The X-ray ribs within the cocoon shock of Cygnus Aoro.open.ac.uk/53749/1/53749.pdf ·...
13
MNRAS 476, 4848–4860 (2018) doi:10.1093/mnras/sty549 Advance Access publication 2018 March 3 The X-ray ribs within the cocoon shock of Cygnus A R. T. Duffy, 1‹ D. M. Worrall, 1 M. Birkinshaw, 1 P. E. J. Nulsen, 2 , 3 M. W. Wise, 4 , 5 M. N. de Vries, 5 B. Snios, 2 W. G. Mathews, 6 R. A. Perley, 7 M. J. Hardcastle, 8 D. A. Rafferty, 9 B. R. McNamara, 10 A. C. Edge, 11 J. P. McKean, 4, 12 C. L. Carilli, 7, 13 J. H. Croston, 14 L. E. H. Godfrey 4 and R. A. Laing 15 1 HH Wills Physics Laboratory, University of Bristol, Tyndall Avenue, Bristol BS8 1TL, UK 2 Harvard-Smithsonian Center for Astrophysics, 60 Garden Street, Cambridge, MA 02138, USA 3 ICRAR, University of Western Australia, 35 Stirling Hwy, Crawley, WA 6009, Australia 4 ASTRON (Netherlands Institute for Radio Astronomy), PO Box 2, NL-7990 AA Dwingeloo, the Netherlands 5 Astronomical Institute ‘Anton Pannekoek’, University of Amsterdam, Postbus 94249, NL-1090 GE Amsterdam, the Netherlands 6 University of California Observatories/Lick Observatory, Department of Astronomy and Astrophysics, University of California, Santa Cruz, CA 95064, USA 7 National Radio Astronomy Observatory, PO Box O, Socorro, NM 87801, USA 8 Centre for Astrophyics Research, School of Physics, Astronomy and Mathematics, University of Hertfordshire, College Lane, Hatfield AL10 9AB, UK 9 Hamburger Sternwarte, Universitat Hamburg, Gojenbergsweg 112, D-21029, Hamburg, Germany 10 Department of Physics and Astronomy, University of Waterloo, 200 University Avenue West, Waterloo, ON N2L 3G1, Canada 11 Centre for Extragalactic Astronomy, University of Durham, Durham DH1 3LE, UK 12 Kapteyn Astronomical Institute, PO Box 800, NL-9700 AV Groningen, the Netherlands 13 Astrophysics Group, Cavendish Laboratory, JJ Thomson Avenue, Cambridge CB3 0HE, UK 14 School of Physical Sciences, The Open University, Walton Hall, Milton Keynes MK7 6AA, UK 15 Square Kilometre Array Organisation, Jodrell Bank Observatory, Lower Withington, Macclesfield, Cheshire SK11 9DL, UK Accepted 2018 February 23. Received 2018 February 22; in original form 2017 December 15 ABSTRACT We use new and archival Chandra observations of Cygnus A, totalling ∼1.9 Ms, to investigate the distribution and temperature structure of gas lying within the projected extent of the cocoon shock and exhibiting a rib-like structure. We confirm that the X-rays are dominated by thermal emission with an average temperature of around 4keV, and have discovered an asymmetry in the temperature gradient, with the southwestern part of the gas cooler than the rest by up to 2keV. Pressure estimates suggest that the gas is a coherent structure of single origin located inside the cocoon, with a mass of roughly 2 × 10 10 M . We conclude that the gas is debris resulting from disintegration of the cool core of the Cygnus A cluster after the passage of the jet during the early stages of the current epoch of activity. The 4keV gas now lies on the central inside surface of the hotter cocoon rim. The temperature gradient could result from an offset between the centre of the cluster core and the Cygnus A host galaxy at the switch-on of current radio activity. Key words: galaxies: active – galaxies: individual: Cygnus A – radio continuum: galaxies – X-rays: galaxies. 1 INTRODUCTION Cygnus A is the best known and nearest example of a powerful Fanaroff–Riley type II (FRII) radio galaxy. The galaxy that hosts Cygnus A is also the dominant galaxy of a 6-keV cluster with mass within 500 kpc in excess of ∼2 × 10 14 M (Arnaud et al. 1984; Smith et al. 2002). The proximity and power of Cygnus A allows in-depth study of interactions between the expanding radio lobes of Cygnus A and the surrounding X-ray gas. E-mail: [email protected] The host galaxy of Cygnus A resides within an elliptical cocoon shock, which extends about 60 arcsec (65 kpc) from north to south of the active galactic nucleus (AGN) and about 120 arcsec (130 kpc) from west to east (Nulsen et al. 2015; Snios et al. 2018). Within the projected extent of the cocoon shock, surrounding the radio core, lies a region of enhanced X-ray emission with a complex rib-like structure. Previous studies of this have revealed it to be thermal emission from gas with an average temperature of about 4 keV (Smith et al. 2002; Wilson, Smith & Young 2006). The X-ray emit- ting ribs lie predominantly between the high-frequency radio lobes, their long axes mostly perpendicular to the radio axis of Cygnus A. We call this structure ‘rib-like’ as its appearance suggests a hollow structure, with the filaments lying in the surrounding envelope, so C 2018 The Author(s) Published by Oxford University Press on behalf of the Royal Astronomical Society Downloaded from https://academic.oup.com/mnras/article-abstract/476/4/4848/4919633 by The Open University user on 12 April 2018
Transcript of The X-ray ribs within the cocoon shock of Cygnus Aoro.open.ac.uk/53749/1/53749.pdf ·...

MNRAS 476, 4848–4860 (2018) doi:10.1093/mnras/sty549Advance Access publication 2018 March 3
The X-ray ribs within the cocoon shock of Cygnus A
R. T. Duffy,1‹ D. M. Worrall,1 M. Birkinshaw,1 P. E. J. Nulsen,2,3 M. W. Wise,4,5
M. N. de Vries,5 B. Snios,2 W. G. Mathews,6 R. A. Perley,7 M. J. Hardcastle,8
D. A. Rafferty,9 B. R. McNamara,10 A. C. Edge,11 J. P. McKean,4,12 C. L. Carilli,7,13
J. H. Croston,14 L. E. H. Godfrey4 and R. A. Laing15
1HH Wills Physics Laboratory, University of Bristol, Tyndall Avenue, Bristol BS8 1TL, UK2Harvard-Smithsonian Center for Astrophysics, 60 Garden Street, Cambridge, MA 02138, USA3ICRAR, University of Western Australia, 35 Stirling Hwy, Crawley, WA 6009, Australia4ASTRON (Netherlands Institute for Radio Astronomy), PO Box 2, NL-7990 AA Dwingeloo, the Netherlands5Astronomical Institute ‘Anton Pannekoek’, University of Amsterdam, Postbus 94249, NL-1090 GE Amsterdam, the Netherlands6University of California Observatories/Lick Observatory, Department of Astronomy and Astrophysics, University of California, Santa Cruz, CA 95064, USA7National Radio Astronomy Observatory, PO Box O, Socorro, NM 87801, USA8Centre for Astrophyics Research, School of Physics, Astronomy and Mathematics, University of Hertfordshire, College Lane, Hatfield AL10 9AB, UK9Hamburger Sternwarte, Universitat Hamburg, Gojenbergsweg 112, D-21029, Hamburg, Germany10Department of Physics and Astronomy, University of Waterloo, 200 University Avenue West, Waterloo, ON N2L 3G1, Canada11Centre for Extragalactic Astronomy, University of Durham, Durham DH1 3LE, UK12Kapteyn Astronomical Institute, PO Box 800, NL-9700 AV Groningen, the Netherlands13Astrophysics Group, Cavendish Laboratory, JJ Thomson Avenue, Cambridge CB3 0HE, UK14School of Physical Sciences, The Open University, Walton Hall, Milton Keynes MK7 6AA, UK15Square Kilometre Array Organisation, Jodrell Bank Observatory, Lower Withington, Macclesfield, Cheshire SK11 9DL, UK
Accepted 2018 February 23. Received 2018 February 22; in original form 2017 December 15
ABSTRACTWe use new and archival Chandra observations of Cygnus A, totalling ∼1.9 Ms, to investigatethe distribution and temperature structure of gas lying within the projected extent of the cocoonshock and exhibiting a rib-like structure. We confirm that the X-rays are dominated by thermalemission with an average temperature of around 4 keV, and have discovered an asymmetry inthe temperature gradient, with the southwestern part of the gas cooler than the rest by up to2 keV. Pressure estimates suggest that the gas is a coherent structure of single origin locatedinside the cocoon, with a mass of roughly 2 × 10¹⁰ M�. We conclude that the gas is debrisresulting from disintegration of the cool core of the Cygnus A cluster after the passage ofthe jet during the early stages of the current epoch of activity. The 4 keV gas now lies on thecentral inside surface of the hotter cocoon rim. The temperature gradient could result from anoffset between the centre of the cluster core and the Cygnus A host galaxy at the switch-on ofcurrent radio activity.
Key words: galaxies: active – galaxies: individual: Cygnus A – radio continuum: galaxies –X-rays: galaxies.
1 IN T RO D U C T I O N
Cygnus A is the best known and nearest example of a powerfulFanaroff–Riley type II (FRII) radio galaxy. The galaxy that hostsCygnus A is also the dominant galaxy of a 6-keV cluster with masswithin 500 kpc in excess of ∼2 × 10¹⁴ M� (Arnaud et al. 1984;Smith et al. 2002). The proximity and power of Cygnus A allowsin-depth study of interactions between the expanding radio lobes ofCygnus A and the surrounding X-ray gas.
� E-mail: [email protected]
The host galaxy of Cygnus A resides within an elliptical cocoonshock, which extends about 60 arcsec (65 kpc) from north to southof the active galactic nucleus (AGN) and about 120 arcsec (130 kpc)from west to east (Nulsen et al. 2015; Snios et al. 2018). Within theprojected extent of the cocoon shock, surrounding the radio core,lies a region of enhanced X-ray emission with a complex rib-likestructure. Previous studies of this have revealed it to be thermalemission from gas with an average temperature of about 4 keV(Smith et al. 2002; Wilson, Smith & Young 2006). The X-ray emit-ting ribs lie predominantly between the high-frequency radio lobes,their long axes mostly perpendicular to the radio axis of Cygnus A.We call this structure ‘rib-like’ as its appearance suggests a hollowstructure, with the filaments lying in the surrounding envelope, so
C© 2018 The Author(s)Published by Oxford University Press on behalf of the Royal Astronomical Society
Downloaded from https://academic.oup.com/mnras/article-abstract/476/4/4848/4919633by The Open University useron 12 April 2018

The X-ray ribs within the cocoon shock of Cygnus A 4849
that they are seen projected on to the core from in front or behind,rather than lying within it. It is conceivable that the origin of the gasmay be similar to that of belt-like emission seen in other local radiogalaxies (Hardcastle et al. 2007; Worrall et al. 2007; Mannering,Worrall & Birkinshaw 2013; Duffy et al. 2016), and enhancedcentral gas distributions showing interactions with the base of thelobes are a common feature of numerical models of radio galaxies(Hardcastle & Krause 2013, 2014).
Despite spectral studies of the gas, no firm conclusions havebeen drawn as to its origin. One possibility suggested by Smith et al.(2002) is that the rib-like structure represents a large-scale accretiondisc with gas flowing into the Cygnus A nucleus. Alternatively,Mathews & Guo (2010) suggest that the X-ray emission may be theexpanded remnant of denser gas formerly located near the centre ofCygnus A, which has been shocked and heated by the AGN duringthe early stages of FR II development.
Using archival and new Chandra data, totalling over 1.9 Msof observation, we investigate the physical properties of the gasinterior to the cocoon shock of Cygnus A, specifically focusing onthe rib-like structure that surrounds the core. Throughout this paper,a flat � cold dark matter (�CDM) cosmology with �m0 = 0.3 and��0 = 0.7 with H0 = 70 km s−1 Mpc−1 is adopted. This gives anangular scale of 1.088 kpc arcsec−1 at z = 0.056 075 (Owen et al.1997), the redshift of Cygnus A.
2 CHANDRA O B S E RVATI O N S
Cygnus A has been observed numerous times using Chandra’s Ad-vanced CCD Imaging Spectrometer (ACIS), with the source centredon either the S3 or I3 chip, mostly as part of the Chandra Vision-ary Project (Wise, in preparation). We have opted to include onlyobservations where Cygnus A is centred on the I3 chip, as theseform the vast majority of observations. We did not include any ob-servations where Cygnus A’s north-west subcluster was the target,or ObsIDs 17145 and 17505 where the PSF near Cygnus A’s coreis very broad. A list of the Chandra observations used in this workis given in Table 1.
The data were reprocessed using CHANDRA_REPRO from CIAO 4.8or 4.9 with CALDB 4.7.2 or 4.7.4 (later versions used for 2017observations) and were then cleaned using the routine DEFLARE in itslc_clean mode to remove the small contribution from backgroundflaring, with applied GTIs removing no more than 1 ks of exposuretime in any observation. To account for astrometric errors, ObsID5831 was chosen as a reference due to its high total counts. Follow-ing Snios et al. (2018), 0.5–7.0 keV images in 0.492-arcsec pixelswere made of a region 160 by 120 arcsec2 centred on Cygnus A,with the events from other ObsIDs reprojected into the same skyframe as ObsID 5831. The cross-correlations between each Ob-sID’s image and the image from ObsID 5831 were then fitted witha Lorentzian profile to determine the offsets between them. Theseoffsets of the order of 0.5 arcsec or less constitute the astrometricshifts required to align the data sets with ObsID 5831. The off-sets were applied to the event and aspect solution files using theWCS_UPDATE command in CIAO. Aligned exposure corrected imageswere then merged together using MERGE_OBS for image analysis.
3 X - R AY M O R P H O L O G Y
Fig. 1 shows an exposure-corrected image made using all the obser-vations listed in Table 1. The edges of the cocoon shock are clearlyvisible at the lower brightness limit of the scale selected, as wellas hotspots at the extremities of the lobes. Visible in both lobes
Table 1. List of Chandra observations used in this work, with observationidentification number, start date of the observation, and net exposure timeafter background flare corrections, texp, in ks.
ObsID Date texp ObsID Date texp
05830 2005-05-26 23.5 17518 2016-07-16 49.405831 2005-02-16 51.1 17519 2016-12-19 29.706225 2005-02-15 24.3 17520 2016-12-06 26.806226 2005-02-19 23.8 17521 2016-07-20 24.706228 2005-02-25 16.0 17522 2017-04-08 49.406229 2005-02-23 22.8 17523 2016-08-31 49.406250 2005-02-21 7.0 17524 2015-09-08 23.006252 2005-09-07 29.7 17525 2017-04-22 24.717133 2016-06-18 30.2 17526 2015-09-20 49.417134 2017-05-20 29.4 17527 2015-10-11 26.717135 2017-01-20 19.8 17528 2015-08-30 49.317136 2017-01-26 22.2 17529 2016-12-15 35.117137 2017-03-29 25.2 17530 2015-04-19 21.317138 2016-07-25 26.4 17650 2015-04-22 28.217139 2016-09-16 39.5 17710 2015-08-07 19.817140 2016-10-02 34.6 18441 2015-09-14 24.617141 2015-08-01 29.7 18641 2015-10-15 22.417142 2017-04-20 23.3 18682 2015-10-14 22.817143 2015-09-04 27.1 18683 2015-10-18 14.117144 2015-05-03 49.4 18688 2015-11-01 34.617507 2016-11-12 32.6 18871 2016-06-13 21.817508 2015-10-28 14.8 18886 2016-07-23 21.717509 2016-07-10 51.4 19888 2016-10-01 19.517510 2016-06-26 37.5 19956 2016-12-10 54.317511 2017-05-11 15.9 19989 2017-02-12 41.517512 2016-09-25 66.8 19996 2017-01-28 28.917513 2016-08-15 49.4 20043 2017-03-25 29.617514 2016-12-13 49.4 20044 2017-03-27 14.817515 2017-03-22 39.5 20048 2017-05-19 22.817516 2016-08-18 49.0 20077 2017-05-13 27.717517 2016-09-17 26.7 20079 2017-05-21 23.8
Total: 1919.8 ks
is a broad X-ray jet-like feature, which is roughly aligned with theradio jet axis close to the AGN, but becomes misaligned in the outerpart of the jet (Steenbrugge, Blundell & Duffy 2008). The brighteastern X-ray jet-like feature can be seen extending almost the fulllength towards the eastern hot spots, while the western X-ray jet-like feature can only be seen extending roughly half way along thelength of the western lobe in this particular image. The core canbe seen between the lobes at the centre of the bright rib-like emis-sion. The ribs occupy a region between high-brightness parts of theradio lobes, although radio emission extends across the centre ofthe lobes and down to the south of the ribs and is more uniformat lower radio frequencies. There is no obvious relation betweenthe X-ray brightness enhancements associated with the ribs and theradio emission. The brightest part of the X-ray rib structure is seenextending immediately to the south of the core, with another brightfilament to the west of this at the boundary of the ribs. The north–south axis of the ribs measures roughly 42 arcsec (45 kpc) in length,while the east–west axis measures roughly 29 arcsec (32 kpc). Tothe south of the brightest rib structure and contours on Fig. 1 is aroughly elliptical region of low surface brightness, representing thecavity previously studied by Chon et al. (2012).
3.1 Unsharp mask images
The merged X-ray image was used to create unsharp mask imagesof Cygnus A. First the image was binned into soft (0.5–2.0 keV) and
MNRAS 476, 4848–4860 (2018)Downloaded from https://academic.oup.com/mnras/article-abstract/476/4/4848/4919633by The Open University useron 12 April 2018

4850 R. T. Duffy et al.
Figure 1. Merged Chandra exposure-corrected 0.5–7.0 keV image of Cygnus A observations listed in Table 1, with native 0.492 arcsec pixels. Contours areof a 327 MHz VLA radio map with restoring beam of size 2.75 arcsec from program AK570, and are shown at brightness levels of 1.434 × (0.2, 0.5, 1.0, 2.0,5.0, 7.5, 15, 20, 25) Jy beam−1.
hard (2.0–7.0 keV) energy bands. The core to a radius of 3 arcsecand the hotspots were excised. The hard and soft images were thensmoothed on two different length-scales, and these images weresubtracted to produce the unsharp mask images. Fig. 2 shows theresult after using Gaussian smoothings of 2 and 10 arcsec.
In both panels of Fig. 2, the rib structure is clearly visible. Therib to the south is unusual in that it appears to terminate at theAGN, unlike any of the others, although this is possibly an effectof projection. There appear to be several holes, corresponding toregions of low surface brightness, not only visible within the ribstructure, but also extending beyond the position where the southrib bends. The unsharp mask images also clearly show X-ray jet-likefeatures of Cygnus A to both the east and the west.
4 SPEC TRO SC O PY
4.1 Region selection
The structure of the X-ray emission from the region lying betweenthe bright radio lobes is complex and clearly inhomogeneous. Wefirst divided it into related regions for spectral analysis by apply-ing the CONTBIN 1.4 software (Sanders 2006) on the merged data.CONTBIN employs an algorithm for spatially binning X-ray data us-
ing contours on an adaptively smoothed map and defining regionsof matched signal-to-noise ratio (SNR). The regions closely matchthe surface brightness structure, allowing us to examine whetherdifferent populations of gas are found in different ribs of Cygnus A.
We tested CONTBIN with several different settings, before settlingon an SNR of 200 after the image had been adaptively smoothed withan SNR of 15. The resulting regions aligned well with the surfacebrightness features identifiable by eye. The region within 5 arcsecof the AGN and a broad rectangular region around the easternjet-like emission were excluded from all analysis. No backgroundwas used in defining the regions, as the features we are studyingare much brighter than their surroundings. CONTBIN identified 28regions across a 60 by 63 arcsec2 field.
Whilst the CONTBIN regions were interesting in helping us to defineappropriately sized and located regions for selection, this selectionmisses several potentially interesting structures. This applies mostlyto regions of low surface brightness, which are amalgamated intoother larger regions in order for CONTBIN’s selection to reach theappropriate SNR. To prevent this, we adjusted the regions suggestedby CONTBIN to make the connected regions more contiguous andto create smoother boundaries with the regions of lower surfacebrightness while roughly retaining the S/N. We identified 22 regionson which to perform spectral extraction, across a smaller area than
MNRAS 476, 4848–4860 (2018)Downloaded from https://academic.oup.com/mnras/article-abstract/476/4/4848/4919633by The Open University useron 12 April 2018

The X-ray ribs within the cocoon shock of Cygnus A 4851
Figure 2. Top panel: Unsharp mask image made from the soft 0.5–2.0 keVband by subtracting an image smoothed with a Gaussian dispersion of10 arcsec from one smoothed by 2 arcsec. Bottom panel: Unsharp mask im-age made from the hard 2.0–7.0 keV band by subtracting an image smoothedwith a Gaussian dispersion of 10 arcsec from one smoothed by 2 arcsec.Black circular regions correspond to excised core and hotspots.
that used in the initial CONTBIN selection. The 22 regions are shownin Fig. 3.
4.2 Spectral fitting
We utilized SPECEXTRACT to extract source and local backgroundspectra for each of the 22 regions from the 50 included observa-tions. The local background is taken from a square annulus outsideour area of interest, with width 15 arcsec (see Fig. 4). CIAO’s COM-BINE_SPECTRA was used to sum the spectra from individual observa-tions and combine the calibration files, with the counts binned toretain at least 20 counts per bin to allow the use of χ2 fitting. Wefound that combining data with very different observation times hadno significant impact on the fits, and results were consistent betweenearly and late data. We applied READOUT_BKG to each observation toestimate the contribution of out-of-time (OOT) events to each spec-trum and remove it, although the rib region is sufficiently bright thatthe OOT contribution is negligible.
Each of the 22 regions was fitted in XSPEC (Arnaud 1996) witha PHABS×APEC model (Smith et al. 2001) between 0.5 and7.0 keV with z = 0.056 075 and Galactic NH = 3.1 × 1021 cm−2
based on an average of results from Dickey & Lockman (1990)and Kalberla et al. (2005). The abundance was left free in the fit-ting and was scaled to the solar abundances of Anders & Grevesse(1989). Freeing the PHABS component of our model showed thatNH = 3.1 × 1021 cm−2 is an underestimate of the absorption in the
region of the ribs. To account for absorption associated with thehost galaxy of Cygnus A, we added a second absorption componentto our model, ZPHABS. The ZPHABS component increases thevalue of NH in almost all regions by at least 10 per cent. The highestabsorption is in the north ribs. A broadly acceptable fit could befound for each region using just this model, suggesting that eachregion is dominated by single-temperature thermal emission.
The origin of excess photoelectric absorption in brightest clustergalaxies (BCGs) is a topic of current debate, with suggested origins,including gas condensing from lower entropy gas, which is liftedoutwards from the cluster core by X-ray bubbles (McNamara et al.2016), or gravitational attraction from the BCG moving through aregion with a short cooling time focusing cooling in its wake (Fabianet al. 2001). The excess absorption we detect is similar to the columndensities of molecular gas seen in other BCGs (Vantyghem et al.2016). Wilman et al. (2000) detect molecular hydrogen extendingsome 6 kpc from the centre of Cygnus A, although the highestabsorption columns we measure are found at around 20 kpc fromthe core.
We expect some systematic uncertainties in combining 62 datasets, but as a goal we have defined an acceptable fit from our χ2
fitting as one with a null hypothesis probability ≥0.01. The ma-jority of the selected regions fit acceptably by these criteria whilemodelled as an absorbed APEC model (see Table 2). It is possi-ble that some of these regions are contaminated with non-thermalcore AGN emission. In our extraction regions, the region near theAGN was excised with a circle of radius 5 arcsec. However, com-parison of the PSF (for the ACIS-S image, ObsID 1707, whichhas a 0.4 s frame time to mitigate the effect of pileup) and a radialprofile suggests that significant core emission may be found up to8 arcsec from the core. We therefore included the spectral model ofthe nucleus from Young et al. (2002; see their table 2, model 1) inour poorly fit regions close to the core. We included both the hardand soft model components, and their relative normalizations werefixed. We also used the absorption column suggested in Young et al.(2002), although this is likely to have varied across the time-scaleof the various observations (Reynolds et al. 2015). The core modelis necessary as a simple power law does not improve the fits, andthe data show a preference for a spectrum that rises with increas-ing energy. The shape of the core model is very different from asingle-component power law and its inclusion causes a significantimprovement for several regions.
Adding the core component brought the fits of regions 1, 5, 6,and 13 to an acceptable level and improved the fit of region 14.F-test probabilities are ≤10−7 for each region, showing that theaddition of the core components is very strongly favoured. Poorlyfitted regions 2 and 11 are too far from the core to justify theinclusion of this model. We tested for multitemperature componentsin regions still giving a poor fit, but could find no evidence of asecond component. Radio maps at 327, 1345, and 146 MHz showthat Cygnus A is bright at low radio frequencies across the centre andmuch of the southern ribs (Lazio et al. 2006; Steenbrugge, Heywood& Blundell 2010; McKean et al. 2016) and inverse-Compton X-ray emission at some level is expected, so we tested for an extrasingle power-law component. We again found no evidence for thiscomponent, although regions 2 and 11 occupy the northern part ofthe ribs away from the brightest radio emission. Inverse-Comptonemission has been plausibly detected in the lobes of Cygnus A inthe past (Hardcastle & Croston 2010; Yaji et al. 2010), althoughthese detections are where the radio emission is brightest at GHzfrequencies, to the east and west of the ribs. The poor fits in regions2 and 11 are possibly explained by mixing of gases, but it seems the
MNRAS 476, 4848–4860 (2018)Downloaded from https://academic.oup.com/mnras/article-abstract/476/4/4848/4919633by The Open University useron 12 April 2018

4852 R. T. Duffy et al.
Figure 3. Map identifying spectral extraction regions across the rib-like structure of Cygnus A. The unnumbered cyan region to the south corresponds to theposition of the Chon et al. (2012) cavity, while the yellow regions correspond to regions between the ribs and cavity. A rectangular region coincident with thejet-like feature and a 5 arcsec region are excluded and not used in spectral analysis.
Figure 4. Merged Chandra image of Cygnus A. The ‘square annulus’ localbackground extraction region is overlaid.
mixing is sufficiently complicated that the spectral fitting does notcope well.
The best-fitting APEC components are given in Table 2. Regionsmarked with an ‘*’ are those where additional components wereadded to the absorbed APEC model to improve the fits.
Region 7 has a particularly poor fit to the APEC model, which isnot improved to acceptable levels by the inclusion of core or power-law components. This is likely to be because there is emissionassociated with the X-ray jet-like feature within this region. A fitincluding this is beyond the scope of this paper (but see de Vrieset al. 2018, submitted). For this reason, region 7 is not included inany analysis beyond the temperature mapping in Section 6.1.
A χ2 test to compare the abundances with a constant (each with1σ errors as compared with the 90 per cent values given in Table 2)finds an unacceptable fit with χ2/dof = 67.4/21. This suggests somechanges in metallicity across the rib structure. There appear to be nosystematic trends, although regions of higher and lower metallicityare clustered together. The range in metallicities is consistent withthe abundances seen in new radial profiles of the cluster gas up to20 arcsec beyond the cocoon shock (Snios et al. 2018). A fit tothe cavity identified in Chon et al. (2012), immediately south ofthe ribs gives a temperature of 4.39+0.31
−0.26 keV and an abundance of0.62+0.11
−0.10 Z�.
MNRAS 476, 4848–4860 (2018)Downloaded from https://academic.oup.com/mnras/article-abstract/476/4/4848/4919633by The Open University useron 12 April 2018
The X-ray ribs within the cocoon shock of Cygnus A 4853
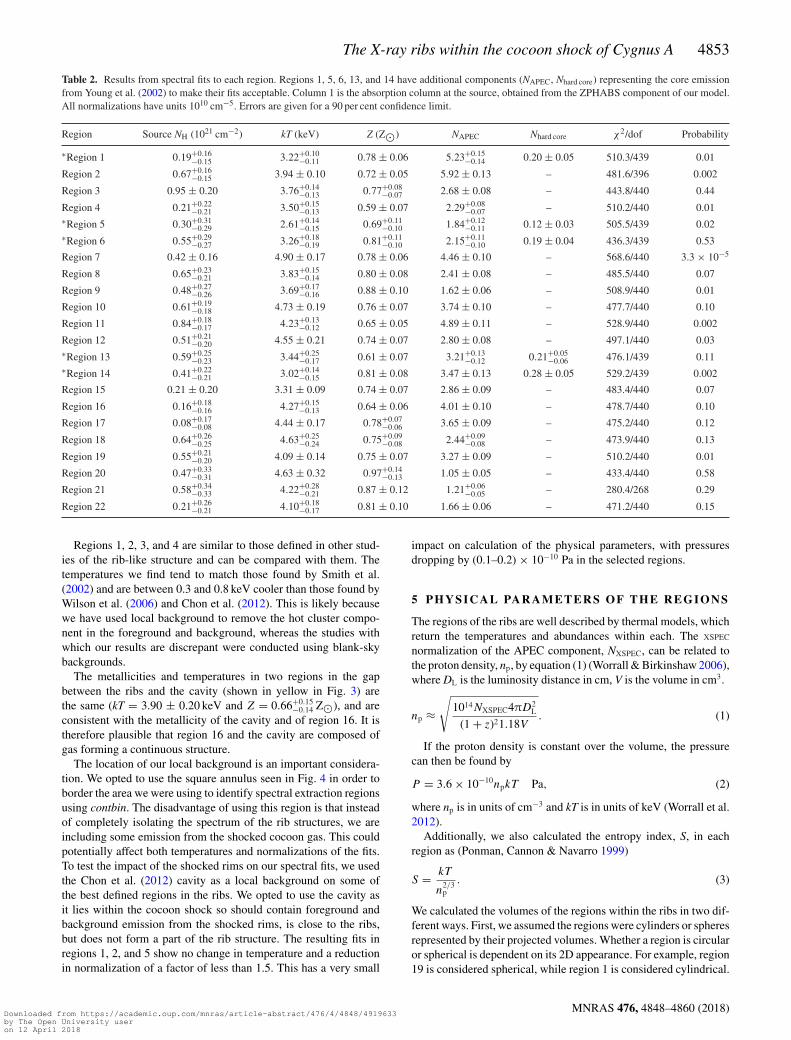
Table 2. Results from spectral fits to each region. Regions 1, 5, 6, 13, and 14 have additional components (NAPEC, Nhard core) representing the core emissionfrom Young et al. (2002) to make their fits acceptable. Column 1 is the absorption column at the source, obtained from the ZPHABS component of our model.All normalizations have units 1010 cm−5. Errors are given for a 90 per cent confidence limit.
Region Source NH (1021 cm−2) kT (keV) Z (Z�) NAPEC Nhard core χ2/dof Probability
∗Region 1 0.19+0.16−0.15 3.22+0.10
−0.11 0.78 ± 0.06 5.23+0.15−0.14 0.20 ± 0.05 510.3/439 0.01
Region 2 0.67+0.16−0.15 3.94 ± 0.10 0.72 ± 0.05 5.92 ± 0.13 – 481.6/396 0.002
Region 3 0.95 ± 0.20 3.76+0.14−0.13 0.77+0.08
−0.07 2.68 ± 0.08 – 443.8/440 0.44
Region 4 0.21+0.22−0.21 3.50+0.15
−0.13 0.59 ± 0.07 2.29+0.08−0.07 – 510.2/440 0.01
∗Region 5 0.30+0.31−0.29 2.61+0.14
−0.15 0.69+0.11−0.10 1.84+0.12
−0.11 0.12 ± 0.03 505.5/439 0.02∗Region 6 0.55+0.29
−0.27 3.26+0.18−0.19 0.81+0.11
−0.10 2.15+0.11−0.10 0.19 ± 0.04 436.3/439 0.53
Region 7 0.42 ± 0.16 4.90 ± 0.17 0.78 ± 0.06 4.46 ± 0.10 – 568.6/440 3.3 × 10⁻⁵
Region 8 0.65+0.23−0.21 3.83+0.15
−0.14 0.80 ± 0.08 2.41 ± 0.08 – 485.5/440 0.07
Region 9 0.48+0.27−0.26 3.69+0.17
−0.16 0.88 ± 0.10 1.62 ± 0.06 – 508.9/440 0.01
Region 10 0.61+0.19−0.18 4.73 ± 0.19 0.76 ± 0.07 3.74 ± 0.10 – 477.7/440 0.10
Region 11 0.84+0.18−0.17 4.23+0.13
−0.12 0.65 ± 0.05 4.89 ± 0.11 – 528.9/440 0.002
Region 12 0.51+0.21−0.20 4.55 ± 0.21 0.74 ± 0.07 2.80 ± 0.08 – 497.1/440 0.03
∗Region 13 0.59+0.25−0.23 3.44+0.25
−0.17 0.61 ± 0.07 3.21+0.13−0.12 0.21+0.05
−0.06 476.1/439 0.11∗Region 14 0.41+0.22
−0.21 3.02+0.14−0.15 0.81 ± 0.08 3.47 ± 0.13 0.28 ± 0.05 529.2/439 0.002
Region 15 0.21 ± 0.20 3.31 ± 0.09 0.74 ± 0.07 2.86 ± 0.09 – 483.4/440 0.07
Region 16 0.16+0.18−0.16 4.27+0.15
−0.13 0.64 ± 0.06 4.01 ± 0.10 – 478.7/440 0.10
Region 17 0.08+0.17−0.08 4.44 ± 0.17 0.78+0.07
−0.06 3.65 ± 0.09 – 475.2/440 0.12
Region 18 0.64+0.26−0.25 4.63+0.25
−0.24 0.75+0.09−0.08 2.44+0.09
−0.08 – 473.9/440 0.13
Region 19 0.55+0.21−0.20 4.09 ± 0.14 0.75 ± 0.07 3.27 ± 0.09 – 510.2/440 0.01
Region 20 0.47+0.33−0.31 4.63 ± 0.32 0.97+0.14
−0.13 1.05 ± 0.05 – 433.4/440 0.58
Region 21 0.58+0.34−0.33 4.22+0.28
−0.21 0.87 ± 0.12 1.21+0.06−0.05 – 280.4/268 0.29
Region 22 0.21+0.26−0.21 4.10+0.18
−0.17 0.81 ± 0.10 1.66 ± 0.06 – 471.2/440 0.15
Regions 1, 2, 3, and 4 are similar to those defined in other stud-ies of the rib-like structure and can be compared with them. Thetemperatures we find tend to match those found by Smith et al.(2002) and are between 0.3 and 0.8 keV cooler than those found byWilson et al. (2006) and Chon et al. (2012). This is likely becausewe have used local background to remove the hot cluster compo-nent in the foreground and background, whereas the studies withwhich our results are discrepant were conducted using blank-skybackgrounds.
The metallicities and temperatures in two regions in the gapbetween the ribs and the cavity (shown in yellow in Fig. 3) arethe same (kT = 3.90 ± 0.20 keV and Z = 0.66+0.15
−0.14 Z�), and areconsistent with the metallicity of the cavity and of region 16. It istherefore plausible that region 16 and the cavity are composed ofgas forming a continuous structure.
The location of our local background is an important considera-tion. We opted to use the square annulus seen in Fig. 4 in order toborder the area we were using to identify spectral extraction regionsusing contbin. The disadvantage of using this region is that insteadof completely isolating the spectrum of the rib structures, we areincluding some emission from the shocked cocoon gas. This couldpotentially affect both temperatures and normalizations of the fits.To test the impact of the shocked rims on our spectral fits, we usedthe Chon et al. (2012) cavity as a local background on some ofthe best defined regions in the ribs. We opted to use the cavity asit lies within the cocoon shock so should contain foreground andbackground emission from the shocked rims, is close to the ribs,but does not form a part of the rib structure. The resulting fits inregions 1, 2, and 5 show no change in temperature and a reductionin normalization of a factor of less than 1.5. This has a very small
impact on calculation of the physical parameters, with pressuresdropping by (0.1–0.2) × 10−10 Pa in the selected regions.
5 PH Y S I C A L PA R A M E T E R S O F T H E R E G I O N S
The regions of the ribs are well described by thermal models, whichreturn the temperatures and abundances within each. The XSPEC
normalization of the APEC component, NXSPEC, can be related tothe proton density, np, by equation (1) (Worrall & Birkinshaw 2006),where DL is the luminosity distance in cm, V is the volume in cm3.
np ≈√
1014NXSPEC4πD2L
(1 + z)21.18V. (1)
If the proton density is constant over the volume, the pressurecan then be found by
P = 3.6 × 10⁻¹⁰npkT Pa, (2)
where np is in units of cm−3 and kT is in units of keV (Worrall et al.2012).
Additionally, we also calculated the entropy index, S, in eachregion as (Ponman, Cannon & Navarro 1999)
S = kT
n2/3p
. (3)
We calculated the volumes of the regions within the ribs in two dif-ferent ways. First, we assumed the regions were cylinders or spheresrepresented by their projected volumes. Whether a region is circularor spherical is dependent on its 2D appearance. For example, region19 is considered spherical, while region 1 is considered cylindrical.
MNRAS 476, 4848–4860 (2018)Downloaded from https://academic.oup.com/mnras/article-abstract/476/4/4848/4919633by The Open University useron 12 April 2018

4854 R. T. Duffy et al.
Table 3. Cylinder/sphere geometry: density, pressure, mass, and entropyindex of the X-ray emission in the various regions within the rib structure ofCygnus A. Errors are quoted for 90 per cent confidence range. These werecalculated assuming a spherical or cylindrical volume for each region.
Region np (10−1 cm−3) P (10−10 Pa) M(109 M�) S (keV cm2)
Region 1 1.40 ± 0.02 1.6 ± 0.1 1.8 ± 0.1 11.9 ± 0.4Region 2 1.41 ± 0.01 2.0 ± 0.1 2.0 ± 0.1 14.5 ± 0.4Region 3 1.83 ± 0.01 2.5 ± 0.1 0.7 ± 0.1 11.7+0.5
−0.4
Region 4 1.68 ± 0.03 2.1 ± 0.1 0.7 ± 0.1 11.5+0.5−0.4
Region 5 1.83+0.06−0.50 1.7 ± 0.1 0.5 ± 0.1 8.1 ± 0.5
Region 6 2.29+0.06−0.05 2.7 ± 0.2 0.5 ± 0.1 8.7 ± 0.5
Region 8 1.54 ± 0.03 2.1 ± 0.1 0.8 ± 0.1 13.3 ± 0.5Region 9 1.33 ± 0.02 1.8 ± 0.1 0.6 ± 0.1 14.1+0.7
−0.6
Region 10 1.34 ± 0.02 2.3 ± 0.1 1.3 ± 0.1 18.0 ± 0.7Region 11 1.22 ± 0.01 1.9 ± 0.1 1.9 ± 0.1 17.2 ± 0.5Region 12 1.61 ± 0.02 2.6 ± 0.1 0.8 ± 0.1 15.4 ± 0.7Region 13 1.75+0.04
−0.03 2.2+0.2−0.1 0.9 ± 0.1 11.0+0.8
−0.6
Region 14 1.64 ± 0.03 1.8 ± 0.2 1.0 ± 0.1 10.1 ± 0.5Region 15 1.73 ± 0.03 2.1 ± 0.1 0.8 ± 0.1 10.7 ± 0.3Region 16 1.16 ± 0.01 1.8 ± 0.1 1.7 ± 0.1 18.0 ± 0.6Region 17 1.28 ± 0.02 2.0 ± 0.1 1.4 ± 0.1 17.5 ± 0.7Region 18 1.18 ± 0.02 2.0 ± 0.1 1.0 ± 0.1 19.2 ± 1.0Region 19 1.15 ± 0.02 1.7 ± 0.1 1.4 ± 0.2 17.3 ± 0.6Region 20 1.23 ± 0.03 2.0 ± 0.2 0.4 ± 0.1 18.7 ± 1.3Region 21 1.21 ± 0.03 1.8 ± 0.1 0.5 ± 0.1 17.2+1.2
−0.9
Region 22 1.23 ± 0.02 1.8 ± 0.1 0.7 ± 0.1 16.6+0.8−0.7
Total mass: 21.0 ± 1.0
For cylinders, the volume was calculated assuming the longest axisof the region corresponds to the height of the cylinder and half thelength of the shortest axis corresponds to the radius. The resultsusing this method are shown in Table 3. Secondly, we assume therib structures each fill a cylinder of radius 39 arcsec (the semi-minoraxis of the cocoon), lying in the plane of the sky, whose axis liescoincident with the radio axis. The surface areas of our regions arethen multiplied by a depth representing the line of sight containedwithin the cylinder. The results using this method are shown inTable 4.
A comparison between the pressures for each volume assumptioncan be seen in Fig. 5. Fitting a constant to these data gives anaverage pressure P = (2.0 ± 0.1) × 10−10 Pa , with χ2 = 246.4 forthe cylinders and spheres, and P = (4.7 ± 0.2) × 10−11 Pa, withχ2 = 234.7 assuming the ribs fill a cylinder. This fitting showsno significant preference for either model. The clear difference inpressure between the two volume models suggests that the ribs arenot composed of a mixture of cylinders and spheres and regionsthat fill a cylinder. This suggests that all structures within the ribsare likely to have a similar geometry and similar dynamical origins.The poor χ2 and deviations from the mean are possibly caused byinhomogeneities in the density of the various rib structures. For bothgeometries, the total mass of rib gas is substantial at a few times1010 M�.
Snios et al. (2018) have determined the pressure of the lobes tobe (1.0 ± 0.4) × 10−10 Pa in the east lobe and (8.4 ± 0.2) × 10−11
Pa in the west lobe, using spectra for the thin rim of gas betweenthe shock and the radio lobes. This is an order of magnitude largerthan the 1.3 × 10⁻¹¹ Pa minimum energy field of lobes closest tothe centre of the source found by Carilli et al. (1991). The meanpressures we find in our two configurations fall either side of theSnios et al. estimates.
Table 4. Filled cylinder geometry: density, pressure, mass, and entropyindex of the X-ray emission in the various regions within the rib structureof Cygnus A. Errors are quoted for 90 per cent confidence range. Thesewere calculated assuming that ribs are contained to fill a cylinder of radius39 arcsec.
Region np (10−2 cm−3) P (10−11 Pa) M(109 M�) S (keV cm2)
Region 1 3.73 ± 0.05 4.3+0.1−0.2 6.7 ± 0.1 28.8+0.9
−1.0
Region 2 4.29 ± 0.04 6.1 ± 0.2 6.6 ± 0.1 32.2 ± 0.9
Region 3 3.78 ± 0.06 5.1 ± 0.2 3.4 ± 0.1 33.4+1.3−1.2
Region 4 4.20+0.07−0.06 5.3 ± 0.2 2.6 ± 0.1 28.9+1.3
−1.1
Region 5 3.63 ± 0.01 3.4 ± 0.2 2.4 ± 0.1 23.8 ± 1.4
Region 6 3.51+0.09−0.08 4.1 ± 0.3 2.9 ± 0.1 30.4 ± 1.8
Region 8 3.76 ± 0.06 5.2 ± 0.2 3.1 ± 0.1 34.2+1.4−1.3
Region 9 3.19 ± 0.06 4.2 ± 0.2 2.4 ± 0.1 36.7+1.8−1.7
Region 10 3.56 ± 0.05 6.1 ± 0.3 5.0 ± 0.1 43.7 ± 1.8
Region 11 3.25 ± 0.04 4.9 ± 0.2 7.2 ± 0.1 41.6+1.3−1.2
Region 12 3.02 ± 0.04 4.9 ± 0.2 4.5 ± 0.1 47.0 ± 2.2
Region 13 3.10 ± 0.06 3.8+0.3−0.2 5.0 ± 0.1 34.8+2.6
−1.8
Region 14 3.34 ± 0.06 3.6±0.2 5.0 ± 0.1 29.1+1.4−1.5
Region 15 3.37 ± 0.05 4.0 ± 0.1 4.1 ± 0.1 31.7 ± 0.9
Region 16 3.53 ± 0.04 5.4 ± 0.2 5.4 ± 0.1 39.7+1.4−1.3
Region 17 3.29 ± 0.04 5.3 ± 0.1 5.3 ± 0.1 43.2 ± 1.7
Region 18 3.22+0.06−0.05 5.4 ± 0.3 3.6 ± 0.1 45.8+2.5
−2.4
Region 19 3.32 ± 0.05 4.9 ± 0.2 4.7 ± 0.1 39.6 ± 1.4
Region 20 2.81 ± 0.07 4.7 ± 0.3 1.8 ± 0.1 50.1 ± 3.6
Region 21 2.92+0.07−0.06 4.4+0.3
−0.2 2.0 ± 0.1 44.5+3.0−2.3
Region 22 3.04 ± 0.06 4.5 ± 0.2 2.6 ± 0.1 42.1+1.9−1.8
Total mass: 86.0 ± 1.0
Figure 5. Pressure in each region calculated for the two different geome-tries. Lines of best fit indicate the mean for each pressure group.
5.1 Dynamical time-scales of the ribs
The sound speed, cs, of the gas in each region is found as (Worrallet al. 2012)
cs(kpc Myr−1) = 0.54(kT/keV)0.5, (4)
where T is the temperature of the regions obtained from our spectralfits. We can estimate the dynamical time-scale of each region bytaking the length of the shortest two-dimensional axis and dividingit by the calculated sound speed. If the source is older than this
MNRAS 476, 4848–4860 (2018)Downloaded from https://academic.oup.com/mnras/article-abstract/476/4/4848/4919633by The Open University useron 12 April 2018

The X-ray ribs within the cocoon shock of Cygnus A 4855
Table 5. Sound speed and age of the X-ray gas containedwithin each region of the rib structure in Cygnus A.
Region cs Dynamical(kpc Myr−1) time-scale (Myr)
Region 1 0.97 ± 0.02 6.3 ± 0.1Region 2 1.07 ± 0.02 9.7 ± 0.1Region 3 1.05 ± 0.02 3.9 ± 0.1Region 4 1.01 ± 0.01 6.6 ± 0.1Region 5 0.87 ± 0.02 4.7 ± 0.2Region 6 0.98 ± 0.03 3.1 ± 0.1Region 8 1.06 ± 0.02 6.8 ± 0.1Region 9 1.04 ± 0.02 6.7 ± 0.1Region 10 1.17 ± 0.02 4.8 ± 0.1Region 11 1.11 ± 0.01 5.7 ± 0.1Region 12 1.15 ± 0.03 3.4 ± 0.1Region 13 1.00+0.04
−0.02 3.7 ± 0.1
Region 14 0.94 ± 0.02 5.3 ± 0.1Region 15 0.98 ± 0.01 5.3 ± 0.1Region 16 1.12+0.02
−0.01 7.6 ± 0.1
Region 17 1.14 ± 0.01 6.3 ± 0.1Region 18 1.16 ± 0.03 4.9 ± 0.1Region 19 1.09 ± 0.02 8.9 ± 0.1Region 20 1.16 ± 0.04 5.5 ± 0.2Region 21 1.11+0.04
−0.03 6.1+0.2−0.1
Region 22 1.09 ± 0.02 6.8 ± 0.1
time-scale, the gas in each region is likely to be in pressure balance.The results for cs and the dynamical time-scale are given in Table 5.The time-scales vary between 3.1 and 9.7 Myr, and are somewhatless than the 18.7 Myr estimated age of the shock front (Snios et al.2018), implying that the structure has largely reached local pressureequilibrium.
6 MAPPING
6.1 Temperature mapping
The best-fitting temperature map in the rib gas is shown in Fig. 6.Interestingly, there is a clear range in temperature within the struc-ture, with regions in the southwestern corner of the ribs cooler thanthose in the remainder, although the temperatures in regions 6 and13 have been reduced by 0.5 and 0.4 keV, respectively (more than10 per cent), by the inclusion of the core component.
To obtain a measure of the range in temperature, we placedannuli of width 5 arcsec centred on the core and calculated theaverage temperature in 30◦ annular sectors (see Fig. 7). The resultsfor annuli at 5–10 and 10–15 arcsec can be seen in Fig. 8. Thedifference between the hottest and coolest regions is about 2 keV.The temperature difference is compensated by an opposing densityasymmetry that causes the pressure to be roughly constant in theribs.
6.2 Pressure and entropy index maps
Assuming that the ribs are composed of cylinders and spheres,there is no discernible systematic structure in the pressure map (seeFig. 9). However, in Fig. 10 (ribs filling cylinder), the regions inthe eastern half of the ribs contain somewhat higher pressure whencompared to the western half, which is a pattern also identified forthe lobes (Snios et al. 2018). The average pressure of the easternhalf of the ribs, for this geometry, is (5.5 ± 0.2) × 10−11 Pa, and
Figure 6. Temperature map of the rib-like structure of Cygnus A. Thecolourbar corresponds to the best-fitting temperature of each region in keV.The black circle at the centre of the sources corresponds to an excised circleof radius 5 arcsec, representing the core.
Figure 7. Temperature map of the ribs showing the pie slices used tomodel the temperature at various angles and radii. The blue line indicatesthe 0 degree line.
the average pressure of the western half is (4.4 ± 0.2) × 10−11 Pa,which is 10 per cent lower. While less significant than the roughly20 per cent difference seen by Snios et al., it is interesting that it, aneast–west pressure difference, may be present closer to the nucleus.However, pressures in the east and west of the cylinders and spheresconfiguration are the same within errors.
MNRAS 476, 4848–4860 (2018)Downloaded from https://academic.oup.com/mnras/article-abstract/476/4/4848/4919633by The Open University useron 12 April 2018

4856 R. T. Duffy et al.
Figure 8. Temperature versus angle across the rib-like structure in CygnusA between 5–10 arcsec from the core exclusion (middle) and 10–15 arcsecfrom the core exclusion (bottom). The first and final wedges of the 10–15arcsec plot are missing as there is no rib structure in these segments at thisradius.
We also investigate the entropy index of the ribs, which is of inter-est as the entropy structure contains information about the thermalhistory of the gas in clusters, especially with regard to the effectof feedback on the intracluster medium. In general, the entropiesacross the ribs are uniform, with the highest entropy index for bothgeometries (lower images, Figs 9 and 10) found at the extremitiesof the rib structure. The exception to this is the southwestern cor-ner, and entropies here are similar to those seen in regions 2 and 3.Interestingly, the entropies in regions 5, 15, and 4, which arguablybelong to the same rib, are similar but increase with angle from thecore. Perhaps unsurprisingly, the entropies measured for the filledcylinder geometry are closer to the central entropy of Cygnus Afound by Cavagnolo et al. (2009), assuming spherical symmetry.
Although we have discussed differences in pressure and entropyin the rib structure, within each geometry the pressures and entropiesmeasured are similar across regions. There is less than a factor of 2difference between the lowest and highest pressures and entropieswithin each geometry. As it is unlikely, the two geometries aremixed (see Fig. 5), and because of our suggested origin for the ribs
Figure 9. Top panel: Pressure map of the rib-like structure of Cygnus A,where volumes are calculated using cylinders and spheres representing theregions. The colourbar corresponds to the best-fitting pressure of each re-gion in 10−10 Pa. The black circle at the centre of the sources corresponds toan excision of radius 5 arcsec, representing the core. Bottom panel: Entropyindex map of the rib-like structure of Cygnus A, where volumes are calcu-lated using cylinders and spheres representing the regions. The colourbarcorresponds to the entropy index of each region in keV cm2. The black circleat the centre of the sources corresponds to an excision of radius 5 arcsec,representing the core.
(see Section 8) we prefer the cylinder and spheres geometry for thefollowing sections.
7 R AY L E I G H – TAY L O R IN S TA B I L I T I E S
The gas extending to the south of the core is one of the more strikingparts of Cygnus A’s ribs. The eastern edge of region 5 (Fig. 3) isa particularly sharp boundary. This is remarkable since it appearsthat X-ray emitting gas is decelerating the low-density plasma froma part of the Cygnus A lobe system, and so this interface should besubject to the Rayleigh–Taylor (RT) instability. In this section, wediscuss this edge of region 5 as an exemplar of other sharp featuresin Cygnus A (Fig. 2).
MNRAS 476, 4848–4860 (2018)Downloaded from https://academic.oup.com/mnras/article-abstract/476/4/4848/4919633by The Open University useron 12 April 2018

The X-ray ribs within the cocoon shock of Cygnus A 4857
Figure 10. Top panel: Pressure map of the rib-like structure of Cygnus A,where volumes are calculated assuming the ribs fill a cylinder defined bythe cocoon shock. The colourbar corresponds to the best-fitting pressureof each region in 10−11 Pa. The black circle at the centre of the sourcescorresponds to an excision of radius 5 arcsec, representing the core. Bottompanel: Entropy index map of the rib-like structure of Cygnus A, wherevolumes are calculated assuming the ribs fill a cylinder defined by the cocoonshock. The colourbar corresponds to the entropy index of each region in keVcm2. The black circle at the centre of the sources corresponds to an excisionof radius 5 arcsec, representing the core.
RT instabilities develop where a higher density gas lies above alower density gas in a gravitational field, or, equivalently, where thehigher density gas is decelerating the expansion of the lower densitygas. Bubbles and fingers of the fluids then disturb the interface andcause mixing. If the lower density gas lies over the higher densitygas, or if the higher density gas is accelerating the lower density gas,then there are no RT instabilities. In the context of Cygnus A, weexpect RT instabilities where radio plasma is encountering denserexternal gas.
In the absence of dynamically important magnetic fields, thegrowth rate of the RT instability is (Chandrasekhar 1961)
� =(
2πg
λ
ρa − ρb
ρa + ρb
)1/2
, (5)
where g is the deceleration, ρa and ρb are the densities of the twogases (ρa > ρb), and λ is the horizontal (parallel to the interface)wavelength of a mode. RT instabilities grow at all wavelengths, butfaster at shorter λ.
The density of the radio-emitting plasma in Cygnus A is muchlower than the density of the external rib gas, ρa ρb, so the growthrate of the instability simplifies to
� =(
2πg
λ
)1/2. (6)
If the instabilities have been growing for time, τ , then any initialperturbations in the interface will grow by a factor exp (�τ ), whichshould be <1 for the perturbations still to be in the linear regime. Ifthe radio plasma has been interacting with the X-ray plasma for thesame time τ , during which the lobe has expanded to scale R, then gwill be of the order of R/τ 2 (e.g. for self-similar expansion), and
exp(�τ ) ≈ exp(2.5 (λ/R)−1/2
). (7)
Perturbations on scales smaller than the radio structure should there-fore have grown to the non-linear regime and blurred the interface,unless the radio lobe lies over the thermal plasma, or the thermalplasma is accelerating the radio lobe.
However, such a conclusion is premature, since the result (7)is unrealistic. We expect magnetic fields in the radio plasma andthermal gas to become concentrated and ordered near the interfaceand that the magnetic layer will inhibit the RT instability (e.g. Car-lyle & Hillier 2017). A full treatment of the RT instability thenrequires a model for the magnetic structure. Since the magneticfield is expected to lie predominantly parallel to the interface, butwith no consistent direction on the large scale, and with the fieldstrength decreasing away from the interface, no analytic or numeri-cal calculation to date provides a sufficient treatment of the growthof the instability. However, an approximate result (validated by acomparison with simpler field models, such as that of Goldston &Rutherford 1995) can be obtained by modelling the field as provid-ing surface energy that mimics surface tension. Surface tension, σ T,introduces a wavelength of maximum instability
λ∗ = 2π
(3σT
(ρa − ρb)g
)1/2
(8)
and suppresses the RT instability completely for modes with λ <
λ∗/√
3. The rate of growth of the RT instability is modified to
� =[
2πg
λ
{ρa − ρb
ρa + ρb
− 4π2σT
gλ2(ρa + ρb)
}]1/2
(9)
and takes a maximum value of
�∗ =[
4g3(ρa − ρb)3
27σT (ρa + ρb)2
]1/4
(10)
at λ = λ∗.The model quantity σ T is taken as arising from magnetic field
energy density uB concentrated in a layer of thickness d at the edgeof the radio lobe. d could be the vertical scale on which the RTinstability causes field bunching, or some scale established by thedynamics of the expansion of the radio lobe. The effective surfacetension is then
σT = uBd. (11)
MNRAS 476, 4848–4860 (2018)Downloaded from https://academic.oup.com/mnras/article-abstract/476/4/4848/4919633by The Open University useron 12 April 2018
4858 R. T. Duffy et al.
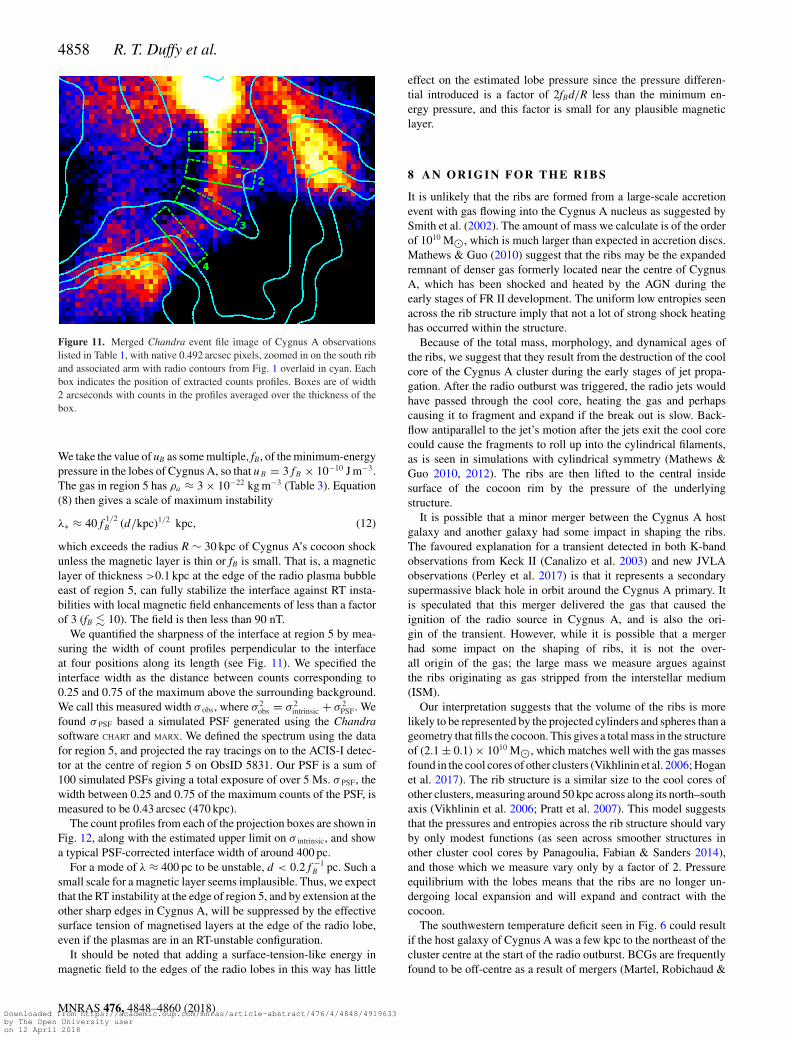
Figure 11. Merged Chandra event file image of Cygnus A observationslisted in Table 1, with native 0.492 arcsec pixels, zoomed in on the south riband associated arm with radio contours from Fig. 1 overlaid in cyan. Eachbox indicates the position of extracted counts profiles. Boxes are of width2 arcseconds with counts in the profiles averaged over the thickness of thebox.
We take the value of uB as some multiple, fB, of the minimum-energypressure in the lobes of Cygnus A, so that uB = 3fB × 10−10 J m−3.The gas in region 5 has ρa ≈ 3 × 10⁻²² kg m−3 (Table 3). Equation(8) then gives a scale of maximum instability
λ∗ ≈ 40f1/2B (d/kpc)1/2 kpc, (12)
which exceeds the radius R ∼ 30 kpc of Cygnus A’s cocoon shockunless the magnetic layer is thin or fB is small. That is, a magneticlayer of thickness >0.1 kpc at the edge of the radio plasma bubbleeast of region 5, can fully stabilize the interface against RT insta-bilities with local magnetic field enhancements of less than a factorof 3 (fB � 10). The field is then less than 90 nT.
We quantified the sharpness of the interface at region 5 by mea-suring the width of count profiles perpendicular to the interfaceat four positions along its length (see Fig. 11). We specified theinterface width as the distance between counts corresponding to0.25 and 0.75 of the maximum above the surrounding background.We call this measured width σ obs, where σ 2
obs = σ 2intrinsic + σ 2
PSF. Wefound σ PSF based a simulated PSF generated using the Chandrasoftware CHART and MARX. We defined the spectrum using the datafor region 5, and projected the ray tracings on to the ACIS-I detec-tor at the centre of region 5 on ObsID 5831. Our PSF is a sum of100 simulated PSFs giving a total exposure of over 5 Ms. σ PSF, thewidth between 0.25 and 0.75 of the maximum counts of the PSF, ismeasured to be 0.43 arcsec (470 kpc).
The count profiles from each of the projection boxes are shown inFig. 12, along with the estimated upper limit on σ intrinsic, and showa typical PSF-corrected interface width of around 400 pc.
For a mode of λ ≈ 400 pc to be unstable, d < 0.2f −1B pc. Such a
small scale for a magnetic layer seems implausible. Thus, we expectthat the RT instability at the edge of region 5, and by extension at theother sharp edges in Cygnus A, will be suppressed by the effectivesurface tension of magnetised layers at the edge of the radio lobe,even if the plasmas are in an RT-unstable configuration.
It should be noted that adding a surface-tension-like energy inmagnetic field to the edges of the radio lobes in this way has little
effect on the estimated lobe pressure since the pressure differen-tial introduced is a factor of 2fBd/R less than the minimum en-ergy pressure, and this factor is small for any plausible magneticlayer.
8 A N O R I G I N FO R T H E R I B S
It is unlikely that the ribs are formed from a large-scale accretionevent with gas flowing into the Cygnus A nucleus as suggested bySmith et al. (2002). The amount of mass we calculate is of the orderof 1010 M�, which is much larger than expected in accretion discs.Mathews & Guo (2010) suggest that the ribs may be the expandedremnant of denser gas formerly located near the centre of CygnusA, which has been shocked and heated by the AGN during theearly stages of FR II development. The uniform low entropies seenacross the rib structure imply that not a lot of strong shock heatinghas occurred within the structure.
Because of the total mass, morphology, and dynamical ages ofthe ribs, we suggest that they result from the destruction of the coolcore of the Cygnus A cluster during the early stages of jet propa-gation. After the radio outburst was triggered, the radio jets wouldhave passed through the cool core, heating the gas and perhapscausing it to fragment and expand if the break out is slow. Back-flow antiparallel to the jet’s motion after the jets exit the cool corecould cause the fragments to roll up into the cylindrical filaments,as is seen in simulations with cylindrical symmetry (Mathews &Guo 2010, 2012). The ribs are then lifted to the central insidesurface of the cocoon rim by the pressure of the underlyingstructure.
It is possible that a minor merger between the Cygnus A hostgalaxy and another galaxy had some impact in shaping the ribs.The favoured explanation for a transient detected in both K-bandobservations from Keck II (Canalizo et al. 2003) and new JVLAobservations (Perley et al. 2017) is that it represents a secondarysupermassive black hole in orbit around the Cygnus A primary. Itis speculated that this merger delivered the gas that caused theignition of the radio source in Cygnus A, and is also the ori-gin of the transient. However, while it is possible that a mergerhad some impact on the shaping of ribs, it is not the over-all origin of the gas; the large mass we measure argues againstthe ribs originating as gas stripped from the interstellar medium(ISM).
Our interpretation suggests that the volume of the ribs is morelikely to be represented by the projected cylinders and spheres than ageometry that fills the cocoon. This gives a total mass in the structureof (2.1 ± 0.1) × 1010 M�, which matches well with the gas massesfound in the cool cores of other clusters (Vikhlinin et al. 2006; Hoganet al. 2017). The rib structure is a similar size to the cool cores ofother clusters, measuring around 50 kpc across along its north–southaxis (Vikhlinin et al. 2006; Pratt et al. 2007). This model suggeststhat the pressures and entropies across the rib structure should varyby only modest functions (as seen across smoother structures inother cluster cool cores by Panagoulia, Fabian & Sanders 2014),and those which we measure vary only by a factor of 2. Pressureequilibrium with the lobes means that the ribs are no longer un-dergoing local expansion and will expand and contract with thecocoon.
The southwestern temperature deficit seen in Fig. 6 could resultif the host galaxy of Cygnus A was a few kpc to the northeast of thecluster centre at the start of the radio outburst. BCGs are frequentlyfound to be off-centre as a result of mergers (Martel, Robichaud &
MNRAS 476, 4848–4860 (2018)Downloaded from https://academic.oup.com/mnras/article-abstract/476/4/4848/4919633by The Open University useron 12 April 2018

The X-ray ribs within the cocoon shock of Cygnus A 4859
Figure 12. Count profiles of the various regions along the south rib. Red lines indicate the 0.25 and 0.75 of the maximum counts above the background.
Barai 2014) and Cygnus A is thought to be undergoing a mergercurrently with a sub-cluster to its north-west (Wise, in preparation).
Parts of this explanation and the lack of gas mass transport toouter regions seen here are similar to results of simulations of GHz-peak spectrum objects undertaken by Sutherland & Bicknell (2007).Obviously, those sources are far smaller than Cygnus A (around60 times) and have disrupted their ISMs rather than a cluster coolcore as we infer for Cygnus A.
The rib filaments may be associated with enhanced magneticfields. This, in combination with the already clear density varia-tions in the region, suggests that there would be rotation measurestructures present across the central region. Unfortunately, the ro-tation measure maps of Dreher, Carilli & Perley (1987), which findRMs of up to a few thousand rad m−2, do not cover the centralregions containing the ribs. There is a significant amount of gas inthe region, indicating the rotation measure could be large, perhapsup to 10 000 rad m−2, depending on the degree of magnetic orderingin the interfaces. Radio telescopes such as LOFAR and JVLA couldprovide measurements of such high RMs and RM gradients nearthe ribs, but these measurements will be challenging: They mustbe done at low frequencies so that synchrotron emission in theseregions is bright, at high angular resolution to resolve the cavityedges, at high spectral resolution to avoid depolarization, and at ahigh dynamic range. The question of whether the thermal gas as-
sociated with the ribs is in the interior regions of the radio lobesshould also be answered by radio polarimetry.
9 SU M M A RY
We have used X-ray spectroscopy from very deep Chandra obser-vations to investigate the rib-like structure within the cocoon shockof Cygnus A and have confirmed it to be dominated by thermalemission with an average temperature of about 4 keV (Section 4.2,Table 2).
Dynamical time-scales for the ribs are somewhat less than theestimated age of the shock front, suggesting that the gas is in localpressure equilibrium with its surroundings and expanding with thecocoon (Section 5.1, Table 5). Similarities in the pressures acrossthe rib structure suggest that it is a coherent structure with a singledynamical origin (Sections 5 and 6.2).
The clumpy, filamentary, rib-like structure is likely debris, re-sulting from disintegration of the cool core of the Cygnus A clusterduring the early stages of the current epoch of activity (Section 8).The gas now lies on the central inside surface of the cocoon rim(Section 8). The pressure across the ribs is roughly constant if thefilaments are modelled as structures lying within a sheath; this isnot the case if some are elongated structures projected to fill theradio lobes.
MNRAS 476, 4848–4860 (2018)Downloaded from https://academic.oup.com/mnras/article-abstract/476/4/4848/4919633by The Open University useron 12 April 2018

4860 R. T. Duffy et al.
We have discovered that the gas exhibits a temperature structure,with the southwestern part of the ribs cooler than the rest (Fig. 6).Plotting the temperature as a function of angles 5–10 and 10–15arcsec from the core shows an oscillatory pattern with an amplitudeof about 1 keV, providing a quantitative measure of the temperaturegradient (Fig. 8). We suggest that the X-ray gas in the southwestregion is cooler and the AGN was a few kpc northeast of the clustercentre at the start of the outburst.
RT instabilities are not active in the sharp edge measured indetail for one of the gas filaments. We show that they could havebeen suppressed by magnetized layers at the edge of the radio lobe(Section 7).
AC K N OW L E D G E M E N T S
Support for this work was provided by the National Aeronauticsand Space Administration (NASA) through Chandra Award Num-ber GO5-16117A issued by the Chandra X-ray Observatory Center,which is operated by the Smithsonian Astrophysical Observatoryfor and on behalf of the National Aeronautics Space Administrationunder contract NAS8-03060. RTD thanks the Science and Technol-ogy Facility Council (STFC) for support. PEJN was supported inpart by NASA contract NAS8-03060. MJH acknowledges STFCgrant ST/M001008/1. ACE acknowledges support from STFC grantST/L00075X/1.
R E F E R E N C E S
Anders E., Grevesse N., 1989, Geochim. Cosmochim. Acta, 53, 197Arnaud K. A., 1996, in Jacoby G. H., Barnes J., eds, ASP Conf. Ser. Vol.
101, Astronomical Data Analysis Software and Systems V XSPEC: TheFirst Ten Years. Astron. Soc. Pac., San Francisco, p. 17
Arnaud K. A., Fabian A. C., Eales S. A., Jones C., Forman W., 1984,MNRAS, 211, 981
Canalizo G., Max C., Whysong D., Antonucci R., Dahm S. E., 2003, ApJ,597, 823
Carilli C. L., Perley R. A., Dreher J. W., Leahy J. P., 1991, ApJ, 383, 554Carlyle J., Hillier A., 2017, A&A, 605, A101Cavagnolo K. W., Donahue M., Voit G. M., Sun M., 2009, ApJS, 182, 12Chandrasekhar S., 1961, Hydrodynamic and hydromagnetic stability, Inter-
national Series of Monographs on Physics. Oxford.Chon G., Bohringer H., Krause M., Trumper J., 2012, A&A, 545, L3de Vries M. N. et al., 2018, MNRAS, submittedDickey J. M., Lockman F. J., 1990, ARA&A, 28, 215Dreher J. W., Carilli C. L., Perley R. A., 1987, ApJ, 316, 611Duffy R. T., Worrall D. M., Birkinshaw M., Kraft R. P., 2016, MNRAS,
459, 4508Fabian A. C., Sanders J. S., Ettori S., Taylor G. B., Allen S. W., Crawford
C. S., Iwasawa K., Johnstone R. M., 2001, MNRAS, 321, L33Goldston R. J., Rutherford P. H., 1995, Introduction to Plasma Physics. IoP
Publishing, BristolHardcastle M. J., Croston J. H., 2010, MNRAS, 404, 2018Hardcastle M. J., Krause M. G. H., 2013, MNRAS, 430, 174Hardcastle M. J., Krause M. G. H., 2014, MNRAS, 443, 1482
Hardcastle M. J., Kraft R. P., Worrall D. M., Croston J. H., Evans D. A.,Birkinshaw M., Murray S. S., 2007, ApJ, 662, 166
Hogan M. T., McNamara B. R., Pulido F., Nulsen P. E. J., Russell H. R.,Vantyghem A. N., Edge A. C., Main R. A., 2017, ApJ, 837, 51
Kalberla P. M. W., Burton W. B., Hartmann D., Arnal E. M., Bajaja E.,Morras R., Poppel W. G. L., 2005, A&A, 440, 775
Lazio T. J. W., Cohen A. S., Kassim N. E., Perley R. A., Erickson W. C.,Carilli C. L., Crane P. C., 2006, ApJ, 642, L33
McKean J. P. et al., 2016, MNRAS, 463, 3143McNamara B. R., Russell H. R., Nulsen P. E. J., Hogan M. T., Fabian A. C.,
Pulido F., Edge A. C., 2016, ApJ, 830, 79Mannering E., Worrall D. M., Birkinshaw M., 2013, MNRAS, 431, 858Martel H., Robichaud F., Barai P., 2014, ApJ, 786, 79Mathews W. G., Guo F., 2010, ApJ, 725, 1440Mathews W. G., Guo F., 2012, ApJ, 755, 13Nulsen P. E. J., Young A. J., Kraft R. P., McNamara B. R., Wise M. W.,
2015, in Massaro F., Cheung C. C., Lopez E., Siemiginowska A., eds,Proc. IAU Symp. 313, Extragalactic Jets from Every Angle. Kluwer,Dordrecht, p. 236
Owen F. N., Ledlow M. J., Morrison G. E., Hill J. M., 1997, ApJ, 488, L15Panagoulia E. K., Fabian A. C., Sanders J. S., 2014, MNRAS, 438, 2341Perley D. A., Perley R. A., Dhawan V., Carilli C. L., 2017, ApJ, 841, 117Ponman T. J., Cannon D. B., Navarro J. F., 1999, Nature, 397, 135Pratt G. W., Bohringer H., Croston J. H., Arnaud M., Borgani S., Finoguenov
A., Temple R. F., 2007, A&A, 461, 71Reynolds C. S. et al., 2015, ApJ, 808, 154Sanders J. S., 2006, MNRAS, 371, 829Smith R. K., Brickhouse N. S., Liedahl D. A., Raymond J. C., 2001, ApJ,
556, L91Smith D. A., Wilson A. S., Arnaud K. A., Terashima Y., Young A. J., 2002,
ApJ, 565, 195Snios B. et al., 2018, ApJ, 855, 71Steenbrugge K. C., Blundell K. M., Duffy P., 2008, MNRAS, 388, 1465Steenbrugge K. C., Heywood I., Blundell K. M., 2010, MNRAS, 401, 67Sutherland R. S., Bicknell G. V., 2007, ApJS, 173, 37Vantyghem A. N. et al., 2016, ApJ, 832, 148Vikhlinin A., Kravtsov A., Forman W., Jones C., Markevitch M., Murray S.
S., Van Speybroeck L., 2006, ApJ, 640, 691Wilman R. J., Edge A. C., Johnstone R. M., Crawford C. S., Fabian A. C.,
2000, MNRAS, 318, 1232Wilson A. S., Smith D. A., Young A. J., 2006, ApJ, 644, L9Worrall D. M., Birkinshaw M., 2006, in Alloin D., ed., Lecture Notes in
Physics, Physics of Active Galactic Nuclei at all Scales. Springer-Verlag,Berlin, p. 39
Worrall D. M., Birkinshaw M., Kraft R. P., Hardcastle M. J., 2007, ApJ,658, L79
Worrall D. M., Birkinshaw M., Young A. J., Momtahan K., Fosbury R. A.E., Morganti R., Tadhunter C. N., Verdoes Kleijn G., 2012, MNRAS,424, 1346
Yaji Y., Tashiro M. S., Isobe N., Kino M., Asada K., Nagai H., Koyama S.,Kusunose M., 2010, ApJ, 714, 37
Young A. J., Wilson A. S., Terashima Y., Arnaud K. A., Smith D. A., 2002,ApJ, 564, 176
This paper has been typeset from a TEX/LATEX file prepared by the author.
MNRAS 476, 4848–4860 (2018)Downloaded from https://academic.oup.com/mnras/article-abstract/476/4/4848/4919633by The Open University useron 12 April 2018