The Woodlands Home Sales Report - January 2015
9
The Home Sales Real Estate Report The Woodlands | January 3 rd , 2015 Lis@ng Inventory Month By Month Home Sales Month By Month Average Sold Price / Median Sold Price – Month By Month Average Price Per Square Foot – Month By Month Average Days On Market – Month By Month Months Supply of For Sale Inventory – Month By Month Sold Price To List Price % R By Broker 9000 Forest Crossing Drive | The Woodlands TX 77381 | 281-367-3531 281-367-3531
-
Upload
ken-brand -
Category
Real Estate
-
view
203 -
download
1
Transcript of The Woodlands Home Sales Report - January 2015

The$Home$Sales$Real$Estate$Report$$The$Woodlands$|$January$3rd,$2015$Lis@ng$Inventory$Month$By$Month$Home$Sales$Month$By$Month$$Average$Sold$Price$/$Median$Sold$Price$–$Month$By$Month$Average$Price$Per$Square$Foot$–$Month$By$Month$Average$Days$On$Market$–$Month$By$Month$Months$Supply$of$For$Sale$Inventory$–$Month$By$Month$$Sold$Price$To$List$Price$%$R$By$Broker$$
9000 Forest Crossing Drive | The Woodlands TX 77381 | 281-367-3531
281-367-3531

The Woodlands Texas Real Estate ReportListing Inventory - Month to Month By Year
Jan Feb Mar Apr May Jun Jul Aug Sep Oct Nov Dec2015 5912014 355 366 373 445 497 556 617 682 669 680 652 645
Better Homes And Gardens Real Estate Gary Greene - 9000 Forest Crossing, The Woodlands Texas / 281-367-3531Data obtained from the Houston Association of Realtors Multiple Listing Service - Single Family/TheWoodlands TX
2015 Listing Inventory 2014 Listing Inventory

The Woodlands Texas Real Estate ReportProperties Placed Under Contract - Month to Month
Jan Feb Mar Apr May Jun Jul Aug Sep Oct Nov Dec2014 195 203 277 314 300 297 218 233 155 197 147 1662013 182 257 290 327 364 304 270 228 177 212 138 149
Better Homes And Gardens Real Estate Gary Greene - 9000 Forest Crossing, The Woodlands Texas / 281-367-3531Data obtained from the Houston Association of Realtors Multiple Listing Service - Single Family/TheWoodlands TX
2013 Contrats Written 2014 Contracts Written
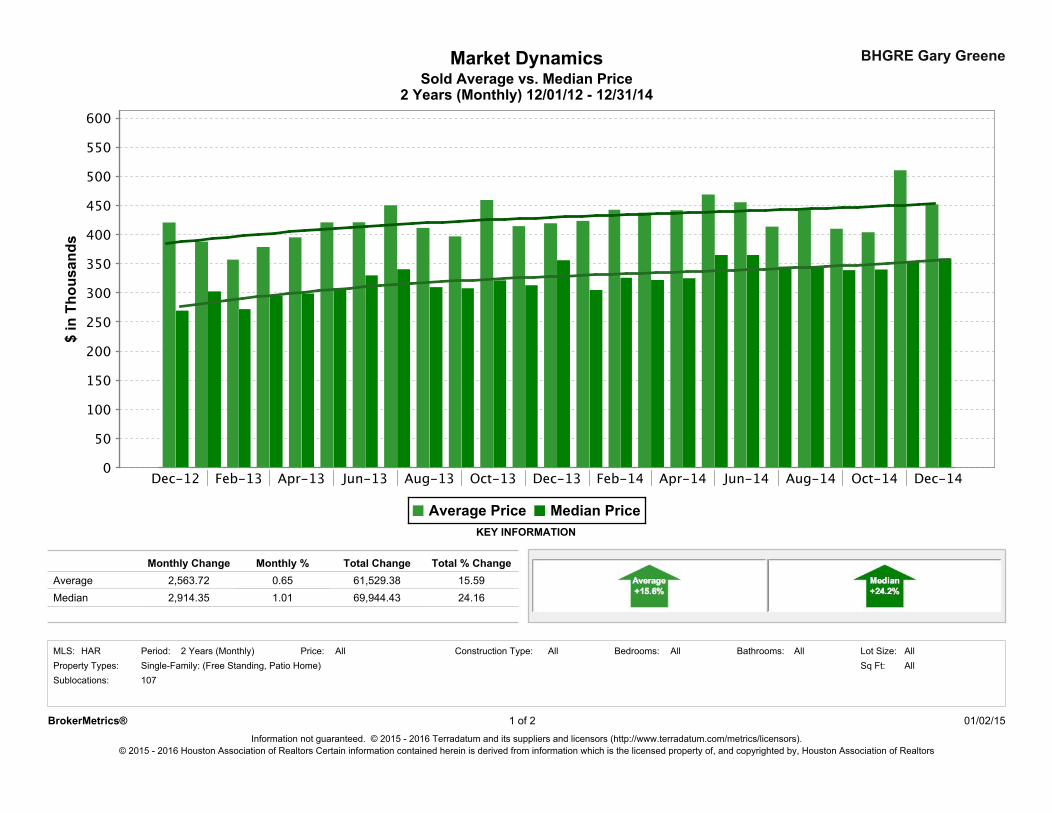
KEY INFORMATION
2 Years (Monthly) 12/01/12 - 12/31/14
Market Dynamics BHGRE Gary GreeneSold Average vs. Median Price
Monthly % Total % Change
24.160.65
Monthly Change
2,914.35Median
Total ChangeAverage 2,563.72 61,529.38 15.59
69,944.431.01
Sublocations:All
Bathrooms:Single-Family: (Free Standing, Patio Home) Sq Ft:
HAR AllAll AllAllAll Lot Size:Bedrooms:Property Types:
107
2 Years (Monthly) Construction Type:Price:Period:MLS:
01/02/15BrokerMetrics®Information not guaranteed. © 2015 - 2016 Terradatum and its suppliers and licensors (http://www.terradatum.com/metrics/licensors).
© 2015 - 2016 Houston Association of Realtors Certain information contained herein is derived from information which is the licensed property of, and copyrighted by, Houston Association of Realtors
1 of 2

BHGRE Gary Greene
2 Years (Monthly) 12/01/12 - 12/31/14
Market DynamicsSold Average vs. Median Price
Time Period # Properties Sold Sold Average $ Sold Median $ Sold Avg DOMAverage $ - Median $ Median $ as % of Average $188Dec-14 451,916 79.5359,250 92,666 52127Nov-14 510,416 69.4354,500 155,916 46165Oct-14 404,115 84.1340,000 64,115 42187Sep-14 410,118 82.7339,000 71,118 36229Aug-14 444,543 77.2343,000 101,543 35303Jul-14 413,571 83.4345,000 68,571 28269Jun-14 455,421 80.2365,000 90,421 27269May-14 468,861 77.8365,000 103,861 32228Apr-14 441,674 73.6325,000 116,674 34206Mar-14 437,658 73.6322,000 115,658 38143Feb-14 442,656 73.6326,000 116,656 43125Jan-14 423,536 72.0305,000 118,536 46172Dec-13 419,476 84.9356,000 63,476 43177Nov-13 414,448 75.5313,000 101,448 47170Oct-13 459,404 70.0321,500 137,904 35192Sep-13 397,010 77.6308,000 89,010 32278Aug-13 411,555 75.3309,900 101,655 27310Jul-13 450,251 75.6340,495 109,756 27321Jun-13 421,217 78.3330,000 91,217 28306May-13 420,921 72.5305,000 115,921 32232Apr-13 395,125 75.6298,869 96,256 38212Mar-13 378,783 78.0295,250 83,533 45169Feb-13 357,056 76.2272,000 85,056 54131Jan-13 387,824 78.0302,500 85,324 65181Dec-12 420,754 64.0269,500 151,254 68
© 2015 - 2016 Houston Association of Realtors Certain information contained herein is derived from information which is the licensed property of, and copyrighted by, Houston Association of Realtors
2 01/02/152 ofBrokerMetrics®Information not guaranteed. © 2015 - 2016 Terradatum and its suppliers and licensors (http://www.terradatum.com/metrics/licensors).

BHGRE Gary GreeneMarket Dynamics
2 Years (Monthly) 12/01/12 - 12/31/14Average DOM for Under Contract Properties
Monthly %0.05
107
Total % Change
Sq Ft:Bathrooms:All All
DOM
Construction Type:
Sublocations:
Period:Property Types:
1.20 3.05Monthly Change
0.13
Lot Size:All
KEY INFORMATION
Single-Family: (Free Standing, Patio Home) AllHAR AllBedrooms:
Total Change
AllMLS: Price:2 Years (Monthly)
Information not guaranteed. © 2015 - 2016 Terradatum and its suppliers and licensors (http://www.terradatum.com/metrics/licensors).
BrokerMetrics® 1 of 2
© 2015 - 2016 Houston Association of Realtors Certain information contained herein is derived from information which is the licensed property of, and copyrighted by, Houston Association of Realtors
01/02/15

Average DOM for Under Contract PropertiesMarket Dynamics BHGRE Gary Greene
2 Years (Monthly) 12/01/12 - 12/31/14
Period Avg DOM Avg CDOMContract# UnderTime
65Dec-14 9215652Nov-14 7614644Oct-14 6518143Sep-14 6114039Aug-14 4922134Jul-14 4420232Jun-14 4227525May-14 2926030Apr-14 4627730Mar-14 4826042Feb-14 5718644Jan-14 7018148Dec-13 6112037Nov-13 5313845Oct-13 6219235Sep-13 5816533Aug-13 4421331Jul-13 4724723Jun-13 4227328May-13 3834136Apr-13 6328931Mar-13 5126145Feb-13 6722358Jan-13 8718169Dec-12 100135
2
© 2015 - 2016 Houston Association of Realtors Certain information contained herein is derived from information which is the licensed property of, and copyrighted by, Houston Association of Realtors
01/02/15Information not guaranteed. © 2015 - 2016 Terradatum and its suppliers and licensors (http://www.terradatum.com/metrics/licensors).
BrokerMetrics® 2 of

! Page 1 9000 Forest Crossing The Woodlands, Texas 77381 Office: 281.367.3531 or 800.932.7253
The Woodlands Texas Real Estate Report Months Supply Of “For Sale” Listing Inventory – January 2nd, 2015
Q. Is it a Seller’s Market? According to real estate economists a six-month supply of For Sale Inventory represents a balanced market. Over six months of For Sale Inventory indicates a buyer’s market. Less than six months of inventory in considered a seller’s market. As we can see from these inventory numbers below, sellers priced under $900,000 enjoy a seller’s market. Here’s a break down by price. PRICE RANGE. . . . . . . . . . . . . . . MONTHS SUPPLY OF LISTING INVENTORY
$000,000 – $200,000 . . . . . . . . . . . . . . . . . . . . 27 Days
$200,001 – $300,000 . . . . . . . . . . . . . . . . . . . . 1.8 Months $300,001 – $400,000 . . . . . . . . . . . . . . . . . . . . 2.4 Months $400,001 – $500,000 . . . . . . . . . . . . . . . . . . . . 2.9 Months $500,001 – $600,000 . . . . . . . . . . . . . . . . . . . . 2.9 Months $600,001 – $700,000 . . . . . . . . . . . . . . . . . . . . 4.7 Months $700,001 – $800,000 . . . . . . . . . . . . . . . . . . . . 4.7 Months $800,001 – $900,000 . . . . . . . . . . . . . . . . . . . . 5.0 Months $900,001 – $1,000,000 . . . . . . . . . . . . . . . . . . . 6.5 Months
$1,000,001 - $1,500,000 . . . . . . . . . . . . . . . . . 9.3 Months $1,500,001 - $2,000,000 . . . . . . . . . . . . . . . . . 8.2 Months
$2,000,001+ . . . . . . . . . . . . . . . . . . . . . . . . . . 27.6 Months All Price Ranges . . . . . . . . . . . . . . . . . . . . . . . . 2.9 Months
What does this mean? For Buyers: in a seller’s market, when you find something you love, don’t hesitate to submit an offer. If you snooze you lose out. For Sellers: Any amateur can sell a property in a screaming seller’s market. To sell your property for HIGHEST possible price and the BEST possible terms call us today.
Closing Thoughts: While mulling over these inventory numbers, keep in mind these figures represent big averages across The Woodlands. Real estate is hyper local in nature and market conditions for your specific property, in your specific neighborhood may be different that the big average you see above.
To find out what’s happening in your neighborhood, contact us and we’ll provide you with an up to the minute, on-target Months Supply of Inventory report. Give us a call and we’ll send you your free report – pronto.

Market Share Totals BHGRE Gary Greene
Sublocations:
Price:Single-Family: (Free Standing, Patio Home)
Bathrooms:Property Types:
AllDate: AllBroker All
107
HAR All11/01/2014 - 12/03/2014 SoldStatus: Construction Type:Type: Bedrooms:MLS:
Information not guaranteed. © 2014 - 2015 Terradatum and its suppliers and licensors (http://www.terradatum.com/metrics/licensors).© 2014 - 2015 Houston Association of Realtors Certain information contained herein is derived from information which is the licensed property of, and copyrighted by, Houston Association of Realtors
2%URNHU0HWULFV� 1 of 12/03/14