The Welfare Cost of Inflation with Banking Time · The Welfare Cost of Inflation with Banking Time...
43
MŰHELYTANULMÁNYOK DISCUSSION PAPERS INSTITUTE OF ECONOMICS, CENTRE FOR ECONOMIC AND REGIONAL STUDIES, HUNGARIAN ACADEMY OF SCIENCES - BUDAPEST, 2018 MT-DP – 2018/31 The Welfare Cost of Inflation with Banking Time MAX GILLMAN
Transcript of The Welfare Cost of Inflation with Banking Time · The Welfare Cost of Inflation with Banking Time...

MŰHELYTANULMÁNYOK DISCUSSION PAPERS
INSTITUTE OF ECONOMICS, CENTRE FOR ECONOMIC AND REGIONAL STUDIES,
HUNGARIAN ACADEMY OF SCIENCES - BUDAPEST, 2018
MT-DP – 2018/31
The Welfare Cost of Inflation
with Banking Time
MAX GILLMAN

Discussion papers MT-DP – 2018/31
Institute of Economics, Centre for Economic and Regional Studies,
Hungarian Academy of Sciences
KTI/IE Discussion Papers are circulated to promote discussion and provoque comments.
Any references to discussion papers should clearly state that the paper is preliminary. Materials published in this series may subject to further publication.
The Welfare Cost of Inflation with Banking Time
Author:
Max Gillman Friedrich A. Hayek Professor in Economic History
University of Missouri-St. Louis; IEHAS, Budapest; CERGE-EI, Prague [email protected]
November 2018

The Welfare Cost of Inflation with Banking Time
Max Gillman
Abstract
The paper presents the welfare cost of inflation in a banking time economy that models
exchange credit through a bank production approach. The estimate of welfare cost uses
fundamental parameters of utility and production technologies. It is compared to a cash-only
economy, and a Lucas (2000) shopping economy without leisure, as special cases. The paper
estimates the welfare cost of a 10% inflation rate instead of zero, for comparison to other
estimates, as well as the cost of a 2% inflation rate instead of a zero inflation rate. The zero
rate is specified as the US inflation rate target in the 1978 Employment Act amendments. The
paper provides a conservative welfare cost estimate of 2% inflation instead of zero at $33
billion a year. Estimates of the percent of government expenditure that can be financed
through a 2% vs. zero inflation rate are also provided.
JEL: E13, E31, E43, E52
Keywords: Euler equation, interest rates, inflation, banking, money demand, velocity,
price-theoretic, marginal cost, productivity shocks, Great Recession
Acknowledgement:
I acknowledge valuable comments from the Editor and Referee of the journal, from Tamas
Csaba, Michal Kejak, from many students at CEU, Cardi¤ and UMSL, and also appreciate the
funding of Czech Science Foundation GACR 13-34096S.

The Welfare Cost of Inflation with Banking Time
Max Gillman∗
University of Missouri, St. Louis; IEHAS, Budapest; CERGE-EI, Prague.
October 22, 2018
Abstract
The paper presents the welfare cost of inflation in a banking time economy that
models exchange credit through a bank production approach. The estimate of welfare
cost uses fundamental parameters of utility and production technologies. It is compared
to a cash-only economy, and a Lucas (2000) shopping economy without leisure, as
special cases. The paper estimates the welfare cost of a 10% inflation rate instead of
zero, for comparison to other estimates, as well as the cost of a 2% inflation rate instead
of a zero inflation rate. The zero rate is specified as the US inflation rate target in the
1978 Employment Act amendments. The paper provides a conservative welfare cost
estimate of 2% inflation instead of zero at $33 billion a year. Estimates of the percent
of government expenditure that can be financed through a 2% vs. zero inflation rate
are also provided.
JEL Classification: E13, E31, E43, E52
Keywords: Euler equation, interest rates, inflation, banking, money demand, veloc-
ity, price-theoretic, marginal cost, productivity shocks, Great Recession.
∗I acknowledge valuable comments from the Editor and Referee of the journal, from Tamas Csabafi,Michal Kejak, from many students at CEU, Cardiff and UMSL, and also appreciate the funding of CzechScience Foundation GACR 13-34096S.

1 Introduction
The welfare cost of inflation remains an issue of importance given monetary policy’s world-
wide adoption of inflation rate targeting. For example, US Congress passed a 1978 Act
amending the 1946 Full Employment Act to state that the US inflation rate should be zero
from 1988 onwards unless other goals conflict with this. The US Federal Reserve System
(Fed) has in recent years established an explicit 2% inflation target, in apparent violation
of statutory law; see Section 2 for details. This leaves important whether inflation, which
continually is a source of government revenue, is very costly as a tax or not, even at low
levels of the inflation rate.
The paper shows a "modern", neoclassical, banking based, view of how to compute
the welfare cost of inflation. Abstracting from the inclusion of capital accumulation, as in
Lucas’s (2000) "Inflation and Welfare", the paper builds a banking time model rather than
Lucas’s shopping time model. Related to Silva (2012), who endogenizes the number of times
banking activity is conducted in order to avoid optimally the inflation tax, the advantage
here is that all parameters are fundamental to either the bank production function or to the
other standard utility and goods technology production frontiers. The resulting welfare cost
function shows the importance of two channels in avoiding the inflation tax: banking, which
produces credit, so as to use less real money for the chosen amount of consumption goods,
and secondly leisure use which allows avoidance of the implicit inflation tax by consuming
less goods. As reflected in the interest elasticity of money demand, as shown below, it
ends up that credit use makes money demand much more interest elasticity as compared to
leisure use, making credit use the major component of the welfare cost of inflation.
The welfare cost is constructed as the compensating asset endowment required to keep
utility when facing inflation the same as utility at the Friedman (1969) optimum. The result
is that in the case of no utility derived from to leisure, the welfare cost as a fraction of full
income is exactly the time used in banking. This extends the Lucas (2000) result of how,
in a similar economy with no leisure, the welfare cost is exactly the shopping time as in a
McCallum and Goodfriend (1987) shopping time economy. Silva (2012) has similar results
1
in his baseline model without leisure, in that then the welfare cost of inflation is due almost
solely to banking activity.1
With substitution towards leisure, the consumer can balance a somewhat lower consump-
tion level against the use of labor in banking to avoid the inflation tax by using exchange
credit. This marginal tradeoff is seen in terms of the marginal rate of substitution between
goods and leisure, which equals the ratio of the shadow price of goods to leisure. In this
shadow price, goods have a shadow cost of exchange that is a weighted average, per unit of
consumption goods, of the average cost of using money plus the average cost of using credit.
The average exchange cost of using credit results from the banking production function.
The paper presents the welfare cost of a 10% inflation rate instead of a zero inflation, as
well as the cost of a 2% inflation rate instead of a zero rate. It also computes the welfare
cases when banking is not permitted (equivalent to a zero productivity parameter in banking
production), but leisure still can be used to avoid inflation, and the case when leisure is not
used (leisure preference is zero) but banking is a viable means to avoid inflation. For the
2% inflation rate instead of zero, the paper estimates how much national income is being
lost relative to the 1978 Act target of a zero inflation rate, calculated to be some $33 billion
a year.
2 US Law on the Target Inflation Rate
According to the US Federal Reserve Bank the FOMC (Federal Open Market Committee)
has since 2012 adopted an explicit inflation target of 2%. In January 2012 the FOMC stated2
"The inflation rate over the longer run is primarily determined by monetary
policy, and hence the Committee has the ability to specify a longer-run goal
for inflation. The Committee judges that inflation at the rate of 2 percent, as
measured by the annual change in the price index for personal consumption
expenditures, is most consistent over the longer run with the Federal Reserve’s
statutory mandate (Board of Governors of the Federal Reserve System 2012)."1See Silva (2012), for example, in Table 2, with his N fixed and with his a = 0.2https://www.federalreservehistory.org/essays/humphrey_hawkins_act#footnote3
2

The same January 2012 FOMC statement continues that it will not specify the level of
employment to be targeted:
"The maximum level of employment is largely determined by nonmonetary
factors that affect the structure and dynamics of the labor market. These factors
may change over time and may not be directly measurable. Consequently, it
would not be appropriate to specify a fixed goal for employment" [bold
added].
In contrast, current US law in the form of the 1978 Amendments to the 1946 Full
Employment and Stability Act precisely sets both the targeted US inflation rate and the US
unemployment rate. For inflation, it states that the US inflation rate should be 3% by 1983
and should be 0% by 1988 and afterwards, unless it conflicts with the employment goal. For
unemployment, rates of 4% for aged 16 and over, and 3% for aged 20 and over, are to be
met within 5 years of the passing of the 1978 Act (so by 1983).
Further, the Act specifies that only the President or Congress can change these goals.
The US Federal Reserve Bank (Fed) is not allowed, by any existing law, to change these
goals. Therefore, it is not authorized, without Presidential or Congressional mandate, to
set a 2% inflation rate target as it did in 2012, because the target is currently specified in
law as zero percent unless it conflicts with achieving the unemployment target. And it is not
authorized to change the target unemployment rate of the 1978 Act.3
The Fed seemingly has a big loophole in that the 1978 Act specifies that the inflation rate
target may be higher if it conflicts with the unemployment rate targets. But when the Fed
set its 2% inflation target, it also specifically stated that the inflation target does not affect
the unemployment rate, in that this is set by "nonmonetary factors". So the Fed closes the
loophole offered to it under the 1978 Act by saying the inflation and unemployment rates
are "largely" unrelated.
3Public Law 95-523, passed October 27, 1978, is known as the Humphrey-Hawkins Actor offi cially within its Section 1 as "Full Employment and Balanced Growth Act of 1978".https://www.govtrack.us/congress/bills/95/hr50/textAlternatively, a pdf of the law is found at https://onlabor.org/wp-content/uploads/2016/12/STATUTE-
92-Pg1887.pdf
3

However the Fed’s logic for not setting an unemployment rate goal is faulty. Rather than
its authority to set unemployment rate targets being based on some envisioned relation
between the inflation rate and the unemployment rate, the Fed has no authority to set
unemployment rate targets since the fact is that these are already set in the 1978 Act,
which provides no authority to the Fed to alter these targets. It is the specific US 1978
statutory law, which specifically precludes the Fed from having authority to change the
unemployment rate targets, that implies that for the Fed: "it would not be appropriate to
specify a fixed goal for employment". The end result is that today the Fed has given no
Congressionally valid reason for setting a 2% inflation rate target in deliberate contradiction
of the 1978 Act’s target of a zero inflation rate.
There are four relevant sections of the Act, 4.b1.-4.b.4, which respectively set out the
unemployment rate goal, the inflation rate target for the first five years, the inflation rate
target for all years after 1988, and the authority for changing these targets.
"Section 4.b.(1). reducing the rate of unemployment, as set forth pursuant
to section 3(d) of this Act, to not more than 3 per centum among individuals
aged twenty and over and 4 per centum among individuals aged sixteen and over
within a period not extending beyond the fifth calendar year after the first such
Economic Report; and
Section 4.b.(2) reducing the rate of inflation, as set forth pursuant to section
3(e) of this Act, to not more than 3 per centum within a period not extending
beyond the fifth calendar year after the first such Economic Report: Provided,
That policies and programs for reducing the rate of inflation shall be designed
so as not to impede achievement of the goals and timetables specified in clause
(1) of this subsection for the reduction of unemployment."
"Section 4.c.(2). Upon achievement of the 3 per centum goal specified in sub-
section (b) (2), each succeeding Economic Report shall have the goal of achieving
by 1988 a rate of inflation of zero per centum: Provided, That policies and pro-
grams for reducing the rate of inflation shall be designed so as not to impede
achievement of the goals and timetables specified in clause (1) of this subsection
4

for the reduction of unemployment."
Section 4.d states that only the President or Congress may change these goals:
"if the President finds it necessary, the President may recommend modifica-
tion of the timetable or timetables for the achievement of the goals provided for
in subsection (b) and the annual numerical goals to make them consistent with
the modified timetable or timetables, and the Congress may take such action
as it deems appropriate consistent with title III of the Full Employment and
Balanced Growth Act of 1978."
Using data from the US Bureau of Labor Statistics, the unemployment goal of 4% for
over 16 years of age was achieved for briefly in December 1999, and for several months into
2000, when it dipped into the 3+% range. Now, in April, May, and June 2018, the rate
has been again below or equal to 4%.4 The rate for ages over 20 has been below 4% since
September 2017.
The legislatively binding US law, which sets the US inflation rate to be 0% permanently,
seems to be contraindicted permanently such that a permanent 2% inflation rate target is
set "de facto" by the Fed. Would this contradiction of US law be based on the inability
to meet some unemployment goal, it might be acceptable as an interim policy. But, 1) the
Fed FOMC openly admits in January 2012 that monetary policy has little if any ability
to affect the long term employment rate (as quoted above). And 2), the goals of the 1978
law on unemployment are now largely met, although having taken longer than the five
years allowed. This achievement of the statutory US unemployment goals seems to imply
unambiguously that the inflation target should now be zero.
To summarize and emphasize the conundrum here: First, the Fed claims the 2% inflation
target is not chosen to achieve the unemployment goal, since it cannot affect unemployment.
Second, the unemployment goal appears to have been met as of now anyway. Third, the
inference results that the Fed appears to be contravening statutory law of a 0% inflation rate
by their self-established 2% target. If so, then by US law, the Fed 2% inflation target is a
4https://fred.stlouisfed.org/series/UNRATENSA
5

judicially challengable over-reach by the Fed relative to US statutory law. While economists
can consult the lawyers, this is clearly controversial, if not illegal, policy practice by the Fed,
even though there not much of a fuss made over it by academics. Economists though can
propose ways to quantify the cost of the Fed’s contraindiction of the zero inflation rate in
favor of the 2% target. This is done here through the standard approach of the welfare cost
of inflation, in terms of a 2% rate compared to zero.
3 Banking Time Model
Consider an exchange economy using only labor, and no physical capital. With log utility
u, over goods ct and leisure xt,
u = ln ct + α lnxt, (1)
and a linear production of output using only labor time lt, and with w ∈ R++,
yt = wlt, (2)
the allocation of time constraint now is that labor, l, bank production time lQ, and leisure
xt equal total endowed time each period of T. With T normalized to 1, this implies
1 = lt + lQt + xt. (3)
In nominal terms, at time t, with a price of goods denoted by Pt, the consumer purchases
goods Ptct, invests in holding money, Mt+1−Mt, invests in holding nominal bonds, denoted
by Bt, where this investment is Bt+1 − (1 +Rt)Bt, and Rt is the nominal bond interest
rate. The consumer’s income consists of nominal wages from working, Ptw (1− lQt − xt) ,
plus the government transfer of revenue, Ht. The consumer also receives each period a goods
6

endowment of Ptzt ≥ 0.
Ptct +Mt+1 −Mt +Bt+1 − (1 +Rt)Bt = w (1− lQt − xt) +Ht + Ptzt. (4)
Let qt denote the real amount of goods that are bought with the credit service provided
by the bank, with these credit purchases being a consumer financial liability due to be paid
offby the end of the period from the consumers deposit account. The other financial liability
can be considered to be the cash withdrawn from the bank deposit account during time t,
as determined at the end of the last period. Each of these provide means of exchange that
give rise to the exchange constraint whereby the sum of real money and credit purchases
equal consumption good purchases, ct.
In particular, the exchange constraint is that real consumption can be bought with either
real money mt ≡Mt/Pt, or with real exchange credit qt :
ct = mt + qt. (5)
Let the deposited funds in the bank account be denoted by dt, with these deposits being
the consumer’s asset of the net income deposited in the consumer’s bank account by the
goods producer and government transfers (Ht). The consumer’s assets equal deposits, which
in turn equal liabilities of cash withdrawals, mt, plus credit purchases qt. Given the exchange
constraint in equation (5), by which consumption purchases equal the liabilities of real cash
plus credit, this implies that dt = ct is a "balance sheet" constraint, with assets equal to
liabilities. This incarnates the type of constraint recommended by Hicks (1935). At the
same time, the banking service is conducted by providing labor to the production of the
credit service, within a representative agent framework in which the agent also acts in part
as a bank. Or as Hicks (1935) puts it, with "every individual in the community as being,
on a small scale, a bank. Monetary theory becomes a sort of generalisation of banking
theory".5
5"Our method of analysis, it will have appeared, is simply an extension of the ordinary method of valuetheory. In value theory, we take a private individual’s income and expenditure account; we ask which of theitems in that account are under the individual’s own control, and then how he will adjust these items in
7

Following Clark (1984), and the subsequent consistent literature known as the "produc-
tion approach to banking" (Degryse et al., 2009), assume that the credit service production
function is specified in Cobb-Douglas form as
qt = AQ (lQt)γ
(dt)1−γ
. (6)
The per unit of deposit amount of credit service produced is simply (qt/dt) = AQ
(lQtdt
)γ.
Making the substitution of consumption goods for deposited funds, apply the balance con-
straint that dt = ct, since the bank problem is not decentralized here. Then as in Gillman
and Nakov (2003, 2004), Gillman and Kejak (2004, 2005a, 2005b), Gillman et al. (2004),
Benk et al. (2005a, 2005b, 2008, 2010), Gillman and Yerokhin (2005) and Gillman and
Otto (2007), the consumer acts also as banker and produces the credit service so that the
normalized credit production function can be written as qt/ct = AQ
(lQtct
)γ. Alternatively,
the bank problem can be decentralized by which the consumer chooses dt, along with qt,
with dt = ct as an added constraint of the consumer problem; for such a decentralization
of the bank provision of exchange credit in a similar deterministic setting see Gillman and
Kejak (2011).6
Substituting the bank production function of equation (6), with dt substituted by ct,
into the the exchange constraint gives the condition that
ct = mt +AQ (lQt)γ
(ct)1−γ
. (7)
order to reach a most preferred position. On the production side, we make a similar analysis of the profitand loss account of the firm. My suggestion is that monetary theory needs to be based again upon a similaranalysis, but this time, not of an income account, but of a capital account, a balance sheet. We have toconcentrate on the forces which make assets and liabilities what they are. So as far as banking theory isconcerned, this is really the method which is currently adopted; though the essence of the problem is theresomewhat obscured by the fact that banks, in their efforts to reach their " most preferred position " arehampered or assisted by the existence of conventionial or legally obligatory reserve ratios. For theoreticalpurposes, this fact ought only to be introduced at a rather late stage; if that is done, then my suggestioncan be expressed by saying that we ought to regard every individual in the community asbeing, on a small scale, a bank. Monetary theory becomes a sort of generalisation of bankingtheory" (bold added, p. 12, Hicks, 1935).
6Using the centralized banking approach in this paper, consumption goods equal deposits and so enterthe bank production function instead of deposits, while Gillman and Kejak (2011) decentralize the banksector and so the consumer chooses deposits subject to the constraint that deposits equal consumption;this yields that the return on deposits Rd equals the shadow value of the deposit constraint (d = c). Thebank optimization with respect to deposits d in turn yields the profit per unit of deposits given back to theconsumer, who owns the bank, whereby Rd = R (1− γ) q
d= R (1− γ) q
c.
8

The government budget constraint in turn is that
Ht = Mt+1 −Mt +Bt+1 −Bt (1 +Rt) , (8)
with the provisions that there are zero net bond holdings in equilibrium and that the money
supply for here grows at a constant rate such that
Ht = Mt+1 −Mt = σMt. (9)
With a time discount factor of 11+ρ , the consumer problem in infinite horizon form
adds one more variable lQt to the standard Lucas (1980) cash-only cash-in-advance model,
exchanges the shopping time st of the McCallum and Goodfriend (1987) model with this
"banking time" lQt, and instead of a shopping time constraint includes a cash-in-advance
exchange constraint extended to include an explicit money substitute used to avoid the
inflation tax, this being exchange credit. With the budget constraint (4) written in real
terms, with the time t + 1 inflation rate defined by πt+1 ≡ Pt+1/Pt, and with bt ≡ Bt/Pt,
the consumer problem is
Maxct,xt,Mt+1,Bt+1,lQt
∞∑t=0
(1
1 + ρ
)t{u (ct, xt) (10)
+λt
−ct + w (1− lQt − xt)−mt+1 (1 + πt+1) +mt
−bt+1 (1 + πt+1) + bt (1 +Rt) +Ht/Pt + zt
+µt
[−ct +mt +AQ (lQt)
γ(ct)
1−γ.]} .
The first-order equilibrium conditions (FOC) are as follows:
9

ct :1
ct− λt − µt
[1− (1− γ)AQ
(lQtct
)γ]= 0; (11)
xt :α
xt− λtw = 0; (12)
Mt+1 : −(
1
1 + ρ
)tλt
1
Pt+
(1
1 + ρ
)t+1(λt+1
1
Pt+1+ µt+1
1
Pt+1
)= 0; (13)
Bt+1 : −(
1
1 + ρ
)tλt
1
Pt+
(1
1 + ρ
)t+1λt+1
(1 +Rt+1)
Pt+1= 0; (14)
lQt : −λtw + µtγAQ
(lQtct
)γ−1= 0. (15)
The equilibrium goods and exchange constraints are that ct = w (1− lQt − xt) + zt, and
ct = mt +AQ (lQt)γ
(ct)1−γ
.
The marginal rate of substitution between goods and leisure, MRSc,x, primarily from
equations (11) and (12), is the ratio of the shadow price of goods to the shadow price of
leisure. The goods cost of the shadow price of goods is one, and the exchange cost is now
a weighted average of the cost of using money, at an average cost per consumption unit
of the nominal interest rate R, and the cost of using exchange credit, at an average cost
per consumption unit of γR. Since γR < R, because γ ∈ [0, 1), then the average cost of
exchange using credit per unit of consumption is less than that using money. The weights
are the share of purchases using money, or the inverse consumption velocity, mtct , which we
can denote as at ≡ mtct, such that since ct = mt+qt, it results that 1 = mt
ct+ qtct. The shadow
price of leisure is the marginal product of labor w. This makes MRSc,x equal to
xtαct
=1 + atRt + (1− at) γRt
w. (16)
Note that without leisure, with α = 0, then it results that the marginal benefit of
consumption equals its shadow marginal cost, or 1ct
= λt [1 + atRt + (1− at) γRt] , and the
only way to avoid the inflation tax is with credit use; the leisure option is eliminated as an
escape valve. Alternatively, with no credit available, as in the special case of at = 1 (which
occurs when AQ = 0), then equation (16) becomes xtαct
= 1+Rtw , as in a Lucas (1980) cash
10

only economy, with leisure.7 Having credit available lowers the exchange cost from R to
Rt ≡ atRt + (1− at) γRt, since it is always true that Rt ≥ atRt + (1− at) γRt. This can
be seen by substituting in the solution for normalized money demand, at ∈ (0, 1], found in
equation (22) below, and differentiating with respect to Rt.
A lower exchange cost means the consumer effectively avoids some of the inflation tax, at
the cost of the banking service, but with the advantage of less substitution towards leisure
since the shadow cost of goods is not as high when credit is available. Choosing more leisure
use avoids the inflation tax through less goods ct, which occurs when the shadow price of
goods to leisure, 1+atRt+(1−at)γRtw , rises as a result of an increased money supply growth
rate, and a subsequently higher nominal interest rate Rt (even as at falls when Rt rises).
That is, ∂Rt∂Rt≥ 0. It results, as seen in Section 8 below, that the elasticity of money demand
is increased much more by the ability to use credit than the ability to use leisure to avoid
the inflation tax.
To see the result in full on equation (16) of raising the money supply growth rate, note
that from the exchange constraint, Mt+1
Mt= at+1Pt+1
atPt. In the steady state at+1 = at, and so
the money supply growth rate equals the inflation rate; 1+σ = 1+π. In addition, the Fisher
equation holds from the bond FOC, in equation (14), such that 1+R = (1 + π) (1 + ρ), which
in turn equals (1 + σ) (1 + ρ) since σ = π. This shows that an increase in the exogenous
money supply growth rate σ causes R to rise proportionate with (1 + ρ); ∂R∂σ = 1 + ρ, so R
rises when σ rises, and R also rises, but by less that R itself.
The FOC with respect to time in credit service production, lQt, implies the Baumol
condition of this model whereby the marginal cost of money equals the marginal cost of
exchange credit. In particular, using that µtλt
= R, from the equilibrium conditions for
money Mt+1 and bonds Bt+1, of equations (13) and (14), together with the lQt FOC, of
equation (15), implies that the marginal cost of exchange credit equals the marginal factor
7 In a shopping time economy, with leisure, this marginal rate is xtαct
=1+wgc(mt,ct)
w, where s = g (mt, ct)
is the standard shopping time function; since Rt = −wgm (mt, ct) is another equilibrium conditions, thenxtαct
=1+Rtgc(mt,ct)/gm(mt,ct)
w, and with st ≡ g (ct,mt) =
ctkmt
, as in Lucas (2000), then xtαct
=1+Rt
mtct
w=
1+atRw
, in our notation, rather than 1+atRt+(1−at)γRtw
as in this paper’s model.
11

cost w divided by the marginal factor product of (∂qt) / (∂lQt) = γAQ
(lQtct
)γ−1; or
Rt =w
γAQ
(lQtct
)γ−1 . (17)
The equalization of the price of exchange credit to its marginal factor cost divided by its
marginal factor product, in equation (17), is a fundamental part of what is termed "price
theory", or competitive microeconomic theory.
Substituting in for lQtctfrom the production function for exchange credit per unit of
consumption, whereby qt = AQ (lQt)γ
(ct)1−γ , and so
qtct
= AQ
(lQtct
)γ, (18)
implies that
lQtct
=
(qtct
AQ
) 1γ
. (19)
Denoting the marginal cost of exchange credit per unit of consumption by MCq/c, and
combining equations (17) and (19), allows the Baumol condition to be stated in terms of
credit per unit of goods, qt/ct :
Rt =w
γAQ
[(qtct
AQ
) 1γ
]γ−1 =w
γ (AQ)1γ
(qtct
) 1−γγ
≡MCq/c. (20)
Let b ≡ w/(γ (AQ)
1γ
), so that the per unit marginal cost more simply is expressed as
MCq/c = b
(qtct
) 1−γγ
. (21)
12

4 Calibration
The calibration can be done for the US based on averages for the post-1959 period, viewed
generally as a "moderately low inflation" historical period overall, in comparison to inter-
national historic experience including hyperinflation. Consider the standard M1 aggregate,
and why it may not be the best basis for the post-1959 calibration. For the 58 years, from
Jan. 1959 to Jan. 2018, the M1 velocity average is 6.8. However since the advent of money
market fund popularity in the late 1970’s and early 1980’s, which initially avoided Regula-
tion Q interest rate limits, deposits took off in (non-FDIC insured) money market deposit
accounts (MMDA) and remained stagnant in (FDIC insured) deposit accounts. As a re-
sult, the income velocity of M1 does not track well the nominal interest rates such as the 1
year and 10 year US Treasury constant maturity rate, which rose steadily up until around
1980 and fell steadily thereafter. For this reason, Lucas and Nicolini (2015) construct a
new monetary aggregate by adding the MMDA to M1. For this "M1MMDA" aggregate,
they find a stable money demand function with cointegration evidence, in contrast of the no
cointegration findings of Friedman and Kuttner (1992) using standard monetary aggregates.
Now the Federal Reserve has constructed a new aggregate called MZM that adds the
other checking accounts such as MMDA and other similar ones. This is a useful, innovative,
aggregate with an income velocity that rises and falls historically with Treasury interest
rates since 1959; this velocity can be found on the FRED database with the series name
of MZMV. While this aggregate allows small amounts of interest to be paid on deposits
such as MMDA, it offers an aggregate for which a stable money demand, such as that in
the model, can be fitted. Therefore MZM offers one basis for the calibration, albeit its low
velocity implies it will give a conservative estimate of the welfare cost of inflation.
The MZM velocity level averaged 2.2 from 1959 to 2018. Thus for the MZM aggregate,
a 2.2 velocity level is the calibration target. In qualification, velocity in the model is the
consumption velocity c/m, which is the same as the output velocity since y = c in the
model without physical capital. With y/m = c/m = 2.2, then a ≡ mc = 1
2.2 . It results that
qc = 1− m
c = 1− 12.2 = 0.545.
13

An important parameter is the degree of leisure preference. One way to consider this
is to look at the economy’s solution for goods and leisure at the Friedman optimum of
R = 0. Then the equilibrium solutions are c = w1+α and x = α
1+α .With leisure preference of
α = 0.5, then leisure equals 1/3 of free (non-maintenance) time and work is 2/3 of time by
the allocation of time constraint. This is similar to saying that there are five days per week
with eight hours of work per day, for a total of 40 hours a week, while having two weekend
days with eight hours of leisure per day, plus one hour of leisure each of the other five days
a week. This gives 21 hours of leisure and 40 hours of work, for a division between work and
leisure time as implied approximately in the model with α = 0.5 at the Friedman optimum.
An alternative calibration, which provides a more conservative basis for calculating the
welfare cost of inflation, is to value leisure by twice as much, such that α = 1. This gives
leisure time of x = α1+α equal to 0.5. This one-half value for leisure is found within the
typical range used in calibration (eg. Gomme and Ruppert, 2007, with home production of
goods, but not credit services). Even higher values of leisure make inflation even less costly.
We will focus on α = 0.5 as the baseline calibration, with α = 1 as an alternative more
conservative calibration.
Next, consider the Cobb-Douglas coeffi cient of labor time in banking, that is γ. In the
decentralized bank sector optimization problem, as given in Gillman and Kejak (2011), the
parameter γ equals the value of the labor cost divided by the value of the credit output, as
given by γ =wlQRq . Following Benk et al. (2008) reasoning, consider the total cost of credit
to be the cost of an American Express credit card (Amex) per year. As in the model, an
Amex card typically must be paid off at the end of the period to avoid extra fees. But
there is a cost to the card, even though interest is not charged for the credit. This cost is
now $95 for an Amex "Blue Cash Everyday Card"; let the credit cost per person, wlQ, be
approximated by this $95. Then the total cost needs to be divided by Rq to get the implied
γ.
Picking which maturity for the Treasury interest rate corresponds to the nominal bond
interest rate R in the model here is complex. Typically, one might consider one period in
the model as being for example one year and so use the one-year Treasury rate. And during
14
the "normal" yet healthy growth periods of the 1960’s, 1980’s and 1990’s a comparison of
the 10 year and 1 year constant maturity US Treasury interest rates shows that the rates
were mostly very close together. In that case, using either the one-year or the 10 year rate
would be of little consequence.
However, the short term and long term Treasury rates have diverged since 2001. Since
the September 2001 terrorist attacks, when the Fed first started driving the Federal Funds
Rate below the CPI inflation rate for a sustained period, the one year rate has been below
the 10 year rate almost all of the time. Further, the 1 year rate has also been below the
inflation rate for most of the time since 2001, except for the two years starting late 2005.
This has meant negative real interest rates as measured by the one-year rate. In contrast
the 10 year rate has had only brief periods of negative real interest rates, when inflation
accelerated in the mid-1970’s and in 1980, and for brief period during and since the Great
Recession of 2008-2009.
In the model here, a negative real interest rate can only occur with a negative rate of
time preference, that is ρ < 0. But a negative ρ violates boundary conditions on utility,
meaning that ρ is constrained to be positive. Therefore the view taken here is that the
nominal interest rate chosen for the calibration should be consistent with data in which the
corresponding real interest rate was mostly positive. Therefore, the 10 year Treasury rate
is chosen as the nominal interest rate that corresponds best to the R of the model, for the
full data period of 1959 to 2018; this is nearly equivalent to choosing the one year Treasury
rate for the period ending in 2000.8
The average 10-year Treasury bond rate, at an annual rate on a monthly basis, is 6.13
from 1959:1 to 2018:1. The 10 year Treasury rate has mostly positive real interest rates
for the full period, so a 6.13 rate is chosen for the calibration for 1959 to 2018. It turns
out that the calculated welfare cost is only slightly changed if 5.10, the 1959-2018 one-year
Treasury bill rate, were used instead, while in contrast it is quite sensitive to the preference
for leisure.8Explaining how short term interest rates could fall below the inflation rate for the extended period since
the Great Recession is the subject matter of Csabafi et al. (2018), using a related model with shocks toboth goods and banking sectors.
15

Now consider an approach for calibrating the rate of time preference ρ by considering
historical data on the real rate of interest for the Treasury interest rates relative to CPI
inflation rates. Before the Vietnam War spending began ratcheting upwards, the annual
inflation rate, taken by month, averaged 1.4% for the seven years from Jan. 1959 to Jan.
1966. In the 1980’s, the inflation rate fell to 3.8% in December 1982, and then averaged
4.5% for the seven years from December 1982 to December 1989. For the eleven years
from January 1990 to January 2000, the inflation rate averaged 4.3%. During these episodes
of mostly healthy, above trend growth and stable relatively low inflation, the 1-year and
10-year real interest rates were of mostly similar magnitude and ranged from around 2 to
4%. Picking a midpoint, the calibration will assume that ρ = 0.03, giving a 3% real rate of
interest.
Measure the credit q as q = c (1− a) , from the exchange constraint in equation (5).
Given from above that with MZM velocity, 1 − a = 0.545, it remains to find consumption
per capita. This has trended steadily upwards except during the 2008-2009 recession. From
FRED data (series A794RX0Q048SBEA), the average real per-capita consumption in 2009
dollars is $22432 from Jan. 1959 to Jan. 2018. Put this $22432 in current prices by factoring
it by the change in the CPI from May 2009 to March 2018, so as to give an additional factor
of 250213 for $22432. Then the calibration of γ is that γ =wlQ
Rc(1−a) = 95
(0.0613)[(22432) 250213 ](0.545)=
0.11 , within the range of (0.11, 0.21) calibrated in Benk et al. (2005a,b, 2008, 2010).
Now use equations (20) and (21), such that R = b(qtct
) 1−γγ
, with qtct
= 0.545 and b ≡w
γ(AQ)1γ. Then we have that R = 0.061 = b (0.545)
1−0.110.11 = b (0.0074) , so that b = 0.061
0.0074 =
8.24. Since b is comprised of the factors w
γ(AQ)1γ
= w(0.11)(AQ)
1/0.11 , then 8. 24 = w(0.11)(AQ)
1/0.11 .
With a normalization of w = 1, then AQ =(
18. 24(0.11)
)0.11= 1.01. So in sum, the baseline
calibration assumes that w = 1, AQ = 1.01, γ = 0.11, and R = 0.061, such that the targeted
MZM velocity of 2.2 is achieved; in addition α = 0.5. As a percent of GDP, the estimates
of the welfare cost of inflation as a share of full income (1 ·w) resulting from the calibrations
here will in turn rise by a factor of 1.5, since y = c ' 0.67 in the model with α = 0.5.
As a second alternative calibration (in addition to setting α = 1 instead of α = 0.5),
consider using the historical average of M1 velocity instead of MZM velocity. From Jan.
16

1959 to Jan. 2018, M1 velocity averaged 6.8; with c/m = 6.8, then qc = 1 − a = 1 − 1
6.8 =
0.85. Calibrating γ then implies that γ =wlQ
Rc(1−a) = 95
(0.061)((22432) 250213 )(0.85)' 0.07. Then
R = b(qtct
) 1−γγ
, with qtct
= 0.85 and b ≡ w
γ(AQ)1γ. Then we have that R = 0.061 =
b (0.85)1−0.070.07 = b (0.115) , so that b = 0.061
0.115 = 0.53. Since b is comprised of the factors
w
γ(AQ)1γ
= w(0.11)(AQ)
1/0.11 , then 0.53 = w(0.07)(AQ)
1/0.07 . With a normalization of w = 1, then
AQ =(
10.53(0.07)
)0.07= 1. 26. The calibration when enforcing the equilibrium condition of
equation (20) ends up lowering the labor share parameter γ and raising the bank productivity
parameter AQ. This use of M1 instead of MZM results in a lower welfare cost of inflation,
despite there being a higher velocity, as will shown below.
5 Credit Supply and Money Demand
Its useful to visualize the equilibria at the basis of the above calibrations. Figure 1 graphs
equation (21). With b = w
γ(AQ)1γ
= 8. 24, R = 0.061, and q/c = 0.545, the graphs shows that
the marginal cost per unit of consumption, denoted by MCq/c, has a unique equilibrium
division between credit and money, at q/c = 0.545, with velocity of 2.2, where R = MCq/c.
Using MZM for the baseline calibration, this marginal cost is denoted by MC (MZM).
Alternatively shown is the marginal cost using M1 in the calibration, denoted by MC (M1).9
Taking the same Baumol condition but now writing in terms of mc = 1 − qc , then the
output normalized money demand function m/c is given implicitly in equilibrium by R =
b [1− (m/c)](1−γ)/γ
, whereby m/c = 1−(Rb
)γ/(1−γ), or
a ≡ m
c= 1−
(Rγ
w
) γ1−γ
(AQ)1
1−γ . (22)
Money demand falls with the interest rate R, rises with labor productivity w and falls
with bank productivity AQ. Figure 2 graphs the inverse money demand equation, R =
wγ
((1− mt
ct
)/(AQ)
11−γ)(1−γ)/γ
for this calibration when R = 0.061, m/c = 1/ (2.2) =
0.455 and velocity is 2.2. The baseline using MZM is indicated in the graph by m/c (MZM),
9Note that this graph, which is normalized by c, is the same for any value of leisure preference α.
17

0.0 0.2 0.4 0.6 0.8 1.00.00
0.05
0.10
0.15
0.20
0.25
q/c
MC, R
RMC (MZM) MC (M1)
Figure 1: Marginal Cost of Exchange Credit per unit (MC) Equals the Marginal Cost ofMoney per unit (R).
0.0 0.1 0.2 0.3 0.4 0.5 0.6 0.7 0.8 0.9 1.00.00
0.05
0.10
0.15
0.20
0.25
m/c
R
R
m/c (MZM)
m/c (M1)
Figure 2: Banking Time Money Demand Function.
while the alternative using M1 in the calibration is indicated by m/c (M1).
The interest elasticity of normalized money mtct, denoted by η
mc
R = − 1−atat
γ1−γ . This
means as the interest rate goes up, the interest elasticity becomes increasingly negative as
in a Cagan money demand. In fact, the elasticity has a simple proportionality to q/m, the
credit to cash ratio that rises with the nominal interest rate R :
− γ
1− γ1− atat
= − γ
1− γq
m. (23)
With the calibration, the elasticity is rather low at −0.111−0.110.5450.455 = −0.15. Other estimates
18

are used, such as the classic Baumol (1952) estimate of −0.5 in Lucas (2000). Note however
that this elasticity is not constant as in Baumol, but instead rises with the inflation rate
in a way similar to Cagan (1956). For Cagan, the interest elasticity is −Rb, with b the
"semi-interest elasticity", so that the elasticity rises linearly in magnitude with R.
In the banking time money demand, this elasticity is − γ1−γ
qm = γ
1−γ(Rγw )
γ1−γ (AQ)
11−γ
1−(Rγw )γ
1−γ (AQ)1
1−γ.
Rewrite this using constants b1 and b2, such that the elasticity is −b1(Rγw )
b1 (AQ)b1/γ
1−(Rγw )b1 (AQ)
b1/γ=
−b1 b2(R)b1
1−b2(R)b1, where b1 ≡ γ
1−γ , and b2 ≡(γw
)b1(AQ)
b1/γ . Figure 3 graphs the elasticity
magnitude. It shows how it rises from zero at the Friedman optimum of R = 0, at a varying
rate, as R rises (solid curve). In comparison, a Cagan (1956) type elasticity magnitude
that is linearly rising with R is graphed in the dashed line; here the slope is denoted by b,
which equals 2, less than for example the 7 value used in Cagan for certain hyperinflation
examples. The elasticity using the alternative calibration with M1 is also graphed, in Blue;
here the dashed line corresponding to a linearly rising Cagan elasticity has a slope of b = 8.
The interest elasticity of m/c is important to the welfare cost in that it determines the
nature of the deadweight-loss "triangles" under the marginal cost curve in Figure (1) and
under the money demand curve in Figure (2). However the welfare cost can be derived in
general equilibrium without integrating under the money demand curve.
6 Welfare Cost of Inflation
The welfare cost of inflation can be calculated using the compensating amount of goods z
that is required to make the consumer equally well off when facing a positive inflation tax,
versus having zero such assets and a zero inflation tax, when R = 0. This gives again the
indirect utility equation
v (R, z) = v (0, 0) , (24)
where the indirect utility v denotes the agent’s utility with the equilibrium goods and leisure
substituted in. Given that there is no growth, the solution along the stationary state, with
19

0.00 0.02 0.04 0.06 0.08 0.10 0.12 0.14 0.160.0
0.2
0.4
0.6
0.8
1.0
1.2
R
Elasticity
Figure 3: Interest Elasticity of Banking Time Money Demand (solid) versus Cagan (dashed).
time subscripts dropped, is
c = w
(1− lQ −
αc [1 + aR+ (1− a) γR]
w
)+ z. (25)
The solution to lQ comes from the bank production function, given that the equilibrium q/c
and m/c have been solved, with 1 = qc + m
c . In particular, with q/c =(Rγw
) γ1−γ
(AQ)1
1−γ ,
and from the production in equation (18) in which qtct
= AQ
(lQtct
)γ, setting these equal
provides the solution lQ/c :
(Rγ
w
) γ1−γ
(AQ)1
1−γ = AQ
(lQc
)γ;
lQc
=
(RγAQw
) 11−γ
. (26)
With this solution and given the solution for a ≡ m/c in equation (22), write lQ as
c(RγAQw
) 11−γ
and substitute this into equation (25) so that the closed-form solution for
c can be derived in terms of R (which equals (1 + ρ) (1 + σ) − 1), with ρ and σ assumed
20

parameters):
c =(1 + z/w)w
1 + w (RγAQ/w)1
1−γ + α
[1 +
(1−
(Rγw
) γ1−γ
(AQ)1
1−γ
)R+
((Rγw
) γ1−γ
(AQ)1
1−γ
)γR
] .(27)
The solution for leisure follows directly from the intratemporal margin, whereby xt =
αc[1+aR+(1−a)γR]w . Using the solution for c from equation (27),
x =α [1 + aR+ (1− a) γR] (1 + z/w)
1 + w (RγAQ/w)1
1−γ + α
[1 +
(1−
(Rγw
) γ1−γ
(AQ)1
1−γ
)R+
((Rγw
) γ1−γ
(AQ)1
1−γ
)γR
](28)
The welfare cost of inflation then follows from v (R, z) = v (0, 0) such that
ln(1 + z/w)w
1 + w (RγAQ/w)1
1−γ + α
[1 +
(1−
(Rγw
) γ1−γ
(AQ)1
1−γ
)R+
(Rγw
) γ1−γ
(AQ)1
1−γ γR
]
+α ln
α
[1 +
(1−
(Rtγw
) γ1−γ
(AQ)1
1−γ
)R+
(Rγw
) γ1−γ
(AQ)1
1−γ γR
](1 + a/w)
1 + w (RγAQ/w)1
1−γ + α
[1 +
(1−
(Rγw
) γ1−γ
(AQ)1
1−γ
)R+
(Rγw
) γ1−γ
(AQ)1
1−γ γR
]= ln
w
1 + α+ α ln
α
1 + α. (29)
The solution is that
z/w (30)
=
1 + w (RγAQ/w)1
1−γ + α
[1 +
(1−
(Rγw
) γ1−γ
(AQ)1
1−γ
)R+
((Rγw
) γ1−γ
(AQ)1
1−γ
)γR
](1 + α)
[1 +
(1−
(Rγw
) γ1−γ
(AQ)1
1−γ
)R+
((Rγw
) γ1−γ
(AQ)1
1−γ
)γR
]α/(1+α) − 1
21

0.0 0.1 0.2 0.3 0.4 0.50.00
0.01
0.02
0.03
0.04
0.05
R
WCI
Figure 4: Welfare Cost of Inflation: MZM Baseline Calibration (Solid); Alternative 1: MZMα = 1 (Dashed); Alternative 2: M1 (Dotted).
For the baseline calibration, γ = 0.11, α = 0.5, w = 1, and AQ = 1.01. Putting in these
values, then the cost for any R gives the function zw (R) .10 Figure 4 graphs the welfare cost
function showing for example how R = 0.133 (when π = 0.10) gives a cost of 1.48% of full
income. Normalizing the welfare cost by consumption basically factors the cost by 1.5 since
at R = 0, c = w/ (1 + α) = 0.67, and it falls some as R rises; so with this normalization the
cost would be about (1.48) 1.5 = 2.2, or about 2.22% of output for R = 0.133.
To compute the cost of a 10% inflation rate versus a zero inflation rate, similar to the
most common calculation of welfare cost found in the literature (eg. Bailey, 1956, Silva,
2012) consider that 1 + R = (1 + π) (1 + ρ) . With ρ = 0.03 and π = 0.10, then R = 0.133
gives a cost of 1.5% as a share of full income. But at π = 0, R = ρ, and so the welfare
cost of zw (R) = z
w (0.03) must be subtracted from the cost zw (0.133) to compute the cost
of 10% inflation instead of zero. Therefore the cost of a 10% inflation rate instead of a zero10 zw(R) + 1 =
1+1((R)(0.11)(1.01)/1)1
1−0.11 +1
(1+
(1−((R)(0.11)
1
) (0.11)1−(0.11) (1.01)
11−(0.11)
)(R)+
(((R)(0.11)
1
) (0.11)1−(0.11) (1.01)
11−(0.11)
)(0.11)(R)
)
(1+1)
(1+
(1−((R)(0.11)
1
) (0.11)1−(0.11) (1.01)
11−(0.11)
)(R)+
(((R)(0.11)
1
) (0.11)1−(0.11) (1.01)
11−(0.11)
)(0.11)(R)
)0.5/(1+0.5)
22

rate is zw (0.133) − z
w (0.03) = 0.0148 − 0.0036 = 0.011, or 1.1% of full income. Again, put
in terms of the cost as a share of output, instead of as a share of full income (w), this rises
to about (1.1) 1.5 = 1.65, or about 1.65%. These cost estimates are well within the range of
the literature; see Silva (2012) and Adao and Silva (2018).
Now consider the alternative calibration with leisure preference doubled from α = 0.5
to α = 1. Then the cost estimate for R = 0.133 is 0.47% of full income, about half the level
when α = 0.5. This is shown in Figure 4 by the dashed line.11 For the cost of a 10% inflation
rate instead of a zero rate, the cost is now zw (0.133)− z
w (0.03) = 0.0047− 0.0009 = 0.0038,
or 0.38% of full income. With c ' 0.5, the cost is about (2) 0.38 = 0.76, or 0.76% as a
share of output. With a higher preference for leisure, the cost of avoiding inflation is lower.
This results since leisure use gives greater utility and is a way to avoid the inflation tax,
along with credit use. Credit use itself, per unit of consumption, does not change, and the
money demand function as drawn for m/c in Figure 2 above is also unchanged. Total time
in credit, lQ = c(RγAQw
) 11−γ
, does fall as consumption falls when leisure preference rises.
The other alternative calibration is to use M1 instead of MZM. This gives a different
calibration and welfare cost. Using the baseline values of α = 0.5, w = 1, the changes are
that γ = 0.07 and AQ = 1.26. Figure 4 shows this case with the dotted line; it is generally
placed inbetween the baseline case in the solid line and the alternative with α = 1 in the
dashed line. Here c = 11+α = 0.65 at R = 0. The welfare cost of R = 0.133 is 0.70% of full
income, in this third case. As a fraction of output, the 0.70 rises to 0.7 (1.5) = 1.05, or about
1.05% since c ' 0.67. To find the cost of a 10% inflation rate instead of a zero inflation rate,
zw (0.133)− z
w (0.03) = 0.0070− 0.0019 = 0.0051, or 0.51% of full income, and about 0.76%
as a fraction of output. This 0.76% is the same magnitude as with the alternative MZM
calibration with α = 1.
11 (z/w) =1+1((0.133)(0.11)(1.01)/1)
11−0.11 +1(1+0.40(0.133)+0.60(0.11)(0.133))
(1+1)(1+0.40(0.133)+0.60(0.11)(0.133))1/(1+1)− 1 :
23

7 Low Inflation Regime Welfare Cost
While low inflation rates can be negative, a positive 2% inflation rate is both a low inflation
rate and a level that is ubiquitous in the lexicon of inflation rate targeting policies both in
the US and around the world. At the same time, ever since Friedman’s (1969) optimum of a
negative rate of inflation as the optimum, there has been a conflict between the theoretical
optimum rate of inflation and the policy practice, in that policy seems to avert systemically
a negative rate of inflation. A zero rate of inflation however is often mentioned as a feasible
inflation rate target, such as in US law, while the 2% target has morphed into the accepted
rate of inflation to target by central banks.
There are many theoretical reasons given for targeting a rate of inflation above the
Friedman (1969) optimum, for example with foci on the nature of Laspeyres (CPI) and
Paache (GDP deflator) indices and the so-called substitution bias. This latter distinction
on how the indices are calculated has been made mostly innocuous by the development of
chained indices that mostly eliminate the Laspeyres tendency to overstate the inflation rate.
The quality measurement problem is a long standing one also used to suggest that a higher
inflation rate target than otherwise is warranted because the goods being indexed are of
a higher quality and naturally worth more. There are also monopoly power justifications
given for aiming for a positive inflation rate target.
Putting aside the various justifications for above-zero inflation rate targets, let’s simply
consider the cost of following a central bank target of 2% versus US law’s statement of a zero
inflation rate, as calculated within this economy with banking time. To apply the model
here, a 2% inflation rate corresponds to an R of R = (1 + 0.02) (1 + 0.03) − 1 = 0.051.
With the baseline calibration, from equation (30) above, calculate zw (0.051) − z
w (0.03) as
0.006 − 0.0036 = 0.0024, or 0.24% of full income. As a percent of output, this becomes
about 0.24 (1.5) = 0.36 of one percent.
Using the more conservative alternative calibration with α = 1, this becomes zw (0.051)−
zw (0.03) = 0.0011−0.0009 = 0.0002, or 0.02% of full income. As a percent of output, c = 0.5
at R = 0 in this case, so the cost is about 0.04% of output.
24
Lastly, using the calibration with α = 0.5 but using the aggregate M1, the welfare cost
is zw (0.051)− z
w (0.03) = 0.003− 0.0019 = 0.0011, or 0.11 of one percent of full income. As
a percent of output, this is approximately (0.11) 1.5 = 0.165, or 0.165% of output.
To summarize, in the baseline, for a two percent inflation rate instead of a zero inflation
rate, the welfare cost of this inflation is 0.36% of output. With a $20 trillion US economy,
this welfare cost is $20 (0.0036) = $0.072 trillion, or about $72 billion a year. With the
most conservative of the alternative calibrations (MZM with α = 1) it is $20 (0.0004) =
$0.008 trillion, or $8 billion a year. The second alternative calibration, using M1, gives a
cost inbetween the other two at $20 (0.00165) = $0.033 trillion, or $33 billion a year.
This gives a range of estimates from in billions of dollars from 8 to 33 to 72 per year
due to hitting a target inflation rate of 2% instead of one of zero as specified in the 1978
Act. As of May 2018, inflation is 3%, so the welfare cost currently is actually even higher
as compared to a zero inflation rate.
8 Comparison to Models without Credit and/or Leisure
Compare the welfare cost of inflation in the baseline model with credit and leisure to models
in which there is either no credit, no leisure, or neither credit or leisure. First consider a
cash-only economy, with leisure, but without credit available. In this case m/c = 1, q/c = 0,
lQ = 0, and from equation (30), z/w = 1+α(1+R)
(1+α)(1+R)α/(1+α)− 1. For α = 0.5 and R = 0.133,
the cash only welfare cost is 1+0.5(1+0.133)
(1+0.5)(1+0.133)0.5/(1+0.5)− 1 = 0.0018, or 0.18% of full income.
As a share of output, since c ' 0.67, then the welfare cost is (0.18) 1.5%, or about 0.27%.
For a 10% inflation rate instead of zero, the estimate in this case is 0.18 minus the cost of
R = 0.03, which is 1+0.5(1+0.03)
(1+0.5)(1+0.03)0.5/(1+0.5)− 1 = 0.097. This gives a cost of 0.08% of full
income, or (0.08) 1.5, 0.12% of output.
For R = 0.133, this 0.18% is eight-fold smaller than the higher welfare cost of 1.48%
when credit is available through banking, in the baseline economy above. This lower welfare
cost without credit available is due to there being only goods to leisure substitution available
to avoid the inflation tax in the cash only case. With cash only, the interest elasticity is zero,
25

making money always inelastically demanded, and causing a relatively low welfare cost of
inflation. The higher interest elasticity and welfare cost with credit stems from the ability
to substitute from cash to credit, while also using the goods to leisure substitution margin.
Now consider the case with no leisure. To do this, simply assume leisure is not valued,
as in Lucas’s (2000) shopping time model. What would be the welfare cost of inflation in
this case, with banking time use instead of shopping time? Setting α = 0 in the welfare cost
function of equation (30) above results in
z/w = w (RγAQ/w)1
1−γ = wlQc, (31)
which by equation (26) is also the value of the banking time per unit of consumption, w lQc .
The calculation of welfare cost with the same calibration andR = 0.133 is w (RγAQ/w)1
1−γ =
1((0.133)(0.11)(1.01)
1
) 11−(0.11)
= 0.0088, or 0.88% of full income. As a share of output, since
consumption is nearly 1 in this case, it is the same 0.88% as a share of output. In terms of a
10% inflation rate instead of 0, the cost in this case is 0.87767−1((0.03)(0.11)(1.01)
1
) 11−(0.11)
=
0.876 02, which is the same 0.88% when rounded off. This welfare cost estimate is higher
than when there is no credit, but leisure is valued at α = 0.5, as above, when the cost is
0.18% of full income.
With R = 0.133, the cost from only banking time to avoid inflation of 0.88% compares
to 1.48% when there is also leisure preference, and to 0.18% when there is leisure but not
banking. This means that with only leisure to avoid inflation, the welfare cost is the lowest,
since leisure is not a great substitute for goods, and this makes money demand relatively
interest inelastic. When in contrast only credit is available but not leisure, the welfare cost
is higher since credit use alone to avoid inflation is a better substitute than leisure use
alone. The interest elasticity of money demand is higher in magnitude with credit use alone
than with leisure use alone. With both credit and leisure use to avoid inflation the interest
elasticity is higher.
To see this in terms of elasticities, the magnitude of the interest elasticity of m/c is
26

ηmc
R = − γ1−γ
qm = − γ
1−γ(Rγw )
γ1−γ (AQ)
11−γ
1−(Rγw )γ
1−γ (AQ)1
1−γ, which equals 0.185 for the baseline calibration
with R = 0.33; this can be seen in Figure (21). When credit q equals zero, this interest
elasticity of m/c equals zero. Then the only elasticity of money with respect to the interest
rate, denoted by ηmR , when m = c always, is the same as the interest elasticity of c; ηmR = ηcR.
By equation (27), with q = 0, then c = w1+α(1+R) and the elasticity with respect to R is
ηRc = αR1+α(1+R) = cαR
w . In the case of no credit, and with R = 0.133 and α = 0.5, then
ηmR = αR1+α(1+R) = (0.5)0.133
1+(0.5)(1+0.133) = 0.042. This is a low elasticity, being almost zero.
The interest elasticity magnitudes, given the baseline calibration, triples with credit only
as a substitute to money use, but no leisure, as compared to the case of leisure only and no
credit. With credit only, the elasticity of m with respect to R is the elasticity of mc with
respect to R plus the elasticity of c with respect to R; ηmR = ηmc
R + ηcR. With no leisure, c is
now give from equation (27) as c = w
1+w(RγAQ/w)1
1−γ, and the interest elasticity of this c is
ηcR = − 1
1− γ (c−m)
(Rγ
w
)= − γ
1− γ
cc −
mc
mc
(Rm
w
)= ηmR
(Rm
w
),
such that the interest elasticity is
ηmR = ηmc
R + ηcR = ηmc
R
[1 +
Rm
w
].
With the baseline calibration, at R = 0.133, this elasticity magnitude is 0.195.12 The higher
interest elasticity with only credit, but no leisure, corresponds to the higher welfare cost of
inflation for this case, as compared to when there is positive leisure, but no credit use; these
are 0.88% versus 0.18% respectively for R = 0.133.
The interest elasticity for the full model with both credit and leisure can be calculated
from equation (27) as
ηmR = ηmc
R + ηcR = − γ
1− γ1− aa−
αaR[1− η
mc
R
(1− γ + 1
α
)]1 + w (RγAQ/w)
11−γ + α [1 + aR+ (1− a) γR]
.
12− 0.111−0.11
( 0.111 )0.11
1−0.11 (0.133)0.11
1−0.11 (1.01)1
1−0.11
1−( 0.111 )0.11
1−0.11 (0.133)0.11
1−0.11 (1.01)1
1−0.11
(1 + (0.133)
(1−
((0.133)(0.11)
1
) (0.11)1−(0.11)
(1.01)1
1−(0.11)
))
27

With the baseline calibration, and R = 0.133, this elasticity magnitude is equal to 0.212,
and it corresponds to the higher welfare cost of 1.48%.13
Note that a banking time cost, or a related shopping time cost as in Lucas (2000),
without leisure value but with time, can be viewed an underestimate of welfare cost relative
to when leisure is valued. Without leisure value, the welfare cost z/w in equation (31) is
analytically equal to w lQc , by equation (26). Calculating this directly, w
lQc = (0.0088), as
found above, while lQ = c (0.0088) = 0.646 (0.0088) = 0.0057. In the related Lucas example,
the welfare cost is exactly the shopping time, which Lucas denotes by s(r). In his equation
5.7, he defines this welfare cost and comments that
"In this model, the time spent economizing on cash use, s(r), has the dimensions
of a percentage reduction in production and consumption, and hence is itself a
direct measure of the welfare cost of inflation, interpreted as wasted time."
The welfare cost comparison between the banking time and shopping time models is
a valid one in that the banking time model can be restated exactly as a shopping time
function in formal terms. To see this, recall that banking time is lQ, withlQc =
( qc
AQ
) 1γ
.
Substituting in 1− mc for
qc gives that lQ = c
(1−mcAQ
) 1γ
. This is an exact special case of the
so called shopping time model in that the function c(1−mcAQ
) 1γ
has the same characteristics
as the shopping time general specification. In particular, ∂lQ∂c = lQ
(1 + 1
γ
mc
1−mc
)> 0, and
∂lQ∂m =
−lQ1−mc
< 0, just as is the case for the general shopping time specification of s = g (c,m)
in which gc > 0 and gm < 0, with s the shopping time used to avoid the inflation tax.
With no leisure and only banking time, now c = 1
1+1(0.133(0.11)1.01/1)1
1−0.11= 0.99 and
total banking time also rises to (0.99) (0.0088) = 0.0087, while labor is 1 − 0.0087 = 0.99.
Results imply more banking is done, since leisure cannot be used to substitute away from
the inflation tax on goods consumption. Banking becomes the only means of tax avoidance.
With leisure and no banking, c = 0.638. With leisure and banking, c rises a bit to 0.646.14
13 0.111−0.11
0.600.40
+
0.40(0.5)(0.133)
1+ 0.111−0.11
( 0.111 )0.11
1−0.11 (0.133)0.11
1−0.11 (1.01)1
1−0.11
1−( 0.111 )0.11
1−0.11 (0.133)0.11
1−0.11 (1.01)1
1−0.11(1−0.11+ 1
0.5 )
1+1(0.133(0.11)1.01/1)
11−0.11 +(0.5)(1+0.40(0.133))+0.11(0.133)0.60(1+0.5)
14 c = 1
1+1(0.133(0.11)1.01/1)1
1−0.11 +(0.5)(1+0.40(0.133))+0.11(0.133)0.60(1+0.5)
28

9 Discussion
On the magnitude of the welfare cost of inflation, when banking is allowed or not allowed,
a closely related work is Silva (2012). As in this paper and Aiyagari et al. (1998), Silva also
finds that banking expands with the rate of inflation. Silva uses a Jovanovic (1982) type
Baumol (1952) -Tobin (1956) approach whereby the timing of the withdrawals of money
from the bank is modeled so as to create an endogenous velocity. This allows for a cost
of banking to enter the money demand and the welfare cost calculation. Silva’s approach
is related to the use of the bank production function here as in the so-called "financial
intermediation approach to banking" (Degryse et al., 2009). Silva finds a robust estimate
for a 10% inflation instead of zero of about 0.95% (no leisure in utility) to 1.33% (with leisure
in utility) as a share of output, with the banking and endogenous velocity. This compares
fairly closely to this paper’s baseline estimate of 1.65% for a like amount of inflation with
banking and leisure.
Alternatively, without banking, but with leisure, this paper finds a 0.12% estimate for a
10% inflation instead of zero. This compares for example to Silva’s (2012) 0.36% estimate
where banking is not endogenous, but there is leisure in utility; Silva also uses log utility
as in this paper and has a calibration for leisure preference which is higher than in this
paper. See Silva and Adao and Silva (2018) for a review of other estimates in the literature;
for example Cooley and Hansen (1989) also have a comparatively low welfare cost estimate
with a cash-only economy, as in this paper. For another use of banking intermediation
costs to estimate welfare measures, in this case a Leontieff banking production function for
intertemporal loans, see Antunes et al. (2013).
Lucas (2000) and Silva (2012) define the welfare cost as the compensation to equilibrium
consumption necessary to keep the consumer utility the same when facing a certain high
inflation relative to facing either the optimum (of R = 0 in Lucas) or a lower inflation rate
such as zero (in Silva), but without any consumption compensation. This paper differs
slightly by defining the welfare cost by the amount of goods that need to be transferred
to the consumer to make the consumer indifferent between some high inflation rate versus
29

having no such transfer and facing the Friedman optimum of R = 0. This compensating
income transfer is not to the optimum consumption bundle, but rather to the budget of the
consumer, through equation (24), as in Gillman (1993; equation 16).
The welfare cost of inflation in this paper is the deadweight loss from raising money
through the inflation tax for government expenditure, with the inflation tax proceeds re-
turned as lump sum income. Therefore the welfare loss is only from the distortions of
induced substitution from goods towards leisure, plus the cost of banking under the mar-
ginal cost curve in Figure 1, up to the equilibrium q/c. This cost of banking is also measured
by the area under the money demand m/c in Figure 2 up to the equilibrium quantity of
money per unit of consumption, m/c. Others such as Adao and Silva (2018) and Cooley
and Hansen (1991) consider broader financing possibilities including both the inflation tax
and other forms of direct taxation such as on labor.
The equalization of the marginal cost of money to its marginal benefit, as in equation
(20), is the equilibrium condition found in monetary economies that leads directly to the
model’s underlying demand for money function. Lucas (2000) carefully qualifies this equi-
librium condition as what we can call a money demand function, within a representative
consumer framework with competitive price-taking consumers and firms. This equilibrium
condition can be found since Samuelson’s (1947) static money-in-the-utility function (MIUF)
economy, for example with utility being specified as u (m, c) , and carried on in current dy-
namic MIUF economies. The MIUF equilibrium condition is that the marginal rate of
substitution between money and goods equals the nominal interest rate: (um/uc) = R.
Given the utility function, the money demand results.
Exchange economies such as Lucas (1980) bring the margin into play through the ratio of
the shadow value of the exchange constraint to the shadow value of the budget constraint,
whereby again it results albeit implicitly using envelop conditions that the ratio of the
marginal utility of money to that of goods equals the nominal interest rate. However such
cash-in-advance exchange economies without credit typically have a velocity set at one,
making them not well-poised to estimate the welfare cost of inflation. In shopping time
models, velocity is made endogenous, through the equilibrium condition given by R =
30

−wgm, using the g (c,m) for the shopping time function as above. The marginal cost of
money equals the marginal benefit of reducing the value of time needed for shopping by
using one more unit of money; the money demand then results once g is specified in terms
of c and m.
King and Plosser (1984) instead posed the question of how to include exchange credit
through banking production in a general equilibrium representative agent model of the real
business cycle variant that also includes money. They conclude that using labor and capital
in the production function of banking gives a constant marginal cost of credit. In turn this
constant marginal credit cost could have no unique equilibrium with a constant marginal
cost of money, this being the nominal interest rate.15 At the same time, in the banking
microeconomic literature, Clark (1984) argues that the bank production function needs to
include not just labor and capital but also deposited funds, all in a Cobb-Douglas form.
Hancock (1985) successfully validates this form through estimation of the bank production
function. This production form with deposits included has been used since empirically since
in the banking literature, such as in Berger and Humphries (1997), Wheelock and Wilson
(2012), and as reviewed in Degryse et al. (2009).
The advantage of using the Clark (1984) form in general equilibrium, as in Gillman and
Kejak (2011), is that the units get corrected in this way so as to allow a unique equilibrium
of credit and money. In particular, the marginal cost of credit, per unit of deposits, equals
the marginal cost of money, per unit of goods. With deposits equal to goods in equilibrium
in these models, the unit is a good. On a per unit of goods basis, the marginal cost of credit
endogenously is upwards sloping and so provides a unique equilibrium for a given interest
rate. This in turn gives the money demand as a residual of the credit demand, with the sum
of money and credit purchases equaling total goods consumed and produced per period (in
a model without capital).
In contrast, to get around the necessity of having an upward sloping marginal cost of
banking, for example, Berk and Green (2004) study mutual funds with the assumption of
a convex cost function such that there is an upward sloping marginal cost of the mutual
15See Aiyagari et al. (1998) and Li (2000) where this issue is resolved by either assuming a money demandor assuming dropping the Cobb-Douglas form by assuming diminishing returns in labor, with no capital.
31

funds. This enables a unique equilibrium of how much mutual funds to produce with the
given interest rate. Others take a similar approach of assuming a convex cost of credit
function.
Lucas and Stokey (1983, 1987) model money and exchange credit in their cash-good,
credit-good extension of the Lucas (1980) cash-in-advance economy. This includes no real
resource of credit use, in the sense that King and Plosser (1984) discuss, and as in this
paper, and in Silva (2012), Adao and Silva (2018) and Antunes et al. (2013). The credit
good there has a shadow price of one, while the cash good has a shadow price of 1 + R, as
in the original Lucas (1980) CIA model. Each the cash and credit goods separately enter
the utility function, so some of the cash good is bought according to preferences. There is
no real resource use of credit and Hodrick et al. (1991) find this model inconsistent with
certain velocity evidence; see Silva (2012) for a related discussion on endogenous velocity
approaches in the literature.
Lucas (2000) instead turns to each a Sidrauski (1967a,b) money in the utility function
model (MIUF) and a McCallum and Goodfriend (1987) shopping time model to estimate
welfare cost, with the latter explicitly involving real resource cost in evading the inflation
tax. There Lucas also showed elegantly how to backwards engineer the money demand
function using a general specification of MIUF model, while allowing either the Cagan or
Baumol-Tobin form in his shopping time model.
The banking time approach here produces an endogenous money demand from the other
end without predetermination of money demand. Rather than assuming a utility function
or transaction cost function specifically designed to yield the desired money demand, the
bank approach lets the form of the bank production function determine the form of the
money demand. This is advantageous in giving estimates of welfare cost because the degree
of free parameters gets restricted by the bank production function and information on the
parameters of that function. While the calibration of the cost of banking in this paper
is rudimentary, other innovative approaches are possible that estimate banking costs in
different ways, such as using national income accounts and detailed bank industry data.
32

10 Policy Implications
Policy implications are tangible in the following sense, related to Adao and Silva (2018).
With a 2% inflation rate instead of 0, the amount of money being generated through money
printing to pay for US federal expenditure can be calculated. The real value of the inflation
tax at each year t equals Mt+1−Mt
Pt. As a percent of GDP, this money supply increase can be
expressed as Mt+1−Mt
Ptyt. In turn this pays for some percent of federal government expenditure,
as a percent of GDP, call it φ, so that Mt+1−Mt
Ptyt= φ.With a constant money supply growth
rate of σ, then φ = σMt
Ptyt, and in terms of velocity, with V ≡ y/m, then φ = σ
V .
The inflation tax revenue as a share of output Mt+1−Mt
Ptytrewrites in terms of the inflation
rate by expressing it as φ =
Mt+1Pt+1
Pt+1Pt−MtPt
yt=
mt+1Pt+1Pt−mt
yt. With the inflation rate of
πt+1 = Pt+1Pt− 1, and a stable velocity V over time, and the growth rate of real output
as being denoted by gyt+1 ≡ yt+1yt− 1, then φ = mt+1
yt+1(1 + gyt+1) (1 + πt+1) − mt
yt. With a
stable V and gy over time, φ = 1V [(1 + gy) (1 + π)− 1] . Extending the analysis to allow a
positive growth rate in the economy, the inflation rate to achieve a share φ is π =ηV−gy1+gy
,
while the money supply growth rate is σ = φV. Thus π =σ−gy1+gy
. With a 2% inflation
rate, and say a 2% growth rate in output, then the money supply growth rate would be
(1.02) (0.02) + 0.02 = 0.0404, about 4%. This is similar to Friedman’s (1960) money supply
rule.
The amount of government spending as a share of output, φ, financed with this 4%
money supply growth is σ/V. Consider the velocity of the monetary aggregate that may
best correspond to the inflation tax. As of May 2018, the US monetary base and M1 were
both the same at $3.7 trillion, which is (3.7) /20 = 0.185, or 18.5% of the $20 trillion US
output. In current velocity terms, this is a 20/3.7 = 5. 41 velocity. Letting V = 5.41,
then the share of output financed, φ, by the 2% inflation is 0.04/5.41 = 0.0074, or 0.74%.
This is equal to $20 (0.0074) = $0.148 trillion, or $148 billion a year. Total US Federal
government expenditure is $4.5 trillion for 2018:Q1. So under the assumptions made, the
2% inflation rate instead of zero currently yields 1484479 = 0.033, or 3.3% of federal government
expenditure. Were velocity higher, then the percent of revenue from inflation finance would
33

be less, a point emphasized in Adao and Silva (2018).
The middle range welfare cost calculation found above implies, using the M1 aggregate,
that some $33 billion is a deadweight loss on route to raising $148 billion in additional
spending for the government, or about a 20% economic loss rate. Consider also how the
Fed has used the inflation tax revenue which it is supposed to return to the US Treasury
(as the Fed’s "profit"). From September 2009 to May 2018, excess reserves held at the
Fed have averaged on a monthly basis $1.763 trillion. Over the same period the monthly
average Interest On Excess Reserves (IOER) rate was 0.45%. Using these averages, a simple
estimate is that the Fed directly paid banks $ (1.763) 0.45 = $0.793 trillion, or $793 billion
since 2009. This means that rather than returning all of the inflation tax revenue to the
Treasury, an amount equal to some 5 years of the inflation tax revenue from a 2% inflation
rate as calculated above, at $148 billion a year, was instead used to subsidize the bank
sector, in violation of previous Fed policy (before 2008) not to influence unduly any one
sector of the economy. Or put differently, with somewhat less that about $33 billion welfare
cost per year, for the period from November 2009 to May 2018 when the CPI inflation rate
averaged 1.7% on a monthly basis, almost ten years since the Great Recession implies a
cumulative loss nearing some $330 billion, close to half of the amount that the Fed paid
directly to banks.
The 2018 Fed operating budget is reported by the Fed to be $4.45 billion. If the Fed
2% inflation target instead of zero is causing a welfare loss of some $33 billion, then the
total economic cost of the current Fed policy including all of their operating cost is about
$37 billion. With a zero inflation target, the $33 billion would be saved. A simple way to
successfully keep the inflation rate around zero, is to set the quarterly money supply growth
rate σ, for the current quarter, equal to the output growth rate, gy, reported for the previous
quarter. Then money supply and demand would be about equal over time. As a simple rule
that would enforce the 1978 Act inflation target, this would also presumably eliminate the
welfare loss associated with a 2% instead of zero inflation rate.
The inflation tax revenue with a zero inflation rate would then be only the "natural
seigniorage" from keeping a stable value of the government’s currency. With a 2% growth
34

rate of output, this money supply increase, of the monetary base or M1 both at $3.7 trillion
in 2018, still yields a significant revenue of $ (0.02) 3.7 = 0.074 trillion, or $74 billion, in
current dollars. This would be how much inflation tax the Fed would raise each year. This
would in turn allow, after budget expense, some $70 billion to be returned to Treasury,
or 1.6% ( .704.5 = 0.16) of government expenditures, by following the 1978 Act that governs
current Fed policy, while saving the welfare cost of some $7 to $72 billion a year.
11 Conclusion
The model provides a microeconomic founded way to provide an estimate of the welfare
cost of inflation for any inflation rate. Estimates are provided under a baseline and two
alternative calibrations. The estimates are also compared with different model cases such
as with no banking and with no leisure. With banking time, the cost estimate is precisely
consistent with a shopping time approach in its use of real resources, but formulated using a
bank production function of the Clark (1984) variety. This replaces an arbitrary transaction
cost function designed to give a certain money demand function with a marginal cost of
banking consistent with the banking literature such that the money demand is implied as a
result.
Cost estimates were made for a 10% inflation rate instead of zero inflation, and for a
2% inflation rate instead of zero. A zero inflation rate is put forth as the target in the 1978
Amendments to the 1946 Act governing Fed policy. For a 2% inflation rate instead of zero,
using the paper’s M1 calibration, the cost estimate is $33 billion a year. This magnitude
suggests it is worth considering why the Fed targets 2% inflation rather than following the
1978 US Act prescribing zero inflation. This is especially true now that the unemployment
rate has fallen below the 4% target also found in the 1978 US Act, leaving the Fed without
an escape hatch from the 1978 Act.
35

References
Adao, Bernardino, and Andre C. Silva (2018), "Government Financing, Inflation, and the Financial Sector",
Nova School of Business and Economics, Working Paper #621.
Aiyagari, S. R., Braun R.A. and Eckstein Z. (1998) "Transaction Services, Inflation, and Welfare", Journal
of Political Economy, 106, 1274-1301.
Baumol, William J. (1952). "The Transactions Demand for Cash: An Inventory Theoretic Approach".
Quarterly Journal of Economics 66 (4): 545—556.
Benk, Szilárd, Max Gillman, and Michal Kejak (2005a), "A Comparison of Exchange Economies within a
Monetary Business Cycle", The Manchester School, Vol 73, No. 4 (July): 542-562.
Benk, Szilárd, Max Gillman, and Michal Kejak (2005b), "Credit Shocks in the Financial Deregulatory Era:
Not the Usual Suspects," Review of Economic Dynamics, 8(3, July): 668-687.
Benk, Szilárd, Max Gillman, and Michal Kejak (2008), "Money Velocity in an Endogenous Growth Business
Cycle with Credit Shocks", Journal of Money, Credit, and Banking, vol. 40(6), pp. 1281-1293, September.
Benk, Szilárd, Max Gillman and Michal Kejak (2010), "A Banking Explanation of the US Velocity of Money:
1919-2004", Journal of Economic Dynamics and Control, vol. 34(4), pp. 765—779, April.
Berk, Jonathan B. and Richard C. Green. 2004, "Mutual Fund Flows and Performance in Rational Markets."
Journal of Political Economy, 112(6): 1269-1295.
Berger, A. N. and D. B. Humphrey (1997), "Effi ciency of Financial Institutions: International Survey and
Directions for Future Research, European Journal of Operations Research, 98 (2): 175-212.
Cagan, Phillip (1956). "The Monetary Dynamics of Hyperinflation". In Friedman, Milton (ed.). Studies in
the Quantity Theory of Money. Chicago: University of Chicago Press.
Csabafi, Tamas and Ceri Davies, Max Gillman, and Michal Kejak (2018), "Nominal Interest Rates and
Ination Rate Inversion: Bank Shocks and the Great Recession", manuscript, University of Missouri-St.
Louis.
36
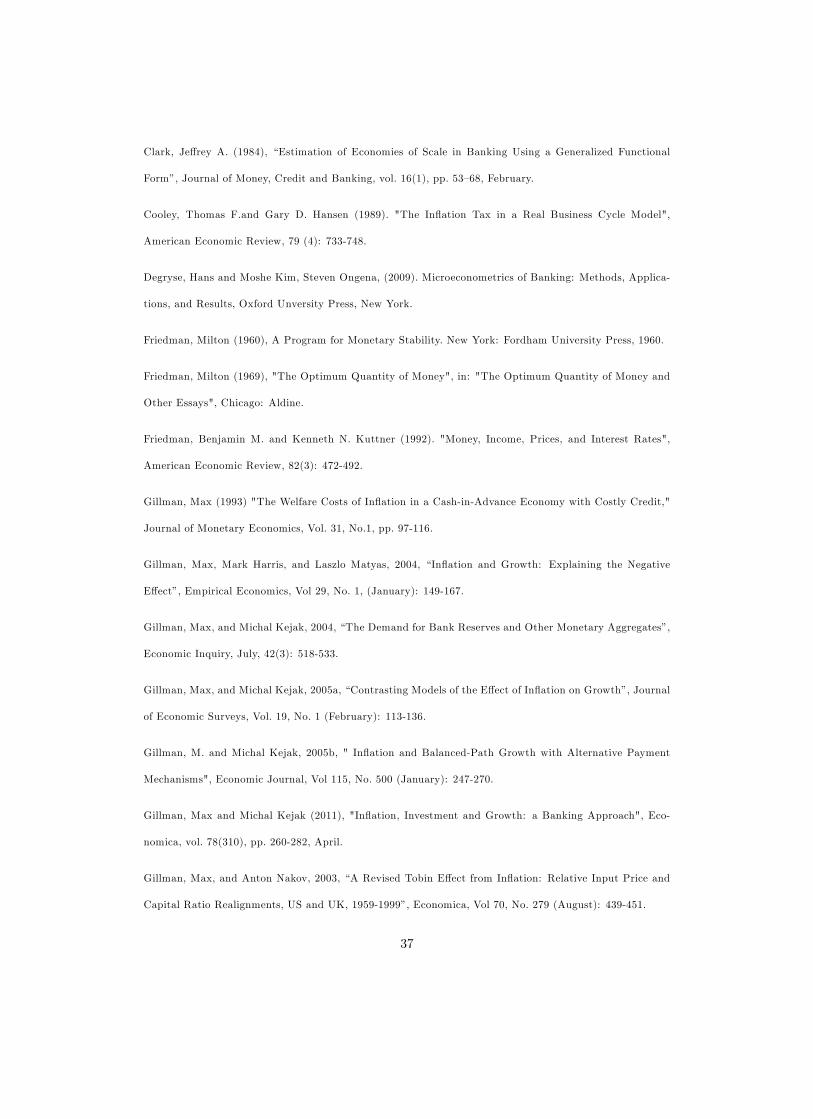
Clark, Jeffrey A. (1984), “Estimation of Economies of Scale in Banking Using a Generalized Functional
Form”, Journal of Money, Credit and Banking, vol. 16(1), pp. 53—68, February.
Cooley, Thomas F.and Gary D. Hansen (1989). "The Inflation Tax in a Real Business Cycle Model",
American Economic Review, 79 (4): 733-748.
Degryse, Hans and Moshe Kim, Steven Ongena, (2009). Microeconometrics of Banking: Methods, Applica-
tions, and Results, Oxford Unversity Press, New York.
Friedman, Milton (1960), A Program for Monetary Stability. New York: Fordham University Press, 1960.
Friedman, Milton (1969), "The Optimum Quantity of Money", in: "The Optimum Quantity of Money and
Other Essays", Chicago: Aldine.
Friedman, Benjamin M. and Kenneth N. Kuttner (1992). "Money, Income, Prices, and Interest Rates",
American Economic Review, 82(3): 472-492.
Gillman, Max (1993) "The Welfare Costs of Inflation in a Cash-in-Advance Economy with Costly Credit,"
Journal of Monetary Economics, Vol. 31, No.1, pp. 97-116.
Gillman, Max, Mark Harris, and Laszlo Matyas, 2004, “Inflation and Growth: Explaining the Negative
Effect”, Empirical Economics, Vol 29, No. 1, (January): 149-167.
Gillman, Max, and Michal Kejak, 2004, “The Demand for Bank Reserves and Other Monetary Aggregates”,
Economic Inquiry, July, 42(3): 518-533.
Gillman, Max, and Michal Kejak, 2005a, “Contrasting Models of the Effect of Inflation on Growth”, Journal
of Economic Surveys, Vol. 19, No. 1 (February): 113-136.
Gillman, M. and Michal Kejak, 2005b, " Inflation and Balanced-Path Growth with Alternative Payment
Mechanisms", Economic Journal, Vol 115, No. 500 (January): 247-270.
Gillman, Max and Michal Kejak (2011), "Inflation, Investment and Growth: a Banking Approach", Eco-
nomica, vol. 78(310), pp. 260-282, April.
Gillman, Max, and Anton Nakov, 2003, “A Revised Tobin Effect from Inflation: Relative Input Price and
Capital Ratio Realignments, US and UK, 1959-1999”, Economica, Vol 70, No. 279 (August): 439-451.
37

Gillman, Max and Anton Nakov, 2004, “Granger Causality of the Inflation-Growth Mirror in Accession
Countries”, Economics of Transition, Vol 12, number 4 (December): 653-682.
Gillman, Max and G. Otto, 2007, “Money Demand in General Equilibrium Endogenous Growth: Estimating
the Role of a Variable Interest Elasticity”, Quantitative and Qualitative Analysis in Social Sciences (QASS).
Vol. 1 (1), Spring, 1-25.
Gillman, Max, and Oleg Yerokhin, 2005, “Ramsey-Friedman Optimality with Banking Time”,
BEPress Journals in Macroeconomics, Topics in Macroeconomics, Vol. 5, No. 1, Article 16;
http://www.bepress.com/bejm/topics/vol5/iss1/art16.
Gomme, Paul and Rupert, Peter, 2007. "Theory, measurement and calibration of macroeconomic models,"
Journal of Monetary Economics, Elsevier, 54(2): 460—497.
Hancock, D.,1985. The financial firm: production with monetary and nonmonetary goods. Journal of Polit-
ical Economy, 93(5), 859-880.
Hicks, John R. 1935. A suggestion for simplifying the theory of money. Economica, N.S. 2 (February): 1-19.
Hodrick, Robert J., Narayana Kocherlakota, and Deborah J. Lucas (1991) “The Variability of Velocity in
Cash-in-Advance Models.” Journal of Political Economy, 99, 358—84.
Jovanovic, Boyan, (1982): "Inflation and Welfare in the Steady State," Journal of Political Economy, 90,
561-577.
King, Robert G. and Charles I. Plosser., 1984."Money, Credit, and Prices in a Real Business Cycle", The
American Economic Review, 74 (3, June ): 363-380.
Li, V. (2000): “Household Credit and the Monetary Transmission Mechanism,”Journal of Money, Credit
and Banking, 32(3), 335—356.
Lucas, Robert E. Jr., (1980), "Equilibrium in a Pure Currency Economy," Economic Inquiry, 18(2): 203-20.
Lucas, Robert E. Jr., (2000). "Inflation and Welfare," Econometrica, vol. 68(2), pages 247-274, March.
Lucas, Robert E. Jr., and Nicolini, Juan Pablo, (2015). "On the stability of money demand," Journal of
Monetary Economics, vol. 73(C), pages 48-65.
38
Lucas, Robert E. Jr., Stokey, N. L., 1983. Optimal fiscal and monetary policy in an economy without capital.
Journal of Monetary Economics, 12(1), 55-93.
Lucas, Robert E, Jr., Stokey, Nancy L, 1987. "Money and Interest in a Cash-in-Advance Economy," Econo-
metrica, vol. 55(3), pages 491-513, May.
McCallum, B. T., and Goodfriend M. S. (1987) “Demand for Money: Theoretical Studies”, in New Palgrave
Money, J. Eatwell et al. eds., Macmillan Press, NY.
Samuelson, Paul A., 1947, Enlarged ed., 1983. Foundations of Economic Analysis, Harvard University Press.
Sidrauski, Miguel (1967a): "Rational Choice and Patterns of Growth in a Monetary Economy," American
Economic Review, 57, 534-544.
Sidrauski, Miguel (1967b): "Inflation and Economic Growth," Jouirnal of Political Economny, 75, 796-810.
Silva, Andre C. (2012). "Rebalancing Frequency and the Welfare Cost of Inflation", American Economic
Journal: Macroeconomics, 4(2): 153-183.
Tobin, James (1956). "The Interest Elasticity of the Transactions Demand for Cash". Review of Economics
and Statistics 38 (3): 241—247.
Wheelock, David C. and Paul W. Wilson (2012), "Robust Nonparametric Quantile Estimation of Effi ciency
and Productivity Change in U.S. Commercial Banking, 1985—2004," Journal of Business & Economic Sta-
tistics, 27:3, 354-368.
39