The Weekly Dig March 4, 2016 - Amazon Web...
45
The Weekly Dig – March 4, 2016 Mick Carew, PhD 604-697-6006[email protected] and the Haywood Mining Team Member of the Canadian Investor Protection Fund Please see page 40 for Analyst Certification, Important Information and Legal Disclaimers, page 43 for Risk Profile Definitions, and pages 41 to 49 for Disclosures, Rating Structure, and notes. Crunch Time for Commodities/Mining Equities as PDAC Approaches The rally in metal prices and mining equities continued unabated this week. However, while precious metals, particularly gold (↑2.8%; $1,262 per ounce this week), have risen on the back on global economic uncertainty, especially in the U.S., the recent rise in base metals has taken many investors by surprise. Testing the $2.00 per pound level a little less than a month ago, the price of copper has since risen by 12%. This week alone, copper is up 6.4%, while nickel (↑9.1%), lead (↑6.78%) and zinc (↑5.24%) have each risen significantly this week, with nickel rocketing past the $4.00 per pound level to finish at $4.23 per pound. While the rise in gold can be attributed to investors seeking safe-haven assets following the fall in global stock markets worldwide, the rise in base metals is not so easily explained; concerns over global economic growth, particularly in China, would imply significant downward pressure on base and industrial metal prices, certainly copper, or Dr. Copper as it affectionately known (at least in a bull market) has historically been viewed as the bellwether for global growth. Some view this counterintuitive move as a reflection of the opaque nature of China’s economy, and that perhaps growth in the Country is not as significant as first thought. Regardless of the reasons, however, many view the timing of the PDAC, and the performance of metals and mining equities syn- and post- the world’s largest mining conference as a reliable indicator for what is in store for the summer. This view is borne from the performance of metals and equities during the same period since 2011, with initial positive signs giving way to a subsequent downturn in metal/equity prices at and around the PDAC. Silver (↑5%), platinum (↑6.6%) and palladium (↑13%) also finished up, closing at $15.55, $979 and $556 per ounce respectively. Meanwhile, WTI crude prices also rose during the week, finishing at $36.23 per barrel, while the UxC Broker Average Price (BAP) of uranium fell below $32.00 per pound, finishing at $31.38 per pound on Friday. DIGGING IN… Metals Sector Macro: Metal Price Rally Continues As PDAC Approaches ….……………………….………2 Junior Explorer – Weekly Vantage Point: News from the Junior sector this week included the signing of an option agreement between Mirasol Resources (MRZ-V) and Cerro Vanguardia S.A. for its Claudia project in Argentina, an exploration update from SilverCrest Metals (SIL-V) for its Las Chispas project in Sonora, Mexico, and drill assay results from Pure Gold Mining Inc. (PGM- V), Golden Arrow Resource’s (GRG-V), TerraX Minerals Inc. (TXR-V) and Unigold Inc. (UGD- V)….....................................................................................................................................................3 Haywood Research – The Week in Review: Publications from the Haywood Research team this week included 2015 production results from NSU-T, an increased target price from AGB-V, 2016 guidance estimates from HBM-T, resource and reserve update from MND-T, a maiden resource estimate from NXE-V, drill assay results from OBM-T, a decreased target price for OGC-T, preliminary royalty production results and guidance from OR-T, a purchase agreement for RMC-V, and the friendly acquisition of TGM-V by EDV-T …………………………………………..…..……..9 Market Essentials: Glencore Plc (GLEN-LON) announced its Q4/15 and 2015 financial results …..16 Equity Financings: This Week: 13 equity raises for C$26. million……..………………………..………..17 Weekly Commodities / Indices / Exchange Rates: The S&P/TSX Comp and S&P/TSX Venture Comp both rose significantly this week, finishing at 13,213 and 562 respectively…… …………..18 Commodities and ETFs: A Week in Action: nickel up for the week (↑9%), finishing at $4.23 per pound..……………………………………………….……………………………………………………………….…………….…….19 Equities: Weekly Performances: HudBay Minerals Inc. (HBM-T) up 46% for the week…..…..…21 Comparables Tables: Consensus and Haywood forecasts and multiples, plus market valuations for in situ resources…………………………………………………………………………………………………………………..……..24 Important Notice & Disclaimer – Please Read The Dig is intended to provide general information only and it is written for an institutional audience. It is not a solicitation for the purchase of securities, an offer of securities, or intended as investment research or advice. The information presented, while obtained from sources we believe reliable is not guaranteed against errors or omissions. For Canadian residents: Haywood Securities Inc. is a Canadian registered broker-dealer and a member of the Investment Industry Regulatory Organization of Canada, the Toronto Stock Exchange, the Toronto Venture Exchange and the Canadian Investor Protection Fund. Any Canadian client that wishes further information about anything contained herein should contact a qualified salesperson of Haywood Securities Inc. For U.S. residents: The Dig is distributed in the United States by Haywood Securities (USA) Inc. $1,200 $1,250 $1,300 2/29 3/4 Gold (US$/oz) Last: $1,262 $15 $16 $17 2/29 3/4 Silver (US$/oz) Last: $15.55 $2.05 $2.25 2/29 3/4 Copper (US$/lb) Last: $2.26 $32 $34 $36 2/29 3/4 WTI Crude (US$/bbl) Last: $36.23
Transcript of The Weekly Dig March 4, 2016 - Amazon Web...

The Weekly Dig – March 4, 2016 Mick Carew, PhD [email protected]
and the Haywood Mining Team
Member of the Canadian Investor Protection Fund Please see page 40 for Analyst Certification, Important Information
and Legal Disclaimers, page 43 for Risk Profile Definitions, and pages 41 to 49 for Disclosures, Rating Structure, and notes.
Crunch Time for Commodities/Mining Equities as PDAC Approaches
The rally in metal prices and mining equities continued unabated this week. However, while precious metals, particularly gold (↑2.8%; $1,262 per ounce this week), have risen on the back on global economic uncertainty, especially in the U.S., the recent rise in base metals has taken many investors by surprise. Testing the $2.00 per pound level a little less than a month ago, the price of copper has since risen by 12%. This week alone, copper is up 6.4%, while nickel (↑9.1%), lead (↑6.78%) and zinc (↑5.24%) have each risen significantly this week, with nickel rocketing past the $4.00 per pound level to finish at $4.23 per pound. While the rise in gold can be attributed to investors seeking safe-haven assets following the fall in global stock markets worldwide, the rise in base metals is not so easily explained; concerns over global economic growth, particularly in China, would imply significant downward pressure on base and industrial metal prices, certainly copper, or Dr. Copper as it affectionately known (at least in a bull market) has historically been viewed as the bellwether for global growth. Some view this counterintuitive move as a reflection of the opaque nature of China’s economy, and that perhaps growth in the Country is not as significant as first thought. Regardless of the reasons, however, many view the timing of the PDAC, and the performance of metals and mining equities syn- and post- the world’s largest mining conference as a reliable indicator for what is in store for the summer. This view is borne from the performance of metals and equities during the same period since 2011, with initial positive signs giving way to a subsequent downturn in metal/equity prices at and around the PDAC. Silver (↑5%), platinum (↑6.6%) and palladium (↑13%) also finished up, closing at $15.55, $979 and $556 per ounce respectively. Meanwhile, WTI crude prices also rose during the week, finishing at $36.23 per barrel, while the UxC Broker Average Price (BAP) of uranium fell below $32.00 per pound, finishing at $31.38 per pound on Friday.
DIGGING IN… Metals Sector Macro: Metal Price Rally Continues As PDAC Approaches ….……………………….………2 Junior Explorer – Weekly Vantage Point: News from the Junior sector this week included the signing of an option agreement between Mirasol Resources (MRZ-V) and Cerro Vanguardia S.A. for its Claudia project in Argentina, an exploration update from SilverCrest Metals (SIL-V) for its Las Chispas project in Sonora, Mexico, and drill assay results from Pure Gold Mining Inc. (PGM-V), Golden Arrow Resource’s (GRG-V), TerraX Minerals Inc. (TXR-V) and Unigold Inc. (UGD-V)….....................................................................................................................................................3 Haywood Research – The Week in Review: Publications from the Haywood Research team this week included 2015 production results from NSU-T, an increased target price from AGB-V, 2016 guidance estimates from HBM-T, resource and reserve update from MND-T, a maiden resource estimate from NXE-V, drill assay results from OBM-T, a decreased target price for OGC-T, preliminary royalty production results and guidance from OR-T, a purchase agreement for RMC-V, and the friendly acquisition of TGM-V by EDV-T …………………………………………..…..……..9 Market Essentials: Glencore Plc (GLEN-LON) announced its Q4/15 and 2015 financial results …..16 Equity Financings: This Week: 13 equity raises for C$26. million……..………………………..………..17 Weekly Commodities / Indices / Exchange Rates: The S&P/TSX Comp and S&P/TSX Venture Comp both rose significantly this week, finishing at 13,213 and 562 respectively…… …………..18 Commodities and ETFs: A Week in Action: nickel up for the week (↑9%), finishing at $4.23 per pound..……………………………………………….……………………………………………………………….…………….…….19 Equities: Weekly Performances: HudBay Minerals Inc. (HBM-T) up 46% for the week…..…..…21 Comparables Tables: Consensus and Haywood forecasts and multiples, plus market valuations for in situ resources…………………………………………………………………………………………………………………..……..24 Important Notice & Disclaimer – Please Read The Dig is intended to provide general information only and it is written for an institutional audience. It is not a solicitation for the purchase of securities, an offer of securities, or intended as investment research or advice. The information presented, while obtained from sources we believe reliable is not guaranteed against errors or omissions. For Canadian residents: Haywood Securities Inc. is a Canadian registered broker-dealer and a member of the Investment Industry Regulatory Organization of Canada, the Toronto Stock Exchange, the Toronto Venture Exchange and the Canadian Investor Protection Fund. Any Canadian client that wishes further information about anything contained herein should contact a qualified salesperson of Haywood Securities Inc. For U.S. residents: The Dig is distributed in the United States by Haywood Securities (USA) Inc.
$1,200
$1,250
$1,300
2/29 3/4
Gold (US$/oz)Last: $1,262
$15
$16
$17
2/29 3/4
Silver (US$/oz)Last: $15.55
$2.05
$2.25
2/29 3/4
Copper (US$/lb)Last: $2.26
$32
$34
$36
2/29 3/4
WTI Crude (US$/bbl)Last: $36.23

The Weekly Dig 3/4/16
Haywood Mining [email protected] Page 2
Metals Sector Macro
Macroeconomic News
United States: The week started on a poor note when Chicago Purchasing Managers Index data for February came in significantly lower than expected at 47.6, compared with the 54.0 estimated by economists. The result was a blow considering that readings below 50 signal a contracting economy. A day later, both Markit and the Institute for Supply Management (ISM) released their PMI estimates for February, indicating slightly better conditions than the Chicago reading; ISM said its index increased 1.3% to a reading of 49.5, the highest reading since September, while Markit’s index rose slightly to 51, the second-lowest reading since October 2012. Factory orders on Thursday also indicated that the manufacturing slump in the United States may be easing; new orders rebounded 1.6% in January after an unrevised 2.9% drop in December. Also up were durable goods orders, which rose by the most in 10 months (4.9%), and well above the 2.9% expected. A strong dollar, weak global demand, and spending cuts by energy firms following a plunge in crude oil prices have all conspired to undercut manufacturing, although some of the recent data suggest this may be bottoming-out. Later in the week, employment data were mixed; private sector employment increased by 214,000 jobs from January to February, compared with the 190,000 expected; however, initial jobless claims rose by 6,000, albeit still well below the 300,000 threshold. The rise was more than anticipated; economists had expected the figure to climb by 2,000. The 4-week moving average of jobless claims, which evens out some of the volatility, fell 1,750 from last week to 270,250. Nonfarm payrolls were also up, increasing by 242,000 in February, while the unemployment rate remained unchanged at 4.9%, the U.S. Bureau of Labor Statistics reported on Friday. Also on Friday, U.S. trade figures showed the Country’s deficit widened more than expected in January as a strong dollar and weak global demand helped to push exports to more than a five-and-a-half-year low.
Canada: The Canadian dollar gained ground against the U.S. dollar, after Canada’s gross domestic product (GDP) expanded more than anticipated by 0.2% month over month in December, after expanding by 0.3% in the preceding month, and compared with market expectations for a rise of 0.1%. However, the country’s manufacturing sector was almost unchanged in February as the industry shrank for the seventh month in a row. The RBC Canadian Manufacturing Purchasing Managers’ Index (PMI), a measure of manufacturing business conditions, edged up to a seasonally adjusted 49.4 last month from 49.3 in January.
China: Manufacturing data out of China were even worse than expected in February; China’s official Manufacturing Purchasing Managers Index fell last month to its lowest level in more than 4 years, to 49.0—down from 49.4 in January—government data released on Tuesday showed. Separately, the Caixin China manufacturing PMI dropped to 48 in February from 48.4 the month before. China’s services activity also grew slower than expected in February, with the Caixin China services Purchasing Managers Index dropping to 51.2 in February from January’s 6-month high of 52.4. Meanwhile, rating agency Moody’s cut its outlook for China from “stable” to “negative”, urging economic reforms to prevent a downgrade of the country’s credit rating. The rating was left unchanged at Aa3, but the negative outlook reflects ongoing concern about the slowing economy.

The Weekly Dig 3/4/16
Haywood Mining [email protected] Page 3
Junior Explorer: Weekly Vantage Point
News from the Junior sector this week included drill assay results from Pure Gold Mining’s (PGM-V) Madsen project in Ontario, an option agreement between Mirasol Resources Ltd. (MRZ-V) and Cerro Vanguardia S.A. (92.5% owned by AngloGold Ashanti (ANG-JSE) in Argentina, an exploration update from SilverCrest Metals Inc. (SIL-V) and drill assay results from Golden Arrow Resources Corp. (GRG-V).
Mining Flashes Other News
Pure Gold Mining Inc. (PGM-V) Mirasol Resources Ltd. (MRZ-V) SilverCrest Metals Inc. (SIL-V) Golden Arrow Resources Corp. (GRG-V) TerraX Minerals Inc. (TXR-V) Unigold Inc. (UGD-V)
Mining Flashes
Pure Gold Mining Inc. (PGM-V, $0.245) – Drilling Results Support Geological Reinterpretation at Madsen
Mick Carew, [email protected], Tara Hassan, [email protected], Danny Ochoa, PEng, [email protected]
Gold Intersections Support Geological Reinterpretation at Madsen – On Tuesday morning, Pure Gold released drill assay results from the McVeigh horizon located on the Company ’s 100% owned Madsen gold project in Ontario’s Red Lake District. Approximately 3,000 metres of drilling over 10 drill holes have been completed at Madsen since January 2016. This drilling was designed to test the steeply plunging mineralized shoots associated with the McVeigh horizon, which is situated parallel to the Austin horizon. Highlights from the latest set of drill results include:
PG16-054 that intersected 11.9 metres grading 6.5 g/t gold from 2.2 metres downhole (Austin Horizon), and 1.7 metres grading 11.4 g/t gold from 304.0 metres downhole (McVeigh Horizon)
PG16-058 that intersected 7.0 metres grading 16.0 g/t gold from 153.0 metres downhole, including 2.1 metres grading 45.5 g/t gold and 4.3 metres grading 4.7 g/t gold, including 7.0 metres grading 9.9 g/t gold (both in the McVeigh Horizon).
See Haywood Securities for the full report
Other News
Mirasol Resources Ltd. (MRZ-V, $1.20) Share Price: (52-week high/low: $1.15/$0.72) Daily Average Volume for the Week: 265,685 Market Capitalization: $53.09 million Shares Outstanding: 44.2 million Cash: ~$18.9 million (February 2016; plus $3.1 million anticipated tax recoveries) Date of Release: March 1, 2016 Event: Mirasol signed an exploration and option agreement with Cerro Vanguardia S.A. (CVSA), 92.5% owned by AngloGold Ashanti (ANG-JSE), whereby CVSA has the option to acquire a 75% interest in Mirasol’s Claudia project situated adjacent to CVSA’s Cerro Vanguardia gold and silver mine in Argentina.

The Weekly Dig 3/4/16
Haywood Mining [email protected] Page 4
Details of agreement: To acquire a 75% interest, CVSA can exercise its option over three stages over a 6-year or shorter term period.
To earn a 51% interest in the project over a maximum 2-year period: CVSA needs to spend US$5 million on exploration, make US$1 million in payments to Mirasol, and execute an exploration program that includes a minimum of 12,000 metres of drilling.
To earn a 65% interest within 2 additional years after the 51% earn-in: CVSA need to provide a National Instrument 43-101 compliant Preliminary Economic Assessment (PEA) of not less than 350,000 ounces of gold as inferred or higher classification, with grades that support profitable economic extraction based on the Cerro Vanguardia mine cost structure.
To earn a 75% interest within a total of 4 years of the 51% earn-in date: CVSA is required to deliver a technical and financial evaluation report to National Instrument 43-101 prefeasibility study standards, demonstrating a compliant measured and indicated resource of not less than 350,000 ounces of gold, including a minimum of 175,000 ounces of measured mineral resources; and delivering to the Company a decision to proceed with mining operations.
Furthermore, at any time after CVSA has earned a 75% interest, Mirasol shall have the right to require CVSA to provide a loan on commercially reasonable terms, to fund 100% of Mirasol’s share of the costs to commence commercial production, with repayment of the loan to be made from 60% of the Company’s cash flow from production.
Implications: The agreement with CVSA consolidates the Cerro Vanguardia gold and silver mine, which last year produced 300,000 ounces of gold from open-pit/heap leach and underground operations. Cero Vanguardia abuts Mirasol’s Claudia project, which consists of a number of large-scale gold-silver prospects. Gold and silver mineralization at both Claudia and Cerro Vanguardia is interpreted to represent part of a large Intermediate- to low-sulphidation epithermal system; the Curahue prospect represents a 15.5-kilometre-long epithermal vein trend and one of a number of prospects within the 127,680-metre land package, where epithermal veining preferentially developed adjacent to a north-south-oriented basement structure that controls Vanguardia veins. Highlight trench assay results from Claudia include: 2.3 metres grading 2.0 g/t gold and 110.9 g/t silver, and 2.2 metres grading 2.59 g/t gold and 7.6 g/t silver. Other targets include Rio Seco, Laguna Blanca, Ailen, and Cilene.
SilverCrest Metals Inc. (SIL-V, $0.30) Share Price: (52-week high/low: $0.27/$0.09) Daily Average Volume for the Week: 873,151 Market Capitalization: $12.26 million Shares Outstanding: 66.1 million Cash: ~$6.5 million (March 2016) Date of Release: March 2, 2016 Event: SilverCrest released an update on its Las Chispas project in Sonora, Mexico
Results: The Company announced a series of geochemical results from drilling at 2015, as well as details of a work program that it plans on conducting throughout the year. The primary focus in the short- to medium-term will be the rehabilitation of several historical silver-gold mines at Las Chispas, which will help SilverCrest conduct work to assess the potential for high-grade silver-gold mineralization; historically, it is estimated that 100 million ounces of silver and 200,000 ounces of gold were mined between 1880 and 1930. Rehabilitation work will include cleaning and securing all underground areas, removing historical backfill and stockpiles for possible future processing, in addition to other minor infrastructure, followed by detailed mapping and sampling of old workings—work estimated to cost approximately $150,000 to $200,000. Initial sampling of underground workings has retuned encouraging grades, including:

The Weekly Dig 3/4/16
Haywood Mining [email protected] Page 5
1.3 metres of 15.1 g/t gold and 1,340 g/t silver
1.5 metres of 8.1 g.t gold and 163 g/t silver.
Finally, the Company released the results of its maiden drill program at the Huasabas project, also in Sonora. Approximately 1,091 metres of drilling returned minor, anomalous gold-silver mineralization within several epithermal veins. SilverCrest intends to follow-up with more work at Huasabas at some point, although the focus in the meantime will be Las Chispas.
Implications: SilverCrest has set itself up for a busy year in 2016. After the rehabilitation work at Las Chispas, the Company will conduct a 3,000-metre surface drill program, followed by a 2,000-metre underground drill program later in the year. We note that the geochemical samples released and described above are representative of what is currently exposed and accessible only; historically, mineralized zones are believed to be more than 5 metres wide. Overall, the 2016 budget will be between $1.5 million and $2 million.
Golden Arrow Resources Corp. (GRG-V, $0.23) Share Price: (52-week high/low: $0.495/$0.17) Daily Average Volume for the Week: 655,248 Market Capitalization: $13.52 million Shares Outstanding: 58.8 million Cash: NA (< $500,000) Date of Release: March 3, 2016 Event: Golden Arrow released drill assay results from the Chinchillas silver project in Argentina. The 19 holes released this week are part of a Phase V drilling program funded by Silver Standard; the drilling program is part of a pre-development assessment program (US$12.6 million) currently being undertaken to evaluate the feasibility of creating a combined mining business with Silver Standard’s Pirquitas mine, as announced on October 1, 2015. Chinchillas has a current National Instrument 43-101 compliant resource of 25.9 million tonnes grading 77.2 g/t silver, 0.66% lead, and 0.66% zinc in the indicated category, and 47.2 million tonnes grading 50.2 g/t silver, 0.52% lead, and 0.64% zinc in the inferred category.
Results: In addition to high-grade results from the Silver Mantos area, drilling was also conducted approximately 1 kilometre south of the main deposit to install a water-monitoring well. The hole returned multiple intervals of mineralization similar in style to high-grade mineralization at Silver Standard’s Pirquitas mine (approximately 30 kilometres to the southwest). In particular, the hole (CGA-272W) returned 3 metres grading 165 g/t silver, 2.0% lead, and 3.6% zinc.
Highlight results from holes drilled within the main Silver Mantos area include:
854 g/t silver over 14 metres in CGA-275, including 1,611 g/t silver over 5 metres
485 g/t silver, 1.9% lead, 0.7% zinc over 9 metres in CGA-277, including 1,507 g/t silver, 5.2% lead ,and 1.1% zinc over 2 metres
106 g/t silver, 0.8% lead, and 0.5% zinc over 41 metres in CGA-278, including 316 g/t silver and 2.8% lead over 3 metres
69 g/t silver, 1.1% lead, and 1.9% zinc over 15 metres in CGA-272W, including 165 g/t silver, 2.0% lead and 3.6% zinc over 3 metres.
Implications: The recent change in government in Argentina has brought Golden Arrow back on the radar as renewed confidence in the region intensifies. Recent results from Chinchillas have also illustrated the higher grade potential of the project, and an updated mineral resource estimate will incorporate these additional intersections, and is expected to be announced in Q2/16. In addition to the updated resource estimate, ongoing engineering, permitting, and environmental studies are being conducted as part of the pre-development studies funded by Silver Standard to determine the possible synergies between Chinchillas and

The Weekly Dig 3/4/16
Haywood Mining [email protected] Page 6
Silver Standard’s Pirquitas mine. Under the agreement announced on October 1, the two projects would be combined into a 75% (Silver Standard) / 25% (Golden Arrow) mining joint venture, with Silver Standard assuming the role of operator. As of December 2014, Pirquitas had total reserves and resources of 20 million tonnes grading 176 g/t silver and 1.8% zinc. Finally, the discovery of silver mineralization 1 kilometre to the south provides additional exploration upside, which will be followed-up with more exploration work. TerraX Minerals Inc. (TXR-V, $0.35) Share Price: (52-week high/low: $0.425/$0.23) Daily Average Volume for the Week: 317,729 Market Capitalization: $23.63 million Shares Outstanding: 67.5 million Working Capital: October, 2016 ($4.1 million) Date of Release: March 4, 2016 Event: TerraX Minerals released drill assay results from the Mispickel target, one of a number of targets the Company expects to test as part of its 2016 winter exploration program within its Yellowknife City Gold Project (YCGP) in the Northwest Territories. The two holes released here follow the first two holes released two weeks ago by the company, which returned highlight intersections of: 7.30 metres grading 23.60 g/t gold from a downhole depth of 43.60 metres (Hole TWL16-002) and 8.60 metres grading 12.87 g/t gold from a downhole depth of 25.90 metres (Hole TWL16-001).
Results: Holes TWL16-003 and 004 were drilled on the same north-south section, 50 metres to the south of the first two holes. Highlights include:
TWL16-003, which intersected 4.05 metres grading 3.49 g/t gold from a downhole depth of 49.65 metres (main zone)
TWL16-004, which intersected 7.50 metres grading 2.08 g/t gold (within an overall intercept of 39.00 metres grading 0.63 g/t gold), from a downhole depth of 44.50 metres (hanging wall zone)
Implications: The two drill results from Mispickel complement the initial drill results released two weeks ago (see Mining Flash February 23, 2016); gold mineralization has now been intersected along two sections 50 metres apart along a north-south trending structure. Interestingly, the higher total cumulative gold widths and values in hole TWL16-004 were achieved even though the hole did not intersect the Main Zone, which was responsible for the majority of gold grade in the total cumulative TWL16-003 intersection. This preliminary success from the four holes drilled at Mispickel has resulted in the decision to do more work at Mispickel this winter. This will comprise of a magnetic survey that will be completed over the next two weeks, followed by an expanded drill program that could begin later this month until ice breakup in mid-April. The Company will provide more information over the coming weeks. TerraX have also completed 9 holes (1,501 metres) of drilling at the Sam Otto target located to the southwest of Mispickel, plus 5 holes (1,145 metres) at the Homer Lake target to the north. Results are pending. Drilling is currently underway at the Barney Zone in the Core Gold Area of the YCGP. Unigold Inc. (UGD-V, $0.30) Share Price: (52-week high/low: $2.00/$0.08) Daily Average Volume for the Week: 354,698 Market Capitalization: $8.84 million Shares Outstanding: 29.5 million Cash: $300,000 (February 2016) Date of Release: March 4, 2016 Event: Unigold released drill assay results from its Candelones Extension deposit (100%-owned) in the Dominican Republic. Drilling was focussed on the deeper parts of the gold mineralized system below the

The Weekly Dig 3/4/16
Haywood Mining [email protected] Page 7
current National Instrument 43-101 compliant resource (39.4 million tonnes grading 1.6 g/t gold (2 million ounces) in the inferred category).
Results: Highlight intersections include four holes in what has been interpreted as a feeder zone to the stratabound massive sulphide mineralization that makes up most of the current resource. Highlights include:
LP16-100, which intersected 42.5 metres grading 3.41 g/t gold, 6.3 g/t silver, 0.5% copper and 1.6% zinc from a downhole depth of 291.1 metres. This includes a higher-grade intersection of 12.0 metre grading 7.46 g/t gold, 5.1 g/t silver, 1.4% copper and 1.3% zinc.
LP16-98, which intersected 4.80 metres grading 7.32 g/t gold, 52.0 g/t silver, 0.2% copper and 2.7% zinc from a downhole depth of 245.8 metres.
Implications: The latest set of results represents the second target drill tested at Candelones, and it is the second target where higher-grade gold-silver-copper-zinc mineralization has been identified. Mineralization is associated with matrix-supported angular breccias which show clear evidence of multiphase epithermal textures. Importantly, the grades associated with this epithermal-style mineralization is higher grade than the stratabound mineralization, and was largely missed by previous drilling. The genetic relationship, and the size and continuity of this feeder zone, needs to be determined via further drill testing, although preliminary interpretations suggest the feeder zone may have a plunge component. We look forward to more details of follow-up work on the high-grade feeder-zone, which could have important implications for future project economics.

The Weekly Dig 3/4/16
Haywood Mining [email protected] Page 8
Performance of Companies Included in Junior X and Notable News Flow
Source: Capital IQ and Haywood Securities
Key Catalysts for Companies Featured in the Last Junior Exploration Report
Source: Haywood Securities
Close
Price Market Capitalization
Cash at Quarter
End Weekly Performance QTD Performance
QTD Performance
vs. TSXV Index
Company Ticker (C$) (C$M) (C$M)
Junior Exploration Names
Balmoral Resources Ltd TSX:BAR 0.65 76.46 5.61 10.2% 51.2% 46.0%
Barkerville Gold Mines Ltd. TSXV:BGM 0.53 137.50 0.70 (1.9)% 103.8% 98.7%
Barsele Minerals Corp. TSXV:BME 0.19 19.63 0.47 (5.0)% 65.2% 60.0%
Cardinal Resources Limited ASX:CDV 0.14 23.13 0.81 (6.9)% (3.6)% (8.8)%
Falco Resources Ltd. TSXV:FPC 0.41 45.19 3.92 (1.2)% 54.7% 49.5%
Gold Standard Ventures Corp TSXV:GSV 1.35 268.24 14.72 15.4% 42.1% 36.9%
Marathon Gold Corporation TSX:MOZ 0.26 24.26 2.35 6.1% 73.3% 68.2%
NGEx Resources Inc. TSX:NGQ 0.73 146.77 2.11 15.9% 12.3% 7.1%
Plateau Uranium Inc. TSXV:PLU 0.35 14.22 1.09 0.0% (6.7)% (11.8)%
Purepoint Uranium Group Inc. TSXV:PTU 0.10 14.24 0.22 17.6% 185.7% 180.5%
SilverCrest Metals Inc. TSXV:SIL 0.30 12.26 5.15 30.4% 87.5% 82.3%
TerraX Minerals Inc. TSXV:TXR 0.35 23.63 4.51 (6.7)% 27.3% 22.1%
Wolfden Resources Corporation TSXV:WLF 0.11 7.77 0.47 0.0% 29.4% 24.2%
Other Companies in the News
Mirasol Resources Ltd. TSXV:MRZ 1.20 53.09 18.28 14.3% 36.4% 31.2%
Golden Arrow Resources Corp. TSXV:GRG 0.23 13.52 0.05 9.5% 15.0% 9.8%
Unigold Inc. TSXV:UGD 0.30 8.84 0.87 53.8% 140.0% 134.8%
Company Ticker Catalysts
Junior Exploration Names
Balmoral Resources Ltd TSX:BAR • NI 43-101 compliant resource estimate for Martiniere - Q2/16
• 2016 Drilling expected to commence late January
Barkerville Gold Mines Ltd. TSXV:BGM • Cow Mountain Resource update - Q3/16
• Bonanza Ledge.-BCV Production - H2/16
• Drill Results - through 2016Barsele Minerals Corp. TSXV:BME • Results from $1.5m program expected Q1/16
Cardinal Resources Limited ASX:CDV • Results from 4 to 5 diamond holes - Q1/16
• Geophysical surveys (IP/magnetics) over Namdini - Q1/16
Falco Resources Ltd. TSXV:FPC • Updated resource estimate - Q1/16
• Preliminary Economic Assessment - Q2/16
• Dewatering Permit Q1/16
• Completion of Dewatering and Commencement of Underground Drill Program -
Q3/16
• Feasibility Study - 2017
Gold Standard Ventures Corp TSXV:GSV • Drill assays: 1DHH from Dark Star and approx. 10 RC holes from Pinion
• Recommence drilling April/May (weather dependant)
Marathon Gold Corporation TSX:MOZ • Results from 2,000 metres of drilling = Q1/16
• Initiate work on metallurgical (heap leach) testing - Q1/16
NGEx Resources Inc. TSX:NGQ • Project constellation de-risking (surface rights acquisition + environmental base
studies)
• Filo del Sol drill target development and metallurgical (leach) test work.
• Potential partner engagement
Plateau Uranium Inc. TSXV:PLU • Updated PEA integrating consolidated resources (Q1/2016)
• Results of further metallurgical testwork and exploration (2016)
Plateau Uranium Inc. TSXV:PLU • Updated PEA integrating consolidated resources (Q1/2016)
• Results of further metallurgical testwork and exploration (2016)
Purepoint Uranium Group Inc. TSXV:PTU
• $3.4 million (Purepoint to contribute $0.7m) - 6,000 drill program (Q1/2016)
SilverCrest Metals Inc. TSXV:SIL • ~$1.5 million exploration program in 2016
• March 2016 - drilling to commence at Las Chispas and Huasabras
TerraX Minerals Inc. TSXV:TXR • Maiden resource estimate for Crestaurum - Q1/16
• ~$4 million drill program on a number of targets in the YGCP
Tinka Resources Ltd. TSXV:TK • Results from 2016 Rice Island (winter) exploration program

The Weekly Dig 3/4/16
Haywood Mining [email protected] Page 9
Haywood Research: The Week in Review
Publications from the Haywood Research team for the week included the following:
Increased target rating for Atlantic Gold Corporation (AGB-V)
Guidance estimates for 2016 from Hudbay Minerals Inc. (HBM-T)
Resource and reserve update and asset sale from Endeavour Mining Corp. (EDV-T)
Updated reserves and resources from Mandalay Resources Corp. (MND-T)
A maiden resource estimate from NexGen Energy Ltd. (NXE-V)
Q4/15 production results from Nevsun Resources Ltd. (NSU-T)
Drill assay results from Oban Mining Corporation (OBM-T)
Decreased price target for OceanaGold Corporation (OGC-T)
Preliminary royalty production results and guidance from Osisko Gold Royalties Ltd. (OR-T)
A purchase agreement for Reservoir Minerals Inc. (RMC-V)
The announcement of a friendly acquisition of True Gold Mining Inc. (TGM-V) by Endeavour Mining Corp. (EDV-T)
Radar Flashes
Atlantic Gold Corporation (AGB-V, $0.45) – Project Financing, Fixed Price EPC Potential, Equity Performance Lead to Re-rate
Geordie Mark, [email protected], Benjamin [email protected]
Project Loan Facility – A commitment letter for C$115 million from Macquarie Bank Limited and Caterpillar Financial Services Corporation is expected to be completed in Q2/16. The project loan facility consists of the Canadian Dealer Offered Rate (CDOR), plus 5.0% during preproduction and 4.5% post construction. The loan requires hedging of 215 koz of gold at a minimum of C$1,500/oz. We note that the gold price currently resides above C$1,650/oz.
Equipment Financing – A term sheet with Caterpillar Financial Services Corp. for up to C$20 million in mining fleet equipment financing (5-year term) is expected to be completed in Q2/16.
EPC Fixed Price Contract – The Company also announced that Ausenco has furnished a Lump Sum Turnkey Fixed Price proposal of C$87.4 million (valid until May 4, 2016) to build the 2 Mtpa MRC project processing plant and some of the related infrastructure on an engineering, procurement, and construction (EPC) basis for the MRC project in Nova Scotia. We note that project development could start as early as Q3/15, which has the potential to bring gold production forward into late 2017.
Target Price, Ratings – We have increased our target to $0.85, up from $0.55, and maintained our BUY rating.
See Haywood Securities for the full report
Hudbay Minerals Inc. (HBM-T, HBM-N, $3.99) – Battening Down the Hatches – Prudent Steps Taken to Improve Liquidity
Stefan Ioannou, [email protected]

The Weekly Dig 3/4/16
Haywood Mining [email protected] Page 10
2015A production at Constancia totalled 233 million pounds (Mlb) of copper at an average total cash cost of US$1.16/lb produced net of credits. A concentrate inventory buildup at the mine through Q3/15 has now been sold. Peruvian production was augmented with an additional 91 Mlb of copper production from Manitoba. The Canadian operations also produced 228 Mlb of refined zinc.
A recent cost review stands to lower 2016E operating and capital spending by ~US$105 million (combined) versus recently provided 2016E cost guidance (with no effect on metal production guidance). We remain cognizant that Pampacancha-related deferrals stand to offset the timing of higher-grade ore feed, impacting Constancia’s medium-term production profile. However, given current market conditions, we are pleased to see Hudbay defer near-term capital-intensive development in Peru and Manitoba. Hudbay’s revised +2016E cost budget and restructured credit facilities stand to provide (much needed) financial flexibility. The Company is now better positioned to weather the currently weak commodity price environment. Related model updates have prompted a target price increase to $7.25 per share (from $6.75).
See Haywood Securities for the full report
Endeavour Mining Corp. (EDV-T, $11.86) – R&R Update Highlighted by Addition of Ity and Gains at Agbaou
Tara Hassan, [email protected], Danny Ochoa, Peng, [email protected]
Consolidated Reserves and Resources See a Big Increase - Endeavour announced year end proven and probable (P&P) reserves of 5.9 million oz Au and measured and indicated (M&I) resource of 11.0 million oz Au (on a 100% basis). This represents a year over year increase of 32% increase for reserves and 39% for resources. The bulk of this increase was driven by the inclusion of the Ity project (added 1.6 million oz Au and 3.1 million oz Au), however backing Ity out, Endeavour still managed to replace a significant portion of reserves and resources. In 2015 Endeavour replaced 61% of reserve depletion and 93% of resource depletion.
Agbaou Continues to Steal the Show - The greatest contribution to the reserve and resource replacement was Agbaou where a $5.8 million exploration program delineated 256 Koz of M&I resources and reserves jumped by 11%. Reserves at Agbaou are now 13% greater than at the start of production in 2014, an impressive feat given the limited exploration budgets since 2014. Importantly, through this exploration success Endeavour was able to fully replace the soft material mined in 2015, extending the mine life for free-dig oxide ore by another year. This is key in allowing Agbaou to maintain production levels over the next few years.
See Haywood Securities for the full report
Endeavour Mining Corp. (EDV-T, $12.14) – Youga Sale a Positive for Endeavour
Tara Hassan, [email protected], Danny Ochoa, Peng, [email protected]
Youga Sale Nets US$25.3 Million in Cash – Endeavour announced that it has sold its Youga project to MNG Gold (a privately owned Turkish gold exploration and development company). The transaction includes:
US$20 million for the asset
US$5.3 million for the cash on hand
1.8% Net smelter royalty on production beyond the current reserve. The buyback provision is based on an agreed-upon market value of the ounces at the time of purchase. Endeavour is not required to agree to a buyback, and there is no time trigger related to the buyback.

The Weekly Dig 3/4/16
Haywood Mining [email protected] Page 11
See Haywood Securities for the full report
Mandalay Resources Corp. (MND-T, $0.90) – MND Tables Updated Reserves and Resources: Replaces Depletion on a Consolidated Basis
Benjamin Asuncion [email protected]
Costerfield – Gold-equivalent reserves grew by 27%, net of depletion, which represents an additional year of production (now 3.2 years). Reserve growth was driven by successful infill and extensional drilling on the N and Cuffley lodes, in conjunction with more favourable economic parameters (USD:AUD exchange rate, lower operating and capital costs). Based on drilling of 18,439 metres of diamond core for US$2.5 million, this equated to a finding cost of US$20 per gold-equivalent ounce. Exploration in 2016 will focus on following-up on notable intercepts from three structures below the King Cobra fault.
Cerro Bayo – Despite significant infill and extensional drilling under Laguna Verde, the distance and orientation made it difficult to target the ore zones under the lake, and resulted in silver -equivalent reserves declining by 13% (reserve-supported mine life of 4.2 years). Based on drilling of 26,700 metres of diamond core for US$3.0 million, this equated to a finding cost of US$1.10 per silver -equivalent ounce. Management continues to remain optimistic on future additions. However, given the aforementioned challenges, drilling will be deferred until drill platforms can be developed from access drifts closer to the ore zones. Near-term exploration will focus on targets in the Brilliantes, Cerro Bayo Hill, and Laguna Verde Norte areas.
See Haywood Securities for the full report
Nevsun Resources Ltd. (NSU-T, $4.42) – Solid 2015 Paves the Way for Primary Copper-Zinc Production in H2/16
Stefan Ioannou, [email protected]
2015A copper production (in concentrate) totalled 135.9 Mlb at an average total cash cost of US$1.31/lb net of credits and excluding royalties (100% basis). This profile included 33.0 Mlb in Q4/15 -similar to the prior two quarters despite a notably lower average copper head grade, which was expected as mining at Bisha progresses through high-grade supergene copper ore towards primary copper-zinc ore. Despite lower grade, Q4/15A production benefited from stronger metallurgical performance and record mill throughput.
Nevsun exited 2015 with a US$434M cash balance (and no long-term debt). Acknowledging this cash balance remained essentially unchanged from September 30, 2015, we note that during Q4/15, in addition to maintaining a relatively low-cost production profile at Bisha, the Company continued to pay a peer-leading dividend (US$8.0 million ; 4.8% annualized yield), advance a zinc-circuit expansion project at Bisha (US$10.3 million ; now 94% complete; on schedule and under budget), advance Bisha’s life-of-mine optimization study (US$1.3 million ), and deliver very strong exploration results from a number of targets located in close proximity to the Bisha mill (i.e., Harena; US$1.1 million ). Hence, we look to Nevsun’s use of cash during Q4/15 as money very well spent.
See Haywood Securities for the full report
NexGen Energy Ltd. (NXE-V, $1.25) – Arrow Maiden Resource Smashes Our Expectations at 201.9 Mlb of U3O8 (2.63% U3O8)
Colin Healey, [email protected]

The Weekly Dig 3/4/16
Haywood Mining [email protected] Page 12
Huge Maiden Resource of 201.9 Mlb of U3O8 (3.48 million tonnes at average grade of 2.63% U3O8, inferred). – The new resource at Arrow represents the largest all-categories maiden resource in more than 15 years out of the Athabasca Basin, and in our view is clearly positioned as the largest undeveloped high-grade resource in this prolific region, underscoring Arrow ’s potentially strategic importance. The scale and grade of the maiden resource significantly exceed the metal inventory assumption underlying our valuation, which is based on a net present value (NPV)12% of a conceptual production model for a 10 Mlb of U3O8 per annum nominal production, underground mining operation, with a mine life just over 10 years. We will seek to review our conceptual model in the context of the new resource estimate for Arrow. The resource is underpinned by a super high-grade component of the A2 shear zone which contains 120.5 Mlb of U3O8 in just 410 kt of rock, for an average grade of 13.26% U3O8.
Robust Tolerance to Increasing Cutoff Grade – While the headline resource is stated at a 0.25% U3O8 cutoff grade based on a uranium price of US$65/lb of U3O8, the Arrow deposit demonstrates impressive resilience as the cutoff grade increases. For example, at a 1.0% U3O8 cutoff, the Arrow deposit retains 88.3% (178.3 Mlb of U3O8) of the contained uranium, while shedding 57.2% of the mass (almost 2 million tonnes), as average grade more than doubles to 5.43% U3O8. This characteristic should provide huge flexibility in economic study and decision-making when testing a range of uranium price and production rate scenarios as NexGen advances towards a potential prefeasibility study in 2017, and should easily support the low-cost production profile we outline in out mining concept.
See Haywood Securities for the full report
Oban Mining Corporation (OBM-T, $1.05) – Drilling at Windfall Continues to Highlight Upside Potential
Tara Hassan, [email protected], Danny Ochoa, Peng, [email protected]
This morning Oban announced results from 8 holes of its ongoing 55,000-metre drill program at its 100% owned Windfall Lake gold project located in Urban Barry Township, Quebec. Highlights include:
286.88 g/t gold over 2.0 metres in DDH OBM-16-584
22.32 g/t gold over 3.3 metres in DDH OBM-15-564
5.59 g/t gold over 7.4 metres in DDH OBM-15-564
7.49 g/t gold over 7.0 metres in DDH OBM-15-564
15.89 g/t gold over 2.8 metres in DDH OBM-16-582.
The latest results include intersections both above and below the Red Dog intrusion and have intersected what Oban believes could be a number of new mineralized lens.
See Haywood Securities for the full report
OceanaGold Corporation (OGC-T, OGC-AU; C$3.65) – OceanaGold Update: Haile Capex Rise Overshadows Exploration Success
Geordie Mark, [email protected], Benjamin [email protected]
Waihi Exploration – Since acquiring the project, exploration drilling (13,031 metres in H2/15, plus 3,907 metres year to date) focused on identifying extensions proximal to the underground mine, including Correnso Deeps, Daybreak, and Empire. Underground exploration drilling results appear encouraging for their potential to increase reserves. In total, four drill rigs are operating on surface where OceanaGold plans 34,000 metres of drilling in 2016 for a $10 million budget.

The Weekly Dig 3/4/16
Haywood Mining [email protected] Page 13
Forecasts – 2016: 417 koz of gold, plus 40.6 Mlb of copper production at a cash cost of US$567/oz. 2017: 570 koz of gold, plus 36.1 Mlb of copper at a cash cost of US$500/oz.
Target Price, Ratings – We are revising our per-share target price to $3.80 from $4.00 on the back of higher capex and costs, but maintaining our HOLD rating.
See Haywood Securities for the full report
Osisko Gold Royalties Ltd. (OR-T, $13.62) – Tweaking Estimates Ahead of 2015 Results
Tara Hassan, [email protected], Danny Ochoa, Peng, [email protected]
2015 Production in Line – Osisko released preliminary royalty production and revenue for 2015. Royalty production of 30,125 ounces came in above our estimate of 29,183 ounces on the back of 2.9% higher royalty production from Canadian Malartic. Revenue of $45.4 million was just ahead of our estimate of $44.4 million. Osisko reported dividend income from holdings in Labrador Iron Ore Royalty Corporation (LIF-T; not rated) of $5.9 million, in line with our estimate.
Look for Growth in 2016 – Guidance for 2016 was largely in line with our expectations (34,200 to 37,200 ounces, versus our estimate of 38,100). We have made minor revisions to our expectations for Veza, but our total estimated royalty production remains in line with the top end of guidance. We look for Éléonore and Island Gold mines to contribute royalty growth of 15% to 25% in 2016 and estimate free cash flow (before transactions) of nearly $50 million.
See Haywood Securities for the full report
Reservoir Minerals Inc. (RMC-V, $4.62) – Potential Lundin Involvement Stands to Expedite Epithermal Development
Stefan Ioannou, [email protected]
The purchase agreement stands to give Lundin a 75% interest (over time) in the high grade Cukaru Peki epithermal deposit, which generates a ~US$1.0B after-tax NAV12% at US$3.00/lb copper and US$1,200/oz gold (100% basis; Haywood conceptual model, in part based on 2020 Direct shipping ore [DSO] production start-up)—as well as additional upside exposure to a potential large scale porphyry discovery at depth. Lundin is well positioned to fund the transaction, noting the Company’s December 31, 2015 balance sheet included US$557M in cash, which is augmented by a US$350M undrawn revolving credit facility. Furthermore, long-term-debt of US$978M does not entail any significant principal repayments until 2020. Reservoir’s interest in the Timok project is not affected by the pending purchase agreement. Furthermore, we look favorably on Lundin’s potential involvement in Serbia, as it stands to bring greater focus to timely epithermal mine development at Cukaru Peki (versus Freeport’s focus on porphyry potential at depth).
See Haywood Securities for the full report
True Gold Mining Inc. (TGM-V, $0.50) – Win-Win as Endeavour Makes a Deal for Karma
Tara Hassan, [email protected], Danny Ochoa, Peng, [email protected]
This morning, Endeavour Mining (EDV-T, $12.00 Target Price, Buy Rating) announced a friendly acquisition of True Gold. The acquisition values True Gold at $0.57 per share, in line with our target price and a premium of 43.4% on yesterday’s close and a 32.7% on the 20 day VWAP. We view the transaction positively as it is affords True Gold shareholders an attractive valuation, lowers the risks related to a single asset company, and provides shareholders exposure to a growing mid-tier producer with significant exposure and experience in West Africa.

The Weekly Dig 3/4/16
Haywood Mining [email protected] Page 14
Highlights of the transaction include:
O All share transaction with each True Gold common share exchanged for 0.044 of an Endeavour Mining common share
O Values True Gold at approximately $0.57/share or $226 million based on yesterday's close.
O Premium of 43.4% based on yesterday's close and 32.7% on 20 day VWAP basis
O Transaction will include a US$15 million convertible bridge loan to True Gold which will replace the US$15 million of additional gold stream funding that was available from Franco Nevada (FNV -T, not rated) and Sandstorm (SSL-T, not rated).
O True Gold shareholders will represent 20.9% of Endeavour mining capital after the exercise of the La Mancha anti-dilution right.
See Haywood Securities for the full report
Radar Flashes
Technical Analysis – The Medium-Term Decline Is Still Not Over
Keith Edwards, Technical Advisor
By mid-February, we finally got the necessary “low-rally-retest” set up, and a relief rally of short-term degree got underway. This rally is just a countertrend bounce from the support level that dates back to the October 2014 low. The rally has not been impulsive, suggestive of serious demand returning to the market; rather it has been driven by short covering as the most heavily shorted stocks gained the most. Volume has been lacklustre throughout the rally. Market internals were strong for a couple of days but have since resorted to grinding stocks and indexes higher, trying to overcome selling pressure along the way. Overall sentiment has barely shown any life, indicating investors and portfolio managers are largely selling into the rally. This was confirmed Friday with reports that $2.8 billion had flowed from equity funds during the week, the 12th weekly outflow over the prior 13 weeks. On top of all that, short-term momentum is nearing overbought levels and is due to peak in early March, while medium-term momentum, which peaked in early January, remains under pressure and is not due to bottom until later in March. Our view remains that the wave down from the “failure” at S&P2104 will not be complete until the medium-term momentum bottoms in mid to late March. Further, that low may very well be in the S&P1750/30 area. Participate accordingly.
See Haywood Securities for the full report

The Weekly Dig 3/4/16
Haywood Mining [email protected] Page 15
Market Essentials
Companies in the News
Glencore Plc (GLEN-LON) announced its Q4/15 and 2015 financial results, which were headlined by a net loss attributable to shareholders of US$4.96 billion in 2015, reversing the US$2.31 billion profit of the previous year. The Company has cut its net debt by 15%, to $25.9 billion, by the end of December compared with a year earlier. Management is now aiming to sell $4 billion to $5 billion in assets this year, up from a previous goal of $3 billion to $4 billion, targeting a reduction in net debt to $17 billion to $18 billion this year, compared with its previous debt goal of $18 billion to $19 billion by the end of 2016. Glencore’s net debt stood at $29.6 billion as of June 30. Meanwhile, total capital expenditure was US$5.96 billion, 30% lower compared with 2014, with industrial capital expenditure consisting of US$5.7 billion.
Standard & Poor’s Ratings Services removed BHP Billiton (BHP-ASX) from CreditWatch and affirmed its A/A-1 long- and short-term corporate credit ratings following the Company’s move to change its dividend policy and its guidance on capital expenditure to protect its balance sheet amid current market conditions. The Anglo-Australian miner announced the shift in dividend policy last Tuesday, when it unveiled a $5.7 billion first-half net loss. In Australia, the shares fell 8.2%, the largest one-day drop since December 2008. Its London-listed shares have fallen 52% in the past 12 months. However, S&P noted it has kept the Company on negative outlook, stating it “reflects our view that the further weakness in market conditions, combined with uncertainty regarding BHP Billiton’s financial policy, may slow the recovery in its credit metrics over the coming 12 months. It also reflects the uncertainty around the environmental liability at Samarco.” Meanwhile, Samarco Mineração SA, a joint-venture firm formed by Vale SA (VALE-NYSE) and BHP Billiton, will pay approximately US$6.2 billion for damages caused by the breach of the tailings dam at the Samarco iron ore mine in Brazil in November 2015 that killed 19 people. BHP Billiton and Vale confirmed the deal.
In addition, BHP Billiton changed its iron ore production strategy, with CEO Andrew Mackenzie saying that a renewed focus on cash flows means that the Company will no longer be reliant on higher production volumes. “High quality medium-to-longer term projects will only be pursued at a time when they add greater value than all other options, and do not exacerbate the current supply-demand imbalances,” Mackenzie added.
Fresnillo Plc (FRES-LON) reported its 2015 profit of US$69.4 million for the year ended December 31, down 40% from the US$117.1 million recorded in 2014, which was significantly impacted by the devaluation of the Mexican peso against the U.S. dollar, gold hedging, and the re-evaluation of its silver stream. Revenue was up to $1.44 billion from $1.43 billion as production of gold and silver increased. Net cash from operating activities was $542.9 million, against $121.6 million in 2014. Fresnillo reported capital expenditure of $474 million and exploration spending of $140 million.
According to Randgold Resources Ltd. (GOLD-NASDAQ) CEO Mark Bristow, a rebound in gold prices in 2016 could be doing more damage than good for the producers, Bloomberg News reported. “The industry could do with a lower gold price for longer because [US]$1,200 doesn’t fundamentally change the fabric of our business and the inherent structural damage that’s embedded in our business,” Bristow noted.

The Weekly Dig 3/4/16
Haywood Mining [email protected] Page 16
Completed Equity Financings 2013 to Date (C$ million and average transaction size)
Source: Capital IQ
Announced Equity/Debt Raisings and Streaming Deals for the Week (> $500,000)
Source: Capital IQ and Haywood Securities
$0
$10
$20
$30
$40
$50
$60
$70
$0
$2,000
$4,000
$6,000
$8,000
$10,000
Jan
-14
Feb
-14
Mar
-14
Ap
r-1
4
May
-14
Jun
-14
Jul-
14
Au
g-1
4
Sep
-14
Oct
-14
No
v-1
4
De
c-1
4
Jan
-15
Feb
-15
Mar
-15
Ap
r-1
5
May
-15
Jun
-15
Jul-
15
Au
g-1
5
Sep
-15
Oct
-15
No
v-1
5
De
c-1
5
Jan
-16
Feb
-16
Mar
-16
Ave
rage
Siz
e (
C$
Mill
ion
)
Val
ue
(C
$ M
illio
n)
Monthly ($millions)
Cumulative ($millions)
Average Size ($millions)
Date Company Ticker Value Price 20 Day VWAP
Prem /
Disc Details
Equity Raisings4-Mar-16 Rogue Resources Inc. (TSXV:RRS) TSXV:RRS C$1.0 M $0.10 $0.10 4.4% sh at C$0.10/sh and FT sh plus warr at C$0.12/sh for 2 years. 4-Mar-16 Honey Badger Exploration Inc. (TSXV:TUF) TSXV:TUF C$0.8 M $0.04 $0.03 47.0% 13.1M FT sh at C$0.04/sh plus warr at C$0.07/sh for 3 years & 10M sh at C$0.03/sh 4-Mar-16 Resolve Ventures, Inc. (TSXV:RSV) TSXV:RSV C$0.5 M $0.05 $0.06 (14.9)% 10M sh at C$0.05/sh plus warr at $0.10/sh for 3 years 3-Mar-16 Vendetta Mining Corp. (TSXV:VTT) TSXV:VTT C$1.5 M $0.05 $0.05 1.0% 30M sh at US$0.05/sh plus warr at C$0.10/sh for 2 years 3-Mar-16 Gold Bullion Development Corp. TSXV:GBB C$0.8 M $0.05 $0.05 (7.0)% 15M sh at C$0.05/sh plus warr for C$0.10 for 2 years 3-Mar-16 Bravada Gold Corporation (TSXV:BVA) TSXV:BVA C$0.7 M $0.05 $0.06 (15.1)% 10M sh at C$0.05/sh plus warr for C$0.10/sh for 5 years 2-Mar-16 Novo Resources Corp. (OTCPK:NSRP.F) OTCPK:NSRP.F C$2.4 M $0.60 $0.58 3.5% 3.9M sh at C$0.60/sh plus warr at $0.85/sh for 2 years 2-Mar-16 Banyan Gold Corp. (TSXV:BYN) TSXV:BYN C$0.8 M NA $0.06 NA More details to follow2-Mar-16 International Lithium Corp. (TSXV:ILC) TSXV:ILC C$0.7 M $0.08 $0.06 26.6% 8.1M sh at C$0.08/sh plus ½ warr at $0.12/sh for 3 years 1-Mar-16 European Uranium Resources Ltd. TSXV:EUU C$2.0 M $0.01 $0.01 31.8% 20M sh at C$0.10/sh (post consolidation) 1-Mar-16 Telson Resources Inc. (TSXV:TSN) TSXV:TSN C$1.5 M $0.12 $0.12 2.7% 12.5M sh at C$0.12/sh plus ½ warr at C$0.12/sh for 2 years
Debt RaisingsNo debt finances this week
Premium/discount based on closing price one day prior to announcement
Premium/discount based on common shares (where applicable) or quoted security
E = equity; D = Debt; sh = shares; FT = flow through; warr = warrant

The Weekly Dig 3/4/16
Haywood Mining [email protected] Page 17
Weekly Commodities / Indices / Exchange Rates
Metal and Currency Prices for the Week
Source: Haywood Securities
12,500
13,000
13,500
2/29 3/4
S&P/TSX Composite IndexLast: 13,213
170
2/29 3/4
S&P/TSX Global Gold IndexLast: 181.4
16,500
17,000
2/29 3/4
Dow Jones Industrial AverageLast: 17,007
530
550
570
2/29 3/4
S&P/TSX Venture Comp IndexLast: 562
60
80
2/29 3/4
S&P/TSX Global Base Metals IndexLast: 73.6
1,900
2,000
2/29 3/4
S&P 500 IndexLast: 2,000
Name Close 1Wk Δ % 5 Day Trend 52W H/L 1W H/L
Gold Spot 1,259 35.64 2.83% 1,280 1,264
US$/oz 1,046 1,223
Silver Spot 15.49 0.80 5.14% 17.78 15.49
US$/oz 13.65 14.70
Platinum Spot 979 64.45 6.59% 1,187 979
US$/oz 811 914
Palladium Spot 556 71.25 12.81% 830 556
US$/oz 452 485
Copper Future 2.28 0.15 6.39% 2.94 2.28
US$/lb 1.95 2.13
Nickel Spot 4.23 0.39 9.14% 6.54 4.23
US$/lb 3.43 3.84
Lead Spot 0.85 0.06 6.78% 0.97 0.85
US$/lb 0.70 0.79
Zinc Spot 0.84 0.04 5.24% 1.10 0.84
US$/lb 0.66 0.80
Aluminum Spot 0.73 0.01 1.73% 0.89 0.73
US$/lb 0.65 0.72
Iron Ore Spot 52 5.50 10.58% 140 79
US$/t 78 78
Newcastle Coal 50 0.95 1.90% 62 50
US$/t 48 48
CAAP Coal 44 (0.57) (1.31)% 53 44
US$/t 41 44
Uranium Spot 31.80 (0.20) (0.63)% 37 32
US$/lb 37 32
WTI 36 3.44 9.50% 66 36
US$/bbl 29 33
Brent 39 3.48 8.94% 73 39
US$/bbl 29 35
Henry Hub 1.67 (0.12) (7.18)% 3.19 1.79
US$/MMBtu 1.61 1.64
ENER
GY
BA
SE M
ETA
LSP
REC
IOU
S M
ETA
LS
Name Close 1Wk Δ % 5 Day Trend 52W H/L 1W H/L
TSX 13,213 415 3.14% 15,525 13,213
11,531 12,798
TSXV 562 24.20 4.30% 708 562
466 538
Canadian Dollar 1.33 (0.02) (1.42)% 1.47 1.35
1.19 1.33
Euro 1.10 0.01 0.70% 1.17 1.10
1.05 1.09
China Renminbi 6.51 (0.03) (0.50)% 6.60 6.55
6.18 6.51
Mexican Peso 17.78 (0.49) (2.77)% 19.44 18.27
14.76 17.78
Peruvian New Sol 3.46 (0.07) (1.92)% 3.54 3.52
3.06 3.46
S. African Rand 15.35 (0.82) (5.34)% 17.92 16.17
11.67 15.35
Australian Dollar 0.74 0.03 4.08% 0.82 0.74
0.68 0.71
Japanese Yen 113.9 (0.13) (0.11)% 125.9 114.0
111.0 112.7
Chilean Peso 680 (11.53) (1.70)% 733 696
593 680
British Pound 1.42 0.04 2.53% 1.59 1.42
1.38 1.39
Swiss Franc 0.99 (0.00) (0.41)% 1.03 1.00
0.91 0.99
Norwegian Krone 8.48 (0.21) (2.43)% 8.99 8.69
7.29 8.48
Turkish Lira 2.91 (0.09) (3.10)% 3.08 3.00
2.54 2.91
Indian Rupee 67.10 (1.54) (2.29)% 68.79 68.63
62.10 67.10
EXC
HA
NG
E R
ATE
SIN
DIC
IES

The Weekly Dig 3/4/16
Haywood Mining [email protected] Page 18
Commodities and ETFS: A Week in Action
Gold - 1-Year US$/oz (left) and Total ETF Holdings (right)
Spot: Gain (+2.9%) for the week
ETF Holdings: 55,329,918 ounces, up 1,360,308 ounces for the week
Silver - 1-Year US$/oz (left) and Total ETF Holdings (right)
Spot: Gain (+5.4%) for the week
ETF Holdings: 605,829,797 ounces, up 6,556,007 ounces for the week
Platinum - 1-Year US$/oz (left) and Total ETF Holdings (right)
Spot: Gain (+7.0%) for the week
ETF Holdings: 2,317,305 ounces, up 3,716 ounces for the week
Palladium - 1-Year US$/oz (left) and Total ETF Holdings (right)
Spot: Gain (+14.7%) for the week
ETF Holdings: 2,205,731 ounces, up 8,291 ounces for the week
Copper - 1-Year US$/lb (left) and LME Inventory (right)
Futures: Gain (+6.8%) for the week
LME Copper: 186,700 tonnes, down 10,525 tonnes for the week
Nickel - 1-Year US$/lb (left) and LME Inventory (right)
Spot: Gain (+10.1%) for the week
LME Nickel: 431,874 tonnes, down 10,092 tonnes for the week
$1,000
$1,100
$1,200
$1,300
Mar
-15
Ap
r-1
5
May
-15
Jun
-15
Jul-
15
Au
g-1
5
Sep
-15
Oct
-15
No
v-15
Dec
-15
Jan
-16
Feb
-16
Mar
-16
Gold ($/oz)
Price
100D MA
46
47
48
49
50
51
52
53
54
55
Mar
-15
Ap
r-1
5
May
-15
Jun
-15
Jul-
15
Au
g-1
5
Sep
-15
Oct
-15
No
v-15
Dec
-15
Jan
-16
Feb
-16
Gold ETF Holdings (Moz)
$13.00
$16.00
$19.00
Mar
-15
Ap
r-1
5
May
-15
Jun
-15
Jul-
15
Au
g-1
5
Sep
-15
Oct
-15
No
v-15
Dec
-15
Jan
-16
Feb
-16
Silver ($/oz)
Price
100D MA
590
600
610
620
630
Mar
-15
Ap
r-1
5
May
-15
Jun
-15
Jul-
15
Au
g-1
5
Sep
-15
Oct
-15
No
v-15
Dec
-15
Jan
-16
Feb
-16
Silver ETF Holdings (Moz)
$800
$850
$900
$950
$1,000
$1,050
$1,100
$1,150
$1,200
$1,250
$1,300
Mar
-15
Ap
r-1
5
May
-15
Jun
-15
Jul-
15
Au
g-1
5
Sep
-15
Oct
-15
No
v-15
Dec
-15
Jan
-16
Feb
-16
Mar
-16
Platinum ($/oz)
Price
100D MA
2.3
2.4
2.5
2.6
2.7
2.8
2.9
Mar
-15
Ap
r-1
5
May
-15
Jun
-15
Jul-
15
Au
g-1
5
Sep
-15
Oct
-15
No
v-15
Dec
-15
Jan
-16
Feb
-16
Platinum ETF Holdings (Moz)
$460
$510
$560
$610
$660
$710
$760
$810
$860
Mar
-15
Ap
r-1
5
May
-15
Jun
-15
Jul-
15
Au
g-1
5
Sep
-15
Oct
-15
No
v-15
Dec
-15
Jan
-16
Feb
-16
Mar
-16
Palladium ($/oz)
Price
100D MA
2.1
2.2
2.3
2.4
2.5
2.6
2.7
2.8
2.9
3.0
3.1
Mar
-15
Ap
r-1
5
May
-15
Jun
-15
Jul-
15
Au
g-1
5
Sep
-15
Oct
-15
No
v-15
Dec
-15
Jan
-16
Feb
-16
Palladium ETF Holdings (Moz)
$1.90
$2.10
$2.30
$2.50
$2.70
$2.90
$3.10
Mar
-15
Ap
r-1
5
May
-15
Jun
-15
Jul-
15
Au
g-1
5
Sep
-15
Oct
-15
No
v-15
Dec
-15
Jan
-16
Feb
-16
Mar
-16
Copper ($/lb)
Price100D MAPrice
190,000
210,000
230,000
250,000
270,000
290,000
310,000
330,000
350,000
370,000
Mar
-15
Ap
r-1
5
May
-15
Jun
-15
Jul-
15
Au
g-1
5
Sep
-15
Oct
-15
No
v-1
5
De
c-1
5
Jan
-16
Feb
-16
Mar
-16
LME Copper Inventories (t)
$3.50
$4.00
$4.50
$5.00
$5.50
$6.00
$6.50
$7.00
$7.50
Mar
-15
Ap
r-1
5
May
-15
Jun
-15
Jul-
15
Au
g-1
5
Sep
-15
Oct
-15
No
v-15
Dec
-15
Jan
-16
Feb
-16
Mar
-16
Nickel ($/lb)
Price
100D MA
380,000
390,000
400,000
410,000
420,000
430,000
440,000
450,000
460,000
470,000
480,000
Mar
-15
Ap
r-1
5
May
-15
Jun
-15
Jul-
15
Au
g-1
5
Sep
-15
Oct
-15
No
v-15
Dec
-15
Jan
-16
Feb
-16
Mar
-16
LME Nickel Inventories (t)

The Weekly Dig 3/4/16
Haywood Mining [email protected] Page 19
Lead - 1-Year US$/lb (left) and LME Inventory (right)
Spot: Gain (+7.3%) for the week
LME Lead: 208,425 tonnes, down 6,875 tonnes for the week
Zinc - 1-Year US$/lb (left) and LME Inventory (right)
Spot: Gain (+5.5%) for the week
LME Zinc: 465,500 tonnes, down 17,375 tonnes for the week
Iron – 1-Year US$/t 58% Fe (left) and 62% Fe (right)
58% Fe Iron Ore: Gain (+3.1%) for the week
62% Fe Iron Ore: Gain (+11.8%) for the week
Thermal Coal – 1-Year US$/t Central Appalachian (left) and Newcastle (right)
CAPP Futures: Loss (-1.7%) for the week
Newcastle Thermal Futures: Gain (+1.6%) for the week
Uranium – 1-Year US$/lb Short-Term (left) and Long-Term (right)
Uranium Spot: Loss -2.7%) for the week
Uranium Long-Term: Unchanged
Source: Bloomberg, UxC Consulting, and Haywood Securities
$0.70
$0.75
$0.80
$0.85
$0.90
$0.95
$1.00
Mar
-15
Ap
r-1
5
May
-15
Jun
-15
Jul-
15
Au
g-1
5
Sep
-15
Oct
-15
No
v-15
Dec
-15
Jan
-16
Feb
-16
Mar
-16
Lead ($/lb)Price
100D MA
120,000
140,000
160,000
180,000
200,000
220,000
240,000
Mar
-15
Ap
r-1
5
May
-15
Jun
-15
Jul-
15
Au
g-1
5
Sep
-15
Oct
-15
No
v-15
Dec
-15
Jan
-16
Feb
-16
Mar
-16
LME Lead Inventories (t)
$0.65
$0.70
$0.75
$0.80
$0.85
$0.90
$0.95
$1.00
$1.05
$1.10
$1.15
Mar
-15
Ap
r-1
5
May
-15
Jun
-15
Jul-
15
Au
g-1
5
Sep
-15
Oct
-15
No
v-15
Dec
-15
Jan
-16
Feb
-16
Mar
-16
Zinc ($/lb)
Price100D MAPrice
400,000
500,000
600,000
700,000
Mar
-15
Ap
r-1
5
May
-15
Jun
-15
Jul-
15
Au
g-1
5
Sep
-15
Oct
-15
No
v-15
Dec
-15
Jan
-16
Feb
-16
Mar
-16
LME Zinc Inventories (t)
$30
$40
$50
$60
$70
Mar
-15
Ap
r-1
5
May
-15
Jun
-15
Jul-
15
Au
g-1
5
Sep
-15
Oct
-15
No
v-15
Dec
-15
Jan
-16
58% Iron Ore ($/t)
Price
100D MA
$35
$40
$45
$50
$55
$60
$65
$70
$75
Mar
-15
Ap
r-1
5
May
-15
Jun
-15
Jul-
15
Au
g-1
5
Sep
-15
Oct
-15
No
v-15
Dec
-15
Jan
-16
Feb
-16
Mar
-16
62% Iron Ore ($/t)
Price
100D MA
$40
$42
$44
$46
$48
$50
$52
$54
Mar
-15
Ap
r-1
5
May
-15
Jun
-15
Jul-
15
Au
g-1
5
Sep
-15
Oct
-15
No
v-15
Dec
-15
Jan
-16
Feb
-16
Central App Coal ($/t)
Price
100D MA
$35
$40
$45
$50
$55
Mar
-15
Ap
r-1
5
May
-15
Jun
-15
Jul-
15
Au
g-1
5
Sep
-15
Oct
-15
No
v-15
Dec
-15
Jan
-16
Feb
-16
Mar
-16
Newcastle Coal (AUD/t)
Price
100D MA
$33
$38
Mar
-15
Ap
r-1
5
May
-15
Jun
-15
Jul-
15
Au
g-1
5
Sep
-15
Oct
-15
No
v-1
5
Dec
-15
Jan
-16
Feb
-16
Mar
-16
Uranium Spot ($/lb)
Price
100D MA
$42
$46
$50
Mar
-15
Ap
r-1
5
May
-15
Jun
-15
Jul-
15
Au
g-1
5
Sep
-15
Oct
-15
No
v-15
Dec
-15
Jan
-16
Feb
-16
Mar
-16
Uranium Long-Term ($/lb)
Price
100D MA

The Weekly Dig 3/4/16
Haywood Mining [email protected] Page 20
Equities: Weekly Performances
S&P TSX Global Mining Index – Top and Bottom Performance (upper) and Constituent Performance (lower)
Source: Capital IQ and Haywood Securities
Top Companies Close $∆ %∆
HudBay Minerals, Inc. 5.52 1.73 46%
First Quantum Minerals Ltd. 7.04 2.18 45%
CONSOL Energy Inc. 10.58 2.74 35%
Teck Resources Limited 10.26 2.60 34%
Freeport-McMoRan Inc. 9.74 2.31 31%
Vedanta Limited 5.37 1.24 30%
Coeur Mining, Inc. 4.52 0.97 27%
Pretium Resources Inc. 7.51 1.47 24%
BHP Billiton plc 24.51 4.71 24%
BHP Billiton Limited 27.68 5.12 23%
1WkBottom Companies Close $∆ %∆
Torex Gold Resources Inc 1.62 (0.11) (6)%
Franco-Nevada Corporation 76.33 (3.76) (5)%
Agnico Eagle Mines Limited 45.67 (1.05) (2)%
Centerra Gold Inc. 7.20 (0.13) (2)%
Guyana Goldfields Inc. 4.25 (0.03) (1)%
China Gold International Resources Corp Ltd 2.22 - -
Barrick Gold Corporation 18.28 0.01 0%
IAMGOLD Corp. 3.20 0.01 0%
Osisko Gold Royalties Ltd. 13.95 0.05 0%
Detour Gold Corporation 21.18 0.12 1%
1Wk
Ticker Company Close $∆ %∆ High Low Ticker Company Close $∆ %∆ High Low
TSX:AEM Agnico Eagle Mines Limited 45.67 (1.05) (2)% 51.49 27.63 TSX:IVN Ivanhoe Mines Ltd. 0.81 0.13 19% 1.36 0.53
TSX:ASR Alacer Gold Corp. 2.73 0.06 2% 3.23 2.08 NasdaqGS:KALU Kaiser Aluminum Corporation 80.46 2.81 4% 88.92 70.14
TSX:AGI Alamos Gold, Inc. 7.03 1.21 21% 7.25 3.27 TSX:K Kinross Gold Corporation 3.98 0.07 2% 4.63 1.79
NYSE:AA Alcoa Inc. 9.57 0.70 8% 14.56 6.14 TSX:KGI Kirkland Lake Gold Inc. 8.61 0.73 9% 8.68 4.49
NasdaqGS:ARLP Alliance Resource Partners LP 12.46 2.24 22% 38.36 9.95 TSX:LSG Lake Shore Gold Corp. 1.82 0.06 3% 1.94 0.88
TSX:ALS Altius Minerals Corp. 9.98 0.57 6% 15.47 7.39 TSX:LUC Lucara Diamond Corp. 2.49 0.06 2% 2.59 1.42
NYSE:ACH Aluminum Corporation Of China Limited 9.41 0.09 1% 17.44 6.87 TSX:LUN Lundin Mining Corporation 4.29 0.57 15% 6.46 2.98
NYSE:AU AngloGold Ashanti Ltd. 12.92 0.77 6% 13.58 5.64 TSX:MAG MAG Silver Corp. 10.37 0.87 9% 11.42 6.90
TSX:AKG Asanko Gold Inc. 2.87 0.23 9% 2.95 1.59 TSX:MDI Major Drilling Group International Inc. 7.10 0.98 16% 7.49 3.55
TSX:BTO B2Gold Corp. 1.69 0.24 17% 2.21 0.86 NYSE:MTRN Materion Corporation 25.96 0.22 1% 41.85 20.62
TSX:ABX Barrick Gold Corporation 18.28 0.01 0% 19.99 7.89 TSX:NSU Nevsun Resources Ltd. 4.65 0.23 5% 5.35 3.27
NYSE:BHP BHP Billiton Limited 27.68 5.12 23% 52.46 18.46 TSX:NGD New Gold, Inc. 5.00 0.75 18% 5.04 2.52
NYSE:BBL BHP Billiton plc 24.51 4.71 24% 50.33 16.36 NYSE:NEM Newmont Mining Corporation 26.11 0.76 3% 27.90 15.39
TSX:CCO Cameco Corporation 16.66 0.48 3% 21.44 14.56 TSX:NG NovaGold Resources Inc. 6.69 0.21 3% 6.95 3.42
TSX:CG Centerra Gold Inc. 7.20 (0.13) (2)% 8.67 5.05 TSX:OGC OceanaGold Corporation 3.76 0.17 5% 4.01 1.79
TSX:CGG China Gold International Resources Corp Ltd 2.22 - - 2.58 1.30 TSX:OR Osisko Gold Royalties Ltd. 13.95 0.05 0% 18.64 12.39
NYSE:CDE Coeur Mining, Inc. 4.52 0.97 27% 6.35 1.62 TSX:PAA Pan American Silver Corp. 13.50 0.48 4% 13.66 7.77
NYSE:BVN Compañía de Minas Buenaventura S.A.A. 5.51 0.33 6% 12.51 3.30 TSX:PG Premier Gold Mines Limited 3.26 0.07 2% 3.52 1.65
NYSE:CMP Compass Minerals International Inc. 68.72 0.67 1% 95.68 66.30 TSX:PVG Pretium Resources Inc. 7.51 1.47 24% 9.05 5.57
NYSE:CNX CONSOL Energy Inc. 10.58 2.74 35% 34.14 4.54 TSX:P Primero Mining Corp. 2.25 0.07 3% 5.51 1.94
NYSE:CSTM Constellium N.V 6.23 1.02 20% 20.81 3.38 NasdaqGS:GOLD Randgold Resources Limited 91.01 1.63 2% 93.67 54.88
TSX:DGC Detour Gold Corporation 21.18 0.12 1% 22.82 9.08 NYSE:RIO Rio Tinto plc 30.32 4.80 19% 47.37 21.89
TSX:DDC Dominion Diamond Corporation 16.02 2.30 17% 24.60 9.96 NasdaqGS:RGLD Royal Gold, Inc. 48.50 3.68 8% 69.00 24.68
TSX:ELD Eldorado Gold Corporation 4.63 0.71 18% 6.68 2.67 TSX:SSL Sandstorm Gold Ltd. 4.16 0.33 9% 4.71 2.82
NasdaqGS:GSM Ferroglobe PLC 9.33 1.68 22% 13.17 6.90 TSX:SMF SEMAFO Inc. 4.66 0.15 3% 4.96 2.46
TSX:FR First Majestic Silver Corp. 6.50 0.25 4% 7.78 3.50 NYSE:SBGL Sibanye Gold Limited 13.93 0.41 3% 14.67 4.07
TSX:FM First Quantum Minerals Ltd. 7.04 2.18 45% 19.83 2.15 TSX:SSO Silver Standard Resources Inc. 8.93 1.46 20% 10.56 5.22
TSX:FVI Fortuna Silver Mines Inc. 5.20 0.58 13% 5.22 2.65 TSX:SLW Silver Wheaton Corp. 21.95 1.10 5% 25.69 14.51
TSX:FNV Franco-Nevada Corporation 76.33 (3.76) (5)% 85.86 49.96 NYSE:SCCO Southern Copper Corp. 26.94 2.31 9% 33.31 21.55
NYSE:FCX Freeport-McMoRan Inc. 9.74 2.31 31% 23.97 3.52 NYSE:SWC Stillwater Mining Company 9.64 1.68 21% 15.07 4.99
NYSE:GFI Gold Fields Ltd. 4.10 0.03 1% 4.71 2.04 TSX:THO Tahoe Resources Inc. 12.65 0.63 5% 18.65 9.45
TSX:G Goldcorp Inc. 20.17 1.44 8% 25.23 13.55 TSX:TCK.B Teck Resources Limited 10.26 2.60 34% 20.14 3.65
TSX:GUY Guyana Goldfields Inc. 4.25 (0.03) (1)% 4.74 2.48 TSX:TXG Torex Gold Resources Inc 1.62 (0.11) (6)% 1.83 0.85
NYSE:HL Hecla Mining Co. 2.66 0.18 7% 3.37 1.45 TSX:TRQ Turquoise Hill Resources Ltd. 3.51 0.50 17% 5.80 2.30
TSX:HBM HudBay Minerals, Inc. 5.52 1.73 46% 12.61 2.26 NYSE:VEDL Vedanta Limited 5.37 1.24 30% 14.43 3.52
TSX:IMG IAMGOLD Corp. 3.20 0.01 0% 3.55 1.50 TSX:YRI Yamana Gold, Inc. 4.12 0.45 12% 5.28 1.89
NYSE:YZC Yanzhou Coal Mining Co. Ltd. 4.93 0.73 17% 12.24 3.66
52Wk1Wk 52Wk 1Wk

The Weekly Dig 3/4/16
Haywood Mining [email protected] Page 21
Upcoming Macroeconomic News
Source: Bloomberg
Date Event Period Survey Prior
Relevance
(%) Date Event Period Survey Prior
Relevance
(%)
United States Canada
03/07/2016 Labor Market Conditions Index Feb -- 0.4 8.87097 03/07/2016 Bloomberg Nanos Confidence 4-Mar -- 53.6 2
03/07/2016 Consumer Credit Jan $16.750b $21.267b 41.129 03/08/2016 Housing Starts Feb -- 165.9k 80
03/08/2016 NFIB Small Business Optimism Feb 94.2 93.9 62.0968 03/08/2016 Building Permits MoM Jan -- 11.30% 73
03/09/2016 MBA Mortgage Applications 4-Mar -- -4.80% 92.3077 03/09/2016 Bank of Canada Rate Decision 9-Mar 0.50% 0.50% 98
03/09/2016 Wholesale Inventories MoM Jan -0.20% -0.10% 80.6452 03/10/2016 Capacity Utilization Rate 4Q -- 82.00% 46
03/09/2016 Wholesale Trade Sales MoM Jan -0.10% -0.30% 9.67742 03/10/2016 New Housing Price Index MoM Jan -- 0.10% 66
03/10/2016 Initial Jobless Claims 5-Mar -- 278k 98.3871 03/10/2016 New Housing Price Index YoY Jan -- 1.60% 15
03/10/2016 Continuing Claims 27-Feb -- 2257k 68.871 03/11/2016 Unemployment Rate Feb -- 7.20% 88
03/10/2016 Bloomberg March United States 0 03/11/2016 Net Change in Employment Feb -- -5.7k 85
03/10/2016 Bloomberg Consumer Comfort 6-Mar -- 43.6 66.129 03/11/2016 Full Time Employment Change Feb -- 5.6 37
03/10/2016 Household Change in Net Worth 4Q -- -$1232b 10.4839 03/11/2016 Part Time Employment Change Feb -- -11.3 29
03/10/2016 Monthly Budget Statement Feb -$200.0b -- 75.8065 03/11/2016 Participation Rate Feb -- 65.9 32
03/11/2016 Import Price Index MoM Feb -0.80% -1.10% 78.2258 03/11/2016 Bloomberg March Canada Economic 0
03/11/2016 Import Price Index YoY Feb -6.50% -6.20% 33.871

The Weekly Dig 3/4/16
Haywood Mining [email protected] Page 22
Comparables Tables
Precious Metals Comparables – Consensus Estimates
Source: Capital IQ and Haywood Securities
Shares Market Working Enterprise
Company Symbol Price O/S Capitalization Cash Capital Debt Value 2015E 2016E Number of
(millions) (millions) (millions) (millions) (millions) (millions) CFPS CFPS Estimates 2015E 2016E 2015E 2016E 2015E 2016E
Senior Precious Metals Producers
Agnico Eagle Mines Limited TSX:AEM C$ 45.75 217.7 US$ 7,465 US$ 163 US$ 518 US$ 1,118 US$ 8,066 US$ 3.15 US$ 2.86 16 10.9x 12.0x 11.8x 13.0x 10.6x 11.4x
AngloGold Ashanti Ltd. NYSE:AU C$ 18.99 406.1 US$ 5,782 US$ 485 US$ 643 US$ 2,637 US$ 7,776 US$ 2.56 US$ 3.20 7 5.6x 4.4x 7.5x 6.0x 6.7x 5.6x
Barrick Gold Corporation TSX:ABX C$ 18.28 1165.1 US$ 15,967 US$ 2,455 US$ 3,621 US$ 9,653 US$ 21,999 US$ 2.07 US$ 1.80 12 6.6x 7.6x 9.1x 10.5x 6.7x 6.9x
Compañía de Minas Buenaventura S.A.A. NYSE:BVN C$ 7.35 254.2 US$ 1,401 US$ 79 (US$ 181) - US$ 1,582 US$ 0.49 US$ 1.01 3 11.3x 5.5x 12.7x 6.2x 4.1x 2.9x
Eldorado Gold Corporation TSX:ELD C$ 4.63 715.7 US$ 2,484 US$ 405 US$ 456 US$ 589 US$ 2,617 US$ 0.30 US$ 0.27 13 11.6x 12.6x 12.2x 13.3x 8.9x 11.9x
Fresnillo PLC LSE:FRES C$ 18.19 736.9 US$ 10,051 US$ 500 US$ 1,073 US$ 797 US$ 9,775 US$ 0.61 US$ 0.83 6 22.3x 16.5x 21.6x 16.0x 16.6x 13.9x
Gold Fields Ltd. NYSE:GFI C$ 5.85 775.3 US$ 3,401 US$ 440 US$ 386 US$ 1,804 US$ 4,819 US$ 0.71 US$ 1.10 7 6.1x 4.0x 8.7x 5.7x 5.1x 5.3x
Goldcorp Inc. TSX:G C$ 20.17 830.0 US$ 12,551 US$ 383 US$ 282 US$ 2,476 US$ 14,745 US$ 1.64 US$ 1.63 14 9.2x 9.3x 10.8x 10.9x 8.4x 10.3x
Kinross Gold Corporation TSX:K C$ 3.98 1147.6 US$ 3,424 US$ 1,056 US$ 1,590 US$ 1,732 US$ 3,566 US$ 0.64 US$ 0.78 14 4.7x 3.8x 4.9x 4.0x 4.3x 3.6x
Newcrest Mining Limited ASX:NCM C$ 17.04 766.0 US$ 9,783 US$ 105 US$ 327 US$ 2,614 US$ 12,070 US$ 1.21 US$ 1.32 6 10.6x 9.7x 13.0x 11.9x 9.9x 9.9x
Newmont Mining Corporation NYSE:NEM C$ 34.83 529.2 US$ 13,816 US$ 2,801 US$ 3,567 US$ 6,070 US$ 16,319 US$ 4.40 US$ 3.47 8 5.9x 7.5x 7.0x 8.9x 5.8x 6.8x
Randgold Resources Limited LSE:RRS C$ 125.50 93.5 US$ 8,795 US$ 214 US$ 384 US$ 3 US$ 8,414 US$ 3.61 US$ 4.62 8 26.1x 20.4x 25.0x 19.5x 21.7x 17.7x
Yamana Gold, Inc. TSX:YRI C$ 4.12 947.0 US$ 2,925 US$ 249 US$ 186 - US$ 2,739 US$ 0.46 US$ 0.58 14 6.8x 5.3x 6.3x 5.0x 4.7x 4.3x
Group Average - Senior Producers 10.6x 9.1x 11.6x 10.1x 8.7x 8.5x
Group Average - Senior Producers (excluding high/low) 9.7x 8.6x 11.0x 9.8x 8.0x 8.2x
Intermediate Precious Metals Producers
Acacia Mining plc LSE:ACA C$ 5.39 410.1 US$ 1,656 US$ 233 US$ 314 US$ 99 US$ 1,442 US$ 0.41 US$ 0.58 10 9.8x 7.0x 8.5x 6.1x 8.1x 5.1x
Alacer Gold Corp. TSX:ASR C$ 2.73 291.9 US$ 597 US$ 361 US$ 404 - US$ 193 US$ 0.39 US$ 0.21 9 5.2x 9.6x 1.7x 3.1x 1.7x 2.7x
Alamos Gold Inc. TSX:AGI C$ 7.03 255.5 US$ 1,347 US$ 403 US$ 494 US$ 313 US$ 1,166 US$ 0.23 US$ 0.42 12 23.3x 12.4x 20.1x 10.7x 18.3x 9.3x
B2Gold Corp. TSX:BTO C$ 1.69 927.1 US$ 1,175 US$ 87 US$ 112 US$ 406 US$ 1,468 US$ 0.17 US$ 0.21 14 7.5x 6.0x 9.4x 7.5x 8.8x 6.5x
Centamin Plc LSE:CEY C$ 1.83 1146.1 US$ 1,571 US$ 191 US$ 310 - US$ 1,260 US$ 0.15 US$ 0.17 5 8.9x 7.9x 7.1x 6.4x 7.5x 6.3x
Centerra Gold Inc. TSX:CG C$ 7.20 239.4 US$ 1,292 US$ 542 US$ 768 - US$ 524 US$ 1.22 US$ 0.93 4 4.4x 5.8x 1.8x 2.4x 1.5x 1.8x
Detour Gold Corporation TSX:DGC C$ 21.18 171.6 US$ 2,724 US$ 133 US$ 189 US$ 425 US$ 2,960 US$ 0.94 US$ 1.41 17 16.8x 11.3x 18.3x 12.3x 20.4x 11.8x
Dundee Precious Metals Inc. TSX:DPM C$ 1.55 140.6 US$ 163 US$ 27 US$ 34 US$ 131 US$ 260 US$ 0.53 US$ 0.41 4 2.2x 2.8x 3.5x 4.5x 3.8x 4.0x
Harmony Gold Mining Company Limited NYSE:HMY C$ 4.62 435.8 US$ 1,510 US$ 57 US$ 57 US$ 200 US$ 1,653 US$ 0.18 US$ 0.64 5 19.6x 5.4x 21.4x 6.0x 16.0x 7.3x
Hecla Mining Co. NYSE:HL C$ 3.55 378.6 US$ 1,007 US$ 155 US$ 142 US$ 500 US$ 1,365 US$ 0.21 US$ 0.32 5 12.6x 8.3x 17.1x 11.2x 14.3x 10.1x
IAMGOLD Corp. TSX:IMG C$ 3.20 396.9 US$ 952 US$ 481 US$ 702 US$ 628 US$ 879 US$ 0.38 US$ 0.40 10 6.3x 5.9x 5.8x 5.5x 5.4x 4.6x
New Gold, Inc. TSX:NGD C$ 5.00 509.5 US$ 1,910 US$ 336 US$ 467 US$ 788 US$ 2,230 US$ 0.49 US$ 0.38 14 7.6x 9.9x 8.9x 11.5x 8.6x 9.4x
Nord Gold N.V. LSE:NORD C$ 4.07 370.8 US$ 1,131 US$ 364 US$ 327 US$ 815 US$ 1,619 US$ 1.24 US$ 0.89 2 2.5x 3.4x 3.5x 4.9x 3.0x 3.3x
OceanaGold Corporation TSX:OGC C$ 3.76 604.2 US$ 1,703 US$ 185 US$ 188 US$ 183 US$ 1,698 US$ 0.54 US$ 0.36 10 5.3x 7.9x 5.2x 7.8x 8.7x 6.9x
SEMAFO Inc. TSX:SMF C$ 4.66 294.3 US$ 1,028 US$ 138 US$ 158 US$ 59 US$ 929 US$ 0.48 US$ 0.39 15 7.3x 9.1x 6.6x 8.2x 6.0x 7.3x
Torex Gold Resources Inc TSX:TXG C$ 1.62 786.9 US$ 956 US$ 74 US$ 77 US$ 305 US$ 1,184 (US$ 0.03) US$ 0.03 5 - 38.0x - 47.1x - 17.5x
Group Average - Intermediate Producers 9.3x 9.4x 9.3x 9.7x 8.8x 7.1x
Group Average - Intermediate Producers (excluding high/low) 8.3x 7.8x 8.4x 7.5x 8.0x 6.8x
Junior Precious Metals Producers
Argonaut Gold Inc. TSX:AR C$ 1.61 155.3 US$ 187 US$ 43.8 US$ 101.3 US$ 1.5 US$ 87.7 US$ 0.28 US$ 0.30 8 4.3x 4.0x 2.0x 1.9x 2.7x 1.7x
Asanko Gold Inc. TSX:AKG C$ 2.87 197.0 US$ 424 US$ 159.3 US$ 120.0 US$ 118.7 US$ 422.6 (US$ 0.04) US$ 0.23 4 - 9.5x - 9.5x - 5.9x
Endeavour Mining Corporation TSX:EDV C$ 11.25 59.1 US$ 498 US$ 109.5 US$ 83.4 US$ 225.6 US$ 640.4 US$ 3.57 US$ 2.84 7 2.4x 3.0x 3.0x 3.8x 3.8x 3.1x
Golden Star Resources, Ltd. TSX:GSC C$ 0.65 259.9 US$ 127 US$ 35.1 US$ (65.8) US$ 89.9 US$ 282.3 (US$ 0.07) (US$ 0.09) 3 - - - - - 11.6x
Guyana Goldfields Inc. TSX:GUY C$ 4.25 152.5 US$ 486 US$ 18.5 US$ (5.8) US$ 58.1 US$ 549.6 (US$ 0.02) US$ 0.42 4 - 7.5x - 8.5x - 7.6x
Highland Gold Mining Ltd. AIM:HGM C$ 1.20 325.2 US$ 291 US$ 39.8 US$ 33.2 US$ 194.0 US$ 452.2 US$ 0.32 US$ 0.36 2 2.8x 2.5x 4.3x 3.9x 3.5x 3.1x
Kirkland Lake Gold Inc. TSX:KGI C$ 8.61 114.3 US$ 738 US$ 63.7 US$ 61.8 US$ 82.7 US$ 758.8 US$ 0.83 US$ 0.98 8 7.7x 6.6x 8.0x 6.8x 13.5x 6.4x
Lake Shore Gold Corp. TSX:LSG C$ 1.82 463.2 US$ 632 US$ 70.4 US$ 56.4 US$ 68.2 US$ 643.9 US$ 0.16 US$ 0.18 10 8.5x 7.6x 8.7x 7.8x 8.6x 7.0x
McEwen Mining Inc. TSX:MUX C$ 2.56 320.2 US$ 614 US$ 31.8 US$ 30.0 US$ 0.0 US$ 584.5 - - 0 - - - - - -
Newmarket Gold Inc. TSX:NMI C$ 2.12 320.2 US$ 509 US$ 37.2 US$ 22.6 US$ 21.8 US$ 508.0 US$ 0.49 US$ 0.40 9 3.2x 4.0x 3.2x 4.0x 6.8x 5.6x
Perseus Mining Limited TSX:PRU C$ 0.37 529.3 US$ 147 US$ 68.9 US$ 120.1 US$ 0.0 US$ 26.7 US$ 0.11 - 2 2.5x - 0.5x - 0.3x 1.0x
Primero Mining Corp. TSX:P C$ 2.25 164.2 US$ 277 US$ 45.6 US$ 4.9 US$ 61.5 US$ 333.5 US$ 0.49 US$ 0.54 14 3.4x 3.1x 4.1x 3.7x 3.2x 2.8x
Richmont Mines Inc. TSX:RIC C$ 6.75 58.4 US$ 296 US$ 44.0 US$ 34.1 US$ 2.4 US$ 263.8 US$ 0.49 US$ 0.52 6 10.3x 9.7x 9.2x 8.7x 9.3x 7.9x
Roxgold Inc. TSXV:ROG C$ 0.85 604.2 US$ 385 US$ 55.1 US$ 34.4 US$ 28.1 US$ 378.7 (US$ 0.01) US$ 0.07 4 - 9.6x - 9.4x 3.2x 3.3x
Teranga Gold Corporation TSX:TGZ C$ 0.58 392.0 US$ 170 US$ 44.4 US$ 162.0 US$ 13.5 US$ 21.9 US$ 0.13 US$ 0.10 8 3.3x 4.2x 0.4x 0.5x 0.2x 0.2x
Timmins Gold Corp. TSX:TMM C$ 0.34 315.4 US$ 79 US$ 10.4 US$ (6.1) US$ 0.1 US$ 85.4 US$ 0.03 US$ 0.05 7 8.4x 5.3x 9.0x 5.7x - 3.7x
True Gold Mining Inc. TSXV:TGM C$ 0.48 398.8 US$ 142 US$ 20.7 US$ (2.0) US$ 0.0 US$ 144.1 (US$ 0.02) US$ 0.03 4 - 10.7x - 10.9x - 5.2x
Group Average - Junior Producers 5.2x 6.2x 4.8x 6.1x 5.0x 4.7x
Group Average - Junior Producers (excluding high/low) - 5.9x - 5.7x - 4.6x
All data sourced from Capital IQ
P/CF Ratio EV/CF Ratio EV/EBITDA Ratio

The Weekly Dig 3/4/16
Haywood Mining [email protected] Page 23
Other Precious Metals Comparables – Consensus Estimates
Source: Capital IQ and Haywood Securities
Shares Market Working Enterprise
Company Symbol Price O/S Capitalization Cash Capital Debt Value 2015E 2016E Number of
(millions) (millions) (millions) (millions) (millions) (millions) CFPS CFPS Estimates 2015E 2016E 2015E 2016E 2015E 2016E
PGM Producers
Impala Platinum Holdings Ltd. JSE:IMP C$ 3.92 709.7 US$ 2,085 US$ 411 US$ 809 US$ 574 US$ 1,850 US$ 0.23 US$ 0.23 4 13.1x 12.6x 11.6x 11.2x 7.5x 8.6x
Lonmin plc LSE:LMI C$ 2.98 282.1 US$ 630 US$ 320 - - US$ 630 US$ 6.97 US$ 0.19 5 0.3x 11.8x 0.3x 11.8x 9.1x 10.8x
Stillwater Mining Company NYSE:SWC C$ 12.86 121.0 US$ 1,167 US$ 464 US$ 523 US$ 259 US$ 903 US$ 0.70 US$ 0.58 2 13.7x 16.8x 10.6x 13.0x 8.7x 13.6x
North American Palladium Ltd. TSX:PDL C$ 5.73 58.1 US$ 250 US$ 8 US$ 15 - US$ 235 - - 0 - - - - - -
Group Average - PGM Producers 9.0x 13.7x 7.5x 12.0x 8.5x 11.0x
Group Average - PGM Producers (excluding high/low) 13.1x 12.6x 10.6x 11.8x 8.7x 10.8x
Silver Producers
Aurcana Corporation TSXV:AUN C$ 0.18 84.6 US$ 11 US$ 1 (US$ 44) - US$ 56 - - 0 - - - - - -
Coeur Mining, Inc. NYSE:CDE C$ 6.03 152.6 US$ 690 US$ 201 US$ 307 US$ 472 US$ 855 US$ 0.57 US$ 0.54 5 7.9x 8.3x 9.8x 10.3x 8.4x 7.6x
Endeavour Silver Corp. TSX:EDR C$ 2.82 103.1 US$ 218 US$ 21 US$ 17 - US$ 201 US$ 0.34 US$ 0.25 5 6.2x 8.6x 5.7x 7.9x 5.0x 6.4x
First Majestic Silver Corp. TSX:FR C$ 6.50 155.6 US$ 758 US$ 57 US$ 16 US$ 11 US$ 754 US$ 0.46 US$ 0.53 6 10.7x 9.2x 10.6x 9.2x 11.4x 8.7x
Fortuna Silver Mines Inc. TSX:FVI C$ 5.20 129.2 US$ 504 US$ 110 US$ 113 US$ 39 US$ 431 US$ 0.24 US$ 0.42 6 16.0x 9.3x 13.7x 7.9x 8.3x 6.5x
Hecla Mining Co. NYSE:HL C$ 3.55 378.6 US$ 1,007 US$ 155 US$ 142 US$ 500 US$ 1,365 US$ 0.21 US$ 0.32 5 12.6x 8.3x 17.1x 11.2x 14.3x 10.1x
Mandalay Resources Corp. TSX:MND C$ 0.87 410.4 US$ 268 US$ 49 US$ 20 US$ 2 US$ 250 US$ 0.15 US$ 0.13 4 4.3x 4.9x 4.0x 4.6x 3.8x 4.1x
Pan American Silver Corp. TSX:PAA C$ 13.50 152.0 US$ 1,538 US$ 227 US$ 392 US$ 36 US$ 1,182 US$ 0.57 US$ 0.67 6 17.6x 15.1x 13.5x 11.6x 12.4x 12.3x
Silver Standard Resources Inc. TSX:SSO C$ 8.93 80.8 US$ 541 US$ 300 US$ 341 US$ 208 US$ 408 US$ 0.96 US$ 0.86 4 7.0x 7.8x 5.3x 5.9x 4.3x 5.3x
Silvercorp Metals Inc. TSX:SVM C$ 1.18 168.6 US$ 149 US$ 67 US$ 40 - US$ 109 US$ 0.28 US$ 0.19 2 3.2x 4.7x 2.3x 3.4x 3.4x 3.3x
Tahoe Resources Inc. TSX:THO C$ 12.65 227.4 US$ 2,157 US$ 111 US$ 66 US$ 2 US$ 2,093 US$ 0.77 US$ 0.87 9 12.4x 10.9x 12.0x 10.5x 10.9x 8.8x
Group Average - Silver Producers 9.8x 8.7x 9.4x 8.3x 8.2x 7.3x
Group Average - Silver Producers (excluding high/low) 9.6x 8.4x 9.3x 8.5x 8.0x 7.2x
Diamond Producers
Dominion Diamond Corporation NYSE:DDC C$ 16.03 85.3 US$ 1,025 US$ 328 US$ 643 US$ 23 US$ 405 US$ 3.72 US$ 1.67 4 3.2x 7.2x 1.3x 2.8x 1.1x 1.6x
Lucara Diamond Corp. TSX:LUC C$ 2.49 380.0 US$ 709 US$ 135 US$ 149 - US$ 561 US$ 0.25 US$ 0.29 8 7.5x 6.4x 6.0x 5.1x 4.5x 3.1x
Group Average - Diamond Producers 5.4x 6.8x 3.6x 4.0x 2.8x 2.3x
Royalty Companies
Anglo Pacific Group plc LSE:APF C$ 1.03 169.0 US$ 130 US$ 6 US$ 3 US$ 4 US$ 132 US$ 0.05 US$ 0.08 3 15.7x 9.9x 15.8x 10.1x 18.0x 12.3x
Franco-Nevada Corporation TSX:FNV C$ 76.33 177.3 US$ 10,145 US$ 614 US$ 698 - US$ 9,447 US$ 1.89 US$ 2.24 14 30.2x 25.5x 28.2x 23.8x 29.0x 22.7x
Osisko Gold Royalties Ltd. TSX:OR C$ 13.95 106.1 US$ 1,110 US$ 229 US$ 223 - US$ 886 US$ 0.26 US$ 0.37 12 40.3x 28.1x 32.2x 22.4x 41.2x 27.7x
Royal Gold, Inc. US:RGLD C$ 64.69 62.3 US$ 3,020 US$ 118 US$ 142 US$ 677 US$ 3,555 US$ 2.63 US$ 3.13 9 18.5x 15.5x 21.7x 18.2x 16.3x 13.4x
Sandstorm Gold Ltd. TSX:SSL C$ 4.16 137.9 US$ 430 US$ 47 US$ 47 - US$ 384 US$ 0.27 US$ 0.29 8 11.5x 10.6x 10.3x 9.5x 11.5x 9.2x
Silver Wheaton Corp. US:RGLD C$ 21.95 403.5 US$ 6,641 US$ 81 US$ 67 US$ 647 US$ 7,221 US$ 2.63 US$ 3.13 9 6.3x 5.2x 6.8x 5.7x 17.6x 13.5x
Group Average - Royalty Companies 20.4x 15.8x 19.2x 14.9x 22.3x 16.5x
Group Average - Royalty Companies (excluding high/low) 19.0x 15.4x 19.0x 15.0x 20.2x 15.5x
All data sourced from Capital IQ
P/CF Ratio EV/CF Ratio EV/EBITDA Ratio

The Weekly Dig 3/4/16
Haywood Mining [email protected] Page 24
Base Metals Comparables – Consensus Estimates
Shares Market Working Enterprise
Company Symbol Price O/S Capitalization Cash Capital Debt Value 2015E 2016E Number of
(millions) (millions) (millions) (millions) (millions) (millions) CFPS CFPS Estimates 2015E 2016E 2015E 2016E 2015E 2016E
Large-Cap Base Metals Producers
Anglo American plc LSE:AAL C$ 11.23 1401.8 US$ 11,803 US$ 6,895 US$ 7,941 US$ 16,265 US$ 20,127 US$ 2.86 US$ 2.61 9 2.9x 3.2x 5.0x 5.5x 4.2x 5.5x
Antofagasta plc LSE:ANTO C$ 10.44 985.9 US$ 7,719 US$ 3,220 US$ 2,775 US$ 1,976 US$ 6,921 US$ 0.82 US$ 0.78 8 9.5x 10.1x 8.5x 9.0x 6.6x 6.2x
BHP Billiton Limited ASX:BHP C$ 17.50 5321.2 US$ 69,816 US$ 10,701 US$ 6,745 US$ 32,476 US$ 95,547 US$ 2.93 US$ 2.23 6 4.5x 5.9x 6.1x 8.1x 4.1x 8.7x
First Quantum Minerals Ltd. TSX:FM C$ 7.04 689.3 US$ 3,638 US$ 365 US$ 1,063 US$ 4,675 US$ 7,250 US$ 1.13 US$ 1.12 13 4.7x 4.7x 9.3x 9.4x 11.1x 9.2x
Freeport-McMoRan Inc. NYSE:FCX C$ 12.99 1251.8 US$ 12,193 US$ 224 US$ 3,155 US$ 19,779 US$ 28,817 US$ 2.71 US$ 3.19 4 3.6x 3.0x 8.5x 7.2x 7.1x 5.8x
Glencore Plc LSE:GLEN C$ 3.00 14028.9 US$ 31,572 US$ 2,887 US$ 1,326 US$ 32,556 US$ 62,802 US$ 0.72 US$ 0.46 7 3.1x 4.8x 6.2x 9.6x 7.4x 8.1x
KGHM Polska Miedz Spólka Akcyjna WSE:KGH C$ 25.87 200.0 US$ 3,879 US$ 269 US$ 110 US$ 1,023 US$ 4,792 US$ 5.02 US$ 3.83 6 3.9x 5.1x 4.8x 6.2x 4.0x 4.9x
Rio T into plc LSE:RIO C$ 40.41 1798.5 US$ 54,485 US$ 9,589 US$ 5,397 US$ 21,140 US$ 70,228 US$ 5.11 US$ 4.35 7 5.9x 7.0x 7.6x 9.0x 5.5x 7.6x
Teck Resources Limited TSX:TCK.B C$ 10.26 576.3 US$ 4,454 US$ 1,360 US$ 2,219 US$ 6,923 US$ 9,158 US$ 2.14 US$ 1.65 16 3.6x 4.7x 7.4x 9.6x 5.8x 7.3x
Vale S.A. NYSE:VALE C$ 6.07 5234.8 US$ 20,971 US$ 3,637 US$ 4,856 US$ 27,551 US$ 43,666 US$ 0.86 US$ 0.92 8 5.1x 4.8x 9.7x 9.1x 6.2x 7.4x
Group Average - Large-Cap Producers 4.7x 5.3x 7.3x 8.3x 6.2x 7.1x
Group Average - Large-Cap Producers (excluding high/low) 4.3x 5.0x 7.3x 8.5x 5.9x 7.1x
Mid Tier Base Metals Producers
Capstone Mining Corp. TSX:CS C$ 0.58 386.9 US$ 168 US$ 102 US$ 162 US$ 343 US$ 349 US$ 0.17 US$ 0.26 14 2.5x 1.6x 5.2x 3.4x 4.9x 3.1x
Cliffs Natural Resources Inc. NYSE:CLF C$ 3.85 180.1 US$ 521 US$ 285 US$ 401 US$ 2,699 US$ 2,819 US$ 2.41 US$ 1.03 1 1.2x 2.8x 6.5x 15.1x 10.4x 13.2x
HudBay Minerals, Inc. TSX:HBM C$ 5.52 235.2 US$ 973 US$ 54 US$ 58 US$ 1,205 US$ 2,121 US$ 0.89 US$ 1.15 15 4.7x 3.6x 10.2x 7.9x 8.1x 5.4x
Imperial Metals Corp. TSX:III C$ 5.28 81.8 US$ 324 US$ 6 (US$ 25) US$ 626 US$ 975 (US$ 0.21) US$ 1.07 3 - 3.7x - 11.1x 36.5x 7.4x
KAZ Minerals plc LSE:KAZ C$ 3.45 445.9 US$ 1,154 US$ 1,251 US$ 870 US$ 3,201 US$ 3,485 (US$ 0.16) US$ 0.26 5 - 9.9x - 29.8x 24.5x 14.9x
Lundin Mining Corporation TSX:LUN C$ 4.29 719.6 US$ 2,314 US$ 557 US$ 633 US$ 977 US$ 2,658 US$ 0.85 US$ 0.51 16 3.8x 6.3x 4.3x 7.2x 3.9x 6.3x
MMG Limited HKSE:1208 C$ 0.32 5290.1 US$ 1,274 US$ 636 US$ 772 US$ 8,863 US$ 9,365 US$ 0.14 US$ 0.13 1 1.8x 1.8x 12.9x 13.2x 15.4x 7.5x
Nevsun Resources Ltd. TSX:NSU C$ 4.65 199.8 US$ 696 US$ 434 US$ 462 - US$ 234 US$ 0.55 US$ 0.35 8 6.4x 10.1x 2.1x 3.4x 1.8x 4.8x
Nyrstar NV ENXTBR:NYR C$ 1.07 935.6 US$ 747 US$ 140 (US$ 426) US$ 499 US$ 1,672 US$ 0.62 US$ 0.33 3 1.3x 2.4x 2.9x 5.4x 5.6x 5.8x
OZ Minerals Limited ASX:OZL C$ 5.40 303.5 US$ 1,228 US$ 402 US$ 522 - US$ 706 US$ 1.09 US$ 0.89 6 3.7x 4.5x 2.1x 2.6x 2.0x 2.5x
Sherritt International Corporation TSX:S C$ 0.99 293.9 US$ 218 US$ 314 US$ 439 US$ 1,565 US$ 1,344 US$ 0.09 (US$ 0.11) 3 8.1x - 50.1x - 14.4x 15.9x
Turquoise Hill Resources Ltd. TSX:TRQ C$ 3.51 2012.3 US$ 5,295 US$ 1,310 US$ 1,447 - US$ 3,848 US$ 0.33 US$ 0.04 6 8.0x 59.6x 5.8x 43.3x 5.9x 21.9x
Vedanta Resources plc LSE:VED C$ 6.99 276.3 US$ 1,448 US$ 8,917 US$ 1,375 US$ 11,228 US$ 11,301 US$ 4.34 US$ 7.16 6 1.2x 0.7x 9.4x 5.7x 2.9x 4.9x
Western Areas Limited ASX:WSA C$ 2.50 233.4 US$ 437 US$ 22 US$ 10 - US$ 427 US$ 0.32 US$ 0.27 6 5.8x 7.0x 5.7x 6.8x 3.7x 11.0x
Group Average - Mid Tier Producers 4.0x 8.8x 9.8x 11.9x 10.0x 8.9x
Group Average - Mid Tier Producers (excluding high/low) 2.0x 4.5x 1.4x 9.3x 8.5x 8.4x
Small Cap Base Metals Producers
Amerigo Resources Ltd. TSX:ARG C$ 0.15 173.6 US$ 20 US$ 9 (US$ 6) US$ 55 US$ 81 (US$ 0.05) US$ 0.05 2 - 2.2x - 9.3x - -
Copper Mountain Mining Corporation TSX:CUM C$ 0.64 118.8 US$ 57 US$ 9 (US$ 11) US$ 273 US$ 341 US$ 0.23 US$ 0.18 9 2.1x 2.7x 12.4x 16.0x 8.8x 7.1x
Taseko Mines Ltd. TSX:TKO C$ 0.62 221.8 US$ 103 US$ 55 US$ 27 US$ 206 US$ 282 US$ 0.16 US$ 0.09 8 2.9x 5.2x 8.0x 14.3x 8.2x 20.9x
Thompson Creek Metals Company Inc. TSX:TCM C$ 0.44 222.1 US$ 73 US$ 177 US$ 175 US$ 832 US$ 730 US$ 0.26 US$ 0.18 8 1.3x 1.8x 12.6x 18.0x 5.6x 6.4x
Trevali Mining Corporation TSX:TV C$ 0.38 0.0 US$ 95 US$ 6 US$ 4 US$ 46 US$ 137 US$ 0.06 US$ 0.14 5 5.1x 2.0x - - 7.5x 2.4x
Group Average - Small Cap Producers 2.8x 2.8x 11.0x 14.4x 7.5x 9.2x
Group Average - Small Cap Producers (excluding high/low) 2.1x 2.3x 6.8x 13.2x 7.1x 5.3x
All data sourced from Capital IQ
P/CF Ratio EV/CF Ratio EV/EBITDA Ratio

The Weekly Dig 3/4/16
Haywood Mining [email protected] Page 25
Iron Comparables – Consensus Estimates
Bloomberg Shares Market Daily Enterprise
Company (T icker) Share Price
Consensus
Target
Implied
Return β
Outstanding
(millions)
Capitalization
(millions)
Volume
(millions)
Weekly
Liquidity WACC
Debt
(millions)
Value
(millions) 2016 2017 2018 2016 2017 2018 2016 2017 2018 2016 2017 2018
Diversified Mining Houses
VALE SA (VALE3-BZ) R$ 16.55 R$ 11.69 (29.4)% 1.05 3,217 R$ 77,002 8.1 2.0% 18.9% R$ 112,667 R$ 183,907 3.08 4.26 5.22 5.4x 3.9x 3.2x 20.5x 7.4x 8.2x 5.8x 4.4x
BHP BILLITON (BHP-AU) A$ 17.67 A$ 19.11 8.1% 1.39 3,212 A$ 91,791 14.3 2.4% 9.3% A$ 31,170 A$ 99,860 2.62 2.88 3.22 6.7x 6.1x 5.5x 36.9x 18.6x 8.9x 7.9x 6.1x
RIO TINTO (RIO-AU) A$ 44.90 A$ 48.08 7.1% 1.09 424 A$ 75,041 2.9 3.2% 7.5% A$ 23,063 A$ 76,204 6.23 6.59 7.47 7.2x 6.8x 6.0x 26.3x 17.6x 13.4x 8.3x 7.1x 6.2x
Group Average - Diversifed Mining Avg. -> 6.4x 5.6x 4.9x 26.3x 25.0x 13.1x 8.5x 6.9x 5.6x
Producers
KUMBA IRON (KIO-SJE) ZAR 8,242 ZAR 4,363 (47.1)% 2.00 322 ZAR 26,546 0.9 1.8% 9.2% ZAR 8,205 ZAR 36,997 2440 2141 1740 3.4x 3.8x 4.7x 14.4x 16.6x 15.5x 4.6x 5.1x 4.8x
FORTESCUE METALS (FMG-AU) A$ 2.49 A$ 1.99 (20.2)% 1.50 3,114 A$ 7,753 24.4 4.5% 6.4% A$ 9,569 A$ 11,912 0.72 0.61 0.71 3.4x 4.1x 3.5x 18.3x 25.7x 5.3x 6.1x 5.6x
CLIFFS NATURAL (CLF-US) US$ 2.89 US$ 1.65 (42.9)% 0.95 180 US$ 521 3.9 16.5% 1.8% US$ 2,774 US$ 3,910 0.62 0.53 1.19 4.7x 5.4x 2.4x 18.7x 16.8x 15.0x
MMX MINERACAO (MMXM3-BRZ) R$ 0.13 0.47 162 R$ 21 0.3 1.6% 19.4% R$ 99 R$ 173
FERREXPO PLC (FXPO-LSE) GBp 40 GBp 28.07 (28.9)% 0.99 589 GBp 233 0.7 0.8% 4.5% GBp 1,305 GBp 988 19.82 20.68 39.59 2.0x 1.9x 1.0x 10.4x 5.8x 2.8x 6.4x 5.8x 3.7x
MOUNT GIBSON (MGX-AU) A$ 0.19 A$ 0.20 3.5% 0.64 1,091 A$ 207 1.5 1.2% 7.1% A$ 3 A$ 152 (0.02) (0.02) (0.00)
GRANGE RESOURCES (GRR-AU) A$ 0.09 A$ 0.08 (13.0)% 1.00 1,157 A$ 106 0.4 0.1% 9.2% A$ 1 A$(4) 0.02 0.02 4.0x 4.8x 10.2x 30.7xNORTHERN IRON (NFE-AU) A$#N/A N/A 484 #VALUE! 0.0 0.0% 3.1% A$ 66 A$N/A
BC IRON (BCI-AU) A$ 0.13 A$ 0.09 (32.0)% 1.78 196 A$ 25 1.0 2.6% 14.1% A$ 6 A$(37) 41.7x 41.7x
Group Average - Producers Avg. -> 3.5x 4.0x 2.9x 13.3x 17.7x 14.7x 8.7x 8.4x 7.3x
Advanced Development / Exploration (Select Group)
SUNDANCE RESOURCES (SDL-AU) A$ 0.01 1.07 6,605 A$ 33.0 5.0 0.2% 6.7% A$ 38 A$ 72
NEW MILLENNIUM (NML-T) C$ 0.10 0.63 181 C$ 18.1 0.1 0.3% 8.4% C$ 0 C$ 0 (0.01)
ALDERON IRON (ADV-T) C$ 0.15 1.52 132 C$ 19.2 0.1 0.2% 11.0% C$ 19 C$ 72 (0.02) (0.04)
ZANAGA IRON (ZIOC-LSE) GBp 2 0.36 279 GBp 5.3 0.1 0.2% 3.9% GBp 0 GBp(2)
CENTURY GLOBAL (CNT-T) C$ 0.30 99 C$ 29.6 0.0 0.0% 12.7% C$ 0 C$ 15
CHAMPION IRON (CIA-T) C$ 0.16 0.86 198 C$ 31.7 0.1 0.1% 11.2% C$ 0 C$ 28 (0.02) (0.03) (0.03)
ADRIANA RESOURCES (ADI-V) C$ 0.11 1.08 158 C$ 16.5 0.1 0.3% 13.6% C$ 0 C$(16)
IMX RESOURCES (IXR-AU) A$ 0.00 0.51 1,546 A$ 6.2 2.8 3.7% 6.2% A$ 0 A$ 9
BLACK IRON (BKI-T) C$ 0.05 (0.63) 161 C$ 7.2 0.1 0.6% -5.9% C$ 0 C$(3) (0.07) (0.07) 0.3x 0.3x
OCEANIC IRON (FEO-T) C$ 0.12 (0.88) 42 C$ 4.9 0.0 0.1% -5.1% C$ 0 C$ 6
MACARTHUR MINERALS (MMS-T) C$ 0.02 0.86 82 C$ 1.6 0.1 0.3% 5.0% C$ 0 C$ 0
Group Average - Developers / Explorers Avg. -> 0.3x 0.3x
All data sourced from Bloomberg
EV/EBITDAP/EPSCFPS (LoC) P/CFPS

The Weekly Dig 3/4/16
Haywood Mining [email protected] Page 26
Uranium Comparables – Consensus Estimates
Bloomberg Shares Market Daily Enterprise
Company (T icker)
Share
Price
Consensus
Target
Implied
Return β
Outst.
(millions)
Capitalization
(millions)
Volume
(millions)
Weekly
Liquidity
Value
(millions)
Resource
(M lb)
USD
EV/lb
Resource 2015 2016 2017 2015 2016 2017 2015 2016 2017 2015 2016 2017
CAMECO CORP (CCO-T) C$ 16.66 C$ 22.43 34.6% 1.10 396 C$ 6,594 1.73 1.8% C$ 7,626 996.1 $5.75 1.72 2.44 2.92 9.7x 6.8x 5.7x 1.22 1.45 1.90 13.6x 11.5x 8.8x
PALADIN ENERGY (PDN-AU) A$ 0.19 A$ 0.28 45.7% 0.86 1,713 A$ 325 0.28 0.1% A$ 593 510.5 $0.87 (0.00) 0.02 0.04 10.6x 5.3x (0.02) 0.01 0.02 23.8x 9.5x
ENERGY RESOURCES (ERA-AU) C$ 0.34 C$ 0.25 (26)% 0.69 518 C$ 176 0.16 0.1% C$ -189 473.0 ($0.30) 0.13 0.10 0.06 3.3x 5.7x (0.00) (0.03) (0.03)
ENERGY FUELS (EFR-T) C$ 3.71 C$ 10.15 173.6% 1.40 47 C$ 173 0.07 0.7% C$ 149 134.0 $0.84 0.14 0.15 26.7x 24.6x (0.43) (0.42)
UR-ENERGY INC (URE-T) C$ 0.68 C$ 2.60 282.9% 0.67 143 C$ 97 0.09 0.4% C$ 96 29.9 $2.41 0.05 0.03 0.16 15.1x 23.4x 4.3x 0.01 0.05 0.10 68.0x 15.1x 6.8x
URANIUM ENERGY (UEC-AMEX) US$ 0.92 US$ 3.29 257.3% 1.06 99 US$ 91 0.64 2.4% US$ 105 89.3 $1.18 (0.21) (0.06) 0.04 23.0x (0.23) 0.02 46.0x
Group Average - Producers $1.79 12.4x 14.2x 11.4x 40.8x 24.1x 8.4x
DEEP YELLOW (DYL-AU) A$ 0.01 0.31 1,931 A$ 14 0.63 0.4% A$ 10 106.0 $0.07
DENISON MINES (DML-T) US$ 0.65 US$ 1.45 122.8% 1.30 518 US$ 337 0.88 0.9% US$ 239 204.3 $0.88 (0.04) (0.03) (0.02) (0.07) (0.03) (0.03)
FORSYS METALS (FSY-T) C$ 0.10 -0.11 135 C$ 13 0.02 0.0% C$ 13 125.0 $0.08
UR-ENERGY INC (URE-T) C$ 0.68 C$ 2.60 282.9%
MEGA URANIUM (MGA-T) C$ 0.11 1.27 282 C$ 31 0.62 2.5% C$ 30 43.1 $0.52
LARAMIDE RESOURCES (LAM-T) C$ 0.26 C$ 0.80 213.7% 0.76 94 C$ 24 0.14 0.3% C$ 25 62.3 $0.30 (0.02) (0.03)
BANNERMAN RESOURCES (BMN-AU) A$ 0.03 0.83 702 A$ 22 0.38 0.2% A$ 18 169.6 $0.08
PLATEAU URANIUM (PLU-V) C$ 0.35 1.14 41 C$ 14 0.04 0.2% C$ 9 124.0 $0.06
TORO ENERGY (TOE-AU) A$ 0.06 A$ 0.09 52.5% 0.34 2,005 A$ 118 0.45 0.2% A$ 114 96.0 $0.88
ALLIANCE RESOURCES (AGS-AU) A$ 0.03 0.56 417 A$ 14 0.54 0.9% A$ 13 17.8 $0.56
PENINSULA ENERGY (PEN-AU) C$ 0.80 C$ 2.20 175.0% 0.85 176 C$ 141 0.11 0.1% C$ 112 110.6 $0.75 (0.12) (0.06) 0.08 0.14 10.0x 5.7x
Group Average - Developers $0.46 10.0x
FISSION URANIUM (FCU-T) C$ 0.65 C$ 1.86 185.8% 1.05 484 C$ 315 1.60 1.1% C$ 310 108.3 $2.15 (0.02) (0.01) (0.03) (0.03) (0.02) (0.03)
FISSION 3.0 (FUU-V) C$ 0.08 1.19 178 C$ 14 0.28 0.5% C$ 10
NEXGEN ENERGY (NXE-V) C$ 1.28 C$ 2.69 110.2% 0.7 289 C$ 370 1.69 6.1% C$ 349 201.9 $1.30 (0.01) (0.01) (0.01) (0.01) (0.01) (0.01)
KIVALLIQ ENERGY (KIV-V) C$ 0.07 C$ 0.18 150.0% 0.89 217 C$ 15 0.17 0.9% C$ 14 20.0 $0.35 (0.01) (0.01) (0.01) (0.01)
AZINCOURT URANIUM (AAZ-V) C$ 0.06 0.02 10 C$ 1 0.00 0.4% C$ 0
URACAN RESOURCES (URC-V) C$ 0.04 0.28 72 C$ 3 0.13 1.0% C$ 3 44.0 $0.05
INVENTORY FUNDS
URANIUM PARTICIPATION (U-T) C$ 4.84 C$ 6.61 36.5% 0.54 117 C$ 564 0.36 1.0% C$ 553 (0.05) (0.04) - 0.26 1.21 19x 4x
All data sourced from Bloomberg
PR
OD
UC
ER
SD
EV
ELO
PE
RS
EX
PLO
RE
RS
P/EPSCFPS (LoC) P/CFPS EPS (LoC)

The Weekly Dig 3/4/16
Haywood Mining [email protected] Page 27
Coal Comparables – Consensus Estimates
Large Cap USA Bloomberg Shares Market Daily Enterprise
Company (T icker) Share Price
Consensus
Target
Implied
Return β
Outstanding
(millions)
Capitalization
(millions)
Volume
(millions)
Weekly
Liquidity WACC
Debt
(millions)
Value
(millions) 2015 2016 2017 2015 2016 2017 2015 2016 2017 2015 2016 2017
Large Cap USA
PEABODY ENERGY (BTU-US) US$ 3.39 US$ 2.84 (16.1)% 1.16 19 US$ 63 1.5 86.9% 3.6% US$ 6,316 US$ 6,117 (10.36) (5.57) 1.52 2.2x 15.7x 11.6x 9.5x
CONSOL ENERGY (CNX-US) US$ 10.58 US$ 11.79 11.4% 1.49 229 US$ 2,423 11.5 49.3% 5.1% US$ 3,707 US$ 6,211 2.53 2.49 3.26 4.2x 4.2x 3.2x 38.9x 8.4x 8.0x 6.3x
FORESIGHT ENERGY (FELP-US) US$ 2.34 US$ 3.96 69.2% 65 US$ 305 0.1 0.6% 5.4% US$ 1,361 US$ 1,773 2.55 2.32 2.38 0.9x 1.0x 1.0x 9.6x 41.8x 4.7x 5.7x 5.8x
CORSA COAL (CSO-V) C$ 0.04 0.64 1,379 C$ 55 0.2 0.3% 5.3% C$ 34 C$ 115
WESTMORELAND COAL (WLB-US) C$ 7.57 C$ 11.33 49.7% 1.41 18 C$ 137 0.4 9.7% 5.0% C$ 985 C$ 1,162 (1.02) 3.98 3.87 1.9x 2.0x 5.3x 3.7x 4.8x
WALTER ENERGY (WLT-US) US$ 0.03 0.26 81 US$ 3 0.6 0.6% 3.8% US$ 3,136 US$- 179
CLOUD PEAK (CLD-US) US$ 1.95 US$ 2.65 35.9% 1.59 61 US$ 119 1.5 11.3% 5.0% US$ 493 US$ 523 0.64 0.62 0.34 3.0x 3.2x 5.7x 5.8x 7.5x 7.6x
Group Average - Large Cap USA Avg. -> 2.7x 2.6x 2.8x 9.6x 41.8x 38.9x 8.0x 7.3x 6.8x
Limitied Partnerships
ALLIANCE RESOURCE (ARLP-US) US$ 12.46 US$ 19.00 52.5% 1.04 74 US$ 927 0.5 2.6% 6.2% US$ 919 US$ 1,815 8.10 8.13 8.35 1.5x 1.5x 1.5x 6.7x 8.8x 7.3x 3.1x 3.3x 3.5x
NATURAL RESOURCE (NRP-US) US$ 11.25 US$ 7.50 (33.3)% 1.04 12 US$ 138 0.1 4.5% 4.3% US$ 1,475 US$ 1,498 16.50 15.80 17.31 0.7x 0.7x 0.6x 1.5x 1.9x 1.6x 5.3x 5.6x 5.5x
Group Average - Limited Partnerships Avg. -> 1.1x 1.1x 1.1x 4.1x 5.4x 4.5x 4.2x 4.5x 4.5x
Large Cap Non-North America
NEW HOPE (NHC-AU) A$ 1.42 A$ 1.40 (0.7)% 0.77 831 A$ 1,176 0.1 0.1% 8.1% A$#N/A N/A A$ 111 0.12 0.16 0.16 11.4x 8.7x 8.7x 28.9x 20.8x 25.7x 1.1x 0.7x 0.7x
WHITEHAVEN COAL (WHC-AU) A$ 0.70 A$ 0.75 7.0% 1.70 1,026 A$ 718 6.7 3.7% 7.4% A$ 1,038 A$ 1,644 0.12 0.16 0.24 5.8x 4.3x 2.9x 58.3x 31.8x 11.1x 7.8x 6.9x 5.7x
BANPU PUBLIC (BANPU-SET) ฿ 18.10 ฿ 20.20 11.6% 1.46 2,582 ฿ 46,732 15.5 5.4% 4.3% ฿ 120,580 ฿ 162,429 2.80 5.01 6.5x 3.6x 18.9x 14.0x 10.3x 12.7x 11.6x 12.9x
CHINA COAL (1898-HK) HK$ 3.07 HK$ 2.49 (19.0)% 1.14 4,107 HK$ 71,271 9.7 2.3% 8.5% HK$ 94,708 HK$ 157,827 0.24 0.47 0.65 11.0x 5.5x 4.0x 22.5x 24.1x 19.6x
CHINA SHENHUA (1088-HK) HK$ 12.42 HK$ 13.95 12.3% 1.12 3,399 HK$ 326,847 18.7 2.9% 9.1% HK$ 95,370 HK$ 376,198 2.35 2.46 2.69 4.4x 4.2x 3.9x 11.7x 9.8x 9.1x 6.0x 6.4x 6.0x
COAL OF (CZA-AU) A$ 0.04 (0.30) 1,927 A$ 81 0.0 0.0% 0.4% A$ 0 A$ 43
NINE ENTERTAINMENT (NEC-AU) A$ 1.59 A$ 1.69 6.5% 0.96 879 A$ 1,394 4.2 6.8% 7.7% A$ 576 A$ 1,341 0.17 0.18 0.19 9.5x 8.8x 8.3x 10.9x 9.6x 9.8x 6.2x 5.9x 6.1x
YANZHOU COAL (1171-HK) HK$ 3.75 HK$ 2.83 (24.5)% 1.49 1,958 HK$ 46,350 8.8 4.4% 6.7% HK$ 63,506 HK$ 79,996 0.83 0.80 0.83 3.8x 3.9x 3.8x 15.4x 18.7x 14.7x
Group Average - Large Cap Non-North-America Avg. -> 7.5x 5.6x 5.3x 25.7x 17.2x 13.2x 7.2x 10.6x 9.4x
Developer/Explorers
COMPLIANCE ENERGY (CEC-V) C$ 0.03 0.49 8 C$ 0.2 0.0 0.0% 6.6%
EAST ENERGY (EER-AU) A$ 0.00 356 A$ 1.4 0.0 0.0% 4.4% A$ 21 A$ 22
FORTUNE MINERALS (FT -T) C$ 0.03 0.45 227 C$ 6.8 0.3 0.5% 4.3% C$ 55 C$ 13
JAMESON RESOURCES (JAL-AU) A$ 0.02 0.37 209 A$ 3.1 0.4 0.5% 3.9% A$ 0 A$ 3
Group Average - Developers / Explorers Avg. ->
Allied Industry
SEDGMAN LTD (SDM-AU) A$ 0.95 A$ 1.07 13.2% 0.62 237 A$ 224 1.1 3.6% 6.9% A$ 2 A$ 127 0.11 0.12 0.12 8.4x 7.6x 7.7x 12.0x 11.7x 11.4x 3.7x 3.8x 3.8x
Group Average - Allied Industry Avg. -> 8.4x 7.6x 7.7x 12.0x 11.7x 11.4x 3.7x 3.8x 3.8x
Sundry Companies
ADARO ENERGY (ADRO-JKSE) ¥ 680 ¥ 640 (5.9)% 1.57 31,986 ¥ 21,750,454 43.2 1.2% 9.1% ¥ 1,881 ¥ 3,049 0.01 0.01 0.01 4.0x 4.8x 4.8x 8.7x 13.1x 10.5x 4.8x 6.1x 5.7x
BUMI RESOURCES (BUMI-JKSE) ¥ 50 1.15 36,627 ¥ 1,831,351 0.4 0.0% 14.4% ¥ 4,276 ¥ 4,084
NEYVELI LIGNITE (NEYVELILIG-NSEI) रू 63.90 रू 110.00 72.1% 0.99 1,678 रू 107,206 0.1 0.1% 10.2% रू 66,013 रू 140,104
SOUTHGOBI RESOURCES (SGQ-T) C$ 0.25 0.53 258 C$ 63 0.0 0.0% 3.9% C$ 95 C$ 156
TAMBANG BATUBARA (PTBA-JKSE) ¥ 5,800 ¥ 6,409 10.5% 1.19 2,304 ¥ 13,363,965 5.2 2.3% 9.2% ¥ 2,022,057 ¥ 12,383,536 644.91 640.79 1069.00 9.0x 9.1x 5.4x 8.6x 7.8x 6.2x 6.5x 5.7x 4.3x
Group Average - Sundry Companies Avg. -> 6.5x 6.9x 5.1x 8.7x 10.4x 8.3x 5.6x 5.9x 5.0x
All data sourced from Bloomberg
EV/EBITDAP/EPSCFPS (LoC) P/CFPS

The Weekly Dig 3/4/16
Haywood Mining [email protected] Page 28
Senior/Intermediate Gold Producers – EV/oz Comparables
Agnico Eagle Mines Limited NYSE:AEM US $7,476 US $518 US $8,455 54.3 1.97 59.3 2.15 92% 19.1 2.37 20.3 2.51 94% 35.3 1.81 39.0 2.00 90% 54% US $156 US $143
AngloGold Ashanti Ltd. JSE:ANG US $5,782 US $643 US $8,086 231.8 1.20 258.8 1.34 90% 54.5 0.72 60.9 0.81 90% 168.1 1.50 188.7 1.69 89% 35% US $35 US $31
B2Gold Corp. TSX:BTO US $1,091 US $112 US $1,429 27.3 0.67 38.6 0.95 71% 12.5 1.24 12.5 1.24 100% 14.8 0.48 26.2 0.85 57% 64% US $52 US $37
Barrick Gold Corporation TSX:ABX US $16,281 US $3,621 US $26,465 202.4 0.85 294.7 1.24 69% 98.5 1.10 131.2 1.46 75% 103.9 0.70 163.5 1.11 64% 30% US $131 US $90
Compañía de Minas Buenaventura S.A.A. NYSE:BVN US $1,441 US ($181) US $2,230 17.7 0.22 57.5 0.71 31% 8.9 0.24 26.2 0.71 34% 8.6 0.21 31.1 0.74 28% 41% US $126 US $39
Detour Gold Corporation TSX:DGC US $2,770 US $189 US $3,063 21.6 0.98 21.6 0.98 100% 16.4 0.99 16.4 0.99 100% 5.2 0.96 5.2 0.96 100% 24% US $142 US $142
Eldorado Gold Corporation TSX:ELD US $2,323 US $456 US $2,809 44.8 0.86 57.5 1.11 78% 24.4 1.18 31.2 1.50 78% 18.3 0.59 24.2 0.78 76% 66% US $63 US $49
Gold Fields Ltd. JSE:GFI US $3,401 US $386 US $4,903 111.2 2.36 124.0 2.63 90% 47.5 2.98 48.6 3.06 98% 28.8 1.09 40.4 1.53 71% 64% US $44 US $40
Goldcorp Inc. TSX:G US $12,470 US $282 US $15,145 116.1 0.58 199.4 1.00 58% 47.7 0.62 88.0 1.15 54% 68.4 0.56 111.3 0.91 61% 38% US $130 US $76
Harmony Gold Mining Company Limited JSE:HAR US $1,510 US $57 US $1,673 88.6 1.18 113.0 1.50 78% 29.2 0.81 39.0 1.08 75% 59.4 1.52 73.7 1.89 81% 39% US $19 US $15
IAMGOLD Corp. TSX:IMG US $1,016 US $702 US $1,286 32.8 1.29 32.8 1.29 100% 9.8 1.35 9.8 1.35 100% 23.0 1.26 23.0 1.26 100% 40% US $39 US $39
Kinross Gold Corporation TSX:K US $3,545 US $1,590 US $4,553 67.3 0.69 73.2 0.75 92% 32.8 0.70 36.0 0.76 91% 34.4 0.69 37.2 0.74 93% 17% US $68 US $62
New Gold, Inc. TSX:NGD US $1,891 US $467 US $2,361 16.7 0.73 23.9 1.05 70% 8.2 0.74 12.2 1.10 67% 8.5 0.73 11.7 1.00 72% 21% US $141 US $99
Newmont Mining Corporation NYSE:NEM US $14,192 US $3,567 US $20,569 138.2 0.93 173.5 1.17 80% 86.1 0.98 100.2 1.14 86% 52.1 0.87 73.2 1.22 71% 36% US $149 US $119
Randgold Resources Limited LSE:RRS US $8,795 US $384 US $8,802 28.3 3.19 28.3 3.19 100% 15.2 3.57 15.2 3.57 100% 13.1 2.85 13.1 2.85 100% 52% US $311 US $311
Tahoe Resources Inc. TSX:THO US $2,164 US $66 US $2,106 8.2 0.38 18.9 0.87 43% 3.8 0.41 9.8 1.07 38% 4.4 0.35 9.1 0.73 48% 48% US $258 US $111
Yamana Gold, Inc. TSX:YRI US $2,868 US $0 US $4,636 71.6 0.49 119.5 0.81 60% 22.2 0.32 49.8 0.72 45% 49.4 0.64 69.7 0.90 71% 41% US $65 US $39
Group Average - Total # Companies: 17 US $113 US $85
Equivalency assumptions (US$ / 09-18-15): $1,259/oz Au, $15.49/oz Ag, $978/oz Pt, $556/oz Pd, $2.28/lb Cu, $0.84/lb Zn, $0.85/lb Pb, $4.23/lb Ni, $5.55/lb Mo, $10.59/lb Co, $5,300/t Sb, $31.63/lb U3O8, $0.20/lb Sn, $93.00/t HCC, $52.11/t 62% Fe
Source: SNL Financial retrieved on March 4, 2016
% AuAu
(Moz)
Au
(g/t)
AuEq
(Moz)
AuEq
(g/t)
EV/oz
Au
EV/oz
AuEq
Au
(Moz)
Au
(g/t)
AuEq
(Moz)
AuEq
(g/t)% Au
% Au
Inferred
Global Reserves & Resources Reserves Resources (M&I and Inferred)
Au
(Moz)
Au
(g/t)
AuEq
(Moz)
AuEq
(g/t)% Au
GlobalEnterprise
Value
(millions)
Symbol
Market
Capitalization
(millions)
Working
Capital
(millions)
Alacer Gold Corp. TSX:ASR US $600 US $404 US $357 7.9 0.41 15.3 0.79 51% 3.3 2.15 3.6 2.35 91% 4.6 0.26 11.7 0.66 39% 54% US $45 US $23
Alamos Gold, Inc. TSX:AGI US $1,357 US $412 US $1,355 22.8 1.14 23.8 1.19 96% 6.2 1.62 6.2 1.62 100% 16.6 1.03 17.6 1.09 94% 33% US $59 US $57
Argonaut Gold Inc. TSX:AR US $182 US $101 US $143 12.7 0.54 13.3 0.56 96% 4.3 0.63 4.3 0.63 100% 8.5 0.50 9.0 0.53 94% 17% US $11 US $11
Centamin Plc LSE:CEY US $1,571 US $310 US $1,391 10.2 1.19 10.2 1.19 100% 4.4 1.08 4.4 1.08 100% 5.8 1.28 5.8 1.28 100% 31% US $137 US $137
China Gold International Resources Corp Ltd TSX:CGG US $704 US ($204) US $1,567 12.7 0.18 55.4 0.79 23% 5.8 0.30 21.4 1.12 27% 6.9 0.14 34.0 0.67 20% 51% US $124 US $28
Dundee Precious Metals Inc. TSX:DPM US $154 US $34 US $296 6.2 3.38 8.9 4.87 69% 3.1 3.34 4.0 4.32 77% 3.1 3.43 4.8 5.45 63% 38% US $48 US $33
Evolution Mining Limited ASX:EVN US $2,009 US $26 US $2,346 19.9 1.33 20.3 1.35 98% 7.3 1.30 7.3 1.30 100% 12.5 1.34 12.9 1.38 97% 41% US $118 US $116
G-Resources Group Limited SEHK:1051 US $749 US $332 US $455 7.1 1.21 7.9 1.35 90% 2.6 2.09 2.9 2.34 89% - - - - - - US $64 US $58
Nord Gold N.V. LSE:NORD US $1,131 US $327 US $1,784 29.9 0.66 33.0 0.73 91% 11.6 0.52 11.9 0.53 98% 18.2 0.80 21.1 0.93 87% 41% US $60 US $54
Northern Star Resources Limited ASX:NST US $1,769 US $118 US $1,627 10.8 3.44 23.7 7.54 46% 1.8 5.51 1.8 5.51 100% 6.1 3.58 19.0 11.12 32% 60% US $150 US $69
OceanaGold Corporation TSX:OGC US $1,748 US $188 US $1,762 15.6 1.38 16.8 1.49 93% 5.1 1.40 5.9 1.63 86% 9.0 1.28 9.2 1.30 98% 49% US $113 US $105
Primero Mining Corp. TSX:P US $283 US $5 US $355 6.8 0.84 10.0 1.24 67% 2.0 1.50 2.9 2.19 68% 4.8 0.71 7.2 1.06 67% 26% US $53 US $35
Regis Resources Limited ASX:RRL US $1,002 US $56 US $961 7.8 0.95 7.8 0.95 100% 2.0 1.06 2.0 1.06 100% 5.8 0.92 5.8 0.92 100% 19% US $123 US $123
Resolute Mining Limited ASX:RSG US $293 US $68 US $292 13.4 1.51 13.4 1.51 100% 4.8 1.60 4.8 1.60 100% 8.6 1.47 8.6 1.47 100% 34% US $22 US $22
SEMAFO Inc. TSX:SMF US $1,088 US $158 US $1,068 7.8 2.82 7.8 2.82 100% 3.2 3.34 3.2 3.34 100% 4.6 2.55 4.6 2.55 100% 42% US $137 US $137
Group Average - Total # Companies: 15 US $84 US $67
Equivalency assumptions (US$ / 09-18-15): $1,259/oz Au, $15.49/oz Ag, $978/oz Pt, $556/oz Pd, $2.28/lb Cu, $0.84/lb Zn, $0.85/lb Pb, $4.23/lb Ni, $5.55/lb Mo, $10.59/lb Co, $5,300/t Sb, $31.63/lb U3O8, $0.20/lb Sn, $93.00/t HCC, $52.11/t 62% Fe
Source: SNL Financial retrieved on March 4, 2016
% AuAu
(Moz)
Au
(g/t)
AuEq
(Moz)
AuEq
(g/t)
EV/oz
Au
EV/oz
AuEq
Au
(Moz)
Au
(g/t)
AuEq
(Moz)
AuEq
(g/t)% Au
% Au
Inferred
Global Reserves & Resources Reserves Resources (M&I and Inferred)
Au
(Moz)
Au
(g/t)
AuEq
(Moz)
AuEq
(g/t)% Au
GlobalEnterprise
Value
(millions)
Company Symbol
Market
Capitalization
(millions)
Working
Capital
(millions)

The Weekly Dig 3/4/16
Haywood Mining [email protected] Page 29
Junior Gold Producers – EV/oz Comparables
Aureus Mining Inc. TSX:AUE US $59 US ($14) US $153 2.5 2.48 2.5 2.48 100% 0.8 3.38 0.8 3.38 100% 1.7 2.19 1.7 2.19 100% 68% US $61 US $61
Avnel Gold Mining Ltd. TSX:AVK US $57 US $11 US $33 2.3 4.15 2.3 4.15 100% - - - - - 2.3 4.15 2.3 4.15 100% 6% US $14 US $14
Banro Corporation TSX:BAA US $93 US ($58) US $349 13.0 1.60 13.0 1.60 100% 2.9 2.11 2.9 2.11 100% 10.1 1.49 10.1 1.49 100% 52% US $27 US $27
Endeavour Mining Corporation TSX:EDV US $570 US $83 US $739 11.1 1.93 11.1 1.93 100% 4.9 2.17 4.9 2.17 100% 4.8 1.54 4.8 1.54 100% 50% US $66 US $66
Golden Star Resources, Ltd. TSX:GSC US $136 US ($66) US $150 13.0 2.67 13.0 2.67 100% 1.9 2.79 1.9 2.79 100% 11.1 2.65 11.1 2.65 100% 28% US $12 US $12
Goldgroup Mining Inc. TSX:GGA US $13 US ($1) US $16 0.5 0.76 0.8 1.29 59% - - - - - 0.5 0.76 0.8 1.29 59% 41% US $35 US $21
Guyana Goldfields Inc. TSX:GUY US $503 US ($9) US $633 8.9 2.95 8.9 2.95 100% 3.0 2.94 3.0 2.94 100% 5.9 2.95 5.9 2.95 100% 36% US $71 US $71
Kirkland Lake Gold Inc. TSX:KGI US $730 US $61 US $757 10.7 5.22 10.7 5.22 100% 2.3 9.51 2.3 9.51 100% 8.4 4.65 8.4 4.65 100% 41% US $71 US $71
Mandalay Resources Corp. TSX:MND US $271 US $20 US $280 1.4 0.76 3.7 1.97 39% 0.7 2.35 1.0 3.26 72% 0.7 0.46 2.7 1.72 27% 30% US $195 US $76
Metanor Resources Inc. TSXV:MTO US $24 US ($0) US $28 1.5 2.09 1.5 2.09 100% 0.2 7.37 0.2 7.37 100% 1.3 1.88 1.3 1.88 100% 75% US $19 US $19
Minera IRL Limited AIM:MIRL US $8 US ($27) US $0 2.6 2.63 2.6 2.64 100% 1.0 3.38 1.0 3.38 100% 1.6 2.31 1.6 2.32 100% 74% - -
Newmarket Gold Inc. TSX:NMI US $227 US $23 US $215 0.9 2.16 0.9 2.16 100% 0.1 3.58 0.1 3.58 100% 0.8 2.00 0.8 2.00 100% 19% US $144 US $144
Orosur Mining Inc. TSX:OMI US $10 US $4 US $8 1.7 0.71 2.3 0.97 73% 0.1 2.26 0.1 2.26 100% 1.1 0.53 1.7 0.85 63% 7% US $5 US $4
Orvana Minerals Corp. TSX:ORV US $19 US $15 US $3 3.5 2.50 4.2 2.95 85% 0.3 2.82 0.4 3.67 77% 3.2 2.47 3.7 2.88 86% 48% US $1 US $1
Perseus Mining Limited ASX:PRU US $147 US $122 US $86 8.0 1.02 8.0 1.02 100% 2.5 1.29 2.5 1.29 100% 1.1 0.74 1.1 0.74 100% 190% US $11 US $11
Richmont Mines Inc. AMEX:RIC US $289 US $35 US $252 4.9 3.63 4.9 3.63 100% 0.6 8.05 0.6 8.05 100% 4.2 3.35 4.2 3.35 100% 58% US $52 US $52
Rubicon Minerals Corporation TSX:RMX US $16 US $27 US $28 0.4 6.39 0.4 6.39 100% - - - - - 0.4 6.39 0.4 6.39 100% 74% US $69 US $69
Shanta Gold Ltd. AIM:SHG US $48 US $15 US $95 3.0 3.16 3.0 3.16 100% 0.8 4.15 0.8 4.15 100% 2.1 2.91 2.1 2.91 100% 61% US $32 US $32
Teranga Gold Corporation TSX:TGZ US $179 US $34 US $147 4.9 1.66 4.9 1.68 99% 2.4 1.38 2.4 1.38 100% 2.5 2.07 2.5 2.10 98% 34% US $30 US $30
Timmins Gold Corp. TSX:TMM US $83 US ($6) US $87 6.8 0.64 6.9 0.66 98% 1.4 0.50 1.4 0.50 100% 5.3 0.69 5.5 0.71 97% 43% US $13 US $13
Wesdome Gold Mines Ltd. TSX:WDO US $150 US $2 US $156 5.6 1.62 5.6 1.62 100% 0.4 4.63 0.4 4.63 100% 5.2 1.54 5.2 1.54 100% 54% US $28 US $28
Group Average - Total # Companies: 21 US $48 US $41
Equivalency assumptions (US$ / 09-18-15): $1,259/oz Au, $15.49/oz Ag, $978/oz Pt, $556/oz Pd, $2.28/lb Cu, $0.84/lb Zn, $0.85/lb Pb, $4.23/lb Ni, $5.55/lb Mo, $10.59/lb Co, $5,300/t Sb, $31.63/lb U3O8, $0.20/lb Sn, $93.00/t HCC, $52.11/t 62% Fe
Source: SNL Financial retrieved on March 4, 2016
% AuAu
(Moz)
Au
(g/t)
AuEq
(Moz)
AuEq
(g/t)
EV/oz
Au
EV/oz
AuEq
Au
(Moz)
Au
(g/t)
AuEq
(Moz)
AuEq
(g/t)% Au
% Au
Inferred
Global Reserves & Resources Reserves Resources (M&I and Inferred)
Au
(Moz)
Au
(g/t)
AuEq
(Moz)
AuEq
(g/t)% Au
GlobalEnterprise
Value
(millions)
Company Symbol
Market
Capitalization
(millions)
Working
Capital
(millions)

The Weekly Dig 3/4/16
Haywood Mining [email protected]
Page 30
Gold Development-Stage Companies (Engineering Study Complete) – EV/oz Comparables
Company
African Gold Group Inc. TSXV:AGG US $11 US ($1) US $11 2.0 1.01 2.0 1.01 100% 0.5 1.25 0.5 1.25 100% 1.5 0.96 1.5 0.96 100% 59% US $5 US $5
Almaden Minerals Ltd. TSX:AMM US $60 US $3 US $56 2.0 0.54 3.4 0.92 59% - - - - - 2.0 0.54 3.4 0.92 59% 18% US $28 US $17
Asanko Gold Inc. TSX:AKG US $416 US $120 US $384 9.4 1.68 9.4 1.68 100% 4.7 1.68 4.7 1.68 100% 4.7 1.68 4.7 1.68 100% 48% US $41 US $41
ATAC Resources Ltd. TSXV:ATC US $49 US $12 US $36 0.8 1.61 0.8 1.64 98% - - - - - 0.8 1.61 0.8 1.64 98% 36% US $45 US $45
Azumah Resources Ltd DB:A6Z US $12 US $0 US $12 1.8 1.51 1.8 1.51 100% 0.6 2.14 0.6 2.14 100% 1.2 1.33 1.2 1.33 100% 49% US $7 US $7
Belo Sun Mining Corp TSX:BSX US $121 US $7 US $112 6.8 1.04 6.8 1.04 100% 3.8 1.02 3.8 1.02 100% 3.0 1.07 3.0 1.07 100% 52% US $17 US $17
NewCastle Gold Ltd. TSXV:NCA US $16 US ($1) US $16 5.0 0.60 5.0 0.60 100% - - - - - 5.0 0.60 5.0 0.60 100% 16% US $3 US $3
Chaarat Gold Holdings Ltd AIM:CGH US $26 US $6 US $22 6.4 2.76 6.4 2.79 99% 4.7 2.79 4.7 2.79 100% 1.6 2.67 1.7 2.81 95% 59% US $3 US $3
Chalice Gold Mines Limited ASX:CHN US $27 US $29 US $0 1.9 2.33 1.9 2.33 100% - - - - - 1.9 2.33 1.9 2.33 100% 62% US $0 US $0
Chesapeake Gold Corp. TSXV:CKG US $90 US $19 US $71 19.8 0.49 29.3 0.73 68% 18.5 0.50 27.7 0.75 67% 1.4 0.44 1.6 0.52 84% 59% US $4 US $2
Dalradian Resources Inc. TSX:DNA US $149 US $15 US $131 3.5 9.87 3.5 10.01 99% - - - - - 3.5 9.87 3.5 10.01 99% 71% US $37 US $37
Exeter Resource Corporation TSX:XRC US $52 US $18 US $34 25.3 0.49 37.4 0.72 68% 0.0 3.31 0.0 3.31 100% 25.3 0.49 37.4 0.72 68% 7% US $1 US $1
First Mining Finance Corp. TSXV:FF US $91 US ($1) US $91 8.1 1.35 8.8 1.45 93% - - - - - 8.1 1.35 - - - 29% US $11 US $10
Gold Road Resources Limited ASX:GOR US $257 US $35 US $220 6.1 1.25 6.2 1.29 98% 3.2 1.22 3.2 1.22 100% 2.9 1.30 3.0 1.37 95% 54% US $36 US $35
Golden Queen Mining Co. Ltd. TSX:GQM US $127 US $43 US $191 0.9 0.53 1.1 0.64 83% 0.5 0.66 0.6 0.80 83% 0.4 0.43 0.5 0.52 82% 30% US $214 US $177
Goldquest Mining Corp. TSXV:GQC US $32 US $2 US $30 2.4 2.33 3.5 3.34 70% - - - - - 2.4 2.33 3.5 3.34 70% 23% US $12 US $9
Goldrock Mines Corp. TSXV:GRM US $28 US $1 US $25 3.5 0.44 4.5 0.57 76% 1.5 0.72 1.5 0.72 100% 2.0 0.33 3.0 0.52 65% 48% US $7 US $6
Gryphon Minerals Ltd. ASX:GRY US $25 US $12 US $10 3.7 1.37 3.7 1.37 100% 0.8 1.48 0.8 1.48 100% 2.8 1.34 2.8 1.34 100% 23% US $3 US $3
Hummingbird Resources PLC AIM:HUM US $30 US ($7) US $47 6.4 1.64 6.4 1.64 100% 0.6 3.04 0.6 3.04 100% 5.8 1.57 5.8 1.57 100% 53% US $7 US $7
Integra Gold Corp. TSXV:ICG US $125 US $20 US $106 5.0 6.38 5.0 6.39 100% - - - - - 5.0 6.38 5.0 6.39 100% 57% US $21 US $21
International Tower Hill Mines Ltd. TSX:ITH US $36 US $7 US $28 20.1 0.59 20.1 0.59 100% 10.1 0.69 10.1 0.69 100% 10.1 0.51 10.1 0.51 100% 44% US $1 US $1
Kaminak Gold Corp. TSXV:KAM US $162 US $4 US $157 5.2 1.39 5.2 1.39 100% 2.2 1.45 2.2 1.45 100% 3.0 1.34 3.0 1.34 100% 74% US $30 US $30
KEFI Minerals Plc AIM:KEFI US $13 US ($1) US $11 1.9 1.96 1.9 1.96 100% 1.0 2.12 1.0 2.12 100% 0.9 1.82 0.9 1.82 100% 20% US $6 US $6
Lupaka Gold Corp. TSXV:LPK US $12 US ($1) US $12 2.8 1.17 3.1 1.31 89% - - - - - 2.8 1.17 3.1 1.31 89% 42% US $4 US $4
Lydian International Limited TSX:LYD US $36 US $9 US $26 5.0 0.69 5.3 0.72 95% 2.4 0.78 2.6 0.82 95% 2.6 0.62 2.8 0.65 95% 77% US $5 US $5
Magellan Minerals Limited TSXV:MNM US $10 US ($3) US $11 2.2 1.71 2.3 1.74 98% - - - - - 2.2 1.71 2.3 1.74 98% 70% US $5 US $5
Metals Exploration Plc AIM:MTL US $93 US ($11) US $146 1.7 1.62 1.9 1.81 90% 0.9 1.86 1.0 2.03 92% 0.8 1.43 1.0 1.63 87% 82% US $84 US $76
Midas Gold Corp. TSX:MAX US $46 US $4 US $41 6.5 1.57 7.0 1.68 93% 4.6 1.60 4.9 1.72 93% 2.0 1.49 2.1 1.59 94% 55% US $6 US $6
Moneta Porcupine Mines Inc. TSX:ME US $27 US $0 US $27 4.3 1.17 4.3 1.17 100% - - - - - 4.3 1.17 4.3 1.17 100% 75% US $6 US $6
Orezone Gold Corporation TSXV:ORE US $36 US $6 US $30 5.1 1.08 5.1 1.08 100% 1.3 0.76 1.3 0.76 100% 3.8 1.26 3.8 1.26 100% 21% US $6 US $6
Pershimco Resources Inc. TSXV:PRO US $34 US ($3) US $21 0.8 0.69 1.0 0.84 82% 0.5 0.77 0.5 0.82 94% 0.1 7.46 0.1 7.46 100% 12% US $26 US $22
Pilot Gold Inc. TSX:PLG US $36 US $10 US $48 2.1 0.36 4.0 0.71 52% - - - - - 2.1 0.36 4.0 0.71 52% 36% US $23 US $12
Premier Gold Mines Limited TSX:PG US $428 US $59 US $375 8.9 2.24 9.0 2.27 99% 0.3 4.38 0.3 4.46 98% 8.5 2.20 8.7 2.23 99% 25% US $42 US $42
Pretium Resources Inc. TSX:PVG US $931 US $323 US $917 50.4 0.70 62.0 0.86 81% 7.5 14.14 7.9 14.85 95% 42.9 0.60 54.1 0.76 79% 35% US $18 US $15
Red Eagle Mining Corporation TSXV:RD US $52 US $5 US $45 0.6 3.35 0.6 3.35 100% 0.4 5.19 0.4 5.19 100% 0.2 1.98 0.2 1.98 100% 64% US $73 US $73
Roxgold Inc. TSXV:ROG US $217 US $35 US $190 1.1 13.87 1.1 13.87 100% 0.8 11.83 0.8 11.83 100% 0.3 23.05 0.3 23.05 100% 84% US $175 US $175
RTG Mining Inc. TSX:RTG US $40 US $7 US $33 0.6 1.63 1.1 3.27 50% - - - - - 0.6 1.63 1.1 3.27 50% 40% US $59 US $30
Sabina Gold & Silver Corp. TSX:SBB US $139 US $15 US $125 7.2 6.21 7.2 6.21 100% 2.5 6.30 2.5 6.30 100% 4.7 6.16 4.7 6.16 100% 40% US $17 US $17
Sandspring Resources Ltd. TSXV:SSP US $20 US $3 US $17 10.0 0.84 11.1 0.93 90% 4.1 1.00 4.5 1.10 91% 5.9 0.75 6.6 0.85 89% 53% US $2 US $2
Seabridge Gold, Inc. TSX:SEA US $579 US $5 US $571 87.8 0.54 144.7 0.90 61% 44.7 0.62 65.9 0.91 68% 43.1 0.48 78.8 0.89 55% 70% US $7 US $4
Sihayo Gold Limited ASX:SIH US $15 US ($2) US $12 1.1 2.60 1.1 2.60 100% 0.4 2.41 0.4 2.41 100% 0.7 2.73 0.7 2.73 100% 43% US $11 US $11
Terraco Gold Corp. TSXV:TEN US $11 US $0 US $11 1.0 0.70 1.0 0.70 100% - - - - - 1.0 0.70 1.0 0.70 100% 8% US $10 US $10
Torex Gold Resources Inc TSX:TXG US $1,032 US $77 US $1,264 9.3 2.63 12.0 3.40 78% 4.2 2.69 4.2 2.75 98% 5.2 2.59 7.8 3.90 66% 88% US $136 US $105
True Gold Mining Inc. TSXV:TGM US $118 US ($2) US $97 4.5 1.10 4.5 1.10 100% 0.9 0.89 0.9 0.89 100% 3.6 1.17 3.6 1.17 100% 59% US $22 US $22
Vast Resources plc AIM:VAST US $15 US ($3) US $30 2.4 1.57 2.8 1.85 85% 0.5 1.90 0.5 1.90 100% 1.9 1.50 2.3 1.84 82% 72% US $13 US $11
Victoria Gold Corp. TSXV:VIT US $60 US $7 US $49 6.4 0.66 6.5 0.67 99% 2.3 0.78 2.3 0.78 100% 4.1 0.61 4.2 0.62 99% 38% US $8 US $8
Group Average - Total # Companies: 46 US $28 US $25
Group Average - 0 - 20 million ounces # Companies: 42 US $30 US $27
Group Average - 20 - 50 million ounces # Companies: 2 US $1 US $2
Group Average - +50 million ounces # Companies: 2 US $12 US $9
Equivalency assumptions (US$ / 09-18-15): $1,259/oz Au, $15.49/oz Ag, $978/oz Pt, $556/oz Pd, $2.28/lb Cu, $0.84/lb Zn, $0.85/lb Pb, $4.23/lb Ni, $5.55/lb Mo, $10.59/lb Co, $5,300/t Sb, $31.63/lb U3O8, $0.20/lb Sn, $93.00/t HCC, $52.11/t 62% Fe
Source: SNL Financial retrieved on March 4, 2016
Symbol
Market
Capitalization
(millions)
Working
Capital
(millions)
Enterprise
Value
(millions)
Global Reserves & Resources
Au
(Moz)
Au
(g/t)
AuEq
(Moz)
AuEq
(g/t)% Au
Reserves
Au
(Moz)
Au
(g/t)
AuEq
(Moz)
AuEq
(g/t)% Au
Global
EV/oz
Au
EV/oz
AuEq
Resources (M&I and Inferred)
Au
(Moz)
Au
(g/t)
AuEq
(Moz)
AuEq
(g/t)% Au
% Au
Inferred

The Weekly Dig 3/4/16
Haywood Mining [email protected]
Page 31
Gold Exploration-Stage Companies (Resource Only) – EV/oz Comparables
Adventure Gold, Inc. TSXV:AGE US $11 US $1 US $10 0.8 2.61 0.8 2.61 100% - - - - - 0.8 2.61 0.8 2.61 100% 98% US $12 US $12
Alexandria Minerals Corporation TSXV:AZX US $8 US $1 US $7 2.0 1.99 2.4 2.42 82% - - - - - 2.0 1.99 2.4 2.42 82% 50% US $4 US $3
Atacama Pacific Gold Corporation TSXV:ATM US $17 US ($1) US $17 5.9 0.37 5.9 0.37 100% 3.7 0.40 3.7 0.40 100% 2.1 0.33 2.1 0.33 100% 29% US $3 US $3
Auryn Resources Inc. TSXV:AUG US $52 US $4 US $47 1.6 5.21 1.6 5.21 100% - - - - - 1.6 5.21 - - - 59% US $28 US $28
Balmoral Resources Ltd TSX:BAR US $57 US $4 US $53 0.6 0.90 0.6 0.90 100% - - - - - 0.6 0.90 0.6 0.90 100% 68% US $89 US $89
Brazil Resources Inc. TSXV:BRI US $33 US $1 US $32 7.0 0.67 8.6 0.82 82% - - - - - 7.0 0.67 8.6 0.82 82% 60% US $5 US $4
Calibre Mining Corp. TSXV:CXB US $17 US $1 US $16 0.4 1.61 0.5 2.11 76% - - - - - 0.4 1.61 0.5 2.13 75% 91% US $42 US $32
Cardinal Resources Limited ASX:CDV US $17 US $0 US $17 - - - - - - - - - - - - - - - - - -
Columbus Gold Corp. TSX:CGT US $42 US $1 US $42 2.3 1.48 2.3 1.48 100% - - - - - 2.3 1.48 2.3 1.48 100% 22% US $18 US $18
Condor Gold PLC AIM:CNR US $30 US $4 US $26 3.7 3.08 4.0 3.33 93% 0.7 3.04 0.7 3.11 98% 3.1 3.09 3.4 3.38 91% 65% US $7 US $7
Corvus Gold Inc. TSX:KOR US $42 US $3 US $40 2.0 0.29 2.1 0.31 96% - - - - - 2.0 0.29 2.1 0.31 96% 69% US $20 US $19
Eastmain Resources Inc. TSX:ER US $37 US $3 US $34 1.8 4.37 1.8 4.37 100% - - - - - 1.8 4.37 1.8 4.37 100% 34% US $19 US $19
Eco Oro Minerals Corp TSX:EOM US $21 US $1 US $19 3.5 4.38 3.7 4.60 95% - - - - - 3.5 4.38 3.7 4.60 95% 37% US $5 US $5
Eurasian Minerals Inc. TSXV:EMX US $32 US $2 US $31 1.0 0.07 6.4 0.47 16% - - - - - 1.0 0.07 6.4 0.47 16% 33% US $31 US $5
Falco Resources Ltd. TSXV:FPC US $33 US $2 US $31 4.3 1.86 6.4 2.78 67% - - - - - 4.3 1.86 6.4 2.78 67% 20% US $7 US $5
GobiMin Inc. TSXV:GMN US $13 US $23 US ($15) 2.9 1.48 4.5 2.31 64% - - - - - 2.9 1.48 4.5 2.31 64% 63% - -
Gold Bullion Development Corp. TSXV:GBB US $15 US ($2) US $15 3.2 0.89 3.2 0.90 98% - - - - - 3.2 0.89 3.2 0.90 98% 49% US $5 US $5
Gold Canyon Resources Inc. TSXV:GCU US $41 US $1 US $40 - - - - - - - - - - - - - - - - - -
Gold Standard Ventures Corp TSXV:GSV US $223 US $11 US $212 2.1 0.63 2.2 0.66 95% - - - - - 2.1 0.63 2.2 0.66 95% 80% US $103 US $97
Golden Reign Resources Ltd. TSXV:GRR US $11 US ($0) US $11 0.9 7.81 1.0 7.97 98% - - - - - 0.9 7.81 1.0 7.97 98% 84% US $12 US $12
Harte Gold Corp. TSX:HRT US $22 US $0 US $21 0.5 9.47 0.5 9.47 100% - - - - - 0.5 9.47 0.5 9.47 100% 33% US $45 US $45
IDM Mining Ltd. TSXV:IDM US $8 US ($1) US $8 0.5 8.06 0.5 8.38 96% - - - - - 0.5 8.06 0.5 8.38 96% 18% US $17 US $17
Kasbah Resources Limited ASX:KAS US $9 US $3 US $6 0.2 0.56 0.3 0.63 88% - - 0.0 0.08 - 0.2 1.20 0.2 1.28 94% - US $27 US $23
Lexam VG Gold Inc. TSX:LEX US $29 US $1 US $28 2.4 2.74 2.4 2.74 100% - - - - - 2.4 2.74 2.4 2.74 100% 39% US $11 US $11
Lion One Metals Limited TSXV:LIO US $19 US $0 US $19 0.7 0.09 10.7 1.37 7% - - - - - 0.7 0.09 10.7 1.37 7% 60% US $26 US $2
Marathon Gold Corporation TSX:MOZ US $20 US $2 US $18 1.3 2.37 1.3 2.37 100% - - - - - 1.3 2.37 1.3 2.37 100% 15% US $14 US $14
Niogold Mining Corp. TSXV:NOX US $41 US $1 US $39 2.1 1.36 2.1 1.36 100% - - - - - 2.1 1.36 2.1 1.36 100% 28% US $18 US $18
Orca Gold Inc. TSXV:ORG US $15 US $14 US ($8) 1.6 1.78 1.6 1.82 98% - - - - - 1.6 1.78 1.6 1.82 98% 28% - -
Orex Minerals Inc. TSXV:REX US $32 US $5 US $29 0.1 2.45 0.1 2.45 100% - - - - - 0.1 2.45 0.1 2.45 100% 47% US $450 US $450
Puma Exploration Inc. TSXV:PUM US $5 US ($0) US $5 0.3 2.30 0.5 4.78 48% - - - - - 0.3 2.30 0.5 4.78 48% 2% US $17 US $8
Pure Gold Mining Inc. TSXV:PGM US $23 US $4 US $17 1.2 9.47 1.2 9.47 100% - - - - - 1.2 9.47 1.2 9.47 100% 24% US $14 US $14
Renaissance Minerals Limited ASX:RNS US $15 US $1 US $14 0.6 2.22 0.6 2.22 100% - - - - - 0.6 2.22 0.6 2.22 100% 15% US $25 US $25
RNI NL ASX:RNI US $12 US ($18) US $27 - - 0.1 0.12 - - - - - - - - 0.1 0.12 - - - US $374
Rye Patch Gold Corp. TSXV:RPM US $20 US $4 US $17 2.5 0.35 2.9 0.42 85% - - - - - 2.5 0.35 2.9 0.42 85% 32% US $7 US $6
Sarama Resources Limited TSXV:SWA US $6 US $1 US $5 0.8 1.69 0.8 1.69 100% - - - - - 0.8 1.69 0.8 1.69 100% 100% US $6 US $6
Spanish Mountain Gold Ltd TSXV:SPA US $9 US ($1) US $9 7.0 0.40 7.1 0.40 98% - - - - - 7.0 0.40 7.1 0.40 98% 50% US $1 US $1
Temex Resources Corp. TSXV:TME US $17 US $1 US $16 - - - - - - - - - - - - - - - - - -
Teras Resources Inc. TSXV:TRA US $9 US ($0) US $8 1.1 0.48 1.3 0.55 88% - - - - - 1.1 0.48 1.3 0.55 88% 10% US $7 US $7
Treasury Metals Inc. TSX:TML US $26 US ($4) US $30 1.6 1.88 1.8 2.17 86% - - - - - 1.6 1.88 1.8 2.17 86% 24% US $19 US $16
TriMetals Mining Inc. TSX:TMI US $11 US $3 US $9 1.8 0.07 12.8 0.49 14% - - - - - 1.8 0.07 12.8 0.49 14% 47% US $5 US $1
West Kirkland Mining Inc. TSXV:WKM US $18 US $0 US $18 0.9 0.49 1.2 0.61 80% 0.6 0.58 0.7 0.68 85% 0.4 0.40 0.5 0.54 74% 46% US $19 US $15
Group Average - Total # Companies: 37 US $33 US $39
Equivalency assumptions (US$ / 09-18-15): $1,259/oz Au, $15.49/oz Ag, $978/oz Pt, $556/oz Pd, $2.28/lb Cu, $0.84/lb Zn, $0.85/lb Pb, $4.23/lb Ni, $5.55/lb Mo, $10.59/lb Co, $5,300/t Sb, $31.63/lb U3O8, $0.20/lb Sn, $93.00/t HCC, $52.11/t 62% Fe
Source: SNL Financial retrieved on March 4, 2016
Company Symbol
Market
Capitalization
(millions)
Working
Capital
(millions)
Enterprise
Value
(millions)
Au
(Moz)
Au
(g/t)
AuEq
(Moz)
Global Reserves & Resources Reserves Resources (M&I and Inferred)
Au
(Moz)
Au
(g/t)
AuEq
(Moz)
AuEq
(g/t)
AuEq
(g/t)
% Au
Inferred
EV/oz
Au
EV/oz
AuEq
Au
(Moz)
Au
(g/t)
AuEq
(Moz)
AuEq
(g/t)% Au
Global
% Au% Au

The Weekly Dig 3/4/16
Haywood Mining [email protected] Page 32
Silver – EV/oz Comparables
Alexco Resource Corporation TSX:AXR US $57 US $8 US $52 67 319 115 543 59% - - - - - 67 319 115 543 59% 18% US $0.78 US $0.46
Argentex Mining Corporation OTCPK:AGXM.F US $4 US $0 US $4 26 93 51 187 50% - - - - - 26 93 51 187 50% 18% US $0.16 US $0.08
Athena Silver Corp OTCPK:AHNR US $2 US ($2) US $4 43 67 43 67 100% - - - - - 43 67 43 67 100% - US $0.08 US $0.08
Bear Creek Mining Corp. TSXV:BCM US $72 US $22 US $49 523 41 1,018 79 51% 291 52 581 103 50% 232 32 437 61 53% 33% US $0.09 US $0.05
Defiance Silver Corp. TSXV:DEF US $4 US ($0) US $5 17 182 18 192 95% - - - - - 17 182 18 192 95% 100% US $0.27 US $0.26
Dolly Varden Silver Corporation TSXV:DV US $2 US ($0) US $2 43 333 43 333 100% - - - - - 43 333 43 333 100% 25% US $0.05 US $0.05
Global Minerals Ltd. TSXV:CTG.H US $0 US ($0) US $0 - - - - - - - - - - - - - - - - - -
Golden Arrow Resources Corp. TSXV:GRG US $10 US ($1) US $11 64 85 101 135 63% 10 211 11 229 92% 53 76 90 129 59% 43% US $0.17 US $0.10
Golden Minerals Company AMEX:AUMN US $27 US ($1) US $26 144 42 382 111 38% - - - - - 144 42 382 111 38% 59% US $0.18 US $0.07
Iberian Minerals Ltd. TSXV:IML US $11 US $4 US $7 22 9 301 120 7% - - - - - 22 9 301 120 7% - US $0.32 US $0.02
Investigator Resources Limited ASX:IVR US $5 US $2 US $4 33 117 33 117 100% - - - - - 33 117 33 117 100% 100% US $0.13 US $0.13
Kootenay Silver Inc TSXV:KTN US $15 US $1 US $14 13 27 41 84 32% - - - - - 13 27 41 84 32% 24% US $1.06 US $0.34
MacPhersons Resources Limited ASX:MRP US $26 US $2 US $24 20 24 83 97 24% 8 44 25 135 33% 12 18 58 86 21% 29% US $1.17 US $0.28
MAG Silver Corp. TSX:MAG US $582 US $78 US $504 143 62 443 193 32% - - - - - 143 62 443 193 32% 57% US $3.53 US $1.14
Minco Silver Corporation TSX:MSV US $27 US $44 US ($6) 162 158 254 248 64% 50 189 60 229 82% 112 148 193 254 58% 52% - -
Mines Management, Inc. AMEX:MGN US $16 US $0 US $19 231 68 486 143 48% - - - - - 231 68 486 143 48% 28% US $0.08 US $0.04
Northair Silver Corp. TSXV:INM US $11 US $2 US $9 63 85 75 102 83% - - - - - 63 85 75 102 83% 18% US $0.15 US $0.12
Silver Bear Resources Inc. TSX:SBR US $10 US ($8) US $18 57 576 57 576 100% - - - - - 57 576 57 576 100% 59% US $0.32 US $0.32
Silver Bull Resources, Inc. OTCPK:SVBL US $9 US $1 US $8 91 48 377 198 24% - - - - - 91 48 377 198 24% 0% US $0.09 US $0.02
Silver Predator Corp. TSXV:SPD US $1 US $6 US $5 21 60 29 83 72% - - - - - 21 60 29 83 72% 19% US $0.22 US $0.16
Silver Range Resources Ltd. TSXV:SNG US $2 US $1 US $0 40 28 170 116 24% - - - - - 40 28 170 116 24% 96% US $0.01 US $0.00
T inka Resources Ltd. TSXV:TK US $19 US $5 US $13 33 35 130 138 26% - - - - - 33 35 130 138 26% 57% US $0.40 US $0.10
Group Average - Total # Companies: 21 US $0.46 US $0.19
Equivalency assumptions (US$ / 09-18-15): $1,259/oz Au, $15.49/oz Ag, $978/oz Pt, $556/oz Pd, $2.28/lb Cu, $0.84/lb Zn, $0.85/lb Pb, $4.23/lb Ni, $5.55/lb Mo, $10.59/lb Co, $5,300/t Sb, $31.63/lb U3O8, $0.20/lb Sn, $93.00/t HCC, $52.11/t 62% Fe
Source: SNL Financial retrieved on March 4, 2016
EV/oz
Ag
EV/oz
AgEq
Ag
(Moz)
Ag
(g/t)
AgEq
(Moz)
AgEq
(g/t)% Ag
Global
% Ag% AgAg
(Moz)
Ag
(g/t)
AgEq
(Moz)
Global Reserves & Resources Reserves Resources (M&I and Inferred)
Ag
(Moz)
Ag
(g/t)
AgEq
(Moz)
AgEq
(g/t)
AgEq
(g/t)
% Ag
Inferred
Company Symbol
Market
Capitalization
(millions)
Working
Capital
(millions)
Enterprise
Value
(millions)

The Weekly Dig 3/4/16
Haywood Mining [email protected] Page 33
Copper Non-Producers – EV/lb Comparables
Shares Market Working LTD Enterprise Copper
Company Symbol Price O/S Capitalization Capital Value Value Ratio*** Reserve (P&P) Resource (Total)
(million) (million) (million) (million) (million) (% Contained) (CuEq** Mlb) (CuEq** Mlb) Reserve Total
Africo Resources Ltd. TSX:ARL C$ 0.48 71.3 US$ 25 US$ 45.4 US$ 0.0 US$ (20) Cu / Co 52% - 3,662 - -
AQM Copper Inc. TSXV:AQM C$ 0.07 141.0 US$ 7 US$ 1.8 US$ 0.0 US$ 5 Cu / Au 90% - 2,026 - $0.003
Aquila Resources Inc. TSX:AQA C$ 0.14 221.0 US$ 24 US$ (1.0) US$ 7.9 US$ 32 Au / Zn 19% - 1,587 - $0.020
Bellhaven Copper and Gold Inc. TSXV:BHV C$ 0.13 18.3 US$ 2 US$ (0.0) US$ 0.0 US$ 2 Au / Cu 40% - 1,036 - $0.002
Candente Copper Corp. TSX:DNT C$ 0.09 151.7 US$ 10 US$ (1.1) US$ 0.0 US$ 11 Cu / Au 89% - 12,427 - $0.001
Colorado Resources Ltd. TSXV:CXO C$ 0.09 61.4 US$ 4 US$ 2.0 US$ 0.0 US$ 2 Cu / Au 59% - 1,165 - $0.002
Copper Fox Metals Inc TSXV:CUU C$ 0.20 447.1 US$ 65 US$ 1.1 US$ 0.0 US$ 64 Cu / Au 68% 2,375 5,648 $0.027 $0.011
Coro Mining Corp. TSX:COP C$ 0.04 159.4 US$ 5 US$ (6.0) US$ 0.3 US$ 11 Cu / Au 84% 195 965 $0.057 $0.011
Crazy Horse Resources Inc. TSXV:CZH C$ 0.03 48.6 US$ 1 US$ 0.2 US$ 0.0 US$ 1 Cu / Au 80% 2,638 5,794 $0.000 $0.000
EurOmax Resources Limited TSXV:EOX C$ 0.51 116.8 US$ 45 US$ (8.1) US$ 0.0 US$ 53 Cu / Au 48% 1,848 2,680 $0.029 $0.020
Exeter Resource Corporation TSX:XRC C$ 0.83 88.4 US$ 55 US$ 18.0 US$ 0.0 US$ 37 Au / Cu 41% 12,504 22,559 $0.003 $0.002
Foran Mining Corporation TSXV:FOM C$ 0.10 90.8 US$ 6 US$ 1.0 US$ 0.0 US$ 5 Cu / Zn 46% - 1,756 - $0.003
Getty Copper Inc. TSXV:GTC C$ 0.02 108.4 US$ 2 US$ (0.2) US$ 0.0 US$ 2 Cu / Mo 96% 620 969 $0.003 $0.002
Gold Reach Resources Ltd. TSXV:GRV C$ 0.13 41.3 US$ 4 US$ 0.3 US$ 0.0 US$ 4 Cu / Mo 68% - 5,444 - $0.001
Highland Copper Co Inc. TSXV:HI C$ 0.11 154.0 US$ 13 US$ (7.9) US$ 0.0 US$ 21 Cu / Ag 96% 871 6,019 $0.024 $0.003
Indico Resources Ltd. TSXV:IDI C$ 0.06 147.0 US$ 7 US$ (2.5) US$ 0.0 US$ 9 Cu / - 100% - 410 - $0.022
Kiska Metals Corporation TSXV:KSK C$ 0.03 115.5 US$ 2 US$ 1.2 US$ 0.0 US$ 1 Au / Cu 38% - 2,048 - $0.000
Los Andes Copper Limited TSXV:LA C$ 0.10 218.1 US$ 16 US$ 0.2 US$ 0.0 US$ 15 Cu / Mo 89% - 12,305 - $0.001
Nevada Copper Corp. TSX:NCU C$ 0.77 80.5 US$ 46 US$ (21.1) US$ 94.1 US$ 162 Cu / Au 91% 5,791 7,917 $0.028 $0.020
NGEx Resources Inc. TSX:NGQ C$ 0.73 201.1 US$ 110 US$ 0.7 US$ 0.0 US$ 109 Cu / Au 76% - 27,655 - $0.004
Northern Dynasty Minerals Ltd. TSX:NDM C$ 0.45 222.2 US$ 75 US$ 0.6 US$ 0.0 US$ 74 Cu / Au 57% - 142,635 - $0.001
Northisle Copper and Gold Inc. TSXV:NCX C$ 0.03 82.3 US$ 2 US$ (0.1) US$ 0.0 US$ 2 Cu / Au 51% - 4,358 - $0.000
NovaCopper Inc. TSX:NCQ C$ 0.60 105.0 US$ 47 US$ 16.1 US$ 0.0 US$ 31 Cu / Zn 83% - 9,685 - $0.003
Panoro Minerals Ltd. TSXV:PML C$ 0.14 220.6 US$ 23 US$ (0.0) US$ 0.0 US$ 23 Cu / Au 77% - 10,114 - $0.002
Polymet Mining Corp. TSX:POM C$ 1.36 277.6 US$ 283 US$ (67.7) US$ 0.0 US$ 351 Cu / Ni 49% 3,145 10,139 $0.112 $0.035
Quaterra Resources Inc. TSXV:QTA C$ 0.06 193.5 US$ 9 US$ 5.2 US$ 0.5 US$ 4 Cu / Ag 96% - 8,247 - $0.000
Redhawk Resources, Inc. TSX:RDK C$ 0.05 157.7 US$ 5 US$ (0.2) US$ 0.5 US$ 6 Cu / Mo 92% - 3,835 - $0.002
Regulus Resources Inc TSXV:REG C$ 0.40 56.4 US$ 17 US$ 3.4 US$ 0.0 US$ 13 Cu / Au 0% - - - -
Reservoir Minerals Inc. TSXV:RMC C$ 4.89 48.7 US$ 178 US$ 25.3 US$ 0.0 US$ 153 Cu / Au 71% - 3,419 - $0.045
Serengeti Resources Inc. TSXV:SIR C$ 0.07 54.6 US$ 3 US$ 0.0 US$ 0.0 US$ 3 Cu / Au 67% - 4,153 - $0.001
St Augustine Gold and Copper Limited TSX:SAU C$ 0.11 726.8 US$ 57 US$ 4.4 US$ 0.0 US$ 53 Cu / Au 58% 2,131 3,263 $0.025 $0.016
Sunridge Gold Corp. TSXV:SGC C$ 0.31 209.9 US$ 49 US$ 4.1 US$ 0.0 US$ 45 Cu / Zn 50% 2,182 3,491 $0.020 $0.013
Tintina Resources Inc. TSXV:TAU C$ 0.09 222.5 US$ 15 US$ 4.5 US$ 0.0 US$ 11 Cu / Co 86% - 1,538 - $0.007
Western Copper and Gold Corporation TSX:WRN C$ 0.55 94.2 US$ 39 US$ 8.1 US$ 0.0 US$ 31 Cu / Au 45% 10,033 22,599 $0.003 $0.001
Yellowhead Mining Inc. TSX:YMI C$ 0.05 0.0 US$ 0 US$ 0.8 US$ 0.0 US$ (1) Cu / Au 91% 4,475 8,701 - -
Group Average - Total $0.027 $0.008
*All reserve and resource data sourced from IntierraRMG, additional data sourced from Capital IQ and Market Q.
**CuEq = copper equivalent. Calculated based on Haywood's formal long-term metal price forecasts.
***Copper Ratio = value of in situ copper / total value of in situ metals.
Primary /
Secondary
Metal
Reserves & Resources* - Attributable
EV/lb CuEq** (US$)

The Weekly Dig 3/4/16
Haywood Mining [email protected] Page 34
Nickel Non-Producers – EV/lb Comparables
Zinc Non-Producers – EV/lb Comparables
Shares Market Working LTD Enterprise Nickel
Company Symbol Price O/S Capitalization Capital Value Value Ratio*** Reserve (P&P) Resource (Total)
(million) (million) (million) (million) (million) (% Contained) (NiEq** Mlb) (NiEq** Mlb) Reserve Total
Anfield Nickel Corp. TSXV:ANF C$ 0.75 43.4 US$ 24 US$ 3.0 US$ 0.0 US$ 21 Ni / Co 99% 2,169 3,616 $0.010 $0.006
Asian Mineral Resources Limited TSXV:ASN C$ 0.03 779.5 US$ 15 US$ 6.1 US$ 0.0 US$ 9 Ni / Cu 86% 85 146 $0.101 $0.058
Canadian Arrow Mines Ltd. TSXV:CRO C$ 0.01 140.0 US$ 1 US$ (0.4) US$ 0.0 US$ 1 Ni / Cu 82% - 141 - $0.007
First Point Minerals Corp. TSX:FPX C$ 0.06 105.8 US$ 5 US$ 0.8 US$ 0.0 US$ 4 Ni / - 100% - 2,186 - $0.002
Hard Creek Nickel Corporation TSXV:HNC C$ 0.02 18.1 US$ 0 US$ 0.0 US$ 0.0 US$ 0 Ni / Co 91% - 9,161 - $0.000
Mustang Minerals Corp. TSXV:MUM C$ 0.01 256.5 US$ 1 US$ 0.1 US$ 0.0 US$ 1 Co / Ni 38% 2 1,176 $0.363 $0.001
Noront Resources Ltd TSXV:NOT C$ 0.34 244.1 US$ 62 US$ (17.2) US$ 17.1 US$ 97 Ni / Cu 78% 498 851 $0.194 $0.114
North American Nickel Inc. TSXV:NAN C$ 0.08 122.2 US$ 7 US$ 3.6 US$ 0.0 US$ 3 Ni / Cu 0% - - - -
Northern Shield Resources Inc. TSXV:NRN C$ 0.02 158.6 US$ 2 US$ 0.2 US$ 0.0 US$ 2 Ni / Cu 0% - - - -
Poseidon Nickel Limited ASX:POS A$ 0.04 767.4 US$ 25 US$ (0.7) US$ 27.6 US$ 53 Ni / Au 98% 171 1,284 $0.312 $0.042
Royal Nickel Corporation TSX:RNX C$ 0.20 131.3 US$ 19 US$ 5.6 US$ 0.0 US$ 14 Ni / Co 94% 7,217 13,124 $0.002 $0.001
Sama Resources Inc. TSXV:SME C$ 0.10 108.4 US$ 8 US$ 0.1 US$ 0.0 US$ 8 Ni / Cu 71% - 195 - $0.041
Strongbow Exploration Inc. TSXV:SBW C$ 0.09 25.6 US$ 2 US$ 0.6 US$ 0.0 US$ 1 Ni / Cu 86% - 417 - $0.002
Talon Metals Corporation TSX:TLO C$ 0.12 358.9 US$ 32 US$ (5.8) US$ 0.0 US$ 38 Ni / Fe 56% - 125 - $0.305
Group Average - Total $0.164 $0.048
*All reserve and resource data sourced from IntierraRMG, additional data sourced from Capital IQ and Market Q.
**NiEq = nickel equivalent. Calculated based on Haywood's formal long-term metal price forecasts.
***Nickel Ratio = value of in situ nickel / total value of in situ metals.
Primary /
Secondary
Metal
Reserves & Resources* - Attributable
EV/lb NiEq** (US$)
Shares Market Working LTD Enterprise Zinc
Company Symbol Price O/S Capitalization Capital Value Value Ratio*** Reserve (P&P) Resource (Total)
(million) (million) (million) (million) (million) (% Contained) (ZnEq** Mlb) (ZnEq** Mlb) Reserve Total
Canada Zinc Metals Corp. TSXV:CZX C$ 0.12 152.4 US$ 13 US$ 5.3 US$ 0.0 US$ 8 Zn / Pb 82% - 6,096 - $0.001
Canadian Zinc Corporation TSX:CZN C$ 0.15 218.0 US$ 25 US$ 2.0 US$ 0.0 US$ 23 Zn / Pb 40% 2,525 10,077 $0.009 $0.002
El Nino Ventures Inc. TSXV:ELN C$ 0.01 37.1 US$ 0 US$ (0.2) US$ 0.0 US$ 1 Zn / Cu 45% - 1,357 - $0.000
Firestone Ventures Inc. TSXV:FV C$ 0.01 36.8 US$ 0 US$ (0.5) US$ 0.0 US$ 1 Zn / Pb 73% - 454 - $0.001
Foran Mining Corporation TSXV:FOM C$ 0.10 90.8 US$ 6 US$ 1.0 US$ 0.0 US$ 5 Cu / Zn 33% - 4,962 - $0.001
InZinc Mining Ltd. TSXV:IZN C$ 0.06 72.2 US$ 3 US$ 0.6 US$ 0.0 US$ 2 Zn / Cu 77% - 3,873 - $0.001
Rathdowney Resources Ltd. TSXV:RTH C$ 0.19 118.1 US$ 17 US$ (0.2) US$ 0.0 US$ 17 Zn / Pb 80% - 3,437 - $0.005
Sunridge Gold Corp. TSXV:SGC C$ 0.31 209.9 US$ 49 US$ 4.1 US$ 0.0 US$ 45 Cu / Zn 29% 6,167 9,867 $0.007 $0.005
Wolfden Resources Corp. TSXV:WLF C$ 0.11 70.7 US$ 6 US$ 1.6 US$ 0.0 US$ 4 Au / Zn 29% - 4,516 - $0.001
Zazu Metals Corporation TSX:ZAZ C$ 0.25 55.4 US$ 10 US$ 0.7 US$ 0.0 US$ 10 Zn / Pb 69% - 3,077 - $0.003
Group Average - Total $0.008 $0.002
*All reserve and resource data sourced from IntierraRMG, additional data sourced from Capital IQ and Market Q.
**ZnEq = Zinc equivalent. Calculated based on Haywood's formal long-term metal price forecasts.
***Zinc Ratio = value of in situ zinc / total value of in situ metals.
Primary /
Secondary
Metal
Reserves & Resources* - Attributable
EV/lb ZnEq** (US$)

The Weekly Dig 3/4/16
Haywood Mining [email protected] Page 35
Dissemination of Research Research reports are disseminated either through electronic medium or in printed copy. Clients may access reports on our website, or receive publications directly via email. Haywood strives to ensure all clients receive research in a timely manner and at the same time. It is against our policy for analysts to discuss or circulate their recommendations internally prior to public distribution. This policy applies equally to recommendation changes, target changes and/or forecast revisions.
For Canadian residents: Haywood Securities Inc. is a Canadian registered broker-dealer and a member of the Investment Industry Regulatory Organization of Canada, the Toronto Stock Exchange, the Toronto Venture Exchange and the Canadian Investor Protection Fund and accepts responsibility for the dissemination of this report. Any Canadian client that wishes further information on any securities discussed in this report should contact a qualified salesperson of Haywood Securities Inc.
For U.S. residents: This investment research is distributed in the United States, as third party research by Haywood Securities (USA) Inc. Haywood Securities (USA) Inc. is a wholly owned subsidiary of Haywood Securities Inc., registered with the U.S. Securities and Exchange Commission, and is a member of FINRA and the Securities Investor Protection Corporation (SIPC). Haywood Securities (USA) Inc. as a U.S. registered broker-dealer accepts responsibility for this Research Report and its dissemination in the United States. Any U.S. client that wishes further information on any securities discussed in this report or wish to effect a transaction in these securities should contact a qualified salesperson of Haywood Securities (USA) Inc. Haywood Securities Inc. Research Analysts are considered Foreign Research Analysts to the USA and are not registered/qualified as Research Analysts with FINRA. As these analysts are considered Foreign Research Analysts they may not be specifically subject to FINRA (formerly NASD) Rule 2711 and FINRA (formerly NYSE) Rule 472 restrictions on communications with a Subject Company, Public Appearances and trading securities held by a Research Analyst Account.
This report may be distributed in the following states: nil. Otherwise, this report may only be distributed into those states with an institutional buyer state securities registration exemption.
Analyst Certification We, Geordie Mark, Mick Carew, Colin Healey, Kerry Smith, Stefan Ioannou, Ben Asuncion and Tara Hassan, hereby certify that the views expressed in this report (which includes the rating assigned to the issuer’s shares as well as the analytical substance and tone of the report) accurately reflect my/our personal views about the subject securities and the issuer. No part of my/our compensation was, is, or will be directly or indirectly related to the specific recommendations.

The Weekly Dig 3/4/16
Haywood Mining [email protected] Page 36
Important Disclosures
Of the companies included in the report the following Important Disclosures apply:
Ticker Company 1 2 3 4 5 6 7 8
TSX:AGI Alamos Gold Inc. X
TSX:AKG Asanko Gold Inc. X X X
TSXV:AGB Atlantic Gold Corp. X
TSX:BTO B2Gold Corp. X
TSX:ABX Barrick Gold Corporation X
TSX:CS Capstone Mining Corp. X
TSX:CUM Copper Mountain Mining Corporation X
TSX:DML Denison Mines Corp. X X X
TSX:DGC Detour Gold Corporation X X X
TSX:ELD Eldorado Gold Corporation X X
TSX:EDV Endeavour Mining Corp. X X
TSX:EFR Energy Fuels Inc. X X
TSXV:FOM Foran Mining Corporation X
TSXV:HI Highland Copper Company Inc. X X X X
TSX:HBM Hudbay Minerals, Inc. X X
TSXV:ICG Integra Gold Corp. X X X
TSX:KDX Klondex Mines Ltd. X X
TSX:LSG Lake Shore Gold Corp. X X
TSX:LUC Lucara Diamond Corp. X X
TSX:LUG Lundin Gold Inc. X
TSX:LUN Lundin Mining Corporation X X X
TSX:MND Mandalay Resources Corp. X
TSX:MAX Midas Gold Corp. X X X X X X
TSX:MPV Mountain Province Diamonds Inc. X X
TSXV:NXE NexGen Energy Ltd. X X
TSX:NSU Nevsun Resources Ltd. X
TSXV:NCA NewCastle Gold Ltd. X X
TSX:NCQ NovaCopper Inc. X X X
TSX:OBM Oban Mining Corporation X
TSX:OGC OceanaGold Corporation X
TSX:OR Osisko Gold Royalties Ltd. X X X
TSX:ORE Orezone Resources Inc. X
TSX:PLG Pilot Gold Inc. X X
TSXV:RMC Reservoir Minerals Inc.
TSXV:ROG Roxgold Inc. X X X X X
TSX:RNX Royal Nickel Corporation X X
TSX:RTG RTG Gold Inc. X X X X
TSX:SBB Sabina Gold and Silver Corp. X
TSXV:SWA Sarama Resources Ltd. X
TSX:SMF SEMAFO Inc. X
TSX:THO Tahoe Resources Inc. X X
TSX:TLO Talon Metals Corp. X X X
TSX:TV Trevali Mining Corporation X X X
TSXV:TGM True Gold Mining Inc. X X
AMEX:UEC Uranium Energy Corp. X

The Weekly Dig 3/4/16
Haywood Mining [email protected] Page 37
TSX:U Uranium Participation Corporation X
1 The Analyst(s) preparing this report (or a member of the Analysts’ households) have a financial interest in this company.
2 As of the end of the month immediately preceding this publication either Haywood Securities, Inc., one of its subsidiaries, its officers or directors beneficially owned 1% or more of this company.
3 Haywood Securities, Inc. has reviewed lead projects of this company and a portion of the expenses for this travel have been reimbursed by the issuer.
4 Haywood Securities Inc. or one of its subsidiaries has managed or co-managed or participated as selling group in a public offering of securities for this company in the past 12 months.
5 Haywood Securities, Inc. or one of its subsidiaries has received compensation for investment banking services from this company in the past 12 months.
6 Haywood Securities, Inc. or one of its subsidiaries has received compensation for investment banking services from this company in the past 24 months.
7 Haywood Securities, Inc. or one of its subsidiaries is restricted on this company at the time of publication.
8 Haywood Securities, Inc. or one of its subsidiaries expects to receive or intends to seek compensation for investment banking services from this company in the next 3 months.
Other material conflict of interest of the research analyst of which the research analyst or member knows or has reason to know at the time of publication or at the time of public appearance:
N/A
Rating Structure Each company within an analyst’s universe, or group of companies covered, is assigned: (i) a recommendation or rating, usually BUY, HOLD, or SELL; (ii) a 12 month target price, which represents an analyst’s current assessment of a company’s potential stock price over the next year; (iii) an overall risk rating which represents an analyst’s assessment of the company’s overall investment risk; and (iv) specific risk ratings or risk profile parameters which in their aggregate support an analyst’s overall risk rating. These ratings are more fully explained below. Before acting on our recommendation we caution you to confer with your Haywood investment advisor to determine the suitability of our recommendation for your specific investment objectives, risk tolerance and investment time horizon.
Recommendation Rating BUY – The analyst believes that the security will outperform other companies in their sector on a risk adjusted basis or for the reasons stated in the research report the analyst believes that the security is deserving of a (continued) BUY rating.
HOLD – The analyst believes that the security is expected to perform in line with other companies in their sector on a risk adjusted basis or for the reasons stated in the research report the analyst believes that the security is deserving of a (continued) HOLD rating.
SELL – Investors are advised to sell the security or hold alternative securities within the sector. Stocks in this category are expected to under-perform other companies on a risk adjusted basis or for the reasons stated in the research report the analyst believes that the security is deserving of a (continued) SELL rating.
TENDER – The analyst is recommending that investors tender to a specific offering for the company’s stock.
RESEARCH COMMENT – An analyst comment about an issuer event that does not include a rating or recommendation.
UNDER REVIEW – Placing a stock Under Review does not revise the current rating or recommendation of the analyst. A stock will be placed Under Review when the relevant company has a significant material event with further information pending or to be announced. An analyst will place a stock Under Review while he/she awaits sufficient information to re-evaluate the company’s financial situation.
COVERAGE DROPPED – Haywood Securities will no longer cover the issuer. Haywood will provide notice to clients whenever coverage of an issuer is discontinued.
Haywood’s focus is to search for undervalued companies which analysts believe may achieve attractive risk-adjusted returns. This research coverage on potentially undervalued companies may result in an outweighed percentage of companies rated as BUY. Management regularly reviews rating and targets in all sectors to ensure fairness and accuracy.

The Weekly Dig 3/4/16
Haywood Mining [email protected] Page 38
For further information on Haywood Securities’ research dissemination policies, please visit: http://www.haywood.com/research_dissemination.asp
Overall Risk Rating Very High Risk: Venture type companies or more established micro, small, mid or large cap companies whose risk profile parameters and/or lack of liquidity warrant such a designation. These companies are only appropriate for investors who have a very high tolerance for risk and volatility and who are capable of incurring temporary or permanent loss of a very significant portion of their investment capital.
High Risk: Typically micro or small cap companies which have an above average investment risk relative to more established or mid to large cap companies. These companies will generally not form part of the broad senior stock market indices and often will have less liquidity than more established mid and large cap companies. These companies are only appropriate for investors who have a high tolerance for risk and volatility and who are capable of incurring a temporary or permanent loss of a significant loss of their investment capital.
Medium-High Risk: Typically mid to large cap companies that have a medium to high investment risk. These companies will often form part of the broader senior stock market indices or sector specific indices. These companies are only appropriate for investors who have a medium to high tolerance for risk and volatility and who are prepared to accept general stock market risk including the risk of a temporary or permanent loss of some of their investment capital
Moderate Risk: Large to very large cap companies with established earnings who have a track record of lower volatility when compared against the broad senior stock market indices. These companies are only appropriate for investors who have a medium tolerance for risk and volatility and who are prepared to accept general stock market risk including the risk of a temporary or permanent loss of some of their investment capital.
Risk Profile Parameters – Mining and Minerals Sector Forecast Risk: High (7-10) – The Company’s primary project(s) is at an earlier stage of exploration and/or resource delineation whereby grades, tonnages, capital and operating costs, and other economic/operational parameters are not yet reliably established. Moderate (4-6) – The Company has taken steps to de-risk its primary producing, or soon to be producing project(s) and has established reasonably reliable operational and economic parameters. Low (1-3) – The Company has de-risked the majority of its primary project(s) through operational history and established production profile(s).
Financial Risk: High (7-10) – The Company’s near- and medium-term (capital) expenditure considerations, including the current year or next forecast year, are not fully funded through a combination of established debt facilities, cash on hand, and/or anticipated cash flow from existing operations—successful project execution depends, in part, on future (equity) financing(s). Existing and/or forecast levels of leverage are above average relative to the Company’s peer group. The risk of a significant capital cost overrun(s) is high given the early stage of project development. Moderate (4-6) – The Company’s near-term (capital) expenditure program, in the current year or next forecast year, is fully funded through a combination of established debt facilities, cash on hand, and/or anticipated cash flow from existing operations. Medium-term funding requirements will likely require additional financing consideration, but should be achievable assuming no significant uncontrollable events impede access to capital. Existing and/or forecast levels of leverage are in-line with the Company’s peer group. The risk of a significant capital cost overrun(s) is moderate given the advanced stage of project development. Low (1-3) – the Company’s near- and medium-term (capital) expenditure program is fully funded through a combination of established debt facilities, cash on hand, and/or anticipated cash flow from existing operations. Existing and/or forecast levels of leverage are below average relative to the Company’s peer group.
Valuation Risk: High (7-10) – The current valuation is at a premium to peers. The valuation reflects considerable future exploration success and/or commodity appreciation. Where applicable, the current capitalization exceeds the “DCF” evaluation by more than 50%. Moderate (4-6) – The current valuation is within historic ranges and generally consistent with peers. The valuation reflects reasonable exploration success and/or commodity appreciation. Where applicable, the current capitalization exceeds the DCF valuation by 15% to 50%. Low (1-3) – The current valuation is at the low end of historic ranges and at a discount to peer valuations. The valuation reflects limited new exploration success and no commodity appreciation. Where applicable, the current capitalization exceeds the DCF valuation by less than 15% or falls below the current market value.
Political Risk: High (7-10) –Obtaining permits is challenging. Properties are located in an area(s) with high geo-political uncertainty, limited access, and/or have significant new infrastructure requirements. Moderate (4-6) – Properties are located

The Weekly Dig 3/4/16
Haywood Mining [email protected] Page 39
in an area(s) with moderate geo-political risk, reasonable or manageable access, and some established infrastructure. Low (1-3) – Properties are located in areas with a manageable geo-political risk profile and established access/infrastructure.
Distribution of Ratings (as of March 4, 2016)
Distribution of Ratings IB
Clients
% # (TTM)
Buy 72.1% 75 100.0%
Hold 5.8% 6 0.0%
Sell 0.0% 0 0.0%
Tender 1.0% 1 0.0%
UR (Buy) 0.0% 0 0.0%
UR (Hold) 0.0% 0 0.0%
UR (Sell) 0.0% 0 0.0%
dropped (TTM) 21.2% 22 0.0%
Distribution of Ratings
IB Clients
% # (TTM)
Buy 72.1% 75 100.0%
Hold 5.8% 6 0.0%
Sell 0.0% 0 0.0%
Tender 1.0% 1 0.0%
UR (Buy) 0.0% 0 0.0%
UR (Hold) 0.0% 0 0.0%
UR (Sell) 0.0% 0 0.0%
dropped (TTM) 21.2% 22 0.0%
Price Chart, Rating and Target Price History (as of March 4, 2016)
Alamos Gold, Inc. (AGI-T) Date Target(C$) Rating1/12/16 $7.00 Buy
11/13/15 $8.00 Buy7/15/15 $9.00 Buy1/27/15 $9.25 Buy
10/23/14 $11.25 Buy4/16/14 $12.00 Buy1/29/14 $11.50 Buy1/15/14 $16.00 Buy11/1/13 $17.00 Buy6/11/13 $16.00 Buy4/26/13 $19.50 Buy2/22/13 $21.00 Buy
0
5
10
15
20
25
30
35
Mar13
Jun13
Sep13
Dec13
Mar14
Jun14
Sep14
Dec14
Mar15
Jun15
Sep15
Dec15
Price History (C$) Target/Rating/Coverage Change
Asanko Gold Inc. (AKG-T) Date Target(C$) Rating1/12/16 $3.25 Buy7/15/15 $3.60 Buy1/21/15 $3.20 Buy
10/23/14 $3.35 Buy4/16/14 $3.60 Buy1/15/14 $3.75 Buy
12/11/13 $3.30 Buy
Initiated Coverage 12/11/13
0
0.5
1
1.5
2
2.5
3
3.5
4
Feb13
May13
Aug13
Nov13
Feb14
May14
Aug14
Nov14
Feb15
May15
Aug15
Nov15
Price History (C$) Target/Rating/Coverage Change
Atlantic Gold Corporation (AGB-V) Date Target(C$) Rating3/1/16 $0.85 Buy
1/12/16 $0.55 Buy12/9/15 $0.50 Buy
Initiated Coverage 12/9/15
0
0.5
1
1.5
2
2.5
Mar13
Jun13
Sep13
Dec13
Mar14
Jun14
Sep14
Dec14
Mar15
Jun15
Sep15
Dec15
Price History (C$) Target/Rating/Coverage Change
B2Gold Corp. (BTO-T) Date Target(C$) Rating11/16/15 $2.10 Buy3/17/15 $2.75 Buy1/27/15 $3.25 Buy
11/17/14 $3.20 Buy10/23/14 $3.45 Buy8/15/14 $3.75 Buy7/9/14 $3.90 Buy
4/16/14 $3.80 Buy3/18/14 $3.75 Buy2/5/14 $3.50 Buy
Transferred Coverage 09/12/12; Re-Initiated Coverage 02/05/14
0
0.5
1
1.5
2
2.5
3
3.5
4
4.5
Feb13
May13
Aug13
Nov13
Feb14
May14
Aug14
Nov14
Feb15
May15
Aug15
Nov15
Price History (C$) Target/Rating/Coverage Change

The Weekly Dig 3/4/16
Haywood Mining [email protected] Page 40
Barrick Gold Corporation (ABX-T) Date Target(C$) Rating2/19/16 $19.50 Buy1/12/16 $14.50 Buy8/7/15 $11.00 Buy
7/15/15 $15.65 Hold4/29/15 $15.75 Hold2/20/15 $15.00 Hold1/27/15 $14.25 Hold
10/23/14 $17.25 Hold7/9/14 $23.50 Hold5/1/14 $23.00 Hold
2/18/14 $24.00 Hold1/15/14 $20.50 Hold
10/22/13 $20.00 Buy6/11/13 $26.50 Buy4/25/13 $34.50 Buy
0
5
10
15
20
25
30
35
40
Feb13
May13
Aug13
Nov13
Feb14
May14
Aug14
Nov14
Feb15
May15
Aug15
Nov15
Price History (C$) Target/Rating/Coverage Change
Capstone Mining Corp. (CS-T) Date Target(C$) Rating2/18/16 $0.60 Buy1/12/16 $0.50 Buy7/9/15 $1.50 Buy
1/27/15 $2.00 Buy5/8/13 $3.50 Buy
4/30/13 $3.00 UR(Buy)3/15/13 $3.00 Buy
Initiated Coverage on 07/10/07 as Sherwood Copper Corp; Name
changed to Capstone Mining Corp. 11/25/08
0
0.5
1
1.5
2
2.5
3
Feb13
May13
Aug13
Nov13
Feb14
May14
Aug14
Nov14
Feb15
May15
Aug15
Nov15
Price History (C$) Target/Rating/Coverage Change
Copper Mountain Mining Corporation (CUM-T) Date Target(C$) Rating1/12/16 $0.60 Buy
11/10/15 $1.00 Buy7/15/15 $1.85 Buy1/27/15 $2.00 Buy1/19/15 $3.50 UR(Buy)8/11/14 $3.50 Buy7/7/14 $3.00 Buy
4/16/14 $2.75 Buy2/24/14 $2.50 Buy
11/12/13 $2.00 Buy10/22/13 $2.35 Buy6/11/13 $3.00 Buy5/16/13 $3.50 Buy3/20/13 $3.75 Buy
Initiated Coverage: 8/26/10
0
0.5
1
1.5
2
2.5
3
3.5
4
4.5
Feb13
May13
Aug13
Nov13
Feb14
May14
Aug14
Nov14
Feb15
May15
Aug15
Nov15
Price History (C$) Target/Rating/Coverage Change
Denison Mines Corp. (DML-T) Date Target(C$) Rating1/12/16 $1.90 Buy3/25/14 $2.10 Buy
Transferred & Re-initiated Coverage 08/20/12
0
0.5
1
1.5
2
2.5
Feb13
May13
Aug13
Nov13
Feb14
May14
Aug14
Nov14
Feb15
May15
Aug15
Nov15
Price History (C$) Target/Rating/Coverage Change
Detour Gold Corporation (DGC-T) Date Target(C$) Rating1/27/16 $19.50 Buy1/12/16 $18.75 Buy7/15/15 $18.50 Buy1/27/15 $14.00 Buy
10/23/14 $13.50 Buy7/31/14 $15.50 Buy7/9/14 $16.50 Buy
4/16/14 $13.75 Buy3/6/14 $12.50 Buy
1/15/14 $8.50 Buy11/11/13 $11.00 Buy10/22/13 $13.75 Buy6/11/13 $21.50 Buy4/29/13 $32.00 Buy
0
5
10
15
20
25
30
35
Feb13
May13
Aug13
Nov13
Feb14
May14
Aug14
Nov14
Feb15
May15
Aug15
Nov15
Price History (C$) Target/Rating/Coverage Change
Eldorado Gold Corporation (ELD-T) Date Target(C$) Rating1/26/16 $4.50 Buy1/12/16 $6.50 Buy7/15/15 $6.75 Buy2/23/15 $7.75 Buy1/27/15 $9.00 Buy
10/23/14 $9.50 Buy7/9/14 $8.50 Hold
4/16/14 $8.00 Hold2/24/14 $7.50 Hold
10/22/13 $7.50 Buy8/6/13 $14.25 Buy
6/11/13 $14.75 Buy5/6/13 $17.50 Buy
2/25/13 $19.25 Buy
0
5
10
15
20
25
Feb13
May13
Aug13
Nov13
Feb14
May14
Aug14
Nov14
Feb15
May15
Aug15
Nov15
Price History (C$) Target/Rating/Coverage Change
Endeavour Mining Corporation (EDV-T) Date Target(C$) Rating1/18/16 $12.00 Buy12/3/15 $11.00 Buy1/27/15 $13.00 Buy11/5/14 $11.50 Buy
10/23/14 $10.50 Buy8/21/14 $12.50 Buy
Initiated Coverage 08/21/14; 10:1 Prices/Targets adjusted to
reflect Stock Consolidation 12/02/15
0
5
10
15
20
25
Feb13
May13
Aug13
Nov13
Feb14
May14
Aug14
Nov14
Feb15
May15
Aug15
Nov15
Price History (C$) Target/Rating/Coverage Change
Energy Fuels Inc. (EFR-T) Date Target(C$) Rating1/12/16 $10.25 Buy9/30/15 $11.00 Buy7/15/15 $12.00 Buy7/9/14 $12.50 Buy
4/16/14 $14.00 Buy3/31/14 $15.00 Buy1/15/14 $16.00 Buy11/6/13 $16.50 Buy11/1/13 $17.50 UR(Buy)
Targets and prices prior to 11/06/13 adjusted for share
consolidation; Transferred & Re-initiated Coverage 08/20/12
0
2
4
6
8
10
12
14
16
18
20
Feb13
May13
Aug13
Nov13
Feb14
May14
Aug14
Nov14
Feb15
May15
Aug15
Nov15
Price History (C$) Target/Rating/Coverage Change

The Weekly Dig 3/4/16
Haywood Mining [email protected] Page 41
Foran Mining Corp. (FOM-V) Date Target(C$) Rating1/12/16 $0.25 Buy7/15/15 $0.35 Buy4/17/15 $0.50 Buy
10/22/13 $0.35 Buy6/11/13 $0.65 Buy4/17/13 $0.75 Buy
Initiated Coverage: 4/17/13
0
0.1
0.2
0.3
0.4
0.5
0.6
0.7
0.8
Feb13
May13
Aug13
Nov13
Feb14
May14
Aug14
Nov14
Feb15
May15
Aug15
Nov15
Price History (C$) Target/Rating/Coverage Change
Highland Copper Company Inc. (HI-V) Date Target(C$) Rating1/12/16 $0.25 Buy7/15/15 $0.35 Buy2/27/15 $0.50 Buy
12/17/14 $0.65 Buy7/18/14 $0.75 Buy
Initiated Coverage: 07/18/14
0
0.1
0.2
0.3
0.4
0.5
0.6
0.7
0.8
Feb13
May13
Aug13
Nov13
Feb14
May14
Aug14
Nov14
Feb15
May15
Aug15
Nov15
Price History (C$) Target/Rating/Coverage Change
HudBay Minerals, Inc. (HBM-T) Date Target(C$) Rating3/1/16 $7.25 Buy
1/18/16 $6.75 Buy1/12/16 $8.50 Buy7/15/15 $12.00 Buy5/11/15 $12.00 Hold2/23/15 $11.00 Hold
10/23/14 $11.00 Buy8/1/14 $11.00 Hold
6/24/14 $10.00 Hold5/2/14 $9.50 Hold
12/19/13 $9.50 Buy
Initiated Coverage: 12/19/13
0
2
4
6
8
10
12
14
Mar13
Jun13
Sep13
Dec13
Mar14
Jun14
Sep14
Dec14
Mar15
Jun15
Sep15
Dec15
Price History (C$) Target/Rating/Coverage Change
Integra Gold Corp. (ICG-V) Date Target(C$) Rating1/12/16 $0.60 Buy7/15/15 $0.70 Buy6/23/15 $0.65 Buy
Initiated Coverage 06/23/15
0
0.2
0.4
0.6
0.8
1
1.2
1.4
Feb13
May13
Aug13
Nov13
Feb14
May14
Aug14
Nov14
Feb15
May15
Aug15
Nov15
Price History (C$) Target/Rating/Coverage Change
Klondex Mines Ltd. (KDX-T) Date Target(C$) Rating7/15/15 $4.00 Buy1/22/15 $3.50 Buy
Initiated Coverage 01/22/15
0
0.5
1
1.5
2
2.5
3
3.5
4
4.5
Feb13
May13
Aug13
Nov13
Feb14
May14
Aug14
Nov14
Feb15
May15
Aug15
Nov15
Price History (C$) Target/Rating/Coverage Change
Lake Shore Gold Corp. (LSG-T) Date Target(C$) Rating2/24/16 n/a Tender1/12/16 $1.75 Buy7/15/15 $1.70 Buy
10/23/14 $1.30 Buy7/23/14 $1.40 Buy7/9/14 $1.20 Buy
4/16/14 $1.15 Buy1/24/14 $1.10 Hold1/15/14 $0.75 Hold6/11/13 $0.60 Hold5/17/13 $0.70 Hold3/20/13 $1.20 Buy
0
0.2
0.4
0.6
0.8
1
1.2
1.4
1.6
1.8
2
Feb13
May13
Aug13
Nov13
Feb14
May14
Aug14
Nov14
Feb15
May15
Aug15
Nov15
Price History (C$) Target/Rating/Coverage Change
Lucara Diamond Corp. (LUC-T) Date Target(C$) Rating1/12/16 $3.15 Buy12/3/15 $2.80 Buy8/13/15 $2.50 Buy4/28/15 $2.80 Buy
Initiated Coverage 04/28/15
0
0.5
1
1.5
2
2.5
3
3.5
Feb13
May13
Aug13
Nov13
Feb14
May14
Aug14
Nov14
Feb15
May15
Aug15
Nov15
Price History (C$) Target/Rating/Coverage Change
Lundin Gold Inc. (LUG-T) Date Target(C$) Rating12/8/15 $5.00 Buy
Initiated Coverage: 12/08/15
0
1
2
3
4
5
6
7
Feb13
May13
Aug13
Nov13
Feb14
May14
Aug14
Nov14
Feb15
May15
Aug15
Nov15
Price History (C$) Target/Rating/Coverage Change

The Weekly Dig 3/4/16
Haywood Mining [email protected] Page 42
`
Lundin Mining Corporation (LUN-T) Date Target(C$) Rating11/2/15 $7.75 UR (Buy)7/15/15 $7.75 Buy1/27/15 $6.75 Buy
10/23/14 $7.75 Buy7/9/14 $7.50 Buy
4/16/14 $6.20 Buy6/11/13 $5.70 Buy2/25/13 $6.00 Buy
Transferred Coverage: 11/02/15
0
1
2
3
4
5
6
7
8
9
Feb13
May13
Aug13
Nov13
Feb14
May14
Aug14
Nov14
Feb15
May15
Aug15
Nov15
Price History (C$) Target/Rating/Coverage Change
Mandalay Resources Corp. (MND-T) Date Target(C$) Rating1/12/16 $1.00 Buy11/6/15 $1.25 Buy
10/23/14 $1.50 Buy8/8/14 $1.60 Buy5/7/14 $1.40 Buy
4/16/14 $1.35 Buy1/15/14 $1.30 Buy
10/22/13 $1.40 Buy6/11/13 $1.50 Buy
Transferred 09/12/12; Re-initiated 10/09/12
0
0.2
0.4
0.6
0.8
1
1.2
1.4
1.6
1.8
Feb13
May13
Aug13
Nov13
Feb14
May14
Aug14
Nov14
Feb15
May15
Aug15
Nov15
Price History (C$) Target/Rating/Coverage Change
Midas Gold Corp. (MAX-T) Date Target(C$) Rating1/12/16 $0.45 Hold7/15/15 $0.50 Hold1/27/15 $0.80 Buy1/9/15 $0.85 Buy
10/23/14 $1.15 Buy8/21/14 $1.30 Buy7/9/14 $1.40 Buy
1/15/14 $1.50 Buy11/5/13 $1.70 Buy
Transferred and Re-initiated Coverage 11/05/13
0
0.2
0.4
0.6
0.8
1
1.2
1.4
1.6
1.8
Feb13
May13
Aug13
Nov13
Feb14
May14
Aug14
Nov14
Feb15
May15
Aug15
Nov15
Price History (C$) Target/Rating/Coverage Change
Mountain Province Diamonds Inc. (MPV-T) Date Target(C$) Rating1/12/16 $8.00 Buy7/15/15 $8.50 Buy2/19/15 $7.40 Buy2/5/15 $7.70 Buy
Initiated Coverage 02/05/15
0
1
2
3
4
5
6
7
8
9
Feb13
May13
Aug13
Nov13
Feb14
May14
Aug14
Nov14
Feb15
May15
Aug15
Nov15
Price History (C$) Target/Rating/Coverage Change
NewCastle Gold Ltd. (NCA-V) Date Target(C$) Rating1/12/16 $0.45 Buy9/3/15 $0.30 Buy
7/15/15 $0.60 Buy1/27/15 $0.70 Buy
12/12/14 $0.65 Buy10/23/14 $0.75 Buy
7/9/14 $1.40 Buy4/16/14 $1.35 Buy1/15/14 $1.20 Buy
11/28/13 $1.50 Buy
Began trading 05/14/13 as Castle Mountain Mining; Initiated
Coverage 11/28/13; Name changed to NewCastle Gold 06/30/15
0
0.2
0.4
0.6
0.8
1
1.2
1.4
1.6
May13
Aug13
Nov13
Feb14
May14
Aug14
Nov14
Feb15
May15
Aug15
Nov15
Feb16
Price History (C$) Target/Rating/Coverage Change
Nevsun Resources Ltd. (NSU-T) Date Target(C$) Rating7/15/15 $5.00 Buy4/29/15 $5.50 Buy2/18/14 $5.00 Buy6/11/13 $4.50 Buy3/22/13 $5.00 Buy
Initiated Coverage: 08/27/04
0
1
2
3
4
5
6
Feb13
May13
Aug13
Nov13
Feb14
May14
Aug14
Nov14
Feb15
May15
Aug15
Nov15
Price History (C$) Target/Rating/Coverage Change
NexGen Energy Ltd. (NXE-V) Date Target(C$) Rating1/12/16 $2.00 Buy11/5/15 $2.10 Buy
Initiated Coverage 11/05/15
0
0.5
1
1.5
2
2.5
Apr13
Jul13
Oct13
Jan14
Apr14
Jul14
Oct14
Jan15
Apr15
Jul15
Oct15
Jan16
Price History (C$) Target/Rating/Coverage Change
NovaCopper Inc. (NCQ-T) Date Target(C$) Rating1/12/16 $0.65 Buy7/15/15 $1.25 Buy1/27/15 $1.75 Buy7/9/14 $2.00 Buy
3/19/14 $2.75 Buy
Began Trading 04/25/12; Initiated Coverage 03/19/14
0
0.5
1
1.5
2
2.5
3
Feb13
May13
Aug13
Nov13
Feb14
May14
Aug14
Nov14
Feb15
May15
Aug15
Nov15
Price History (C$) Target/Rating/Coverage Change

The Weekly Dig 3/4/16
Haywood Mining [email protected] Page 43
Oban Mining Corporation (OBM-T) Date Target(C$) Rating2/4/16 $2.00 Buy
12/10/15 $2.50 Buy
Initiated Coverage 12-10-15
0
1
2
3
4
5
6
7
Apr14
Jul14
Oct14
Jan15
Apr15
Jul15
Oct15
Jan16
Price History (C$) Target/Rating/Coverage Change
OceanaGold Corporation (OGC-T) Date Target(C$) Rating2/19/16 $4.00 Hold10/2/15 $4.00 Buy7/15/15 $4.10 Buy4/30/15 $3.80 Buy2/20/15 $3.60 Buy1/27/15 $3.20 Buy
10/23/14 $3.30 Buy9/22/14 $3.50 Buy
Initiated Coverage 09/22/14
0
0.5
1
1.5
2
2.5
3
3.5
4
4.5
Feb13
May13
Aug13
Nov13
Feb14
May14
Aug14
Nov14
Feb15
May15
Aug15
Nov15
Price History (C$) Target/Rating/Coverage Change
Osisko Gold Royalties Ltd. (OR-T) Date Target(C$) Rating12/16/15 $18.75 Buy
Initiated Coverage 12-16-2015
0
2
4
6
8
10
12
14
16
18
20
Jun14
Sep14
Dec14
Mar15
Jun15
Sep15
Dec15
Price History (C$) Target/Rating/Coverage Change
Orezone Gold Corporation (ORE-V) Date Target(C$) Rating11/2/15 $0.55 UR (Hold)7/15/15 $0.55 Hold
11/10/14 $1.10 Buy10/23/14 $1.30 Buy7/11/14 $1.35 Buy6/10/14 $1.25 Buy4/22/14 $0.90 Buy
Initiated Coverage 04/22/14; Transferred Coverage: 11/02/15
0
0.2
0.4
0.6
0.8
1
1.2
1.4
1.6
1.8
Feb13
May13
Aug13
Nov13
Feb14
May14
Aug14
Nov14
Feb15
May15
Aug15
Nov15
Price History (C$) Target/Rating/Coverage Change
Pilot Gold Inc. (PLG-T) Date Target(C$) Rating1/12/16 $0.70 Buy7/15/15 $1.50 Buy1/29/15 $1.90 Buy1/27/15 $1.60 Buy
10/23/14 $1.70 Buy4/2/14 $2.00 Buy
1/15/14 $1.70 Buy10/22/13 $2.10 Buy6/11/13 $2.60 Buy
Initiated Coverage 10/09/12
0
0.5
1
1.5
2
2.5
3
Feb13
May13
Aug13
Nov13
Feb14
May14
Aug14
Nov14
Feb15
May15
Aug15
Nov15
Price History (C$) Target/Rating/Coverage Change
Reservoir Minerals Inc. (RMC-V) Date Target(C$) Rating12/15/15 $8.50 Buy
Initiated Coverage: 12/15/15
0
2
4
6
8
10
12
Feb13
May13
Aug13
Nov13
Feb14
May14
Aug14
Nov14
Feb15
May15
Aug15
Nov15
Price History (C$) Target/Rating/Coverage Change
Roxgold Inc. (ROG-V) Date Target(C$) Rating7/15/15 $1.10 Buy11/5/14 $1.00 Buy7/9/14 $1.25 Buy
4/23/14 $1.15 Buy1/27/14 $1.05 Buy
Initiated Coverage 01/27/14
0
0.2
0.4
0.6
0.8
1
1.2
1.4
Feb13
May13
Aug13
Nov13
Feb14
May14
Aug14
Nov14
Feb15
May15
Aug15
Nov15
Price History (C$) Target/Rating/Coverage ChangeThis Company is currently Restricted
Royal Nickel Corporation (RNX-T) Date Target(C$) Rating1/12/16 $0.35 Buy7/15/15 $0.50 Buy1/27/15 $0.60 Buy4/16/14 $0.75 Buy
10/22/13 $0.50 Buy6/20/13 $0.75 Buy
Initiated Coverage: 07/05/11
0
0.1
0.2
0.3
0.4
0.5
0.6
0.7
0.8
Feb13
May13
Aug13
Nov13
Feb14
May14
Aug14
Nov14
Feb15
May15
Aug15
Nov15
Price History (C$) Target/Rating/Coverage ChangeThis Company is currently Restricted

The Weekly Dig 3/4/16
Haywood Mining [email protected] Page 44
RTG Mining Inc. (RTG-T) Date Target(C$) Rating1/12/16 $1.10 Buy9/11/15 $1.30 Buy
Initiated Coverage 09/11/15
0
0.2
0.4
0.6
0.8
1
1.2
1.4
1.6
1.8
Feb13
May13
Aug13
Nov13
Feb14
May14
Aug14
Nov14
Feb15
May15
Aug15
Nov15
Price History (C$) Target/Rating/Coverage Change
Sabina Gold & Silver Corp. (SBB-T) Date Target(C$) Rating1/12/16 $1.00 Buy
12/15/15 $0.90 Buy
Initiated Coverage 12-15-15
0
0.5
1
1.5
2
2.5
Feb13
May13
Aug13
Nov13
Feb14
May14
Aug14
Nov14
Feb15
May15
Aug15
Nov15
Price History (C$) Target/Rating/Coverage Change
Sarama Resources Limited (SWA-V) Date Target(C$) Rating1/12/16 $0.15 Buy7/15/15 $0.20 Buy1/27/15 $0.25 Buy
10/23/14 $0.20 Buy7/9/14 $0.40 Buy
4/15/14 $0.50 Buy1/15/14 $0.60 Buy9/17/13 $0.90 Buy6/11/13 $0.85 Buy2/1/13 $1.20 Buy
Initiated Coverage 02/01/13
0
0.1
0.2
0.3
0.4
0.5
0.6
0.7
0.8
0.9
1
Feb13
May13
Aug13
Nov13
Feb14
May14
Aug14
Nov14
Feb15
May15
Aug15
Nov15
Price History (C$) Target/Rating/Coverage Change
SEMAFO Inc. (SMF-T) Date Target(C$) Rating7/15/15 $5.00 Buy1/27/15 $5.75 Buy
10/23/14 $6.25 Buy7/9/14 $6.50 Buy
4/16/14 $5.50 Buy3/13/14 $5.25 Buy1/27/14 $4.25 Buy1/15/14 $4.00 Buy
11/14/13 $3.80 Buy10/22/13 $3.30 Buy8/27/13 $3.00 Buy8/8/13 $2.30 Buy
6/11/13 $2.80 Buy5/15/13 $3.50 Buy3/25/13 $4.00 Buy
0
1
2
3
4
5
6
7
Feb13
May13
Aug13
Nov13
Feb14
May14
Aug14
Nov14
Feb15
May15
Aug15
Nov15
Price History (C$) Target/Rating/Coverage Change
Tahoe Resources Inc. (THO-T) Date Target(C$) Rating7/15/15 $16.50 Buy4/29/15 $19.25 Buy4/2/15 $16.00 Hold
1/27/15 $14.50 Sell12/5/14 $12.75 Sell11/7/14 $15.00 Sell
10/23/14 $17.25 Sell7/9/14 $18.75 Sell
5/12/14 $17.00 Sell1/15/14 $15.00 Sell11/5/13 $15.25 Sell
Initiated Coverage 11/05/13
0
5
10
15
20
25
30
35
Feb13
May13
Aug13
Nov13
Feb14
May14
Aug14
Nov14
Feb15
May15
Aug15
Nov15
Price History (C$) Target/Rating/Coverage Change
Talon Metals Corp. (TLO-T) Date Target(C$) Rating1/5/16 $0.25 Buy
7/15/15 $0.35 Buy1/25/14 $0.50 Buy
Initiated Coverage: 11/25/14
0
0.1
0.2
0.3
0.4
0.5
0.6
Feb13
May13
Aug13
Nov13
Feb14
May14
Aug14
Nov14
Feb15
May15
Aug15
Nov15
Price History (C$) Target/Rating/Coverage Change
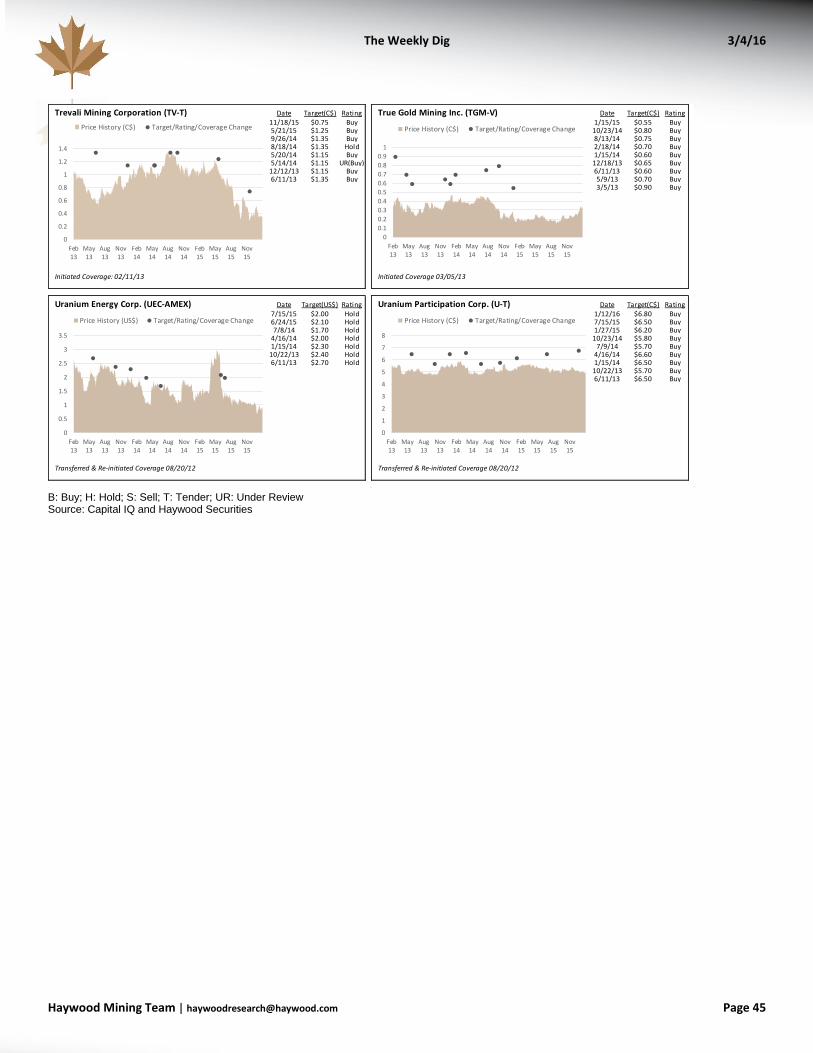
The Weekly Dig 3/4/16
Haywood Mining [email protected] Page 45
B: Buy; H: Hold; S: Sell; T: Tender; UR: Under Review Source: Capital IQ and Haywood Securities
Trevali Mining Corporation (TV-T) Date Target(C$) Rating11/18/15 $0.75 Buy5/21/15 $1.25 Buy9/26/14 $1.35 Buy8/18/14 $1.35 Hold5/20/14 $1.15 Buy5/14/14 $1.15 UR(Buy)
12/12/13 $1.15 Buy6/11/13 $1.35 Buy
Initiated Coverage: 02/11/13
0
0.2
0.4
0.6
0.8
1
1.2
1.4
Feb13
May13
Aug13
Nov13
Feb14
May14
Aug14
Nov14
Feb15
May15
Aug15
Nov15
Price History (C$) Target/Rating/Coverage Change
True Gold Mining Inc. (TGM-V) Date Target(C$) Rating1/15/15 $0.55 Buy
10/23/14 $0.80 Buy8/13/14 $0.75 Buy2/18/14 $0.70 Buy1/15/14 $0.60 Buy
12/18/13 $0.65 Buy6/11/13 $0.60 Buy5/9/13 $0.70 Buy3/5/13 $0.90 Buy
Initiated Coverage 03/05/13
0
0.1
0.2
0.3
0.4
0.5
0.6
0.7
0.8
0.9
1
Feb13
May13
Aug13
Nov13
Feb14
May14
Aug14
Nov14
Feb15
May15
Aug15
Nov15
Price History (C$) Target/Rating/Coverage Change
Uranium Energy Corp. (UEC-AMEX) Date Target(US$) Rating7/15/15 $2.00 Hold6/24/15 $2.10 Hold7/8/14 $1.70 Hold
4/16/14 $2.00 Hold1/15/14 $2.30 Hold
10/22/13 $2.40 Hold6/11/13 $2.70 Hold
Transferred & Re-initiated Coverage 08/20/12
0
0.5
1
1.5
2
2.5
3
3.5
Feb13
May13
Aug13
Nov13
Feb14
May14
Aug14
Nov14
Feb15
May15
Aug15
Nov15
Price History (US$) Target/Rating/Coverage Change
Uranium Participation Corp. (U-T) Date Target(C$) Rating1/12/16 $6.80 Buy7/15/15 $6.50 Buy1/27/15 $6.20 Buy
10/23/14 $5.80 Buy7/9/14 $5.70 Buy
4/16/14 $6.60 Buy1/15/14 $6.50 Buy
10/22/13 $5.70 Buy6/11/13 $6.50 Buy
Transferred & Re-initiated Coverage 08/20/12
0
1
2
3
4
5
6
7
8
Feb13
May13
Aug13
Nov13
Feb14
May14
Aug14
Nov14
Feb15
May15
Aug15
Nov15
Price History (C$) Target/Rating/Coverage Change