THE VALUES OF EUROPEANS - European …ec.europa.eu/commfrontoffice/publicopinion/archives/eb/...0...
46
Standard Eurobarometer 77 Spring 2012 THE VALUES OF EUROPEANS REPORT Fieldwork: May 2012 This survey has been requested and co-ordinated by the European Commission, Directorate-General for Communication. http://ec.europa.eu/public_opinion/index_en.htm This document does not represent the point of view of the European Commission. The interpretations and opinions contained in it are solely those of the authors. Standard Eurobarometer 77 / Spring 2012 – TNS Opinion & Social
Transcript of THE VALUES OF EUROPEANS - European …ec.europa.eu/commfrontoffice/publicopinion/archives/eb/...0...

Standard Eurobarometer 77 Spring 2012
THE VALUES OF EUROPEANS
REPORT
Fieldwork: May 2012
This survey has been requested and co-ordinated by the European Commission,
Directorate-General for Communication.
http://ec.europa.eu/public_opinion/index_en.htm
This document does not represent the point of view of the European Commission.
The interpretations and opinions contained in it are solely those of the authors.
Standard Eurobarometer 77 / Spring 2012 – TNS Opinion & Social

0
Standard Eurobarometer 77 Spring 2012
The values of Europeans
Survey conducted by TNS Opinion & Social at the request of the European Commission,
Directorate-General for Communication
Survey coordinated by the European Commission,
Directorate-General for Communication “Research and Speechwriting” Unit

STANDARD EUROBAROMETER 77 VALUES OF EUROPEANS – SPRING 2012
1
CONTENTS INTRODUCTION ............................................................................................................................... 2
I. THE EXISTENCE OF COMMON EUROPEAN VALUES ................................................................... 4
1. The closeness of Member States in terms of values .............................................................. 4
2. The comparison with other continents ................................................................................. 7
II. THE VALUES SHARED BY EUROPEANS AND THOSE THAT BEST REPRESENT THE EUROPEAN
UNION ..................................................................................................................................... 9
1. The values shared by Europeans .......................................................................................... 9
2. The values that best represent the European Union ........................................................... 12
3. The idea of happiness ........................................................................................................ 15
III. THE ECONOMIC AND SOCIAL VALUES OF EUROPEANS ............................................................ 18
1. State intervention and free competition ............................................................................ 18
2. Equality or individual freedom? ......................................................................................... 25
3. The severity of the justice system ...................................................................................... 28
4. The contribution of immigrants to society .......................................................................... 31
5. Economic growth or environmental protection? ................................................................ 34
6. The importance of leisure .................................................................................................. 38
ANNEXES
Technical specifications

STANDARD EUROBAROMETER 77 VALUES OF EUROPEANS – SPRING 2012
2
INTRODUCTION
Understanding European public opinion lies partially through an analysis of the values of Europeans. What are they? Are there shared values? What are the values attributed to the European Union? Have they changed during the crisis? Are there divisions between different categories?
These are the questions which we try to answer in this volume of the Eurobarometer 77 survey of spring 2012.
This Standard Eurobarometer was conducted between 12 and 27 May 2012 in 34 countries or territories1: the 27 Member States of the European Union, the six candidate countries (Croatia, the Former Yugoslav Republic of Macedonia, Turkey, Iceland, Montenegro and Serbia), and in the Turkish Cypriot Community in the part of the country that is not controlled by the government of the Republic of Cyprus.
The analysis of the values of Europeans is conducted from different angles:
- The closeness of Member States in terms of values: Are values shared between the Member States? Are they shared more closely than on other continents?
- The values that count the most and which are best embodied by the European Union: What are the values that matter most to Europeans? Which best represent their idea of happiness? What values do they attribute to the EU? Are these personal and European values consistent?
- The economic and social values of Europeans, and how they are changing: How do they perceive state intervention? How does this relate to free competition? Do they give precedence to equality or to freedom? Is the justice system sufficiently severe? How do the public see the contribution of immigrants to society? Which takes priority, the environment or growth? And lastly, what is the place of leisure as opposed to work?
The full Standard Eurobarometer report comprises several volumes. The first volume analyses the results for the trend indicators of the Standard Eurobarometer. Four other volumes present European public opinion on other topics: the economic and financial crisis; the Europe 2020 strategy; European citizenship; values. The present volume considers the values of Europeans.
The general analysis and the socio-demographic analyses are based on the average results for the 27 Member States. This average has been weighted to reflect the actual population of each Member State. The averages for previous years represent the results obtained in all the Member States of the European Union as it was composed at the time of the survey.
* * * * *
1Please refer to the technical specifications for the exact dates of the fieldwork carried out in each country

STANDARD EUROBAROMETER 77 VALUES OF EUROPEANS – SPRING 2012
3
32,728 people from different social and demographic backgrounds were interviewed face to face in their homes in their mother tongue at the request of the European Commission. The methodology used is that of the Eurobarometer surveys conducted on behalf of the Directorate-General for Communication (“Research and Speechwriting” Unit)2. A technical note concerning the interviews carried out by the institutes within the TNS Opinion & Social network is annexed to this report. It describes the method used for the interviews and the confidence intervals3.
The abbreviations used in this report correspond to:
ABBREVIATIONS BE Belgium LV Latvia CZ Czech Republic LU Luxembourg BG Bulgaria HU Hungary DK Denmark MT Malta DE Germany NL The Netherlands EE Estonia AT Austria EL Greece PL Poland ES Spain PT Portugal FR France RO Romania IE Ireland SI Slovenia IT Italy SK Slovakia CY Republic of Cyprus*** FI Finland LT Lithuania SE Sweden UK The United Kingdom CY (tcc) Turkish Cypriot Community
HR Croatia EU27 European Union – 27 Member States TR Turkey MK Former Yugoslav Republic of Macedonia**** EU15 BE, IT, FR, DE, LU, NL, DK, UK, IE, PT, ES, EL, AT, SE, FI*
IS Iceland NMS12 BG, CZ, EE, CY, LT, LV, MT, HU, PL, RO, SL, SK**
ME Montenegro Eurozone
BE, FR, IT, LU, DE, AT, ES, PT, IE, NL, FI, EL, EE, SI, CY, MT, SK
RS Serbia Non-Eurozone
BG, CZ, DK, LV, LT, HU, PL, RO, SE, UK
* EU15 refers to the 15 countries that formed the European Union before the 2004 and 2007 enlargements
** The NMS12 are the 12 “new Member States” which joined the European Union during the 2004 and 2007 enlargements
*** Cyprus as a whole is one of the 27 European Union Member States. However, the “acquis communautaire” has been suspended in the part of the country which is not controlled by the government of the Republic of Cyprus. For practical reasons, only the interviews carried out in the part of the country controlled by the government of the Republic of Cyprus are included in the “CY” category and in the EU27 average. Interviews carried out in the part of the country that is not controlled by the government of the Republic of Cyprus are included in the “CY(tcc)” category (tcc: Turkish Cypriot Community).
**** Provisional abbreviation which in no way prejudges the definitive name of this country, which will be agreed once the current negotiations at the United Nations have been completed.
* * * * *
We wish to thank the people interviewed throughout Europe who took the time to take part in this survey.
Without their active participation, this survey would not have been possible.
2 http://ec.europa.eu/public_opinion/index_en.htm 3 The results tables are annexed. It should be noted that the total of the percentages indicated in the tables in this report may exceed 100% when the respondent was able to choose several answers to the same question.
STANDARD EUROBAROMETER 77 VALUES OF EUROPEANS – SPRING 2012
4
I. THE EXISTENCE OF COMMON EUROPEAN VALUES
- A relative majority of Europeans, unchanged since 2006, feel that EU Member States are close in terms of values -
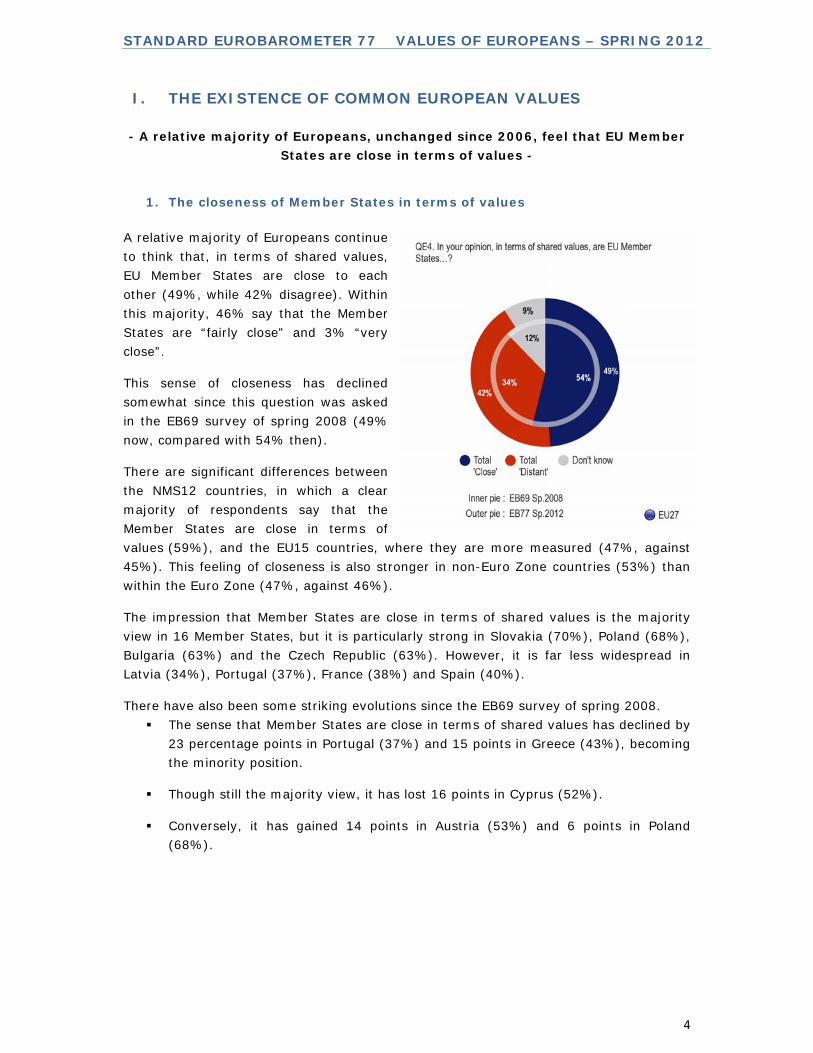
1. The closeness of Member States in terms of values
A relative majority of Europeans continue to think that, in terms of shared values, EU Member States are close to each other (49%, while 42% disagree). Within this majority, 46% say that the Member States are “fairly close” and 3% “very close”.
This sense of closeness has declined somewhat since this question was asked in the EB69 survey of spring 2008 (49% now, compared with 54% then).
There are significant differences between the NMS12 countries, in which a clear majority of respondents say that the Member States are close in terms of values (59%), and the EU15 countries, where they are more measured (47%, against 45%). This feeling of closeness is also stronger in non-Euro Zone countries (53%) than within the Euro Zone (47%, against 46%).
The impression that Member States are close in terms of shared values is the majority view in 16 Member States, but it is particularly strong in Slovakia (70%), Poland (68%), Bulgaria (63%) and the Czech Republic (63%). However, it is far less widespread in Latvia (34%), Portugal (37%), France (38%) and Spain (40%).
There have also been some striking evolutions since the EB69 survey of spring 2008. The sense that Member States are close in terms of shared values has declined by
23 percentage points in Portugal (37%) and 15 points in Greece (43%), becoming the minority position.
Though still the majority view, it has lost 16 points in Cyprus (52%).
Conversely, it has gained 14 points in Austria (53%) and 6 points in Poland (68%).

STANDARD EUROBAROMETER 77 VALUES OF EUROPEANS – SPRING 2012
5

STANDARD EUROBAROMETER 77 VALUES OF EUROPEANS – SPRING 2012
6
This question reveals the divisions which are traditionally measured in relation to the European Union:
Young Europeans are more likely to see the Member States as close in terms of values (56% of the 15-24 age group) than their elders (44% of people aged 55+; this is the minority view in this group).
A majority of the most educated Europeans share this impression (54% of those who studied to the age of 20 or beyond), while it is the minority view among respondents whose education ended before the age of 16 (39%).
It is also stronger among Europeans who position themselves towards the top of the social scale (57%) than among those who place themselves at the bottom (42%).
Finally, it is much more widespread among respondents with a strong interest in European politics (52%, vs 44% of those who take no interest).
STANDARD EUROBAROMETER 77 VALUES OF EUROPEANS – SPRING 2012
7
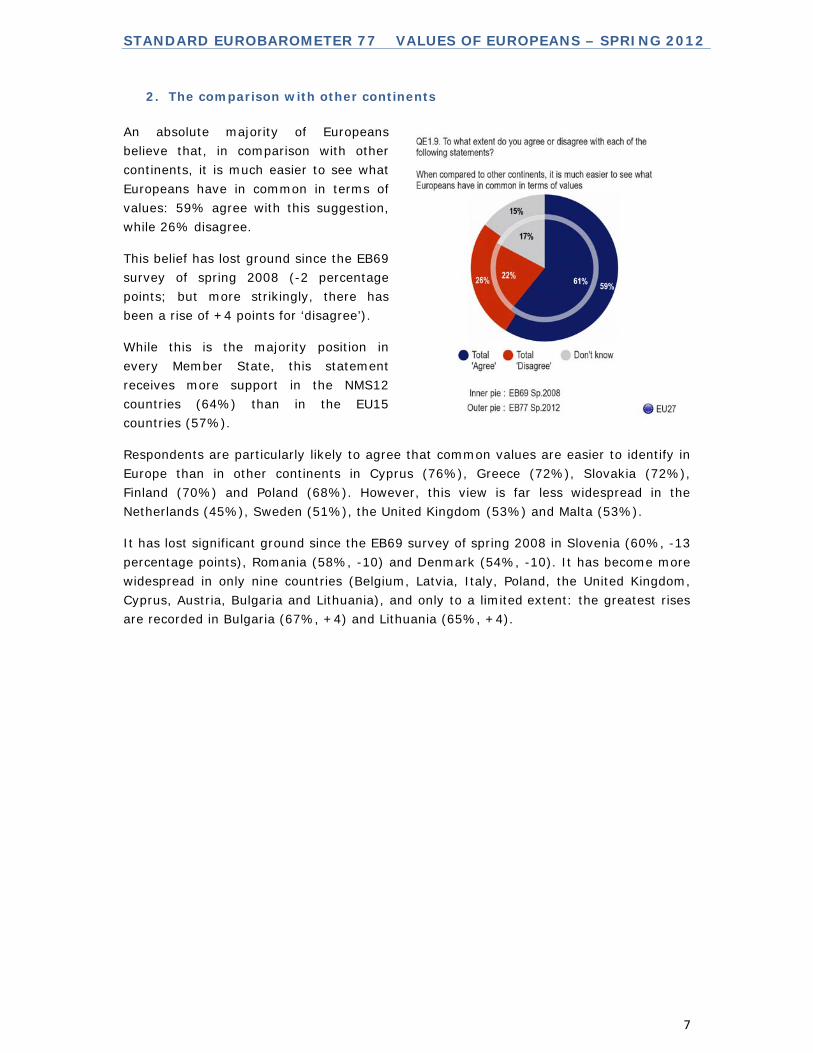
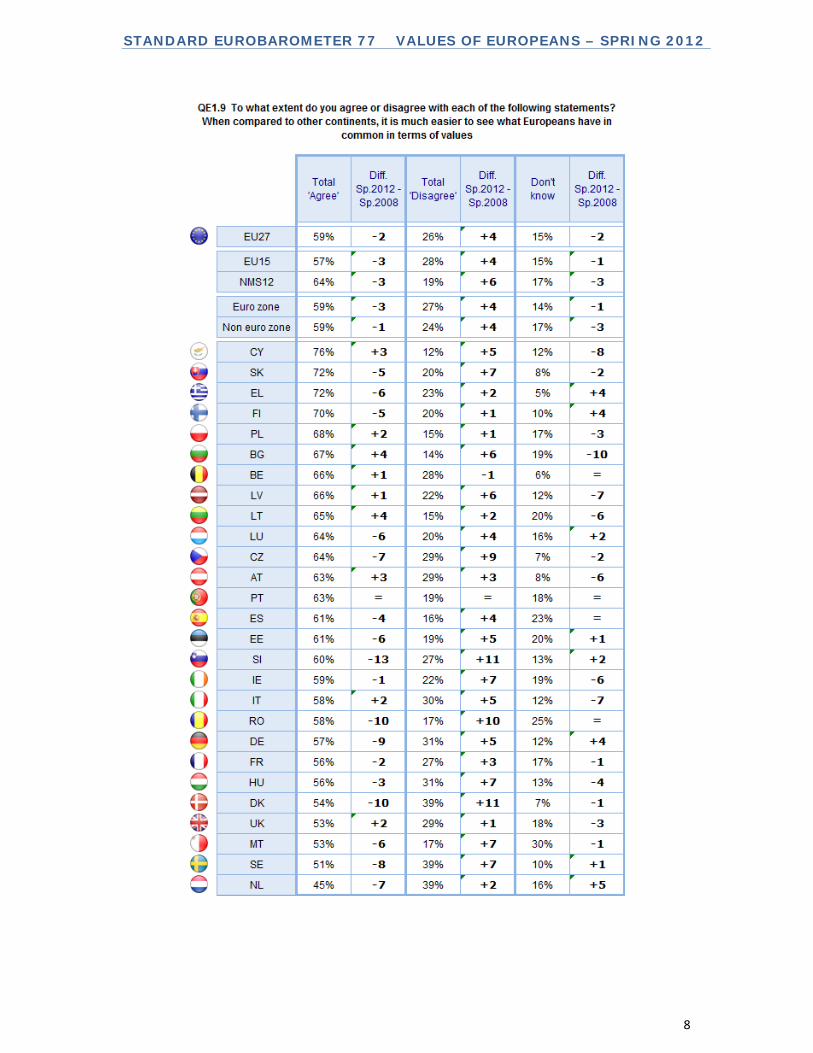
2. The comparison with other continents
An absolute majority of Europeans believe that, in comparison with other continents, it is much easier to see what Europeans have in common in terms of values: 59% agree with this suggestion, while 26% disagree.
This belief has lost ground since the EB69 survey of spring 2008 (-2 percentage points; but more strikingly, there has been a rise of +4 points for ‘disagree’).
While this is the majority position in every Member State, this statement receives more support in the NMS12 countries (64%) than in the EU15 countries (57%).
Respondents are particularly likely to agree that common values are easier to identify in Europe than in other continents in Cyprus (76%), Greece (72%), Slovakia (72%), Finland (70%) and Poland (68%). However, this view is far less widespread in the Netherlands (45%), Sweden (51%), the United Kingdom (53%) and Malta (53%).
It has lost significant ground since the EB69 survey of spring 2008 in Slovenia (60%, -13 percentage points), Romania (58%, -10) and Denmark (54%, -10). It has become more widespread in only nine countries (Belgium, Latvia, Italy, Poland, the United Kingdom, Cyprus, Austria, Bulgaria and Lithuania), and only to a limited extent: the greatest rises are recorded in Bulgaria (67%, +4) and Lithuania (65%, +4).
STANDARD EUROBAROMETER 77 VALUES OF EUROPEANS – SPRING 2012
8

STANDARD EUROBAROMETER 77 VALUES OF EUROPEANS – SPRING 2012
9
II. THE VALUES SHARED BY EUROPEANS AND THOSE THAT BEST
REPRESENT THE EUROPEAN UNION
- Personal values are generally consistent with those that best represent the European Union: peace, human rights and democracy -
1. The values shared by Europeans
Asked which values matter the most to them, Europeans first mention human rights (43%) and respect for human life (43%). The former has lost ground since the EB74 survey of Autumn 2010 (-4 percentage points), while respect for human life is mentioned a little more often (+2).
These two values are followed by peace (40%), which is mentioned less often than in autumn 2010 (-4 points).
Democracy stands fourth in the ranking of values which matter most to Europeans (28%, -1), followed by individual freedom (23%, unchanged) and the rule of law (21%, -1).
These are followed by equality (20%, +1), solidarity (15%, unchanged) and tolerance (15%, unchanged), ahead of self-fulfilment (11%, +1), respect for other cultures (9%, +1) and religion (5%, -1).
The ranking of personal values is fairly similar between the EU15 countries and the NMS12 countries, with priority given to respect for human life, human rights and peace. NMS12 respondents are more likely to mention individual freedom (26%, compared with 22% in the EU15), whereas EU15 respondents give preference to democracy (30%, compared with 21% in the NMS12).
Respect for human life is the first value identified in 10 Member States, led by Ireland (58%), Bulgaria (52%) and Romania (51%). It is also mentioned by a majority in Cyprus (51%, in second place after human rights). It has gained significant ground since the EB74 survey of Autumn 2010 in Lithuania (48%, +11 percentage points) and Romania (51%, +10).

STANDARD EUROBAROMETER 77 VALUES OF EUROPEANS – SPRING 2012
10
Human rights lead the ranking of personal values in seven Member States. This item is very widely mentioned in Sweden (65%), Cyprus (62%), Lithuania (51%) and Bulgaria (51%, where it stands in second place behind respect for human life, 52%). However, the trend for this item is downwards, with the most significant decline recorded in Luxembourg (41%, -12 percentage points).
In Italy, these first two values, respect for human life and human rights, were mentioned equally (both 38%).
Peace is the first personal value mentioned in seven Member States: Germany (55%), Slovenia (51%), Luxembourg (48%), Malta (47%), Greece (46%), the Netherlands (40%) and Slovakia (39%). It is cited much less often than in Autumn 2010 in Poland (32%, -12 percentage points), Estonia (42%, -11) and Finland (45%, -10).
Democracy is the first value mentioned in Denmark (52%), as is individual freedom in Austria (53%).
Other notable results include: The rule of law is very widely mentioned in Slovenia (38%). In Portugal, equality (36%) and solidarity (26%) are both cited more than
average. Respondents in Belgium give pride of place to tolerance (30%). Those in Romania mention self-fulfilment more than the European average
(23%). Respect for other cultures is frequently mentioned in Luxembourg (18%). Religion is frequently mentioned in Cyprus (19%).
In the candidate countries: The three leading personal values are also respect for human life, human rights
and peace in almost all the candidate countries.
In Serbia, where this survey was fielded for the first time, peace leads the ranking (46%).
Turkey is an exception in giving more importance to religion (27%) and individual freedom (26%) than peace (25%), behind respect for human life (50%) and human rights (45%).
The hierarchy of values which matter most personally varies little across the socio-demographic categories, though there are some differences in the frequency of mentions. However, older respondents and less educated respondents are most likely to mention peace as their first personal value.

STANDARD EUROBAROMETER 77 VALUES OF EUROPEANS – SPRING 2012
11

STANDARD EUROBAROMETER 77 VALUES OF EUROPEANS – SPRING 2012
12
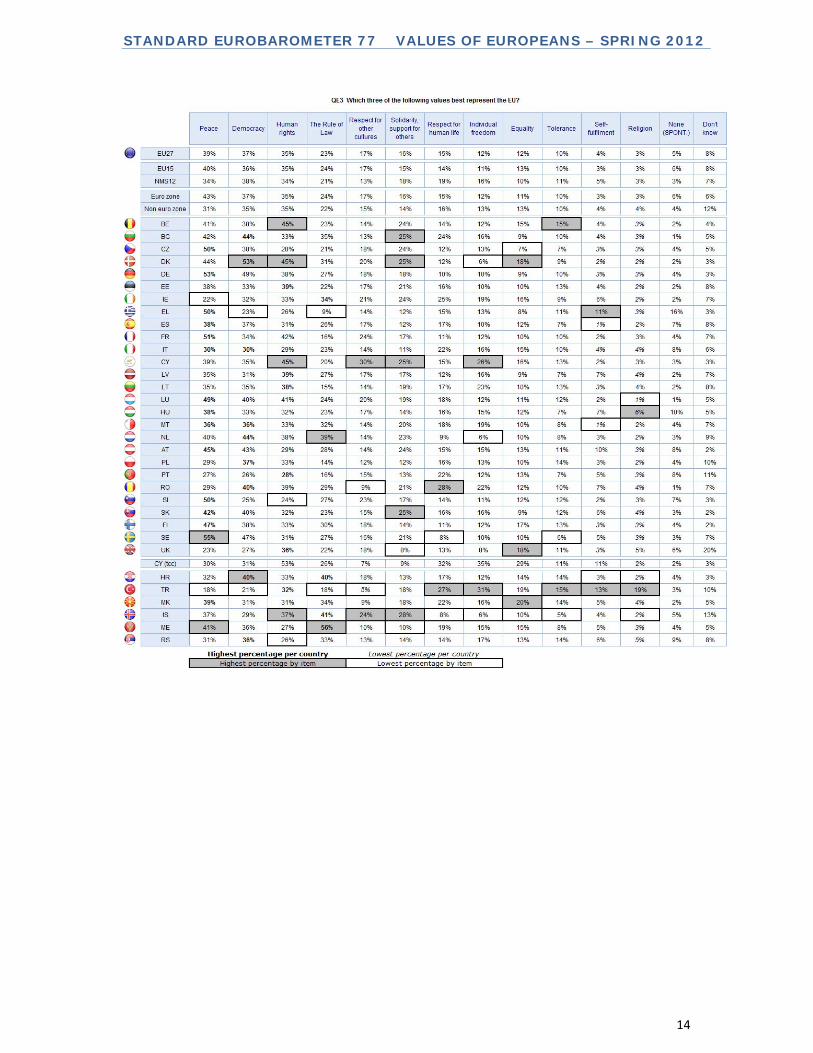
2. The values that best represent the European Union
Invited to say which values best represent the European Union, respondents mention the same values as those which they most cherish personally. Peace leads the ranking (39%), following a rise since the EB74 survey of autumn 2010 (+4 percentage points). Democracy has moved into second place, still with a high score (37%, -1). The third value representing the EU is human rights, despite a slight decline (35%, -3).
These values are followed by the rule of law (23%, -2), and respect for other cultures (17%, -1).
Solidarity is in 6th position, but is mentioned less than in the EB74 survey (16%, -4).
As in the past, respect for human life, the first-ranked personal value, scores much lower here (15%, -1), doubtless because it is seen more as a matter for individual behaviour than for a political entity.
These values are followed by individual freedom (12%, =), equality (12%, -1), tolerance (10%, -1), self-fulfilment (4%, =), and religion (3%, =).
EU15 respondents are more likely to mention peace (40%) as a value which embodies the EU, while NMS12 respondents are most likely to mention democracy (38%, compared with 34% for peace).
Peace is the value that best represents the European Union for respondents in 12 Member States. It is mentioned very frequently in Sweden (55%), Germany (53%) and France (51%), and much more often than in Autumn 2010 in the Czech Republic (50%, +13 percentage points) and Slovenia (50%, +12). Other countries in which peace is seen as the value most representing the EU are Greece, Spain, Luxembourg, Hungary, Austria, Slovakia and Finland.
Democracy is the most mentioned value in five Member States, led by Denmark (53%).
Peace and democracy jointly lead the ranking in Malta (36%) and Italy (30%).
Human rights are the first value in seven Member States, led by Belgium and Cyprus (both 45%). This item is mentioned much less frequently than in autumn 2010 in Luxembourg (41%, -10 percentage points) and Italy (29%, -9).
The rule of law is the first value mentioned in Ireland (34%).

STANDARD EUROBAROMETER 77 VALUES OF EUROPEANS – SPRING 2012
13
The decline in mentions of solidarity, touched upon above, is especially strong in Germany (18%, -13), Portugal (13%, -10) and Sweden (21%, -9).
In the candidate countries: The rule of law is the first value identified as representing the EU in Montenegro
(56%), Iceland (41%) and Croatia (40%, equal with democracy).
In Turkey, individual freedom, which we have seen is an important personal value, is mentioned very often (31%) and stands in second place behind human rights (32%).
In Serbia, democracy is the first-ranked value (36%), ahead of the rule of law (33%).
STANDARD EUROBAROMETER 77 VALUES OF EUROPEANS – SPRING 2012
14
STANDARD EUROBAROMETER 77 VALUES OF EUROPEANS – SPRING 2012
15
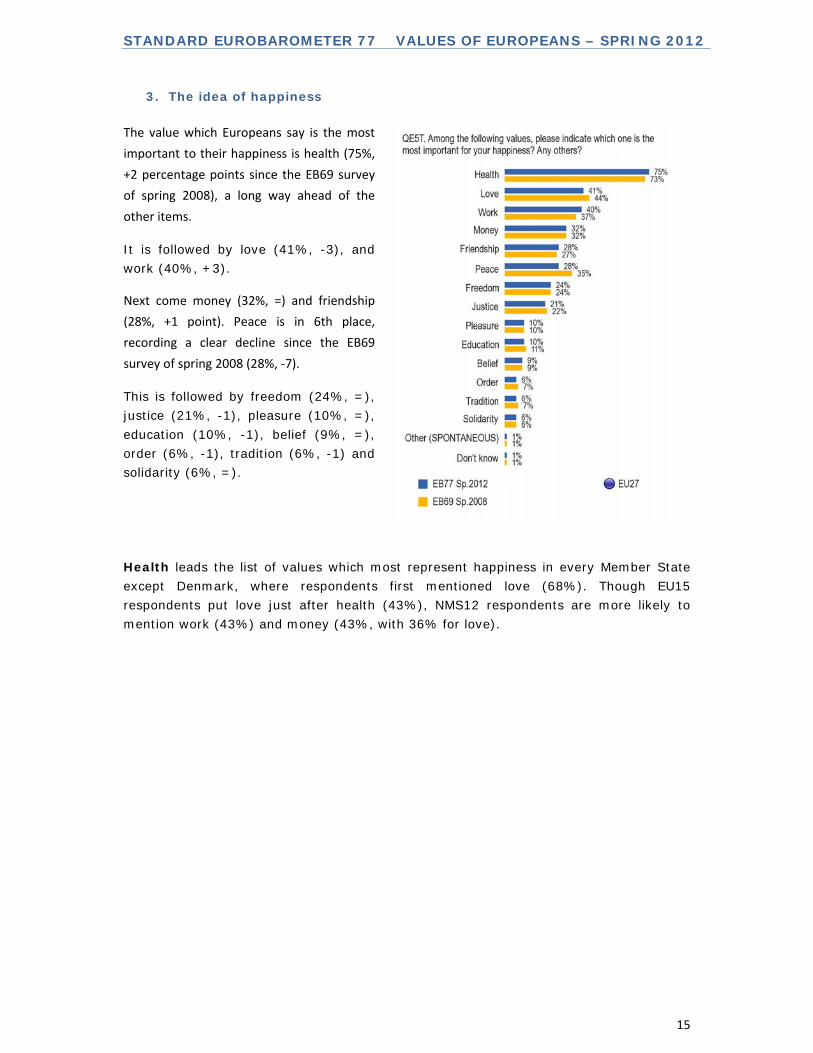
3. The idea of happiness
The value which Europeans say is the most
important to their happiness is health (75%,
+2 percentage points since the EB69 survey
of spring 2008), a long way ahead of the
other items.
It is followed by love (41%, -3), and work (40%, +3).
Next come money (32%, =) and friendship
(28%, +1 point). Peace is in 6th place,
recording a clear decline since the EB69
survey of spring 2008 (28%, ‐7).
This is followed by freedom (24%, =), justice (21%, -1), pleasure (10%, =), education (10%, -1), belief (9%, =), order (6%, -1), tradition (6%, -1) and solidarity (6%, =).
Health leads the list of values which most represent happiness in every Member State except Denmark, where respondents first mentioned love (68%). Though EU15 respondents put love just after health (43%), NMS12 respondents are more likely to mention work (43%) and money (43%, with 36% for love).

STANDARD EUROBAROMETER 77 VALUES OF EUROPEANS – SPRING 2012
16
Work has gained significant ground in Denmark (35%, +20 percentage points), Cyprus (44%, +16), Estonia (43%, +13), Ireland (39%, +11), Romania (37%, +11), Slovenia (33%, +11) and the United Kingdom (23%, +10). Conversely, the score for this item has declined fairly sharply in Luxembourg (32%, -9), Malta (36%, -7) and Germany (36%, -6).
STANDARD EUROBAROMETER 77 VALUES OF EUROPEANS – SPRING 2012
17
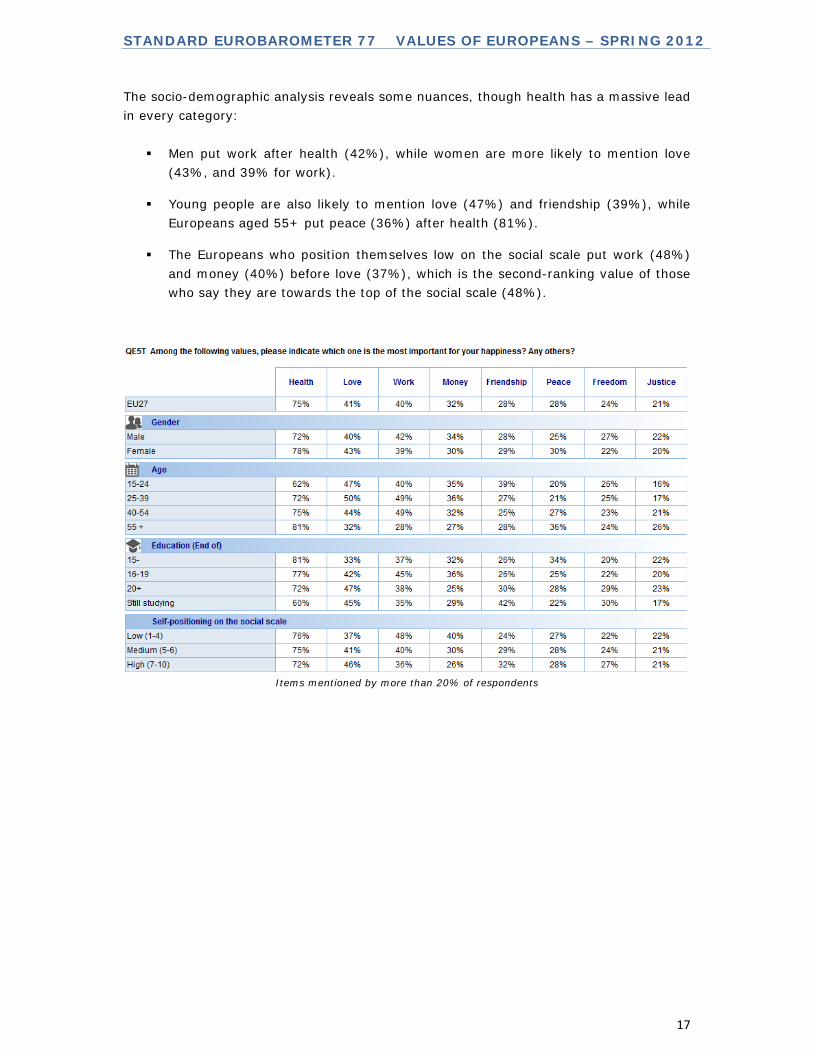
The socio-demographic analysis reveals some nuances, though health has a massive lead in every category:
Men put work after health (42%), while women are more likely to mention love (43%, and 39% for work).
Young people are also likely to mention love (47%) and friendship (39%), while Europeans aged 55+ put peace (36%) after health (81%).
The Europeans who position themselves low on the social scale put work (48%) and money (40%) before love (37%), which is the second-ranking value of those who say they are towards the top of the social scale (48%).
Items mentioned by more than 20% of respondents
STANDARD EUROBAROMETER 77 VALUES OF EUROPEANS – SPRING 2012
18
III. THE ECONOMIC AND SOCIAL VALUES OF EUROPEANS
1. State intervention and free competition
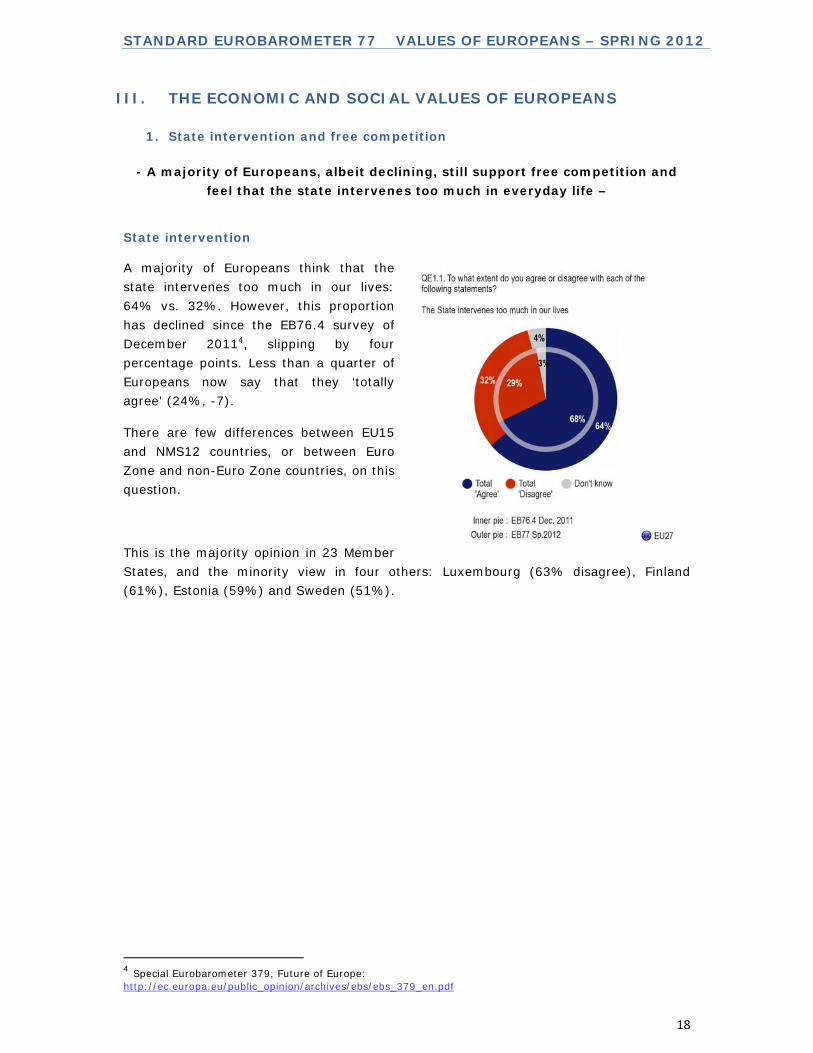
- A majority of Europeans, albeit declining, still support free competition and feel that the state intervenes too much in everyday life –
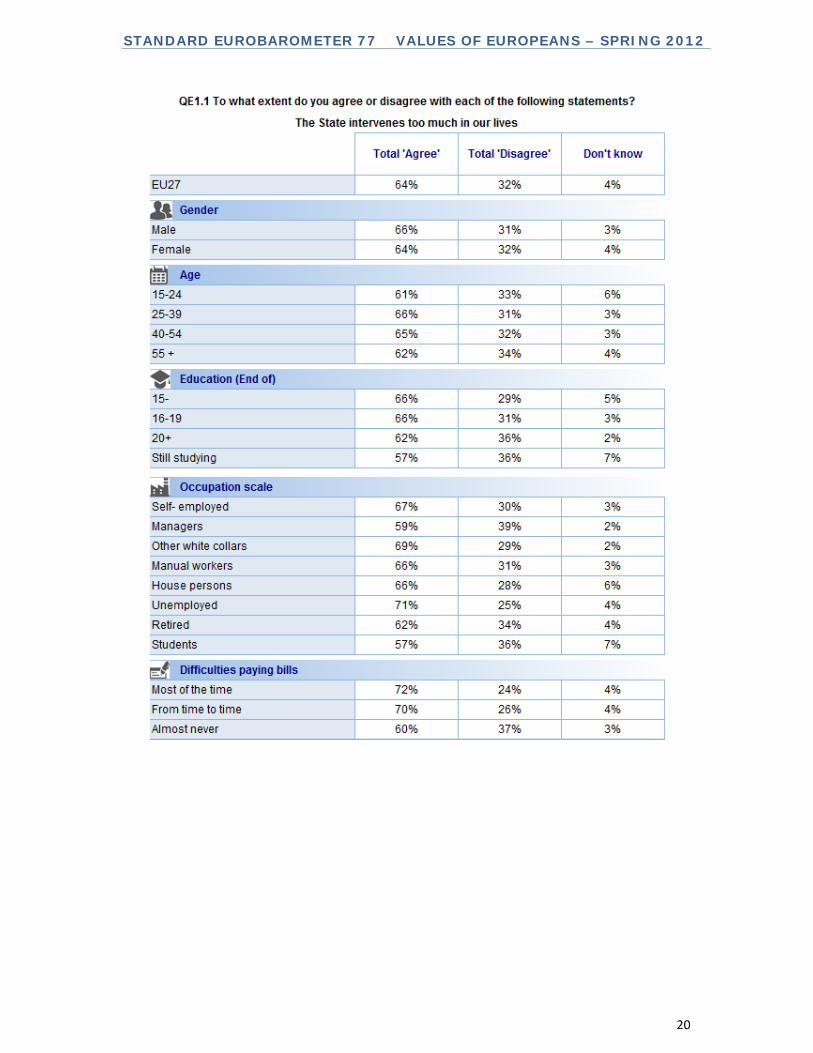
State intervention A majority of Europeans think that the state intervenes too much in our lives: 64% vs. 32%. However, this proportion has declined since the EB76.4 survey of December 20114, slipping by four percentage points. Less than a quarter of Europeans now say that they ‘totally agree’ (24%, -7).
There are few differences between EU15 and NMS12 countries, or between Euro Zone and non-Euro Zone countries, on this question.
This is the majority opinion in 23 Member States, and the minority view in four others: Luxembourg (63% disagree), Finland (61%), Estonia (59%) and Sweden (51%).
4 Special Eurobarometer 379, Future of Europe: http://ec.europa.eu/public_opinion/archives/ebs/ebs_379_en.pdf

STANDARD EUROBAROMETER 77 VALUES OF EUROPEANS – SPRING 2012
19
It is particularly strong in Portugal (86%), Greece (84%) and Slovenia (82%). However, it has declined significantly since the previous survey in Luxembourg (34%, -19 percentage points), where it is now the minority view, and in France (55%, -14) and Austria (56%, -12). It has gained most ground in Malta (62%, +8).
STANDARD EUROBAROMETER 77 VALUES OF EUROPEANS – SPRING 2012
20
STANDARD EUROBAROMETER 77 VALUES OF EUROPEANS – SPRING 2012
21
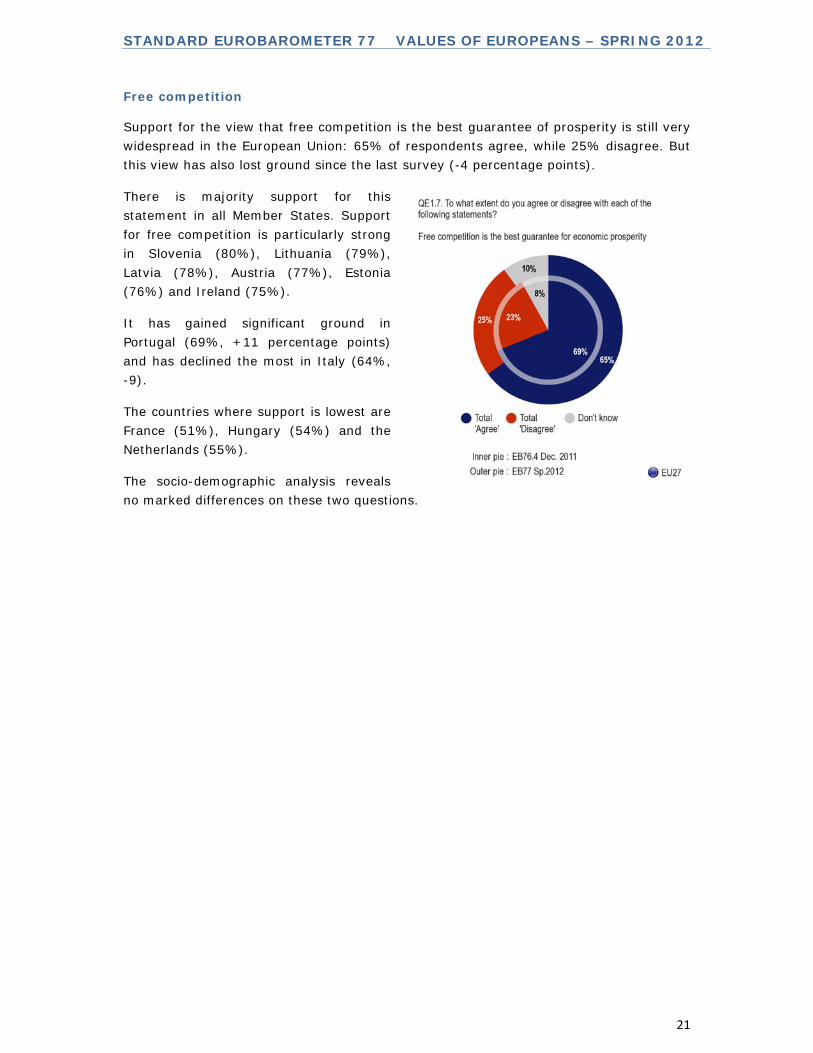
Free competition Support for the view that free competition is the best guarantee of prosperity is still very widespread in the European Union: 65% of respondents agree, while 25% disagree. But this view has also lost ground since the last survey (-4 percentage points).
There is majority support for this statement in all Member States. Support for free competition is particularly strong in Slovenia (80%), Lithuania (79%), Latvia (78%), Austria (77%), Estonia (76%) and Ireland (75%).
It has gained significant ground in Portugal (69%, +11 percentage points) and has declined the most in Italy (64%, -9).
The countries where support is lowest are France (51%), Hungary (54%) and the Netherlands (55%).
The socio-demographic analysis reveals no marked differences on these two questions.

STANDARD EUROBAROMETER 77 VALUES OF EUROPEANS – SPRING 2012
22

STANDARD EUROBAROMETER 77 VALUES OF EUROPEANS – SPRING 2012
23

STANDARD EUROBAROMETER 77 VALUES OF EUROPEANS – SPRING 2012
24

STANDARD EUROBAROMETER 77 VALUES OF EUROPEANS – SPRING 2012
25
2. Equality or individual freedom?
– Two-thirds of Europeans support more equality and justice, even if this means less individual freedom –
Two-thirds of Europeans think that “we need more equality and justice even if this means less freedom for the individual” (66%, vs. 29% who disagree). This proportion has changed little since the last time this question was asked, in the EB69 survey of spring 2008 (65%, vs. 29% who disagreed).
Support for this statement is stronger in the NMS12 countries (72%) than in the EU15 (64%). In contrast, there is only a marginal difference between Euro Zone (67%) and non-Euro Zone countries (65%).
A majority of respondents call for equality even at the expense of freedom in 25 Member States. The feeling is particularly strong in Portugal (82%), Italy (79%), Romania (79%), Slovenia (76%) and Bulgaria (75%). Conversely, a majority disagree in the Netherlands (54% disagree) and Denmark (50%).
Since the EB69 survey of spring 2008, this opinion has gained significant support in Cyprus (70%, +11), Slovenia (76%, +9) and Austria (62%, +9).
Despite the majority support in all social classes, we found that:
This idea is more appealing to respondents aged 55+ (69%) than to the youngest respondents (61% of those aged 15-24 years).
Support is also stronger among the least educated respondents (71% of those whose education ended before the age of 16, compared with 63% of those who studied until the age of 20 or beyond).
It is also a little stronger among Europeans who position themselves towards the bottom of the social scale (69%) than among those who place themselves at the top (63%).

STANDARD EUROBAROMETER 77 VALUES OF EUROPEANS – SPRING 2012
26

STANDARD EUROBAROMETER 77 VALUES OF EUROPEANS – SPRING 2012
27
STANDARD EUROBAROMETER 77 VALUES OF EUROPEANS – SPRING 2012
28
3. The severity of the justice system
- A majority say that the justice system is insufficiently severe –
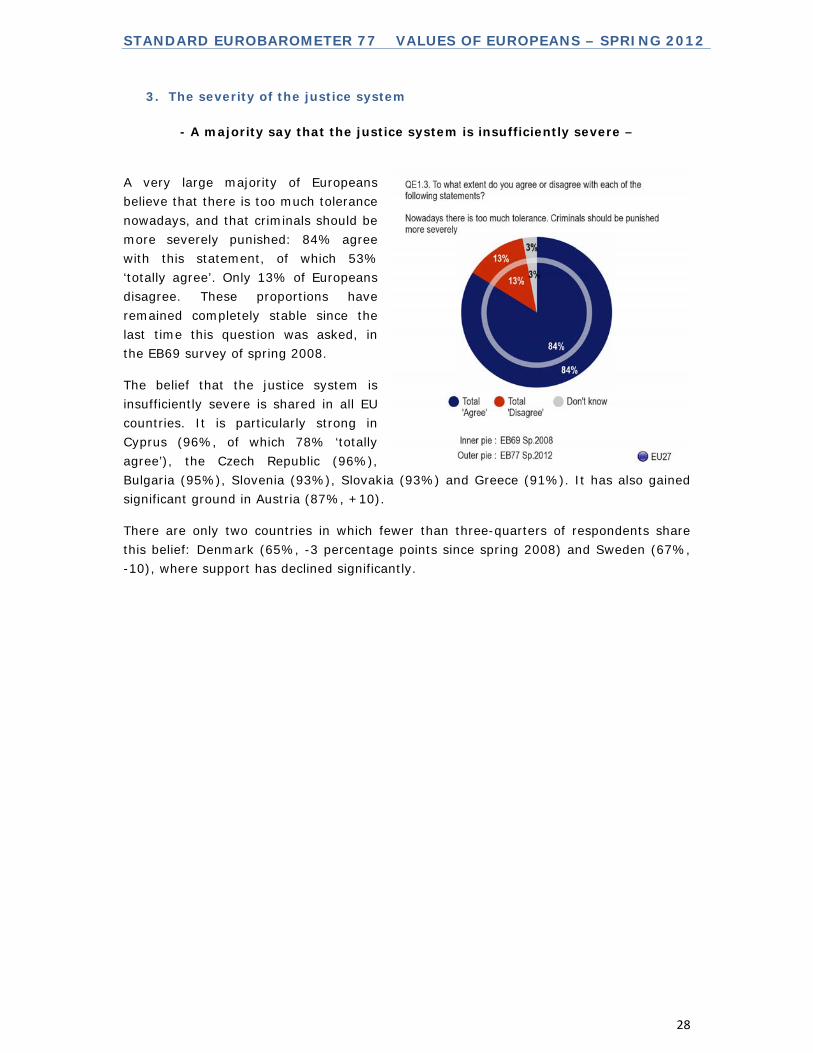
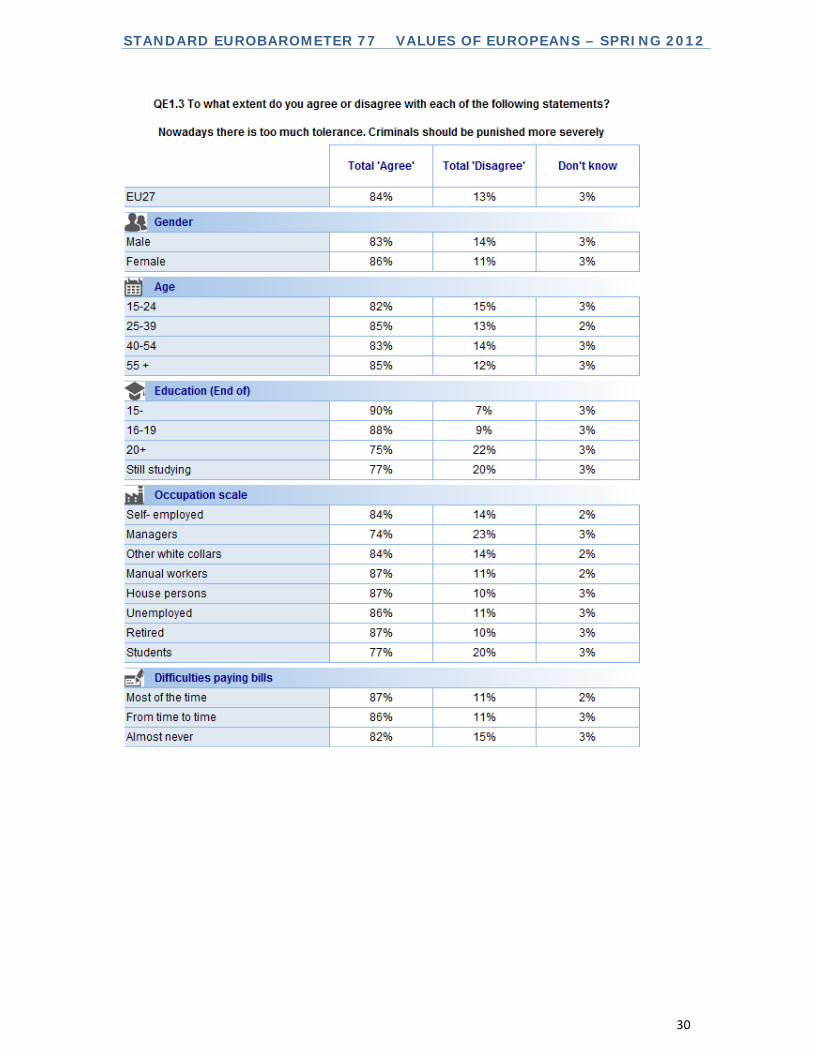
A very large majority of Europeans believe that there is too much tolerance nowadays, and that criminals should be more severely punished: 84% agree with this statement, of which 53% ‘totally agree’. Only 13% of Europeans disagree. These proportions have remained completely stable since the last time this question was asked, in the EB69 survey of spring 2008.
The belief that the justice system is insufficiently severe is shared in all EU countries. It is particularly strong in Cyprus (96%, of which 78% ‘totally agree’), the Czech Republic (96%), Bulgaria (95%), Slovenia (93%), Slovakia (93%) and Greece (91%). It has also gained significant ground in Austria (87%, +10).
There are only two countries in which fewer than three-quarters of respondents share this belief: Denmark (65%, -3 percentage points since spring 2008) and Sweden (67%, -10), where support has declined significantly.

STANDARD EUROBAROMETER 77 VALUES OF EUROPEANS – SPRING 2012
29
STANDARD EUROBAROMETER 77 VALUES OF EUROPEANS – SPRING 2012
30
STANDARD EUROBAROMETER 77 VALUES OF EUROPEANS – SPRING 2012
31
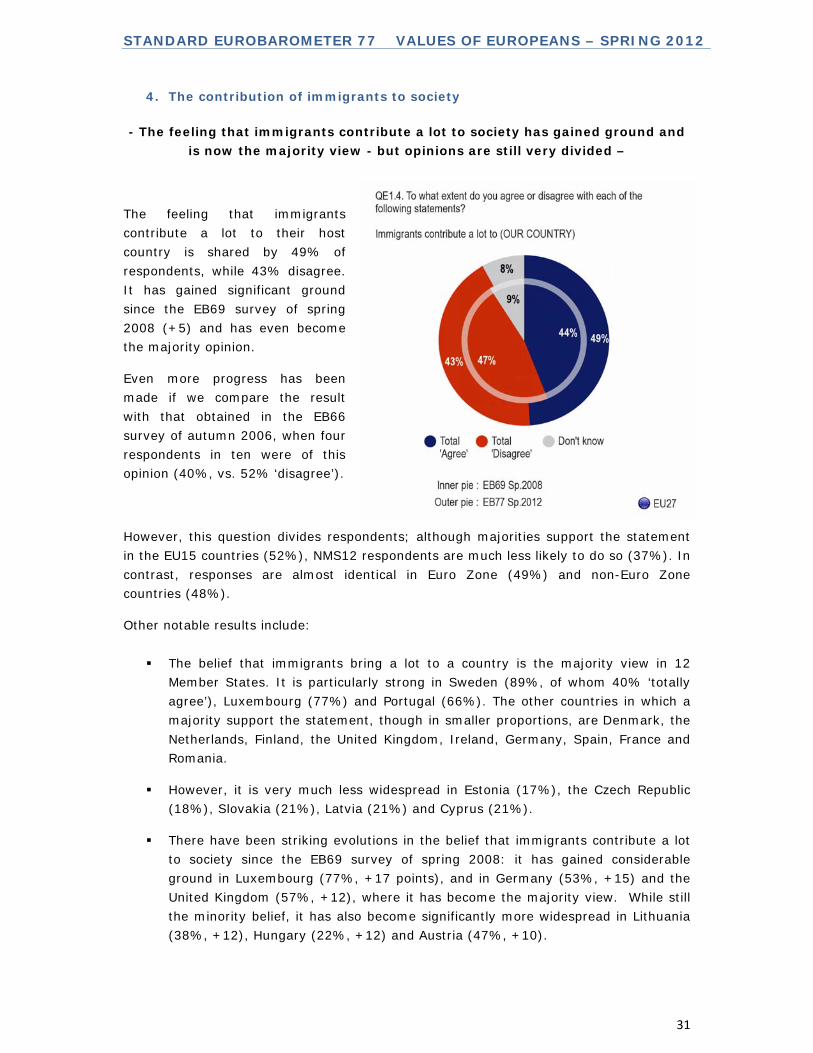
4. The contribution of immigrants to society
- The feeling that immigrants contribute a lot to society has gained ground and is now the majority view - but opinions are still very divided –
The feeling that immigrants contribute a lot to their host country is shared by 49% of respondents, while 43% disagree. It has gained significant ground since the EB69 survey of spring 2008 (+5) and has even become the majority opinion.
Even more progress has been made if we compare the result with that obtained in the EB66 survey of autumn 2006, when four respondents in ten were of this opinion (40%, vs. 52% ‘disagree’).
However, this question divides respondents; although majorities support the statement in the EU15 countries (52%), NMS12 respondents are much less likely to do so (37%). In contrast, responses are almost identical in Euro Zone (49%) and non-Euro Zone countries (48%).
Other notable results include:
The belief that immigrants bring a lot to a country is the majority view in 12 Member States. It is particularly strong in Sweden (89%, of whom 40% ‘totally agree’), Luxembourg (77%) and Portugal (66%). The other countries in which a majority support the statement, though in smaller proportions, are Denmark, the Netherlands, Finland, the United Kingdom, Ireland, Germany, Spain, France and Romania.
However, it is very much less widespread in Estonia (17%), the Czech Republic (18%), Slovakia (21%), Latvia (21%) and Cyprus (21%).
There have been striking evolutions in the belief that immigrants contribute a lot to society since the EB69 survey of spring 2008: it has gained considerable ground in Luxembourg (77%, +17 points), and in Germany (53%, +15) and the United Kingdom (57%, +12), where it has become the majority view. While still the minority belief, it has also become significantly more widespread in Lithuania (38%, +12), Hungary (22%, +12) and Austria (47%, +10).

STANDARD EUROBAROMETER 77 VALUES OF EUROPEANS – SPRING 2012
32
Conversely, it has declined markedly in Spain (48%, -16, retaining a narrow majority), Greece (32%, -13) and Cyprus (21%, -15).

STANDARD EUROBAROMETER 77 VALUES OF EUROPEANS – SPRING 2012
33
The socio-demographic analysis reveals some slight differences between categories: The feeling that immigrants contribute a lot to a country is the majority view
among those aged 15-24 (51%, vs. 40%); however, in the 55+ group, it is - just - the minority opinion (45%, vs. 46%).
A majority of the more educated Europeans share this impression (60% of those who studied to the age of 20 or beyond), while it is clearly the minority view among the less educated respondents (only 41% of those whose education ended before the age of 16 agree, while 50% disagree).
A majority of managers (62%) and white-collar workers (51%) recognise the contribution of immigrants, but only a minority of manual workers (46%) and the unemployed (44%) do so.
Whether respondents have difficulty paying their bills or not is a very significant factor: while 52% of Europeans who almost never have these difficulties say that immigrants bring a lot to their country, this proportion plummets to 38% among those who have the most frequent problems (vs. 54% who disagree).
STANDARD EUROBAROMETER 77 VALUES OF EUROPEANS – SPRING 2012
34
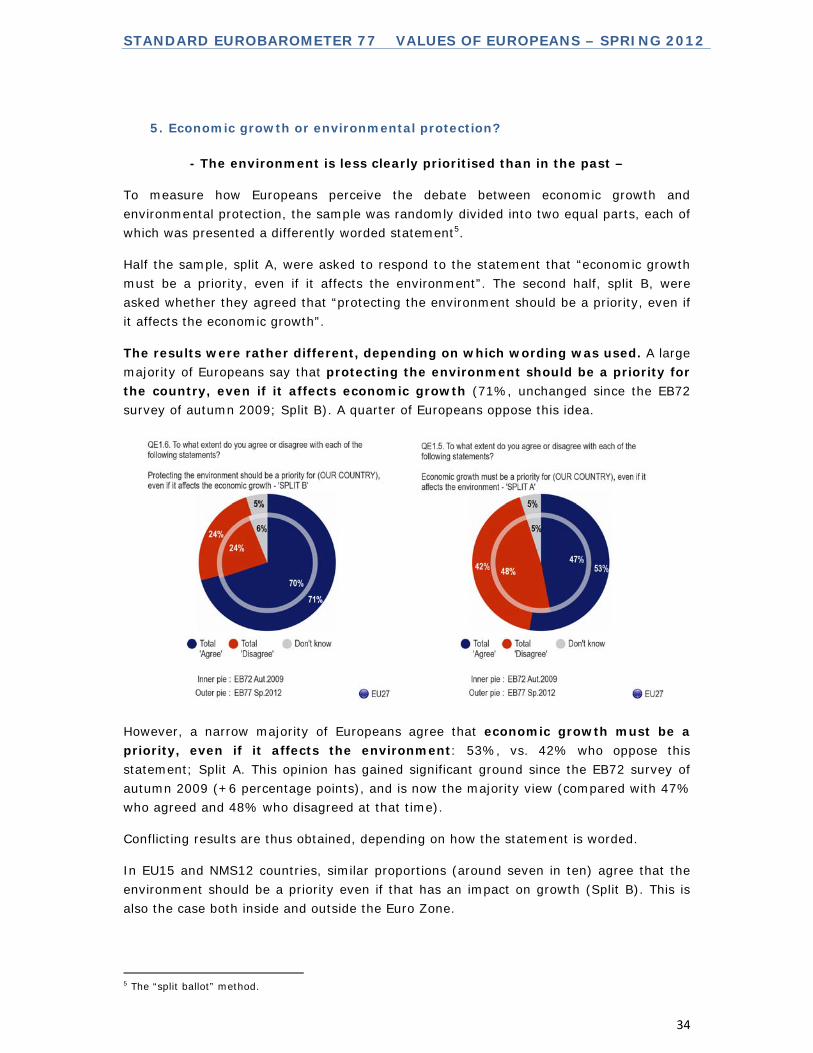
5. Economic growth or environmental protection?
- The environment is less clearly prioritised than in the past –
To measure how Europeans perceive the debate between economic growth and environmental protection, the sample was randomly divided into two equal parts, each of which was presented a differently worded statement5.
Half the sample, split A, were asked to respond to the statement that “economic growth must be a priority, even if it affects the environment”. The second half, split B, were asked whether they agreed that “protecting the environment should be a priority, even if it affects the economic growth”.
The results were rather different, depending on which wording was used. A large majority of Europeans say that protecting the environment should be a priority for the country, even if it affects economic growth (71%, unchanged since the EB72 survey of autumn 2009; Split B). A quarter of Europeans oppose this idea.
However, a narrow majority of Europeans agree that economic growth must be a priority, even if it affects the environment: 53%, vs. 42% who oppose this statement; Split A. This opinion has gained significant ground since the EB72 survey of autumn 2009 (+6 percentage points), and is now the majority view (compared with 47% who agreed and 48% who disagreed at that time).
Conflicting results are thus obtained, depending on how the statement is worded.
In EU15 and NMS12 countries, similar proportions (around seven in ten) agree that the environment should be a priority even if that has an impact on growth (Split B). This is also the case both inside and outside the Euro Zone.
5 The “split ballot” method.

STANDARD EUROBAROMETER 77 VALUES OF EUROPEANS – SPRING 2012
35
But the idea of giving priority to growth, even if this has an impact on the environment (Split A), produces more contrasting responses. Though this statement still attracts the agreement of the majority, support is weaker in EU15 countries (51%) than in the NMS12 (60%) and within the Euro Zone (50%) than outside it (59%).
The statement that the environment should be a priority even if this affects growth (Split B) has majority support in all Member States. Support is particularly strong in Sweden (89%, of whom 39% ‘totally agree’), Denmark (86%), Cyprus (86%) and Slovakia (81%). It is less widespread, commanding a scant majority, in the Netherlands (52%).
In terms of evolutions, there has been a distinct fall in support in Greece, though it remains the majority view (70%, -12), and a significant rise in Slovakia (81%, +12) and Lithuania (69%, +11).
There is now majority support for the idea that growth should be a priority even if this affects the environment (Split A) in 16 Member States, compared with 14 in the autumn 2009 survey (EB72): Bulgaria, Belgium, the Czech Republic, Ireland, Spain, France, Italy, Lithuania, Hungary, Malta, Poland, Portugal, Romania, Slovenia, Slovakia and the United Kingdom.
At least two-thirds of respondents agree in Hungary (69%), Ireland (68%), Italy (67%) and Portugal (66%). But what is most striking is the significant extent to which this idea has gained ground since the autumn 2009 survey (EB72) in Cyprus (+17 to 46%), Slovenia (+17 to 62%), Finland (+16 to 44%), Portugal (+14 to 66%), Italy (+14 to 67%), France (+12 to 53%), Poland (+11 to 64%) and the United Kingdom (+11 to 61%).

STANDARD EUROBAROMETER 77 VALUES OF EUROPEANS – SPRING 2012
36
However, this view is clearly the minority view in the Netherlands (29%), Germany (34%), and Austria (37%).
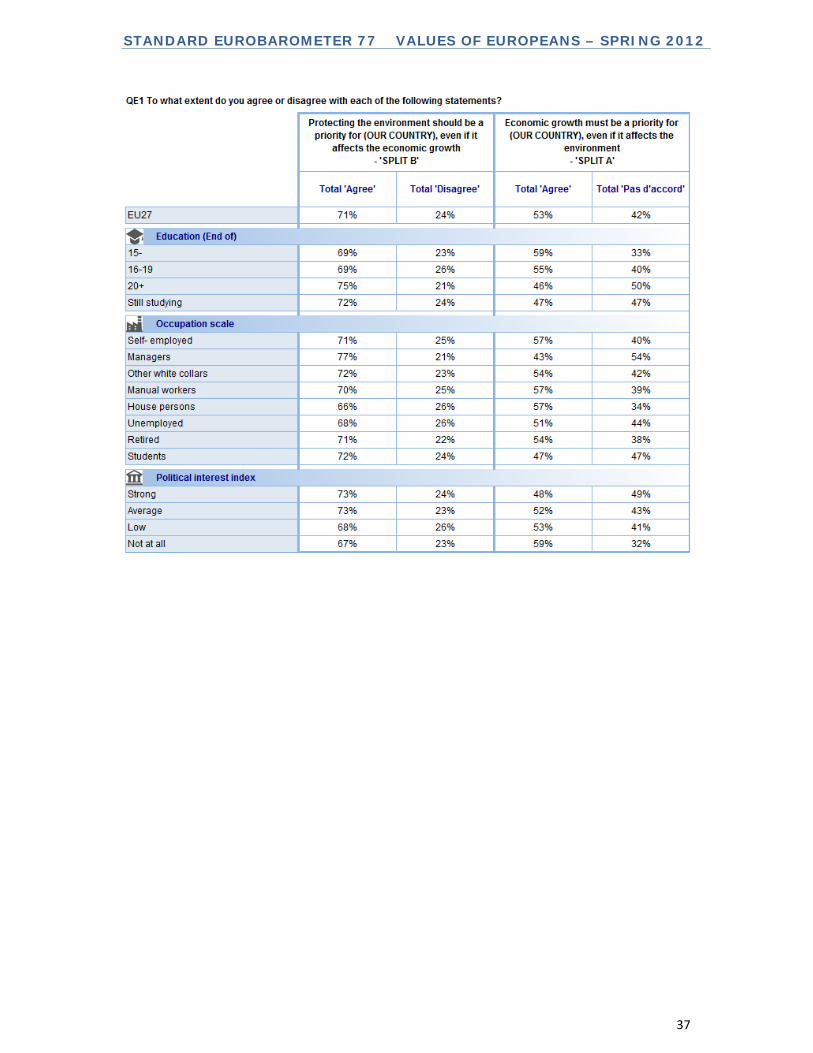
The socio-demographic analysis demonstrates that a clear majority of respondents support prioritising the environment even if that has an impact on growth (Split B) in all categories, with relatively small differences between them. Conversely, the suggestion that growth should take priority even if this affects the environment (Split A) leads to more pronounced divisions:
Support is strong among the least educated Europeans (59%) while it is the minority position among those who remained in education until the age of 20 and beyond (46%).
There is also firm support among the self-employed (57%), white-collar workers (54%) and manual workers (57%), but only a minority of managers agree (43%).
Finally, this idea is more attractive to the Europeans who are not at all interested in politics (59%) than to those who say they are very interested (48%).
STANDARD EUROBAROMETER 77 VALUES OF EUROPEANS – SPRING 2012
37

STANDARD EUROBAROMETER 77 VALUES OF EUROPEANS – SPRING 2012
38
6. The importance of leisure
– An absolute and increasing majority of Europeans are opposed to giving more importance to leisure than to work –
The idea that “more importance should be given to leisure than to work” continues to attract only minority support among Europeans: 41% agree with this suggestion, while 54% disagree. Opposition has grown significantly since the EB69 survey of spring 2008 (+4 percentage points).
Support is a little stronger in the NMS12 countries (47%) than in the EU15 (40%), but it remains a minority in both cases. The difference between Euro Zone (40%) and non-Euro Zone countries (43%) is a little narrower.
The idea that leisure should be given more importance than work is the majority view in 10 Member States, compared with 16 in the EB69 survey of spring 2008: Estonia (63%), Slovakia (62%), Finland (61%), Malta (56%), Slovenia (56%), Austria (55%), the Czech Republic (52%), Sweden (52%), Hungary (51%) and Ireland (46%). The six Member States which have seen a change of majority since the EB69 survey - and where a majority of respondents now disagree with the statement - are Romania (45% agree, while 46% disagree), Cyprus (44%, vs. 52%), Spain (41%, vs. 51%), Greece (41%, vs. 55%), the United Kingdom (39%, vs. 57%) and Denmark (37%, vs. 59% ).
Respondents are most likely to reject this idea in the Netherlands (68%), Lithuania (63%), Germany (62%) and France (61%).

STANDARD EUROBAROMETER 77 VALUES OF EUROPEANS – SPRING 2012
39
But the most striking aspect is the very significant extent to which opposition to this statement has gained ground since the spring 2008 survey (EB69) in Greece (+25 to 55%), Spain (+20 to 51%), Cyprus (+15 to 52%), Ireland (+15 to 42%), the United Kingdom (+14 to 57%) and Denmark (+14 to 59%).

STANDARD EUROBAROMETER 77 VALUES OF EUROPEANS – SPRING 2012
40
Evolution EB77 spring 2012 / EB69 spring 2008

STANDARD EUROBAROMETER 77 VALUES OF EUROPEANS – SPRING 2012
41
The analysis by socio-demographic criteria reveals some nuances in these responses: A narrow majority of respondents aged 15-24 support the idea of giving more
importance to leisure (48%, while 47% disagree), whereas Europeans aged 55+ are decisively opposed to it (32% agree, 62% disagree).
Though it is still the minority position, support is stronger among the most educated Europeans (43%) than among those whose education ended before the age of 16 (34%).
And while once again only a minority agree, support is a little more widespread among white-collar workers (49%) than manual workers (46%) and managers (43%).
STANDARD EUROBAROMETER 77 VALUES OF EUROPEANS – SPRING 2012
TECHNICAL SPECIFICATIONS Between the 12th and the 27th of May 2012, TNS Opinion & Social, a consortium created between TNS plc and TNS opinion, carried out the wave 77.3 of the EUROBAROMETER, on request of the EUROPEAN COMMISSION, Directorate-General for Communication, “Research and Speechwriting”. This wave is the STANDARD EUROBAROMETER 77 and covers the population of the respective nationalities of the European Union Member States, resident in each of the Member States and aged 15 years and over. The STANDARD EUROBAROMETER 77 has also been conducted in the six candidate countries (Croatia, Turkey, the Former Yugoslav Republic of Macedonia, Iceland, Montenegro and Serbia) and in the Turkish Cypriot Community. In these countries, the survey covers the national population of citizens and the population of citizens of all the European Union Member States that are residents in these countries and have a sufficient command of the national languages to answer the questionnaire. The basic sample design applied in all states is a multi-stage, random (probability) one. In each country, a number of sampling points was drawn with probability proportional to population size (for a total coverage of the country) and to population density.
In order to do so, the sampling points were drawn systematically from each of the "administrative regional units", after stratification by individual unit and type of area. They thus represent the whole territory of the countries surveyed according to the EUROSTAT NUTS II (or equivalent) and according to the distribution of the resident population of the respective nationalities in terms of metropolitan, urban and rural areas. In each of the selected sampling points, a starting address was drawn, at random. Further addresses (every Nth address) were selected by standard "random route" procedures, from the initial address. In each household, the respondent was drawn, at random (following the "closest birthday rule"). All interviews were conducted face-to-face in people's homes and in the appropriate national language. As far as the data capture is concerned, CAPI (Computer Assisted Personal Interview) was used in those countries where this technique was available. For each country a comparison between the sample and the universe was carried out. The Universe description was derived from Eurostat population data or from national statistics offices. For all countries surveyed, a national weighting procedure, using marginal and intercellular weighting, was carried out based on this Universe description. In all countries, gender, age, region and size of locality were introduced in the iteration procedure. For international weighting (i.e. EU averages), TNS Opinion & Social applies the official population figures as provided by EUROSTAT or national statistic offices. The total population figures for input in this post-weighting procedure are listed above.
TS1
STANDARD EUROBAROMETER 77 VALUES OF EUROPEANS – SPRING 2012
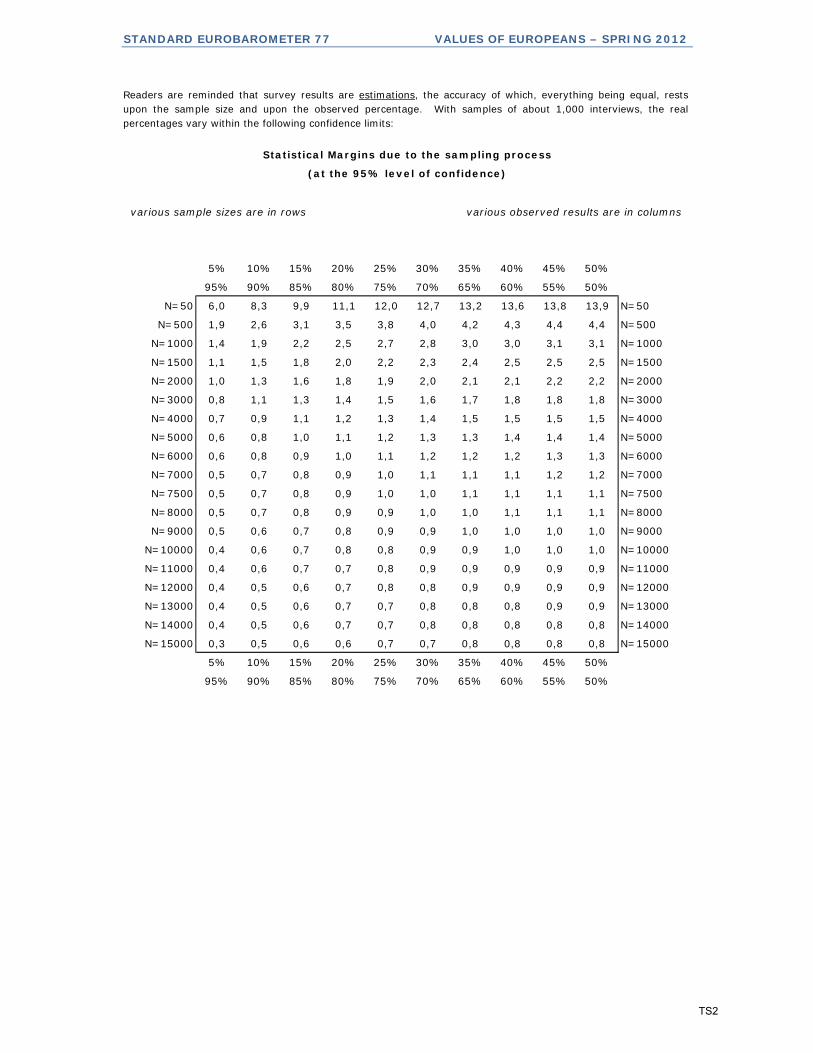
Readers are reminded that survey results are estimations, the accuracy of which, everything being equal, rests upon the sample size and upon the observed percentage. With samples of about 1,000 interviews, the real percentages vary within the following confidence limits:
various sample sizes are in rows various observed results are in columns
5% 10% 15% 20% 25% 30% 35% 40% 45% 50%
95% 90% 85% 80% 75% 70% 65% 60% 55% 50%
N=50 6,0 8,3 9,9 11,1 12,0 12,7 13,2 13,6 13,8 13,9 N=50
N=500 1,9 2,6 3,1 3,5 3,8 4,0 4,2 4,3 4,4 4,4 N=500
N=1000 1,4 1,9 2,2 2,5 2,7 2,8 3,0 3,0 3,1 3,1 N=1000
N=1500 1,1 1,5 1,8 2,0 2,2 2,3 2,4 2,5 2,5 2,5 N=1500
N=2000 1,0 1,3 1,6 1,8 1,9 2,0 2,1 2,1 2,2 2,2 N=2000
N=3000 0,8 1,1 1,3 1,4 1,5 1,6 1,7 1,8 1,8 1,8 N=3000
N=4000 0,7 0,9 1,1 1,2 1,3 1,4 1,5 1,5 1,5 1,5 N=4000
N=5000 0,6 0,8 1,0 1,1 1,2 1,3 1,3 1,4 1,4 1,4 N=5000
N=6000 0,6 0,8 0,9 1,0 1,1 1,2 1,2 1,2 1,3 1,3 N=6000
N=7000 0,5 0,7 0,8 0,9 1,0 1,1 1,1 1,1 1,2 1,2 N=7000
N=7500 0,5 0,7 0,8 0,9 1,0 1,0 1,1 1,1 1,1 1,1 N=7500
N=8000 0,5 0,7 0,8 0,9 0,9 1,0 1,0 1,1 1,1 1,1 N=8000
N=9000 0,5 0,6 0,7 0,8 0,9 0,9 1,0 1,0 1,0 1,0 N=9000
N=10000 0,4 0,6 0,7 0,8 0,8 0,9 0,9 1,0 1,0 1,0 N=10000
N=11000 0,4 0,6 0,7 0,7 0,8 0,9 0,9 0,9 0,9 0,9 N=11000
N=12000 0,4 0,5 0,6 0,7 0,8 0,8 0,9 0,9 0,9 0,9 N=12000
N=13000 0,4 0,5 0,6 0,7 0,7 0,8 0,8 0,8 0,9 0,9 N=13000
N=14000 0,4 0,5 0,6 0,7 0,7 0,8 0,8 0,8 0,8 0,8 N=14000
N=15000 0,3 0,5 0,6 0,6 0,7 0,7 0,8 0,8 0,8 0,8 N=15000
5% 10% 15% 20% 25% 30% 35% 40% 45% 50%
95% 90% 85% 80% 75% 70% 65% 60% 55% 50%
Statistical Margins due to the sampling process
(at the 95% level of confidence)
TS2
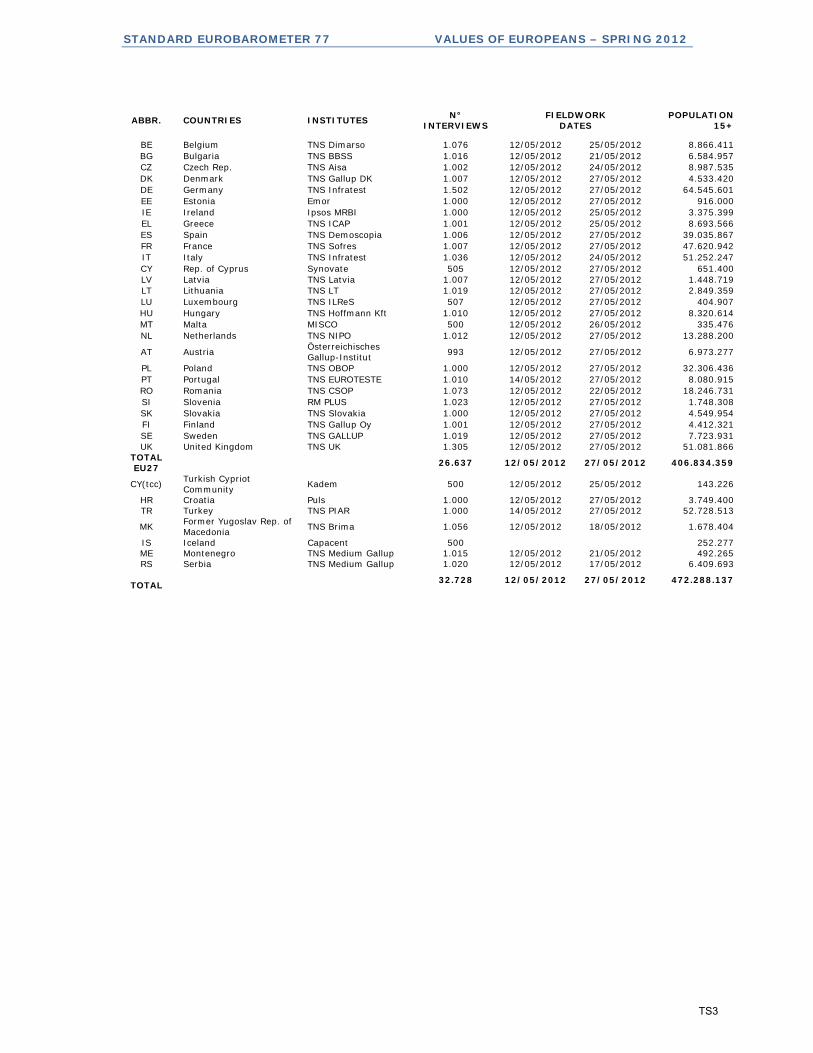
STANDARD EUROBAROMETER 77 VALUES OF EUROPEANS – SPRING 2012
ABBR. COUNTRIES INSTITUTES N° INTERVIEWS
FIELDWORK DATES
POPULATION 15+
BE Belgium TNS Dimarso 1.076 12/05/2012 25/05/2012 8.866.411 BG Bulgaria TNS BBSS 1.016 12/05/2012 21/05/2012 6.584.957 CZ Czech Rep. TNS Aisa 1.002 12/05/2012 24/05/2012 8.987.535 DK Denmark TNS Gallup DK 1.007 12/05/2012 27/05/2012 4.533.420 DE Germany TNS Infratest 1.502 12/05/2012 27/05/2012 64.545.601 EE Estonia Emor 1.000 12/05/2012 27/05/2012 916.000 IE Ireland Ipsos MRBI 1.000 12/05/2012 25/05/2012 3.375.399 EL Greece TNS ICAP 1.001 12/05/2012 25/05/2012 8.693.566 ES Spain TNS Demoscopia 1.006 12/05/2012 27/05/2012 39.035.867 FR France TNS Sofres 1.007 12/05/2012 27/05/2012 47.620.942 IT Italy TNS Infratest 1.036 12/05/2012 24/05/2012 51.252.247 CY Rep. of Cyprus Synovate 505 12/05/2012 27/05/2012 651.400 LV Latvia TNS Latvia 1.007 12/05/2012 27/05/2012 1.448.719 LT Lithuania TNS LT 1.019 12/05/2012 27/05/2012 2.849.359 LU Luxembourg TNS ILReS 507 12/05/2012 27/05/2012 404.907 HU Hungary TNS Hoffmann Kft 1.010 12/05/2012 27/05/2012 8.320.614 MT Malta MISCO 500 12/05/2012 26/05/2012 335.476 NL Netherlands TNS NIPO 1.012 12/05/2012 27/05/2012 13.288.200
AT Austria Österreichisches Gallup-Institut 993 12/05/2012 27/05/2012 6.973.277
PL Poland TNS OBOP 1.000 12/05/2012 27/05/2012 32.306.436 PT Portugal TNS EUROTESTE 1.010 14/05/2012 27/05/2012 8.080.915 RO Romania TNS CSOP 1.073 12/05/2012 22/05/2012 18.246.731 SI Slovenia RM PLUS 1.023 12/05/2012 27/05/2012 1.748.308 SK Slovakia TNS Slovakia 1.000 12/05/2012 27/05/2012 4.549.954 FI Finland TNS Gallup Oy 1.001 12/05/2012 27/05/2012 4.412.321 SE Sweden TNS GALLUP 1.019 12/05/2012 27/05/2012 7.723.931 UK United Kingdom TNS UK 1.305 12/05/2012 27/05/2012 51.081.866
TOTAL EU27 26.637 12/05/2012 27/05/2012 406.834.359
CY(tcc) Turkish Cypriot Community Kadem 500 12/05/2012 25/05/2012 143.226
HR Croatia Puls 1.000 12/05/2012 27/05/2012 3.749.400 TR Turkey TNS PIAR 1.000 14/05/2012 27/05/2012 52.728.513
MK Former Yugoslav Rep. of Macedonia TNS Brima 1.056 12/05/2012 18/05/2012 1.678.404
IS Iceland Capacent 500 252.277 ME Montenegro TNS Medium Gallup 1.015 12/05/2012 21/05/2012 492.265 RS Serbia TNS Medium Gallup 1.020 12/05/2012 17/05/2012 6.409.693
TOTAL 32.728 12/05/2012 27/05/2012 472.288.137
TS3