
The Utility MACT - mcilvainecompany.com · The Utility MACT How Did EPA Arrive ... Indiantown...
21
The Utility MACT How Did EPA Arrive at the Floors/Limits for Existing Sources and Can We Expect Changes October 4, 2011 Presented by Kasi Dubbs Trinity Consultants [email protected] trinityconsultants.com
Transcript of The Utility MACT - mcilvainecompany.com · The Utility MACT How Did EPA Arrive ... Indiantown...

The Utility MACT How Did EPA Arrive at the Floors/Limits for
Existing Sources and Can We Expect Changes
October 4, 2011
Presented by
Kasi Dubbs
Trinity Consultants
trinityconsultants.com

CAA on MACT Emission Limits
Floors - 112(d)(3) Existing: The MACT standards can be no less stringent
than the average emission limitation achieved by the best
12 percent of existing sources for which the administrator
has emissions information (if >30 sources) or by the best 5
percent of existing sources for which the administrator has
emissions information (if <30 sources)
New: The MACT standards can be no less stringent than
the best controlled similar source
EPA can consider alternatives to floors Beyond the floor
Work practices
Health thresholds

Overview of Floor Development –
Existing Sources
1. Develop a “pool” of EGUs representing
the top 12% (i.e. the “top performers”)
2. Average the emissions for the top
performers
3. Address variability
4. Set the floor
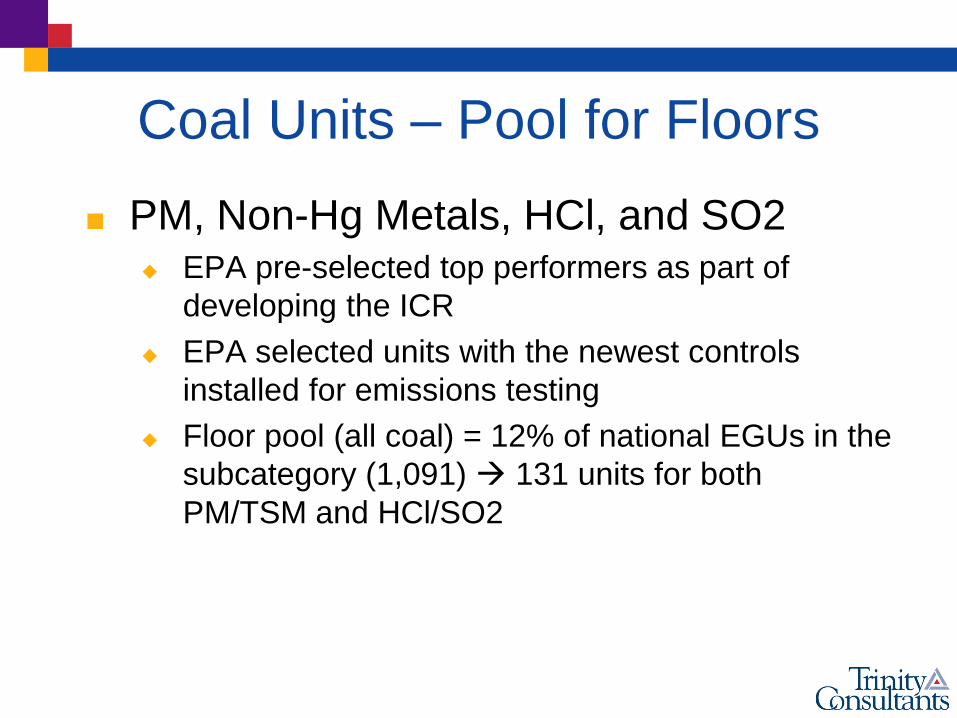
Coal Units – Pool for Floors
PM, Non-Hg Metals, HCl, and SO2
EPA pre-selected top performers as part of
developing the ICR
EPA selected units with the newest controls
installed for emissions testing
Floor pool (all coal) = 12% of national EGUs in the
subcategory (1,091) 131 units for both
PM/TSM and HCl/SO2

Coal Units – Pool for Floors
Hg
EPA did not pre-select units as part of the ICR
(i.e. random)
Coal >8,300 Btu/lb = 12% of all units >8,300
Btu/lb represented by the ICR (330) 40 units
Coal <8,300 Btu/lb
Less than 30 sources, so floor must be based on top 5
sources for which EPA has data
EPA used 2 units since the top 12% of all test runs
belonged to two units

Floors – Existing Coal Units
Averaged data for EGUs in the pool
Used the single test run with the lowest average emissions
for each unit in pool (except for coal <8,300 Btu/lb, EPA
averaged 11 test runs* for the 2 units in the pool)
Addressed statistical variability as 99% UPL based
on normal/lognormal distribution (Central Limit
Theorem???)
PM and TSM – Used only the single test runs used to
calculate the mean
HCl and Hg – used all runs for EGUs in the pool (HCl =
171 tests from 131 units; Hg = 80 tests from 40 units)
*FR 25045 says EPA used 11 data points, but a review of the spreadsheet shows only 5 data points

Floors – Existing Coal Units
PM and Non-Hg Metals
From EPA Spreadsheet: http://www.epa.gov/ttn/atw/utility/utilitypg.html: floor_analysis_coal_pm_031611.xlsx
Pollutant
Mean
(lb/MMBtu)
UPL
(lb/MMBtu)
Number of
units in the
floor
UPL
(lb/Tbtu)Floor value
PM total 0.0116 0.0264 131 0.03 lb/MMBtu
Metal total 0.0000142 0.0000376 131 0.00004 lb/MMBtu
Antimony (Sb) 2.0981E-07 5.4934E-07 131 0.549338529 0.6 lb/TBtu
Arsenic (As) 4.1029E-07 1.0816E-06 131 1.081629882 2.0 lb/TBtu
Beryllium (Be) 4.8952E-08 1.3337E-07 131 0.133372821 0.2 lb/TBtu
Cadmium (Cd) 9.8523E-08 2.1212E-07 131 0.212120593 0.3 lb/TBtu
Chromium (Cr) 1.2160E-06 2.8157E-06 131 2.815717862 3 lb/TBtu
Cobalt 2.8224E-07 7.1184E-07 131 0.711841054 0.8 lb/TBtu
Lead (Pb) 5.3617E-07 1.2792E-06 131 1.279165372 2 lb/TBtu
Manganese (Mn) 1.6846E-06 4.1963E-06 131 4.196344044 5 lb/TBtu
Nickel (Ni) 1.4138E-06 3.3913E-06 131 3.391265314 4 lb/TBtu
Selenium (Se) 1.6204E-06 5.5311E-06 131 5.531080708 6 lb/TBtu

Floors – Existing Coal Units
Pool for PM/TSM (top 20/131)
Plant Unit
Ranked Emissions
(lb/MMBtu) Plant Unit
Ranked Emissions
(lb/MMBtu)
Bonanza Power Plant 1-1 8.6037E-06 Chambers Cogeneration LP Boil 2 1.32711E-06
Dunkirk Generating Plant 1 2.8211E-03 Weston W4 1.50078E-06
Martin Drake Unit 5 - Coal 3.0755E-03 Rawhide Rawhide101 1.51459E-06
Bridgeport Station BHSEMU3OS3-#2 3.2963E-03 Logan Generating Plant Unit1 1.63523E-06
Roxboro Steam Electric Plant Rox_Cfg_2c 3.4217E-03 Northampton Generating Company, L.P. GEN1 1.81939E-06
Springerville 4 3.7344E-03 Wygen 1 WYG1Cfg 2.02798E-06
Havana Boiler 9 3.8254E-03 AES Shady Point,LLC Unit 1 2.09913E-06
Dunkirk Generating Plant 4 3.8498E-03 AES Shady Point,LLC Unit 2 2.09913E-06
J K Spruce 1 3.8651E-03 Havana Boiler 9 2.14923E-06
Reid Gardner 1 4.3292E-03 Martin Drake Unit 5 - Coal 2.20757E-06
San Juan Unit 3 4.3628E-03 Reid Gardner 1 2.32771E-06
Roxboro Steam Electric Plant Rox_Cfg_1b 4.9481E-03 Neil Simpson II NS2Cfg 2.68727E-06
Dallman 34 5.0000E-03 Cedar Bay Generating Company L.P. CBA1 2.94244E-06
Walter Scott Jr. Energy Center 4 5.0613E-03 Cedar Bay Generating Company L.P. CBB1 3.43571E-06
Weston W4 5.2819E-03 TransAlta Centralia Generation BW21CONFIG 3.44699E-06
Clover Unit 2 5.3145E-03 R D Green 2 3.62895E-06
Gerald Gentleman U1 5.4900E-03 J K Spruce 1 3.72133E-06
AES Hawaii 001 5.7893E-03 AES Warrior Run Cogeneration Facility BLR1 3.94935E-06
Crist Unit 4 5.8071E-03 Chambers Cogeneration LP Boil 1 3.98947E-06
Crist Unit 5 5.8071E-03 TransAlta Centralia Generation BW22CONFIG 4.19508E-06
PM TSM
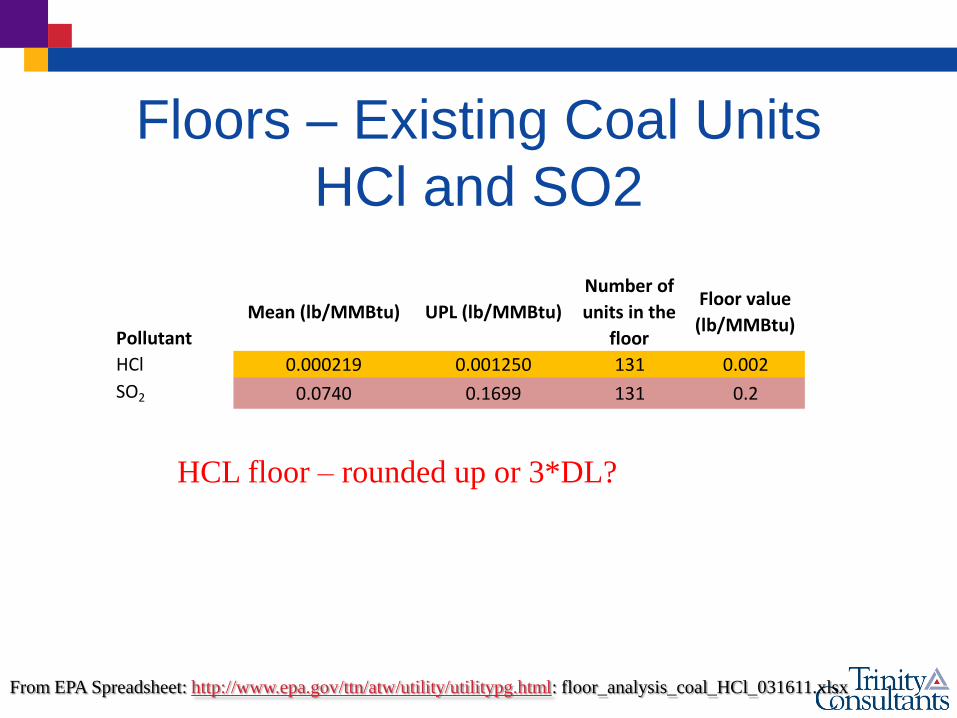
Floors – Existing Coal Units
HCl and SO2
From EPA Spreadsheet: http://www.epa.gov/ttn/atw/utility/utilitypg.html: floor_analysis_coal_HCl_031611.xlsx
Pollutant
Mean (lb/MMBtu) UPL (lb/MMBtu)
Number of
units in the
floor
Floor value
(lb/MMBtu)
HCl 0.000219 0.001250 131 0.002
SO2 0.0740 0.1699 131 0.2
HCL floor – rounded up or 3*DL?

Floors – Existing Coal Units
Pool for HCl/SO2 (top 20/131) Plant Unit
Ranked Emissions
(lb/MMBtu) Plant Unit
Ranked Emissions
(lb/MMBtu)
Logan Generating Plant Unit1 1.28728E-05 Stanton u10 0.007393938
Spruance Genco, LLC GEN3 1.61176E-05 Port of Stockton District Energy Facility 1 0.008
Spruance Genco, LLC GEN2 1.6933E-05 Coffeen 001 0.008466667
Seward SEW-1 1.92667E-05 AES Puerto Rico Cogeneration Facility Unit_2 0.00871
Seward SEW-2 1.92667E-05 Elm Road Generating Station ERGS-B1 0.009
Sandow Station 5A 2.11859E-05 AES Puerto Rico Cogeneration Facility Unit_1 0.009
TS Power Plant TSPower 2.17094E-05 Sandow Station 5A 0.011155326
Sandow Station 5B 2.55238E-05 Boswell Energy Center BEC3 0.011666667
Holcomb SGU1 0.000026 TransAlta Centralia Generation BW21CONFIG 0.0213
Roanoke Valley II Boiler 2 3.21748E-05 Spruance Genco, LLC GEN3 0.0227
Indiantown Cogeneration L.P. 001 3.57665E-05 Hopewell 1 & 2 0.023157477
Rawhide Rawhide101 3.6081E-05 Rio Bravo Jasmin Config 1 0.0232
Walter Scott Jr. Energy Center 4 0.000038 TransAlta Centralia Generation BW22CONFIG 0.023333333
Spruance Genco, LLC GEN4 3.84204E-05 Spruance Genco, LLC GEN2 0.0241
Chambers Cogeneration LP Boil 1 4.23995E-05 Rio Bravo Poso Config 1 0.0245
Navajo Generating Station 001 0.00005 Crist Unit 7 0.025
Chambers Cogeneration LP Boil 2 5.60089E-05 Crist Unit 6 0.025
Colstrip Unit3 6.2094E-05 Crist Unit 4 0.025
Navajo Generating Station 002 6.66667E-05 Crist Unit 5 0.025
Cross C3 6.89398E-05 Edgecombe Genco, LLC Gen 1 0.0278
HCl SO2
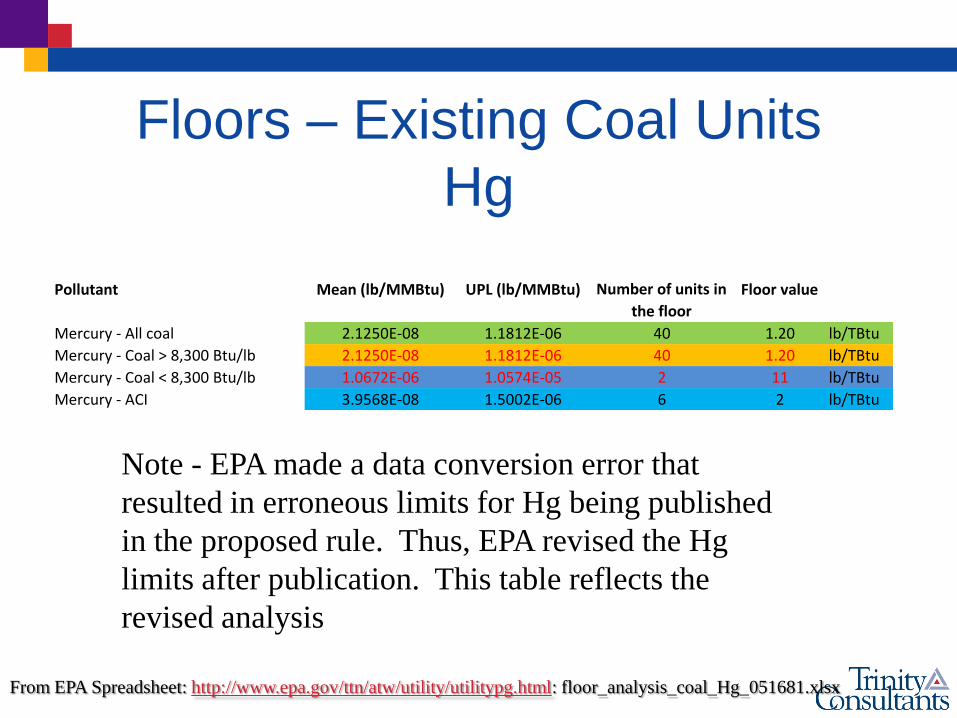
Floors – Existing Coal Units
Hg
Pollutant Mean (lb/MMBtu) UPL (lb/MMBtu) Number of units in
the floor
Floor value
Mercury - All coal 2.1250E-08 1.1812E-06 40 1.20 lb/TBtu
Mercury - Coal > 8,300 Btu/lb 2.1250E-08 1.1812E-06 40 1.20 lb/TBtu
Mercury - Coal < 8,300 Btu/lb 1.0672E-06 1.0574E-05 2 11 lb/TBtu
Mercury - ACI 3.9568E-08 1.5002E-06 6 2 lb/TBtu
From EPA Spreadsheet: http://www.epa.gov/ttn/atw/utility/utilitypg.html: floor_analysis_coal_Hg_051681.xlsx
Note - EPA made a data conversion error that
resulted in erroneous limits for Hg being published
in the proposed rule. Thus, EPA revised the Hg
limits after publication. This table reflects the
revised analysis

Floors – Existing Coal Units >8,300
Pool for Hg (top 20/40)
Plant Unit
Ranked
Emissions
(lb/MMBtu)
Spruance Genco, LLC GEN2 2.6333E-09
Spruance Genco, LLC GEN3 4.6900E-09
Nucla 001 5.3333E-09
Logan Generating Plant Unit1 5.3333E-09
Seward SEW-1 6.3500E-09
AES Greenidge Unit 4 6.4602E-09
Roanoke Valley I Boiler 1 7.2633E-09
AES Westover, LLC 8 8.1456E-09
Indiantown Cogeneration, L.P. 001 8.5384E-09
Northampton Generating Company, L.P. GEN1 1.0397E-08
Roanoke Valley II Boiler 2 1.0760E-08
AES Hawaii 001 1.1711E-08
Spruance Genco, LLC GEN4 1.1770E-08
Ebensburg Power Company EPC01 1.2483E-08
AES Hawaii 002 1.2994E-08
Colver Power Project AAB01 1.4594E-08
Birchwood Power Facility 1A 1.5476E-08
Cedar Bay Generating Company L.P. CBB1 1.9031E-08
Valley VAPP-B1 1.9300E-08
Chambers Cogeneration LP Boil 1 1.9307E-08
Hg
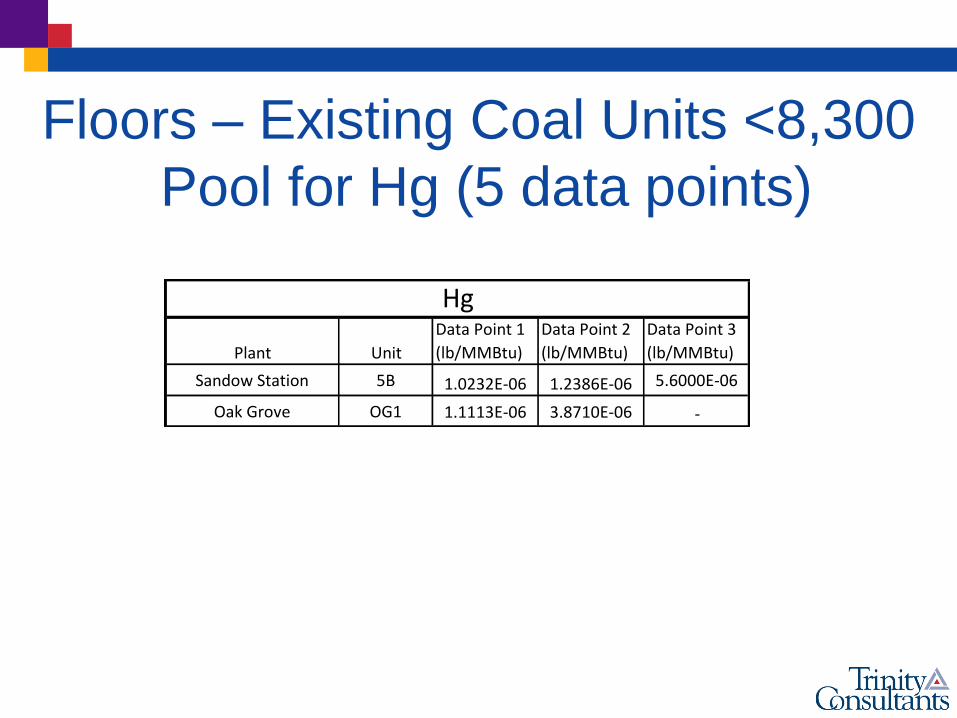
Floors – Existing Coal Units <8,300
Pool for Hg (5 data points)
Plant Unit
Data Point 1
(lb/MMBtu)
Data Point 2
(lb/MMBtu)
Data Point 3
(lb/MMBtu)
Sandow Station 5B 1.0232E-06 1.2386E-06 5.6000E-06
Oak Grove OG1 1.1113E-06 3.8710E-06 -
Hg
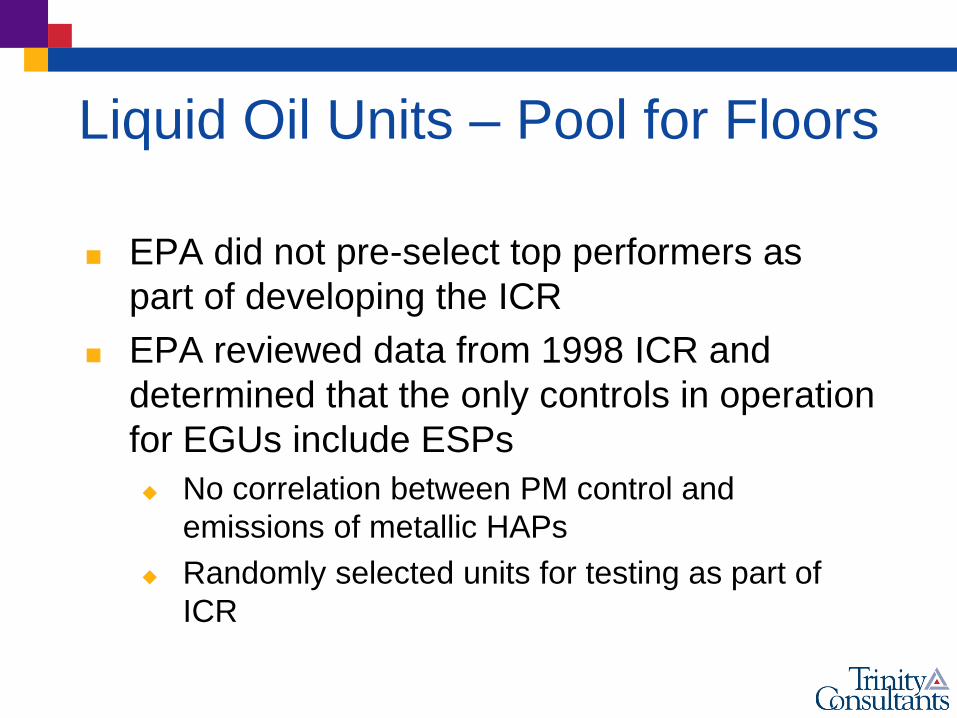
Liquid Oil Units – Pool for Floors
EPA did not pre-select top performers as
part of developing the ICR
EPA reviewed data from 1998 ICR and
determined that the only controls in operation
for EGUs include ESPs
No correlation between PM control and
emissions of metallic HAPs
Randomly selected units for testing as part of
ICR
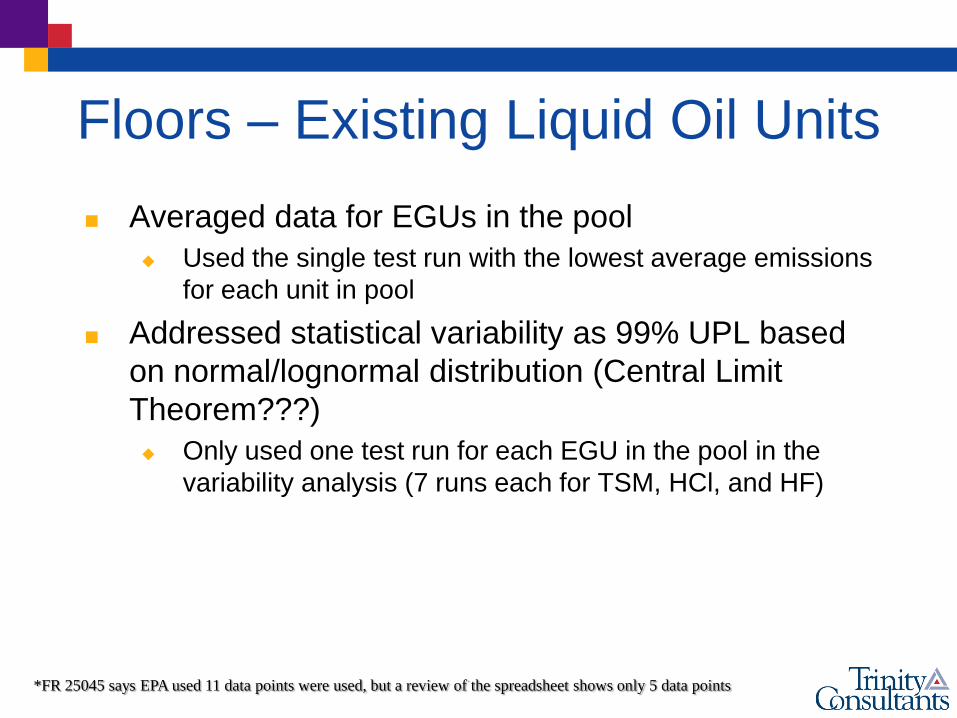
Floors – Existing Liquid Oil Units
Averaged data for EGUs in the pool
Used the single test run with the lowest average emissions
for each unit in pool
Addressed statistical variability as 99% UPL based
on normal/lognormal distribution (Central Limit
Theorem???)
Only used one test run for each EGU in the pool in the
variability analysis (7 runs each for TSM, HCl, and HF)
*FR 25045 says EPA used 11 data points were used, but a review of the spreadsheet shows only 5 data points
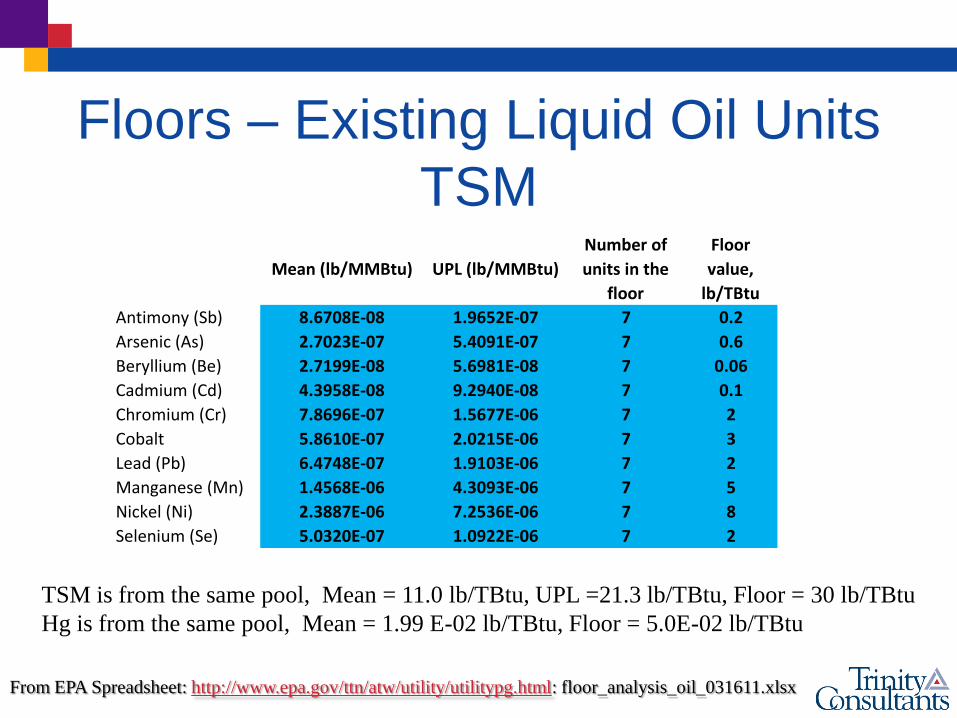
Floors – Existing Liquid Oil Units
TSM
Mean (lb/MMBtu) UPL (lb/MMBtu)
Number of
units in the
floor
Floor
value,
lb/TBtu
Antimony (Sb) 8.6708E-08 1.9652E-07 7 0.2
Arsenic (As) 2.7023E-07 5.4091E-07 7 0.6
Beryllium (Be) 2.7199E-08 5.6981E-08 7 0.06
Cadmium (Cd) 4.3958E-08 9.2940E-08 7 0.1
Chromium (Cr) 7.8696E-07 1.5677E-06 7 2
Cobalt 5.8610E-07 2.0215E-06 7 3
Lead (Pb) 6.4748E-07 1.9103E-06 7 2
Manganese (Mn) 1.4568E-06 4.3093E-06 7 5
Nickel (Ni) 2.3887E-06 7.2536E-06 7 8
Selenium (Se) 5.0320E-07 1.0922E-06 7 2
From EPA Spreadsheet: http://www.epa.gov/ttn/atw/utility/utilitypg.html: floor_analysis_oil_031611.xlsx
TSM is from the same pool, Mean = 11.0 lb/TBtu, UPL =21.3 lb/TBtu, Floor = 30 lb/TBtu
Hg is from the same pool, Mean = 1.99 E-02 lb/TBtu, Floor = 5.0E-02 lb/TBtu
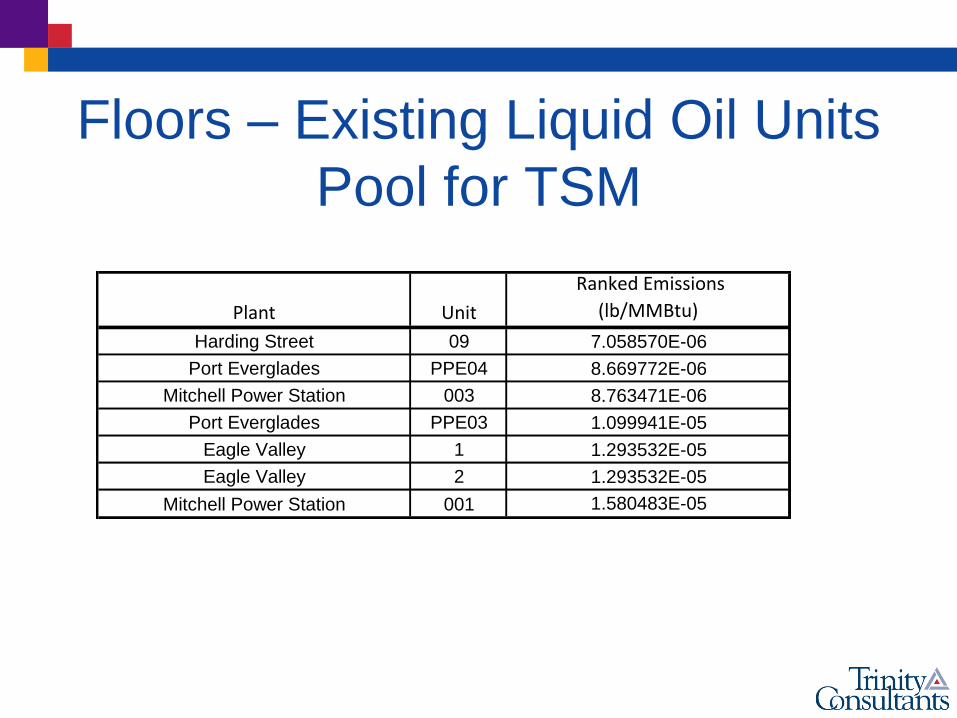
Floors – Existing Liquid Oil Units
Pool for TSM
Plant Unit
Ranked Emissions
(lb/MMBtu)
Harding Street 09 7.058570E-06
Port Everglades PPE04 8.669772E-06
Mitchell Power Station 003 8.763471E-06
Port Everglades PPE03 1.099941E-05
Eagle Valley 1 1.293532E-05
Eagle Valley 2 1.293532E-05
Mitchell Power Station 001 1.580483E-05

Floors – Existing Liquid Oil Units
HCl and HF No EPA summary table similar to others shown
HCl
Mean = 9.25 E-05 lb/MMBtu
UPL = 2.2956 E-04 lb/MMBtu
Number of units in the floor = 7
Floor value = 3.0 E-04 lb/MMBtu
HF
Mean = 6.17E-05 lb/MMBtu
UPL = 1.576 E-4 lb/MMBtu
Number of units in the floor = 7
Floor value 2.0E-04lb/MMBtu

Floors – Existing Liquid Oil Units
Pools for HCl and HF
Plant Unit
Ranked Emissions
(lb/MMBtu) Plant Unit
Ranked
Emissions
(lb/MMBtu)
East River 60 1.0200E-05 East River 60 1.0500E-05
Eagle Valley 1 9.3457E-05 Suwannee River Plant Suw_Cfg_1 4.5011E-05
Eagle Valley 2 9.3457E-05 C D McIntosh Jr Unit 2 5.7150E-05
Harding Street 09 9.5896E-05 BL England 3 5.9031E-05
Kahe K1 9.6790E-05 Manatee PMT01 8.1140E-05
Harding Street 10 1.1276E-04 Northside Generating Station 3 8.5359E-05
Waiau W7 1.4510E-04 Suwannee River Plant Suw_Cfg_2 9.3639E-05
HCl HF
Emission Limits
Limits for existing units are in units of
lbs per electric output OR lbs per heat
input
Utilities can average emissions from all
existing EGUs

Questions?
For additional information:
Kasi Dubbs, P.E.
[email protected] (913) 894-4500
trinityconsultants.com