The USV Annals of Economics and Public …ISSUE_1(21),2015...Gabriela PRELIPCEAN, „Ştefan cel...
294
ISSN 2285–3332 www.annals.seap.usv.ro ISSN-L 2285–3332 On-line ISSN 2344-3847 Revistă ştiinţifică indexată în baze de date internaţionale The USV Annals of Economics and Public Administration VOLUME 15, ISSUE 1(21), 2015 Editura Universităţii “Ştefan cel Mare” din Suceava
Transcript of The USV Annals of Economics and Public …ISSUE_1(21),2015...Gabriela PRELIPCEAN, „Ştefan cel...

ISSN 2285–3332 www.annals.seap.usv.ro ISSN-L 2285–3332 On-line ISSN 2344-3847
Revistă ştiinţifică indexată în baze
de date internaţionale
The USV Annals
of Economics and
Public Administration
VOLUME 15, ISSUE 1(21), 2015
Editura Universităţii “Ştefan cel Mare” din Suceava

The USV Annals of Economics and Public Administration Volume 15, Issue 1(21), 2015
2
EDITORIAL BOARD:
Editor‐in‐chief: Carmen NĂSTASE Executive editor: Adrian Liviu SCUTARIU Editors: Elena HLACIUC, Carmen CHAŞOVSCHI, Florin BOGHEAN, Mariana LUPAN, Ovidiu Florin HURJUI, Simona BUTA SCIENTIFIC COMMITTEE:
Angela ALBU, „Ştefan cel Mare” University of Suceava, Romania Paolo ANDREI, University of Studies in Parma, Italy Stefano AZZALI, University of Studies in Parma, Italiy George P. BABU, University of Southern Mississippi, USA Christian BAUMGARTNER, International Friends of Nature, Austria Grigore BELOSTECINIC, ASEM, Chi şinău, Republic of Moldova Ionel BOSTAN, „Alexandru Ioan Cuza” University of Iaşi, Romania Aurel BURCIU, „Ştefan cel Mare” University of Suceava, Romania Gheorghe CÂRSTEA, Academy of Economic Studies, Bucharest , Romania Slobodan CEROVIC, Singidunum University, Belgrade, Serbia Simion CERTAN, State University of Chişinău, Republic of Moldova Carmen CHAŞOVSCHI, „Ştefan cel Mare” University of Suceava, Romania Liliana ELMAZI, Tirana University, Albania Manuela Rodica GOGONEA, Academy of Economic Studies, Bucuresti, Romania Cristian Valentin HAPENCIUC, „Ştefan cel Mare” University of Suceava, Romania Elena HLACIUC, „Ştefan cel Mare” University of Suceava, Romania Elena IFTIME, „Ştefan cel Mare” University of Suceava, Romania Marian JALENCU, State University of Chişinău, Republic of Moldova Miika KAJANUS, Savonia University of Applied Sciences, Iisalmi, Finland Alunica MORARIU, „Ştefan cel Mare” University of Suceava, Romania Maria MUREŞAN, Academy of Economic Studies, Bucuresti, Romania Carmen NĂSTASE, „Ştefan cel Mare” University of Suceava, Roman ia Alexandru NEDELEA, „Ştefan cel Mare” University of Suceava, Romania Ion PÂRŢACHI, ASEM, Chişinău, Republic of Moldova Rusalim PETRIŞ, „Ştefan cel Mare” University of Suceava, Romania Abraham PIZAM, University of Central Florida, Orlando, Florida Ion POHOAŢĂ, „Alexandru Ioan Cuza” University of Iaşi, Romania Gabriela PRELIPCEAN, „Ştefan cel Mare” University of Suceava, Romania
Gheorghe SANDU, „Ştefan cel Mare” University of Suceava, Romania
Petru SANDU, Elizabethtown College, Pennsylvania, USA Doru TILIUŢE, „Ştefan cel Mare” University of Suceava, Romania Viorel ŢURCANU, ASEM, Chişinău, Republic of Moldova Diego VARELA PEDREIRA, University of A Coruna, Spain Răzvan VIORESCU, „Ştefan cel Mare” University of Suceava, Romania Marian ZAHARIA, Petroleum‐Gas University of Ploiești, Romania Cover design & graphic layout: Adrian Liviu SCUTARIU Contact: Faculty of Economics and Public Administration „Ştefan cel Mare” University of Suceava Str. Universităţii nr. 13, Corp H, Birou H105, 720229 SUCEAVA, ROMANIA Phone: (+40) 230 216147 ext. 297 E-mail: [email protected] Journal web site: www.annals.seap.usv.ro Faculty web site: www.seap.usv.ro University web site: www.usv.ro
Întreaga răspundere asupra conţinutului articolelor publicate revine autorilor. The entire responsability for the content of the published articles rests with the authors.

The USV Annals
of Economics and
Public Administration
Volume 15,
Issue 1(21),
2015
3
CONTENTS
SECTION 1
ECONOMY, TRADE, SERVICES……………………………………………………………………………………………..6
THEECONOMICEFFECTSOFEMIGRATIONOFYOUNGHIGHLYEDUCATEDROMANIANS………………………………….7DorelAILENEILianaBADEACristinaDIMAPIGSCOUNTRIES’NEWCHALLENGESUNDEREUROPE2020STRATEGY…………………………………………………………20Victor‐RomeoIONESCUPRESSUREOFAGEINGONREGIONALDEVELOPMENT.CHALLENGESANDLIMITSFORTHELABOURMARKET.29SilviaPISICĂValentinaVASILEAnaMariaDOBREINFORMATIONANDKNOWLEDGEINAGLOBALCONTEXT……………………………………………………………………………39FlorinaBRANMaria‐LoredanaPOPESCUGENERALCONSIDERATIONSONINDUSTRIALPROPERTYRIGHTSANDTHEROLEOFPATENTADVISOR………41GabrielI.NĂSTASEBogdanPASCUCarmenGeorgianaV.BADEAREGIONALDEVELOPMENT:ROMANIA’SCASE………………………………………………………………………………………………49EmilianM.DOBRESCUDiana‐MihaelaPOCIOVĂLIȘTEANUSUSTAINABLEDEVELOPMENTOFROMANIANAGRICULTUREWITHINTHECONTEXTOFEUROPEANUNION’SREQUIREMENTS……………………………………………………………………………………………………………………………………………57CarmenValentinaRADULESCUIldikoIOANSUSTAINABLEECONOMICGROWTHANDECO‐EFFICIENCY……………………………………………………………………………63MarianaLUPANAngelaNicoletaCOZORICILOOKINGFOR(RE)DEFININGUNIVERSITYAUTONOMY…………………………………………………………………………………74AlaCOTELNICAngelaNICULITAPetruTODOSRomeoTURCANLarisaBUGAIANDanielaPOJARPRIORITIESINREGIONALDEVELOPMENTINROMANIA…………………………………………………………………………………91MihaiPOPESCUASPECTSOFREGIONALCOMPETITIVENESSTHROUGHDYNAMICPRICESOFPETROLEUMPRODUCTS……………99DanielaENACHESCUTHEILLUSIONOFCATCHINGUPTHESOCIO‐ECONOMICREGIONALGAPS……………………………………………………105EugenGHIORGHITALANDMARKSINTHEEVOLUTIONOFREGIONALSCIENCE……………………………………………………………………………114AdrianLiviuSCUTARIU

The USV Annals of Economics and Public Administration Volume 15, Issue 1(21), 2015
4
THE MODEL OF CROSS‐BORDER COOPERATION IN THE ROMANIAN‐BULGARIAN NEIGHBOURHOOD AREABETWEENDESIREANDREALIZATION………………………………………………………………………………………………………….120BogdanVasileILEANUDanielaLuminitaCONSTANTINClaudiuHERTELIUTudorelANDREIANALYSISOFROMANIANFISHERIESANDAQUACULTUREINREGIONALCONTEXT………………………………………127MihaelaNECULITALilianaMihaelaMOGACOMPETITIVENESS AND INNOVATION IN THE ROMANIAN REGIONS – HOWMUCH PROGRESS DURING THEPOST‐ACCESSIONPERIOD?…………………………………………………………………………………………………………………………133CarmenBeatricePAUNAMarioaraIORDANMihaela‐NonaCHILIANDEVELOPMENTOFCROSS‐BORDERAREAS.STUDYCASESREVIEW……………………………………………………………..142MarcelaȘLUSARCIUCTHEEUROPEANUNION“CHASING”APLURILATERALMARKETACCESSBYNEGOTIATINGTHETISA……………152LudmilaBORTASECTION 2
MANAGEMENT AND BUSINESS ADMINISTRATION…………………………………………………………………..159
CLOUD‐BASEDVSDESKTOP‐BASEDPROPERTYMANAGEMENTSYSTEMSINHOTEL……………………………………..160MustafaGULMEZEdinaAJANOVICIsmailKARAYUNLINKING HUMAN RESOURCES STRATEGY WITH KNOWLEDGE MANAGEMENT STRATEGY TO DRIVEMEASURABLERESULTS………………………………………………………………………………………………………………………………..169Otilia‐MariaBORDEIANUSimonaBUTAOPINIONSOFECONOMICENTITIESFROMBRAȘOVANDSUCEAVACOUNTIESREGARDINGTHEIMPORTANCEOFLEASESERVICESFORDEVELOPINGTHEBUSINESSENVIRONMENT……………………………………………………………..176OanaBĂRBULESCUCristianValentinHAPENCIUCAndrei‐AlexandruMOROȘANMihaiCOSTEAPHARMACEUTICAL COMPANIES BETWEEN CRISIS AND COMPETITIVENESS ‐ SECTORALDIAGNOSIS…………………………………………………………………………………………………………………………………………………189MihaelaBÎRSANŞtefăniţăŞUŞUATERRITORIALPROFILEOFPUBLICEXPENDITURESATLAU2LEVEL,FOR2007‐2013PERIODINROMANIA204CristinaLINCARUSperantaPIRCIOGVasilicaCIUCĂDragaATANASIUBeatriceCHIRIACIMPACTOFMARKETINGSTRATEGIESONSACHETPRODUCTSINBANGLADESH…………………………………………..214HossainShahidSHOHROWARDHYH.M.KamrulHASSAN

The USV Annals of Economics and Public Administration Volume 15, Issue 1(21), 2015
5
SECTION 3
ACCOUNTING - FINANCES………………………………………………………………………………………………………………223
ACCOUNTINGREPORTSANDBUDGETPROCESSINTHEROMANIANPUBLICSECTORBETWEENCONVERGENCEANDCHALLENGE…………………………………………………………………………………………………………………………………………224ElenaHLACIUCMarianSOCOLIUCGeaninaMACIUCAAntonelaURSACHIRECENTADAPTATIONSOFTHE LEGAL STANDARDSAPPLIEDTOTAX LIABILITIES THROUGHGOVERNMENTORDINANCES………………………………………………………………………………………………………………………………………………230IonelBOSTANECONOMIC MEASURES DESIGNED BY INTERNATIONAL FINANCIAL INSTITUTION IN ORDER TOMACROSTABILIZEANDTOAUGUMENTECONOMICRECOVERYPROCESS…………………………………………………….233AncaMariaPARASCHIVAlexandruPOTORACIoanaENACHESHOULD TAX COURSES BE REQUIRED FOR ALL ROMANIAN UNIVERSITIES’ BUSINESS STUDENTS? THE NEWFUTUREOFBUSINESSEDUCATION………………………………………………………………………………………………………………241KevinA.DIEHLTHEIMPACTOFTHEFOREIGNCAPITALBANKSONENSURINGFINANCIALSTABILITYONLONGTERM………..246IsacBORSSECTION 4
STATISTICS, ECONOMIC INFORMATICS AND MATHEMATICS………………………………………………254
TERTIARYEDUCATION:WHERETO?ANANALYSISATTHEREGIONALLEVELINROMANIA………………………….255MarianZAHARIAAnielaBĂLĂCESCUAdrianNEDELCUMASTER STUDENTS’ PERCEPTION ON THE CORRELATION BETWEEN ACADEMIC CURRICULA AND LABORMARKET REQUIREMENTS ‐ A COMPARATIVE ANALYSIS OF MASTER PROGRAMS IN ECONOMICS FROMBUCHARESTANDSIBIU……………………………………………………………………………………………………………………………….264ErikaMARINAlexandraHOROBETLucianBELASCUSECTION 5
LAW AND PUBLIC ADMINISTRATION……………………………………………………………………………………………270
ETHICSINPUBLICADMINISTRATION.CASESTUDY–ROMANIA…………………………………………………………………...271RăzvanVIORESCUGabrielaNEMŢOIFORECAST, ORGANIZATION‐COORDINATION AND MOTIVATION IN LOCAL PUBLIC ADMINISTRATIONMANAGEMENT……………………………………………………………………………………………………………….……………………………278PetronelaSCUTARIUPARADIGMSREGARDINGCONCERTEDPRACTICESOFCOMPETITIONPOLICY………………………………………………286GabrielaNEMŢOIRăzvanVIORESCUINSTRUCŢIUNI UTILE PENTRU AUTORI / AUTHOR GUIDELINES ............................................292

The USV Annals
of Economics and
Public Administration
Volume 15,
Issue 1(21),
2015
6
SECTION 1
ECONOMY, TRADE, SERVICES

The USV Annals
of Economics and
Public Administration
Volume 15,
Issue 1(21),
2015
7
THE ECONOMIC EFFECTS OF EMIGRATION OF YOUNG
HIGHLY EDUCATED ROMANIANS
ProfessorPh.D.DorelAILENEI
BucharestUniversityofEconomicStudies,[email protected]
AssociateProfessorPh.D.LianaBADEA
BucharestUniversityofEconomicStudies,[email protected]
AssistantProfessorPh.D.CristinaDIMA
UniversityPolitehnicaofBucharest,[email protected]
Abstract: Migration is one of the oldest phenomena that accompanied the development of human society, sometimes
causing clashes between peoples, cultures and civilizations. Recent events or from a not too distant past of Europe show that tensions created by migratory movements often have an impact on political and economic relations between countries, cultures and religions.
The Romanian reality shows that after 1989 the resident population experienced a decline. According to the National Institute of Statistics, in the period 1989-2012, Romania's population decreased by about 3.1 million, this reduction being due to both migration phenomenon and negative natural increase of population. Some statistic records also show that the extremes are usually among those who decide to emigrate. On the one hand those who are choosing this path are individuals with low income and a low or medium level of education; on the other hand, we can find the phenomenon of brain drain. It is alarming that among those who choose to emigrate are registered young people able to work, this generating the problem of funding on medium and long term the social services.
Starting from such aspects, this paper aims to highlight key issues regarding the intention of emigration of highly educated young people. Using quantitative and qualitative methods the authors of this paper aim to identify some possible causes that may determine the highly educated youth to emigrate, evaluate some possible effects due to this phenomenon and to find proposals to limit the negative effects of demographic decline.
Key words: migration, demographic decline, labor market, social assistance, brain drain. JEL classification: J69, R10.
1. LITERATURE REVIEW ABOUT MIGRATION
Migration phenomenon has existed for a long time, and history is the witness. From the
theoretical standpoint, the issue of migration has been widely debated, however, it can not be asserted that the last word has been said about it. The field is complex, with economic, social, political, demographic and even psychological implications. As the researcher Joaquin Arango said, it appears that the extend of the phenomenon in the last two centuries has led to new research: ”Building of theories in this field is basically an issue of the ‘20th century and especially its last third part. The most contributions before 1960s are now only for historical interest, exception for a number of contributions to migration vocabulary and a special significance of a few notable precursors” (Constantinescu, 2002, p.94).
However, current achievements are based on theories from many centuries ago. Thus, the migration issue has begun to be debated in scientific circles even before the mercantilists. The fact is that Jean Baptiste Colbert and Thomas Mun, representatives of mercantilism, emphasized the interdependence between migration and economic growth, highlighting the need of keeping under control emigration from the origin country to colonies. To have a strong labor supply is one condition which can determine a significant economic growth. Subsequently, classical school

The USV Annals of Economics and Public Administration Volume 15, Issue 1(21), 2015
8
highlights more nuanced the migration problem. Adam Smith, the father of economics, showed the need for free movement of goods and people, as prerequisites for growth of wealth. (Smith, 1992). Among liberals, the mobility issue of population has been approached by J.S. Mill, Th. Malthus, and so on, all of these showing that a high mobility of labor provides acces to new markets. Migration has been studied regardless of doctrinal orientation. For example, in the case of Marx, the main factor triggering economic development, population mobility or changing all aspects of social life is mass industrial production, therefore migration appears to be driven by industrial evolution (Marx, 2009).
The 20th century comes with a number of dedicated migration theories. The table below summarizes some of these, the literature proving to be really complex (table 1).
Table 1. Some references on migration in the literature Year Researchers concerned with the study
of migration The main studied aspects
1957 D. Massey G. Myrdal
Migration can be seen as a process of self-sustaining capacity through the mechanisms which itself gives birth.
1960 O. Stark M.P. Todaro J.R. Harris
Migration can be analyzed from the perspective of individual rational decision. This kind of person will be able to assess prospects for increasing revenues.
1962-1964 G. Becker, Th. Shults, L.A.Sjaastad Migration can be regarded as an investment process in human capital of migrants.
1966 E.S. Lee Starting from the „laws of migration” discoverd by Ravenstein in the 19th century, Lee proposed push-pull theory of migration. It identifies four broad categories of decision determinants for emigration: factors aasociated with the origin area, factors associated with the destination area, obstacles and personal factors.
1979 L. Basch, M. J. Piore Migration has to be studied as an effect of labor demand in the secondary sectors in developed countries.
1987 D. Massey, L.P. Goldring, J. Durand Migration is analyzed in terms of capital formation mechanism.
1989 E. Taylor, O. Stark, P. Arnold, D. Massey
Migration - family strategy directed to minimizing risks of revenues reduction by diversifying their sources of achievement.
Source: Processings of authors
Lately, the study of migration research begins to focus on specific issues such as the
phenomenon of brain drain. The main stream of migration literature stressed that the brain drain represents a loss of human capital (Beine, Docquier and Rapoport, 2001), producing only negative effects on the country of origin (Wong and Yip, 1999 Bhagwati and Wilson, 1989). Another part of the literature shows that the brain drain phenomenon brings with it a number of long-term advantages, such as remittances sent by migrants to their countries of origin (Cinar and Docquier, 2004), additional knowledge and skills brought by persons repatriated to their country of origin (Postel-Vinay Dos Santos, 2003), closer trade relations by creating new business networks (Mesnard and Ravallion, 2001), increased foreign investment, etc. The literature has introduced new concepts such as Brain Drain, Brain Gain, Brain Waste, and a sub-branch of study migration occurred quite rapidly - "new economy brain drain" (Docquier and Rapoport, 2004).
The USV Annals of Economics and Public Administration Volume 15, Issue 1(21), 2015
9
2. THE MIGRATION PHENOMENON IN ROMANIA
After 1990, Romania had suffered the greatest loss of population in times of peace, in its history. The main causes of population reduction were: international migration, family planning and high mortality (INS, 2014).
Since 2014 the resident population of Romania registered for the first time values below 20 million. During the period 1989-2012 the resident population decreased by 3.1 million, more than 77% of its negative growth (2.4 million) being determined by emigration. By 2009 this reduction was driven predominantly by the migration phenomenon and since 2010 by the negative natural increase. International migration has led to an average annual reduction of Romania's population of 104,200 people in 1990-2012 (INS, 2014). The factors that led to the current situation are numerous and fit into different categories, starting with those of economic and social nature and reaching the psychological ones. Interesting is that recent statistics indicate that besides the known factors leading to the current demographic decline there are some others - the increasing average age of mother at the first birth from 23.7 years in 2000 to 26.2 years in 2012 and the decrease of the fertility rate of a Romanian woman (according to Eurostat).
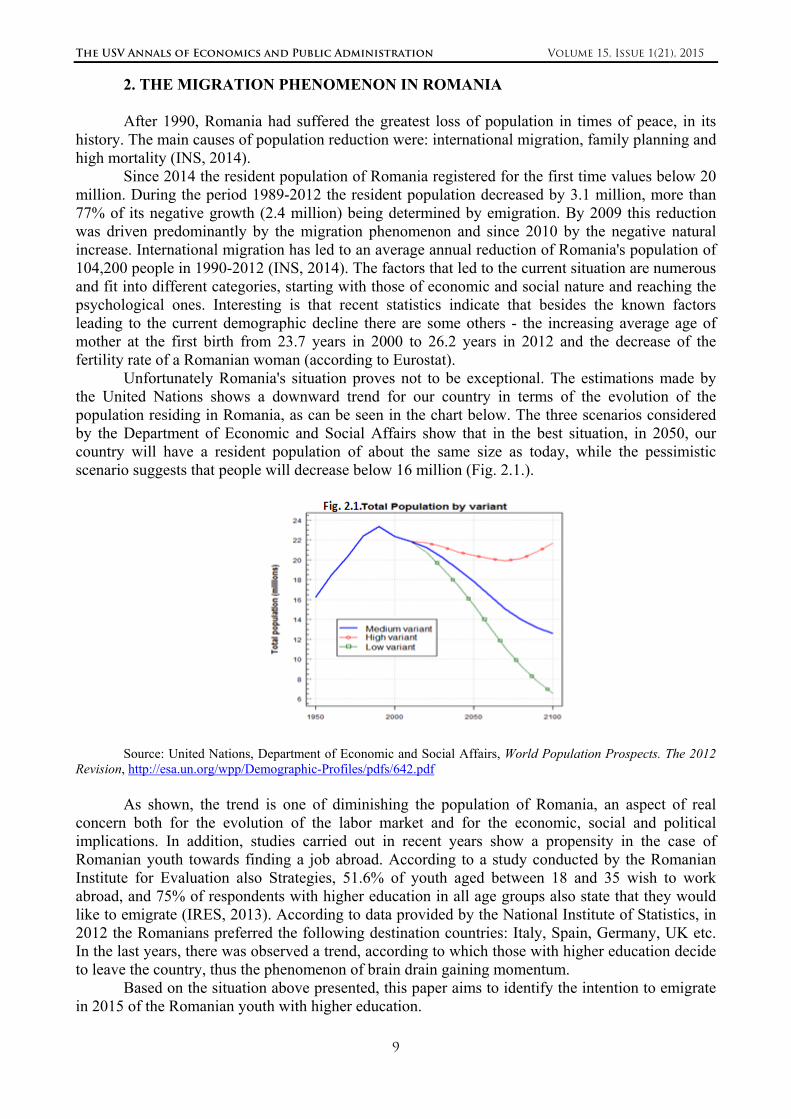
Unfortunately Romania's situation proves not to be exceptional. The estimations made by the United Nations shows a downward trend for our country in terms of the evolution of the population residing in Romania, as can be seen in the chart below. The three scenarios considered by the Department of Economic and Social Affairs show that in the best situation, in 2050, our country will have a resident population of about the same size as today, while the pessimistic scenario suggests that people will decrease below 16 million (Fig. 2.1.).
Source: United Nations, Department of Economic and Social Affairs, World Population Prospects. The 2012 Revision, http://esa.un.org/wpp/Demographic-Profiles/pdfs/642.pdf
As shown, the trend is one of diminishing the population of Romania, an aspect of real
concern both for the evolution of the labor market and for the economic, social and political implications. In addition, studies carried out in recent years show a propensity in the case of Romanian youth towards finding a job abroad. According to a study conducted by the Romanian Institute for Evaluation also Strategies, 51.6% of youth aged between 18 and 35 wish to work abroad, and 75% of respondents with higher education in all age groups also state that they would like to emigrate (IRES, 2013). According to data provided by the National Institute of Statistics, in 2012 the Romanians preferred the following destination countries: Italy, Spain, Germany, UK etc. In the last years, there was observed a trend, according to which those with higher education decide to leave the country, thus the phenomenon of brain drain gaining momentum.
Based on the situation above presented, this paper aims to identify the intention to emigrate in 2015 of the Romanian youth with higher education.

The USV Annals of Economics and Public Administration Volume 15, Issue 1(21), 2015
10
3. RESEARCH REGARDING THE INTENTION TO EMIGRATE OF THE YOUNG ROMANIANS WITH HIGHER EDUCATION
Starting from the need to identify migration intentions of Romanian youth with higher education, we conducted a pilot survey. Thus, during March-April 2015 was distributed a questionnaire containing 18 questions on the intention of Romanian young people to emigrate in the short term. The sample consisted of 199 respondents, all of them being students at some of the most prestigious universities in the country: Bucharest Polytechnic University (with a total of 25,382 students as of academic year 2013-2014) and Bucharest University of Economic Studies (with a total of 23,678 students as of academic year 2013-2014). In a first phase, we needed to develop a pilot survey in order to track the tendencies of young economists and engineers, and based on their responses to determine trends and elements needed to expand this research to other groups of young people with higher education.
Of the total number of questions included in the survey, there have been selected only a few for presenting some relevant determined issues.
The first part of the questionnaire concerned respondents' opinion on the phenomenon of migration. Thus, the statement "You consider the freedom of movement of Romanian citizens in all EU area as the highest win since the Revolution", the majority (51%) of the respondents said that they are totally agree or strongly agree. Only 4% of the respondents were classified in total disagreement, as can be seen in Figure 3.1.
Source: Authors processing based on the results of research carried out during March-April 2015.
Given that most of the respondents were represented by people born after 90s, who did not
have the opportunity to live in the communist regime, but to whom the communist period was presented as one characterized by the deprivation of the Fundamental Rights of the citizen, it is not surprising that freedom of movement within the European area is perceived as a fundamental right. This is reinforced by the results in the case of the second claim, which seeks to highlight the extent to which social and legislative plan (bounded by the right of free movement) is complemented by the development opportunities generated by the existence of this right (”You consider the freedom of movement of Romanian citizens in all EU area as a chance for the development of Romanian society”).

The USV Annals of Economics and Public Administration Volume 15, Issue 1(21), 2015
11
Source: Authors processing based on the results of research carried out during March-April 2015
About 58% of young surveyed students consider the free movement of Romanian citizens in
the EU a chance for the development of Romanian society ("Totally agree" or "Strongly agree") (Fig. 3.2). They take into account the possibilities for the personal, social and professional development that emigration can offer. If 58% of respondents consider free movement of the Romanian citizens in the Community as a great opportunity for the development of Romanian society, it is noted that a similar percentage of people consider this as being a great win.
Emigration is usually associated by young people with so-called "recipe for success" and success, most often is viewed through the prism of the existence of a well-paid job. Therefore, whenever discussing migration, labor market cannot be regarded otherwise than closely connected with the phenomenon of migration. For the third statement "Given the above, you consider emigration of the Romanians into the EU a normal movement within the unique labor market in the EU”, 52.76% of the respondents considered themselves as being totally agree and strongly agree, considering thereby generated labor market fluctuations as being normal (Fig. 3.3.).
Source: Authors processing based on the results of research carried out during March-April 2015
Undoubtedly obtaining the right of free movement caused an intensified emigration in the
case of the citizens of a country where the need for expressions of freedom and other economic opportunities was so stringent that the results were clearly seen in its demographic evolution. The problem in this situation is related to how will succeed the labor market in Romania to rebalance

The USV Annals of Economics and Public Administration Volume 15, Issue 1(21), 2015
12
itself in the context of labor supply reduction. The way it will stabilize will impact on a number of other macroeconomic variables that are influenced by the labor market, such as social security budget, unemployment, low consumption, investment, etc.
Given that the Romanian citizens, who are working abroad, have the chance to improve their standard of living and frequently resort to sending significant amounts of money to their relatives in the country, we asked a question to determine the perception of migration as a phenomenon that leads to an improvement of living standards ("Given the above, you consider emigration of Romanians into The EU a chance for of Romanian citizens to improve their standard of living").
Source: Authors processing based on the results of research carried out during March-April 2015
Compared with only 8% of respondents who have the perception that emigration does not
lead to improving the living standards, 68% of respondents say their leaving for a foreign country will bring a better life for sure, while 24% tend to agree with the statement that emigration will lead to higher standards of living (Fig. 3.4.). The perspective covers both Romanians who have left the country to seek a favorable environment for personal development and better living standards, but also Romanians who remained in the country and who are receiving financial support from abroad, support that can be used for different purposes and that is reflected in the microeconomic level and at global level.
Many times a certain type of behavior draws the same type of conducts. Building on the success that emigrated friends and relatives have obtained, many of those who remained in their home country can question themselves to imitate the behavior of those who have decided to emigrate. To see if there are incentives that can lead to faster the decision making to emigrate, there was formulated the question "Do you have relatives / acquaintances who have moved to another country and if so, where?".

The USV Annals of Economics and Public Administration Volume 15, Issue 1(21), 2015
13
Fig. 3.5. Do you have relatives / acquaintances who have moved to another country and if so,
where? Source: Authors processing based on the results of research carried out during March-April 2015
First, the results point out the high percentage of people who have relatives left in another
country (84% of those who responded), as can be seen in Fig. 3.5. Of these, 36% have relatives in Italy, 34% in Spain, 31% in the UK and in Germany 25% of the individuals have relatives or acquaintances. These are the countries with which Romania has intense commercial exchanges and in the case of Spain and Italy, the language is not an impediment, as both are countries of Latin origin. Italy and Spain, the countries of the first two places, present a lot of cultural similarities, which may explain why they have attracted a significant percentage of emigrants coming from Romania.
Starting from the mirage provided by foreign lands and from the positive experience gained by acquaintances or relatives with immigrant status, 76.38% of the people questioned respond affirmatively to the question "Have you ever thought to emigrate?". Only 23.62% say that they never thought to emigrate, as shown in Fig. 3.6.
Fig. 3.6. Have you ever thought to emigrate?
Source: Authors processing based on the results of research carried out during March-April 2015 It is interesting to note that although only 58% of respondents largely agree that emigration
is a chance for the development of Romanian society, a considerable share of 76.38% of respondents have sought to emigrate. These results can be interpreted to mean that those who want to emigrate do not necessarily believe in a Romanian society development, but rather see emigration as an improvement in their personal situation and in their living standards (68% of respondents consider emigration as a chance to improve the standard of living).

The USV Annals of Economics and Public Administration Volume 15, Issue 1(21), 2015
14
Fig. 3.7. To what extent it is considered that the emigration is a chance for the society
development and for the improvement of the living standards? Source: Authors processing based on the results of research carried out during March-April 2015
Of the respondents who are "strongly agree" that free movement in the EU is a development
opportunity of the country (37%), a major percentage (27%) is "totally agree" that free movement means improving living standards (Fig. 3.7).
The last two questions of the above were analyzed using a graphical correlation between their answers (Fig. 3.8.).
Source: Authors processing based on the results of research carried out during March-April 2015
Of the total of 84% of people who have relatives / acquaintances who have gone abroad,
67% have thought to emigrate and only 17% have considered this option. Of the 16% of respondents who do not have relatives living abroad, a major percentage was also thought to leave Romania. The result shows a general desire to emigrate among youth in Romania, which may generate an overall imbalance of the entire society if the subject is not treated with the utmost attention.
When asked "To what extent do you think you could have a better standard of living in another country?", 84% of respondents believe that their departure could bring a better life (Fig. 3.9.).

The USV Annals of Economics and Public Administration Volume 15, Issue 1(21), 2015
15
Fig. 3.9. To what extent do you think you could have a better standard of living in another
country? Source: Authors processing based on the results of research carried out during March-April 2015
There is an overwhelming percentage of people who have thought to emigrate (76%) and an
even higher percentage of people who felt that they could have a better life in another country in a large and very large extent (84%). The difference is represented by people who, although are aware of the chances to raise the standard of living settling in another country, did not thought to emigrate. The latter represents a very stable category form the demographic perspective.
Beyond the mirage of offered by foreign lands, there are several factors on which public policies might focus in order to keep young people in the country. To the question "What would be the reasons why you choose to stay in Romania?", 92% of respondents indicate family and friends, as shown in Fig. 3.10.
Fig. 3.10. What would be the reasons for which you choose to stay in Romania?
Source: Authors processing based on the results of research carried out during March-April 2015 On the second place is to be found a 16% of the respondents, which indicate the patriotism
as a reason for not leaving the natal country. 10% of respondents stated that they would not emigrate because do not master a foreign language, while 8% range from the unfortunate experience of acquaintances. The high percentage of those who decide to stay in the country for their family and friends highlights a culture of a people attached to others. From this point of view, in order to reduce the migration phenomenon, the state should develop a set of policies that emphasize the importance of family in society and that raise the living standards of their members.
When asked "What country would you choose in the situation you decide to emigrate?", the young people had more possibilities to reply, which included EU countries and a further embodiment response to those who have other preferences than EU.

The USV Annals of Economics and Public Administration Volume 15, Issue 1(21), 2015
16
Fig. 3.11. What country would you choose in the situation you decide to emigrate?
Source: Authors processing based on the results of research carried out during March-April 2015 The responses show that students, future economists and engineers prefer western countries,
especially the UK and Germany (Fig. 11). Italy is not preferred by Romanian young people with higher education, although it is among the countries where they have relatives / acquaintances, which shows that the "snowball effect" does not operate in any situation.
Fig. 3.12. What are the reasons for which you choose to emigrate?
Source: Authors processing based on the results of research carried out during March-April 2015 Among the reasons that would cause Romanian students to work abroad, the prevailing ones
are related to wage earnings, the matching between the graduated studies and the occupied job, a better health and educational system and a "cleaner" political environment. Majority of respondents would emigrate for a higher salary (74%) and for an appropriate job (50%) (Fig.3.12.). These responses do nothing else but to bring to the fore issues the Romanian economy is facing.
The aspirations of young people, seen here as incentives for leaving home land, show what are the areas which dissatisfy them in Romania. Thus disparity, often highlighted in the recent literature, between the Romanian educational system and labor market requirements, the shortcomings of a health system already considered "sick", wages that do not allow for a decent living are just some of the issues that any individual should face. Therefore, those who do not find a job according to their professional training have two possibilities regarding leaving the home country: either to look abroad for a job in which they had been trained, either to settle to work in another area, but being paid more than would be paid in Romania in the field for which they have been trained.

The USV Annals of Economics and Public Administration Volume 15, Issue 1(21), 2015
17
Fig. 3.13. What are reasons for which you would return home?
Source: Authors processing based on the results of research carried out during March-April 2015
The reasons why students in the event that they decide to emigrate would return home are largely the reasons why some of them decide to stay in the country. It's about family and friends (80%), places and memories (42%), the desire to contribute to the modernization of Romanian society (32%) (Fig.3.13.). These are reasons that future generations of Romanian children born abroad will not consider so strong to want a return to the country of origin of their parents because the sense of belonging of future generations will be increasingly reduced.
4. INSTEAD OF CONCLUSIONS Pilot survey results can be considered a warning signal. They generally show a clear
intention of Romanian young people to emigrate. The causes are multiple, from those of a personal nature, relating in particular to living standards, and reaching significant deficiencies in the health and educational system, legislative and political environment etc.
Therefore, the Romanian state spending on education and health provision dealing with young people who leave their native country can be considered losses. On one side are sometimes amounts recovered, on the other hand, in the internal market can create a shortage of labor. One of the sources for covering the loss of population due to migration is represented by the flow of immigrants, who are increasingly coming more to the European Union, with the risk of cultural and social differences. It is estimated that these flows will be increasingly greater with the development of Romania because our country will become more attractive for foreigners seeking a country of adoption. The trend in net inflows of immigrants in the EU is growing - from 36.000 people in 2013 to 1.360.000 persons in 2040 (European Commission, 2014).
However, following the rise of the phenomenon of emigration, the effects that occur in the country of origin are obvious. They can be positive, and we mention here just the remittances and know-how that people working abroad can bring nationally. Studies over time show that migration can lead to lower the tensions on the labor market in countries with a high unemployment rate. In addition, from migrants working in rich countries come often significant amounts in the form of remittances, which even if they are directed to consumption, can induce a positive effect of multiplication.
What worries are actually the negative the effects, among which may be mentioned: the emergence of a shortage of labor force in the home country, the reduction in income to the state budget of Romania, increasing social and political tensions, potential intensification of criminal activities (enhancing human trafficking, drug trafficking etc.) etc.

The USV Annals of Economics and Public Administration Volume 15, Issue 1(21), 2015
18
Therefore, starting from the negative effects of emigration and from the dire projections on economic and demographic future of Romania, the lack of public policies to support young graduates who choose to stay and work in the country and the lack of investments with the purpose of preservation the valuable human capital, can lead us to a critical situation, which will obviously be reflected in the quality of public services, healthcare system, to the education and living standards in general.
Therefore, tackling the problem can be done from two perspectives. A first option would be to take sustainable actions and effective for stopping the exodus of young people. The solution of the annual economic growth of 4-5% higher than in the developed European countries could keep a part of the workforce, but even so the aging European population and economic growth of 2-3% in developed countries will still absorb labor from Eastern European countries, including Romania. Therefore, enabling the creation of well-paid jobs, corresponding to the preparedness of young people could change the course of events.
The second option can go on the idea that migration is a mechanism for regulating the labor market. In this case, via bilateral agreements could be made temporary migration programs between the country of destination and country of origin (state or private environment) with the requirement for knowledge transfer so that the relationship between the host country and the native country to turn into one of the type win-win. Besides measures to facilitate the return of skilled migrants would have a significant multiplier effect. Diaspora should be encouraged to promote home country by participating in transnational networks of knowledge.
Nationally it seems that time has come to take serious measures so that economic, social and political stability not to be affected in the future.
BIBLIOGRAPHIC REFERENCES
1. Beine, M., F. Docquier and H. Rapoport (2001), Brain Drain and economic growth: theory and evidence, Journal of Development Economics, 64(1), pp. 275–289.
2. Bhagwati, J. and J. D. Wilson (ed) (1989), Income Taxation and International Mobility, Cambridge, MA Mitt Pres.
3. Cinar, D and F. Docquier (2004), Brain drain and Remittances: implications for the source country, Brussels Economic Review, Vol. 47, Issue 1, pp. 103-118
4. Constantinescu M. (2002), Teorii ale migraţiei internaţionale, Sociologie Românească, nr. 3-4. Polirom, pp. 93-114.
5. Docquier, F. and Rapoport, H. (2004), Skilled migration: the perspective of developing countries, Policy Research Working Paper Series 3382
6. Dos Santos, M.D, Postel-Vinay, F. (2003), Migration as a source of growth: The perspective of a developing country, Journal of Population Economics, Springer, vol. 16(1), pp. 161-175.
7. European Commission (2014), The 2015 Ageing Report. Underlying Assumptions and Projection Methodologies, Brussels, Belgium, http://ec.europa.eu/economy_finance/publications/european_economy/2014/pdf/ee8_en.pdF, [accessed March 20, 2015]
8. Institutul Național de Statistică (2014), Migrația internațională a României, București, http://www.insse.ro/cms/files/publicatii/pliante%20statistice/Migratia%20internationala%20a%20Romaniei.pdf, [accessed February 14, 2015]
9. Lee, E.S. (1966), A Theory of Migration, Demography, 3(1), pp. 47-57, http://links.jstor.org/sici?sici=0070-3370%281966%293%3A1%3C47%3AATOM%3E2.0.CO%3B2-B, [accessed March 15, 2015]
10. Marx, K. (2009), Critica economiei politice. Procesul de producţie al capitalului, vol.I, Alexandria Publishing House, Suceava

The USV Annals of Economics and Public Administration Volume 15, Issue 1(21), 2015
19
11. Massey, D. et all (1987), Return to Atzlan: The Social Process of International Migration from Western Mexico, University of California Press, Berkeley, US
12. Massey, D. (1990), The Social and Economic Origins of Immigration, Annals of the American Academy of Political and Social Science, Vol. 510, pp. 60-72, http://www.jstor.org/pss/1046794
13. Mesnard, A., Ravallion, M. (2001), Is inequality bad for business: a non-linear microeconomic model of wealth effects on self-employment, Research working paper, WPS no.2527.
14. Piore, M. J. (1979), Birds of Passage: Migrant Labour and Industrial Society, Cambridge, UK: Cambridge University Press
15. Romanian Institute for Evaluation and Strategy (IRES). (2013), Perceptions and attitudes of the Romanian population regarding working abroad, Research Report, http://www.ires.com.ro/articol/221/perceptions-and-attitudes-of-the-romanian-population-regarding-working-abroad, [accessed March 16, 2015 ]
16. Sjaastad, L.A. (1962), The Costs and Returns of Human Migration, The Journal of Political Economy, no.5, Vol. 70, pp. 80-93. http://webkuliah.unimedia.ac.id /ebook/files/human%20capital%204.pdf
17. Smith, A. (1992), Avuţia naţiunilor cercetare asupra naturii şi cauzelor ei, Editura Universitas, Chișinău
18. Stark, O., Taylor, E. (1989), Relative deprivation and international migration, Demography, no. 1, vol. 26, pp. 1-14.
19. United Nations, Departament of Economic and Social Affairs, World Population Prospects. The 2012 Revision, http://esa.un.org/wpp/Demographic-Profiles/pdfs/642.pdf, [accessed March 24, 2015]
20. Wong, K., C. K. Yip (1999), Education, Economic Growth and Brain Drain, Journal of Economic Dynamics Control, vol. 23 (5-6), pp. 699-796.

The USV Annals
of Economics and
Public Administration
Volume 15,
Issue 1(21),
2015
20
PIGS COUNTRIES’ NEW CHALLENGES UNDER EUROPE 2020
STRATEGY
Victor‐RomeoIONESCU
DanubiusUniversityofGalati,FacultyofEconomics,Romaniaromeo.v.ionescu@univ‐danubius.ro
Abstract: The paper deals with the idea that Europe 2020 Strategy is a too ambitious project for many Member
States. The analysis is focused on PIGS countries. In order to demonstrate the impossibility to achieve the Strategy’s goals, the analysis uses six representative economic indicators: GDP growth rate, employment, R&D investment, gas emissions, educational attainment and risk of poverty and social exclusion. The analysis uses regression, clusters, forecasting models and comparisons with Euro area average. The intermediate conclusion of the paper is that PIGS countries can be analysis under a cluster approach. The final conclusion is that PIGS countries are not able to achieve the Strategy’s goals in 2020, even that their socio-economic trend is positive for almost all indicators. The analysis and the conclusions in the paper are supported by pertinent statistic tables and diagrams, coupled with dedicated IBM-SPSS software.
Key words: economic growth rate, R&D investment, gas emissions, educational attainment, risk of poverty, clusters, economic forecasting.
JEL classification: E6, O5, R1.
1 INTRODUCTION
Portugal, Italy, Greece and Spain were defined under PIGS acronym in the 90s. At that moment, it was a pejorative term, used in order to delimit those economies which were able to create problems for the European Union.
Under the recent global crisis’s impact, PIGS economies faced to great socio-economic challenges. These challenges were higher because all these four economies are members of the European area.
The economic recovery period was longer in these countries. Moreover, the idea of four peripheral European Union states with the weakest economies is still available.
The Europe 2020 Strategy brought new strategic goals for the Member States, connected to labour, R&D investment, gas emissions, educational attainment and risk of poverty and social exclusion. These above objectives can be achieved only under a sustainable economic growth.
The analysis in the paper covers at least three steps: a comparative analysis between the PIGS economies and Euro area average, a cluster approach as a result of a regression analysis and forecasting of six specific indicators in the context of Europe 2020 Strategy.
The comparative analysis uses the latest official statistic data, while the regression analysis is made under ANOVA conditions. The two-step cluster approach is based on IBM-SPSS software. The same software will support the forecasting processes, as well.
2 RELATED WORKS
There are enough researches focused on PIGS economies started with the use of their
acronym (Vernet D., 1997). These four economies represented a real challenge for the EU and the latter Euro area. As a
result, the adhering euphoria did not last long (Dainotto R. M., 2006).

The USV Annals of Economics and Public Administration Volume 15, Issue 1(21), 2015
21
The banking crisis in Ireland added the Irish economy to PIGS under the new acronym of PIIGS. Ireland was the first Euro area state which faced to the crisis in 2007 (Krouse S., 2012).
The difficulties in passing the global crisis made the PIGS economies to be considered as zombie economies, which are not able to recover quickly (Quiggin J., 2012).
Almost all economic analyses are focused on the debt crisis and lead to various conclusions and proposals connected to the including of Ireland and UK in PIGS. Moreover, under a global debt approach, USA is considered a good partner for PIGS (Sparke M., 2012).
3 PIGS COUNTRIES’ ECONOMIC DEVELOPMENT UNDER THE GLOBAL CRISIS
The PIGS economies’ evolution is analysed using six specific indicators: GDP growth rate,
employment rate, expenditure on R&D, gas emissions, educational attainment and risk of poverty. The latest trends in GDP growth rates are presented in Table 1(European Commission, 2014).
Table 1: GDP growth rates (%) 2012 2013 2014 2015 Euro area -0.7 -0.4 1.2 1.8Portugal -3.2 -1.6 0.8 1.5Italy -2.5 -1.9 0.6 1.2Greece -6.4 -3.7 0.6 2.9Spain -1.6 -1.2 1.0 1.7
According to Table 1, PIGS states’ GDP growth rates will be close to the Euro area average
at the end of 2014. The same situation will be in 2015, excepting Greece, which will achieve an economic growth rate higher than Euro area average. Basically, will be great disparities between the above five economic entities in 2015 (see Figure 1).
Figure 1: Real GDP growth rate’s disparities Source: personal contribution using IBM-SPSS software
Figure 1 supports the idea of cluster approaching for PIGS economies. The analysis takes
into consideration two clusters. The viability of such approach is quantified in Figure 2. The cluster quality is fair and the ratio of cluster sizes is 1. These data support the cluster approach in Figure 2.

The USV Annals of Economics and Public Administration Volume 15, Issue 1(21), 2015
22
Figure 2: Real GDP growth rate under cluster analysis
Source: personal contribution using IBM-SPSS software
Europe 2020 Strategy establishes specific targets. One of these is the employment rate and covers population aged 20-64. Its evolution is presented in Figure 2 (http://epp.eurostat.ec.europa.eu/tgm/table.do?tab=table&init=1&plugin=0&language=en&pcode=t2020_10&tableSelection=1).
Table 2: Employment rates trend (%)
2010 2011 2012 2013 Euro area 68.8 68.4 68.1 67.7 Portugal 70.3 68.8 66.3 65.4 Italy 61.1 61.2 61.0 59.8 Greece 63.8 59.6 55.0 52.9 Spain 62.8 62.0 59.6 58.6 The employment average trend is negative during 2010-2013 in Euro area as in PIGS economies. Greece, Spain and Italy faced to the lowest employment rates, while Portugal was close to the average in 2013 (see Figure 3).
Figure 3: Employment rate’s disparities
Source: personal contribution using IBM-SPSS software
The fair quality of the cluster and the same ratio of cluster sizes support the cluster approach for this indicator, as for GDP growth rate.

The USV Annals of Economics and Public Administration Volume 15, Issue 1(21), 2015
23
Figure 4: Employment rate under cluster analysis
Source: personal contribution using IBM-SPSS software Another target of the Europe 2020 Strategy is that 3% of the GDP should be invested in
R&D. There are great disparities between the Euro area average and PIGS countries (http://epp.eurostat.ec.europa.eu/tgm/table.do?tab=table&init=1&plugin=0&language=en&pcode=t2020_20&tableSelection=1) as in Table 3.
Table 3: Gross domestic expenditure on R&D (% of GDP)
2010 2011 2012 2013 Euro area 2.00 2.04 2.09 2.12 Portugal 1.53 1.46 1.37 1.36 Italy 1.22 1.21 1.26 1.25 Greece 0.60 0.67 0.69 0.78 Spain 1.35 1.32 1.27 1.24
According to Table 3, the Euro area average investment in R&D increased during 2010-2013, while they decreased in Portugal, Italy and Spain. Greece achieved the same positive trend as Euro area average. On the other hand, there are greater disparities related to the value of the R&D investment between PIGS countries in 2013, as well (see Figure 5).
Figure 5: Gross domestic expenditure on R&D’s disparities
Source: personal contribution using IBM-SPSS software
The same cluster test seems to be fair as quality and ratio sizes (see Figure 6).
Figure 6: R&D expenditure under cluster analysis
Source: personal contribution using IBM-SPSS software

The USV Annals of Economics and Public Administration Volume 15, Issue 1(21), 2015
24
According to Europe 2020 Strategy, the greenhouse emissions should be reduced by 20% compared to 1990. The trend of this indicator is presented in Table 4 (http://epp.eurostat.ec.europa.eu/tgm/table.do?tab=table&init=1&plugin=0&language=en&pcode=t2020_10&tableSelection=1).
Table 4: Greenhouse gas emissions (1990=100%) 2010 2011 2012 2013 Euro area 83.83 85.73 83.21 82.14 Portugal 124.10 117.70 115.74 114.87 Italy 95.39 97.25 94.87 89.72 Greece 118.02 111.73 108.97 105.71 Spain 128.57 124.41 124.41 122.48 No one of PIGS economies was able to achieve the Euro area average related to greenhouse gas emissions in 2013 and the disparities are great (see Figure 7).
Figure 7: Gas emissions’ disparities
Source: personal contribution using IBM-SPSS software Figure 7 allows anticipating the existence of two clusters across the PIGS countries (see Figure 8).
Figure 8: Gas emissions under cluster analysis
Source: personal contribution using IBM-SPSS software The cluster quality is good, better than the above ones and the ratio of the cluster sizes is good enough (1.5). As a result, the cluster assumption for PIGS economies is supported to this step of the analysis. According to Europe 2020 Strategy, at least 40% of 30-34 years old should have completed a tertiary or equivalent education. At this level, the analysis selected the tertiary educational attainment (http://epp.eurostat.ec.europa.eu/tgm/table.do?tab=table&init=1&plugin=0&language=en&pcode=t2020_41&tableSelection=1). The statistical data are presented in Table 5.

The USV Annals of Economics and Public Administration Volume 15, Issue 1(21), 2015
25
Table 5: Tertiary educational attainment (%) 2010 2011 2012 2013 Euro area 33.6 34.0 34.9 35.9Portugal 24.0 26.7 27.8 30.0Italy 19.8 20.3 21.7 22.4Greece 28.6 29.1 31.2 34.9Spain 42.0 41.9 41.5 42.3
Spain achieved a higher rate than the Euro area average in 2013, while Greece was closed to that average. On the other hand, Portugal and Italy faced to low tertiary educational attainment rates in the same year (see Figure 9). Tertiary educational attainment supports the cluster grouping of the PIGS economies, as in Figure 10. The cluster quality is good, while the ratio of cluster sizes increases at 3.
Figure 9: Tertiary educational attainment’s disparities
Source: personal contribution using IBM-SPSS software
Figure 10: Tertiary educational attainment under cluster analysis
Source: personal contribution using IBM-SPSS software The last target of Europe 2020 Strategy is poverty, which should be reduced by lifting at least 20 million people out of the risk of poverty or social exclusion. According to this, the paper focuses on people at risk of poverty as % of total population. The trend of this indicator is presented in Table 6. (http://epp.eurostat.ec.europa.eu/tgm/table.do?tab=table&init=1&plugin=0&language=en&pcode=t2020_50&tableSelection=2).
Table 6: People at risk of poverty (% of total population) 2010 2011 2012 2013 Euro area 21.9 23.0 23.4 23.0 Portugal 25.3 24.4 25.3 27.4 Italy 24.5 28.2 29.9 28.4 Greece 27.7 31.0 34.6 35.7 Spain 26.7 27.7 28.2 27.3

The USV Annals of Economics and Public Administration Volume 15, Issue 1(21), 2015
26
Italy and Spain succeeded to achieve lower poverty rates in 2013 than in 2012, while Portugal and Greece faced to an increase of these rates (see Figure 11).
Figure 11: Poverty risk’s disparities
Source: personal contribution using IBM-SPSS software On the other hand, all PIGS economies face to poverty rates higher than Euro area average. The trend of this indicator leads to the same clustering conclusion (see Figure 12).
Figure 12: Poverty rate under cluster analysis Source: personal contribution using IBM-SPSS software
The best cluster quality in this analysis (close to 1) is doubled by a high ratio of cluster sizes
(3). The first intermediate conclusions of the paper are the existence of great disparities between PIGS countries related to the Europe 2020 Strategy’s targets and the possibility to have a cluster approach in analyzing these countries. 4 THE VIABILITY OF EUROPE 2020 STRATEGY’S TARGETS FOR PIGS COUNTRIES
The next step of the analysis is to realize forecasts for the specific targets at 2020 horizon. In order to do this, the paper uses a larger time-period (2003-2014) covered by official statistic data. The forecasting is realized under ARIMA conditions. The dependent variables are the annual rates for each indicator and the independent variable is the forecasting period. The economic growth rate forecast in PIGS countries is presented in Figure 13.
Portugal Italy

The USV Annals of Economics and Public Administration Volume 15, Issue 1(21), 2015
27
Greece
Spain
Figure 13: GDP forecasting (%) Source: personal contribution using IBM-SPSS software
According to Figure 13, only Greece will achieve positive economic growth trend, while the
other PIGS economies will face to great economic challenges until the end of 2020. The employment rate’s forecasting result has to be compared to Europe 2020 Strategy’s goal of 75% in 2020. The employment rate’s forecast is presented in Figure 14.
Portugal Italy
Greece
Spain
Figure 14: Employment rate forecasting (%) Source: personal contribution using IBM-SPSS software
Unfortunately, no PIGS economy will be able to achieve the Strategy’s target in 2020.
Moreover, the individual PIGS states have their own targets for 2020, which can be other than the Euro area average of 75% (Italy 67%, Greece 70% and Spain 74%). On the other hand, Euro area as a whole will not be able to achieve the Strategy’s goals in 2020. A distinct target of the Strategy is that 3% of the GDP should be invested in R&D. All PIGS states have individual targets less than the Strategy’s goal. The gross domestic expenditure on R&D forecasting leads to the following results:
Portugal Italy
Greece
Spain
Figure 15: Expenditure on R&D forecasting (%) Source: personal contribution using IBM-SPSS software
All PIGS countries will have a positive trend related to expenditure on R&D during 2015-
2020. Unfortunately, they will not be able to achieve their individual targets or the Euro area average in 2020. The same Europe 2020 Strategy stipulates that the greenhouse gas emissions should be reduced by 20% compared to 1990. Italy seems to be the only PIGS country able to achieve this target in 2020 (see Figure 16).

The USV Annals of Economics and Public Administration Volume 15, Issue 1(21), 2015
28
Portugal
Italy
Greece
Spain
Figure 16: Gas emissions forecasting (%) Source: personal contribution using IBM-SPSS software
At least 40% 0f 30-34 years old should have completed a tertiary or equivalent education in
2020 is probably the easiest target for PIGS countries’ individual targets. In order to demonstrate this, the analysis focused on tertiary educational attainment rate forecasting (see Figure 17).
Portugal
Italy
Greece
Spain
Figure 17: Tertiary education attainment forecasting (%) Source: personal contribution using IBM-SPSS software
According to Figure 17, Italy and Greece will achieve higher values than their individual
targets, while Portugal will fall in achieving its target. On the other hand, Spain will achieve higher values than the Euro area average in 2020. The last target of Europe 2020 Strategy is that poverty should be reduced by lifting at least 20 million people out of the risk of poverty or social exclusion. The people at risk of poverty (% of total population) forecasting leads to the following situation:
Portugal
Italy
Greece
Spain
Figure 18: Risk of poverty forecasting (%) Source: personal contribution using IBM-SPSS software
Only Portugal will have a positive trend in Figure 18, while the other three PIGS states will
face to an increase of the risk of poverty rate.

The USV Annals of Economics and Public Administration Volume 15, Issue 1(21), 2015
29
5 CONCLUSIONS
Europe 2020 Strategy represents a project with too high targets for PIGS economies. Even that PIGS economies will achieve positive trends in expenditure on R&D, greenhouse gas emissions and tertiary education attainment, the employment and the economic growth rates will not be able to support the complete economic recovery in these four countries until 2020. Unfortunately, the individual solutions and more painful economic corrections are the best solutions for these economies, which imply high social and political costs.
6 ACKNOWLEDGEMENT
The economic analysis in this paper was realized with the support of the Research, Education and Development Association (REDA) Romania, http://www.aced-online.ro/en/.
7 REFERENCES
1. Dainotto Roberto M. (2006), Europe (in Theory), Durham: Duke University Press, p. 2. 2. European Commission (2014), European Economic Forecast-Winter, Brussels, p. 1. 3. Krouse Sarah (2012). Investing in PIIGS: Portugal, Financial News, 19th of March. 4. Quiggin John (2012), Zombie Economics: How Dead Ideas Still Walk among Us, Princeton
University Press, p. 229. 5. Sparke Matthew (2012), Introducing Globalization: Ties, Tensions, and Uneven Integration,
John Wiley & Sons, p. 261. 6. Vernet Daniel (1997), L'Allemagne au coeur du débat français, Le Monde, 24th of April. 7. http://epp.eurostat.ec.europa.eu/tgm/table.do?tab=table&init=1&plugin=0&language=en&p
code=t2020_10&tableSelection=1 8. http://epp.eurostat.ec.europa.eu/tgm/table.do?tab=table&init=1&plugin=0&language=en&p
code=t2020_20&tableSelection=1 9. http://epp.eurostat.ec.europa.eu/tgm/table.do?tab=table&init=1&plugin=0&language=en&p
code=t2020_10&tableSelection=1 10. http://epp.eurostat.ec.europa.eu/tgm/table.do?tab=table&init=1&plugin=0&language=en&p
code=t2020_41&tableSelection=1 11. http://epp.eurostat.ec.europa.eu/tgm/table.do?tab=table&init=1&plugin=0&language=en&p
code=t2020_50&tableSelection=2

The USV Annals
of Economics and
Public Administration
Volume 15,
Issue 1(21),
2015
30
PRESSURE OF AGEING ON REGIONAL DEVELOPMENT.
CHALLENGES AND LIMITS FOR THE LABOUR MARKET
SilviaPISICĂ
NationalInstituteofStatistics,[email protected]
ValentinaVASILE
InstituteofNationalEconomy,RomanianAcademy,[email protected]
AnaMariaDOBRE
InstituteofNationalEconomy,RomanianAcademy&NationalInstituteofStatistics,[email protected]
Abstract:
Using official statistics, the paper aims to contribute to regional development studies in Romania from perspective of labour market challenges and limits and the increasing number of elderly people participating in economic activity. Regional level is considered for analysing the social productivity of labour in terms of GDP and employment. The employment is analysed from the perspective of share and structure of elderly people on the labour market. In this respect, activity rates, ageing index and economic dependency ratio are reviewed. In order to shape the determinants of employment of elderly people, poverty measures at NUTS 2 level are figured out.
Key words: Employment, Labour Force, Social productivity of labour, Regional Development, Ageing
JEL classification: J40, R10
1. INTRODUCTION
Romania's usual resident population aged 65 and older is projected to increase from 3.3 million persons representing 16.6% of the population in 2014 to 3.9 million persons in 2030 with a share of 21.4% of the projected population and to 4.0 million persons (31.0%) in 2060 (National Institute of Statistics).
Table 1.Usual resident population of Romania – projection for horizon 2030 and 2060
2014 2030 2060
Usual resident population, thousands persons
19942.6 18107.1 13031.8
of which, by age groups, in %:
0-14 years 15.5 12.1 9.9
15-24 years 11.4 10.7 8.5
25-34 years 13.9 11.6 10.1
35-64 years 42.6 44.2 40.5
65 years + 16.6 21.4 31.0
Ageing Index, number of persons 65 years+ per hundred persons 0-14 years
106.7 177.2 311.5
Source: National Institute of Statistics and own calculations
The ageing of the population is driven by declines in fertility and increased longevity. The working-age population (15-64 years) that will provide most of the income to support these people will decrease from 67.9% in 2014 to 66.5% in 2030 and to 59.1% in 2060, while proportion of youth population (0-14 years) is expected to decrease also from 15.5% in 2014 to only 9.9% in

The USV Annals of Economics and Public Administration Volume 15, Issue 1(21), 2015
31
2060. The direct and obvious consequence will be a significant increase of the pressure on central and local governmental budgets for insuring social protection and health services for the elderly. Moreover the population ageing will probably lead to a sharp change in the structure of the local governmental budgets with too lower available funds for other services than the ones dedicated to the support of elderly. The analysis conducted in this study relies on demographic and employment statistics, as well as on poverty measures at regional level for the period 2008-2013. As the poverty statistics at NUTS 3 level are not available, the study will outline a regional analysis at NUTS 2 level (regions).
2. DATA ANALYSIS ON POPULATION AGEING IN ROMANIA Romania’s usual resident population is rapidly ageing, like most EU Member States. The consequences of this process are in sight of economic and social processes, such as employment, education, health, mobility. The accelerated phenomenon of population ageing owes to negative natural increase rate – in the last twenty years the number of deaths exceeding increasingly the number of live births - and, in parallel, due to the increase of life expectancy. Birth rate declining has reduced the young population (0-14 years). Also, the extension of life expectancy has resulted in increasing the number and proportion of elderly population (65 years and over).
Table 2. Share of elderly people in total population, NUTS 2 level - % -
2008 2009 2010 2011 2012 2013
North-West 13.9 13.9 14.0 14.1 14.8 15.3
Center 14.0 14.0 14.1 14.1 15.2 15.6
North-East 14.5 14.5 14.5 14.3 16.1 16.3
South-East 14.8 14.8 14.9 14.8 16.4 16.7
South - Muntenia 16.7 16.7 16.7 16.7 17.4 18.1
Bucharest - Ilfov 14.3 14.1 14.1 14.0 14.0 14.1
South - West Oltenia 16.3 16.3 16.5 16.4 17.7 18.0
West 14.4 14.4 14.4 14.4 15.1 15.7
Source: Eurostat, online data code demo_r_pjangroup The most "ageing" regions in the period under review are South - Muntenia and South - West Oltenia, with the share of the elderly population between 16.7% and 18.1%. Declining birth rates and mortality comedown, supported by a negative external migration marked the share of the elderly in the total population. At the opposite pole are situated the following regions: North-West, Center and Bucharest-Ilfov, with a share of elderly people in total population ranked between 13.9% and 15.6%. Ageing index (ratio between elderly and youth expressed as percentage) and old-age dependency ratio (ratio between elderly and working-age population expressed as percentage) are two indicators showing the dynamics of population ageing.
Figure 1. Old-age dependency ratio in Figure 2. Ageing index in Romania,

The USV Annals of Economics and Public Administration Volume 15, Issue 1(21), 2015
32
Romania, NUTS 2 level (%) NUTS 2 level (%)
Source: Eurostat, online data code demo_r_pjangroup
The highest old age dependency ratios in 2008 were 19.3 in Bucharest-Ilfov and 23.7 in South - West Oltenia. In 2013, in South - Muntenia were 27.1 persons 65 years and over per one hundred persons aged 15-64 years and in Bucharest-Ilfov the burden was the lowest in Romania, i.e. 19.4 elderly persons per one hundred working-age persons. Ageing index ranges between 81.2% (North-East) and 118.9% (Bucharest Ilfov) in 2008. In 2013, the ranking suffered few insignificant changes. The extreme values registered were 88.7% (North-East) and 122.1% (South-West), while in Bucharest-Ilfov the index show 105.2 persons 65 years old or over per hundred persons under age 15. In the following we will refer to the evolution of these indicators not only for Romania but also in comparison with the average of European Union. In the period 2008-2013, the average in EU-27 of old-age dependency ratio constantly increased from 25.45 to 27.51 elderly persons per one hundred working-age persons. In Romania, less elderly people to one hundred working-age persons were found as compared to the European Union, and the growth was less accelerated, i.e. from 22.6% to 23.9%. The ageing index has lower values for Romania than for the average EU-27, highlighting that in Romania are lower elderly persons per hundred young persons than in EU-27, although the rhythm is more rapid in Romania. The EU-27 average ageing index grew from 108.3% in 2008 to 116.5% in 2013 while in Romania, from 94.5% to 103.8% during same period of time.
Figure 3. Old-age dependency ratio (%) Figure 4. Ageing index (%)
Source: Own calculations, based on Eurostat, online data code demo_r_pjangroup
In Romania, the retirement age is linked to life expectancy. Other characteristic in
Romania’s public schemes for retirement is the non-penalized early retirement. Up to 5 years before the statutory retirement age of the person can be granted. Partial early retirement is permitted for persons who exceeded the statutory full period of social contribution with less than 8 years and is penalized by diminishing the benefits calculated for the old age pension, by 0.75% for each month

The USV Annals of Economics and Public Administration Volume 15, Issue 1(21), 2015
33
of early retirement, before complying with the old-age pension criteria. (Aging report EU 2015, p. 307)
Figure 5. Median-age population, EU-27 - years -
Source: Eurostat, online data code demo_pjanind
The phenomenon of population ageing may be also illustrated through the values of median-age. The median-age in Romania in 2013 was 40.5 years, comparing with 41.9 years, which is the median-age for EU-27. Countries like Ireland, Cyprus and Slovakia have the lowest median-ages in Europe in 2008, as well as in 2013, i.e. between 33 and 38 years. Meanwhile, Germany, Italy, Bulgaria and Portugal have the highest median-age, of about 43-45 years.
3. PARTICIPATION OF THE ELDERLY PEOPLE IN ECONOMIC ACTIVITY IN
ROMANIA
In Romania, the participation in the economic activity of the elderly people was higher (15.2%) during the financial crisis in 2008, but afterwards it declined to 11.3% in 2013.
Figure 6. Economic activity rate of elderly people in Romania, 2008-2013
(%)
Figure 7. Elderly persons participation in economic activity, by gender, in 2013
(thou persons)
Source: National institute of Statistics, Labour Force Survey
As the Figure 7 shows, elderly women were more frequent as compared to men among both employment and economically inactive population. The labour force participation rate for persons aged 15 years and over in Romania has a quasi-constant value during 2008-2013. The regions with the highest activity rates are North-East and Bucharest-Ilfov while the ones with the lowest levels are Centre and South-East. In three out of

The USV Annals of Economics and Public Administration Volume 15, Issue 1(21), 2015
34
eight regions, the activity rate increased in 2013 as against 2008: North-West (by 4.6 percentage points), North_East (by 3.9 percentage points) and Bucharest-Ilfov (by 2.3 percentage points). The highest decrease may be observed for region Centre (by -2.9 percentage points). Gender disparities are higher in regions South-East where activity rate for men exceeds the one for women by 22.3 percentage points (in 2013) and West (with a gap of 20.6 percentage points). The smallest gap between men and women in terms of activity rate are met in region North-East (11.4 percentage points) and North-West (13.9 percentage points).
Figure 8. Labour force participation for persons aged 15 years and over in
Romania, NUTS 2 level (%)
Figure 9. Labour force participation by gender for persons aged 15 years and
over in Romania, in 2013, NUTS 2 level (%)
Source: National Institute of Statistics, Tempo online code AMG155F
In the following statement an analysis based on Z-score method was conducted, on NUTS 3 level (counties), for the year 2013. The employment rates of labour resources were grouped by Z-score method. The analysis reveals that counties from North - East, South - East and South - Muntenia have the lowest employment rate of labour resources. In North - West, West and Bucharest - Ilfov is the highest rate of employment among labour resources.
Figure 10.Employment rate of labour resources in Romania, in 2013 (z-score method)
Source: National Institute of Statistics, Tempo online code FOM116A, own calculations

The USV Annals of Economics and Public Administration Volume 15, Issue 1(21), 2015
35
4. SOCIAL PRODUCTIVITY OF LABOUR AND POVERTY Social productivity of labour and poverty may highlight the discrepancies between different
geographical areas with respect to economic and social development. The social productivity of labour was computed as the ratio between GDP (million RON)
and civil employed population (persons).
Figure 11. Social productivity of labour in Romania, 2008-2012, at NUTS 2 level - Million RON/pers -
Source: authors’ calculations, based on National Institute of Statistics data, Tempo online codes CON103I and
FOM103D Given relatively modest performance of the agricultural sector in Romania, performed mainly in the traditional way, the regions with wide agricultural sector are facing low economic efficiency, i.e. low social productivity of labor. These regions are North-East and South-West Oltenia. At the opposite pole are situated the regions in which the tertiary sector (services) has a large share in the economy. These regions (Bucharest-Ilfov and West) have a healthy economic growth, therefore a high social productivity of labour. This is especially the case of two of the counties (NUTS 3 level) which are composing these regions that have the largest GDP in Romania: Bucharest and Timis. The impact of agriculture on employment and the situation of elderly may be also emphasized through the regional poverty indicators.
The poverty measures at NUTS 2 level could be determinants of employment. At-risk-of-poverty rate is an indicator measuring the share of people with an equivalised disposable income (after social transfer) below the threshold set at 60 % of the national median equivalised disposable income. Over 2008-2013, the poorest regions in Romania are North-East (with a share between 29.5% in 2010 and 33.7% in 2012) and South-West Oltenia (with a share between 28.9% in 2011 and 37.4% in 2009). The regions with the lowest share of people at-risk-of-poverty-rate are Bucharest-Ilfov, North-West and Center. The gap between the regions is high. Bucharest-Ilfov is about 10 times less poor than North-East.
Table 3. At-risk-of-poverty rate in Romania, 2008-2013, at NUTS 2 level - % -
2008 2009 2010 2011 2012 2013
Romania 23.4 22.4 21.1 22.2 22.6 22.4
North-West 18.9 18.7 14.6 20.0 15.9 15.9
Center 19.9 19.4 19.4 18.0 18.6 15.9
North-East 32.4 31.5 29.5 32.4 33.7 33.5
South-East 28.2 22.5 26.3 28.0 29.7 32.0
South - Muntenia 22.3 23.0 22.2 21.6 22.1 22.4
Bucharest - Ilfov 6.5 6.4 3.1 3.4 2.7 3.9

The USV Annals of Economics and Public Administration Volume 15, Issue 1(21), 2015
36
South - West Oltenia 36.9 37.4 30.7 28.9 29.9 30.1
West 15.9 15.4 17.6 18.8 20.5 22.9
Source: National Institute of Statistics, Tempo online code SAR102D
At-risk-of-poverty rate for elderly people is higher than the average, i.e. irrespective the age group, with a gap of about 7.2 – 7.4 percentage points (more). During the crisis the at-risk-of-poverty rate for elderly people was double (30.6% in 2008) as against 2013 (15.0 %).
Figure 12. At-risk-of-poverty-rate of elderly people in Romania, 2007-2013
- % -
Source: Eurostat, online data code ilc_li02
According to the 2012 Labour Force Survey ad-hoc module “Transition from work to retirement”, the main reason for economically inactive persons who receive a pension to quit working (50-69 years) is the reaching of eligibility for a pension (38.1% in Romania). Also, in Romania, three out of ten people admit that they quit working because of own health or disability. In EU-27 as well as in Romania, a small percentage of 50-69 years old persons quit working because of favorable financial arrangements to leave, lost job or other job-related reasons.
Figure 13.Main reason for economically inactive persons who receive a pension to quit working (50-69 years), 2012
- % -
Source: Eurostat, online data code lfso_12reasnot
The same ad-hoc module of Labour Force Survey reveals that for the persons receiving a pension but continuing working the reasons consist mainly in financial reasons. Therefore, one out of three persons in the EU-27 continues the work in order to provide sufficient personal/household income. Meanwhile, in Romania, nine out of ten persons that receive a pension continue working for the same financial motivation. For EU-27, another important reason is the establishing/increasing future retirement pension entitlements and to provide sufficient

The USV Annals of Economics and Public Administration Volume 15, Issue 1(21), 2015
37
personal/household income. But, for Romania, the second most important reason is just to establish or increase future retirement pension entitlements. These differences in motivation among EU-27 and Romania appear due to the level of economic development and mentality. In Romania, the elderly persons who are beneficiary of pension system are continuing working because the pensions are not enough to support their financial needs. Therefore, they are just aiming to attract new incomes and to increase their future retirement pension entitlements.
Table 4. Main reason for persons who receive a pension to continue working, 2012
- % - Main reason EU-27 Romania
To establish or increase future retirement pension entitlements 6.8 5.7
To provide sufficient personal/household income 37.2 90.5
To establish/increase future retirement pension entitlements and to provide sufficient personal/household income
14.6 1.6
Non-financial reasons, e.g. work satisfaction 29.2 2.2
Source: Eurostat, online data code lfso_12staywork CONCLUSIONS The labour market challenges and limits in terms of elderly people participating in economic activity have a direct impact on the regional development. The direct consequence of the trend in the population structure of Romania will be a significant increase of the pressure on central and local governmental budgets for insuring social protection and health services for the elderly. The population ageing will probably lead to a sharp change in the structure of the local governmental budgets with too lower available funds for other services than the ones dedicated to the support of elderly. The study concludes that regions with the highest at-risk-of-poverty rates have the lowest social productivity of labour, hence they signal the need for economic development policies. A special case is the one on North-East region, because it is one of poorest region, but it has the highest labour force participation for persons aged 15 years and over and one of the lowest employment rates of labour resources (civil employed population). In terms of economic activity, another important remark is that the regions with wide agricultural sector are facing low economic efficiency, i.e. low social productivity of labor. These regions are North-East and South-West Oltenia. The regions from south (South-Muntenia and South-West Oltenia) are the most affected by the ageing process. REFERENCES
1. European Commission (2014), The 2015 Ageing Report, in the European Economy Series, 8/2014, ISBN 978-92-79-35351-2 (online)
2. Eurostat Database, http://ec.europa.eu/eurostat/data/database 3. Eurostat, Labour Force Survey, Ad-hoc module “Transition from work to retirement”,
http://ec.europa.eu/eurostat/statistics-explained/index.php/Labour_force_survey_statistics_-_transition_from_work_to_retirement
4. Gavrilov L.A., Heuveline P. “Aging of Population.” In: Paul Demeny and Geoffrey McNicoll (Eds.) The Encyclopedia of Population. New York, Macmillan Reference USA, 2003, Available at: http://www.galegroup.com/servlet/ItemDetailServlet?region=9&imprint=000&titleCode=M333&type=4&id=174029

The USV Annals of Economics and Public Administration Volume 15, Issue 1(21), 2015
38
5. National Institute of Statistics, Labour Force Survey, annual database, Tempo on-line, http://statistici.insse.ro/shop/
6. Pisică S , Vasile V., Voineagu V., (2012), Piaţa muncii între formal şi informal, Bucharest: Editura Expert, ISBN 978-973-619-296-9.
7. Pisică S. (coord.), Moldoveanu R., "Forţa de muncă în România: Ocupare şi şomaj în anul…"(annual publication), National Institute of Statistics, 2005 – 2013, ISSN 1223-6446
8. Pisică S. (coord.), Postelnicu, M., Apostol, M., et al., (2012), "Îmbătrânirea populaţiei României", Institutul Naţional de Statistică, ISSN 2285-8237
Annex
Z-Score analysis for employment rate of labour resources
NUTS 2 (region) NUTS 3 (county) Z-Score NUTS 2 (region) NUTS 3 (county) Z-Score North - East Bacau -1.81 South - East Buzau -0.01
South - East Galati -1.70 Centru Brasov 0.00
North - East Vaslui -1.39 West Hunedoara 0.05
South - Muntenia Giurgiu -1.17 South - Muntenia Arges 0.11
North - East Iasi -1.13 South - East Constanta 0.11
South - Muntenia Calarasi -1.03 North-West Maramures 0.11
South - East Tulcea -1.00 North-West Bistrita-Nasaud 0.39
North - East Suceava -0.96 North-West Satu Mare 0.40
North - East Neamt -0.89 Centru Mures 0.42
South - East Braila -0.74 Centru Harghita 0.57
South - West Oltenia Gorj -0.71 Centru Sibiu 0.76
North - East Botosani -0.68 South - West Oltenia
Valcea 0.77
South - Muntenia Ialomita -0.58 South - Muntenia Teleorman 0.79
West Caras-Severin -0.48 Bucharest - Ilfov Ilfov 0.82
South - Muntenia Prahova -0.48 North-West Salaj 0.89
South - Muntenia Dambovita -0.44 Centru Alba 1.06
South - West Oltenia Olt -0.40 West Arad 1.40
South - West Oltenia Mehedinti -0.34 North-West Bihor 1.42
South - East Vrancea -0.31 West Timis 1.60
Centru Covasna -0.18 North-West Cluj 1.67
South - West Oltenia Dolj -0.06 Bucharest - Ilfov Municipiul Bucuresti
3.16
Source: authors’ calculations, based on National Institute of Statistics data, Tempo online code FOM116A

The USV Annals
of Economics and
Public Administration
Volume 15,
Issue 1(21),
2015
39
INFORMATION AND KNOWLEDGE IN A GLOBAL CONTEXT
ProfessorPh.D.FlorinaBRAN
TheBucharestUniversityofEconomicStudies,Bucharest,Româ[email protected]
AssistantProfessorPh.D.Maria‐LoredanaPOPESCU
SpiruHaretUniversity,Bucharest,Româ[email protected]
Abstract: Information and knowledge are two important entities, which make up present stage of globalization, based
mostly on their dynamics. This paper is providing an overview of information and knowledge in global context, highlighting the importance of information society that turned into knowledge society in the beginning of the 21st
century, being driven by Internet – the latter, as part of globalization process. Modern economic theories recognise the importance of information in economic process because its impact on globalization process in economy was essential, and change the way how markets and companies work and represent the key factor of new era of economic development. This paper presents main results from available literature about the relationship between information, knowledge and economic theory in a global conterxt and finally explained the benefits of the knowledge economy to all countries.
Key words: knowledge, information, global, society JEL classification: F63 INTRODUCTION Global policies must increase economies performances by transforming them in knowledge
based economies, which utilises knowledge an information in processes of distribution and production.
As a result of importance of knowledge in economic growth, economists develop the concept in more phases, which generate the actual phase of development.
The stage which assured premisses of today’s developement of this concept materialised in 1990, when Yoneji Masuda defined the concept of information society as key factor of development in post-industrial society. According to this, in the centre of post-industrial society there are production, dissemination and utilization of information, symbolically represented by entities of economic, scientific, technical, social, political reality, ‘created’ through processes of knowledge.
Definition of information society is related, according to specialists with development of information, from its classical form, to of files, magnetic or electronic-optical support, databases or data banks managed by computers, collections, documents, information registers, and computerized, patent funds as well as information held by humans (Dobrotă, 1994, pp. 86).
Knowledge represents more than information, in information society, a reality at the end of 20th century and helped it to achieve the next level into knowledge society in the beginning of the 21st century. Nowadays knowledge is a process that empowering societies, but also individuals, improving the quality of there life.
CONTENTS
Knowledge society can be defined as the human structured organisation of society, build on contemporary developed knowledge to give new quality of life support systems. Knowledge society requires broadening and deepening scientific knowledge and truth on the existence, use and management of existing knowledge under the form of technological and organizational knowledge,

The USV Annals of Economics and Public Administration Volume 15, Issue 1(21), 2015
40
obtaining new knowledge through innovation, an unprecedented dissemination of knowledge to all citizens by new media, using mainly internet. Internet represents the key factor that improves substantial the access to information but also turn information into knowledge. Development of information and communication technology represented a revolution to the global social-economic level, generating increasing economic performances of developed countries, which invest in new technologies. Internet became the agent of change in economic but also in social life, people are nowadays more interconnected economically, within markets, but also socially, and we assist to an increase interest for social ideas. That is practically the second phase in development of the concept, generated by the economic need of development, in the context of an increasing population and also of energetic consumptions. The new economy (economy + internet), or knowledge economy is part of the knowledge society, marking the moment when the innovation process becomes crucial to create new products and services. Innovation in knowledge society aims to improve productivity, not only in relation to classic labour productivity and capital productivity but also in relation to energy resources and natural materials, and with environmental protection. In that context, knowledge society is the solution for development of human society in the frame of sustainable development. Knowledge is helping us to measure sustainability, in the global context of increasing production and also the demand for resources, safeguarding biodiversity and ecosystem. Therefore, the new economy requires fostering creation and development of innovative companies having their own knowledge structure. Knowledge society is both a global system and a factor of globalization. The notion of knowledge society tries to make a synthesis of developments from globalized economic space in the last decades, especially in research, innovation, education, training, all of these based on the use of information technology (IT) and communication technology (ICT). A characteristic of knowledge society is the volume of knowledge and its increased rhythm of development and also the fact communities become more powerful through information. It is estimated volume of knowledge doubles every five years and must be managed for the benefit of society, because this type of society includes not only economy and technology, but also the system of organization of human beings, where there is a new division of labour, a new way to produce through easy access to extensive and interdisciplinary knowledge that makes ‘simple’ knowledge an economic resource, a commodity traded on the global market (by the means of patents, market information, consulting, training, etc.). Industry of knowledge is a result of both types of societies defined above, developed in a fast rhythm in the last few decades and whose results have been materialized into microelectronics, biotechnology, new materials with special properties, telecommunications, civil and military aircraft, robots, computers, space technology etc. The support of this knowledge industry is represented by research and (infrastructure) development, global flow of information and knowledge and, above all, existence of (over)qualified staff. The second key component is trade with knowledge and disseminating it at global level, for the benefit of investments in knowledge industry. In the world of knowledge society, information and knowledge are put up by organised human activity (i.e. by private companies, governments, alliances of countries). Human capital is crucial in knowledge society and generates the information that appears in education based on innovation, research and development entities involved in the industry of knowledge, supported by all logistics needed to enhance information and knowledge, consisting of databases, trade patents, licenses and technologies, flow of information and knowledge, internet. Focusing on knowledge, innovation, human intelligence in the heart of the concept of knowledge society or new economy, means it will develop a new concept of intellectual capital, which includes human capital, structural capital and relational capital, all together forming intangible assets. This intellectual capital (Baker, 1994, pp. 217) forms the invisible wealth of a

The USV Annals of Economics and Public Administration Volume 15, Issue 1(21), 2015
41
nation, its “software”, a true engine of development, role that Winston Churchill intuited, an in a speech given at Harvard University in 1943, when he stated “The empires of the future are true empires of the mind” (Suciu, 2008, pp. 242-287). Later, Gary Becker, in the 40’s, developed the concept of human capital, considering it as one of the decisive competitive advantage of nations (Baker, 1994, pp. 217). Human capital is the one that transforming information and gives knowledge a meaning in the knowledge-based society. The access of human capital to information makes it to turn information into knowledge and this process is related with its own intelligence. But human capital needs development and affirmation of an efficient infrastructure (management capabilities, advanced technological processes, information systems, intellectual property, etc.), valuable relationships established by other organizations, companies, individuals, etc., components that form the capital of social relations (relational capital). As prerequisites, human capital requires, among others, an advanced training educational system, a stimulating internal and an external environment.
INFORMATION SOCIETY AND KNOWLEDGE
Understanding knowledge at country level is reflected also in their development stages. Developed countries, with easier access to markets increase their economic performances. On the other hand, the poor developed countries remain isolated from this point of view, without access to the latest information and progresses in science, culture and economy. We have also the case of emerging countries’ national policies are focusing on research and development sector, and it becomes evident at global level. They understand that research and development represent the source of knowledge. If the end of end of 20th century was dominated of US, EU and Japan on the market of global research, the long domination was eroded by emerging countries. Asia’s share in global spending for research and development increased from 27% to 32% from 2002 to 2007, being especially driven by China, India, South Korea, as UNESCO reports in 2010.
Analysing the period 2002-2008, America’s share in the Thomson Reuters science citation index - best-known database of research publications - fell from 30.9% to 27.7%. Meanwhile, the number of Chinese publications recorded in the same index has doubled. Brazil’s experience is similar. Research and development expenditures increased strongly in the last decade, at global level, from 790 billion to 1.1 trillion dollars, respectively an increase of 45%.
Information society brought the advantage of research and development findings that do not remain within the borders where they appear. Knowledge becomes a public asset for which national borders have low relevance. They are present in all fields of activity, being facilitated by means of information transmittance. The effects can be found at multiple levels and appear under various forms. The shift of economic structure from resources, processes, products and materials distribution systems, towards resources, processes, products and symbolic distribution systems means, in other words, an economy that relies more on converting information and knowledge than on converting material goods. According to European institutions, knowledge society is required to substitute natural capital (non-renewable, such as ores), and man-made capital (physical capital, financial assets) with human capital and social capital (inexhaustible resources). The social capital (of social relations) is defined as a set of values and informal norms shared by members of a group that foster cooperation among them (Fukuyama, 1999, pp. 10). At conceptual level, Nicolas Georgescu-Roegen (1996) introduced the notion of entropy and neg-entropy in the economic process. The ratio of these may be similar to the ratio in conventional economy based mainly on non-renewable resources, hard economy and in new economy based on knowledge, soft economy. An interesting development of the concept of neg-entropy (the software side of it) belongs to a Romanian specialist in this field, PhD Professor Paul Bran. In his opinion, neg-entropy is a contribution to forming value-added products and services, therefore adding knowledge in the production factors is justified.

The USV Annals of Economics and Public Administration Volume 15, Issue 1(21), 2015
42
Through knowledge (neg-entropy), the human factor is brought into the centre of economic activity, contributing, for example in Japan, to 80% of national wealth, 60% in the US and 20% in Australia and Canada. Rates of investment income directed towards development of human resources, in the context of IT and ICT, are more than two times higher than those directed towards investments in factories, production equipment. Economic growth rate is three times higher in countries where knowledge attributes are present, than in those where knowledge is generated more difficulty (by their own participation or by purchase). The market gains other dimensions in case of trading intangible assets (principles, management methods, software, etc.). Global partnerships are set up either among companies, or among employees of the same company, which can reside in any part of the world, depending on the parent company. Such activities are organized in the fields of marketing, consultancy for industrial design, financial services, research in engineering, agriculture.
If knowledge industry sectors are ranked based on the volume of expenses for research and development, then 8 sectors receive 80% of the total expenditure for research and development in developed countries, namely: pharmaceutical products, electronics, computers and office equipment, aerospace industry, vehicles, electrical machinery and instruments (medical, measurement, optical, photography, clock). The specialization degree of a country in products of modern knowledge can be assessed by the number of invention patents registered in that country, or at the European Patent Office or at United States Patent and Trademark Office. Companies, corporations in the industrial field have their own research and development activities and by foreign subsidiaries they extend their influence on the market of patents, evaluation of knowledge potential of the host country and any potential turning into value. Human capital formation, component of the knowledge society is not only the product of the national training systems or activities of companies, corporations, academic environment. The competitive advantage brought in developed countries, including South Asia, is linked to human resources capital. Those societies started with generating a knowledge-based state of mind, mixed with investments and a motivational environment generated outputs that represented key factors in their countries development. Globalization of knowledge boosts knowledge output – the pilar for the emergence of knowledge society. As effect of globalization, it may include migration of experts from abroad, through various forms of association (from collaboration to recruiting, ‘brain theft’, immigration, scholarships awarded to exceptional pupils and students). There are also countries with certain vocation in the field of knowledge. India, for example, provides a lot of experts to the globalized space of knowledge. CONCLUSIONS
This paper wants to prove knowledge society is a tool that could improve living standards inclusively, because it empowers not only individuals but also societies – people becomes more interconnected, with more access to global socio-economic dynamics. In developed countries, easier access to markets increases their economic performances. On the other hand, the underdeveloped countries remain isolated from this point of view, without access to latest information and progress in science, culture and economy. Information and communication technologies act in two different directions, encouraging development of society. First direction is a better communication about products, services and culture; second direction is the fact it represents the key which gives access to information. According to those assumptions, we can conclude both directions can be used, on one hand, to break borders between countries and generations and to accomplish globalisation both of economy and of human society, on the other hand. For example, 7.5% of the EU companies’ patents are converted into products into their US subsidiaries and 11% of US patents come from subsidiaries of US corporations located in Europe, EU-US technology flows forming three quarters of the international technology flows.

The USV Annals of Economics and Public Administration Volume 15, Issue 1(21), 2015
43
Knowledge brings an organisational structure of information, divided on certain criteria and with specific proprieties which require specific support systems. In fact knowledge, more than information, improve quality of life, supporting individuals in their activities but also in their decisions. The problem of modern individual is invasion of knowledge, also quantitative and qualitative, but knowledge society gives it the solution to organise those information, in systematization and management of available knowledge, taking in consideration specific proprieties and processes. Another future topic that could highlight in the future the importance of knowledge is its relation with the sustainable development, because – according to specialists – global context of knowledge helps us to measure economic but also environmental performance. In the global context, analysing model of knowledge based economies, where knowledge was the key factor on their development, combined with others inputs ( capital, labour), and is generating the competitive advantage regarding the produce goods and services on the global market. Knowledge generates also increased productivity and competition on the global market, state of affairs individuals can only benefit from. BIBLIOGRAPHY
1. Becker, G. (1994), Comportamentul uman - o abordare economică, Editura AII, Bucureşti, p. 217.
2. Bran, F., ( Coordonator) (2012), Globalizarea.Manifestări şi reacţii, Editura Economică, Bucureşti
3. Bran, P. (2010), Managementul prin valoare, Editura Universitară, Bucureşti 4. Dobrotă N. (1994), Dicţionar de economie, Editura Economică, Bucureşti, p. 86 5. Fukuyama F. (1999), The great disruption. Human and Natural Reconstruction of
Social Order, The Free Press, New York 6. Georgescu-Roegen, N. (1996), Legea entropiei şi procesul economic, Editura Expert,
Bucureşti 7. Suciu, M.C. (2008), Activele intangibile şi capitalul intelectual - factori-cheie şi
convergenţi, in Convergenţa economică, Iancu Aurel coord., Editura Academiei Române, Bucureşti, pp. 242-287
8. http://europa.eu./int/infonnation-society/index-fr.htm 9.

The USV Annals
of Economics and
Public Administration
Volume 15,
Issue 1(21),
2015
44
GENERAL CONSIDERATIONS ON INDUSTRIAL PROPERTY
RIGHTS AND THE ROLE OF PATENT ADVISOR
AssociateprofessorPh.D.GabrielI.NĂSTASE
„DimitrieCantemir”ChristianUniversity,Bucharest,[email protected]
Ph.D.StudentBogdanPASCU
TheBucharestUniversityofEconomicStudies,Bucharest,Romania
Ph.D.StudentCarmenGeorgianaV.BADEATheBucharestUniversityofEconomicStudies,Bucharest,Romania
Abstract:
Patent advisor must have extensive experience in industrial property activity in order to analyse together with the inventor of all aspects related to the invention, both during drafting documentation and during its review by the Office of Inventions, and then, throughout the period of validity of the patent. Key words: research, development, innovation, patent, patent advisor, technology transfer, recovery.
JEL classification: K11, K42, O34
INTRODUCTION Valuable and useful technical solutions, the result of creative work, need legal protection on
the territory of a country or by its prospects of marketing, in other states too. Scientific and technical creative activity involves a series of concrete actions related to inventions law of that country, but especially to the way in which technical solutions are analysed in view of selecting patentable elements and drafting documentation for patent application for the Office of Inventions.
A basic document in this sense is the description of invention that represents the main element, embodying all technical creation of the inventor (Năstase, 2013). This document should be written according to the rules issued by the Office for Inventions of a country, must present clearly and precisely the elements of the invention and, especially, contain a chapter of claims including all new patentable elements so as to not allow a third person (natural or legal) to develop a so-called "bypass" patent.
CONTENTS A well written description of the invention, with novelty claims filled in, shall avoid during
the term of the patent application and then during the patent life (in case of granting the patent), a number of complications. We consider both pre-screening process and substantive examination, and also in case of disputes on novelty elements, in case of infringement of rights, or for license invalidation or in other situations relating to a patent. And as always in life, the inventor must have an advisor, a support and counsellor in this activity to protect his invention.
And this is more as in general inventors are thinkers in the technical field and sometimes with less knowledge and less practice in industrial property protection legislation. This need to support the inventor has determined the occurrence of patent advisor, or as it is called in some countries patent agent who is the first advisor to the inventor. This should have a solid technical background and be well acquainted with the laws of inventions.
Patent advisor must have extensive experience in industrial property activity in order to analyse together with the inventor of all aspects related to the invention, both during drafting documentation and during its review by the Office of Inventions, and then, throughout the period of

The USV Annals of Economics and Public Administration Volume 15, Issue 1(21), 2015
45
validity of the invention patent. This paper presents the entire flow necessary for obtaining an invention patent, since the emergence and development of the invention, the preliminary submission to the Office of the invention, the patent application being examined and the validity of the patent.
This paper presents also comments on special circumstances occurred either because of provisions of national law on inventions, or by other causes. At the same time, it highlights the role of patent advisor involvement as first counsellor of the inventor and patent owner. Apart from drafting clear and complete description of the technical solution, patent advisor is one that, from the beginning, throughout the flow of patenting shall consult with the inventor or patent applicant on how would be best to exploit the invention.
If marketing shall be abroad, it is also the patent advisor who is aware of international regulations and conventions to which Romania is a party, and shall analyse the patent procedure abroad, the number of countries on which territory the technical solution should be protected and shall decide how the technical solution to be protected with minimum expenditure from the inventor. In the same time, the patent advisor is someone who, as shown in the paper, must support the inventor or patent owner to draw up the contract of sale of the invention, whether it is sold partially, totally or on limited periods.
In case of disputes or during the examination, the patent advisor is the one who, together with the inventor or invention owner will explore all aspects of these processes and will produce a response as required by law and in the same time, very well technically substantiated.
This paper includes and exemplifies these activities of patent advisors, that we believe represent new elements in our country, as this specialty is relatively recent. A patent advisor must be, in some cases, the counsellor of inventor or invention owner. These cases generally refer to paternity disputes, compulsory licenses, etc. or litigation between the parties that shall be heard in a legislative body.
In other words, a patent advisor must be a lawyer representing the client and pleading in court.
This work will be the guide, first for inventors, indicating how a technical solution should be analysed and especially on how to deal with different situations arising during the life of a patent. It must also be a guide for those working in the field of industrial property as direct "advisors" to inventors - patent advisors - and indicate their optimum way to be followed for complete protection of the invention and for the best possible marketing thereof.
In our country the law regulates inventions and inventions issue is completed and cleared by the Application Regulations of the Law on invention patents.
The paper uses the patent advisor name instead of industrial property advisor in order to emphasise that the work is limited only to advisors’ activities and tasks in protecting inventions, which is only part of industrial property protection.
The concept of property is quite large and is discussed in detail in the science of law, but we will use a few items to decide on the concept of industrial property, which includes the invention too. A direct link is between the concepts of property and owner, which is the rightful owner of material and intellectual assets.
The owner has the exclusive right to use such property without authorization of someone else and has the right to sell or leave as inheritance to his successors. Such material assets may be household goods, animals, cars, land, houses etc.
These achievements are the result of intellectual effort of the expert in that field of activity. Here the notion of property indicates the ownership of work created, its real author, the one who made it, no matter whom the right is transferred to, on one way or another, in order to exploit it or turn it into value.
These achievements are not limited to art, painting, music, literature, and art but also to technical field, where the creator can provide new solutions to eliminate all or part of existing gaps in global state of the art, in a particular field.
Thus, two main branches of intellectual property are outlined, namely:

The USV Annals of Economics and Public Administration Volume 15, Issue 1(21), 2015
46
- Literary and artistic property; - Industrial property. In literary and artistic property are included all work in this area, regardless of the mode or
form of its expression. Examples would be books and other writings, lectures, musical, choreographic works, dramatic works, achievements in the video field such as cinema, television works, photography, applied art, paintings, sculptures and more. In the field of literature can be included translations or other transformation of literary works and literary collections.
Protection of these creations or copyright is governed by the laws of the respective countries and refers to the fact that, in general, certain uses of works are considered illegal if they are made without the authorization of the copyright owner.
Examples of copyright infringement can be mentioned: copying or reproduction of works of art without the author's consent, development of films adapted from literary or musical work, the right to translate literary works and others.
Protection of these achievements is done both by legislative provisions of those countries and international conventions such as the Berne Convention for the Protection of Literary and Artistic Works, signed on 9th of April 1886 has been revised successively which over the years, being in force at present.
Romania is a member of the Convention and it is good to note that in accordance with the provisions of this Convention each of the member countries shall be granted the same copyright protection to nationals, in accordance with the law of each country. The Convention establishes the duration of copyright protection and contains special provisions for developing countries.
Industrial property
As mentioned previously, industrial property is part of the Intellectual Property and includes within its sphere, in the first place the “invention” that will still be the main subject of this paper. Also, at “Paris Convention for the Protection of Industrial Property” it was considered that part of the industrial property objects beside the inventions are also utility models, industrial designs and models, trademarks, factory marks and service marks, commercial denomination, indications of origin and original denominations, as well as repression of unfair competition, and by the treaty of Washington DC on 26th of May 1989, in the field of industrial property was also integrated the Protection of Integrated Circuit Topography.
Patentable invention
The invention is considered as the main engine of science and technology development and is the one containing the most advanced notions of human intelligence, representing the main link to the introduction of technical progress in economic and social life. It is generally observed that in countries with highly developed industry, the number of inventions is particularly high as compared with other countries, such as those under development, where the number of inventions is lower, being directly correlated with the degree of technical development. It is necessary for an inventor to have a rich experience and a better knowledge of specialized issues in the field. These two conditions allow a specialist with inventive spirit, to achieve truly new and valuable things and not to work for things that were already done by others, before him. Therefore, the work of invention is a particularly laborious one and generally requires many hours of hard work by the inventor.
The concept of the invention has been defined somewhat differently by the laws of states and therefore we seek to outline the elements contained within the sphere of this concept.
Thus, in 1979 the World Intellectual Property Organization (WIPO) has developed a model of law for inventions in developing countries, not mandatory, where invention was defined as a solution of an inventor, that applied, allows approaching a specific problem in the field of technics.
Japanese law, which is considered as compared to other countries, superior to the laws in the field of inventions, defines invention as very advanced creation in technical field, by which a law of nature is used.

The USV Annals of Economics and Public Administration Volume 15, Issue 1(21), 2015
47
It is appropriate to point out that national legislation of 1974 on inventions and innovations defined inventions as a "scientific or technical creation," presenting novelty and progress over the prior stage of world technics, which has not been patented or made public in the country or abroad, represents a technical solution and can be applied to solve problems in the economy, science, health care, national defence or any area of economic and social life.
Finally, the current law defines a patentable invention as new solution, result of an inventive activity which is susceptible of industrial application.
In this definition, we observe an approach to the definition proposed by WIPO. The invention as object of industrial property is protected by invention patent, called in
other countries as patent. It should be emphasized that sometimes instead of the invention the object of industrial property is presented as the invention patent. It should be understood that the patent is only a document, issued by the Office of Inventions in most countries, in the name of the government of the country for the establishment of an invention protection.
The fact that the invention is object of industrial property and not the invention patent, which is only a document, is highlighted by the majority of the laws on invention of different countries, including law on inventions in our country (Condratov and Hapenciuc, 2012).
The defining elements of an invention, disclosed in the various definitions of the invention mentioned in the laws of some countries, can be materialized by some elements that are found in all laws.
Thus, a first element is the novelty at the world level. This means that by the time the patent application to the Office of Inventions nobody else has published a technical solution similar to that for the patent (Mehlig Sweet and Eterovic Maggio, 2015). By making public a technical solution means either the publication of a patent application for a similar solution before or the publication in a magazine or in any other publication or presentation in an exhibition or television or even in a case study news. Therefore, it is recommended that for a new technical solution, to submit as quickly as possible the documentation at the Office of Inventions to protect it by a patent.
Therefore it is clear that the date until which the novelty condition of a technical solution is the date the patent application was filed with the Office of Inventions.
However, there is a situation when the date by which the novelty of technical solutions is examined, for those who demanded protection through an invention patent, to be prior to submission at the Office of Inventions, i.e. the date of filing the application.
This solution is governed by the Paris Convention to which our country is a party of. Thus, an innovation patent was requested for a technical solution at an Office of Inventions of a country member of the Paris Convention and then within 12 months a patent for the same technical solution was requested at another Office invention of another country, member of the Paris Convention, in the request indicating the priority of the first filing, the research and technical documentation will be made at the second office only until the first filing is considered as deposit legally constituted.
Thus, no technical solution that became public between the date of the deposit and the second deposit cannot be regarded as destructive of novelty for the second, because date of depositing is considered the date of first depositing.
Moreover, if in this period between the establishment of the first depositing in the first country and the establishment of the second deposit in a second country invoking the first depositing in the second country, a third party requests a patent for a technical solution similar to the application submitted before the end of the second deposit that was set as priority, this request will be rejected, because according to the priority given by the provisions of the Paris Convention, to which priority is claimed, the date of depositing the two patent applications is the date of first depositing.
These situations will give rise to many analyses in this paper, analyses directly related to the activity of the patent advisor.
Inventions patents granted for technical solutions generally fall into two groups, namely: product patents and process patents. For example, a patent for a product may refer to an extraction pump or a new chemical substance, and the patent for the process relating to a process for the

The USV Annals of Economics and Public Administration Volume 15, Issue 1(21), 2015
48
manufacture (for example, of a chemical substance). Often, we find patent relating to a process and device or a new material and process for its manufacture.
In fact, when asking for a patent for a new product, it is mandatory to indicate the manufacturing process of this product.
In general, both the product and the manufacturing process being new, the patent is granted for both product and process.
If an inventor will create later a new manufacturing process of the product in terms of purity or higher simplifying the technological process, he or she will be granted the patent only for the process that is new, the product is no longer new, as it was done previously and is no longer a novelty.
A second condition found in the laws of other countries, as well as in inventions legislation of our country is that the technical solution to present progress in relation to the known solutions worldwide in the field. In some cases this condition is called inventive step or as Japanese calls it, a "more advanced technical idea".
This notion of "more advanced" is met also in the case indicated by World Intellectual Property Organization (WIPO) above.
Let us consider then why in some laws of invention, as is the case of our country, it is specified only "new solution resulted from an inventive activity and that is susceptible of industrial application". If we analyse this text, we observe that the element of technical progress is contained in the concept of "inventive activity", meaning a better solution than that found in the prior known technics. This is not merely because it is new, but by the fact that it embodies the inventive spirit. If this notion is reinforced by the fact that a new solution must have industrial application, technical progress is evident.
CONCLUSIONS In the examination of the application for invention patents many cases were encountered
when, although the technical solution itself was new, meaning unprecedented in bibliographic materials, it did not have an industrial application, or the product obtained for example by a new process had lower characteristics of the product obtained by the method already known, inferiority embodied by the degree of purity, reliability or other conditions of existence of a competitive product on the market.
From here, the applicative value of an invention begins to take shape, whose industrial applicability presents far superior characteristics. Surely, by competition with other technical solutions that will meet the best conditions, there will be the most sought after in the market by manufacturers.
New technical solutions, patentable, must solve effectively problems that were created, generating technical, economic effects and other of effects in order to justify intellectual and material efforts made to obtain them. BIBLIOGRAPHY
1. Condratov, I., Hapenciuc, C.V. (2012), Study regarding the use of multimedia technologies in tourism sector of Suceava county, Revista de turism, 14 (14), pp. 60-65.
2. Mehlig Sweet, C., Eterovic, D.S. (2015), Do stronger intellectual property rights increase innovation?, World Development, 66, pp. 665-677.
3. Năstase, I. G., Lorenţ, A. (2008), Managementul inovării. Inventatori şi consilieri de brevete, Editura AGIR, Bucureşti
4. Năstase, I.G. (2013), Innovation and industrial property rights, Quality – Access to Success, 14, S3, pp.101-109.
5. www.wipo.int

The USV Annals
of Economics and
Public Administration
Volume 15,
Issue 1(21),
2015
49
REGIONAL DEVELOPMENT: ROMANIA’S CASE
Prof.Ph.D.EmilianM.DOBRESCUInstituteofNationalEconomy,Romania
Assoc.Prof.Ph.D.Diana‐MihaelaPOCIOVĂLIȘTEANU“ConstantinBrancuși”UniversityofTargu‐Jiu,Romania
Abstract: Regional development is a concept aimed at boosting and diversifying economic activity, stimulating
investment, contributing to the judicious use of human resources and quality of life. Could be applied to regional development policy were set eight development regions, which comprise all over Romania. Each development area includes several counties. Developing regions are not administrative units not having legal personality, being the result of an agreement between the county and local councils.
Key words: regional development, region development, regional development policy
JEL classification: R00, R11,R58
1. GENERAL CONTEXT
In a centralized economy, the undervaluation and underestimation of the importance of the space factor in the economic calculation resulted in an extensive growth of the productive potential and the concentration of the heavy industry in a few large enterprises located mainly in the large urban areas, the environmental protection being completely neglected. The number of active population in the agricultural area artificially lowered being attracted by the industrial activities in the urban areas. The broad phenomenon of migration of the population from rural to urban areas caused serious social disruption and a huge pressure on the cities in the process of industrialization. Looking back at this situation, it was appreciated that the excessive emphasis placed on reducing disparities at any price, to which was added an investment policy based mainly on the availability of labor force, represented one of the causes of diminishing economic growth during the ninth decade of the past century. The growth rate of industrial production in the underdeveloped traditional counties of Romania over those two decades was impressive. In these less developed areas of the country there were registered production increased a dozen times. In the 80’s less developed counties were obliged to achieve an overall level of production per inhabitant equal to the national average. This massive reallocation of resources led eventually to the slowdown of the economic growth process. It is interesting to note that despite the forced industrialization process and economic growth thus induces, traditionally poor counties of the country (Botoşani, Vaslui, Maramureş, Bistriţa-Năsăud, Dolj, Olt, Giurgiu, Teleorman) continued to be affected by the population migration phenomena, which registered high levels throughout the entire period of the 70s and 80s.
With such an evolution, Romania has ended up in a situation unique in the economic landscape of central European countries. The negative consequences of this failed economic policy promoted by the unique party were felt from the early 70’s; they have worsened in the 80’s and were amplified after the 1990s. The harmful consequences are sensed even today when, practically, almost all the counties are facing economic, especially industrial restructuring.

The USV Annals of Economics and Public Administration Volume 15, Issue 1(21), 2015
50
2. CONSIDERATIONS ABOUT INTER-REGIONAL DISPARITIES
The actual situation continues to reflect the artificial conditions created during the communist regime. If we compare the situation of Romania with the EU members, or with the countries with market economies, it is observed that the level of inter-regional disparities in the case of Romania is lowered. Thus, in the process of “building” on the map of these regions resulted in the end the creation of areas with a homogenous level of development. The only notable exceptions are represented by the regions of Bucureşti-Ilfov, relatively developed as compared with the others and the North – Eastern which is the least developed region economically and socially. Thus, while the average level of GDP per inhabitant in Romania is up to 22% of the European region, the reaches only 38% (at purchasing power parity), while the Northeast region only 20% of average Europe. In relative terms, this is similar to that seen in Greece, Portugal and Spain in the early 90s: a report of the discrepancy between the most developed and the least developed and a low difference in percentage terms than the European average. It is important to note that outside the Bucharest-Ilfov and Northeast that are exceptions, all other regions of Romania presents similar income levels in the context of a slightly higher level of development of the western part of the country, compared with the east.
An ad-hoc map of the regional disparities in Romania allows the spatial localization of the poverty and of the under development, in two main areas of the country: the North – East, that practically includes in full the historical region of Moldavia, and the south, respectively the most expanded agricultural area of the country – the Romanian Plain. Unlike these two areas, the West and the Center of the country are outlined as being the richer and more developed areas, from the standpoint of both the income in the population’s households and of the technical - social equipments and facilities and of the economical potential. Besides the general and global disparities, the analytics have shown a series of details, symptomatic for the tipology of the problems specific to different areas. As main conclusions, we can recall the following:
The counties with the lowest standard of living are located in the two main areas of poverty : first, in a particularly critical situation, is situated in the North - East of Moldavia and it includes the counties of Botoşani and Vaslui, and the second one in the southern plain area of the country and it comprises the counties of Teleorman, Giurgiu, Călăraşi and Ialomiţa. In regards to Botoşani and Ialomiţa, we can say these two counties are characterized by a general state of poverty, with scarce financial resources and high levels of infant mortality, migration and unemployment. The counties in the South, especially Călăraşi, Giurgiu and Teleorman are typical examples of cultural scarcity, according to sociologists, defined by low education and high infant mortality rate caused by poor sanitary conditions.
The underdevelopment of infrastructure and the poverty in the households are revealed by several typical cases, such as the one in Gorj county, characterized by a low level of development (technical and social). Next we find the situation of Hunedoara and Constanţa, where the low standard of living in the households finds itself in contracst with the high level of economical acvities, emphasized through specific indicators.
The study around regional disparities and their evolution must be sustained also by an analysis of the changes that occured within the occupational structure of the population and in the sphere of entrepreneurship. These evaluations bring new aspects and significance in order to better understand regional disparities. The main correlation between economical behaviors and social aspects is represented by the decrease of job availability in the industry. The number of employees in the industrial area was reduced with more than 50% of the overall decrease recorded on the economy.
Over 45% of the companies registered in Romania are located in the 8 most developed counties, totalling 30% of the whole population. Higher values of unemployment are registered in the counties with lower development and a high rate of decrease in number of the people who work in the industry ((Bistriţa-Năsăud, Botoşani, Tulcea, Vaslui etc.). In terms of spatial distribution, we can notice a classification of the spatial distribution , registering major differences between the East

The USV Annals of Economics and Public Administration Volume 15, Issue 1(21), 2015
51
and the South and the central and West area. Most of the poorly- developed counties are located in Moldavia and Muntenia, while the majority of the advanced ones are to be found in Transilvania and Banat. The historical regions of Oltenia and Maramureş are characterized by an average level of development. One of the regions least developed is around the capital, except for the strongly industralized and urbanized area of Prahova county.
Regional disparities reach remarcable values for certain indicators, emphasizing the differences between the economical, social, technical procurement or even the overall standard of living. The most dynamic changes were distinguished among the indicators illustrating both the infrastructire and the socio-demographic categories. Economic indicators were described as having a general downfall in the past 11 years, while the ones highlighting the standard of living have increased for most of the poulation within the same period of time. The positive, most dynamic changes could be seen in the the growing number of owned cars and telephone subscrptions. The urbanization level, expressed as percentage of urban population in total population of a county remained relatively constant, indicating there has been no major displacement from the rural to the urban areas, nor vice-versa.
The most relevant downsize in development has registered in the counties of Mehedinţi, Caraş-Severin and Hunedoara, while Brăila, Dâmboviţa and Ialomiţa have undergone a certain growth. The maximum of stability has been acquired by both the developed regions (Sibiu, Braşov, Cluj and Timiş) and the less-developed ones (Giurgiu, Botoşani, Vaslui, Călăraşi, Teleorman). Regional dynamics in Romania can be portrayed as experiencing increased economical disparities given there has been a general decline in the national economy. Regional changes have evolved following different models in terms of household resources, infrastructure or economical structure. The production of industrial enterprises has suffered the most critical downfall, proving these structures had the least capacity to adapt to changes in the market economy. The speed of the economic reform is the one to ultimately influence the growth, faster or slower, of regional disparities.
Taking into consideration the progress Romania has achieved in adopting the community acquis and its institutional, real implementation on the ground, given its policy to support the less developed regions that are part of the Member States or acceding, the European Commission has decided give assistance in implementing the EU regional policy in our country. Beginning with 2001, Romania should receive annually, for 6 years, 100 million euro from the EU, through programs of regional development. According to the estimations done by the EU, the future egional development programs could help create approx. 50.000 new workplaces, especially in the private sector, particularly sustained by the EU. The government’s contribution to conducting future programs, in partnership with the European Union will be 25% of the total EU funds.
Of the 449 projects approved for funding in the last 5 years, 261 are for developing the local initiative (over 12 million euro in funds), 107 projects address human resource training (3,4 million euro) and 81 are focused in tourism (3,6 million euro). 74% of these projects will take place in the urban environment, but what is significant is that 118 projects address the rural communities and have a total 5,4 million euro allocated, which translates into approx. 2,700 new workplaces. By the end of 2001 there have also been held investments with financial support from the EU, with 8,6 million euro dedicated to developing the local industry, tourism and human resources, sectors in which approx. 3,500 new workplaces will be created and 4,300 people will benefit from training.
Supporting regional development in Central European states to the EU has clear grounds, meaning that any acceding countries must come close to the average level of regional development of the EU Member States. We appreciate, however, that the effects of regional policy in this field are still far from the best and the expected, the institutional mechanisms being still unknown or applied at large scale, and the selection of programs being the least objective, due to strong implications of subjective factors.
Beginning with 2001, Ministry of Development and Prognosis has developed and the Government of Romania has approved by resolution the proposal regarding the concentration of PHARE 2001 – a component of economical and social cohesion – and the co-funding from the

The USV Annals of Economics and Public Administration Volume 15, Issue 1(21), 2015
52
state budget in 11 areas of industrial restructuring with economical growth potential. The population in these areas represents approximately a third of the whole population of Romania. According to PHARE regulations, from the cities belonging to the 11 areas there have been selected, prioritarily, those projects of investment in the public and private sector that are falling under the national regional development priorities according to the National Development Plan, priorities also agreed by the Europeam Commission : development of small and medium-sized enterprises, local and regional infrastructure, social services and tourism development.
The criteria recommended by the European Commission which are found on the basis of the region identification are the following : existence of areas - geographically concentrated - with enterprises in difficulty for different reasons (closure, restructuring, privatization), with high unemployment and serious social problems, problems of environmental pollution, but as well ones that have the potential for growth. Targeting PHARE funds, structural and cohesion funds of the EU, in the established areas sustains and completes the general program of development undergone by Romania, together with the measures taken from January 2001 for improving the business environment - by providing incentives for small and medium enterprises, development and modernization of infrastructure, accelerating privatization, intensifying social protection.
3. STRATEGIC PRINCIPLES AND OBJECTIVES OF THE REGIONAL DEVELOPMENT
According to the medium-term National Development Strategy of Romania, approved in the
Cabinet meeting from May 19th 2000, the strategic pronciples of the regional development target: - at national level: a) promote market economy mechanisms in all regions to improve
competitiveness and achieve permanent economic improvement; b) promote the harmonious development of spatial and localities network; c) increase the capacity of the regions (from an institutional, financial and decision-making point of view) to sustain their own development; d) promote sustainable development; e) create equal opportunities in terms of access to information, research and technological development, education and training
- at regional level : reduce disparities between regions, districts, urban – rural environments, central areas, peripheral areas etc.; b) prevent the occurrence of problem areas; c) coordinate regional development initiatives with national priorities and EU guidelines; d) promote differentiated policies according to regional particularities (monofunctional areas - predominantly agricultural, mining - urban areas, natural and built or protected areas, border areas, areas with environmental problems).
Regional development policy objectives, according to the same strategies, are: reduction of existing regional imbalances, stimulation of balanced development, revitalization of disadvantaged areas, prevention of new imbalances, linking regional and sectoral policies, stimulation of internal and international interregional cooperation contributing to the economic and social progress, further development of special, priviledged relations between Romania and the Republic of Moldavia, strengthening the common cultural and spiritual space in accordance with the norms and values of integration in a united Europe.
The fundamental objectives of regional policy, the institutional framework, the different responsibilities of different institutions involved and specific instruments of regional development policy in Romania are set by the Law no. 151/1998 regarding the regional development in Romania.
The fundamental objective of regional development policy, as formulated by the law, is set around reducing the existing regional disparities, especially by stimulating a balanced development and by accelerating the recovery of those areas left behind in terms of development due to historical, geographical, economical and policitcal circumstances, as well as preventing new disparities and regional imbalances. Another goal set by law refers to the correlation of sectoral

The USV Annals of Economics and Public Administration Volume 15, Issue 1(21), 2015
53
policies of the Government with local and regional initiatives and resources in order to achieve sustainable economic, social and cultural development of the regions.
These processes of stimulating regional activities, of coordinating them with governmental policies, of promoting inter-regional cooperation is an effort to correlate the country’s needs and the needs of geographic regions, as well as economic and cultural.
Regional development processes are placed in the broader context of Romania’s accession to the EU and, therefore, of preparation of necessary institutional structures and capacities to implement EU structural policy after accession
Within the regional policy promoted by Romania, an important role is the deprived areas policy whereby the state budget supports the economic and social development of those geographical areas whose level of development is extremely low due to due to the negative effects of economic restructuring and massive staff layoffs. The purpose of this policy is to revitalize the economy in those areas, by attracting investors. The massive economic decline Romania experienced after 1990 required that the national policy of regional development no longer be thought of only in terms of reducing regional disparities. This objective was accompanied by a more general one, that of supporting the restructuring of regional economy.
According to the europen policy for economical and political cohesion, Romania promotes a regional policy that has set as a long-term general goal diminishing the differences in development between different regions of the country. On a short term, however, the regional policy should focus on countering the negative phenomena (loss of jobs, unemployment, etc.) that appear in the country’s economical and especially industrial restructuring process.
Territorial communities, regional and local ones have not developed sufficient capacity for innovation and have not become more flexible in order to respond effectively to the challenge and the national economy’s requirements for restructuring. Therefore, an important objective of Romanian regional policy is to create conditions for the development of innovative capacity of Romanian local communities, to enable them to adopt new activities that would gradually replace the old, inefficient activities, no longer required on the market, taking into account that in the conditions of economic globalization, the initiative and entrepreneurship are basic premises of regional development.
Along with the concern for the economic retsructuring of the various areas, regional development policy aims to stimulate the competitive ability of different areas by stimulating their ability to adapt to new activities. In this sense it puts less emphasis on the region’s ability to offer and more on the quality and the conditions of the offer, for different regions to be able to accept and develop new activities. To this end, the national policy of regional development – through its main instrument, the National Development Plan – works towards a flexible planning which requires concerted action policies on human resources training, technological development, scientific research, the development of small and medium enterprises etc.
To this end, the national policy of regional development - through its main instrument, the National Development Plan - work towards a flexible planning, which requires concerted action policies on human resources training, technology development, scientific research, the development of SMEs etc.
Flexible planning is a basic concept the national policy of regional development operates with in the current economic conditions. Alligning the structural economic changes and the territorial development is achieved through creating new activities in the territory. Both in terms of exogenous development (using foreign investment) and endogenous development (own resources), national regional development policy promoted by Romania focuses on improving the organization of new activities, acting mainly on the physical and human dimensions of the regions and subregions.
In this context, the main goal of the national regional development policy is to help the regions, counties, different areas, localities, to acquire the necessary means to become able to develop a social and cultural structure, highlighted by the quality of human resources, education

The USV Annals of Economics and Public Administration Volume 15, Issue 1(21), 2015
54
and training, as well as the economic infrastructure (road, rail, maritime, aviation, telecommunications etc.) based on a modern technilogical level.
Regional policy measures are planned and promoted within the institutional framework created by the central, regional and local authorities, in accordance with the principles promoted by the EU : concentration, planning, subsidiarity and partnership.
Creating a regional institutional framework and institutionalizing the eight development regions both aimed at facilitating the regional development policy. It is expected that the regional development plans designed by the Regional Development Agencies have the ability to identify the development priorities of regions and their resources, by creating an appropriate framework for achieving the development goals by implementing regional programs.
Development regions in Romania have not been designed only as planning units for the regional development policy pursued by the EU. In the same way, they are meant to promote national policy measures for regional development.
But, as shown by the experience of other countries, regional institutional system created by formation of macro-regions and the Regional Developemtn Agencies will achieve positive results only in the existence of an active policy of regional development that has adequate financial resources.
In Romania, these resources are concentrated in the National Regional Development Fund, including internal financial resources from the state udget and European funds for regional development.
The key problems whose resolution depends on ellaborating and implementing national policy measures for regional development can be summarized as follows :
- Supporting the regional economic restructuring, in the market economy, have become uncompetitive (having major structural weaknesses). We are refering to the industrialized areas found in economic decline, unable to adapt and cope with competition. The have high unemployment, underutilized production potential, technical infrastructure (including buildings) in the process of deterioration. Also, big problems are raised by areas whose economic base is largely agricultural, and which practices an obsolete type of agriculture, inefficient due to lack of appropriate facilities.
- Stimulating the best use of the combination of endogenous potential of regions, both natural resources and raw materials, as well as human resources to boost regional economies
- Ensuring environmental protection. Errors resulted in the massive industrialization period, when its influence on the environment was neglected, led to the emergence of environmental disaster areas. At the same way, environment quality is extremely poor in most cities, including the capital. For changing this state of things it is imperative to know the regional distinctiveness of this phenomenon. Combating and preventing environmental damage requires funds that are not available at regional or local level and require national support. Create and develop an institutional infrastructure pertaining to the market economy at regional level. One component of this infrastructure is the banking system, the existence of commercial banks, investments etc., to direct their funds to be used for development. It is also necessary to create a network of organizations and institutions to accelerate stock exchange of goods. If in the system of centralized economy the enterprises were subordinated hierarchically to the central sector bodies (ministries), today these bodies that would effectively coordinate the functioning of institutions at county and local levels, are missing or not fully functional. The autonomy of enterprises and creating private enterprises highlighted the need to create conditions for the development of regional and local chambers of commerce and. Also, the local government is a key factor in the administrative infrastructure. They have a role of initiator and coordinator of territorial development. Cooperation between the institutions and authorities within tne three levels: local, regional, national, is the key to maximum effects. Only through this cooperation can a climat beneficial throughout the

The USV Annals of Economics and Public Administration Volume 15, Issue 1(21), 2015
55
country appear. Regional Development Agencies play a very important part in the regional institutional system, being the ones to effectively embody the regional development policy.
- Also the regional market economy needs many other institutions to fulfill important functions. Such institutions can handle consulting, marketing, training and professional training of workers, organizing publicity activities, information etc.
4. CONCLUSIONS The socio – economical analysis of the degree and potential of development, as well as of
the existing issues, outline the following important aspects, that were taken in consideration in the process of structuring the Romanian policy of regional development in European context. In the process of creation and consolidation of competitive economical regional structures, there are and need to be removed some obstacles. It is necessary to grant priority to those projects of major importance for the economical development of the regions. It is imperative to adopt clear, fast measures, inclusively in the case of projects of lower importance, underregionals or even local. To be able to efficiently support the process of integration of Romania in EU and to brin gour country closer to the west european countries, it is necessary to focus the financial support from the state and from the European funds on a few directions of action. We estimate that the rythm of economical increase depends on the way in which the endogenous potential of development of the country and of each component region is conscripted, as well as on the amount of financial support granted to the development priorities established through the National Plan of Development. The processes regarding structural economical transformations need to be accompanied by appropriate social protection measures.
BIBLIOGRAPHY
1. Adumitrăcesei, I.D. şi Niculescu, N.G., (1998), Economia românescă postsocialistă - Încotro? Cum? De ce?, Editura Economică, Bucureşti
2. Apostolache, Mihaela Adina, (2014), Regional Development in Romania – From Regulations to Practice, Procedia Economics and Finance, vol. 8, 2014, p. 35-41
3. Axenciuc, Victor, (2000), Avuţia naţională a României. Cercetări istorice comparate, Centrul Român de Economie Comparată şi Consensuală, Bucureşti
4. Bălăcescu, Aniela, Zaharia, Marian, (2013), The Impact of the Economic Crisis to Employment and Unemployment Rate in Romania Macroregion, Annals – Economy Series, Constantin Brancusi University, Faculty of Economics, vol. 6, pp. 136-143
5. Belli, Nicolae, (2001), Tranziţia mai grea decât un război. România 1990-2000, Editura Expert, Bucureşti
6. Bondrea, Aurelian, (2000), Starea naţiunii 2000. România încotro ?, volumul I, Editura Fundaţiei România de Mâine, Bucureşti
7. Ciumara, Mircea, (1997), Economie, politică şi interesul naţional, Editura Expert, Bucureşti 8. Dobrescu, Emilian M., (2000) Românografia 2001. Bilanţ şi perspective, Editura Compania,
Bucureşti 9. Dobrescu, Emilian M., (2000), Integrarea economică, ediţia a II-a revăzută şi adăugită,
Editura All, Bucureşti 10. Dobrescu, M.E., Avram, S., Zamfirescu, S., "Europeanisation Opportunity for Romania
through Promoting the Social-Economic Regional Development and Diversity", project financed by Directorate General for Education and Culture of the European Commission, within the programme called: "Support for European integration activities organised by the academic world", http://www.houseofeurope.ro/europEN.htm

The USV Annals of Economics and Public Administration Volume 15, Issue 1(21), 2015
56
11. Dochia, Aurelian, (2000), Matricea stilistică a factorilor de producţie. Un nou cadru conceptual de analiză comparată şi măsurare a sistemelor economice, Editura Expert, Bucureşti
12. Frenţ, Gabriela şi Dumitrescu, Ileana, (2000), Stimularea iniţiativelor locale şi dezvoltarea durabilă, Bucureşti, Centrul de Informare şi Documentare Economică, Probleme economice, nr. 14-15
13. Ghibuţiu, Agnes, (2000), Serviciile şi dezvoltarea. De la prejudecăţi la noi orizonturi, Editura Expert, Bucureşti
14. Neagu, Vasile, (2000), Servicii şi turism, Colecţia Economia României, Editura Expert, Bucureşti
15. Odae, Nicoleta, (2000), Oportunităţi şi restricţii ale dezvoltării industriale la nivel regional în România, Bucureşti, Centrul de Informare şi Documentare Economică, Studii şi cercetări economice, nr. 6
16. Păuna, Carmen şi colaboratorii, (2000), Stimularea iniţiativelor locale şi dezvoltarea durabilă, Bucureşti, Centrul de Informare şi Documentare Economică, Probleme economice, nr. 23-24-25
17. Pavelescu, Florin-Marius, (2000), Valorificarea capitalului uman în plan regional, Bucureşti, Centrul de Informare şi Documentare Economică, Probleme economice, nr. 1
18. Perţ, Steliana, (2000), Ocuparea forţei de muncă – o prioritate naţională, Bucureşti, Centrul de Informare şi Documentare Economică, Revista Română de Economie, nr. 1-2
19. Petcu, Constanţa, (2000), Caracteristici ale dezechilibrelor pieţei forţei de muncă în România anilor ’90, Bucureşti, Centrul de Informare şi Documentare Economică, Revista Română de Economie, nr. 1-2
20. Simon, Maria, (2000), Potenţialul uman al României. Repatiţia teritorială şi perspective la începutul secolului XXI, Bucureşti, Centrul de Informare şi Documentare Economică, Analele Institutului Naţional de Cercetări economice, nr. 2-3
21. Surd, Vasile, Kassai, Ianos, Giurgiu, Laura, Romania disparities in regional development, Procedia Social and Behavioral Sciences, vol 19, 2011, p. 21-30
22. Zamfir, Cătălin, (2000), Strategii antisărăcie şi dezvoltare comunitară, Colecţia Dezvoltare comunitară, Editura Expert, Bucureşti * * * România în cifre – 2001, Institutul Naţional de Statistică şi Studii economice, Bucureşti, 2001 * * * Un proiect deschis: Strategia naţională de dezvoltare economică a României pe termen mediu. Documente, Bucureşti, Centrul Român de Economie Comparată şi Consensuală, 2000 * * * Cartea albă a preluării guvernării în luna decembrie 2000, Bucureşti, aprilie 2001, Monitorul Oficial * * * Comisia Naţională pentru Statistică – Mediul înconjurător în România, 1998 * * * Configuraţia actuală a învăţământului pentru minorităţile naţionale din România, 1999 * * * Agenda 2000 - Punctele de vedere ale Comisiei Europene în legătură cu solicitarea României de aderare la UE, Uniunea Eurpeană, 1999

The USV Annals
of Economics and
Public Administration
Volume 15,
Issue 1(21),
2015
57
SUSTAINABLE DEVELOPMENT OF ROMANIAN AGRICULTURE
WITHIN THE CONTEXT OF EUROPEAN UNION’S
REQUIREMENTS
PhD.AssociateprofessorCarmenValentinaRADULESCUTheBucharestUniversityofEconomicStudies,Romania
TheBucharestUniversityofEconomicStudies,[email protected]
Abstract: The rich natural potential for agriculture in Romania is contrasting with the low level of economic
performance. Progress toward sustainable development in rural areas depends on processes that lead to increased valuation of the natural resources by cropping and livestock breeding, capturing more value by growing the number of processing stages performed at national level for food production, improvements in the distribution of benefits with special focus on rural population, harnessing the benefits of stewarding natural ecosystems that play a key role for the overall wellbeing of the population, diversifying the structure of economic activities, and encouraging entrepreneurial involvement. European policies of rural development are supporting most of these processes, but within the national context there encountered specific challenges born by the low level of maturation for property relationships, fragmentation of land ownership and cropping plots, cultural patterns that create strong resistance to change, and lack of financial resources. The paper highlights several aspects in order to assess at what extent the Romanian agriculture is making progress toward European requirements.
Key words: Agriculture, rural development, natural resources, value chains, ecosystem services
JEL classification: O13, O18, Q18
INTRODUCTION The concept of sustainable development means the effect of the integrated approach to
decision-makers and policy, where environmental protection and economic development over time are designed to be complementary and mutually dependent (Scutaru, 2013). World Commission on Environment and Development (WCED), presented in 1987 in the report “Our Common Future” known as the Brundtland Report, for the first time by Gro Harlem Brundtland, the concept of sustainable development as being the development that follows meeting the needs of the present without compromising the ability of future generations to meet their own needs. Both on the short-term as well as on the long-term, sustainable communities need to consider carefully how to value economic resources, without inducing harmful environmental effects and threatening the cultural heritage.
Sustainable development pursues to accomplish simultaneous progress toward three categories of goals – economic, social and environmental. Economic goals include economic growth, equity, and efficiency. Social goals are delegation, participation, social mobility, social cohesion, and social development. Environmental goals are to maintain ecosystem integrity, preserving the economic potential of natural resources, biodiversity conservation and mitigating global issues such as climate change.
Agriculture, as economic sector that relies directly on the use of natural resources, is in the forefront of the sustainability debate and should become the leader of change by promoting innovative technologies and management. The European policy regarding agriculture and rural development integrated many sustainability goals and its implementation is expected to have a meaningful contribution to the development of agriculture by respecting social and environmental restrains. At what extent this processes are occurring in Romania and which are the specific challenges born from the features of the national countryside is questioned and discussed in order to

The USV Annals of Economics and Public Administration Volume 15, Issue 1(21), 2015
58
reveal real progress and to highlight sensitive areas that need more careful approach by central and local authorities.
STRATEGIC COMPONENTS OF SUSTAINABLE DEVELOPMENT
Sustainable development embodies the vision of a society that is able to solve the major social and environmental challenges within a continuous economic growth delivering prosperity and wellbeing more effectively (Bran, 2014). Therefore the pillars of sustainable development, acknowledged as the triple bottom line or people, planet profit, are economic growth, social inclusion and equity, and environmental protection. Hence, the goals of sustainable development could be stated as:
- Economic goals: growth, efficiency; - Social goals: equity, participation, mobility, cohesion, social development; - Environmental goals: lower carbon footprint, ecosystem integrity, biodiversity, healthy
environment, regeneration of natural resources. In order to achieve these goals there are necessary important changes compared to the
current state of economic activities. These changes involve decisions made in a strategic framework and are known as the strategic components of sustainable development, namely:
- Management of production and services; - Resource management; and - Change management.
Fig. 1 presents the activities involved by each strategic component.
Fig. 1 Strategic components of sustainable development Source: Rojanschi, V., Bran, F., Grigore, F., Ioan, I. (2006). Cuantificarea dezvoltarii durabile, Bucharest: Economica.
Sustainable development means an agreement between economic growth and social and environmental protection, detaching it from them present satisfaction and social development perspective.
The progress toward sustainable development is far slower than the conceptual evolution. Despite several decades since its proposal and widespread acceptance, the goals of sustainable development are still very distant from the realities, especially in developing countries. The Millennium Development Goals project, although ambitious and highly operation reveals that accomplishing sustainability goals is difficult. This process was considered of common interest and it was managed mainly by governments, at least at strategic levels. Experience proved that such

The USV Annals of Economics and Public Administration Volume 15, Issue 1(21), 2015
59
interventions are necessary, but will not be enough to avoid irreversible changes threatening humankind from both social and environmental perspective.
AGRICULTURE AND SUSTAINABLE DEVELOPMENT AND THE EUROPEAN REQUIERMENTS
The concept of sustainable development of agriculture involves many definitions, but all must include the human dimension in addition to environmental protection. Agriculture is amongst the most ancient human and economic activity addressing the basic need of food. Its productivity controlled the social development for centuries by saving time for more and more diverse human activities that underpinned knowledge development. Currently, agriculture is still a major sector with important social impact, since in developing countries most of the population works in agriculture. Further, the production process has a direct impact on food quality and safety triggering other social implications by health issues. Hence, the human dimension of sustainable agriculture implies complying with the following conditions:
- Sustainable farming technologies should be applied by farmers if these lead to less material losses and if they have access to specific technologies;
- Consumers demanding for safe food products are able to recognize these products in order to make an informed decision that expresses their commitment to support certain qualities of the products and production processes. Agriculture is closely linked to the environment, its production being delivered by
biological processes within technology driven ecological systems. Despite advancement in technological development major resources such as soil and water remain limiting factors since large scale production cannot be deployed without them.
Sustainable agriculture involves technological changes, but most importantly managerial changes. Technology should maintain productivity while reducing environmental impact, while managerial changes should improve the economic accessibility of food in a world where more than one billion people is still suffering by hunger. Innovation created major productivity leaps, but these were accompanied by similar growth of environmental damages. Therefore one of the dilemmas is how to steer innovation within the limits of the people, planet, profit framework.
The progress of agriculture toward sustainability could be assessed by using a number of indicators, out of which we selected the followings:
- The share of fixed capital used in agriculture in total fixed capital nationwide; - The share of agriculture in total investments made investments nationwide; - The share of agriculture in total energy consumption in the country's energy consumption. - The share of agricultural land in the country's total land fund - higher share for agriculture
(arable, vineyards, orchards) in total land fund of the country; - Agriculture’s contribution in GDP.
The European Union, as pioneer of environmental and sustainability initiatives at global level, considers agriculture of major interest in this respect. The Common Agricultural Policy was amongst the first strategic approaches that integrated social and environmental restrains for intensive production. Several priorities of the rural development are clearly targeting sustainability, while the others include sustainability goals as compulsory objectives to be accomplished with the specific ones. For instance, the strategic goals of the rural development include sustainable management of natural resources and mitigation of climate change to be accomplished by targeting as priorities:
- Restoration, preservation and strengthening of ecosystems that are related to agriculture and forestry;
- Promoting the efficient use of resources and supporting the transition toward a low carbon emission and resilient agricultural, forestry, and food economy;
- Promotion social inclusion, poverty reduction and economic development in rural areas.

The USV Annals of Economics and Public Administration Volume 15, Issue 1(21), 2015
60
Farmers and rural entrepreneurs will be supported in activities such as: afforestation of agricultural and non-agricultural land, voluntary agro-environmental commitments; voluntary application of organic farming systems; voluntary exploitation of agricultural areas hindered by various natural hazards.
ROMANIA’S AGRICULTURE AND THE EUROPEAN SUSTAINABILITY GOALS
Romania outstands within the European agricultural economy by the high potential of its natural resources, but also by the low level of productivity. The most fertile soils, such as chernozem, varied structure of the agricultural land by relief and climate, richness and availability of water resources, low level of industrial pollution are the main indicators of this potential. On the other hand, these lands’ yields are far less than the ones gathered in France, Germany, Italy, Spain etc. although a quite large proportion of the population are working in agriculture (Voicu and Radulescu, 2015). Disparities of technological endowment, training, and inputs within an unstable political context that failed to succeed in achieving strategic goals are pointed most frequently as the causes of the low performance. Meanwhile, this is also interpreted as a good potential to make a leap toward sustainability since the natural capital was less depleted than it was the case of states where to most intensive technological solutions were applied. In relation to the European Union, Romania is a medium-sized country with an area of almost 24 million hectares and a population of almost 20 million inhabitants. The landscape is varied, being almost evenly divided into mountains, hills and plateaus and plains. Romania has a temperate continental climate. More quantitative milestones are the followings: 62% of the total is land for agricultural purposes (about 15 million hectares). Out of this, 64% is
arable land used for crops such as cereals, rapeseed, sunflower, soybean, vegetables etc., accounting for 0.45 hectares per capita. This situates Romania as 5th in Europe; 23% of the agricultural land is natural and semi-natural pasture; 10% grasses for fodder production; 3% is land used for plantations, nurseries and orchards. (fig.3);
26% of the surface is represented by forest (about 6 million hectares), out of which 3% is occupied by primary forests and secondary forests and 97% forest land;
4% of the total (about 0,8 million hectares) is occupied by surface water bodies, including the continental shelf of the Black Sea.
2% is degraded or have very low productive potential. 6% is occupied by land used for infrastructure.
Fig. 2 The structure of Romania’s territory by categories of use
Source: own representation using INS data

The USV Annals of Economics and Public Administration Volume 15, Issue 1(21), 2015
61
Fig. 3 The structure of Romania’s agricultural land
Source: own representation using INS data According to the National Strategy for Sustainable Development agriculture is in a state of
decline due to unfair division of property, machinery and equipment with poor facilities, reduced use of chemical or natural ingredients and pesticides to the drastic reduction of the irrigated area, soil damage and lack of a functioning system of agricultural credit. Compared to other developed countries of the European Union, food consumption in Romania is declining for meat, milk, eggs, fish and certain vegetables and fruits, but instead shows an increase in cereal products.
The progress toward the ambitious sustainability goals of the European Union is fostered by a far reaching program designed by EU institutions and adapted to the local characteristics of agriculture and rural area. This is the National Program for Rural Development that faces now the second financial stage covering the period of 2014-2020. According to this program the goals to be achieved are expressed in terms of competitiveness, resources, and people and society (Hapenciuc et al., 2012).
Competitiveness is to be accomplished by strengthening research, technological development and innovation; improving access to information and communication technologies and the use and quality; improving the competitiveness of SMEs, the agricultural sector and fisheries and aquaculture sector. Regarding the first thematic objective, financial support will be granted for the analysis and research in agro-food and forestry fields by formation of groups operating in the European Innovation Partnership Agricultural Productivity and Sustainability, made up of farmers, foresters, researchers, consultants, companies, etc. So in this way are supported pilot projects, new product development, practice, processes and technologies, transfer of good practices.
With respect to improving the competitiveness of SMEs, the agricultural sector and fisheries and aquaculture sector there will be supported the investments for processing and marketing of agricultural products from the companies that process raw materials and aquaculture production by investing in processing fishery and aquaculture products (Pilato, 2014).
The resource related goals envisage: - Supporting the transition to a low-carbon economy in all sectors; - Promoting climate change adaptation, prevention and risk management; - Protecting environment and promoting efficient use of resources.
There are financed investments in agricultural holdings and bio-fuel production, and investment in achieving biomass and other renewable energy types, with farmer’s beneficiaries or other undertakings.
Protection of the environment and promoting resource efficiency will be accomplished by investments for reducing energy consumption in the agro-food sector. This component is divided into:
- Promoting employment and supporting labour mobility; - Promoting social inclusion and mitigating poverty by investments in education, skill
development and lifelong learning. There is also the European Union Programme for Employment and Social Innovation which
supports financially the practice of reform ideas and to develop best practices to scale up as helping

The USV Annals of Economics and Public Administration Volume 15, Issue 1(21), 2015
62
to accomplish the Europe 2020 goals. European programs support training for improving the correspondence between skill needs and productivity toward increased social inclusion.
CONCLUSIONS The patterns of the economic interactions are to be changed by applying the measures
designed for supporting sustainable development. All sectors of economy will undergo changes although some of them will be more transformed than others (Nastase and Kajanus, 2009). Agriculture is one of the sectors that will fall in the first category due to its close relationship with the natural processes that control the regeneration of the resources. The transformations will occur in technology, management, but mainly in economy since the most important limitation of food availability is not the physical access, but the economic one.
Romania’s agriculture could be amongst the most productive ones in Europe if the status of the natural resources is to be considered. In fact, however, Romania’s agriculture is low performing and fails to be attractive for strategic investors (Hapenciuc et al., 2014). The European focus on both social inclusion and environmental protection created opportunities to harness the drawbacks of transition that reduced the chemical inputs and the environmental impact of intensive agricultural technologies.
REFERENCES 1. Bran, F. (2014). Entropy based strategies for the valuation of natural resources, Quality
– Access to Success, 15 (S1), pp. 25-31. 2. Hapenciuc, C.V., Morosan, A.A., Crudu, E. (2012). Factors that influence the absorbtion
of European funds, in C. Bratianu, G. Bratucu, D. Lixandroiu at al. (eds) Business excellence challenges during the economic crisis, 1, pp.225-229.
3. Hapenciuc, C.V., Stanciu, P., Morosan, A.A. (2014). The economic impact of the SAPARD programme on the tourism supply in Suceava county, Amfiteatru economic, 16 (8), pp.1327-1339.
4. Nastase, C., Kajanus, M. (2009). The impact of the global crisis on SME and entrepreneurship behaviour – Romania and Finland cases, Amfiteatru Economic, 11 (25), pp.751-763.
5. Pilato, M. (2014). Structural policies and funding priority in regional development of the European Union, Quality – Access to Success, 15 (S1), pp. 146-153.
6. Rojanschi, V., Bran, F., Grigore, F., Ioan, I. (2006). Cuantificarea dezvoltarii durabile, Bucharest: Economica.
7. Scutaru, L. (2013). Economic development versus sustainable development, Ecoforum, 2 (1), pp.35-40.
8. Voicu, R., Radulescu, C.V. (2015). Improving agricultural productivity and possible implications in the relations of this branch with the natural environment, Quality – Access to Success, 16 (S1), pp. 17-22.
9. * * * (2008). National Strategy for Sustainable Development Horizon 2013-2020-2030, Ministry of Environment, Waters and Forests.
10. * * * (2014). National Program for Rural Development 2014-2020, Ministry of Agriculture and Rural Development.

The USV Annals
of Economics and
Public Administration
Volume 15,
Issue 1(21),
2015
63
SUSTAINABLE ECONOMIC GROWTH AND ECO-EFFICIENCY
AssociateProfessorPhDMarianaLUPAN
'StefancelMare'UniversityofSuceava,[email protected]
LecturerPhDAngelaNicoletaCOZORICI
'StefancelMare'UniversityofSuceava,[email protected]
Abstract:
The current economic and social contexts have brought forth the issues regarding growth and sustainability. The concept of growth has always been linked to an increase in consumption levels, and this inevitably led to pressures on the environment and on the resources that support human activity. Given these circumstances, the question whether we can avoid an environmental disaster while maintaining economic growth, has become more stringent.
We chose to approach this aspect by examining the concept of eco-efficiency, a concept that embodies aspects of both economic efficiency and environmental efficiency. Eco-efficiency can be regarded as the effectiveness with which resources are used in order to create products and services that satisfy human needs. Based on this idea, the last decade has produced an increasing number of studies on eco-efficiency and how it can be measured and implemented in the production of goods and services, but also in the field regarding demand patterns. An analysis regarding the aspects of eco-efficiency at the macro level of the Romanian economy is in line with the current environmental concerns, thus I have chosen to cover these questions, as well as the evolution of the locale economy towards a more sustainable development. The outcome of the examined aspects shows that, in spite of an increase in eco-efficiency levels, energy and material consumption and emissions have increased. This raises the question if measuring economic and environmental efficiency by reporting to the GDP value is becoming obsolete and if there is a need to revaluate eco-efficiency indicators in order to measure the transition to a greener and more sustainable development from different points of view.
Key words: sustainability, eco-efficiency, economic growth, environmental efficiency, sustainable development
JEL classification: O13, F43, F55
1. INTRODUCTION
From the historical point of view, the concept of economic growth has always been closely linked to the growth of the consumption levels, and this fact has led to unprecedented pressure for on the environment and on the resources that are available to the modern world. During the post-war period, when there were numerous approaches to the concept of the economic growth (economic progress, technical and scientific revolution, organization and management of the labour factor), the natural resources were seen as free goods (with zero costs and in unlimited quantities). Thus, acting in the spirit of the theories and models of economic growth in that period, the world countries, especially the economically powerful countries, have created the conditions for entering into the crisis of this model of economic growth. In these circumstances, since the 1970s, there has arisen the question whether the measurement of the economic growth, strictly in terms of GDP, should be replaced by a "balanced" economy, operating within the limits of growth, naturally imposed by the environment.
However, "growth arrest" did not win the political support, and in the 80s there has appeared the concept of exploring the idea of decoupling the economic growth from the negative consequences on the environment and to combine the long term environmental sustainability with the need for economic growth.
Given this paradigm, for maintaining the world economic growth same time avoiding the production of an ecological disaster is appropriate to amend the current concepts and values, to change the structures, to relocate the economy and life, a profound modification of the current mode

The USV Annals of Economics and Public Administration Volume 15, Issue 1(21), 2015
64
of goods consumption is necessary, in an attempt to build a sustainable society. One of the concepts that incorporate these factors is the eco-efficiency concept which has its roots in the concept of sustainable development, its primary objective being the sustainable use of the natural resources.
The global natural capital is limited and exhaustible, and the use of resources in a more effective way that does not endanger the environment and the welfare of the next generations is proving to be an imperative requirement under the conditions of the current global crisis which threatens not only the economy and the financial world, but also calls in question the future of all systems which form the modern world.
There is therefore a question mark on the efficiency with which the resources are used, on the profitability and sustainability of production, and the concept of eco-efficiency is the increasingly seen as an answer to this problem.
2. ASPECTS REGARDING THE SUSTAINABLE DEVELOPMENT AND THE
ECONOMIC EFFICIENCY
The concept of sustainability was launched by the report "Our Common Future" of the Brundtland commission and defines the sustainable development as being "that sort of development that tries to meet the needs and aspirations of the present without compromising the ability to satisfy those from the future" (The Brundtland Commission, 1897). The sustainable development can be seen as a process of improving the opportunities that allow the man, as an individual, but also the communities, to ensure the coverage of needs, aspirations and the full potential for a prolonged period of time, while maintaining the sustainability of the environmental systems.
The eco-efficient development encompass all the human activities as an integral part of nature, the term referring to two essential and intensely debated aspects in the current economic and social context: development and sustainability. In terms of sustainability, this not only solves the current difficulties of the economy, but also immunizes it. The sustainable development requires a continuous adaptation of society and economy, in order to allow a better management of the present and future crisis, being perceived as an opportunity, a solution for us to no longer face such problems in the future.
The concept of eco-efficiency aims to maintain a balance in business, being "located" between the term of ecology and profitable operations. Simply, it is about doing more with less and being environmentally responsible, aspect that allows the environment exploitation without affecting its regenerative capacity.
The first author who discussed and analysed the fundamental paradigm of the development in the light of eco-efficiency is Nicolae Georgescu-Roegen. In his paper „The Entropy Law and Economic Process”, the author highlights the fact that during the economic processes the material degradation occurs, and this cannot be used in future economic activities. From this perspective, the author says, the world economy must respect the overall environmental limits regarding the load capacity of the ecosystems, the setting of the biological and geodynamic cycles, the balance of the climate system, limits that are being considered by Roegen as already achieved. (Roegen, 1971)
In terms of defining the concept, the eco-efficiency has received a number of definitions, among which the most notable is the one given by WBCSD (World Business Council for Sustainable Development) which states that the eco-efficient development is achieved through the production of goods and services at competitive prices that satisfy the human needs and bring quality to life, but at the same time, these reduce the environmental impact up to a level at least equal to the capacity of resource sustainability given by the planet Earth. (WBCSD, 2000).
According to the OECD, the eco-efficiency expresses the efficiency with which the ecological resources are being used in order to meet the human needs, such inclusion may be expressed as the ratio between output and input, the output representing the value of goods and services produced by a company, a sector, or by the economy as a whole, and the input representing the sum of the environmental pressures on the environment that the company, the sector or the economy generates in order to produce those goods and services.

The USV Annals of Economics and Public Administration Volume 15, Issue 1(21), 2015
65
The European Environment Agency addresses the eco-efficiency as a strategy aimed at de-coupling resource use and pollutant release from economic activity, in order to achieve "more welfare with less use of nature" (EEA, 1999). The Eco-efficiency therefore requires changes in production and consumption patterns that lead to the sustainable use of resources and natural capital.
The complexity of the concept, but also the possibility of approaching it from several points of view has led to eco-efficiency transformation from a pure theoretical notion into a management philosophy and an "instrument" that is available to companies and states in order to reduce their ecological footprint and to become more responsible towards the environment and society.
3. KEY ELEMENTS OF ECO-EFFICIENCY Reason of the need to protect the environment, but also to increase the economic
performance, the eco-efficiency is a management concept of the production factors that is based on the economic use of technology in order to reduce the resource consumption and the impact on ecosystems, of the man-made products and services.
The Eco-efficiency calls for companies and states to assume the responsibility that they have towards the environment and society and to rethink the economic activity through innovation and competitiveness. In order to highlight the eco-efficient businesses and companies, WBCSD has identified a series of elements that demonstrates this quality (WBCSD, 2000):
Reducing material intensity use; Reducing energy intensity use; Reducing dispersion of toxic substances; Enhancing recyclability; Maximizing the use of renewables; Extending product and service durability; Increasing service intensity and quality. The seven elements identified by the WBCSD, can be further grouped into three categories
of objectives relating to eco-efficiency, namely (WBCSD, 2000): Reducing the consumption of resource; Reducing the impact on nature; Increasing product or service value. By reducing the resource consumption in the production of goods and services, there is
intended to minimize the energy use, the raw materials, the water and the land resources as well as the increase of the recycling capacity and of the products and services sustainability. Reducing the environmental impact results in the reduction of the pollutants in air and water emissions, the reduction of waste dispersion and of toxic substances, but also it will favour the sustainable use of renewable resources. In this way it can be supported an efficient economic growth with the possibility of reducing the bills on the use of energy, water and raw material, which represents a sustainable development strategy at both micro and macro levels.
There is also a fourth goal in addressing business in terms of eco-efficiency, namely implementing an Environmental Management System integrated in the company's general management system which can ensure that sustainability-related risks and opportunities are identified and managed accordingly.
4. SHORTCOMINGS OF ECO-EFFICIENCY CONCEPT One of the main problems that arises when questioning the concept of eco-efficiency is the
one which emphasizes that fact that in addition to an overall strategy of increasing the eco-efficiency and encouraging sustainable development, a sufficiency strategy is also necessary (Stanciu, 2006). This strategy would require not only setting some limits for various types of pollution or stimulating more effective the consumption and production patterns, but should limit

The USV Annals of Economics and Public Administration Volume 15, Issue 1(21), 2015
66
the amount of the consumed natural resources. Thus, the term of eco-efficiency is not comprehensive enough in order to determine the unsustainable consumption trends and how one could intervene in order to reduce these trends, and the assessment of eco-efficiency by simply measuring the improvement of value per impact can lead to an increase in the impact of the activity against the environment.
It is necessary to deepen the concept and to define some indicators that show the total level of the resource consumption as well as the intensity of key resource use, such as energy, water, raw materials and the earth, in sectors of the economy that are experiencing the greatest demand (food production, consumption of goods and services, transportation, house building).
An obstacle to the sustainable development is represented by the costs. Every organization aim to a sustainable development, but growth requires investment. Global market demand for products, services and more "green" processes is constantly expanding. However, many green solutions are costly in financial terms, compared to the conventional alternatives, particularly in terms of expected future capital costs, and most investments, even those that clearly reduce the long term costs such as the energy efficiency, require a previous additional investment (Zenghelis, 2012).
5. THE EVOLUTION OF THE ECO-EFFICIENCY IN THE ROMANIAN ECONOMY
At governmental level, the sustainable development can be seen as the ability of a
macroeconomic system to achieve a balance between the economic, social and environmental dimensions, in the development process, optimizing the economic and social profits without prejudicing the corresponding potential of the benefits for the future generations (Pop, 2007).
Although originally the concept of the eco-efficiency was introduced in order to measure the efficiency with which the companies are using the resources, at the present time, it is used to assess the evolution at the macroeconomic level and the impact that an economy has on the progress in the environmental issues. Measuring the eco-efficiency at macroeconomic level relies mostly on using as an economic indicator the GDP correlated with the pressures on the environment; here it is most of the time about the levels of the utilisation of energy, water and materials, the levels of emissions of greenhouse gases and waste generation rates.
For a coherent analysis regarding the level and the evolution of the Romanian economy eco-efficiency, we consider that it is necessary to analyse the energy efficiency issues that Romania is facing. In order to highlight the natural and energy resources there are followed two main goals: reducing consumption and using as effectively as possible the natural resources with the help of the economic processing technology (reducing waste and pollution) and using the alternative energy sources. Thus, from the analysis of the available data we can say that the energy intensity of the Romanian economy together with the emissions of greenhouse gases have constantly decreased in the recent years and energy imports decreased to 18.6% of the total energy consumption, Romania being on the 3rd place at EU level regarding the energy independency (EuroStat, 2014). One advantage for the environment is that the renewable energy has come to replace about 20% of the primary energy production (Figure no. 2), thus reducing the consumption of the non-renewable resources.

The USV Annals of Economics and Public Administration Volume 15, Issue 1(21), 2015
67
Figure no 1. Energy dependency
Source: EuroStat, Sustainable Development Indicators, 2014
Figure no. 2. Primary energy production
Source: EuroStat, Sustainable Development Indicators, 2014
Figure no. 3. Total emissions of greenhouse gases (CO₂ equivalent - kilotons)
Source: EuroStat, Sustainable Development Indicators

The USV Annals of Economics and Public Administration Volume 15, Issue 1(21), 2015
68
Figure no. 4. The energy intensity of the Romanian economy
Source: Sustainable Development Indicators, 2014
Furthermore, according to the EuroStat statistics, Romania's economy is ranked on the second place at European level in terms of energy intensity of the economy (Bulgaria being on the 1st place) and is far from reaching the European average of the economic energy intensity (Table no. 1)
Table no. 1. The energy intensity of the Romanian economy 2004 2005 2006 2007 2008 2009 2010 20011 2012 2013
EU 28 166,9 164,9 159,3 152,0 151,0 149,0 151,7 143,9 143,4 141,6
Bulgaria 866,2 849,4 823,5 759,9 711,7 661,4 668,8 705,5 669,9 610,6
Romania 515,9 491,3 471,4 441,5 409,9 387,4 394,6 393,7 378,9 334,7 Source: EuroStat, 2014
In order to identify issues regarding the environment and the energy consumption, but also
in order to find solutions to deal with these issues at European level, there has been developed the package "Energy - Climate Change" as part the Europe 2020 strategy This sets a number of targets for 2020, also known as the "20-20-20 Objectives", covering the aspects of pollutant emissions and renewable energy, whilst establishing the following targets (Europe 2020):
Reducing greenhouse gas (GHG) emissions by at least 20 % compared to base year 1990;
increasing to 20% the share of the renewable energy sources in the overall EU energy consumption as well as reaching a target of 10% biofuels in the transport energy consumption;
reducing at 20% the energy consumption by increasing the energy efficiency. The European Commission proposes that these EU goals to be transposed into national
targets and trajectories in order to ensure that each Member State tailors this strategy to specific national situation. Thus, as obligation assumed in its capacity as EU member state, Romania has aligned with these requirements concerning the energy sector efficiency and the national targets of the Europe 2020 strategy as well as the current values of Romania, all these are summarized in the following table.

The USV Annals of Economics and Public Administration Volume 15, Issue 1(21), 2015
69
Table no. 2. National targets Europe 2020 Europe 2020 objectives – Energy and
climate change Romania 2020
target valueCurrent values
Reducing greenhouse gas (GHG) emissions by at least 20 % compared to base year 1990
20% 56,55%
Increasing the share of renewable energy to 20%
24%
23,3% (including biofuel consumption)
22,2% (ignoring biofuel consumption)
Increasing energy efficiency and decrease energy consumption by
20% 19% 17,3%
Source:http://ec.europa.eu/europe2020/pdf/nd/nrp2012_romania_en.pdf
6. APPLICATION OF ECO-EFFICIENCY INDICATORS AT THE MACRO LEVEL (COMPARISON ROMANIA/EU 28)
While in the private sector the eco-efficiency becomes a more useful tool of products and
services valorisation, with a low environmental impact, adopting a system for measuring the effectiveness with which a state consumes the resources, it becomes essential in the current economic and environmental conditions.
Assuming the eco-efficiency in the economy as a whole can be achieved on many levels, and national governments can set targets of eco-efficiency at macro, micro or regional levels, targets which fit within the objectives of the sustainable development and which are reflected in the national sustainable development strategies.
In order to analyse the eco-efficiency of Romanian economy, but also the progress towards a sustainable development, we considered it is necessary to emphasize a number of indicators regarding the efficiency with which the national economy uses the resources. Thus the rate of material and energy consumption, the generation rate of emissions of greenhouse gases, and the waste generation rate can be observed in the following charts.
Figure no. 5. The rate of the materials use
Source: Calculations based on data available on EuroStat

The USV Annals of Economics and Public Administration Volume 15, Issue 1(21), 2015
70
Figure no. 6. The rate of energy usage
Source: Calculations based on data available on EuroStat
Figure no. 7. The generation rate of GHG emissions
Source: Calculations based on data available on EuroStat

The USV Annals of Economics and Public Administration Volume 15, Issue 1(21), 2015
71
Figure no. 8. The generation rate of municipal waste
Source: Calculations based on data available on EuroStat From the data presented it can be seen that the improvement of the resource consumption efficiency, at national level, is part of the trend registered in the European Union regarding the eco-efficiency growth. However, the lack of detailed information concerning these consumptions makes it difficult for an extensive analysis regarding other key aspects of economy efficiency, both in terms of domestic consumption (water use rate, land use rate) and in terms of identifying a broader overview and for a longer period time. Another problem that results from the detailed analysis of macroeconomic eco-efficiency is that, despite the fact that on the whole it can be recorded an effective growth, this aspect may be due only to the growth of the GPD value, while the consumptions and the generation of harmful substances increase. Here comes the question whether the GDP has become an obsolete way of measuring the progress under the given conditions of a society that tends to satisfy the needs of humanity, in a most efficient way and with a price as low as possible on the environment.
7. OBSTACLES AT NATIONAL LEVEL REGARDING THE TRANSITION TOWARDS A SUSTAINABLE ECONOMY
From the economical point of view, the main constraints on national level concerning the transition to a sustainable development are the economy dependence on traditional fossil fuels, lack of funding and low participation of the banking system in supporting the energy efficiency programs. The weaknesses of Romania in the field of sustainable development were presented by the statistical data EuroStat (2014), including: the Romanian energy strategy for the period 2011-2035 which is not yet completed; transport networks of electricity, gas and oil are insufficiently modernized; alternative energy production is underdeveloped compared to the potential; increased emissions of greenhouse gases from transport by 18% (2012/2005); micro, nano and biotechnologies for health care and quality of life underdeveloped; in many cases, uncontrolled exploitation of the natural resources underground, land and water); insufficient financial resources necessary for specific investments. Another problem is the lack of the framework and vision in terms of creating "green" jobs, here is primarily needed a restore of a national network of vocational schools and university programs with agricultural and ecological profile, agriculture representing one of the most important areas at national level which can support the transition and then the adaptation to a system of sustainable economic growth.
Social and cultural the blockages on addressing environmental problems occur also from the perception and behaviour of the population towards these matters. Although at national level there is a concern for the environmental changes, data from Special Euro barometer 372 regarding the

The USV Annals of Economics and Public Administration Volume 15, Issue 1(21), 2015
72
climate, shows that Romanians consider that economic development and environmental conservation are incompatible and in the context given by the current economic crisis (high unemployment rates and low levels of income), the general perception is that environmental concerns must be sacrificed in order to create new jobs and to restore the economic growth (UE Report, 2011).
Waste management and recycling issues are also less popular among Romanian citizens, and according to EuroStat, from all European countries, Romania recycles only 1% of the entire volume of the produced waste, the rest being disposed of as garbage, placing at the opposite pole from Belgium, which recycles 94% of waste.
Therefore, lack of financial resources and expert personnel, lack of strategies and policies for their implementation, but also public disinterest represent the major obstacles faced by Romania in the transition to a cleaner economy.
8. CONCLUSION
The transition to a clean economy should be regarded as an economic revolution that requires a series of efforts both on the part of governments, companies and the population, so that we can enter on the path of sustainable development. The Governments will have to act in the spirit of promoting sustainable economic growth policies, the companies will have to generate innovation in the production processes, and the population must change the consumption habits towards more efficient models from economic, environmental and social points of view. However, the global economic crisis and the financial difficulties that we are facing are likely to lead to the investment redirection from the environmental protection and from the promotion of clean technologies to the difficulties from the financial markets. Preventing long-term consequences of an inefficient and polluting economic growth is essential, and this can be achieved only through a coherent public policy that should include environmental and consumer issues, industrial policy and development, research and innovation issues. By its nature, the concept of eco-efficiency aims the economic activity transition towards a higher degree of sustainability and the acceleration of this process can be achieved by improving production and consumption and creating economic and political instruments in order to facilitate the implementation and fulfilment of some eco-efficiency targets which may be established at company level, by the industry or even by the national economy.
However, the development should take into proper account the constraints of our environment, rich but fragile. Only through eco-efficiency and optimization of human capital and environmental resources we can offer to all and to future generations the hope for a better quality of life. BIBLIOGRAPHY
1. Brundtland Commission, (1987) Our Common Future 2. Romanian Government, (2012) National Reform Programme 2011-2013 Implementation
Report 3. EEA, (1999) Making sustainability accountable 4. Krebs C., (2008) The ecological world view, Editura Csiro Publishing 5. Georgescu-Roegen, N., (1971) The Entropy Law and the Economic Process, Harvard 6. OECD, 1998, Eco-efficiency 7. Pop C., Pop V., (2007) Management şi dezvoltare, Editura Tipo Moldova, Iaşi 8. Special Eurobarometer 372, Climate Change, 2011 9. Stanciu M., (2006) Metode de cercetare a modelelor de consum, în Studii şi Cercetări
Economice, Academia Română 10. WBCSD, (2000) Creating more value with less impact

The USV Annals of Economics and Public Administration Volume 15, Issue 1(21), 2015
73
11. Zenghelis, D. (2012) A strategy for restoring confidence and economic growth through green investment and innovation, Grantham Research Institute in Climate Change and the Environment, London
Web 1. http://conspect.nl/pdf/Our_Common_Future-Brundtland_Report_1987.pdf, [accesat la
28.03.2015] 2. http://www.eea.europa.eu/publications/Topic_report_No_111999, [accesat la 20.03.2015] 3. http://ec.europa.eu/europe2020/europe-2020-in-a-nutshell/targets/index_ro.htm, [accesat la
18.02.2015] 4. http://epp.eurostat.ec.europa.eu/portal/page/portal/eurostat/home/, [accesat la 20.03.2015] 5. http://ec.europa.eu/europe2020/pdf/nd/nrp2012_romania_en.pdf, [accesat la 25.03.2015] 6. http://www.insse.ro/cms/rw/pages/index.ro.do, [accesat la 20.03.2015] 7. http://books.google.ro/books?id=Tu1j3nfXheQC&printsec=frontcover&dq=krebs+ecologic
al&hl=en&sa=X&ei=yOtTUezcCc-Gswaf7IDYAg&redir_esc=y¸[accesat la 18.02.2015] 8. http://www.keepeek.com/Digital-Asset-Management/oecd/environment/eco-
efficiency_9789264040304-en, [accesat la 03.03.2015] 9. http://ec.europa.eu/public_opinion/archives/ebs/ebs_372_en.pdf, [accesat la 10.04.2015] 10. http://www.iccv.ro/oldiccv/romana/articole/Modele%20consum%20metodologie.pdf,
[accesat la 20.03.2015] 11. http://stats.oecd.org/, [accesat la 10.04.2015] 12. http://www.wbcsd.org/web/publications/eco_efficiency_creating_more_value.pdf, [accesat
la 20.03.2015] 13. https://sustainabledevelopment.un.org, [accesat la 10.04.2015]
ACKNOWLEDGEMENT Angela Nicoleta Cozorici would like to specify that this paper has been financially
supported within the project entitled “Horizon 2020 - Doctoral and Postdoctoral Studies: Promoting the National Interest through Excellence, Competitiveness and Responsibility in the Field of Romanian Fundamental and Applied Economic Research”, contract number POSDRU/159/1.5/S/140106. This project is co-financed by European Social Fund through Sectorial Operational Programme for Human Resources Development 2007-2013. Investing in people!

The USV Annals
of Economics and
Public Administration
Volume 15,
Issue 1(21),
2015
74
LOOKING FOR (RE)DEFINING UNIVERSITY AUTONOMY
ProfessorPhDAlaCOTELNICAcademyofEconomicStudiesofMoldova,RepublicOfMoldova
AssociateprofessorAngelaNICULITAStateUniversityofMoldova,RepublicOfMoldova
ProfessorPhDPetruTODOSTechnicalUniversityofMoldova,RepublicOfMoldova
AssociateProfessorPhDRomeoTURCANAalborgUniversity,Denmark
ProfessorPhDLarisaBUGAIANTechnicalUniversityofMoldova,RepublicOfMoldova
SeniorlecturerPhD,HRandeconomicplanningmanagerDanielaPOJARAlecuRussoBaltiStateUniversity,RepublicOfMoldova
[email protected] Abstract:
The article presents a comparative analysis of the institutional university autonomy of the following EU member states: Denmark, Lithuania, Romania, Scotland and Sweden. Today we are witnessing the restructuring of various society sectors - the economy, labor market, social and political systems, etc. It is a process at state – nation level, as well as regional and global levels. Education systems in most countries, at their turn, react to this process and engage in radical reform of higher education in order to achieve economic, social and political objectives of the society. In this emerging environment universities have to review their position in order to redefine and adapt their functions, forming an autonomous space for proper decision making and, thus, playing an innovative role in the socio-economic environment.
Key words: university, institutional autonomy, higher education, teaching, research, knowledge transfer. JEL classification: I20
INTRODUCTION
This article initiates discussions on institutional autonomy of universities and introduces a modern approach to the concept of institutional university autonomy. The mission of a modern university consists in its role as an actor in a knowledge-based society, with the purpose of contributing to the welfare of both the individual, social and economic environment, generating knowledge and transferring them to students through education, research and innovations. In this context, the mission of the university towards society changes, being defined by three basic components:
Teaching / Learning: forming competent human resources - Through the education process the university is designed to prepare well trained professionals with skills that give them a competitive advantage on the labor market and being perceived by employers as an added value and ultimately would contribute to society`s welfare.

The USV Annals of Economics and Public Administration Volume 15, Issue 1(21), 2015
75
Research: generating new knowledge - through research, development and innovation, the university produces transferable results to the business environment, taking the form of products and services with high added value.
Knowledge transfer: active contributor to the development of the community - through cultural and educational intervention in the spirit of social paradigm of the future, institutional intervention - through university's involvement as an active institutional actor in society development activities, individual intervention - through direct involvement of the academic community members in the life of the society (advice, expertise, participation in the activities of consultative and decision-making bodies, etc).
Realizing the full extent and diversity of contemporary higher education, universities need more autonomy to fulfill their mission. In this sense, the challenge relates to the definition of the "autonomy" concept, its forms, educational policies’ framework, the involvement of other stakeholders and identification of the best international practices on university autonomy.
It is recognized that the nature of the word "autonomy" is not absolute, it all depends on the context within which it is applied. Within higher education institutions this word is associated with the following two words - "freedom" and "independence". If a growing number of people requires higher education, where HEIs provide necessary skills and competencies of graduates and are effective in the knowledge triangle: research-teaching-transfer of knowledge, the essence of the word "autonomy" in practice is understood as academic freedom and independence, and is what works better in relation to the state and society.
Autonomy is not a new word for the academic environment. In the last decade, the value of this idea was appreciated by many European governments. In the modern society, the links between academic and business environments have become stronger and society requirements to university – more strict. This is the reason why it is necessary to have a corresponding framework where universities can carry aut/their mission in the best way possible.
According to the Association of European Universities, university autonomy has four dimensions: organizational, financial, academic and human resources autonomy. Organizational autonomy refers to the ability to decide on university structures and their status, procedures and criteria for selecting the bodies and decision-making factors, as well as the ability to decide on the involvement of outsiders in the work of the university Board and the ability to create distinct legal bodies.
Financial autonomy provides financing means, types and amounts of funds available for financing, mechanisms for attracting and allocating funds, the ability to keep the remaining balance after funding from the budget, and the opportunity to borrow money from the financial market. It also provides the right on buildings’ ownership, to decide on tuition fees and charges for the provision of other services.
Academic autonomy refers to the educational offer, educational plans and teaching methods, the ability to select admission mechanisms, decisions in various areas, objectives and research methods, and the ability to select relevant institutions for quality assessment.
Human resources autonomy manages the responsibilities on procedures for staff recruitment, remuneration and promotion.
In recent years the discussions and analyzes of university autonomy focused mainly on these four dimensions of university management. However, the above-listed dimensions do not highlight enough the understanding of the operation of modern universities and the fact of how extensive and complex their relationships with stakeholders are.
At the basis of this article lies the idea that a fuller understanding of university autonomy can be achieved only through an overall approach, defined by the term "institutional academic autonomy."
For a better understanding of the concept of institutional university autonomy and the classical dimensions of organizational, financial, academic and human resources autonomy, five interfaces that characterize the internal and external points of interaction between modern university and stakeholders will be introduced. These interfaces are: government - university; the university

The USV Annals of Economics and Public Administration Volume 15, Issue 1(21), 2015
76
management - academic staff; academic staff - students; university – business environment and university - international environment:
The government - university interface relates to state policies in higher education area; the role of central and regional state administration in issuing regulations for the governing structures of universities; government vs. administration; supporting and promoting higher education institutions; the need and role of accreditation; financing models for research and teaching activities; responsibility and public accountability, involvement in the mission of the university.
University management – academic staff interface reffers to the models of leadership and management of a modern university; delimitation of competences in decision making at strategic and operational levels; organizational implications from the top down, bottom up or in parallel; stimulation and evaluation mechanisms; external appointment and promotion policies vs. internal policies; staff mobility; responsibility and public accountability.
Academic staff - students interface reffers to the role of students in the administration of the university, as well as in teaching and research processes; university staff - teachers vs. academic staff - mentors; change of the concept on students; models for the admission of students (e.g. related to general state policies in higher education area); student assessment models; students’ mobility; responsibility and public accountability.
University - business environment interface, refers to the role of enterprises in the administration of the university, as well as in teaching and research processes; knowledge transfer models (e.g. in the area of financing, ownership, intellectual creation, intellectual property rights) and knowledge sharing (e.g. staff exchange programs, internships for students, promoting entrepreneurship); career development and innovation; lifelong learning; responsibility and public accountability.
University - internationalization interface refers to university internationalization policies; university strategies on internationalization; mobility of lecturers and students; mechanisms and models of internationalization; accreditation related to the process of internationalization; compatibility of the internationalization with university autonomy; internationalization and university mission; responsibility and public accountability.
After defining the mission of the university and institutional university autonomy, it is equally important to discuss briefly the importance of university autonomy. The Bologna process and the acceleration of the European integration contribute to a common European university culture, characterized by a high degree of institutional university autonomy. It supports the idea that university autonomy brings various benefits to higher education sector, while it does not imply the lack of regulation. It is perceived as a factor for improving the quality of higher education, increasing sector’s performances, facilitating collaboration between universities, state and business environment, thus contributing to increasing the attractiveness of educational institutions not only for local students, but for international ones as well.
Massification of higher education and the increase of costs for studies led to an increased accountability of higher education institutions to public opinion. The role and function of higher education institutions on the effectiveness and efficiency of achieving society demands regarding training of specialists are being more often discussed.
Failure to comply to these trends exclude the country from this innovative environment and can seriously damage the future competitiveness of a nation. Institutional university autonomy is not an objective in itself, but is a vital issue for the success of the academic sector. Performance levels of higher education institutions can be seriously affected by strict regulations and government control.
DIMENSION: ORGANIZATIONAL UNIVERSITY AUTONOMY In order to reliably compare higher education systems, the mode of expression and regulation
of organizational university autonomy, a systemic definition of this notion is required. The current study uses as a benchmark the definition of organizational autonomy of the Lisbon Declaration of
The USV Annals of Economics and Public Administration Volume 15, Issue 1(21), 2015
77
the European University Association (2007), according to which this component of university autonomy is the ability of higher education institutions (HEIs) to decide on the organizational structure and institutional governance - in particular, the ability to establish structures and governing bodies, university leadership and reporting relationships (subordination).
To ensure clarity and comparability of the results of the study the following criteria used to describe the organizational autonomy of universities have been identified: governing bodies, executive management, university freedom to decide on the internal structure, representation of students within governing bodies, university freedom to create legal entities: non-profit and / or commercial ones.
This material derives from the research undertaken under the above-mentionned criteria, taking into account the interfaces described in the previous article.
In two of the five studied countries, namely Lithuania and Scotland, the universities have a dual governing structure, consisting of a governing Board, which includes a small number of people, and the University Senate. Universities in Sweden, Denmark and Romania have a unitary governing structure, the governing body being the Governing Council - for Sweden and Denmark, and the University Senate - for Romania.
The governing Councils of the analyzed education systems, with all specific diversities of the respective states, have similar responsibilities, being accountable for long-term strategic decisions pertaining to the development of the university, such as: decisions on the status, strategic planning, budgeting, choosing/electing the rector and vice-rectors.
In all of the analyzed systems the governing councils include external members (non-university), who/that/which form the majority of the board and usually are representatives of the real sector enterprises, practitioners from various fields, thus ensuring business environment’s involvement in all activities of higher education institutions.
In the respective dual structure, existent in Lithuania and Scotland, the University Senate is responsible for academic issues, namely: curriculum, teaching and research staff promotion, awarding scientific degrees, etc.
In Romania the University Senate has the powers of the two governing bodies from the dual structure, being the governing body that makes strategic decisions on the development of the university, and manages the academic activity of the institution.
The university senates, where it exists, represents the academic community of the institution, the academic and research staff, as well as students being their elected members. In Lithuania the University Senate may include employees of other HEIs and research institutes. Unlike Romania, Lithuania and Scotland HEI’s Rector is a member of the University Senate, and in Scottish universities he is also the president of the Senate.
The procedures for external members’ appointment in the governing councils vary from one system to another. In Sweden external members are proposed by the university, but are appointed by the Government. Universities in Scotland and Denmark are free to designate external members in their governing bodies. In Lithuania some of the external members are selected by the HEI, others are proposed from outside, but all of them are appointed by the Ministry of Education and Science.
Internal members of the Councils are elected by and from the academic and student communities of the respective universities. In Scotland and Sweden University rectors are members ex officio of the governing Council.
In all of the analyzed systems the whole university community is involved in the process of electing the Senate members, except the ex officio members (if there are any). Members of the Senate, except students, are elected by teachers and research staff, while students representatives are elected by a students’ representative structure or the general assembly of students. The procedure for electing members of the Senate is provided in the Statute or other regulatory university acts.
The executive management. Although the university management may include several key positions in the university, this study focuses primarily on the head of the executive body who is

The USV Annals of Economics and Public Administration Volume 15, Issue 1(21), 2015
78
referred to as the Rector. Although there are some differences between the 5 analyzed systems in terms of powers of the Rector, mostly they are similar. Thus, in all of the systems the Rector is the main executive authority of the higher education institution, that provides daily management of the university.
The manner of Rector election / appointment in the studied higher education systems is different. Thus, in Denmark and Lithuania the head of the executive body is appointed by the University Governing Council on the basis of a public competition. Scottish University rectors are also appointed by the governing councils, but based on the procedure for appointing developed by these Councils. In Sweden rectors are appointed by the Government, based on the proposals received from the governing councils of HEI, submitted after consultation with the academic community. This ensures the participation of the academic community and students in this important exercise for universities.
In Romanian universities the Rector may be designated by one of two ways: 1) on the basis of a public competition, based on a methodology approved by the newly
elected senate; or 2) by universal, direct and secret suffrage of all academic and research staff of the university
and student representatives in the senate and faculty councils. In Romania, Lithuania and Sweden the mandate of the rector of the higher education
institution is established by law, for a period of 4, 5 and 6 years, respectively. In addition, a person can be elected only two terms consecutively in the same institution. The term of the mandate for the rectors of Danish and Scottish universities is determined by the Governing Council.
University freedom deciding on the internal structure. In Lithuania, Scotland, Sweden and Denmark the internal structure of HEIs is not regulated by any law. Universities are free to decide on their organizational structure. In Romania the situation is different in this respect. The organizational structure of the university is strictly regulated by the Law on National Education.
Representation of students in governing bodies. In all of the five examined systems students are represented in all decision-making, executive and advisory structures of the university. This is stipulated in both institutional regulations and legislative acts. Here universities in Denmark and Sweden can be mentionned, as students show a rather high degree of involvement in decision-making, teaching and research processes, as well as other activities of the university life.
University freedom to create legal entities. Universities in Lithuania, Scotland, Denmark and Romania have the right to establish legal entities, both non-profit and commercial. But there are some restrictions in Lithuania and Denmark on the activities undertaken and the use of proceeds from such entities. Universities in Sweden have no such a right.
DIMENSION: ACADEMIC UNIVERSITY AUTONOMY Academic autonomy refers to the ability of the university to make decisions on the vision,
mission and academic profile, on the introduction or removal of study programs, the choice of study language, design the structure and content of the programs, and such aspects as the admission of students or quality assurance methods for programs and awards. The ability to decide on the areas, scope/field?, goals and research methods are important subcomponents of the academic autonomy (www.eua.be).
Based on this definition and multiple problems debated during the recent years within the educational system of the Republic of Moldova, there has been selected a wide range of 10 criteria that refers to the introduction and settlement of curricula, admission to studies, recognition of studies, accreditation of study programs, the National Qualifications Framework (NQF), organization of the study process, employment of graduates, the task of teachers, university scientific research and doctoral studies.
Governance - university. The Parliament and the Government are the courts that decide to set up or liquidate higher education and research institutions, approving / setting regulations, objectives, guidelines and resource allocation domains. The Ministry of Education and Research

The USV Annals of Economics and Public Administration Volume 15, Issue 1(21), 2015
79
(under various names) is the authority responsible for the education and research within institutions offering higher education and is the body that decides on the permission of granting qualifications by these institutions.
Four types of higher education institutions are hereby found: handcraft academies and university colleges that offer professional Lycense programs (short-term higher education, for a period of 2-3 years); universities that offer bachelor's and master scientific programs (undergraduate) and PhD; university institutes specializing in arts.
The limited number of universities impresses. In Denmark, for example, there are only 8 universities to a population of 5 million. Universities are formed by law or royal act. Colleges (vocational) are more numerous and are formed at the decision of the Ministry of Education.
Undergraduate programs last for 3-4 years (180-240 ECTS) depending on the profile and the degree obtained at the end (e.g. Scotland, Romania). The Ministry of Education determines the general requirements for college degree programs, I cycle study programs, integrated studies and master. New college and undergraduate programs must comply with the classification approved by the Ministry of Education.New programs are initiated at the request of the economic environment or at the formation of a new scientific direction (Scotland, Denmark, Sweden). Institutions (program team) prepare the program according to those requirements, the academic Council (University Senate) approves them, then it goes through an approval procedure for temporary operation, up to the accreditation.
So, institutions are free to decide on the introduction or liquidation of cycle I study programs, if they meet the rules set by the Ministry.
As for the second cycle, professional and research masters lasting 60- 90-120 credits are practiced, depending on the duration and type of the first cycle. There is a single requirement - the total duration of the first two cycles should be of no more than 300 ECTS. Other requirement are formulated by each university and are made public. It is noted that college graduates may have access to master's programs (with professional license), but they have to study one more compensatory year.
The Ministry of Education offers the right (authorizes) to carry out master and doctoral programs only to institutions that carry out scientific research in the respective field. New master programs must prove their originality in the application and knowledge advancement. The name and content of programs are determined by the authorized institutions under general requirements.
New doctoral programs usually occur as the development of research programs. Institutions may grant the title of Doctor in areas where the research is undertaken and where a doctoral school has been established, either independently or in cooperation with other institutions approved by the ministerial order. The doctoral school must be accredited or provisionally authorized as determined by the Ministry of Education.
The PhD title is awarded to students who have successfully completed the program and passed the PhD thesis. The PhD Program is equivalent to 180 ECTS. The name and content of programs is determined by the institution based on general requirements.
All study programs are usually undertaken in the national language. In parallel English language programs can be created, especially at Master and PhD levels, at institution's decision, aiming to attract foreign students (extra charge) and increase mutual mobility.
The general requirements for candidates to admission are applied to all courses and programs in higher education, specific (set by the institution) and regulated by state laws. The Ministry of Education or another state body (the Council for Higher Education in Sweden, Universities and Colleges Admissions Service in Scotland) is responsible for the centralized admission on behalf of higher education institutions. Typically, the registration is done online. The student is free to choose programs and institutions according to his priorities.
The Government approves the share of admission to study programs depending on the capacity of university structures to ensure quality education. This ability can be established in the accreditation act of the program or institution. In Romania the Ministry of Education develops on

The USV Annals of Economics and Public Administration Volume 15, Issue 1(21), 2015
80
an annual basis a methodology framework and each higher education institution develops and applies its regulation on the organization of the admission to the offered study programs.
For the admission to master studies the competition is done based on the bachelor's diploma on related programs. University colleges graduates are admitted to studies only after one compensatory year is passed. The specific requirements for admission to Masters and PhD are determined by university at study program level. The Ministry of Education determines only the general admission rules. The admission to the second cycle is the responsibility of the university, which establishes its own admission methodology.
Sweden and Romania allot a number of study grants financed by the budget for university master studies for state universities. In other countries master programs are paid.
PhD admission is based on the Regulation prepared by the Committee for Research, or anothe similar structure, that provides grants for doctoral studies directly or through projects on a competitive basis. The admission to doctoral studies is based on a master's degree diploma or integrated studies with 240 ECTS.
Admission of foreign students is carried out by admission committees of universities. There are no quotas on the admission. The admission of foreign students tyo cycle I and II is largely done through mobility and students’ exchange programs. The admission requirements to cycle I and II for foreign students are the same as for local students. The knowledge of English or Swedish / Danish is required. The admission requirements are set independently by each institution. The amission of foreign students is carried out by admission committees of universities.
Universities are autonomous in using different methods of vocational guidance, various measures are undertaken at university, faculty and program levels. The activities of vocational guidance, recruitment of students from the country and abroad is one of the tasks of each department / faculty for all universities in conditions of the decrease of the number of students in all European countries.
A special role in correct and objective informing of student belongs to the centralized admissions service (e.g. UCAS in the UK).
Ensuring the quality of education and scientific university research is an obligation of each higher education institution. For accreditation, the presence of a quality management structure is mandatory.
Higher education institutions have the right to offer studies at accredited programs only. For the external evaluation and accreditation of study programs a National Agency for Higher Education Accreditation as an independent public body is created. The methodology, external evaluation procedures of programs and quality and relevance criteria are, usually, developed by the Agency and approved by the Ministry of education or a Government’s decision.
The assessment is based on several fundamental criteria: the request of studies on the respective labor market; the program is based on research and is connected to an active high quality research environment; continuous internal quality assurance of the program. The overseas subsidiaries and affiliated institutions of foreign institutions are also subject to assessment and accreditation.
The British experience is of a high interest - the methodology, procedures and evaluation criteria are very explicitly described in the UK Quality Code. Each quality criterion has detailed and explicit instructions on the normative documentation the institution must have and may be presented to the assessors. The Code presents an integrated document that meets basic requirements for all stages of a life cycle of the university training process. Universities are free to choose a foreign accreditation agency which is included in the European Register.
A National Qualifications Authority (NCA) is the statutory qualifications’ awarding and accreditating body. The NCA provides qualifications recorded with various types of certificates (for secondary education), diplomas and degrees for the levels related to higher education. The qualification levels for higher education are described in terms of studies (descriptors) and in terms of credits.

The USV Annals of Economics and Public Administration Volume 15, Issue 1(21), 2015
81
National qualifications frameworks of the vizited countries is compatible with the EQF, comprises eight levels of qualifications, four of which relate to higher education: professional level (5), license (6), Master (7) and PhD levels (8). An exception is the CC of Scotland, which provides 12 levels of qualifications, but certain rules for compatibility with the EQF are provided. ANC is under the auspices of the Ministry of Education / Government. ANC also coordinates the development and maintenance of the National Register of Qualifications in Higher Education.
The inclusion of certificates and degrees / titles / diplomas in the NQF Register is based on an assessment of the learning outcomes that individual degrees / certificates document in report to the NQF level descriptors. Higher education institutions are required to register the information on the skills they develop through the offer of studies in the respective Register.
The descriptors for higher education qualifications (degrees), present in the NQF, are used as reference standards / criteria both at the elaboration and the assessment and accreditation of study programs. All 5 countries use the European Credit Transfer System ECTS. There is a small difference in Scotland.
Higher education institutions are responsible for organizing the whole study process, design curricula and courses, as well as current and final assessment procedures. The content of curricula must comply with the objectives and learning outcomes, as well as with competences provided in the NQF, students must possess at the end of their studies. University study programs are designed by groups of initiative, usually by research groups with high results. But the program curriculum must comply with the legal documents issued by the ministry or other subordinated entity.
For example, in the UK the design, approval and implementation of programs is carried out in accordance with the standards established by the Quality Code, developed by the Agency for Quality Assurance in Higher Education of the UK, including a number of indicators of good practice on program operation and mechanisms that higher education service provider can rely upon to enhance the quality of the program put into action.
Among the general requirements to study programs specific requirements can be found on the duration (in credits) of the practice, which depends on the program. Institutional normative acts establish the organization, reporting and evaluation means of the practice.
The final assessment is an act of appreciation of competencies obtained by the student in relation to the purpose prescribed by the program, is achieved through public presentation of a project / thesis to the evaluation committee. Exceptions are only some vocational college programs. Institutional normative documents define the presentation procedures and requirements for the content of the work/paper. The development of projects in a team is widely practiced, but it has to have a personalized assessment. The Danish system has a specific feature regarding the way of external examination both at the final stage of the study program and the assessment of semester modules.
The Romanian, Danish and Scottish NQFs clearly define the correspondence between levels of Framework’s qualifications, the study documents that are issued, the type of education and training programs through which qualification and reference levels of the European Qualifications Framework (EQF) can be acquired.
The employment rate of people with higher education varies from one area to another and from one country to another. Given that the employment and career growth rate is a performance benchmark of the study program and institution at all levels, including at the national one. A lot of effort is made to facilitate this process. Program teams and departments keep records of their graduates’ employment and career advancement. At the study stage the training for the hiring process is organized. Nationally, there is a good practice in Sweden, where every 12-18 months after graduation the Swedish Authority for Higher Education collects data from graduates and then publishes a report on the employment rate of graduates on fields and institutions. In Scotland there is a long tradition of relations with alumni in order to attract sponsorship and bring candidates to studies.
The Labor Code of the examined countries sets the working week for higher education staff of 35-40 hours per week. Individually, institutions establish internal methodologies for calculating

The USV Annals of Economics and Public Administration Volume 15, Issue 1(21), 2015
82
and apportioning the workload of teaching and research staff. It is noted that the core activities of universities consist of conducting research and research-based teaching. The workload of a teacher in Denmark, for example, consists of 490 teaching hours per semester, which constitutes 60% and 200 hours for scientific research (40%). For the administrative work a part of the academic task is reduced.
Education and research policy is defined and implemented by the Ministry of Education, University Research Council and the Centre for Quality Assessment.
In all of the 5 examined countries the scientific research is an indispensable part of the training process of specialists with higher education. Research is concentrated by the side of thematic departments and is funded from the state budget and projects, as well as non-budgetary research grants. Most of the visited universities non-budgetary grants together with grants from international collaboration are comparable by size to the budget ones.
The University is autonomous in creating its own organizational structures and conducting scientific research: centers or laboratories, design units, consulting centers, university clinics, small production units, other manufacturing and transfer of knowledge and technology entities, integrated research, study and business centers. The institutions decide themselves on the internal allocation of financial resources for research and doctoral programs.
MA students are integrated into applied research so that at cycle three they autonomously develop valuable scientific research. In Denmark, involving students in research is regarded as a fundamental principle of university education.
Out of the annual workload of the teaching staff 40% usually belong to scientific research, which is organized and accounted for within the research group. Importance is given to the results, based on which university science funding is done from the state funds. 2-3 valuable publications in the country or international journals are mandatory. The state encourages the excellence in research of the academic staff through specific financial leverages: additional funding for institutional development, mobility grants for research at other universities in the country or abroad.
Collaboration with business environment forms an important aspect of university research and is a prerequisite for institutions. This collaboration is often organized under the form of competence centers and partnership associations that are autonomous units and report directly to the university management. The organization of specialized research institutes that combine research with the academic process is practiced, as well.
The Ministry of Education grants the right to offer PhD studies to universities alone or together with research institutes. The right is granted based on the external evaluation. The doctorate is considered as research-based studies, lasting 3 years full time, while in engineering - 4 years.
Aspects of the organization of doctoral studies (PhD admission, the organization of PhD program, appointment of the main supervisor) are part of university autonomy. The University establishes the rules on the access to the PhD program.
Doctoral study programs are, usually, held in doctoral schools accredited or provisionally authorized with this right. Empowering the right to lead doctoral students belongs to the university department. In Romania, the quality of doctoral supervisor is given by order of the Ministry of Education.
Doctoral studies are organized doctoral schools, which can be organized: by a university, university consortium with research and development units and doctoral centers. The organization of doctoral schools is determined by a Regulation established by the Committee for Research, with detailed specific elements provided by the regulations of the institutions. The study programs from the third cycle are completed with the presentation of the PhD thesis, which done orally and publicly. The University decides on the evaluation, assessment and the presentation procedure. The Faculty / school appoints one or two opponents, and a board of examiners, as well as at least one person from another university. The Commission is the only structure empowered on making decisions on marking and awarding the PhD degree. The degree is confirmed at the University Senate.

The USV Annals of Economics and Public Administration Volume 15, Issue 1(21), 2015
83
In Lithuania, Romania and Sweden there is no a different degree than the PhD in science or arts. Scotland has set a higher doctor degree (Higher doctorates), following the PhD, and is awarded to a person for valuable research or publications. The title is offerred to people from education area, based on the published work, but it does not have a distinctive position within the qualifications and is considered honorary title. In Denmark a higher degree of doctor (doktorgraden) is provided, which is similar to the degree of PhD in Moldova, but in this case the requirements are much simpler.
Post-doctorate is a thorough research program for young people with a Ph.D., to gain additional experience and qualifications.
DIMENSION: UNIVERSITY AUTONOMY ON HUMAN RESOURCES The autonomy of human resources is one of the four pillars of university autonomy
materialized in the institution’s right to set its own recruitment procedures, to develop its own remuneration system based on specific performance indicators for each higher education institution (HEI ) and decide on the procedures for promoting employees, etc. The autonomy of human resources, as defined in the Declaration of European Universities (2007), includes university freedom to recruit and select qualified university human resources, the responsibility for work contracting, setting of wages, salary increments depending on the value of human potential.
The freedom / ability to decide on recruitment and employment procedures. This criterion refers to HEIs’ freedom to decide on recruitment and employment procedures. Broadly, universities are autonomous in achieving this freedom. Central authorities do not get involved in employment and / or recruitment procedures (less in Romania), universities enjoying a high degree of autonomy in this area.
HEI freedom to decide on the recruitment and employment procedures is correlated with the general principles of the labor law: any HEI, as much autonomy as it might have, can not establish internal regulations which would contravene to national and EU labor legislation. Exercising the freedom to decide on staff recruitment and employment procedures should not limit the rights and freedoms guaranteed to employees and employers through various legislative acts. So, the institution has the right to develop its own procedures, to set its own criteria of employment to the extent that they do not violate the rules of labor law.
In all of the analyzed universities there are specialized collegial bodies responsible for the recruitment and / or employment procedures: Commission for wages and employment in Lithuania, the Committee responsible for human resources procedures and strategies in Scotland, the Commission for employment in Sweden and Denmark and the Competition Commission in Romania.
The componence of these committees does not need the approval of a hierarchical authority, except Romania, where rector’s decision on establishing the componence of the committee is submitted to the Ministry of National Education and the nominal componence of the competition commission is published on the website. In case of associate professor, professor,II degree senior researcher and I degree researcher, the commission componence shall be published in the Official Gazette of Romania.
Although normative acts regulating the activity of HEI determine the procedure for recruitment / employment, making it uniform for all institutions in the country, each institution is free to definitely decide on the optimal candidate.
HEI staff does not have the status of civil servants, except in Sweden and Denmark, they are considered employees of the public sector, but no country requires confirmation from a higher authority for the employment of the academic staff.
In all countries the employment is initially made for a specific period, thereafter if the person meets the requirements an employment contract for an indefinite period is signed, the establishment of minimum requirements for hiring didactic and scientific staff by higher education framework law of each country comes to support the idea that university autonomy of human resources should be

The USV Annals of Economics and Public Administration Volume 15, Issue 1(21), 2015
84
correlated with the principle of public accountability of the institution. The University is free to select its staff, establish its own criteria (which will not be less than those established by law), but that selection must be among the best or: the State, being aware of the role of the university within the society, establishes rules that will leads to the fact that HEIs option to be in favor of the best performing candidates.
The freedom of institutions to decide on the promotion of employees. This criterion designates HEI right to decide on ensuring career growth of the personnel, by passing to another grade, position or higher vocational stage.
Employee assessment aims at determining promotion opportunities and remuneration criteria. The career promotion of the staff of the universities of the five countries is done according to internal evaluation procedures, with certain exceptions in Romania, where the Law on National Education regulates these procedures. The promotion to a superior function is carried out on a competitive basis, after prior verification and employees’ evaluation is part of the quality management system in force in each institution.
In all five countries university autonomy of human resources is a large one, the institution is free to decide on the periodicity of the evaluation, the structures responsible for the assessment and the assessment methodology.
No external authority supervises these procedures, the institution must take care that the evaluation will be set taking into account the principle of non-discrimination and transparency.
The rights and freedoms of higher education staff. HEIs in the respective five countries have developed a number of policies on the right enforcement of staff in the institutions. These policies also provide the respect of the right to rest by providing both ordinary annual leave and additional leave as well. Institutions are autonomous in terms of providing the creation leave (sabbatical leave) while maintaining the salary, thus stimulating research activities.
The frequency of such leave varies from one country to another and from one institution to another. Usually, the leave provision method is determined by internal documents of the institutions, they enjoying a high degree of autonomy in this regard. For example, the length of the leave varies depending on the seniority that the person has within the institution, as it is a working experience of at least four years in Scotland, at Strathclyde University.
The freedom to decide on the work load lies in HEI’s right to determine the distribution of the working time, the work load, to determine as accurately as possible the work tasks for a member of the academic community.
The teaching load of the academic staff in HEIs of Sweden and Denmark is made up of a total number of hours, distributed monthly throughout the academic year. According to internal regulations of the university, the academic staff’s working hours must be planned within the department the employee activates, as a result of discussions held between him and the head of the department. When planning the working hours, operational requirements, the financial situation and the general analysis of the teaching tasks have to be taken into account. At the department level, the total number of hours for teaching and research will be accounted, by spreading them evenly to all department members.
In Lithuania the work load of the academic staff consists of the teaching and research activities. In Scotland the work load of the academic staff consists of teaching, research, knowledge transfer and fulfilling administrative activities. The share of a type of activity in the totality of the work load is determined by the head of department, who, by assessing the skills of each employee, will organize the activities of the department in such a way that there is a reasonable balance among all members of the department. In Romania, the work load may comprise a number of teaching and research activities.
In all five countries universities benefit from both institutional and national level autonomy. The didactic staff benefits of a reduced work regime due to the increased emotional psycho effort put into the activity. The annual amount of hours represents approximately 1000 hours, out of which approximately ¼ are meant for the direct teaching-contact activities. Institutions are

The USV Annals of Economics and Public Administration Volume 15, Issue 1(21), 2015
85
autonomous in terms of annual distribution of the working hours, this being the responsibility of departments.
The freedom / capacity of institutions to decide on the payroll system. The freedom a HEI to decide on the system of remuneration is manifested by their right to decide on the system of wages, awards, establishing various salary increases depending on the complexity and volume of the work performed work performed by an employee.
In all of the above-mentionned countries the salary consists of a fixed part (the function salary: Lithuania, Scotland, Sweden and Denmark and the basic salary in Romania) and a variable part, which consists of various bonuses, allowances, incentive payments, etc. Each institution is required to adopt wage policies, which will contain provisions on transparency in the wage setting process.
Universities enjoy greater autonomy in relation to the right to determine the conditions of remuneration, except in Romania, where there is an express regulation in the Law of National Education regarding the size of salaries and other incentive payments.
The structures empowered to set wages are usually collegial structures, called Committees for salarization or Commissions labor remuneration. In Sweden and Denmark the employer and employee representatives negotiate criteria for establishing salary criteria for different groups of employees. Based on these criteria the subdivision director / head of department will evaluate each employee in order to establish his rightful wages. These criteria negotiated by the parties to the employment relationship of a HEI will serve as the basis for salary negotiation between the employee and the head of the department, etc. In Romania, the Senate of the institution is responsible for regulating the salary procedures, as well.
The freedom to decide on the termination of employment contracts. The employment contracts of the HEIs staff in all five countries may cease, as a rule, in connection with the expiration of employment term, or at the initiative of either party. Higher education institutions have well-developed policies and grounds for termination are regulated under general rules by the labor law.
It is not possible to report the degree of autonomy in this regard, but it is clear that institutions are autonomous in terms that the decision to terminate employment relationships do not require approval from an external higher authority.
Following the study visit it was decided to perform a cross case analysis of human resource autonomy through the light of the five interfaces mentioned in the first article, namely: governnment - university, university – didactic staff; faculty - students; university - business and university - internationalization.
Government - university interface. The resort ministries of these countries are bodies that develop personnel policies, which must be considered and implemented by institutions, taking into account the principle of non-discrimination. At the same time, ministries have an advisory role in the work of the institution. Less can be said about Romania, where the role of the ministry is one of the main, coordinating and monitoring all activities related to personnel.
Interface management staff - academics. Competitions on employment are open and give the possibility to participate to persons that qualify for the contest, without any discrimination, under the law, and the competition Methodology will not contain discriminatory provisions for candidates based on gender, ethnic or social origin, citizenship, religion or belief, disability, political opinion, social or economic state. The competition methodology makes no reference to seniority and contains no provisions that would disadvantage candidates from outside the institution or abroad. The position description will be made in comprehensive terms that correspond to the real needs of the higher education institution without limiting the number of potential candidates. All vacancies are announced at national and international levels (except Romania, where the vacancy is announced in the Official Gazette).
The academic staff – students interface. The process of study and research in the analyzed countries is based on the "student-centered studies" principle. The student is an active partner in promoting a positive study environment. Students are widely involved in the assessment process of

The USV Annals of Economics and Public Administration Volume 15, Issue 1(21), 2015
86
the course and teaching method quality. Students are part of the Quality Management System. All institutions have developed procedures for evaluating the academic staff, students being widely involved in their implementation.
University – business environment interface. Collaboration with business environment in all visited universities is a mandatory activity. It means that each academic structure should be involved in research and to conduct research projects. Research should be applied specifically for a company, to be useful to the organization and bring to the institution and researcher additional income.
University – internationalization interface. Internationalization is a process designed to improve the quality of training students for a globalized world. The role of the teacher in this process is increased. All institutions in five countries have developed policies on internationalization. Particular attention is given to the mobility ofvstudies at other universities in the world, as well as receiving foreign students in the university. The mobility of academics both in terms of teaching, but especially for research, is an important criterion in evaluating the academic staff.
DIMENSION: FINANCIAL UNIVERSITY AUTONOMY Lately, lots of discussions are held on financial autonomy. Many people are asking whether
financially autonomous universities will decrease or increase the fees for education and for the accommodation in hostels. What will be the impact on the quality of education? In fact, there are too many questions, and some of them don’t have a reasoned answer yet.
First, it has to be clarified what does this type of autonomy represent. We used the definition introduced by Estermann and Hakki (2009), and Estermann, Hakki, and Steinel (2011) as well, by which the financial autonomy of universities is seen as the ability to: accumulate funds and to keep budget surplus funds; establish tuition fees; borrow money from the financial markets; invest in financial products; issue shares and bonds; owns lands and buildings. This means that we will analyze the financial autonomy of universities through the light of certain criteria that define this type of autonomy, but we take into account the five interfaces, which characterize the internal and external points of interaction between modern university and stakeholders, without specifical reference to them.
Thus, it was found out that in all of the five surveyed countries higher education funding is made from two basic sources: public and private. There is a different percentage ratio between these sources. Funding from the state budget in the analyzed countries is based on different approaches: in Lithuania public funds are allocated based on the global grant, which is divided between different categories of expenditure. But the global grant must be spent according to the budget categories presented to the financier or supervisory body, so the university does not have the freedom to decide in which direction the respective amounts to be spent. In other countries (Scotland, Sweden, Denmark and Romania) financing is made under the form of block grant on two funding lines: teaching and research.
The funding of studies is carried out based on different criteria: in Lithuania - the number of physical students (through vouchers); in Scotland - the number of equivalent students (FTE). Their number is determined by dividing the total number of study credits accumulated by all students during the respective year to 60. Sweden considers both physical students (40%), and their performance, by FTE students (60%), as well. Denmark considers only performant and Romania - equivalent students in proportion of 70% and 30%, based on relative quality indicators.
The funding of research in all 5 countries is based on the dual system, which means that some of the expenses are covered by the state and are included in the amount of the voucher (Lithuania) or in the core funding (Scotland, Romania, Denmark) , and are designed to cover some operational and maintenance costs of the infrastructure needed for research. The second part (much larger) is allocated on a competitive basis for projects by the competent authorities of each country.

The USV Annals of Economics and Public Administration Volume 15, Issue 1(21), 2015
87
Each country has its own methodology for allocating financial resources for universities. It's natural that some elements are common, others specific to each state. The allocation of budgetary resources in Lithuania is made based on the principle "money follows the student". The enrolment is carried out by an independent specialized agency and not by the university. The candidates opt for a particular specialty, and being admitted to study, choose the university. The money from the budget, through vouchers, go to those universities that the enrolled students chose. In Scotland and Sweden allocation is carried out, largely, based on allocations from previous years and according to the existing budget at the state level.In Scotland, the Scottish Funding Council concludes an annual memorandum with each university, setting out the respective conditions. In Sweden, a planning of funds for a period of 3 years is made, specifying the respective amount every year. Denmark has a system for allocating financial resources based on outputs. The Ministry allocates resources according to the number of FTE and cost of a student in the respective area: for teaching and basic research. Romania allocates resources to universities based on contracts signed with the Ministry of National Education. There is a methodology based on calculation formulas, that is reviewed annually.
In each of the five analyzed countries there is a historically established methodology for calculating the cost (price) of a student’s training. In Lithuania this methodology is based on calculating the cost (price) per student, which represents the total amount of expenses related to the number of students financed from the state budget in the past. The price varies depending on the training level (bachelor, master, doctorate), the form of education (day time), and the field of study. In Scotland the basis for calculating the cost of preparing a student is the so-called TRAC methodology. The processes thay form the TRAC base take into account direct and indirect costs of the organization in order to be analyzed and attached to activities in a fair and reasonable manner.
In Sweden and Denmark the calculation of the cost per student is based on a Full Costing methodology that allows consideration of all costs, both direct and indirect, incurred by the institution to train a student. After calculations are done at institution level, all costs are divided by the number of students, taking into account the field and form of study. Thus, as the basis for calculating the cost per student serves the humanitarian education cost, while at financing programs using advanced technology components a coefficient depending on the complexity is included. The student that studies on a daily basis is taken into account as well, those studying on a reduced frequency are quantified at 0.75 (Sweden). In Romania there is a methodology based on the use of certain formulas that take into account all costs incurred at university level.
Universities from the 5 countries enjoy, along with funding from the state budget, of funding from private sources, as well. Both the share of private sources and their structure differ from country to country. Practically, there are legal provisions to private sources that may be attracted to higher education, and means of monitoring their use. Private sources are used depending on the strategy adopted by the university. Monitoring the use of resources is carried out by internal financial audit, and by external financial audit through various control bodies specific to each country, which verifies the use of financial resources by the destination established in the university plans. So, in terms of financial university autonomy, the use of revenues from private sources is not specifically monitored.
Not all universities have the right to borrow money on the financial market. Thus, in Lithuania higher education institutions have the right to loan money through loans, to sign credit agreements, leasing (finance lease) within the overall lending limits established by the Law approving the financial indicators from the state and municipal budgets for the respective year. In Scotland, the university may borrow money from banks only by bringing reasons and with the consent of the Scottish Funding Council. In Sweden universities can borrow money on the financial market only from the bank specified (designated) by the responsible authority. In Denmark universities are allowed to borrow money from the financial market without restrictions. In Romania, the law allows universities to borrow money as well.
Universities in all of the five countries have the freedom in determining the size of tuition fees. Even in countries where there are no taxes for local students and those from the European

The USV Annals of Economics and Public Administration Volume 15, Issue 1(21), 2015
88
Union (Scotland, Sweden, Denmark) universities establish the size of fees for students from outside the European Union, as well as for another category of students, such as those from masters, etc. The requirement imposed in all these countries is that the fee considers all types of costs and is not less than the actual costs for the preparation of a student.
In the 5 countries the respective study reffers to the tuition policy for local citizens and those from the European Union is the same. The university establishes the tuition fee by itself fro students coming from countries outside the European Union. Usually, it's bigger than the tuition for the domestic ones and than the actual training costs. In Romania, university senates can determine the final size of the fees for foreigners, but not less than the amount set by the Government Order.
The situation regarding cash balances at the end of the year in these countries is of a high interest. In Lithuania and Scotland the money left at the end of the year, from the state budget must be reimbursed to the State. The balance of own resources is kept by the university and can be transferred to the next year. In Swedish, Danish and Romanian universities the unused funds, regardless of their sourcing, remain at the university and can be reported from year to year.
When referring to the right to be own a property we find out that the situation in this respect is different as well. Thus the universities from Lithuania, Romania and Denmark can be owners of buildings purchased from its own sources. The ones purchased from public funds belong to the state. In Sweden, universities do not have the ownership of buildings. They are renting space from a state agency that manages these buildings. In Scotland universities only manage the property.
All of the surveyed countries have certain ways of supporting the students. Performance and social scholarships are granted to students by universities in Lithuania and Romania. In Lithuania students can obtain state-supported loans to cover their study costs, living expenses, partial studies according to international agreements. In Scotland scholarships are granted by an independent agency. In Scotland, Sweden and Denmark students receive grants and loans under certain conditions. Thus, in Denmark and Scotland loans should be repaid during 15 years after graduation, while in Sweden - during 25 years as reimbursement only after reaching a certain level of income.
There is no homogeneous distribution of resources within the university. Thus, in Lithuania the distribution of resources is undertaken centrally by the administration, while in other countries (Scotland, Sweden, Denmark and Romania) - in a decentralized manner. Many universities apply the funding principle within the internal allocation of funds identical to that at the country level.
CONCLUSIONS Although universities of the almost all of the analyzed systems have internal regulations,
which provide a framework for their organizational autonomy, the number and level of detail of these rules differ a lot. In most cases, national legislation contains only guidelines on setting the decision-making body (bosdies), their structure and representative groups the members of which are selected of.
In most of the studied countries universities are relatively free to decide on their administrative structures. This is also true for their ability to decide, within the legal framework, on the academic structures and the creation of legal entities. Through such entities institutions may carry some additional activities, both non-profit and commercial.
The inclusion of external members is an important element in preparing competitive specialists on the labor market, efficient cooperation of the scientific environment with the business environment, as well as increasing the accountability of autonomous universities to stakeholders and society as a whole.
In most of the analyzed systems institution's governing bodies include external members who are either selected by universities themselves or are nominated by an external authority, based on the opinions provided by universities.
The head of the executive body of the university is always selected / elected by the institution and is responsible to the governing body of the university. In some of the studied systems the head of the executive body is selected or elected, appointed / confirmed by a higher authority.

The USV Annals of Economics and Public Administration Volume 15, Issue 1(21), 2015
89
With regard to the executive management, in most of the analyzed countries the transition to a "managerial" type of leadership seems to contribute to greater autonomy in the management of universities and their internal structure determination.
Analyzing the legislation of the 5 European countries with respect to their Higher Education systems and internal norms we observed homogeneity in treating the most important issues in the academic and research areas. This, in our view, is the result of the implementation of the basic lines of the Bologna process, which aims at harmonizing the education systems. Higher education institutions in EU countries have a well-defined academic autonomy, and concrete obligations and responsibilities towards society and central administrative authorities as well.
The central administration determines the policies and development strategies of education, and is responsible for assessing the achievement of these strategies. Institutions are autonomous in choosing tools and mechanisms to achieve the educational and research process and are fully responsible for the quality of the final results.
There is no perfect model of human resource autonomy, but there are good practices of certain universities with traditions, which, once taken and adjusted to socio-economic realities of our country could bring positive results, strengthen institutional capacities of higher education and would increase autonomy of the existing human resources management, correlating it with the principle of public accountability of each institution or: university autonomy means, besides freedom, a high level of responsibility as well.
The respective study demonstrated that the financial autonomy of universities is characteristic for all of the above-mentioned states. There’s still a difference in the degrees of freedom they have in solving certain problems. It is to be noted that it’s impossible to highlight an ideal model, perfect for use in any country. Every time it has to start from specific features, traditions and the historical evolution of universities. In the same time, the high degree of responsibility universities have at using the financial resources was very much stressed.
REFERENCES:
1. A strategic analysis of the Scotish Higher Education Sector’s distinctive assets. A study commissioned by British Council Scotland , Neil Kemp, William Lawton, April 2013
2. Aarhus University By-laws, http://goo.gl/mDo40T 3. Accounting Model for Allocating Indirect costs in Higher Education Institutions, link
http://goo.gl/PffSOA 4. Al. Ioan Cuza University Chart from Iaşi, 2011, http://goo.gl/msSs9S 5. Bucharest University Chart, 2011, http://goo.gl/jC2cD5 6. Constantin Oprean, Vasilie Moțoc, Camelia Oprean „Per student equivalent cost, an
instrument for financial management of the university”, link http://www.managementmarketing.ro/pdf/articole/61.pdf
7. Consultation on the development of a new Scottish Code of Good HE Governance - Issues Paper, November 2012
8. Efficiency and effectiveness of public expenditure on tertiary education in the EU Annex: Country Fiche Denmark, , link http://goo.gl/R5LYtF
9. Funding Systems and Their Effects on Higher Education Systems Country Study Denmark, November 2006 Evanthia Kalpazidou Schmidt, Kamma Langberg, Kaare Aagaard The Danish Centre for Studies in Research and Research Policy University of Aarhus, link http://www.oecd.org/denmark/38307998.pdf
10. Further and Higher Education (Scotland) Act 1992, http://goo.gl/QlZR6U 11. Gharter of the University of Strathclyde http://goo.gl/yMu04L 12. Guide for Members of Higher Education Governing Bodies in the UK, March 2009, link
http://goo.gl/AwSVaY

The USV Annals of Economics and Public Administration Volume 15, Issue 1(21), 2015
90
13. Law on Higher Education and Research, Republic of Lithuania, 30 APRIL 2009, no XI-242, http://goo.gl/Ry36fg
14. Law on National Education, no. 1, 2011 (with later modificationa and completions), http://edu.ro/
15. Methodology for allocation of budget funds for excellence-based core financing and supplimentary financing of higher education institutions from Romania for the year 2013, link http://goo.gl/WrmCqt
16. Mikolas Romeris University Statute, http://goo.gl/oX7G7u 17. Ordinance on application fees and tuition fees at higher education institutions, Sweden, link
http://goo.gl/MFP4aK 18. Ordinances of the University of Strathclyde, http://goo.gl/07UGBx 19. Peter Maassen Models of Financing Higher Education in Europe, Center for Higher
Education Policy Studies (CHEPS), University of Twente, 2000 20. Regulations of the University of Strathclyde, http://goo.gl/cCJThg 21. Romanian Government Ordinance no. 22 of August 29, 2009 establishing the minimum
amount of tuition fees, in currency, for citizens studying on their own expense in Romania from countries not members of the European Union and countries not part of the European Economic Area and of the Swiss Confederation;
22. Romanian Government Ordinance no. 57 of August 16, 2002 on scientific research and technological development;
23. Stancu Ion, Bodea Constanta ș.a. (2011), Financial Resources Management in Higher Education, București
24. The Danish (Consolidation) Act on Universities (the University Act) 25. The Swedish Higher Education Act Högskolelag (1992:1434) 26. The Swedish Higher Education Act, 1992, http://goo.gl/ywcSM9 27. Thomas Estermann and Anna-Lena Claeys-Kulik (2013) Financially Sustainable
Universities Full Costing: Progress and Practice 28. Thomas Estermann şi Terhi Nokkala, University Autonomy in Europe I (2009),
http://goo.gl/vuJzR8 29. Thomas Estermann, Terhi Nokkala şi Monika Steinel, University Autonomy in Europe II,
the Scorecard (2012), http://goo.gl/MYRn7i 30. Transparent Approach to Costing (TRAC) Guidance: prepared for the JCPSG by J M
Consulting Ltd, link http://www.jcpsg.ac.uk/guidance/about.htm 31. Vilnus University Statute, http://goo.gl/Y4ysnz

The USV Annals
of Economics and
Public Administration
Volume 15,
Issue 1(21),
2015
91
PRIORITIES IN REGIONAL DEVELOPMENT IN ROMANIA
AssociateprofessorPhDMihaiPOPESCU“ŞtefancelMare”UniversityofSuceava,RomaniaFacultyofEconomicsandPublicAdministration
Abstract: This paper attempts to bring answers to some questions that are born , more quickly , on how Romania
manages to cope with EU requirements . The paper does not claim to treat exhaustively the proposed issue , but attempts to present a balanced and understandable manner the decisive role that regional policy plays in the effective implementation of Europe 2020 , based of the situation in Romania. I chose to approach this subject as, besides being a very topical theme, which continues debate is a table of positioning Romania in the European context , not only economically , regional policy and strategy since 2020 applied to Romania's case highlights the disparities between our country and other parts of Europe.
Key words: regional development,strategies, national objectives , economic restructuring JEL classification: O11, O47, P25
1. REGIONAL DEVELOPMENT IN ROMANIA
Romania has tried since 1989 to build a regional development policy, the fundamentals both internal and external. Internal reasons economic weakness of a region that has been severely affected by the transition period following the exit from communism. Such weakness was not tolerable, since it could easily degenerate into political and economic instability, leading in this way to create major obstacles for the entire national development [1].
External reasons were related to Romania's aspirations to join the European Union in 2007, a process which involved numerous changes at multiple levels, including regional development. Regional policy in Romania has no tradition, no formal or documented. It is possible regionalization to affect the very existence of the nation state, and this could be one of the reasons the 8 regions were simply drawn on the map Romania to meet European integration requirements (regions should have about the same territorial expanse roughly the same population) in an attempt to avoid possible historical factor.
Regional policy in Romania has started to develop simultaneously with Phare [2] in 1996. However, a legal basis has been developed only in 1998, with the adoption of the Law on Regional Development (Law 151/1998 and Law 315 / 2004), which brought some clarification on the situation of the 8 regions, associations considered "voluntary" local administrative units) and on the institutional framework on regional policy.
The negative consequences of this organization equalizers centralized and Romania were felt immediately after the fall of communism in 1989, when some economic and social changes and some reforms were inevitable. During the transition period that followed it was preferred "shock therapy" to the detriment of gradual change and resulted in the acceleration of privatization, liquidation of bankrupt companies, price liberalization, reduction of customs duties, foreign investment promotion etc. Some policy areas where restoration was tougher were affected by an economic and social decline and is facing extreme environmental degradation, high rates of unemployment and very low living standards. The deepest and most obvious discrepancies in Romania after 1990, given the changes in structural terms were between urban and rural areas.
Romania's main problem was the fact that this restructuring targeted a "cleansing" of the economy unprofitable activities, without however doubled up activities to stimulate economic growth. The result was producing more negative effects.

The USV Annals of Economics and Public Administration Volume 15, Issue 1(21), 2015
92
Poorer regions have suffered a rather forced and artificial industrialization during communism, which meant also that the regions concerned have been most affected by the transition, once the industry was not producing profit that was totally closed in 1990. These regions are located in the northeastern part of the country - the historical region of Moldova - and south - Plain Romanian agricultural region. In terms of average income and unemployment rate, Moldova and Muntenia are the poorest regions, while Transylvania and Banat are the most extensive and Oltenia, Maramures is characterized by a medium level of development. It should also be mentioned huge discrepancy between the Bucharest - Ilfov and all that, as in all capital domeniil attract investors and has a rapid level of development.
Current Discrepancies in Romania are both regional (between the 8 regions), corresponding to level II established Nuts and intra (between counties included in each region), corresponding to level III established Nuts. Nomenclature of Territorial Units for Statistics (Nomenclature of Territorial Units for The Statics) is a hierarchical system to divide the economic territory of the European Union. Level II is a population between 800,000 and 3,000,000 inhabitants and level III - a population between 150,000 and 800,000 people [3].
Therefor, Romania's regional policy was outlined only to meet financial assistance by the European Union. We may wonder whether Romania has indeed a coherent public policy of this mechanism (given especially politically), as experience has shown that member states with a tradition in regional development have been implemented better and even users Best of financial resources received from the European Union. 2. THE CURRENT SITUATION 2.1. REGION, REGIONALIZATION, THE IMPACT OF REGIONAL POLICY
Creating European Union has meant a reaffirmation of the role of the national state, which has eroded the powers degree. The boundaries, both internal and external, were redrawn and the decision has not been the prerogative exclusive, national governments, acting alone or in tandem with each other.
Regions, once defined, although they were formed on administrative criteria, tend to build up a certain identity and become functional regions. In other words, the actors tend to evolve towards regional cooperation and interdependence with other actors positioned in the same region. For example, public corporations tend to include organizations from a single region, entrepreneurs tend to seek contractors in one region and rely solely on the existing workforce in the region.
Regionalism can be of several kinds: political (Spain and Italy), incorporated (the unitary state is formed by unifying several states retain their individual characteristics), various (regional administrative structures are not based solely on political or territorial criteria, but on the basis of language and culture), classic (France, where regions are the result of decentralization), functional (for Greece, where the regions are simple district state administration) and cooperation (for Romania [4], with regions the result of cooperation between local authorities).
One controversy is linked to this regional policy promoted by Romania, referred to as "artificial" because of the way the definition and delimitation of the regions, whereas the geographic dimension is not necessary to draw a region. Its limitations should be a social decision, based on one or more criteria. Of these, the most important are: [5] - features Spatial / Geographic Region consists given certain special geographical features; for example: the Black Sea - social features: language, religion, culture, nationality - politico-administrative features: the limits of the region are set according to a certain rule; for example, regions should have similar size - economic characteristics: the regions is based on a certain type of economic activity.
Romania had a chance to become an EU member in 2007. Although accession of Romania involves numerous rights and benefits, it also involves obligations on Member statului-. Romania

The USV Annals of Economics and Public Administration Volume 15, Issue 1(21), 2015
93
should be aware that regional policy will bring the expected benefits if and only if it will be released in connection with another comprehensive policy, national development and the overall development policy of the state. In the absence of other mechanisms, regional policy will not have the expected effects. Regional development must be a partnership between government, business and community.
In Romania regionalization is directed to discrease disparities between regions, it should be taken into account that poorer regions are less able to absorb funds and, moreover, if they obtain, use them effectively. If local skills cannot themselves generate progress and prosperity, viable solution is to be given assistance to develop their skills in creating solid income from economic activities.
It is also important to note that the intervention is not always the optimal considered that would allow maximizing the benefits and minimizing the negative effects, but is still kept as a reference rural- urban limit.
The eight development regions are not administrative units and there remains the question of whether they really are the most effective way of dividing Romania. The current structure cannot be changed, since Romania is obliged to maintain this form of territorial division during the implementation period 2007-2013. Any change to the structure is a complex process that requires consultation with all the agents involved, including the European Commission.
The success of a region will depend ultimately on its ability to self-organize and organize players around common goals, to adapt and adjust according to external pressures. Source development of a region is to the region itself, in its people, its institutions and, most importantly, its innovative spirit and entrepreneurship of the region's population. 2.2. REGIONAL COMPETITIVENESS AND ECONOMIC AGGLOMERATIONS
The idea of regional competitiveness has become topical in the context of globalization, as the flow of goods, capital and labor around the world has become a reality. Investors are attracted to regions where human capital is well prepared and where labor cost is at a fair.
According to B. Gardinier (2004), there are three main sources that determine regional competitiveness: infrastructure and accessibility, human capital and environment.
The current trend in Romania to keep up with the pace of globalization is creating economic clusters. An economic agglomeration is a geographic concentration of interconnected companies, suppliers of services, firms in fields related or associated institutions (eg universities, standardization agencies and professional associations) in certain sectors, who are simultaneously and competitors and collaborators. In the European Union as an example of such clusters can be given: Alsace-Ruhr steel industry or the chemical industry in Basel. If we consider the case of Romania, we can talk Galati shipbuilding industry, the timber industry in Mures, Bukovina's tourism industry, the automotive industry in Arges etc.
There are two main causes that lead to the creation of economic clusters in Romania. The first case relates to soil, climate, water waterways, in other words, regional facilities can not be changed. The second category of cases are related to the chosen location circularity, through this understanding that businesses want to be where there are large markets and large markets will be where the companies are located. Economic clusters and trade are inextricably linked. Romanian companies will try to focus activity close to the main markets, which will enable them to reduce production costs due to external factors, and transport costs.
The link can envisage between regional policy and economic agglomerations is: clusters is a key factor of economic growth, but it is important to note that they will not automatically lead to reducing disparities between regions and cohesion. Applied Economics Group (The Group for Applied Economy) considers that Romania has a dynamic business environment and a substantial competitive potential, but also a limited capacity for monitoring and evaluation of the advantages actions. The lack of a legal framework to empower action and discretion regions is perhaps the biggest barrier to decentralization.

The USV Annals of Economics and Public Administration Volume 15, Issue 1(21), 2015
94
In conclusion, it can say that the EU is in constant motion. The process of integration of Romania into the Union has been slow and full of difficulties and the integration has changed the direction of economic integration to one that includes more social and political opportunities. As regards regional policy programs designed to eliminate poverty must take into account that the poor are not able to achieve an effective absorption of European funds, as neither are unable to manage or use them. By offering substantial amounts of less developed regions, you might miss some important opportunities in more developed regions.
The main challenge for Romania is to be able to make an effective tool for regional development, economic and social cohesion. Although cohesion can only be achieved through regional development, according to the European Union, it remains the most important instrument.
Regional policy is a financial mechanism put into practice the principle of solidarity and social cohesion and interregional economic efiientă resulting in a redistribution of income. Regional policy makes it possible meeting in the same place at the same time the three factors needed for development (territorial resources, human resources and capital), given that these factors can not always be found together. 3. EUROPE 2020 AND DEVELOPMENT PRIORITIES
Europe 2020 will feature three priorities: smart growth, sustainable growth, inclusive growth and of course the crisis. She also brings some significant news. First, the Europe 2020 strategy stimulates a new kind of growth (smart, sustainable and inclusive) by increasing the powers and strengthening education throughout life, fostering research and innovation, the use of smart grids and smart digital economy , modernization of industry, to promote a more efficient use of energy and resources.
It also aims to strengthen governance by regular monitoring and transparent decision-making at the highest political level - the European Council. The Commission will lead this process and will use all the new tools introduced by the Treaty of Lisbon: recommendations, warnings and, where serious delays, the possibility of sanctions. 3.1. PRIORITIES - GOALS - FLAGSHIPS
The Europe 2020 strategy proposes five major objectives that the European Union should consider to boost growth and employment. A first objective is to increase the employment rate of the labor population aged 20 to 64 from the current 69% to at least 75%.
It also aims to achieve a level of 3% of GDP investment in R & D, in particular by improving the conditions for investment coming from the private sector and developing a new indicator for innovation.
A third objective is to reduce emissions of greenhouse gases by at least 20% compared to 1990 levels or by 30% if the conditions are favorable and also to increase the share of renewable energy consumption Final energy to 20% and achieve a 20% increase in energy efficiency. Another object on which it proposes strategy in question is to reduce the drop out rate from the current rate of 15% to 10% and to increase from 31% to at least 40% share of graduates in the population aged between 30 and 34 years.
European strategy 2020 also aims to take out of poverty around 20 million people, reducing by 25% the number of Europeans living below the subsistence level.
So the five objectives of the Europe 2020 Strategy are: employment; growth, development and innovation; Climate Change and Energy; education; poverty and social exclusion. These objectives define the position that the EU should deal with 2020 in terms of some major parameters are interdependent and mutually reinforcing. Thus, progress in education plan contributes to improving employment prospects and poverty reduction. More research and innovation and efficient use of resources helps us become more competitive and provide better living conditions.

The USV Annals of Economics and Public Administration Volume 15, Issue 1(21), 2015
95
These objectives are translated into national targets, for each of them to be able to track progress. They are common and not burden sharing, to be achieved by action at national and European level.
The EU has identified areas that could boost economic growth and create new jobs. They are at the center of major şapteiniţiative. Within each initiative, the European and national authorities should coordinate their efforts to support each other. Most initiatives were presented by the Commission in 2010. 1) Innovation Union: to improve framework conditions and access to finance for research and innovation available to strengthen the innovation chain to ensure levels of investment throughout the Union 2) Youth on the Move: to improve the performance of education systems in the European Union and strengthen both the international attractiveness of Europe's higher education institutions 3) A Digital Agenda for Europe: to accelerate the development of high-speed internet services and to benefit from a digital single market for households and businesses 4) efficient Europe in terms of resources: to help decouple economic growth from resource use by decarbonising our economy, increasing the use of renewable sources, modernizing the transport sector and promote energy efficiency 5) An industrial policy for the globalization era: to improve the business environment, especially for SMEs, and to support the development of a strong and sustainable industrial base able to compete globally 6) An agenda for new skills and jobs: to modernize labor markets by facilitating labor mobility and skills development throughout the life cycle in order to increase labor participation and better matching between demand and supply labor 7) The European Platform against Poverty: to ensure social and territorial cohesion so that the benefits of economic growth and employment growth are widely shared and people experiencing poverty and social exclusion can live in dignity and to take an active role in society
For the implementation of Europe 2020, all policies and tools that were previously used in the Lisbon strategy must be improved. Particular attention should be paid to the Single Market, the composition of the budget and foreign policy.
The Single Market must be deepened. This involves removing all residual bottlenecks to cross border activity; creating a single market for services; full implementation of the Services Directive; exploiting the huge potential of information and communications technology; improving SME access to the Single Market; protection of market competition against any temptation to economic nationalism.
All economic policies should be useful for achieving the Europe 2020 objectives of cohesion policy and structural funds should be used to achieve the Europe 2020 priorities, the European Investment Bank and European Investment Fund should focus on innovation funding and entrepreneurship, and the EU's multiannual budget should reflect long-term growth priorities.
All foreign economic policy instruments should be used to stimulate European growth. This applies to all external aspects of internal policies and trade and international macroeconomic policy coordination. EU must assert itself more effectively on the world stage, playing a major role in shaping the future global economic order G20 and must follow European interest through the active use of all instruments at its disposal.
Governance of the Europe 2020 strategy follows a double track: a thematic approach which focuses on three priorities of smart, sustainable and inclusive growth and the five objectives; a national approach that focuses on crisis exit strategies of each Member State dealing with macroeconomic stability and sound public finances finding.
The first step in the political process is the approval of the Integrated Guidelines by the European institutions located at a higher level. These guidelines refer both to long-term growth issues and issues related to exit from the current economic crisis [6]. Then the implementation of the policy is divided into two: a thematic approach and strategy of each country reporting.

The USV Annals of Economics and Public Administration Volume 15, Issue 1(21), 2015
96
The thematic approach covers three to five strategic priorities and objectives. Each Member State should report annually on progress in implementing the strategy and objectives (NRPs). The EU will comment on these reports and distribute each state implementation advice on the form of recommendations.
Reporting every State to strategy relates to the implementation of exit strategies, to restore macroeconomic stability and return to sustainable growth and public finances consistent. Euro area Member States prepare annual stability programs annually, while the other EU Member States prepare convergence programs and submit them to the Commission and Council. Council examines the programs at the beginning of each year and issue an opinion on the program each Member State on the basis of assessments by the Commission and the Economic and Financial Committee (EFC).
The European Council is responsible for driving the strategy through general assessment of the progress made at European and national level and at the same time satisfies a more general role of guidance and control.
The Council is primarily responsible for monitoring and peer review. State ministers responsible for each relevant policy areas discussed implementation of the national reform program in their area of competence.
The Commission is monitoring the situation every year, based on a set of indicators showing overall progress towards the headline targets of Europe 2020; prepares an annual growth survey and assess the reports states and stability programs / convergence; issuing specific recommendations and, if necessary, policy warnings Member States.
EU governments must draw up two reports each year, by explaining what they do to get closer to the objectives of the Europe 2020 national stability programs / convergence should focus on public finances and fiscal policy. National Reform Programmes should focus on progress towards achieving the national objectives of the Europe 2020 strategy for smart, sustainable and inclusive growth. The two reports are separate reports, but delivered simultaneously.
Guidelines of Europe 2020 are: 1. Ensuring the quality and sustainability of public finances 2. Addressing macroeconomic imbalances 3. Reducing imbalances in the euro area 4. Optimising support for R & D and innovation, strengthening the knowledge triangle and development potential of the digital economy 5. Increase resource efficiency and reducing emissions of greenhouse gases 6. Improving business and consumer environment and modernizing the industrial base 7. Improving labor market participation and reduce structural unemployment 8. Developing a skilled workforce responding to labor market needs, promoting job quality and lifelong learning 9. Improving the performance of education and training at all levels and increasing participation in higher education 10. Promoting social inclusion and combating poverty 3.2. ANALYSIS OF PRIORITIES
The seven initiatives of the Europe 2020 strategy are correlative to the three priorities set by the European Commission: smart, sustainable and inclusive growth. But an important difference between the Europe 2020 Strategy and the Lisbon Strategy is that the first was launched in the midst of a profound economic crisis, which is why Europe 2020 Strategy includes an important section regarding exit strategy. Crisis exit strategy focuses on finding and attracting financial resources consistent, progressive withdrawal of short-term sectoral aid, better policy coordination in the economic and monetary union.

The USV Annals of Economics and Public Administration Volume 15, Issue 1(21), 2015
97
1. Smart growth involves the improvement of the EU in the fields of education - by encouraging learning and skills upgrading); research and innovation - creating new products and services that create growth and new jobs and help us meet the challenges of social order; digital society - use of technology and information.
Smart growth means strengthening knowledge and innovation as drivers of our future growth. This requires improving the quality of education, strengthen research performance, promoting innovation and knowledge transfer throughout the Union, and full use of information and communication technologies.
Under this priority, the EU promotes three flagship initiatives: Innovation Union, Youth on the Move, A Digital Agenda for Europe. a). Innovation Union aims to refocus innovation policy and research and development to the challenges facing our society, such as climate change, energy and resource efficiency, health issues and demographic change. b). Youth on the Move aims to improve the performance and international attractiveness of Europe's higher education institutions and increase the overall quality of all levels of education and training in the EU by promoting mobility of students and teachers and improve employability of youth . c). A Digital Agenda for Europe aims to bring economic and social conditions due to a Digital Single Market based on fast and ultra fast internet and interoperable applications, with broadband access for all by 2013, access for all to much higher speed 2020, and increased by 50% or more of European households having internet connections above 100 Mbps (megabits per second). 2. Sustainable growth means setting a competitive, sustainable, resource-efficient, low-carbon, exploiting Europe's leadership in the race to develop new processes and technologies. This priority includes investment in clean technologies and renewable energies, environmental protection, reduction of emissions of greenhouse gases and halt biodiversity loss decoupling resource use from non-renewable energy, combating climate change and improving capacitatăţii of disaster prevention and response where they occur.
Under this priority, the EU promotes two flagship initiatives: An efficient Europe in terms of resource and an industrial policy for the globalization era. a). An efficient Europe in terms of resource aims to support the transition to an economy that uses resources efficiently. The goal is to decouple economic growth from resource and energy use, reduce carbon dioxide emissions, enhance competitiveness and promote a greater energy security. b). An industrial policy for the globalization era aims to implement a modern industrial policy, entrepreneurship support, guidance and support industry to meet the challenges of globalization, promoting competitiveness primary service industries, manufacturing and services in Europe and help them exploiting opportunities in green economy. This involves improving the business environment to promote the restructuring of sectors in difficulty towards future oriented activities, promote technologies and production methods that reduce natural resource use, promoting the internationalization of SMEs, increasing competitiveness in the tourism sector. 3. Inclusive growth means empowering people through high levels of employment, investing in skills, fighting poverty and modernizing labor markets, training and improving social protection systems. Under this priority, the EU promotes two flagship initiatives: An Agenda for New Skills and Jobs and European Platform against Poverty. a). An agenda for new skills and jobs aims to create conditions for modernizing labor markets to increase employment levels and ensuring the sustainability of our social models. This means empowering people through the acquisition of new skills to enable our workforce to adapt to current and future conditions to us and possible career changes and reducing unemployment and increasing labor productivity. b). European Platform against Poverty aims to ensure economic, social and territorial cohesion, combating poverty and social exclusion. This means implementing programs to provide opportunities for education, training and employment innovative disadvantaged communities and to

The USV Annals of Economics and Public Administration Volume 15, Issue 1(21), 2015
98
fight discrimination, to facilitate the integration of immigrants, and to cope with the groups at particular risk. 4. CONCLUSION
As regards regional policy, it emerged only to meet financial assistance by the European Union. For regional policy to have the desired effects, there must be mechanisms for implementing economy-administraţie- to coordinate the community as efficient as a direct result of regionalization, far from being labeled as "artificial". We have made considerable progress and rapid development of the process of regionalization, for it to meet economic and social realities existing in Romania, and is also in line with the will of the people.
Romania should be aware that regional policy will bring the expected benefits if and only if it will be released in connection with another comprehensive policy, national development and the overall development policy of the state.
The crucial problem of the country remains poverty, the percentage of people living below subsistence level, in poor conditions, without access even to education, increasing. 5. ENDNOTES [1]. Claudia Ionescu, Regional development policy - vol. 2, Ed. Triton 2007 [2]. Nomenclature of territorial units for According to statistics - Regions in the European Union Nomenclature [3]. According www.mie.ro [4]. Sandu D., Optimising regionalisation in today Romania, University of Craiova Conference on Regional Development, April 2012 [5]. Jozsef Benedek, Regional Policies in Romania, Polirom, 2011 [6]. Paul Krugman, Return economy decline and crisis of 2008, Ed. Post, Bucharest, 2009 6. BIBLIOGRAPHY
1. Benedek Jozsef, Regional Policies in Romania, Polirom, 2011 2. Ionescu Claudia, Regional development policy - vol. 2, Ed. Triton 2007 3. Nomenclature of territorial units for According to statistics - Regions in the European Union
Nomenclature 4. Krugman Paul, Return economy decline and crisis of 2008, Ed. Post, Bucharest, 2009 5. Sandu D., Optimising regionalisation in today Romania, University of Craiova Conference
on Regional Development, April 2012 6. Scutariu Adrian Liviu, Năstase Carmen, Comparative evolution of tourism in the North-
Eastern Region of Romania, Subcarpathia of Poland and Central Slovakia, Bulletin UASVM Horticulture, Nr. 67 (2), 2010, pp.229-237
7. www.mie.ro

The USV Annals
of Economics and
Public Administration
Volume 15,
Issue 1(21),
2015
99
ASPECTS OF REGIONAL COMPETITIVENESS THROUGH
DYNAMIC PRICES OF PETROLEUM PRODUCTS
AssociateProfessorPhDDanielaENACHESCUPetroleum‐GasUniversityofPloiesti,Romania
Abstract: This paper presents aspects regarding the dynamics of prices of petroleum products: gasoline and diesel in
Romania in the period 2003(2007)-2014. Both focus on relationship-price raw material and finished product by the impact of market prices. Given that the price of fuel is a key factor in economic development but also in the living of population, this paper has proposed to analyze some aspects of the dynamics of prices of petroleum products in correlation with commodity prices in a competitive market in 2003 -2014. In the analized period, price of oil barrel has a dynamics substantially influenced by the global political turbulences but also by lower oil demand due to consumption reduction, especially lately. Increases and decreases were abrupt and unpredictable in the early years of the first decade of the XXI century. Political crises in the Middle East, the economic crisis started in 2007 and especially the crisis in Ukraine and policies adopted by the EU and the US have led to extremely large fluctuations in oil prices from one period to another . This dynamic will only cover the price of petroleum products namely gazoline and diesel for vehicles.
Key words: regional competitivness, dynamics of prices, petroleum product prices, gazoline, diesel
JEL classification: A10, L71, R10
1. INTRODUCTION
Despite all the predictions, oil remains one of the most important energy resources for the economy of a country. However, few nations in the world and in Europe were blessed with "black gold", and they enjoyed a rapid growth based on the industry.
If in the world, Saudi Arabia holds the first position in the ranking, with a daily production of 11.726 million barrels of oil, oil production in Romania halved from the Revolution to the present, from almost 8 million tons of oil extracted in 1990 to 4 million tonnes in 2013. Although production fell to 86.000 barrels / day, our country has managed to maintain a leading position as the 10th largest producer of petroleum in Europe and Eurasia according to statistics from British Petroleum, black gold "is, in fact, the most sensitive area of Romania on energy imports, and no gas”[4].
On the other hand, consumption of oil and oil products decreased in Romania in 2012, standing at 182,000 barrels a day, which represents 0.2 percent of global consumption [10]. The economic crisis which began in 2007 had a significant impact not only on production branches (Zaharia, 2015) or services in most EU countries (Zaharia, Enăchescu & Bălăcescu, 2014) but also the price of oil, one of the most important resources of XX and XXI centuries (Enachescu, 2002).
On the other hand, the deteriorating of international situation and the political crisis caused by Ukraine, the economic restrictions imposed to Russia, one of the most important oil producing countries in the world (the third place) had a major impact on the decrease oil prices but also to finished products: gasoline and disel .
The paper aims to analyze the dynamics and correlations commodity prices: oil well finished products: diesel and gasoline in the period 2003-2014.
2. ANALYSIS OF THE DYNAMICS OF OIL PRICES AND FINISHED PRODUCTS
For analyzes on the prices of oil and oil products were used data from statistical databases INS (National Statistics Institute) (http://www.insse.ro/cms/), NBR (National Bank of Romania )

The USV Annals of Economics and Public Administration Volume 15, Issue 1(21), 2015
100
and portals Europe's Energy Portal official (http://www.energy.eu), International Energy Agency (IEA) (http://www.iea.org/), OPEC (http://www.opec.org), Eurostat and the National Union of Road Hauliers portal (http://www.untrr.ro/)
BARREL OIL PRICE DYNAMICS
It will analyze price dynamics for OPEC Reference Basket barrel of crude oil (ORB) annually, in the period from 2003 to 2015, and from February 2014 to 2015, monthly, when there were significant fluctuations.
The new OPEC Reference Basket (ORB) was introduced on 16 June 2005, is currently made up of the following oil sources: Saharan Blend (Algeria), Girassol (Angola), Oriente (Ecuador), Iran Heavy (Islamic Republic of Iran), Basra Light (Iraq), Kuwait Export (Kuwait), Es Sider (Libya), Bonny Light (Nigeria), Qatar Marine (Qatar), Arab Light (Saudi Arabia), Murban (UAE) and Merey (Venezuela)[8].
In the period 2013 - 2015, price of oil barrel has a dynamics substantially influenced by the global political turbulences but also by lower oil demand due to consumption reduction, especially lately. Increases and decreases were abrupt and unpredictable in the early years of the first decade of the XXI century. Political crises in the Middle East, the economic crisis started in 2007 and especially the crisis in Ukraine and policies adopted by the EU and the US have led to extremely large fluctuations in oil prices from one period to another (figure no. 1).
61.06
77.45
105.87
96.29
48.91
109.45107.46
94.45
28.1020
30
40
50
60
70
80
90
100
110
120
2003
2004
2005
2006
2007
2008
2009
2010
2011
2012
2013
2014
2015
US
$/b
a r
Figure no.1. Evolution of the price of a barrel of oil in the period 2003-2015
Source: own processing after http://www.opec.org/opec_web/en/data_graphs/40.htm
In the first part of the last decade, in the period 2003-2008, oil prices increased 2.36 times from 28.10 US $ / bar in 2003 to 94.45 US $ / bar in 2008. A very good approximation of this evolution is given by linear model:
1,439.12608.12 12003/$ tttP barUS (1)
The above statement is supported by the coefficient of determination ( 96642 R ) corresponding to the model (1). Linear increase in the price of a barrel of oil, from this period can be attributed to the process of economic growth in a relatively stable in terms of the international situation, which led to continuous growth in demand.

The USV Annals of Economics and Public Administration Volume 15, Issue 1(21), 2015
101
First interrupting of this process occurs in 2009 and is determined by the magnitude of the financial crisis that affected nearly all oil-consuming states. Consequently, in 2009, the price of a oil barrel fell by 35.3% compared to 2008, being approximately equal to that of 2006. The years that followed have led to a rebound in oil prices, the biggest increase was recorded in 2011 when oil prices rose 30.01 US $ / barrel above the level recorded in 2010.
The 2011-2013 period is characterized by relative stability of oil prices around an average of 107.5 US $ / bar. This relative stability was maintained until mid-2014 (Figure no.2), when it evolved from 104.15 US $ / bar in February 2014 and recorded 107.89 US $/ bar registered in June 2014.
53.92
104.27105.38 100.75105.61105.44104.15107.89
95.98
85.06
75.57
59.46
44.38
20
30
40
50
60
70
80
90
100
110
Feb-
14
Mar
-14
Apr
-14
May
-14
Jun-
14
Jul-
14
Aug
-14
Sep-
14
Oct
-14
Nov
-14
Dec
-14
Jan-
15
Feb-
15
US
$/b
ar
Figure no.2. Evolution of the price of a barrel of oil in the period February 2014 – Febr. 2015
Souce: own processing after http://www.opec.org/opec_web/en/data_graphs/40.htm
Since August 2014, the Ukrainian crisis and Russian restrictions on both the EU and USA have led to significant decreases in the price of a barrel of oil on a linear trend:
0,2.968.12 014_/$ tttP SepbarUS (2)
Since for the model (2), 988.02 R , we believe that it provides a good approximation of the evolution of oil prices during the period.
Consequently, during September 2014 - January 2015, the price of a barrel of oil has fallen every month, with approximately 12.8 US $ / bar. Julie 2014 versus January 2015 he was with 61.23 US $ / bar lower, ie 44.05% of the value recorded in July 2014. This value (44.38 US $ / bar) is approximately equal to the average price of a barrel of oil in 2005, and the absolute minimum of the last 12 months.
3. THE VARIATION OF UNLEADED GASOLINE AND DIESEL PUMP PRICES IN
ROMANIA During the analyzed period, the dynamics of prices at the pump for major finished
petroleum products: gasoline and diesel recorded significant fluctuations but not always in line with fluctuations in raw material prices, as would be expected.

The USV Annals of Economics and Public Administration Volume 15, Issue 1(21), 2015
102
Thus, if in periods of rapid growth of the oil price and the selling price at the pump has increased at a similar rate in periods when oil prices dropped significantly, the price of diesel or petrol has a relatively high inertia to follow the similar trend.
This is due to the following reasons: the desire of the main players on the fuel market to get higher profits in any situation, but also, because of excise variation rate, expressed in US $, both as absolute value and due to depreciation of the leu versus the dollar. Moreover, of retail price of gasoline at the pump 95, taxes (VAT) and excize is, in febrary 2015:
Excluding taxes
Excise duties
VAT Retail price
€ 0.508 € 0.460 € 0.232 € 1.200 Source: https://www.energy.eu/fuelprices/
Do not forget the fact that OMVPetrom, with a market share of 34% in 2013, the oil
obtained from own production, so it is not influenced of international market price quotations. Moreover, OMVPetrom, the largest company of Romania, has reached the end of the five years of crisis, 2009-2013, in a historic profit of over one billion euros, 5.5 times higher than in 2009, most difficult year for the local economy after the collapse of Lehman Brothers, and the net profit margin higher than that of oil giant Shell and ExxonMobil[11].
In Figures no.3 and no. 4 are presented graphically the variation of liters of petrol price and diesel in the period 2000-2012. Thus we see that the price per liter of unleaded gasoline pump prices rose from 2000 to 2014, the average value of 1.2 to 5.8 ron, so 4.83 times or 383%
Figure no. 3. Variation unleaded gasoline pump prices in Romania in the period 2000-2012
(euro / liter) Source: https://www.energy.eu/historical-prices/Romania/ and http://www.untrr.ro/pret-motorina/evolutie-pret-motorina-petrom-cotatii-titei-si-cursuri-valutare. html#. VDqe0RY4jzg The price of diesel has increased from 2000 to 2014, the average value of 0.92 lei (RON) to 6.02 lei /liter or so of 6.54 times.

The USV Annals of Economics and Public Administration Volume 15, Issue 1(21), 2015
103
Figure no. 4. Variation of diesel price at the pump in Romania in the period 2000-2012
(euro / liter) Source: https://www.energy.eu/historical-prices/Romania/ si http://www.untrr.ro/pret-motorina/evolutie-pret-motorina-petrom-cotatii-titei-si-cursuri-valutare. html#.
The influence of the steep decrease in the price of raw materials, from February 2014 to January 2015 at 105.38 US $ / barrel to US $ 44.38 / bbl, did not materialize in a similar decrease for finished products: gasoline or diesel (figure no 5)
Figure no 5. Average oil price action, the exchange rate and the price of diesel at the pump
(OMV-PETROM) during 2013-2015 Source: http://www.untrr.ro/userfiles/files/Variatie%20motorina%202015.PNG

The USV Annals of Economics and Public Administration Volume 15, Issue 1(21), 2015
104
4. CONCLUSIONS Given that the price of fuel is a key factor in economic development but also in the living of
population, this paper has proposed to analyze some aspects of the dynamics of prices of petroleum products in correlation with commodity prices in a competitive market in 2003 -2014.
Romania, which was one of the main oil producing countries in Europe (14 million tons annually) and one of the largest processing capacity of over 34 million tons per year after 2000 experienced strong impact of oil price fluctuations but also of derivatives.
This was reflected in continued growth in prices of petrol and diesel, with a major impact in all areas of economic and social activity but also in the welfare of the population.
During the financial crisis household consumption has been falling, which was reflected in falling prices, but major oil companies increased profit.
Aligning the prices in Romania prices within the EU has led to artificially increase the price, with a negative impact on the welfare of the population, the more so as the minimum wage / average in Romania is very small compared to the rest of the EU. No gasoline or diesel fuel surcharges (over 58% of the sale price) does nothing more than deepen these issues. In addition, in Romania, the price of gasoline and diesel (1.2 euro / l, 1.24 euro / l) is higher than in neighboring countries, Bulgaria (1,043euro / l, 1,067euro / l), Hungary (1146 EUR / l, 1,205euro / l), Poland (1,021 euro / l, 1.045 euro / l) (27 February 2015).
REFERENCES
1. Enachescu Daniela, (2002), Industria de prelucrare a titeiului, componenta principala a industriei romanesti , The 27th Annual Congress of the American Romanian-Academy of Arts and Science (ARA), Univ of Oradea, May 29—June 2, 2002, Proceed, volI, Polytechnic International Press
2. Zaharia M., Babucea A.G., Bălăcescu A., Rabontu C. (2015). Metallurgical Industry in Romania in the Context of the Economic Crisis, Metalurgija, 54(5), pag.445-448, Zagreb, Sijecanj-Oyujak, Croaţia.
3. Zaharia M., Enachescu D., Bălăcescu A. (2014). Evolutions of employment and turnover in services in EU, Industrija, Serbia, Vol 42, No 2 (2014) , p. 21 -34.
4. http://adevarul.ro/economie/stiri-economice/infografie-romania-mai-dependenta- importurile-titei-decat-gaze-1_542830710d133766a87f5239/ index. html-[access at 9.03.2015]
5. https://www.energy.eu/historical-prices/Romania/ 6. http://www.iea.org/statistics/topics/pricesandtaxes/ 7. http://www.opec.org/opec_web/en/data_graphs/334.htm 8. http://www.opec.org/opec_web/en/data_graphs/40.htm 9. https://www.energy.eu/historical-prices/Romania/ 10. http://www.ziare.com/articole/top+tari+petrol 11. http://www.zf.ro/zf-24/petrom-9-300-angajati-putin-pierdut-8-puncte-cota-piata-rafineaza-
27-putin-petrol-profitul-crescut-peste-cinci-ori-iar-marja-neta-mare-cea-exxon-12464881 12. http://www.untrr.ro/pret-motorina/evolutie-pret-motorina-petrom-cotatii-titei-si-cursuri-
valutare. html#. VDqe0RY4jzg 13. http://www.untrr.ro/userfiles/files/Variatie%20motorina%202015.PNG 14. http://www.insse.ro/cms/ 15. https://www.energy.eu/fuelprices/

The USV Annals
of Economics and
Public Administration
Volume 15,
Issue 1(21),
2015
105
THE ILLUSION OF CATCHING UP THE SOCIO-ECONOMIC
REGIONAL GAPS*
AssociateProfessorPhDEugenGHIORGHITA
DepartmentforMarketingandInternationalBusiness,SpiruHaretUniversityBucharest,[email protected]
Abstract: There is a sort of scientific bias in the way economics literature approaches the issues of general or regional
economic growth and socio-economic backwardness. The term 'catching up of socio-economic gaps' appears to be rather a contradictio in adjecto, a sort of
oxymoron, than a possible evolution of the world’s countries. The very idea of ‘catching-up’ or ‘recovery’ as a consequence of ‘lagging behind’ seems to be more specific to sports competitions or post-surgery periods. Transfering the idea of ‘backwardness’ to human communities (be it tribes, villages or political-administrative entities of higher dimensions) is at least questionable. The contradiction is generated by the very establishment of the benchmarks for identifying ‘backwardness’. During the last 50 years, and after 1990 especially, the appeal to such indicators as GDP/capita, HDI, Gini coefficient, convergence criteria etc. became a common place. Nowadays it appears to anyone a matter-of-course, that any geopolitical entity can be "weighed" or "measured" by reference to a set of uniform criteria.
Unfortunately, the global and regional efforts made after WW II towards an accelerated socio-economic growth of both developing and less developed countries succeded only for few countries to reduce the historically shaped gaps as against developed countries. On the contrary, for the bulk of the ‘lagged behind’ regions gaps seem to have risen. This is why many questions arose about the inefficiency of the steps made towards 'catching up of socio-economic gaps', such as: “Why after about 70 years of international welfare levelling efforts, gaps between development and living standards of the world regions are still so large?” “Why do economies have to grow at any price?” “Is the forced (artificial), accelerated development beneficial? And it if so, to whom?” “Are specific historical socio-economic structures negligible under the pressure of globalization?”
This study tries to identify the fundamental bias of the regional accelerated development efforts.
Key words: economic development and growth, backwardness, development gap, catch-up effect, specific regional policies, macroeconomic indicators.
JEL classification: B25, O10, O43, Q56, Z13
Motto: People crushed by laws, have no hope but to evade power. If the laws are their enemies, they will be enemies to the law; and those who have most to hope and nothing to lose will always be dangerous. [1] But the age of chivalry is gone. That of sophisters, economists, and calculators has succeeded; and the glory of Europe is extinguished forever. [2]
INTRODUCTION During the last 50 years new theories, models and scenarios appeared concerning the
objectives and stages of socio-economic growth and development for all world regions. According to established criteria and indicators, countries have been classified in “developed”, “developing” and “less (or least) developed”.
According to the United Nations Statistics Division, nevertheless, “there is no established convention for the designation of "developed" and "developing" countries or areas in the United Nations system.” [3] The same source states that “The designations «developed» and «developing» are intended for statistical convenience and do not necessarily express a judgment about the stage reached by a particular country or area in the development process.” [4]

The USV Annals of Economics and Public Administration Volume 15, Issue 1(21), 2015
106
However, the statistical “convenience”, expressed by economic and social indicators annually published by international, regional and national institutions, shows smaller or bigger differences between regions, areas or countries. This is how the issue of development gap became a common place.
The origin of the idea of “economic development gap” is associated with the obsession of economic growth. In both academic and mass media there are “cohorts” of researchers, analysts, commentators who use a more or less wordy language fitting often perfectly to the wooden language sadly recalling the socialism era. [5] So, we got used to consider as objectively given some statements that became axioms:
1. The economy, in general, has to grow permanently, including of course the inherent cyclical fluctuations.
2. The gaps between the backwards economies and the developed ones must be alleviated and finally eradicated.
The above underlined words (“given”, “has to” and “must”) suggest the character of historical necessity or objectivity: the economic, political and sociological thinking follow ineluctably this way.
Despite this common, generalized approach, the very issue of “gap” between socio-economic development levels of the contemporary political entities has always been extremely delicate.
As a conference paper aims to reveal not only ultimate truth, but also heuristic issues, here are several questions concerning the fragile issue of gaps and backwardness:
a. How did they get to the necessity of featuring the development level of each political or geo-economical entity by the instrumentality of economic macroindicators systems?
b. Are the accelerated and at any price [6] economic development and growth of all inhabited regions of the world the main target of mankind?
c. How did the imperative of generalized economic growth become a postulate? d. How much effective is the regions’ ranking by macro indicators (such as GDP/capita,
GNP/capita, HDI etc.) for the scientifical knowledge, as well as for the adjusting actions at the local or global level?
e. Is it reasonable to compare regions with distinct institutional evolution features, as if they were supposed to follow the same historical path (the Palau, Tonga, Kiribati archipelagos with the USA, Norway, China or Singapore)?
f. The economies of the advanced, highly civilized regions are outcomes only of free market and private property democratical institutions or rather of their colonial and military expansion?
Perhaps we could not give accurate answers to all these questions. But we must at least agree with Richard Ennals’:“We need to find, develop and test new ways of working together so that problems can be addressed and, if not solved, at least better understood.” [7]
INSTITUTIONAL DIVERSITY AND „HISTORICAL DELAY” Nowadays human society appears to be still divers, despite the countless efforts towards
homogenization. Over the past two centuries, within the framework of the so-called “modernization” and
“globalization processes”, political revolutions and institutional restructuring by reforms aim at diluting the differences given by the traditional peculiarities of each local community.
This is why people strive, individually or collectively, to change their lifestyle, deserting “oldfashioned” customs and traditions for the modern ones. And so, change became the leitmotif of the common and scientific thought. The absolutely necessary change was converted to a fundamental preconception (or prejudice).
There are not only common prejudices, but also scientifical prejudices. Belaboured by famous historians, sociologists, and political scientists (G. Vico, G.W.F. Hegel, K. Marx, W.

The USV Annals of Economics and Public Administration Volume 15, Issue 1(21), 2015
107
Sombart, W. W. Rostow, and many others) the hypothesis of stage evolution of mankind became a thesis.
Human society advances from the inferior to the superior (Hegel). Here lies the key of progress. [8] The faster evolving regions of the world influence or determine the delayed ones in a necessarily historical way.
Such a modeling of the becoming of mankind starts from o series of prerequisites, as: - There are evolution models and ways unavoidably and gradually followed by all human
societies. [9] - Each new stage of evolution is obviously superior to the previous one; passing to the new
stage is therefore historically necessary. - Leapfrogging should occur when it is not possible or necessary to run through each stage
already experienced by the developed regions, or when the catch-up estimated period is too short. - New institutional forms (cultural, religious, political, economical and social organization
patterns) are assimilable within longer or shorter historical periods. - Ethnical apriorism (customs, traditions, popular culture, mentalities) is merely a temporary
hindrance for the establishment of the new rules. - For the backward regions the next stage is generally already known. - The very probable incompatibility of the new institutional forms with the mentalities
peculiar to the backward regions would be solved by centralised decision at the level of state or international agencies.
The application of this theoretical approach would prevent (and actually has prevented) the local communities not only from a free (by themselves) evolution, but it also would preclude (and has precluded) a specific, own rhythm of change.
Introduced as integrating or holistic (globalizing) the aforementioned preconception assumes the existence of one or more theoretical and methodogical evolutionary model(s) generally available and locally applicable. Per se, the historical analysis has become subject of prejudgement and anticipation of the very probable historical stages to reach by the developing or less developed countries.
Therefore, many authors acquainted with the previous progressing evolution of Western capitalism, and following the matrix inherent to new regions integration, use to call as “objectives” the processes derived from the experience of developed regions, such as: building of instrastructure, electrification, industrialization, schooling, literacy, modernization of agriculture, urbanization, etc.
The principle of this approach method is extremely simple. It starts from the prerequisite of the success won by the organization forms in certain regions/countries, and, considering that “they shouldn’t reinvent the wheel”, concludes the necessity to direct all the “backwards” on the same path on which passed the western wealthy nations.
Unfortunately, the history of “lagging” or “backwards” regions abounds in contradictory facts, data, and events specific to the very processes of institutional, cultural, and behavioural adjustment. And, more than that, there is a permanent pressure put on the development rhythm of peripheral regions to catch up with the core regions of progress.
It is apparentally unreasonable, physically and mentally impossible for a region to build in decades (20-50 years) effective economic and social mechanisms shaped during centuries in other regions. History showed that even more than 150 years were not sufficient for most of less developed regions to catch up with the more developed ones.
“STAGES” OF DEVELOPMENT After Great Britain’s industrial take-off by the end of the 18th century, during the 19th
century the successful industrializing economies were Belgium, France, Germany and the USA. For the beginning of the 20th century they were followed by Austro-Hungary, Russia, Northern Italy, Japan, and the Scandinavian Countries.

The USV Annals of Economics and Public Administration Volume 15, Issue 1(21), 2015
108
The success of the industrial development in Western Europe, USA, Japan and later Australia and Canada opened the way to optimistical expectations for the possible spread of economic progress through industrialisation over other regions of the world. [10]
The economic and social evolution during the past five centuries is generally described as a rather linear process that crossed several stages, from mercantilism (or commercial capitalism) and industrialisation to the post-industrial stage. [11]
Starting from the fifth decade of the 19th century economic nationalism emphasized the big role played by the development of the national productive forces that is by a vigorous industrial development. [12]
For the new created national states, the first step towards economic growth was considered to be the building of a democratic, free market institutional framework. This process lasted about fifty or more years for the majority of the European regions during the 19th century. The new institutions were supposed to assure freedom and welfare. A fairly timid process of industrialisation took-off as well in the Eastern regions of Europe.
But...! A lot of hindrances were met on the way of a fast industrialization of the agricultural or raw material exporting regions. [13] By the middle of the 19th century, manufactures were little developed in the vast majority of the world countries. Furthermore, the propensity to entrepreneurship and the domestic investment capital were mostly absent. More than that, monetary economy was specific only for a relatively few areas.
Apart from the main prerequisites, such as financial capital, crafts and manufacturing traditions, entrepreneurship and investment propensity, a major obstacle to development was the ideology prevailing for the majority of individuals (the peasantry) in the most “backwards” regions consisting of informal constraints (customs and traditions), the so-called path dependance.
The situation changed with very slow rhythms until 1940, despite the endeavours to spread the “institutions of freedom” (free markets and constitutional democracies) in many regions of the world. The assimilation of the foreing modern institutions (constitutions, civil codes) proved to be rather formal than actual.
By 1940 no one could have said how long it would have lasted until less developed regions economies’ structures, such as those of the South-Eastern European countries, would have become compatible with the supply structure of the developed regions. However, the proper, suitable transformation rhythms were too slow as compared to the growth rhythms of the West.
The experience of the Soviet Union was considered an encouraging example, and so socialism became the solution for a number of less developed countries to accelerate their growth and development rhythms.
Leapfrogging appeared to be the solution. Socialism should have been an effective “leapfrog”. But was it indeed? Has Romania and other socialist countries achieved the “catch up” by 1989 or after 1990?
COMPARISON CRITERIA FOR THE UNEVEN REGIONAL DEVELOPMENT The statistical analyses [14] made during the fourth and fifth decades of the 20th century
showed great differences between the factors productivity in agriculture and industry [15], between the standards of living, sanitary and education conditions, etc. of industrialized and raw materials producing regions.
Meanwhile, so many works concerned with growth models and analyses have been belaboured, that it should be really hard to accurately list them. However, the research criteria in the field of economic growth and development can be classified in two significant groups:
The first group of criteria would include growth and development macroindicators used
for quantitative cross-countries analyses. [16] The analysis of macroindicators offers stunning results. Let’s take a simple example looking
at the GDP figures produced by the international agencies.

The USV Annals of Economics and Public Administration Volume 15, Issue 1(21), 2015
109
Table 1. Gross Domestic Product of Romania, according to the international estimates
- Billions of US$ - IMF WB UN CIA
2014 2013 2013 2104 Total GDP (nominal) 53 199.9 53 189.6 53 188.1 53 188.9Total GDP (PPP) 45 392.8 46 379.0 - - 43 288.5Surse: http://en.wikipedia.org/wiki/List_of_countries_by_GDP_%28nominal%29, http://en.wikipedia.org/wiki/List_of_countries_by_GDP_%28PPP%29
Data for Total nominal GDP (Table 1) appear to be slightly different: Romania ranks on the
53rd position among the world’s countries, regions and dependencies, with about 189-199 billion US$.
On the other side, the values mentioned for the Total PPP GDP show a staggering difference of more than 100 billion US$: the IMF produces the greatest value, 392.8 billions of US$ (45th position), while the CIA World Factbook shows only 288.5 billions of US$ (43rd).
Table 2. Gross Domestic Product of Romania per capita, according to the international estimates
- US$ - IMF WB UN CIA
2014 2013 2013 2103 GDP (nominal)/capita 68 10034 73 9499 75 8705 72 8900GDP (PPP)/capita 60 19712 59 18974 - - 77 13200Surse: http://en.wikipedia.org/wiki/List_of_countries_by_GDP_%28nominal%29_per_capita http://en.wikipedia.org/wiki/List_of_countries_by_GDP_%28PPP%29_per_capita
The values for Nominal GDP/capita data (Table 2) are once again divergent, lowering
Romania’s position from 68th with 10034 US$/capita as given by IMF statistics to 75th place with 8705 US$/capita mentioned by the United Nations. The same happens with GDP (PPP)/capita: the “optimistical” IMF data place Romania on the 60th position with 19712 US$/capita, but the “pessimistic” CIA statistics see Romania on 77th place in the world with only 13200 US$/capita.
These substantial differences reveal not only distinct methodological approaches, but also the relativity of statistical data, given the specificity of each country, region or territory represented.
The second group of criteria, the cultural and institutional background seems to be much
more important than the quantitative approach. The rising West covered the area where European shipping, trade and handicraft, developed
during the late Middle Ages, made possible the conquest of vast overseas regions that gave birth to the future colonial empires starting from the 16th century.
By the middle of the 20th century the world’s economic map was mostly configured. Only a few winners, the already developed countries, were comparable to each other.
For the rest of the “backwards” regions newcomers, who had missed the take-off, the predominance of the old established institutional paths, mentalities and behaviours should not allow a reasonable quantitative comparison to the advanced societies. [17]
To many libertarians the modern constitutional-democratic and competitive free market institutional framework appeared to be successfully applicable everywhere and anywhere. Because it worked somewhere, it would automatically work everywhere, as an engine, or a computer, irrespective of the cultural and educational patterns.
Romania is not a particular case, in spite of its certain “originality”. Leapfrogging by importing the main formal institutions intended to a democratical and free market organization was specific to the vast majority of the world regions. Within two or three generations the less developed regions were expected to record growth rhythms superior to the developed countries.

The USV Annals of Economics and Public Administration Volume 15, Issue 1(21), 2015
110
But they didn’t! Until 1940 “the Romanian democracy created not even the conscience of citizen”, as Emil Cioran magistrally put it.
Adopting and adapting foreign rules is not a guarantee that they will be effective. The radicalism of change as well as the lack of an effective authority to enforce the new constraints begot weak institutional structures. Perhaps more important than the differences between cultures was the manner - how - the new patterns were protruded.
The weak institutionally structured economy and society are the main outcome of a hasty transition from unstable political and economical regimes to apparently stable and hard to assimilate structures. History shows that radical and serious institutional changes have been followed by enforcing regimes. From Peisistratids’ tyranny to Bonaparte’s dictatorship (Premier Empire) compelling effectively new systems of laws has been done under strong authoritarian regimes.
Instead of a real authority starting from 1859 until 1940 Romania benefited by a persistent laxity of the newly introduced institutions. The political and economical elites were not able to enjoin a coherent specific juridical system. As in many other world countries (regions), the contact with the new western constitutional structures after 1859 led to superficial and formal assimilations of the new institutional framework.
The survival art and techniques acquired during centuries under the Turk domination and Greek administration taught the landlord as well the peasant, the industrial employer as well the worker to mime adaptation.
The lack of an organic evolution of the economic institutional framework is visible during both the capitalist and the socialist systems. It is hard to speak about “structures”, as long as the institutional instability was not frictional but quite symptomatic: most of the Romanian (economic) subjects learned to permanently adopt and adapt (foreign) institutions, as everybody knows that “laws are done only to be broken”.
* * *
Considering only the macroindicators, any comparison between economic entities is
possible and allowed. But is any comparison effective or efficient? What should we use quantitative indicators for?
A simple list of tabulated macroindicators such as total or per capita GDP and GNP, “Gini coefficient”, or the HDI showing the rank of a country or region in the world might be significant for “quizzes”. It would be the same as comparing Mont Blanc, Chomolungma and Moldoveanu peaks, as well as we may compare the number of population or the countries’s areas or the land distribution according to properties’ size or crops’ types etc..
What should we than compare? Any development is explainable, even if it is considered to be a “miracle”. Let’s take, as an instance of such a “miracle”: the rough development of Japan. Starting
from 1867, during the Meiji Era, Japan industrialized rapidly importing capital and modern technologies from Western Europe and USA. After only two generations, Japan was able to successfully engage in two wars within a single decade - the first Sino-Japanese war (1894-1895) and the Russo-Japanese war (1904-1905) – gaining control of Taiwan, Koreea and the southern half of Sakhalin. Was it really a “miracle”? Or was it rather an expectable evolution? How had Japan evolved until 1867? After introducing the Chinese characters during the Heian period (from eighth to twefth century) and developing of a system of education in the spirit of discipline, honour and sacrifice for more than ten generations during the Tokugawa or Edo period (1603-1867) based on bushido (samurai code of honour), Japan adopted the Western European institutions after 1967, during the same span of time as Romania. Are these two countries comparable?
How could it ever be reasonable to compare the macroeconomical outcomes of regions with quite different cultural or institutional paths?
Which are the common cultural background criteria for a reliable comparison between Bermudas, Philippines, Albania, Tanzania, Bulgaria, Columbia, Japan and Norway?

The USV Annals of Economics and Public Administration Volume 15, Issue 1(21), 2015
111
Is it correct to call “backwards” a region or a country only because they didn’t evolve similarly to the developed ones?
And furthermore how could it ever be possible for a “backward” region to really catch up with the advanced ones? Or, put it in other words: a region that was obedient for centuries could catch up with an expansive (imperial) region, a colony or a neocolony with a metropolis state? USA, Canada and Australia are the great exceptions! On the other hand, the Asian “tigers” Taiwan, South Korea, Hong Kong or Singapore are not at all “miracles”.
Thus the term 'catch up' appears to be rather a contradictio in adjecto, a sort of oxymoron, than a reasonable evolution of the world’s countries. The very idea of ‘catching-up’ or ‘recovery’ as a consequence of ‘lagging behind’ seems to be more specific to sports competitions or post-surgery periods. Sportsmen and sportswomen engaged in a competition will not get the same results, but they are compatible to compete: all of them are similarly trained to face competition.
Transfering the idea of ‘backwardness’ to human communities (be it tribes, villages or political-administrative entities of higher dimensions) is at least questionable. The contradiction is engendered by the very establishment of the benchmarks for identifying ‘backwardness’. Applying the same macroindicators to all the countries/regions appears to be as a Procustean bed.
The diversity of endowments prerequisites consisting of capital, natural, human resources, etc., etc. would make impossible a reasonable comparison.
Effective comparisons should be made only if the prerequisites of the historical evolution were compatible: early/late development of an expanding monetary economy, commercial network and trading techniques, crafts traditions, capital resources, investment in education, science and technologies resulting in “national” agricultural, demographic and industrial revolutions, as well as raise in productivity, modern credit institutions, entrepreneurship, occupational diversity, policies’ expanding or defensive character, etc.
Most authors assert the idea of the “unavoidable”, “implacable”, “irreversible” character of globalization. Is it indeed too late to reconsider the way the humanity evolves?
ENDNOTES
* The present paper was presented in a simplified form at the trimestrial conference of the Section for Economic history and history of economic thought of the Romanian Academy on December, 10th, 2013.
[1] Edmund Burke, Letter to Charles James Fox (1777-10-08) [2] http://www.brainyquote.com/quotes/quotes/e/edmundburk149708.html,
http://www.brainyquote.com/quotes/authors/e/edmund_burke_2.htmlm, retrieved: 2013.08.10. [3] http://unstats.un.org/unsd/methods/m49/m49regin.htm#ftnc, retrieved 2015.01.23. [4] http://unstats.un.org/unsd/methods/m49/m49.htm, retrieved 2015.01.23. [5] “In the quest for economic growth, free market ideology has been embraced around the world with the fervor
of a fundamentalist religion faith”. „În goana după creştere economică, ideologia pieţei libere a fost îmbrăţişată în întreaga lume cu fervoarea unei credinţe religioase fundamentale.”; David C. Korten, When Corporations Rule the World, Kumarian Press Inc. şi Berrett-Koehler Publishers, 1995; Corporaţiile conduc lumea, Editura Antet, 1997, p. 82.
[6] The price of economic growth during the last two centuries was the environment’s havoc, resource depletion, support of local, regional, and sometimes global conflicts, as well as dilution of cultural identities in the great ocean of world’s expected welfare. This price of accelerated development rises proportionally with the stifling rhythms of both economic growth and technological progress supported by an exceptional credit expansion (created fake money that became legal tender).
[7] Richard Ennals, Artifical Inteligence and Human Institutions, Springer-Verlag, London, 1991, p. 3. [8] Cf. Alberto Martinez Piedra, Natural Law: the foundation of an orderly economic system, Lexington Books,
2004, p. 88. [9] “… a people’s intelligence and strength may not suffice […], and it may hold to the lower law; or it may
happen that another nation has reached its higher constitution, thereby rising in the scale, and the first gives up its nationality and becomes subject to the other.” G. W. F. Hegel, Lectures on the History of Philosophy, vol. II, p. 98, apud http://en.wikipedia.org/wiki/Hegelianism#Philosophy_of_history.
[10] “A good deal of our thinking about industrialization of backward countries is dominated – consciously or unconsciously – by the grand Marxian generalization according to which it is the history of advanced or established industrial countries which traces out the road of development for the more backward countries.”

The USV Annals of Economics and Public Administration Volume 15, Issue 1(21), 2015
112
Alexander Gerschenkron, Economic Backwardness in Historical Perspective, a book of essays, Cambridge, Massachusetts: Belknap Press of Harvard University Press, 1962, p.6.
[11] The taxonomy of development stages of the world regions is obviously much more complex. See, for example, among others, professor’s Frithjof Kuhnen excellent synthesis: Causes of underdevelopment and concepts for development - an introduction to development theories at http://www.professor-frithjof-kuhnen.de/publications/causes-of-underdevelopment/3.htm. Almost all so far existant development theories are synthetically described: “modernization”, “dualism”, “balanced growth”, “unbalanced growth”, “stages of growth”, “big-push”, “development poles”, “circular causation”, “socio-psychological theories”, “sociological explanation of socioeconomic change”, “theory of social change”, “dependence theories”, “external trade theories”, “circular deterioration of terms of trade”, “theory of immiserizing growth”, “imperialism theory”, “classical imperialism theory”, “modern imperialism theory”.
[12] The neo-mercantilist classical work for the 19th century remains Friedrich List’s Das Nationale System der Politischen Ökonomie, Stuttgart, Tübingen, 1841.
[13] “[…] in several important respects the development of a backward country may, by the very virtue of its backwardness, tend to differ fundamentally from that of an advanced economy.” Alexander Gerschenkron, op. cit., p.7.
[14] See for instance Industrialisation et commerce extérieur, Société des Nations, Genève, 1945. [15] It is worth to mention here the contribution of Mihail Manoilescu in his fundamental work Forţele naţionale
productive şi comerţul exterior, Editura Ştiinţifică şi Enciclopedică, Bucureşti, 1986, first edited in French, Théorie du protectionisme et de l'echange international, Paris, 1929, translated into Italian and English, as well as in a new edition in German: Die nationalen Produktivkräfte und der Aussenhandel; Theorie des internationalen Warenaustausches, Berlin, Junker und Dünnhaupt verlag, 1937.
[16] For instance: World Bank’s World Development Indicators; UNCTAD, Handbook of Statistics; European Union, Eurostat etc.
[17] Scholars and generally people may compare anything to anything. So, for instance, one might compare mice with elephants, or worms with snakes. All one needs is to establish the criteria for the comparative analysis.
REFERENCES
1. Acemoglu, D., Johnson S., Robinson, J.A., “Institutions as a fundamental cause of long-run growth”, in Handbook of Economic Growth, Volume IA, edited by Philippe Aghion and Steven N. Durlauf, Elsevier B.V., 2005
2. Barro, R. J., „Rule of Law, Democracy, and Economic Performance”, în 2000 Index of Economic Freedom, Washington, DC, Heritage Foundation, 2000, p. 31–49
3. Daly Herman E., Cobb John B.Jr., For the Common Good: Redirecting the Economy toward Community, the Environment and a Sustainable Future, Beacon Press, Boston, 1989
4. Ennals, Richard, Artificial Intelligence and Human Institutions, Springer-Verlag, London, 1991
5. Gerschenkron, Alexander, Economic Backwardness in Historical Perspective, a book of essays, Cambridge, Massachusetts: Belknap Press of Harvard University Press, 1962
6. Haas, B. Ernst, Beyond the Nation-State, Functionalism and International Organization, ECPR Press, 2008
7. Korten, David C., When Corporations Rule the World, Kumarian Press Inc. and Berrett-Koehler Publishers, 1995; Corporaţiile conduc lumea, Editura Antet, 1997
8. Lipset, S. M., „Some Social Requisites of Democracy: Economic Development and Political Legitimacy”, American Political Science Review, 53(1), 1959, p. 69–105
9. http://ihome.ust.hk/~sochenshuo/file/ECON7198/Course%209%20Lipset%201959.pdf 10. Murgescu, Bogdan, România şi Europa. Acumularea decalajelor economice (1500-2010),
Editura Polirom, Iaşi, 2010 11. Nakaoka, T., On technological leaps of Japan as a developing country. Osaka City
University Economic Review, 22, 1-25, 1987 12. Nakaoka, T., The learning process and the market: the Japanese capital goods sector in the
early twentieth century, LSE STICERD Research Paper No. JS271, 1994 13. Nakaoka, T., “Technology in Japan: From the Opening of Ports to the Start of the Postwar
Economic Growth”; Technological Development and Economic Systems: Japanese Experiences and Lessons, October 1-2, 1994, Tokyo, Japan, 1996.

The USV Annals of Economics and Public Administration Volume 15, Issue 1(21), 2015
113
14. Nakaoka, T. (Ed.), International Comparison of Technological Formation-social capability of industrialization, Tokyo, Chikumashobo (Japanese), 1990
15. Nakaoka, T., “Science and technology in the history of modern Japan: imitation or endogenous creativity?” in A. Abdel-Malek, G. Blue and M. Pecujlic (Eds.) Science and Technology in the Transformation of the World, The United Nations University, 1982
16. North, D. C., Institutions, Institutional Change and Economic Performance, Cambridge University Press, 1990
17. Piedra, Alberto Martinez, Natural Law: the foundation of an orderly economic system, Lexington Books, 2004
18. Simpson, David (Ed.), The Origins of Modern Critical Thought: German Aesthetic and Literary Criticism From Lessing to Hegel, Cambridge University Press, 1988
19. Sokoloff Kenneth L., Engerman Stanley L.. "History Lessons: Institutions, Factor Endowments, and Paths of Development in the New World". The Journal of Economic Perspectives Vol 14 No.3 (2000): pp. 217-23
20. * * The Economist, http://www.economist.com/economics-a-to-z/c#node-21529531

The USV Annals
of Economics and
Public Administration
Volume 15,
Issue 1(21),
2015
114
LANDMARKS IN THE EVOLUTION OF REGIONAL SCIENCE
LecturerPhDAdrianLiviuSCUTARIU
“ŞtefancelMare”UniversityofSuceava,RomaniaFacultyofEconomicsandPublicAdministration
[email protected] Abstract: This article approaches issues of regional science development, science that analyzes the phenomena and
processes related to space, distance and location. One can notice the diversity of theoretical approaches, and these can be grouped into: theories of localization, theories of regional growth and development theories. The evolution of this science was not linear, it has experienced both periods of boom and decay, recording remarkable progresses over time. Along with other disciplines, in the frame of regional science stands the regional economy that studies the optimal location of firms and the territorial economic development. The region is the core of these theoretical concerns, and one of the problems of regional development refers to factors that determine the development of a region. Regarding future research directions, regionalization existing in the EU provides regional science a further opportunity to continue its development.
Key words: regional science, regional economy, region, regional development, theories
JEL classification: R10
REGIONAL SCIENCE. INTRODUCTIVE ASPECTS
Since microeconomics studies economic phenomena at the economic entity level and macroeconomics deals with these issues at the national economy level, it is the competence of mesoeconomics to analyze phenomena in the branches and sectors. In its logical and comprehensive approach, the spatial approach aims to meet both micro and macroeconomics requirements and challenges of the mesoeconomics.
Over time, many researchers have contributed to the theoretical framework of regional science. Regional science bases were made by the representatives of the German school of spatial economy (J. von Thünen, W. Launhardt - 19th century and A. Weber, W. Christaller, A. Lösch - 20th century) and the regionalists of the American, French, Scandinavian, Russian, Dutch schools successfully continued the work of their predecessors.
Regional Science focused, right from its appearance, on two elements not approached by economic theory: the distance and the area. Distance was important because of the transport costs which influenced the market price and the location of production factors. Therefore, regional science deals with developing methods and rigorous and systematic techniques of analysis of phenomena and processes in which space, distance and location have a central role [1].
Regional Science Association International (RSAI), which was founded in 1954, has played a major role in shaping regional science (in the 50s) and its subsequent evolution. Since 1956, the Association was formally recognized as a legitimate organization in the social sciences field, and afterwards there were created branches almost worldwide.
Establishment of regional science as a distinct field was based on the adoption, from spatial perspective, of some concepts and methods of economics, geography, econometrics, mathematics, sociology, political science, etc., which gives it a strong interdisciplinary character [2].
THE MAIN GROUPS OF THEORIES OF REGIONAL GROWTH AND DEVELOPMENT Theoretical approaches were multiple, and we intend to highlight briefly the main theories developed in this field.

The USV Annals of Economics and Public Administration Volume 15, Issue 1(21), 2015
115
While there was an insufficient economic growth at regional level, the classical theory of regional development appeared. Because at regional level the development is uneven, regional development theory tried to explain regional growth processes, as well as the differences that are reported in their frame.
In a first phase, it was considered that the differences among regions are not due to their particularities, but to different rates of economic growth. Currently, it is accepted the idea that endogenous processes of evolution, which are based on qualitative characteristics of regions, have some influence on regional growth.
Understanding regional growth processes involves the necessity of presentation of the main regional development theories: theories of localization, of regional growth and of development.
The first theoretical landmarks of the regional economy, as an essential part of regional science, were recorded in the 19th century. These were the theories of localization, underlying understanding of the interaction between space and the local economy. In essence, the theories of localization investigate the location of firms in order to meet demand in the conditions of the lowest costs. In the analysis some macro-regional phenomena are also brought to attention, such as heterogeneous spatial distribution of economic activities, thus paving the way for the analysis of territorial imbalances.
Classical and neoclassical economists of the 18h and 19th century had considered the economic growth process as the being conditioned by the productive efficiency, by the division of labor and by the productivity of factors of production, and according to current theories of regional growth, growth means capacity is to increase real production of a region and the ability to maintain it, due to cumulative economic and territorial elements [3]. From these differences of vision come out the importance that currently has the economic adaptability to a changing economic environment.
Development theories have the basic idea of presence of fundamental inequalities between center and periphery, inequalities that lead to a specific dependence of peripheral regions of central ones, which over time can diminish.
One can say that theoretical approaches were quite diverse, this diversity coming from the fact that researchers had different visions and railed at different theoretical currents.
THE PROGRESS OF REGIONAL SCIENCE Over time, the evolution of regional science has not been marked by linearity, but there were
both flourishing periods and less prolific ones. Regional science recorded an evident progress during 1950-1970, but the situation changed
in the 80s, globalization capturing increasing attention to the detriment of regionalization (Figure no. 1).
Figure no. 1. The three main periods of regional science
Source: A. Bailly, L.J. Gibson - Regional science: Directions for the future, Papers in Regional Science, 83, 2004, p.131

The USV Annals of Economics and Public Administration Volume 15, Issue 1(21), 2015
116
In more than half a century of existence, regional science has sought and largely succeeded to combine in a balanced way combine theoretical and applied research. Since the early years of research in the field, scientists have analyzed the spatial issues, including regional differentiation. Subsequently, other issues were approached, such as: analyzes regarding the location of new facilities for manufacturing and services, regional development initiatives to counter the economic and social disparities, as well as advanced spatial models for improving the efficiency of regional planning activities [4].
According to David Boyce [5], the evolution of regional science includes several periods. He believes that the foundation of this science was made between 1954 and 1968. Among those who could be considered regional science pioneers is William Alonso, who first obtained a PhD in regional science.
One of the regional science reference books, Location and Land Use (1964), was elaborated by William Alonso, author who has worked under the direction of Walter Isard and Ben Stevens. It should also be noted that Alonso has developed consumer and producer theory in spatial context. The theoretical approaches of Alonso also had influence on the subsequent development of some studies on housing markets.
The next phase, respectively 1969-1989, is considered to be what Boyce called the expansion years and includes two periods, the boom one (1969-1976) and the expansion (diffusion) one (1977-1989) [6]. During the boom period the researchers Peter Nijkamp (Netherlands) and Alan Wilson (England) stands out, and the expansion one is marked by the deployment of World Congresses and by the reconfiguration of RSAI. Also, there are signs of disseminating knowledge and establishing of new major research centers in the field.
Boyce considers that the period 1990-2003 represents the mature years for regional science. Among the topics discussed which have had increased attention we mention regional convergence and competitiveness. To note is the fact that the interest for practical aspects was brought again to attention. An important aspect for the evolution of this science was the creation of the journal Papers in Regional Science, with a special role in improving the information flow. However, in this period a new generation of researchers appeared, which includes also the distinguished economist Paul Krugman. He helped create the New Economic Geography and was involved in the development process of regional science. It should also be noted that the objective of regional science was not rallying to the main economic current, but rather creating a new discipline in the frame of social sciences [7]. After the elaboration of Isard's work, the researchers Fujita, Krugman and Venables have contributed to the development of localization economy and of the spatial economy. They also analyzed an aspect of the field which had previously been insufficiently approached, namely, the formation and networking of cities, explained through imperfect competition in spatial framework. However, it should be noted that with the new ideas appeared, there have also emerged new directions for future research.
Among the iconic figures, present in all three periods of evolution of regional science, stands out the Dutch researcher P. Nijkamp. He believes that regional science is not a discipline in itself, because it is a set of complementary disciplinary perspectives, centered around the thematic concept of "region" [8]. Throughout the whole development of regional science, a multidisciplinary orientation emphasizes, this being useful to the research approaches in the field. Regional science perspectives are closely linked to multidisciplinarity, meaning that the role of some disciplines (e.g. economy, geography, statistics, ecology, political sciences, etc.) will still be determinant in terms of contributions made. A future direction of development of regional science involves creating a convergence between the different theoretical approaches, this being only partially revealed in the new theories of regional growth [9], [10]. Although in the regional economy there are various visions on space, there is already a shaping convergence among the main groups of theories.
Publication of journals and books on this topic, but also organization of conferences and summer schools have escalated, contributing to the exchange of ideas and to the development of the field. In this sense, we can mention some of the most important periodicals: The Journal of

The USV Annals of Economics and Public Administration Volume 15, Issue 1(21), 2015
117
Regional Science, The Annals of Regional Science, European Research in Regional Science, Regional Science and Urban Economics, Papers in Regional Science.
Strengthening of an academic field could not take place only by editing journals, but it was also imperative the publication of research results in the form of monographs and books. Also, many research institutes, such as Institute for Research in Regional Science, played an important role in the publication of materials in the field.
REGIONAL ECONOMY, REGION AND REGIONAL DEVELOPMENT Regional science covers a range of disciplines, such as regional economy, regional planning,
rural economy, spatial sustainable development, urban economics, urban planning, etc. Regional economy has its beginnings in the 19th century (especially the theory of economic activities localization), developing within main currents of economic theory [11]. Regional economy is the division of economics that studies the optimal location of firms and the territorial economic development. Reality shows that the evolution of regional science has recorded moments of recognition and repeated declines, without regional elements to be taken into account in the analysis of economic life (until around 1950) [12].
The aim of regional economy is to investigate at spatial scales the links between regional economic systems and the relations among the components of each system.
The methods and techniques developed for understanding the functioning of national economies were the starting point for analyzing issues that the regional economy is studying.
The main reason for the existence of regional economy is related to the need to provide a theoretical and methodological scientific basis for the regional strategies and policies, namely for setting a coherent set of goals and ways to mitigate regional imbalances, as well as for identifying the appropriate measures and instruments for achieving the targets set [13]. The periods of stagnation experienced by the regional science were also felt by the regional economy. However, at present, the regional economy is facing a challenge, namely the possibility to influence the regional science, in order to reduce the divergence between the theoretical and practical approaches [14].
Region is the key element that lies in the center of these theoretical and practical concerns, both in regional science (in general) and in the regional economy. The term region has its origins in the Latin word "regionem" and it is present in most European languages, with the meaning of land, geographic area with borders and more or less accurate characteristics [15]. This notion was used by geographers in the early 20th century.
Assembly of European Regions (AER) adopted (in the Declaration on regionalism in Europe - 1996) a definition in which the region is considered a territorial public entity corresponding to the level immediately below that of the state, being administered by a government that has its own political powers [16].
Aspects of a region were not covered by a comprehensive definition, but the idea of space as a whole is common to all definitions of the region, so that the region is considered a unit comprising a number of neighboring areas.
The term region is used for the delimitation of areas belonging to a certain geographical area, both nationally and internationally.
The main problems [17] of regional development refer to the forces that drive the development of a region, to the influence of external decisions on these forces, to the tendency of space towards homogenization or differentiation.
The wide scope of regional development sometimes lead to overlaps with other fields in which there are similarities in terms of content: local development, economic development or territorial planning. Regional development is a relatively new concept, which means not only boosting and diversifying economic activities, stimulating private sector investments, contributing to reducing unemployment and improving living standards, but a whole environment of support and of adaptation of sustainable actions that converge to the fields of competence of the region [18].

The USV Annals of Economics and Public Administration Volume 15, Issue 1(21), 2015
118
From the above aspects we see that regional development is interconnected with a whole series of elements, which gives it a great complexity.
CONCLUSIONS Regional science deals with developing methods and techniques for analyzing the
phenomena and processes related to space, distance and location. Theoretical approaches were quite different, and they can be grouped into: theories of localization, theories of regional growth and development theories. Following the presentation of some aspects of regional science evolution, one can see that this trend was not marked by linearity, but there were both flourishing periods (50s and 70s and the post-2000 years) and less prolific periods (80s - with the occurence of globalization). However, over time remarkable progresses have been made, and among those who have made notable contributions we can mention W. Alonso, W. Isard, P. Nijkamp and A. Wilson. In the development of regional science, RSAI had an important role. The exchange of ideas was facilitated by organizing scientific events and publishing of books and journals on this topic.
In the frame of regional science, along side other disciplines, the regional economy is of particular importance and studies the optimal location of firms and the territorial economic development. The region is the essential element that lies in the center of these theoretical and practical concerns, and the factors that determine the development of a region is one of the problems of regional development. There is no unique way to define a region, but in all definitions of region the idea of space as a whole is found, so that the region is considered to be a unit consisting of a number of neighboring areas.
Experts believe that regional science has promising prospects for development by approaching current spatial problems, especially in the context of regionalization process in the EU and the multidisciplinarity of this science is an important asset. Another aspect to be noted is that policies are often based on theories, situation that applies also in the case of regional development.
ENDNOTES
[1] D.L. Constantin – Economie regională, Editura Oscar Print, Bucureşti, 1998, p.9 [2] D.L. Constantin – Op. cit., p.10 [3] R. Capello – Regional economics in its 1950s: recent theoretical directions and future changes, The
Annals of Regional Science, 42, 2008, p.755 [4] A. Bailly, L.J. Gibson – Regional science: Directions for the future, Papers in Regional Science, 83,
2004, p.132 [5] D. Boyce - A short history of the field of regional science, Papers in Regional Science, 83, 2004 [6] A.M. Isserman - Intellectual leaders of regional science: A half-century citation study, Papers in Regional
Science, 83, 2004, p.99 [7] W. Isard - History of regional science and the Regional Science Association International: The
beginnings and early history, Springer, Berlin Heidelberg NewYork, 2003 apud B.S. Waldorf – Path-breaking books in regional science, Papers in Regional Science, 83, 2004, p.85
[8] P. Nijkamp - Regional science: Multi-disciplinarity ‘avant la lettre’, Papers in Regional Science, vol.83, number 3, July 2004, p.517
[9] R. Capello – Op. cit., p.762 [10] Among the new theories that combines elements of the main groups of regional development theories are:
the theories of endogenous local development (with elements of theories of development and of localization) and the new economic geography (with elements of theories of location and of growth)
[11] According to D. Antonescu – Dezvoltarea regională în România – concept, mecanisme, instituţii, Editura Oscar Print, Bucureşti, 2003, p.12
[12] M. Blaug - Teoria economică în retrospectivă, Literatura economică internaţională, Editura Didactică şi Pedagogică, Bucureşti, 1992 apud D. Antonescu – Op. cit., p.12
[13] D.L. Constantin – Op. cit., 1998, p.12 [14] According to R. Capello – Op. cit., p.764 [15] D. Platon – Regiunile din unghiul politicilor de dezvoltare ale UE in C. Pârlog, D.L. Constantin (coord.) -
Dezvoltare regională şi integrare europeană, Lucrările celui de-al Doilea Simpozion Naţional al

The USV Annals of Economics and Public Administration Volume 15, Issue 1(21), 2015
119
Asociaţiei Române de Ştiinţe Regionale, 4-5 aprilie 2002, Bucureşti, Editura Oscar Print, Bucureşti, 2003, p.43
[16] Assembly of European Regions - Declaration on regionalism in Europe, 1996, art. 1 [17] According to D. Antonescu – Op. cit., p.12 [18] V. Pușcaşu – Dezvoltarea regională, Editura Economică, Bucureşti, 2000, p.14
BIBLIOGRAPHY
1. Antonescu Daniela – Dezvoltarea regională în România – concept, mecanisme,
instituţii, Editura Oscar Print, Bucureşti, 2003 2. Assembly of European Regions - Declaration on regionalism in Europe, 1996, art. 1 3. Bailly Antoine, Gibson Lay James – Regional science: Directions for the future, Papers
in Regional Science, 83, 2004, pp.127-138 4. Behrens Kristian, Thisse Jacques-François – Regional economics: a new economic
geography perspective, Regional Science and Urban Economics, 37, 2007, pp.457-465 5. Blaug Mark - Teoria economică în retrospectivă, Literatura economică internaţională,
Editura Didactică şi Pedagogică, Bucureşti, 1992 6. Boyce David - A short history of the field of regional science, Papers in Regional
Science, 83, 2004, pp.31-57 7. Capello Roberta – Regional economics in its 1950s: recent theoretical directions and
future changes, The Annals of Regional Science, 42, 2008, pp.747-767 8. Constantin Daniela Luminiţa – Economie regională, Editura Oscar Print, Bucureşti,
1998 9. Isard Walter - History of regional science and the Regional Science Association
International: Thebeginnings and early history. Springer, Berlin Heidelberg NewYork, 2003
10. Isserman Andrew M. - Intellectual leaders of regional science: A half-century citation study, Papers in Regional Science, 83, 2004, pp.91-126
11. Năstase Carmen, Popescu Mihai, The model of cluster in implementing change and creating a favourable environment for enterprises, Entrepreneurial Strategies and Policies for Economic Growth, 2012, pp. 179-188
12. Nijkamp Peter - Regional science: Multi-disciplinarity ‘avant la lettre’, Papers in Regional Science, vol.83, number 3, July 2004, pp.516-518
13. Platon Dan – Regiunile din unghiul politicilor de dezvoltare ale UE, in Pârlog Cornelia, Constantin Daniela Luminiţa (coord.) - Dezvoltare regională şi integrare europeană, Lucrările celui de-al Doilea Simpozion Naţional al Asociaţiei Române de Ştiinţe Regionale, 4-5 aprilie 2002, Bucureşti, Editura Oscar Print, Bucureşti, 2003, pp.43-49
14. Puşcaşu Violeta – Dezvoltarea regională, Editura Economică, Bucureşti, 2000 15. Richardson Harry W. – Regional and urban economics, Pitman Publishing Ltd.,
London, 1973 16. Scutariu Adrian Liviu - Aspects regarding the interconnection of regional science with
regional development, The USV Annals of Economics and Public Administration, Volume 12, Issue 1(15), 2012, pp.84-90
17. Scutariu Adrian Liviu - Cercetarea fenomenului turistic din perspectivă regională, Teză de doctorat, Universitatea “Alexandru Ioan Cuza” din Iași, 2013
18. Stanciu Pavel - Studiul pensiunilor turistice din judeţul Suceava, Revista de turism-studii și cercetări în turism, Nr. 4, 2007, pp.48-53
19. Waldorf Brigitte S. - Path-breaking books in regional science, Papers in Regional Science, 83, 2004, pp.59-89
20. Zaharia Petronela - Aspects related to the autonomy manifestation in local public administration management, The USV Annals of Economics and Public Administration, Volume 13, Issue 1(17), 2013, pp. 273-279

The USV Annals
of Economics and
Public Administration
Volume 15,
Issue 1(21),
2015
120
THE MODEL OF CROSS-BORDER COOPERATION IN THE
ROMANIAN-BULGARIAN NEIGHBOURHOOD AREA BETWEEN
DESIRE AND REALIZATION
LecturerPhDBogdanVasileILEANUAcademyofEconomicStudies,Bucharest,Romania
ProfessorPhDDanielaLuminitaCONSTANTINAcademyofEconomicStudies,Bucharest,Romania
DepartmentofAdministrationandPublicManagementdanielaconstantin_2005@yahoo.com
AssociateProfessorPhDClaudiuHERTELIU
AcademyofEconomicStudies,Bucharest,RomaniaDepartmentofStatisticsandEconometrics
ProfessorPhDTudorelANDREIAcademyofEconomicStudies,Bucharest,Romania
Abstract: This paper develops some findings from the project entitled “Bulgarian-Romanian Area Identities: A
Neighbourhood Study” (BRAINS), funded by the European Regional Development Fund under the auspices of the Romania-Bulgaria Trans-border Cooperation Programme 2007-2013, Priority Axis 3 – Economic and Social Development. More precisely, it aims to explore the manner in which the cross-border cooperation model perceived by the Romanian and Bulgarian citizens living in the cooperation area responds the current economic and social challenges. The main issue investigated is: does the local population – as a main actor in the Romanian-Bulgarian Neighbourhood Area (ROBULNA) – connect its aspirations with the realities, possibilities and potential of this area? The correlation degree between these two aspects is established starting from the project sampled data connected with the official data from the Romanian and Bulgarian 2011 censuses. The analysis relates and comments upon aspects regarding human capital, unemployment, economic structure and their distribution in ROBULNA, revealing fields of both convergent and divergent opinions, which enhance or, on the contrary, create difficulties in constructing an integrated cross-border cooperation action.
Key words: ROBULNA, trans-border cooperation model, regional analysis, county analysis Romania, Bulgaria,
JEL classification: R19, R10, P48
1. INTRODUCTION
The new political and economic environment, characterized by the influences of globalisation, internationalisation and integration, has determined major changes in the structure of strategic relationships. Inter alia, they have transformed the functions of international borders, with new challenges and opportunities in terms of interconnections, cooperation between countries and regions (Clement, 1997; McMaster, 2013).
In this context various definitions and diverse types of border regions have been brought into discussion, as well as different spatial scales of corresponding analyses (van Geenhuizen et al., 1996). Thus, border regions can be addressed as “border areas as public authority regions and as functional economic spaces” (van Geenhuizen, 1996, .675). According to Ratti (Ratti, 1994) and

The USV Annals of Economics and Public Administration Volume 15, Issue 1(21), 2015
121
Greenhuizen(van Geenhuizen ,1996) four approaches are usually employed for border areas, as follows: the functional activity approach, focusing on the identification of the functional impact of the border on the development of the neighbor regions; the core-periphery approach, which considers the border areas as institutional and economic outskirts; the regional system approach, emphasizing the role played by the borders in the restructuring processes at regional level; the strategic planning approach, closely related to the strategic behavior of the actors involved in the economic planning and their perception of borders as separation lines.
At present the border areas are more and more subject to territorial cooperation, which creates appropriate conditions for functional cooperation between adjacent territorial units aiming at solving problems of common interest (McMaster, 2013).
Territorial cooperation can take the form of cross-border (when adjacent regions are envisaged), transnational (when regional and local authorities are involved) and interregional (characterized by information exchange and experience sharing at larger scale) cooperation (McMaster, 2013;Perkmann, 2003; Scott, 2002).
As far as the European Union is concerned, European territorial cooperation (ETC) is a clear objective of the Cohesion Policy. In the 2007-2103 programme period it counted 53 cross-border programmes, 13 transnational programmes and an interregional cooperation programme, affecting more than 500 million people. All these programmes were funded via the European Fund for Regional Developemnt, the allocated budget representing approx. 8.7 billion euros.
A distinctive feature resulted from the European integration processes, leading to the free movement of services, capital and labour is the creation of two significantly different types of borders, namely internal – between EU member states and external – between EU member states and non-member states.
The accession to the EU of the new member states has brought about important changes in their transborder cooperation, particularly in the internal borderland areas: formal legal arrangements have been established and the shaping of connections between the actors of cooperation in these border areas – regional and local governments, local communities, business firms, education, cultural and scientific institutions, NGOs, etc. – has gained a considerable importance (Dolzblasz and Raczyk, 2010).
The impact of successful territorial cooperation is examined in terms of economic growth, job creation, quality of life, quality of natural environment, services provision, international trade, foreign direct investment, tourism, social commuting, migration, educational exchanges, etc. (Celinaka-Janowicz et al., 2013). A structural equation model measuring such impacts has been elaborated and tested within the ESPON project TERCO – European Territorial Cooperation as a Factor of Growth, Jobs and Quality of Life (ESPON – TERCO, 2013). The results with regard to the most important factors for the success of territorial cooperation point to those that initiate the cooperation – people, stakeholders and resources, highlighting the need of responsible involvement in this process from its early stages.
In the same register with the findings of the TERCO project, our paper points out the need to investigate the opinions of the involved actors about the fields of cooperation and correlate them considering the local identities in the participating regions as a part of the background for establishing realistic strategies for cooperation. It offers as case study the opinions expressed by the inhabitants from ROBULNA [1], demonstrating a variety of ideas and behaviours depending on the investigated aspect and local identity features. They can serve as a background in order to formulate policies able to contribute to surmounting the existing barriers and formulating a coherent cooperation model.
2. DATA AND METHODS The starting point of our research has been a questionnaire aiming to study the inhabitants’
opinions with regard to the potential cooperation opportunities, so as to define the most suitable

The USV Annals of Economics and Public Administration Volume 15, Issue 1(21), 2015
122
cross-border cooperation model, in accordance with the profile of the two sub-areas (Romanian and Bulgarian) involved. The analysis is based on a mix of micro and macro-data related to ROBULNA, collected from different sources:
a) Micro-data were collected during November and December 2012 from a sample of 1015 units, adult inhabitants living in the neighbourhood area, in the seven counties from the South of Romania, and 900 respondents interviewed during almost in the same period from the nine border districts of Bulgaria (see Map 1).
Map 1. Romanian-Bulgarian Neighborhood Area (ROBULNA)
Source: edited by the authors starting from the source available on the BRAINS project homepage http://robulna.eu/en/ The sample distribution by county and district is presented in Table 1.
Table 1. Sample distribution by county County Share(%) District Share (%) 1 Mehedinti 14.3 1.Vidin 6.3 2 Dolj 14.3 2.Veliko Trnovo 16.1 3 Olt 14.3 3.Vratsa 11.3 4 Teleorman 14.3 4.Dobric 11.4 5 Giurgiu 14.3 5.Montana 9.1 6 Calarasi 14.3 6.Plevna 16.5 7 Constanta 14.3 7.Razgrad 7.6
Total 100.0 8.Ruse 14.5 9.Silistra 7.3 Total 100.0
The sample distribution by age and by gender is very close to the official data. Thus 55.6% of
the respondents are females and the rest of 44.4 % are males. On the Bulgarian side a share of 51.4% is represented by females.
Regarding the distribution by age it can be mentioned that 44.9 % of the Romanian respondents are close to middle age (30-49 years), 37.6% are over 50 years and only 17.4% are youngers, aged below 30 years. 31. 3% of the Bulgarian respondents are in the middle age, 18.6% are aged below 30 years and the rest of 50.2% are aged over 50 years old.
Most of the respondents have at least medium level of education, while 21.3 % of Romanians and 22.5 % of Bulgarians have higher education.
The question addressed to the target population described above was: “To what extent are you influenced by the following factors, when you maintain /intend to maintain relations with your Bulgarian/Romanian neighbours?” with the following predefined answers: “Finding job
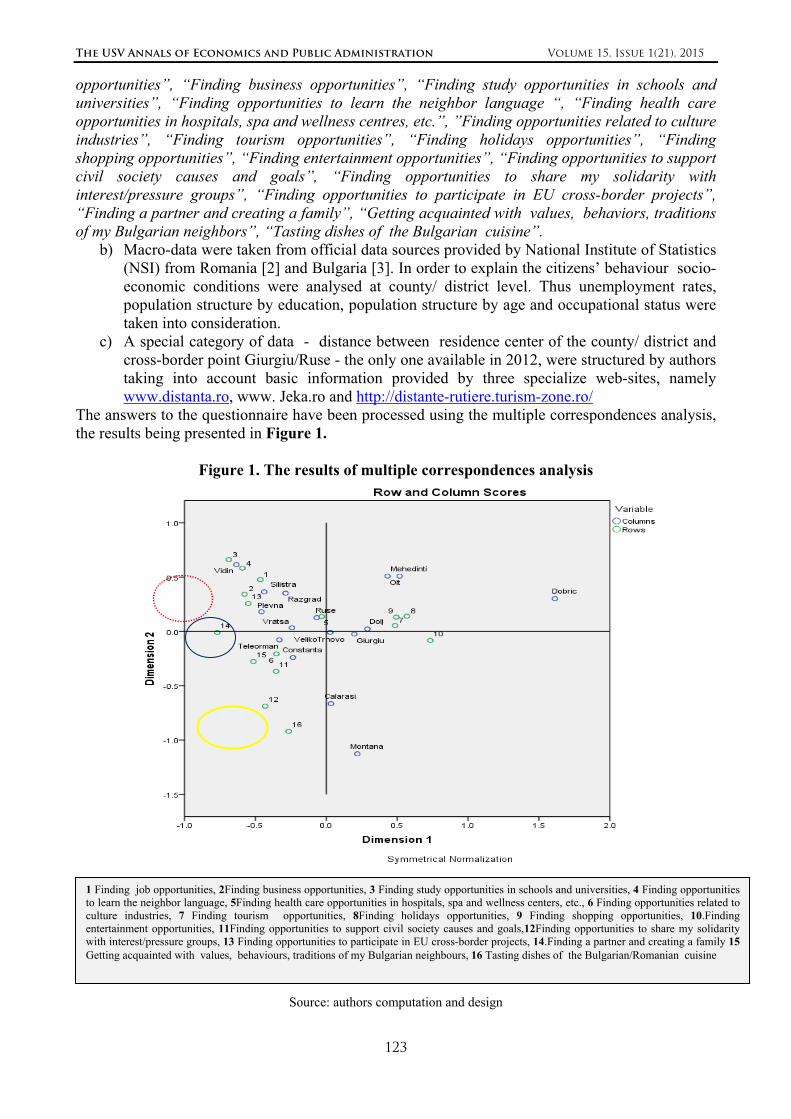
The USV Annals of Economics and Public Administration Volume 15, Issue 1(21), 2015
123
opportunities”, “Finding business opportunities”, “Finding study opportunities in schools and universities”, “Finding opportunities to learn the neighbor language “, “Finding health care opportunities in hospitals, spa and wellness centres, etc.”, ”Finding opportunities related to culture industries”, “Finding tourism opportunities”, “Finding holidays opportunities”, “Finding shopping opportunities”, “Finding entertainment opportunities”, “Finding opportunities to support civil society causes and goals”, “Finding opportunities to share my solidarity with interest/pressure groups”, “Finding opportunities to participate in EU cross-border projects”, “Finding a partner and creating a family”, “Getting acquainted with values, behaviors, traditions of my Bulgarian neighbors”, “Tasting dishes of the Bulgarian cuisine”.
b) Macro-data were taken from official data sources provided by National Institute of Statistics (NSI) from Romania [2] and Bulgaria [3]. In order to explain the citizens’ behaviour socio-economic conditions were analysed at county/ district level. Thus unemployment rates, population structure by education, population structure by age and occupational status were taken into consideration.
c) A special category of data - distance between residence center of the county/ district and cross-border point Giurgiu/Ruse - the only one available in 2012, were structured by authors taking into account basic information provided by three specialize web-sites, namely www.distanta.ro, www. Jeka.ro and http://distante-rutiere.turism-zone.ro/
The answers to the questionnaire have been processed using the multiple correspondences analysis, the results being presented in Figure 1.
Figure 1. The results of multiple correspondences analysis
Source: authors computation and design
1 Finding job opportunities, 2Finding business opportunities, 3 Finding study opportunities in schools and universities, 4 Finding opportunities to learn the neighbor language, 5Finding health care opportunities in hospitals, spa and wellness centers, etc., 6 Finding opportunities related to culture industries, 7 Finding tourism opportunities, 8Finding holidays opportunities, 9 Finding shopping opportunities, 10.Finding entertainment opportunities, 11Finding opportunities to support civil society causes and goals,12Finding opportunities to share my solidarity with interest/pressure groups, 13 Finding opportunities to participate in EU cross-border projects, 14.Finding a partner and creating a family 15 Getting acquainted with values, behaviours, traditions of my Bulgarian neighbours, 16 Tasting dishes of the Bulgarian/Romanian cuisine

The USV Annals of Economics and Public Administration Volume 15, Issue 1(21), 2015
124
3. RESULTS
The first result which can be noticed from available data is the fact that there is no evidence
of a common or specific opinion between Romanian and Bulgarians regarding the background of actual or future close cooperation.
The overall spread can be explained taking into account some general aspects also highlighted by other Romanian and Bulgarian studies and some particular aspects which are specific to each entity. One of the general aspects which characterize this complex neighborhood area is related to high regional and county/district disparities. The problem of disparities was earlier underlined by many researches with regard to different aspects. Various Romanian studies are making discussion regarding the situation in the counties which now are included in the ROBULNA area. For example, Goschin et al. (2008) point out disparities between territorial units and also classify the 42 counties based on absolute level and trends of disparities. Three ROBULNA counties, namely Teleorman, Giurgiu and Calarasi are classified on this occasion in the poorest category, their main indicators showing high time-decline.
Ileanu (Ileanu et al., 2009) shows that in the counties from South of Romania the small and medium enterprises, as engine of the economy, form only small, fragile clusters, rather based on customer capital than on core-value such as human or organizational capital.
A more recent study (Constantin, 2013) Constantin reveals that the inequalities within NUTS2 regions (between counties) are more important than the interregional balances, the Romanian area situated alongside the Danube river being a relevant example in this context. Not least, as it was shown before in (Ileanu, 2013) some problems of communication or policy transmission between different levels of public or private management authorities might exist. In this case they may be counted on factor list which creates such distances between territorial areas.
The same aspects can be also remarked across the border, in Bulgaria, where Kirilova (Kirilova,2013) noticed a high level of disparities between districts. Beside the general aspects dominated by local disparities, particular aspects are highlighted starting from results revealed in the Figure 1.
The Romanian counties and Bulgarian districts are spread overall the standardized space, generally being in different quadrants and respondent’s attributes are associated with only a few districts/counties.
The lowest standardized distance between Romanian and Bulgarians, as seen in the figure, is between Giurgiu-Ruse-Veliko-Trnovo, county which makes the connection with Bulgarian districts through the main road between counties.
The “distance” from the communities from Vidin and Dolj, which has multiple dimensions is pregnant. Despite the historical facts, at the moment of the research study the bridge between Danube towns Vidin and Calafat was not functional.
Some joint opinions could be seen between the administrative territories from the same country, rather based on neighborhood characteristics. Enhancing this idea can be mentioned that:
-Citizens from Vidin are more interested in “Finding study opportunities in schools and universities” or “Finding opportunities to learn the neighbor language” and it is the only district with significant whishes related to education purposes. One explanation might be represented by the fact that Vidin is at least twice closer to the Romanian city Craiova than to Sofia or Varna, as the most important university centers, taking into account that the new passage possibility, the bridge Vidin-Calafat will be finished soon [4].
- In Silistra district, people are more interested in job or business opportunities, mainly because according to official macro-data found at Bulgarian NSI, Silistra was ranking in 2012 on third place after Vidin and Razgrad by highest unemployment rate (16%). None of the Romanian counties from the cross-border has such huge unemployment rate. Moreover in this area there is one of the lowest shares of people with tertiary education from all Bulgarian districts. But the most

The USV Annals of Economics and Public Administration Volume 15, Issue 1(21), 2015
125
important issue is that Silistra has a ratio of retired to employed persons of 35% [5], the highest in Bulgaria, double as value compared for example with Sofia. In this case the worst conditions of the citizens determine them to seek any possibility of work.
-A special group of counties-districtis is formed by Calarasi, Montana, Olt and Dobrich, where the inhabitants seem to have no expectancies about joint collaboration with neighbors.
-Citizens from Ruse are more likely to find health or other wealth benefits opportunities in Romania.
-Items 10,12,14,16 which refer to entertainment, solidarity, family/relationship and testing neighbor dishes are very far from the citizen’s expectancies.
4. CONCLUSIONS
The quantitative analysis reveals a relative distance between Romanian and Bulgarians. Main opportunities which may be expected as joint activities should be created around education and work: find/offer job opportunities, find offer education opportunities. The absence of a common opinion regarding joy, feelings or solidarity opportunities warns about the difficulty of constructing an integrated cross-border cooperation action. The importance of opportunities based on work and education is an effect of the low socio-economic profile of the citizens around the border.
These differences might be also the consequences of an unstable economic situation, underlined by lack of different types of capital and high disparities between counties as researchers have shown, during a long period after 1990, in both countries, in areas alongside the Danube. Dominated by local problems (intra-counties or intra-districts) the citizens are not able even to think about potential cross-border cooperation. Given these circumstances, in a broader perspective, future cooperation has to take into consideration regional and local identities as an important element for the economic and social development of ROBULNA, turning to good account the potential of the whole area. The changing status of the Romanian-Bulgarian border, which is now an internal border of the EU raises economic, cultural, administrative challenges in order to unite the border counties/districts: they have to identify variables that can be controlled by these border areas and, thus, to formulate adequate strategies for their joint economic, social and cultural development. Acknowledgement: The authors acknowledge the support received from Professor Constantin Apostol and Professor Mimi Kornazheva, the Romanian and, respectively, the Bulgarian coordinators of the “Bulgarian-Romanian Area Identities: A Neighbourhood Study” (BRAINS) project, 2(21)-3.1-11, MIS ETC:651, funded via the Romania-Bulgaria Trans-border Cooperation Programme 2007-2013, Priority Axis 3 – Economic and Social Development.
5. ENDNOTES
[1] Within the BRAINS project besides the inhabitants’ opinions about the fields of cooperation the opinions of the local administration and business firms have been also studied.
[2] www.insse.ro [3] http://www.nsi.bg/en/ [4] At the moment of the survey Vidin-Calafat bridge was not finished. [5] Authors calculations using 2011 Bulgarian census data.
6. REFERENCES
1. Celinska-Jankowicz, D., Zwalinska, K., Widla-Domaradzki, L. (2013), “Structural Equation Model of Successful Territorial Cooperation”, in G. Gorzelak, K. Zawalinska, European Territories: From Cooperation to Integration?, ESPON and EUROREG, Warsaw: Scholar, pp. 134-154

The USV Annals of Economics and Public Administration Volume 15, Issue 1(21), 2015
126
2. Clement, N.C. (1997), “The Changing Economics of International Borders and Border Regions”, in P. Ganster, A. Sweedler, J. Scott (Eds.), Borders and Border Regions in Europe and North America, Institute for Regional Studies of the Californias at San Diego University, San Diego 3. Constantin, D.L.(2013), “Romania’s Regional Policy between the Current Realities and the Challenges of the 2014-2020 Programme Period”, Acta Universitatis Danubius. Œconomica), Vol 9, No 4, pp.281-291 4. Dolzblasz, S., Raczyk, A. (2010), “Relationships between actors of transborder cooperation. Polish-German borderland case study”, Europa XXI, Vol. 20, pp. 119-129 5. McMaster, I. (2013), “European Territorial Cooperation: Overview and Evaluation”, in G. 6. Goschin,Z., Constantin, D.L., Roman, M., Ileanu, B.V.(2008), “The current state and dynamics of regional disparities”, Romania Romanian Journal of Regional Science, Vol.2, No. 2, pp. 80-105 7. Gorzelak, G., Zawalinska, K. European Territories: From Cooperation to Integration?, ESPON and EUROREG, Warsaw: Scholar, pp. 54-68 8. Ileanu, B.V., Isaic-Maniu,A., Herteliu,C. (2009), “Intellectual capital components as causes of regional disparities. A case study in Romania”, Romanian Journal of Regional Science, Vol. 3, No. 2, pp.39-53. 9. Ileanu B. (2013) SME’s Priorities, and Management Authorities Directions. A Regional Approach in Romania, Acta Universitatis Danubius. Œconomica, Vol. 9, No. 5, pp. 191-199 10. Perkman, M. (2003), “Cross-border regions in Europe: significance and drivers of regional cross-border cooperation”, European Urban and Regional Studies, Vol.10, pp. 153-171 11. Ratti, R. (1994), “Spatial effects of borders: an overview of traditional and new approaches to border region development”, in P. Nijkamp (Ed.), Europe on Move, Avebury, Aldershot, pp. 115-137 12. Scott, J.W. (2002), “Cross-border governance in the Baltic Sea Region”, Regional and Federal Studies, Vol. 12, pp. 135-153 13. Van Geenhuizen, M., van der Knapp, B., Nijkamp, P. (1996), “Trans-border European Networking: Shifts in Corporate Strategy?”, European Planning Studies, Vol.4, No.6/1996 14. http://www.nsi.bg/en/content/11236/economic-statistics/ 15. http://statistici.insse.ro/shop/ 16. Kirilova Y. (2013), “Regional disparities in Bulgaria - evaluation and policy implications”, paper presented at the “EU in the New Economic Complex Geography” COST seminar, Lisbon, available at: www.gecomplexity-cost.eu/.../Presentation_lisbon_Yana_kirilova.ppt

The USV Annals
of Economics and
Public Administration
Volume 15,
Issue 1(21),
2015
127
ANALYSIS OF ROMANIAN FISHERIES AND AQUACULTURE IN
REGIONAL CONTEXT
ProfessorPhDMihaelaNECULITA
DunareadeJosUniversityofGalati,[email protected]
ProfessorPhDLilianaMihaelaMOGA
DunareadeJosUniversityofGalati,[email protected]
Abstract: Integration in European Union assumes obtaining certain benefits. Fisheries and aquaculture can provide a
key contribution to food security and poverty alleviation. Employment in the sector has grown faster than the world’s population, providing jobs and supports the livelihoods of hundreds of millions. Fish continues to be one of the most-traded food commodities worldwide being very important for developing countries. However, productivity gains in fisheries do not always imply long-term increases in supply. Developing countries are continuing their efforts to clarify the linkage between development activities and sustainable resource use. Both population and economic growth are putting enormous additional pressures on inland and marine fisheries resources as contributors to food security and providers of a social safety net. At the same time, the use of domestic fisheries to generate foreign exchange is exacerbating allocation issues between artisan and industrial fleets. The actual fisheries legislation was influence by social, economic and environmental considerations. The paper proposes an integrated analysis of Romanian situation by means of data and statistics provided by European and national statistics institutions. Fisheries in general and aquaculture sector in particular could be regarded as an advantage for Romania in the European competition. The main problem of the Romanian fisheries is its unsatisfactory competitiveness both regarding the domestic and European market.
Key words: aquaculture, fishery, food security, integration, policy
JEL classification: F15, Q13, Q22
I. INTRODUCTION
The aim of this paper is to analyze Romanian fishery and aquaculture situation to the regional level in the 8 development regions of Romania: North-West, Center, North-East, South-East, South, Bucharest–Ilfov, South-West, West.(Moga and Constantin, 2011). Romania's development regions do not actually have an administrative status and do not have a legislative or executive council or government. The main region’s function is to allocate European Union funds for regional development.
The paper analyzes the current Romanian fisheries and aquaculture sector because fishery is very important in supply the European seafood market.
In Romania, the fisheries sector includes aquaculture, marine and inland fishing, processing and marketing. Romania’s main fishery production component is aquaculture, followed by inland fisheries, while fishery activities along the coastline of the Black Sea remain limited when compared to the importance of inland fisheries. (Figure 1)
Marine fishing takes place only in the Romanian Black Sea national waters and the national fishing fleet is represented by the small scale fishery. Commercial inland fishing takes place in rivers, ponds, reservoirs, the Danube River, the Danube Delta and the Danube Delta Biosphere Reserve. The Romanian aquaculture sector is predominantly freshwater and regarding the extensive farming, they have the advantage of preserving the quality of the water. Recently the extensive fish

The USV Annals of Economics and Public Administration Volume 15, Issue 1(21), 2015
128
farms provide other service such as: ecological tourism, recreational fishing, and educational activities.
Figure no. 1. – Romanian fish productions. Variable trend (2005-2013) Souce: Romanian market analysis of fish and fish products, ROMPOP 2014
The data analysis shows that, Romania's fish production has fluctuated (unpublished). In
2005 was 13,337 tones, registering a maximum of 17 942 tones in 2008, after which the economic crisis, fell to approx. 11.600 tons in 2010 and 2011, the last two years, 2012 and 2013, registering a recovery up to 13,500 -15,000 tons.
Fisheries and aquaculture, along with fish processing and trade of fish products are activities present in all regions of the country. In some isolated areas, such as Danube Delta, fishing is one of the main activities that provide employment and sources of income for the local population.
II. METHODOLOGY The paper develops a methodological framework establishing statistical methods for
measuring and analyzing the interaction between regional integration and regional development to the national level and the influence it has on Romanian fisheries and aquaculture production.
Data were collected and processed from the national institutions and Eurostat. The period considered is 2005-2013.
III. AQUACULTURE AND FISHERIE SECTOR 1. Aquaculture The Romanian aquaculture production represents the most important part in fish production,
in terms of share ranging. Its weight varies in period 2005 - 2013 from 54% to 76% of total production, with an average of 68% of the total production.
The Romanian traditional aquaculture system is extensive or semi-intensive, and based on cyprinid polyculture.( Zaharia 2012)) The main species produced in Romania from aquaculture to 2005 was dominated by cyprinids, both Indigenous and Asian origin(such as: silver carp, bighead carp and grass carp), representing 85% of the total, 15% being represented by trout, perch, pike, perch, catfish, sturgeon, etc. After the cyprinids, the second species produced is trout sharing 9%, followed by crucian carp with 9%.
Many of the pond sites are degraded, as they have been given little or no maintenance over 15 years. Unfortunately, an important part of the existing aquaculture surfaces are unsuitable for aquaculture, particularly since they have not been adapted to the requirements of modern

The USV Annals of Economics and Public Administration Volume 15, Issue 1(21), 2015
129
production processes. There are over 100.000 ha designated for aquaculture activities in Romania, structured in fish farms, hatcheries, and nurseries. (Table 1)
After ’90 the aquaculture production decline as consequence of the transition to the market economy, low investments and an unclear institutional and legal framework, particularly as regards land ownership (Cristea, Zugravu et al 2011). Today, the production recovered, but we have more to do until will reach the European average.
Table no. 1. Distribution of aquaculture units by region
Region Units Facilities Total area Nurseries area
Farms area
%
North-East 58 72 9412,2 942,014 8470,18 9,2 South-East 93 99 66726,1 3385,26 63340,7 65 South 143 160 14122,5 1472,81 12649,7 14 South-West 38 39 2544,15 129,312 2414,83 2,5 West 39 37 1709,22 279,676 1429,55 1,7 North-West 66 75 3128,84 380,741 2748,09 3 Center 53 57 2726,49 83,3207 2643,17 2,7 Bucharest–Ilfov 28 5 1986,2 0 1986,2 1,9 TOTAL 518 575 102356 6673,14 95682,3 100
Source: ANPA (RUA, PNCD)
2. Inland fishing Inland fishing is carried out as main, full time occupations, often by traditional fishers. In
some case, it is a subsistence activity for people who have insufficient income from other sources (Zugravu, Turek Rahoveanu et al 2011).
Fish catches made in inland waters during 2005 – 2013 (Figure 2) are at a relatively constant level. The lowest production was recorded in 2010 and was 2457.1 tons and the largest amount, 6.045 tons, was registered in 2006. In 2013 was a production of 3094.3 tons, the highest in the last 3 years.
Figure no. 2. – Romanian inland fishing(tons). Variable trend (2005-2013)
Souce: Romanian market analysis of fish and fish products, ROMPOP 2014 The analysis of the average values of catches by species during 2005 - 2013 (Figure 2)
shows that the main species caught in inland waters were: crucian carp 41,2%, bream 16,7%, roach 5,9%, carp 4,7%, pike perch 4,4%, catfish 4,2%, pike 2,6%, Danube mackerel 8,4%. Predatory fish represent 12,25% of the period average catch.
3. Marine fishing In the period 2006 - 2013, Black Sea catches recorded in 2010 a minimum of 230.9 tonnes
and a maximum in 2013 of 1617.3 tons, this is mainly due to the increased demand for rapana, representing over 50% of the marine production obtained. (Figure 3)

The USV Annals of Economics and Public Administration Volume 15, Issue 1(21), 2015
130
Figura no. 3. - Regions share of catches from commercial fishing. Shares in 2013
Souce: Romanian market analysis of fish and fish products, ROMPOP 2014
The situation in the Black Sea catch is as follows: 2008 - 443,9 tons, 2009 - 331,8 tons, 2010 - 230,9 tons, 2011 - 537,2 tons, 2012 – 810,6 tons, 2013 – 1.617,3 tons.
Regarding processing industry of fishery and aquaculture products we observed a concentration of these units in areas with a tradition of fishing and fish farming, respectively in the South-East region (Figure 4) formed by counties with a large hydrographic network.
Figura no. 4. - Distribution processing industry units by region. Shares in 2013
Souce: Romanian market analysis of fish and fish products, ROMPOP 2014 In Romania, the overall value of the output of the processing industry amounts to around
44504 EUR Value of the output in 2011 (in thousands of EUR) and the number of persons employed measured in full-time equivalent national was1178. Consumption varies in European Union from 5.3 Kg per person in Hungary and 6.3Kg per person in Romania to 56.7kg per person in Portugal according to EUROSTAT( FAO -STECF, The 2013 Annual Economic Report).
Aquaculture fish production is about 17,000 tons and the rest up to 90,000 tons, as is the annual consumption in Romania, is covered by imports. Our country provides less than 20% of consumption.
It predicts that the total market fish (fresh and frozen) will continue to grow about 25-30% each year. One of the problems of suppliers is lack of qualified personnel in factories and shops. Fish is most sensitive meat and when you are dealing with this product or with fresh seafood, the problem is the warranty. It takes well-qualified people to implement traceability systems. Economic objective is to increase fish consumption from 6 Kg per person per year in Romania, to an average of 20kg per person per year in European Union.

The USV Annals of Economics and Public Administration Volume 15, Issue 1(21), 2015
131
Table no. 2. Fish consumption evolution [thousand tons] 2008 2009 2010 2011 2012 2013
Sales of fish from domestic sources, to population and processing units. Total
of wich: 16,2 16,1 11,5 11,6 13,4 14,5
Fish from aquaculture *** 12,5 13,1 8,8 8,4 10,0 10,0 Fish from marine and inland fishing 3,7** 3,0** 2,7** 3,2** 3,4* 4,5*
Imports*** 89,6 90,2 86,0 69,2 74,4 74,8Exports *** 1,7 4,1 4,7 6,5 6,2 6,3
Total intern consumption (= 1+2-3) 104,1 102,2 92,8 74,3 81,6 83,0 Consumption per capita (kg/pers/year) 4,6 4,6 4,1 3,3 3,6 3,6
Source: * M.A.D.R.; **ANPA statistics; *** EUROSTAT
4. Economic performance From 2013 to 2012, total income decreased by 16%, while the operational cost decreased by
15%. The total income is dominated by the turnover from the sale of fish from the farms, which contributes 65% of total income, leaving only 33% to other income and only 2% for subsidies.
The feed costs are 21%, livestock costs are 18% and wages and salaries 20%.. The total expenditures totalize 68% of the total income. The total value of assets decreased in 2013 comparing with 2012 by 11% and debts increased by 3%. This is mainly due to the decreasing number of bigger farms and increasing the number of small farms. The net investment increased 180%, but it is still low.
It is importance to increase the local production and reduce the dependence from the import( more than 100,000 tones are imported annually). The price is driven by the trout price, which has remained at the relative constant level.
For the Romania aquaculture producers 2013 was better than 2012 because the Romania sector opportunities are at a higher level. The economic crisis and the consequences are over passed. The new regulation, especially its provisions stimulating aquaculture production is expected to increasing the investments in the sector for on growing production.
IV. CONCLUSION
In case of the 8 regions, have been observed for aquaculture, inland fishing and marine
fishing, certain needs of the actors involved, needs that lead to a slow positive trend compared with the European situation.
Aquaculture sector needs more efficient production activity, investments in rehabilitation and sites modernization, state intervention through legislative simplification, fiscal incentives, use of allocated funds and funding partnerships with research institutions.
Commercial fisheries (inland and marine fishing) should invest in the modernization of ports, fishing fleet, promoting fishery products, implementing an integrated traceability system for monitoring the entire route from capture to final consumer, compensation and subsidies for unforeseen circumstances. Across all regions, identified needs for processing are related to the efficiency of the production activity, the use of allocated funds and state intervention measures.
Must trace the improvement of product quality, problem that influence the marketing of products internally and externally. Product quality is conditioned by European and international regulations and the Romanian water legislation (difficulty of land tabulation) which sometimes hinders the development of fish farming.
Product diversification is very important, Romania has to sell new species, especially valuable species to attract new market share to national and international level. Increasing market share is based on sales growth,, which is based on marketing and on effective management of distribution channels. Market share is influenced by the buyer reticence for commercialization of

The USV Annals of Economics and Public Administration Volume 15, Issue 1(21), 2015
132
fish from natural environment or from aquaculture. In Romania the population prefers fish from the natural environment, even if aquaculture fish do not suffer genetic mutations.
Romania has a special situation in Europe because we do not have a fishing fleet. However, in all 8 regions, the share of sales of native species is holds by carp, crucian carp followed with 20% and then followed the other freshwater species. Although in recent years has stimulated the research for development sturgeon aquaculture, the lack of habit and lack of market consumption prevented its commercialization.
However to expand the production further the industry needs new licenses, modernizing the existent farms, and training of the staff, new technologies to be applied(Dong, Moga et al 2011).
V. ACKNOWLEDGEMENT
This research was financed by the Programme Partenerships in Priority Areas – National Plan for Research, Development and Innovation 2007– 2013 (PN II), sponsored by Ministry of National Education – Executive Agency for Higher Education, Research, Development and Innovation Funding (MEN – UEFISCDI), project no. 167/2014, Cloud computing based traceability information system for fishery.
VI. REFERENCES
1. Cristea, V., Zugravu, A., Moga, L., Cristea, D., Maftei, C.O., Oprea, R.A.(2011) Impact of Information Technology Management Processes on Fish Farming, Journal of Environmental Protection and Ecology, ISSN 1311-5065, Vol. 12, nr. 4 2. Dong Tian, L.M. Moga, C. Nistor, X. Zhang, C. Oprit Maftei (2011)A Decision Support System for Water Pollution Assessment and Control in Aquaculture Pond, Journal of Environmental Protection and Ecology, ISSN 1311-5065, Vol. 12, Nr. 3A 3. Moga L. M., Constantin D.L. (2011) Specialization and geographic concentration of the economic activities in the Romanian regions, Journal of Applied Quantitative Methods, vol. 6, no. 2 p.15 4. Zaharia T.(2012) National aquaculture sector overview: Romania, in: Proceedings of the International Conference, Scientific and Technical Innovation in the Blue Economic Zone, 18 - 19 May, 2012, Yantai, PR China, Editura Didactică şi Pedagogică, Bucureşti, ISBN 978-973-30-3305-9: 71-86 5. Zugravu, Neculiță, Turek Rahoveanu(2011) Information System for Financial Analysis and Economic Planning within Fish Farms, The XVIIth International Conference IBIMA (International Business Information Management Association) „Creating Global Competitive Economies: A 360-degree Approach”, Milano, Italia, Proceedings cotat ISI *** (2014) - Romanian market analysis of fish and fish products, chap. 3, Conceta Silva Consulting Company, Agrotec, Geastrategy & Consulting, Studiu ROMPOP, unpublished *** (2013) - The Economic Performance of the EU Aquaculture Sector Scientific, Technical and Economic Committee for Fisheries (STECF) Report

The USV Annals
of Economics and
Public Administration
Volume 15,
Issue 1(21),
2015
133
COMPETITIVENESS AND INNOVATION IN THE ROMANIAN
REGIONS – HOW MUCH PROGRESS DURING THE POST-
ACCESSION PERIOD?
SeniorResearcherCarmenBeatricePAUNA
InstituteforEconomicForecasting,Bucharest,[email protected]
SeniorResearcherMarioaraIORDAN
InstituteforEconomicForecasting,Bucharest,[email protected]
SeniorResearcherMihaela‐NonaCHILIAN
InstituteforEconomicForecasting,Bucharest,[email protected]
Abstract: The paper aims to assess the latest developments in the competitiveness of the Romanian regions, with a
particular focus on innovation as one of its key determinants. Different sets of indicators are used and comparisons with the EU countries and their regions are provided. The results reveal some progress towards better competitive positioning, but little advancement in the field of innovation in most of the Romanian regions (below 50% of the EU average). This exposes a systemic weakness of the innovation process in Romania, determined by both the national RDI system and the business sector, which calls for sustained efforts at multiple levels (political, economic, institutional, social, entrepreneurial, both nationally and regionally) to overcome the current stagnation and push strongly towards the most needed change in mindsets and actions in the near future.
Key words: Romanian regions, regional competitiveness, regional innovation, composite indices
JEL classification: O30, R10, R11
1. DEFINING REGIONAL COMPETITIVENESS In a broad sense, competitiveness may be defined as the ability of a country, measured against
the performance of other countries, to build up and ensure an economic, social and political environment able to support the accelerated value added creation. At national level, competitiveness also entails a territorial dimension, the territorial spread of the competitive economic agents being rather unequal, but usually concentrated in certain areas of the national territory. As regards this issue, the broad concept of competitiveness also involves defining its limits, the standard competitiveness analyses usually emphasizing three competitiveness levels – country, industry and company (Porter, 1990; Reiljan et al., 2000), while the more recent ones expanded towards sub-regions and supra-national organizations (Reiljan et al., 2000). At regional level, competitiveness must capture the fact that despite the presence within the region of both competitive and not competitive actors/structures, there are also certain common features in every region that impact on the competitiveness of all its companies. Such features include, among others, the social and physical infrastructure, labor skills, and public institution efficiency.
The complexity of regional competitiveness was also captured by an analytical decomposition by four levels (elaborated by Esser in 1995 and presented by Annoni and Kozlovska in 2010 in their report on the regional competitiveness index of the EU), in which different types of competitiveness drivers operate: i) the micro level, the competitiveness drivers focusing on the efforts of companies and on their collaboration/company networks; ii) the medium level, which aims at creating an enabling environment for companies, the competitiveness drivers focusing on the physical infrastructure, on the competitiveness-oriented sectoral policies (education and R&D, industrial policy, environment policy, export promotion), but also on territorially-focused policies

The USV Annals of Economics and Public Administration Volume 15, Issue 1(21), 2015
134
(regional policy, localization policy, territorial promotion), iii) the macro level, which includes the macroeconomic, political and legal framework which favors competition, its key drivers being the monetary, budget and fiscal policies, the trade and exchange rate policies, the competition and consumer protection policies and iv) the meta-level, which pertains to the basic societal directions, its drivers being the competitive economic system, the capability to elaborate visions and strategies, value systems that encourage learning and change, collective memory, social cohesion, social capital, social status of entrepreneurs. At regional/sub-regional/local level, the four levels are interconnected, although their degree of relevance differs; however, what is interesting is the fact that lately the significance of the meta-level seemed to have increased within the territorial units in what regards the choice of their development paths and ways, especially in the long and medium term.
Finally, we mention the most recent definition, proposed by the report on the EU Regional Competitiveness Index 2013, which integrates both the vision of the companies and that of the people located in/residents of a region: “regional competitiveness may be defined as the ability to provide the companies and residents with an attractive and sustainable working and living environment”, sustainability being considered the ability of a region to provide an attractive environment both on the long and on the short term (Annoni, Dijsktra, 2013).
2. ASSESSMENT OF REGIONAL COMPETITIVENESS IN THE EUROPEAN UNION AND ROMANIA Different ways to assess the regional competitiveness may be found in the specialized literature,
one of the most often used being that regarding the aggregate/composite competitiveness indicators. However, some specialists say (Jula et al., 1998, 1999) that it can be difficult to build an aggregate indicator in order to assess regional competitiveness starting from its defining elements, because it is not easy to choose what to include in such an index, due to the elusiveness and non-direct observation of the concept itself. Moreover, practically all the indicators which are relevant for competitiveness are inter-correlated, so that causality is difficult to assess. However, efforts can be done to distinguish between the drivers of competitiveness and its outputs.
One may find many studies which compute global competitiveness indices, but mostly at country level (for instance, those computed by the World Economic Forum and International Institute for Management Development). Beside them, there are studies dealing with regional competitiveness that use fewer indicators than in the case of the national competitiveness indices. From among them we mention the European Competitiveness Index (ECI), United Kingdom Competitiveness Index, World Knowledge Competitiveness Index (elaborated by Robert Huggins Associates), Atlas of Regional Competitiveness (Eurochambers) and, in Romania, the regional competitiveness index elaborated in 2007 by the Group for Applied Economics, the regions’ competitiveness index elaborated in 2011 by IRECSON and the regional competitiveness indices elaborated on the basis of integrative model proposed by Prof. Cezar Mereuţă (Mereuţă et al., 2007; Chilian, 2011).
Based on the methodology employed by the World Economic Forum, which yearly publishes the Global Competitiveness Report, an index of competitiveness of regions was elaborated in the EU (for the NUTS-2 regions), with 11 pillars and 73 indicators [2], organized by three groups (basic competencies, efficiency drivers and innovation drivers), which cover a wider range of factors than purely economic aspects. The pillars of this indicator are the following [3]: i) basic competencies: i1) institutional quality, i2) macroeconomic stability, i3) infrastructure, i4) health, i4) primary and secondary education quality; ii) efficiency drivers: ii1) higher education and lifelong learning, ii2) labor market efficiency, ii3) market size; iii) innovation drivers: iii1) technological readiness, iii2) business sophistication, and iii3) innovation. The i1)-i5) pillars have greater significance for the less developed regions, while the iii1)-iii3) pillars for the more advanced regions (especially for those with a very high development level), but also for the regions in transition from a lower towards a higher development stage. For each pillar, a score is computed as

The USV Annals of Economics and Public Administration Volume 15, Issue 1(21), 2015
135
simple average of the standardized and/or transformed indicators (some indicators are computed only nation-wide), and the final score (total RCI) is computed as weighted average of the three basic pillars.
Because different indicators have a different impact on regions’ competitiveness in accordance with their development levels, the weights attached to the three groups of drivers were correlated with the regional GDP per capita (3 weighting classes in the 2010 version and 5 classes in the 2013 version). This may also provide useful insights to the decision-makers, because competitiveness of a less developed region may be enhanced, for instance, by increasing the institutional and educational quality, as well as by increasing innovation. In fact, this was recognized by the authors of the RCI report, who increased the weight of innovation drivers also in the case of the less developed regional economies, in order to reward the innovation policies in such regions (Annoni, Dijkstra, 2013) (Table 1).
Table 1. RCI weighting scheme of sub-indices of main competitiveness drivers, the 2013 version GDP per capita, in relation to the EU average
Development stage
Basic competencies pillar
Efficiency drivers pillar
Innovation drivers pillar
< 50 1 35% 50.00% 15% 50-75 2 31.25% 50.00% 18.75% 75-90 3 27.50% 50.00% 22.50% 90-110 4 23.75% 50.00% 26.25% >110 5 20.00% 50.00% 30.00%
Source: Taken from P. Annoni, L. Dijkstra, EU Regional Competitiveness Index 2013, JRC Scientific and Policy Reports, European Commission, DG for Regional and Urban Policy, ISBN-978-92-79-32370-6, 2013.
In the European Union, the regional competitiveness index (RCI) reveals a remarkable regional dimension of competitiveness, both among the member states, and inside them. One may notice large differences between the group of the more developed states (EU-15) and the less developed ones (NMS-13) regarding also the territorial distribution of competitiveness drivers and the channels of its diffusion among the regions [4]. The first 10 top competitive regions may all be found in the EU-15 countries (more precisely, in 7 countries: the Netherlands 3 regions, the United Kingdom – 3 regions, Sweden, Germany, France and Denmark – one region each). At the opposite end, the least 10 competitive regions are equally found in EU-15 countries (Greece – 5 regions!) and in NMS-13 countries (Romania – 3 regions and Bulgaria – 2 regions). Considering the three main pillars of RCI, the situation does not change much, although the number of countries varies within larger limits (Table 2). Unfortunately, in the case of basic competencies pillar almost all the regions of Romania are may be found among the least 10 competitive European regions, while in the case of innovation drivers pillars six regions of Romania are similarly unfavorable positioned. Table 2. The top and the least competitive 10 regions of the EU countries, as according to the RCI 2013 pillars Basic competencies pillar Efficiency drivers pillars Innovation drivers pillar Top 10 regions Last 10 regions Top 10 regions Last 10 regions Top 10 regions Last 10 regions Netherlands – 6 regions! Finland – 4 regions
Romania – 7 regions! Bulgaria – 2 regions Greece – 1 region
Netherlands – 6 regions! United Kingdom – 3 regions France – 1 region
Greece – 5 regions! Spain – 2 regions France – 2 region Bulgaria – 1 region
Germany – 3 regions! Sweden, United Kingdom, Denmark, Belgium, Finland, Netherlands, Luxembourg (NUTS-1) –1 region each
Romania – 6 regions! Bulgaria – 3 regions Greece – 1 regions

The USV Annals of Economics and Public Administration Volume 15, Issue 1(21), 2015
136
Source: Computations based on data from P. Annoni, L. Dijkstra, EU Regional Competitiveness Index 2013, JRC Scientific and Policy Reports, European Commission, DG for Regional and Urban Policy, ISBN-978-92-79-32370-6, 2013.
The inter-regional overall competitiveness gaps [5] in the EU countries are of a higher magnitude in the case of the EU-15 countries than in the case of the NMS-13 countries, but considering the three pillars the situation differs (Tables 3 and 4). Thus, while in the case of basic competencies pillar the inter-regional gaps are similar in the two groups of countries, in that of efficiency drivers pillar the inter-regional gaps are somewhat higher in the EU-15 countries, and in that of innovation drivers pillar the highest inter-regional gaps are accounted for by the NMS-13 countries (namely by Romania).
Table 3. Inter-regional competitiveness gaps in the EU-15 countries
Basic competencies pillar
Efficiency drivers pillar
Innovation drivers pillar
RCI 2013
Belgium 1.32 1.42 1.70 1.45 Denmark 1.05 1.32 1.63 1.32 Germany 1.23 1.47 1.67 1.46 Ireland 1.03 1.23 1.24 1.20 Greece 1.80 3.39 3.80 2.80 Spain 1.22 5.23 2.47 2.75 France 1.64 35.02 2.57 3.64 Continental France 1.42 2.61 2.19 2.15 Italy 1.37 2.93 1.92 1.94 Netherlands 1.13 1.43 1.59 1.35 Austria 1.12 1.20 1.52 1.17 Portugal 1.21 2.04 2.17 1.77 Finland 1.06 1.34 1.61 1.22 Sweden 1.13 1.54 1.98 1.52 United Kingdom 1.33 1.83 3.04 1.66
Source: Authors’ computations based on data from P. Annoni, L. Dijkstra, EU Regional Competitiveness Index 2013, JRC Scientific and Policy Reports, European Commission, DG for Regional and Urban Policy, ISBN-978-92-79-32370-6, 2013. Table 4. Inter-regional competitiveness gaps in the NMS-13 countries
Basic competencies pillar
Efficiency drivers pillar
Innovation drivers pillar
RCI 2013
Bulgaria 1.80 1.94 3.83 2.15 Czech Republic 1.13 1.45 1.94 1.42 Croatia 1.03 1.14 1.03 1.08 Hungary 1.27 1.62 2.01 1.65 Poland 1.42 2.08 2.64 1.61 Romania 1.60 3.15 7.03 3.25 Slovenia 1.02 1.19 1.42 1.19 Slovakia 1.29 2.57 2.35 2.11
Source: Authors’ computations based on data from P. Annoni, L. Dijkstra, EU Regional Competitiveness Index 2013, JRC Scientific and Policy Reports, European Commission, DG for Regional and Urban Policy, ISBN-978-92-79-32370-6, 2013.
When assessing the regional competitiveness gaps, we also consider as interesting and useful the assessment of the possible theoretical influence of the maximum, and the minimum ranks of regions, respectively [6], for the RCI and its three pillars. The gaps among the EU countries are

The USV Annals of Economics and Public Administration Volume 15, Issue 1(21), 2015
137
very large in such a case. The highest (theoretical) competitive influence of the maximum ranks of regions may be noticed, both for the RCI and for its pillars, exactly in the countries with regions in Top 10 competitive positions (United Kingdom, Sweden, Germany, Netherlands, Denmark, France and Belgium), and the lowest in countries with regions in weaker or medium competitive positions (Greece, Italy), or in countries with small gaps between the maximum and the minimum ranks (Austria, Ireland), and vice versa in the case of the competitive influence of the regions’ minimum ranks. In the NMS-13 countries, the influences of competitive positions of both the minimum and the maximum ranks are of smaller magnitude and almost similar (except for Slovakia, which comes closer to some EU-15 countries). Also in this case, the most striking gaps may be found for the innovation drivers pillar, which appears to be the key factor for sustainability of the competitive positions of the regions of the EU countries.
As regards Romania, except for the Bucuresti-Ilfov region, all the regions were positioned among the least competitive in the European Union (ranks higher than 240, from among 262 positions), and the Sud-Est region was ranked the penultimate among the EU regions (the lowest overall competitiveness score from among the regions of the new member states, beside the Severozapaden region of Bulgaria also in 2010). Also, in the case of certain sub-indices of competitiveness drivers pillars, at least one Romanian region may be found as ranked last in the NMS regions or even in the entire UE: all Romanian regions in the case of basic education, the Bucuresti-Ilfov region in the case of institutional quality, the Sud-Vest Oltenia region in the case of infrastructure, the Vest region in the case of basic competencies pillar, the Sud-Est region in the case of health, higher education and lifelong learning, labor market efficiency and efficiency drivers and innovation drivers pillars, the Nord-Est region in the case of market size, technological readiness and innovation drivers pillar, the Sud Muntenia region in the case of business sophistication. One may also notice that the Bucuresti-Ilfov region (the most developed in Romania, with the highest competitive position – except for the basic competencies pillar) is surrounded by regions with much worse competitive positions (Sud Muntenia, Sud-Est and Sud-Vest Oltenia), which reveals the concentration of competitiveness drivers on its territory and the limited nature of “competitiveness diffusion”, due both to the poor quality of transport infrastructure, and, mostly, to the significant gaps regarding the sectoral structure and dynamics, business development and propensity to innovate. In fact, the Bucuresti-Ilfov region is already included among the regions in the 4th development stage (namely, transition towards an innovation-driven economy), unlike the rest of the regions, which are included among the regions in the 2nd stage of development (namely, transition towards an efficiency-driven economy – the Vest region) or even in the 1st stage of development (basic competencies-driven economy – the other regions of Romania).
3. INNOVATION PERFORMANCE IN THE ROMANIAN REGIONS
Since innovation is a key driver of competitiveness, both at national and regional level, we
present in the following some issues in this respect. Thus, the regional performance in innovation in the EU regions [7] was determined by the Regional Innovation Scoreboard (RIS), according to which the regions of the EU member countries were classified by four performance groups, as follows: innovation leaders (34 regions), innovation followers (57 regions), average innovators (68 regions) and modest innovators (31 regions – Figure 1). As one may see, although the regional innovation performance may largely vary within a country, generally in the EU the regional performance groups are correlated with the national ones. One may notice a clear innovation divide between the countries (and regions) of the Northern and Western Europe, and the Southern and Eastern Europe. Romania has a single region that exceeds the modest innovators level - the Bucuresti-Ilfov region, included in the average innovators group – results in line with those regarding the competitiveness performance of the Romanian regions.

The USV Annals of Economics and Public Administration Volume 15, Issue 1(21), 2015
138
Figure 1. Innovation performance of the EU countries’ regions
Source: Regional Innovation Scoreboard 2014, Directorate-General for Enterprise and Industry, European Commission.
The regions that are innovation leaders registered the best performance regarding all the indicators considered for the analysis, by about 30% above the EU averages, while the regions that are modest innovators registered the lowest performance, especially regarding the business innovation performance. Despite the presence in such regions of highly skilled and educated labor force, they experience both major weaknesses concerning the other fields of the regional innovation systems, and negative impacts due to the hindrances from the part of the national RD&I systems of the countries of which they are components. In the case of the Romanian regions, the evolution of the overall innovation performance gaps over the interval 2004-2010 was positive for six of the eight development regions, except for the Sud-Vest Oltenia and Vest regions, which registered negative average annual growth rates of RIS ranging between -2.5% and 0% (Figure 2). The best evolutions of the innovation performance were registered by the Bucuresti-Ilfov, Sud Muntenia, Nord-Vest and Nord-Est regions.
Figure 2. Evolution of innovation performance of the EU regions
Source: Regional Innovation Scoreboard 2014, Directorate-General for Enterprise and Industry, European Commission.
When analyzing the performance of the Romanian regions regarding the RIS indicators (Table 5), we may notice that most of them have registered performance below the level of 50% of the EU average for all indicators. Paradoxically, some of the regions with lower development levels

The USV Annals of Economics and Public Administration Volume 15, Issue 1(21), 2015
139
(Nord-Est, Sud-Vest Oltenia) have registered slightly better performance for certain indicators correlated to a higher extend with the innovation capability and the capability of trading the results of innovation, and regions with a higher development levels (Vest, but also Bucuresti-Ilfov) have registered poorer performance. However, on the whole, the weaknesses of the innovation process in Romania, due both to the national RD&I system, and to the business structures and their inner relationships, are also true at the regional level, which call for action at multiple levels (political, economic, institutional, social, entrepreneurial) in order to overcome the current unfavorable situation and build up the premises for a mindset shift and operational action in the very near future.
Table 5. Features of the innovation performance in the Romanian regions Indicators Performance level
> 120% of the EU average
Performance level between 90% and 120% of the EU average
Performance level between 50% and 90% of the EU average
Performance level <50% of the EU average
Share of population aged 25-64 years with higher educational level
Bucuresti-Ilfov Nord-Est, Sud-Est, Sud Muntenia, Sud-Vest Oltenia, Vest, Nord-Vest, Centru
Research on R&D in the public sector as % of the GDP
Bucuresti-Ilfov Nord-Est, Sud-Est, Sud Muntenia, Sud-Vest Oltenia, Vest, Nord-Vest, Centru
Research on R&D in the business sector as % of the GDP
Nord-Est, Sud-Est, Sud Muntenia, Sud-Vest Oltenia, Vest, Nord-Vest, Centru, Bucuresti-Ilfov
Non-R&D innovation expenditures as % of turnover
Sud-Est Nord-Est, Centru, Vest, Sud Muntenia
Bucuresti-Ilfov, Nord-Vest, Sud-Vest Oltenia
Single innovating SMEs, as of total SMEs
Nord-Est, Sud-Est, Sud Muntenia, Sud-Vest Oltenia, Nord-Vest, Centru, Bucuresti-Ilfov. Regiunea Vest – lipsă date
Collaborations between the innovative SMEs, as % of SMEs
Nord-Est, Sud-Est, Sud Muntenia, Sud-Vest Oltenia, Vest, Nord-Vest, Centru, Bucuresti-Ilfov
EPO patent applications per bill. regional GDP (PPS)
Nord-Est, Sud-Est, Sud Muntenia, Sud-Vest Oltenia, Vest, Nord-Vest, Centru, Bucuresti-Ilfov
Product or process innovators as % of SMEs
Nord-Est, Sud-Est, Sud Muntenia, Sud-Vest Oltenia, Nord-Vest, Centru, Bucuresti-Ilfov. Regiunea Vest – unavailable data
Marketing or organizational innovators % of SMEs
Nord-Est Bucuresti-Ilfov, Sud-Vest Oltenia
Sud-Est, Sud Muntenia, Vest, Nord-Vest, Centru
Employment in medium and high-
Vest Bucuresti-Ilfov Centru, Sud Muntenia
Nord-Est, Sud-Est, Sud-Vest Oltenia, Nord-Vest

The USV Annals of Economics and Public Administration Volume 15, Issue 1(21), 2015
140
tech manufacturing and in knowledge-intensive services, as % of total employment Sales due to new-to-market or new-to-firm innovations, as % of turnover
Sud Muntenia, Centru
Nord-Est, Sud-Est, Sud-Vest Oltenia, Nord-Vest, Bucuresti-Ilfov
Vest
Source: Adaptation based on information from Regional Innovation Scoreboard 2014, Directorate-General for Enterprise and Industry, European Commission. [1] The paper presents some partial research results of the research themes Stimularea clusterelor locale - factor determinant al competitivităti regionale – coordinator Carmen Beatrice Păuna, Institute for Economic Forecasting, Bucharest, 2013, mimeo and Identificarea reţelelor inovative în dinamica economică a spaţiului European – cazul României. Capitalul uman. Dezvoltarea economică bazată pe cunoaştere, inovare şi inteligenţă, coordinator Carmen Beatrice Păuna, Institute for Economic Forecasting, Bucharest, 2014, mimeo. [2] The 2013 version; the 2010 version has included 69 indicators. [3] Investing in Europe’s future, Fifth report on economic, social and territorial cohesion, European Union, 2010 and P. Annoni, L. Dijkstra, EU Regional Competitiveness Index 2013, JRC Scientific and Policy Reports, European Commission, DG for Regional and Urban Policy, ISBN-978-92-79-32370-6, 2013. [4] Data available upon request. [5] Computed by the ratio of normalized (score+2) maximum to minimum scores for each EU country with at least two NUTS-2 regions. [6] Computed as according to the formulas: (Rmax-Rmin)*Rmin/(Rmax-Rmin)*Rmax, and (Rmax-Rmin)*Rmax/(Rmax-Rmin)*Rmin, respectively. Data available upon request. [7] 190 analyzed regions, from 22 EU countries, Norway and Switzerland, in 2004, 2006, 2008 and 2010 – Regional Innovation Scoreboard 2014, Directorate-General for Enterprise and Industry, European Commission.
BIBLIOGRAPHY
1. P. Annoni, K. Kozovska (2010), EU Regional Competitiveness Index 2010, Joint Research Centre and DG Regional Policy. 2. P. Annoni, L. Dijkstra (2013), EU Regional Competitiveness Index 2013, JRC Scientific and Policy Reports, European Commission, DG for Regional and Urban Policy, ISBN-978-92-79-32370-6, 2013. 3. R. Camagni (2002), On the concept of territorial competitiveness: Sound or misleading? Paper presented at the ERSA Conference, Dortmund, August. 4. M.N. Chilian (2013), Coeziunea economico-socială la nivel regional – Elemente de fundamentare a unei strategii regionale, Editura Expert, Bucuresti. 5. M.N. Chilian (2011), Competitivitatea economiei românesti si integrarea în Uniunea Europeană, Editura Universitară, Bucuresti. 6. European Commission (2010) - Investing in Europe’s future, Fifth report on economic, social and territorial cohesion. 7. European Commission (2014) - Regional Innovation Scoreboard 2014, Directorate-General for Enterprise and Industry. 8. Gardiner, A., R. Martin, P. Tyler (2004), Competitiveness, Productivity and Economic Growth across the European Regions, University of Cambridge, UK, May. 9. ***„Inovarea şi creşterea competitivităţii – Vectori fundamentali ai progresului economico-social al României”, Program PNCD II, Contract nr. 91-071/2007, Etapa P2/II – „Analiza comparativă a diverselor categorii de indicatori de competitivitate şi relevanţa acestora. Modele pentru studiul mecanismelor de difuzie a noilor cunoştinţe şi de propagare a undelor inovative”, Contractor: Institutul de Prognoză Economică, Subcontractor: Universitatea Româno-Americană, Bucureşti, Noiembrie 2008, mimeo.

The USV Annals of Economics and Public Administration Volume 15, Issue 1(21), 2015
141
10. Jula D., Ailenei D., Jula N., Gârboveanu A. (1999), Economia dezvoltării, Ed. Viitorul Românesc, Bucureşti, 11. Jula D., Jula N., “Dinamica dezechilibrelor în dezvoltarea regională” (1998), Oeconomica, nr. 3-4, Societatea Română de Economie, IRLI, Bucureşti. 12. R. L. Martin (coord.), (2003), A Study on the Factors of Regional Competitiveness. A draft final report for the European Commission, Directorate General Regional Policy, Cambridge Econometrics, University of Cambridge, UK. 13. C. Mereuţă, L.L. Albu, M. Iordan, M.N. Chilian (2007), “A Model to Evaluate the Regional Competitiveness of the EU Regions”, Romanian Journal of Economic Forecasting, No. 3, pp. 81-102. 14. C.B. Păuna (coord.) (2013), Stimularea clusterelor locale - factor determinant al competitivităti regionale, Institutul de Prognoză Economică, Bucureşti, mimeo. 15. C.B. Păuna (coord.) (2014), Identificarea reţelelor inovative în dinamica economică a spaţiului European – cazul României. Capitalul uman. Dezvoltarea economică bazată pe cunoaştere, inovare şi inteligenţă, Institutul de Prognoză Economică, Bucureşti, mimeo. 16. Porter, M.. (1990), The Competitive Advantage of Nations, The Free Press New York. 17. Janno Reiljan, Maria Hinrikus, Anneli Ivanov (2000), Key Issues in Defining and Analyzing the Competitiveness of a Country, University of Tartu, Finland, Faculty of Economics and Business Administration, Working Paper Series, No. 1/2000. 18. ***“Sinteza Documentară privind clusterii şi competitivitatea”, din cadrul studiului documentar privind literatura de specialitate şi tendinţele domeniului creşterii economice pe plan mondial în contextul noii economii, Programul CEEX_CERES, Proiectul Cex-05-D8-32/5.10.2005, “Creşterea economică, ocuparea şi competitivitatea în economia bazată pe cunoaştere“, Autoritatea Contractantă IFA, Contractor IPE, 2005-2008, Etapa I, Decembrie 2005.

The USV Annals
of Economics and
Public Administration
Volume 15,
Issue 1(21),
2015
142
DEVELOPMENT OF CROSS-BORDER AREAS. STUDY CASES
REVIEW
PhDMarcelaȘLUSARCIUC
University„ȘtefancelMare”Suceava/InstituteofNationalEconomyBucharest,[email protected]
Abstract: The paper aims to review study cases found in the scientific literature concerning the development of cross-
border areas in European Union and its neighbourhood. The introductory part of the paper is drawing few considerations about the cross-border areas. Further we identified in the specific literature relevant study cases that provide lessons learned, tools and models that can contribute to the development of the cross-border areas. The last part of the paper is focusing on an inquiry about how this lessons, learned, tools and models may be adapted in case of cross-border areas along the Romanian border with the EU Eastern Neighbourhood.
Key words: cross-border area, economic development, Eastern Neighbourhood JEL classification: P48, R58 1. INTRODUCTION The present paper is part of a larger research frame that has as objective to analyze in a
multidisciplinary frame the economic development poles that are located in the border areas and to identify the way in which the viable development strategies can be applied in the cross-border context, therefore to propose a setting up of a new architecture for the cross-border areas development. As a step in this research we consider some relevant study cases that scientific literature provides about cross-border areas, inside the European Union Borders and at its borders with Eastern neighbours, in order to figure out lessons learned, tools and models that can contribute to the development of the cross-border areas. For the selected cases we considered, partly or entirely, few elements: the existence of historical encouraging/discouraging background, existence of written treaties/agreements, diplomatic exchanges at national level, partnership relations, financing framework, existence of a strategy, the involved actors (public administration, civil society, companies, universities), particularities that mark the cross-border area. We will use these elements in order to figure out a development frame for the cross-border areas along the Romanian border with the EU Eastern Neighbourhood, namely with Ukraine and Republic of Moldova.
2. FEW CONSIDERATIONS ABOUT CROSS-BORDER CONTEXT
If we think at the borders it is constructive to accept that their existence cannot be avoided, as
a continuous element, the only changeable being the character and courses of borders, therefore, the Europe territorial limits will be temporary in terms of political relevance (Langer, 2012). A vivid example is the one of the borders and border regionals in the Central and Eastern part of Europe that faced many changes in the last decades. On the one side we have the free movement in the Schengen area but limited by the lack of trust in some Member States in terms of border control abilities and on the other side the problems that an open border brings – specific crimes, food security issues, environmental pollution issues, traffic, so on.
Beyond all these, the cooperation among local and regional authorities from the different sides of the border make tighter relations between regions and countries, making from Europe a place for meeting the diversities in many fields – economic, politic, institutional cultural or professional (Bohner, 2011). The governance of the cross-border regions cannot be approached in the traditional political or territorial sense, instead having the approach of networks among many public and private actors bringing together different social systems based on different system values

The USV Annals of Economics and Public Administration Volume 15, Issue 1(21), 2015
143
(Lepik, 2011), and therefore, the decisions are not depending so much on national level. That makes the cross-border regions in EU and its neighbourhood as forms of institutional building due to the demanding changes along the borders, involvement of different types of local governance and the interaction of multilevel governance networks – local, regional, European and even global (Lissandrello, 2004). The researches about the cross-border areas generally compare the living conditions on the both sides of a border and the relations across the border, with consideration of the political order of the two states, the geostrategic balance, the mode of historical establishment of the border, the degree of openness and permeability, emotional loadings (Langer, 2012). Sometimes the cross-border cooperation is not limited to involvement of border cities or regions only, but also growth centers, such as capital cities (Lepik, 2011).
An encouraging frame of cross-border cooperation at European level is the one of the legal instruments, which has two main sources: the Council of Europe and the European Union (Odendahl, 2011). The Council of Europe provides mainly three sets of instruments – conventions, recommendations and political declarations, all of them issued and/or adopted by the Committee of Ministers, to which it may be added some others that do not have immediate impact, such as decisions of the Committee of Ministers or activities that are promoting the cross-border cooperation in Europe. The instruments provided by the European Union are different than the ones that Council of Europe uses but are complementary, widening the legal frame of the cross-border cooperation. European Union focuses on technical and financial support of cross-border cooperation, both inside the EU borders and between EU and its Neighbours. Therefore there are funds and programmes – Cohesion and Regional Policy, European Neighbourhood Policy, Pre-Accession Policy. Relevant to be mentioned is the European Grouping of Territorial Cooperation - EGTC (European Parliament and of the Council of European Union, 2006), that is a cooperation instrument at the EU level established for the creation of cooperative groups on its territory, invested with legal personality, in order to overcome the obstacles hindering territorial cooperation and the use of this instrument is optional. An EGTC must have members from at least two member states and members can include local or regional authorities, bodies governed by public law within the meaning of the second subparagraph of Article 1(9) of Directive 2004/18/EC, or Member States and the composition and powers should be described in a convention that is subject to approval by the member states with members in the body.
After these short getting through we should retain the reality of border existence and the always changing course and character of it, the network governance of the cross-border regions and the existence of a complex legal frame for cross-border cooperation in Europe as elements that are part of the cross-border cooperation context in Europe.
3. MODELS FOR DEVELOPMENT OF CROSS-BORDER AREAS In the following we will go through some study cases found in the literature in order to
identify lessons learned, tools and models that can contribute to the development of the cross-border areas. We made two groups of study cases – one formed by cases of cross-border cooperation inside the borders of European Union, between member states, and one formed by cases of cross-border cooperation at the borders of the European Union, between member states and neighbouring countries. Some of the cases we used in a previous paper as partnership and cooperation models examples in order to illustrate the challenges and the solutions that the partners identified aiming a good partnership in the benefit of all countries or regions involved (Slusarciuc, 2013).
3.1. Cross-border development cases inside the European Union borders

The USV Annals of Economics and Public Administration Volume 15, Issue 1(21), 2015
144
a. Polish-German border Widely, one model of cooperation is the Polish-German cross-border mainly because the
historical disadvantageous background deeply imprinted in the memory of the inhabitants from the cross-border area was overcome. There is a Polish-German cooperation treaty focused on three main areas: conservation activities, logistical activities concerning the establishment of consistent protection goals according to international agreements and planning of a coherent system for environmental management between the two countries (Degórski, 2008). The area benefited by the European funds through the INTERREG programme few lessons being important (Ciok & Raczyk, 2008), such as, a polarization is created by the cooperation programmes in the cross-border areas and a change in the structure of projects is recommended, with more focus on economic and social integration and less on infrastructure. There is relevant also the cooperation and networking between the capitals of the two countries, that consist of a deeper and complementary level of collaboration (Korcelli-Olejniczak, 2008). The support for the cross-border cooperation in this area comes from different levels: EU, national governments, regional authorities from both sides of the border, Euroregions and local administrations, therefore nowadays the Polish-German cross-border cooperation serve as a model for the regions at the Eastern border of EU, having similarities between this border and the Ukrainian-Polish one (Gorzelak, 2006). A specific element that helped the neighbours at the border between Germany and Poland to become familiar with each other, eroded the language and cultural barriers and increased the regional consciousness may was the existence and good functioning of the Euroregions, as example Euroregion Pro Europa Viadrina (Yoder, 2003). Consequently, the region took the first steps in this direction through the promotion of common interests, common goals and common institutions.
b. Danish-German border (Malloy, 2010) We found a study case that shows the contribution of national minorities to the building of a
new frame for cooperation in the so considered ‘old’ Danish–German border region, transforming it into a „European ‘cross-border regional space for politics’”. Today’s border region covers the old Duchy of Slesvig (Danish) or Schleswig (German), meaning the area from the River Eider in today’s Schleswig-Holstein in Germany to the River Kongeaen in today’s Region Syddanmark in Denmark. The area had a changeable leadership during time until 1920 when a permanent division put an end to this state, establishing two national minorities, the German minority residing in southern Denmark and the Danish minority residing in northern Germany. Subsequently, it followed events and conflicts that broke the relationship between the two states, the rebuilding after 1945 of a cooperative relationship being a slow and difficult process. Early stages of cross-border development had a slow progress partly because of the almost diametrically opposed views and actions about the EU in the border region in the middle of 1990s, some opinions quoted in the same cited paper considering that ”there is not one border/barrier but four, a structural (legal) one, a language one, a cultural one and an information one.” Therefore, in the last part of 1990s there were political tensions augmented by economic ones, caused by uneven economic development between the two national economies across the border. Still, the actors from both sides of the border, meaning national minorities, changed this largely antagonistic situation and, throughout the 1990s and 2000s, rebuilt the border region through transforming it into a ‘European’ space for politics.
c. Three Borders area – Austria, Italy, Slovenia (Janschitz & Kofler, 2006)
A case where the historical roots led to closed connections between three countries is the one
of the cross-border area between Austria, Italy and Slovenia. Economic issues, political decision-making process and social patterns were the influencing factors for the communities on all the sides of the common borders, this being considered “a multicultural living space by virtue of a shared

The USV Annals of Economics and Public Administration Volume 15, Issue 1(21), 2015
145
history and material culture, as well as geographical proximity”. All the three countries, as member states, assumed a common European identity and benefit by financing programmes as PHARE CBC and INTEREG, the financial framework helping various cross-border projects and activities. The first step of an institutionalized cooperation was made at the national level in 1978, through the Working Community Alpe-Adria organization that includes regions from more than the three countries (Austria, Croatia, Germany, Hungary, Italy, Slovenia and Switzerland). The aim was focused on economic development, traffic, tourism, water management, cultural relations and other related issues. The European funds created the context for specific projects: development of a cross-border cooperation plan for common marketing of cultural monuments and cultural events, design of common offers for recreation and touristic attractions, tourism development concept for the Three Borders Area that promotes a variety of cultural sites, social aspects and natural resources that united and divided the area in the past, the application of a coordinated bid for Olympic Winter Games 2006 with a common marketing view and many more.
d. Italo-Slovene border (Lipott, 2013) The case of Italo-Slovene border is relevant due to the example of border twin towns Gorizia
and Nova Goriza, located in the two states. Gorizia was home for three different communities – German, Italian and Slovene until 1918, later, in 1947, being founded Nova Goriza as a separate town on the other side of the border, in a different political and economic system. Due to relations and acquaintances, people cooperated on land property issues first and culture and sport later. In 1962, the Udine Accords set up new frame for cooperation on finding solutions to practical issues as drinking water supply, urban planning, roads, local traffic, environmental protection or mutual consultation. In 1990 it was signed the Transfrontier Pact, later named Collaboration Protocol, that added an organizational frame to already existing cooperation on economic basis and cooperation between municipalities. In 2002, the mayors of the two cities and the one of Sempeter-Vrtojba created ”the three executives body” as an area of collaboration with regular meetings. The funds from INTERREG programme helped to run projects, a significant one being EureGo as a private law association of Slovenian and Italian local administrative bodies (59 Italian and 13 Slovenian). In 2010, the three municipalities mentioned earlier established the first European Grouping of Territorial Cooperation as mentioned in a previous section of this paper.
e. Slovenian-Croatian Border This cross-border area has an interesting dynamic because both countries had history of open
border and cross-border cooperation as parts of former Yugoslavia, the change later when Slovenia became member state of the EU in 2004 and of the Schengen area in the same year and a recent change again when Croatia became member state too in 2013. The cross-border trade, the petty trade, the visits from a country to other for consumption goods influenced significantly the economic cooperation between the two countries in the cross-border area. 1999 was the year when it was ratified a free trade agreement between the two countries that contributed at a large extent to the economic cooperation between the two states (Barbič, 2006). Officials realized that during the intermediate time, when the border between the two countries was not so open, the exports from Croatia to Slovenia declined because of the border rules change and despite the long and peaceful tradition along the border, these changes in status affected the economic relationships (Pavlakovich-Kochi & Stiperski, 2006). Before Croatia becoming member states both countries receive financial assistance for cross-border cooperation from EU through Slovenia-Croatia IPA Cross-border Programme’, component of the Instrument for Pre-Accession Assistance that follows an INTERREG Community Initiative for the period 2000-2006, during which there were implemented cooperation projects in fields of economic and social development and sustainable management of the natural resources. The actual financing frame is through INTERREG programmes inside EU borders.

The USV Annals of Economics and Public Administration Volume 15, Issue 1(21), 2015
146
f. Hungarian-Croatian Border (Hajdu, 2006) The case of Hungary-Croatia cross-border area is one example of a cross-border area marked
by various historic events, some of them even tragic, therefore the relationship between the two countries and the international interests marked the cross-border cooperation. Following the 1991 Yugoslavian war, in parallel with the internal changes in Hungarian political, economic and social life, the border crossing started to decline after 1990, Croatian market became risky for Ukrainian entrepreneurs, the only growing trade relations being the ones about gasoline and gun running. After that, the development of the two countries was different, Hungarian economy turning westward, fact that declined more the trade relationships with former Yugoslavia countries. Few years later the small border traffic started to develop, Croatian people crossing the frontier in order to buy consumer goods. The Croatian state started to revive, opening to the Hungarian Chambers of Commerce and Industry along the border that had initiatives of initiating representation agency in Croatia. On the other side, the national levels manifest desire of cooperation and potential for good cross-border cooperation and after 2013 the both countries EU membership status make the relation easier. The national levels is focused on cooperation on some specific issues: transportation infrastructure, utilization of Adria oil pipeline and the management of the Drava River, while at the local level the counties, cities and communities from both sides of the border have contacts with each other in the frame of cross-border projects in fields of tourism, environment, cooperative economy and intercommunity human resource development. The European funds played a good role in the enhancement of the cross-border cooperation between Hungary and Croatia through the IPA Cross-border Cooperation Programme and for the actual programming period there is the setup of Hungary-Croatia Cross-border Cooperation Programme 2014-2020.
g. Vienna-Bratislava metropolitan region (Jaššo, 2008) A relevant case is the one of the most closely located pair of capitals in the world - two cities
that are administrative and economic centers for the two neighbourhood countries – Austria and Slovak Republic. The proximity was favouring the development of the cooperation between the two countries influencing significantly the relationship between different actors in the region. The cooperation was strategically built on few clear issues: the Vienna-Bratislava region intends to become a development pole of European significance, considering the concentration of human, scientific, cultural, technological and institutional potentials, the adequate transportation and communication interconnections to other development poles in Europe; the efforts are concentrated for building a residential, economic and cultural center for the upper and middle Danube line; the region aims to become one of the development centers in Central Europe, important issue in the frame of the accession of the four Visegrad countries (Czech Republic, Hungary, Poland and Slovakia); the region targets to be an economic, cultural and information gateway to Austria and Slovakia. The accomplishment of these structured objectives can make a model area for cross-border development.
h. Eurometropolis Lille–Kortrijk–Tournai – metropolitan governance (Durand &
Lamour, 2014) The Eurometropolis is considered one of the pioneering spaces regarding the cross-border
cooperation at metropolitan level. In 1991 the relations gained an official frame the relations official through a flexible and “informal” institution - the Conférence Permanente Intercommunale Transfrontalière (COPIT) and later, in 2008, it was created a new institution, a European Grouping of Territorial Cooperation (EGTC). The COPIT, as cross-border structure bringing together French and Belgian local authorities, had a limited scope for action and was quite dependent on central state funds. Still, the ground rules for cooperation were established also at national level through

The USV Annals of Economics and Public Administration Volume 15, Issue 1(21), 2015
147
agreements reached in the last 20 years that allowed the development of a local cross-border dynamic controlled by the state. For an improved governance and cooperation possibilities in 2000 started a series of ratifications of cooperation processes by the French and Belgian governments, therefore, in 2002 the two countries signed the Brussels Agreement, that allowed cross-border cooperation between the regional and local authorities and the local public bodies in the shared Franco-Belgian space. A year later the French CIADT (Interministerial committee for spatial planning and development) supported the setting up of a parliamentary working group. In 2007, their conclusions used as starting point for a cooperation project and for the signing of the ”Declaration of intention for the creation of the Eurometropolis Lille–Kortrijk–Tournai” by the 14 founding members and in the next the creation of the Eurometropolis was officially recognized thanks to a French bylaw, which introduced all institutional levels, including states themselves, into cross-border governance. This case is relevant because multi-level governance seems best adapted to managing cross-border cooperation, due to involvement of numerous actors and the differences in power distribution on either side of the border. EGTC functions here as a flexible institutional structure that connects two systems of state powers.
i. Espace Mont-Blanc Project (Lissandrello, 2004) The EMB Project started in 1991 together with the decision making forum – Conference
Transfrontaliere du Mont-Blanc as an area to solve, in a cross-border cooperation frame, the issues of international environmental protection in a mountain area, with the benefits of the previous endeavours that international non-governmental organizations did. The financial help of INTERREG programmes boosted the project aims, involved the national decision makers from Switzerland, Italy and France, together with local administrations and international NGOs and put the label ‘Espace’ instead of ‘Park’. Despite the accident with the Mont-Blanc Tunnel, the EMB Project pursued to develop a common understanding of the sustainable development concept based on tri-lateral relationships in a regional context. By now, under the label and platform of Espace Mont-Blanc1 there were many joint projects for region development in fields as sustainable development, mountain agriculture, nature and landscape, integrated tourism and transport. It is a good case of cross-border cooperation and strategy among a nature object and the interests linked with it.
j. Centrope Project (Swiatek, 2013) Centrope is a regional space created by a political project with the aim to promote the region
as a competitive location in the Central Europe covering part from four European countries: Slovakia, Austria, Hungary and Czech Republic. It was initially funded by INTERREG funds as a joint initiative of the Austrian Federal Provinces of Vienna, Lower Austria and Burgenland, the Czech Region of South Moravia, the Slovak Regions of Bratislava and Trnava, the Hungarian Counties of Győr-Moson-Sopron and Vas as well as the Cities of Bratislava, Brno, Eisenstadt, Győr, Sopron, St. Pölten, Szombathely and Trnava. This cooperation project intended to create a multilateral and sustainable framework for the cooperation of local and regional authorities, public institutions and enterprises in the Central European Region. Specific goals consisted mainly in creating of polycentric cooperation framework which should allow all the partners to work jointly and more effectively on the cross border issues. The Centrope Project had a preparatory phase (2002-2003) and 3 main phases: Centrope I (2003-2006), Centrope II (2006-2007) and Centrope III (2008 and later), all of them benefited by EU funds through INTERREG and European Territorial Cooperation programmes. The relevance of this project for us consist in at least few aspects: high number of countries and partners involved, duration of the project and multi-phases planning approach.
1 www.espace-mont-blanc.com/

The USV Annals of Economics and Public Administration Volume 15, Issue 1(21), 2015
148
3.2. Cross-border development cases at the Eastern border of the European Union a. Hungary and the Eastern neighbours The case of Eastern borders of Hungary is relevant to mention due to the cross-border
cooperation approach through Euroregions that in some other areas is not necessarily efficient. The Eastern border of Hungary that overlap the Eastern border of EU is a short one along the Hungarian-Ukrainian border therefore is more significant to take in consideration the wider cooperation in the Carpathian basin, including Hungary, Poland, Slovakia, Romania and Ukraine. In the actual context of geopolitical state of play, besides the historical fragmentation and the peripheral situation of the borders, in case of Ukraine border is in fact double bordered. The area, more or less, is on the Transcarpathia – region considered with high peripherality (Batt, 2002). That makes the Euroregions to play an important role due to flexibility in matters of territorial or regional governance (Branyi, 2006). The Carpathian Euroregion was the first of its kind in Central or Eastern Europe when founded in 1993, it was established along the EU’s borders with former socialist states and it corresponds to a macroregion with peripheral status regarding all the states involved and the EU territoriality, meaning an assembly of socioeconomic peripheries. For strengthening the structure and to allow access to resources, the partner countries decided to give legal form to the Euroregion as Carpathian Foundation International, with the mission of the regional presence and cross-border role for itself, aiming to strengthen programming, organizational capacity and financial sustainability at regional level. They targeted two areas, promoting innovative initiatives and cross-border exchanges in community development, community resource mobilization and strengthening participative democracy and community organizing throughout the region2. In order to accomplish their goals they attracted financial resources that further granted to local administrations or non-governmental organizations from the Carpathian Region. Nowadays they are not so active anymore but the financial frame is ensured by the cross-border cooperation programmes Hungary-Slovakia-Romania-Ukraine and Poland-Ukraine-Belarus, for both 2007-2013 former programming period and 2014-2020 actual programming period.
b. Poland and Ukraine (Krok & Smętkovski, 2006) Two decades ago Ukraine was the second largest trade partner of Poland in the Eastern
Europe after Russia and the economic change was based on industrial centers in central Poland and Eastern Ukraine. It looked like Ukraine is on the path that Poland was fifteen years earlier, the similarities, mainly in socioeconomic and administrative area, being a starting point for cooperation and knowledge transfer. The situation is fundamentally changed now, considering the military conflict with Russia from the Ukrainian Eastern side. The progress that Poland made and the economic breakdown in Ukraine, caused by the war, increased the gap between the two countries. Even if few years after the Poland accession to European Union the cross-border cooperation was disappointing as far as concern the impact in the regional development, in case of this border also the existence of European funds give an impulse through the projects financed by Joint Operational Programme having as priorities increasing competitiveness of the border area and improving the quality of life3. Moreover, a good opportunity for cross-border cooperation between Poland and Ukraine was the organization of the final tournament UEFA 2012 that put together resources in the aim of economic development of the countries. Despite the sudden change in the political, economic and social frame in Ukraine and considering that the Western part of Ukraine is not directly affected by the military actions the cooperation at the border is still running, even if not to a high rate.
2 Carpathian Foundation International, carpathianfoundation.eu 3 Cross-border Cooperation Programme Poland - Belarus - Ukraine 2007-2013, http://www.pl-by-ua.eu
The USV Annals of Economics and Public Administration Volume 15, Issue 1(21), 2015
149
c. Romania and Republic of Moldova (Marcu, 2011) Romania and Moldova are countries with a common history and a common geography at a
certain time, sharing the same identity, culture and traditions. The length of the border between these two countries is covered by three euroregions that, in a cross-border frame, contribute in different manners to the communities development and relations among people living on the border. Therefore, after the political changes of 2009, euroregions have played an important role in the Europeanization of the Romania-Moldova border area. The more recent events make the common border between Romania and Moldova a relevant tool for mobilizing EU resources, in terms of legal frame, funds and governance network, in order to develop institutions, infrastructure, and local human resources.
4. CONCLUSIONS AND REMARKS ABOUT THE ROMANIAN BORDERS In the context of accepting the existence of borders, as a continuous element, the only
changeable being the character and courses of borders, we considered some relevant study cases that scientific literature provides about cross-border areas, inside the European Union Borders and at its borders with Eastern neighbours, in order to figure out lessons learned, tools and models that can contribute to the development of the cross-border areas with the observance of some elements: the existence of historical encouraging/discouraging background, existence of written treaties/agreements, diplomatic exchanges at national level, partnership relations, financing framework, existence of a strategy, the involved actors (public administration, civil society, companies, universities), particularities that mark the cross-border area. No matter the case studied, one of the core elements that are compulsory for a healthy development of the cross-border areas is the cooperation among local and regional authorities from the different sides of the border in many fields – economic, politic, institutional cultural or professional, becoming forms of institutional building due to the demanding changes along the borders, involvement of different types of local governance and the interaction of multilevel governance networks – local, regional, European and even global. The wider the cooperation network is, including enterprises, universities, non-governmental organizations, the better the results are, enforced by the existence of the legal frame at European level.
Going through the selected models some relevant lessons can be useful for the approaches Romania can have to its borders. An important step is the signature or update of the national agreements between states that can be complemented by local or regional agreements, making use of the legal European frame (example, for the borders Romania-Hungary and Romania-Bulgaria). Moreover, for all the borders the already existing euroregions frame can be reinforced with real actions and active networks. The historical stories that bring together the communities can be used better and the old conflicts can be reconciled in a structured way, maybe with a constructive involvement of the relational potential that the minorities from the border communities have. A strategic approach can make a better use of the natural settings building cooperation around it (example, the setting of the Carpathian area in the North cross-border area between Romania and Ukraine) or the urban settings – closed border pair towns/cities (example, Giurgiu, Romania - Ruse, Bulgaria), potential metropolitan areas (example, Iasi, Romania - Chisinau, Republic of Moldova or Suceava-Botosani, Romania – Cernivtsi, Ukraine). As far as financial aspects, the existence of already third generation of EU cross-border programmes that finance projects for development of all Romanian borders with neighbours is an opportunity that can be exploited more efficient thinking complementary projects that cover all the areas and projects that are continuing other successful previous initiatives.
ACKNOWLEDGEMENTS

The USV Annals of Economics and Public Administration Volume 15, Issue 1(21), 2015
150
This paper has been financially supported within the project entitled “Horizon 2020 - Doctoral and Postdoctoral Studies: Promoting the National Interest through Excellence, Competitiveness and Responsibility in the Field of Romanian Fundamental and Applied Scientific Research”, contract number POSDRU/159/1.5/S/140106. This project is co-financed by European Social Fund through Sectoral Operational Programme for Human Resources Development 2007-2013. Investing in people!
BIBLIOGRAPHY
1. Barbič, A. (2006). Perceptions of New Realities along the Slovenian-Croatian Border. In V. Pavlovich-Kochi, B. J. Morehouse, & D. Eastl-Walter, Challenged Borderlands: Transcending Political and Cultural Boundaries (pp. 216--235). London: Ashgate Publishing Limited.
2. Batt, J. (2002). Transcarpathia: Peripheral Region at the 'Centre of Europe'. Regional & Federal Studies, 12(2), 155-177.
3. Bohner, U. (2011). The European Dimension of Cross-border Cooperation. In B. Wassenberg, & B. Joachim, Living and Researching Cross-Border Cooperation (Volume 3): The European Dimension (pp. 51-59). Stuttgart: Franz Steiner verlag.
4. Branyi, B. (2006). Euroregions along the Eastern Borders of Hungary: A Question of Scale? In J. Wesley Scott, EU Enlargement, Region Building and Shifting Borders of Inclusion and Exclusion (pp. 150-161). London: Ashgate Publishing Limited.
5. Ciok, S., & Raczyk, A. (2008). Implementation of the EU Community Initiative INTEREG III A at the Polish-German border. An attempt at evaluation. In M. Leibenath, E. Korcelli-Olejniczak, & R. Knippschild, Cross-border Governanance and Sustainable Spatial Development: Mind the Gaps! (pp. 34-47). Berlin: Springer Verlag.
6. Durand, F., & Lamour, C. (2014). Cross-border metropolitan governance: the multi-faceted state power. Space and Polity, 18(3), 197-214.
7. European Parliament and of the Council of European Union. (2006, July 5). Regulation (EC) No 1082/2006 of on European grouping of territorial cooperation (EGTC). Official Journal L 210. Bruxelles.
8. Gorzelak, G. (2006). Normalizing Polish-German Relations: Cross-Border Cooperation in Regional Development. In J. W. Scott, EU Enlargement, Region Building and Shifting Borders of Inclusion and Exclusion (pp. 195-205). London: Ashgate Publishing Limited.
9. Hajdu, Z. (2006). Renewal of Crossborder Cooperation along the Hungarian-Croatian Border. In V. Pavlovich-Kochi, B. J. Morehouse, & D. Eastl-Walter, Challenged Borderlands: Transcending Political and Cultural Boundaries. England: . London: Ashgate Publishing Limited.
10. Janschitz, S., & Kofler, A. C. (2006). Protecting Diversities and Nurturing Commonalities in a Multicultural Living Space. In V. Pavlovich-Kochi, B. J. Morehouse, & D. Eastl-Walter, Challenged Borderlands: Transcending Political and Cultural Boundaries (pp. 193-213). London: Ashgate Publishing Limited.
11. Jaššo, M. (2008). Cross-border cooperation challenges: Positioning the Vienna-Bratislava region. In M. Leibenath, E. Korcelli-Olejniczak, & R. Knippschild, Cross-border Governance and Sustainable Spatial Development: Mind the Gaps! (pp. 88-100). Berlin: Springer Verlag.
12. Korcelli-Olejniczak, E. (2008). Functional complementarity a basis for inter-metropolitan collaboration and networking. A case study on cultural activities in Berlin and Warsaw. In M. Leibenath, E. Korcelli-Olejniczak, & R. Knippschild, Cross-border Governance and Sustainable Spatial Development: Mind the Gaps! (pp. 118-130). Berlin: Springer Verlag.

The USV Annals of Economics and Public Administration Volume 15, Issue 1(21), 2015
151
13. Krok, K., & Smętkovski, M. (2006). Local and Regional Cross-Border Cooperation between Poland and Ukraine. In W. J. Scott, EU Enlargement, Region Building and Shifting Borders of Inclusion and Exclusion (pp. 177-191). London: Ashgate Publishing Limited.
14. Langer, J. (2012). The Contingency of Europe's Boundaries. In F. Hollinger, & M. (. Hadler, Crossing Borders, Shifting Boundaries. National and Transnational Identity in Europe and Beyond (pp. 179-199). Frankfurt: Campus Verlag.
15. Lepik, K.-L. (2011). Cross-Border Cooperation Institutional Organisation. Cross-Border Cooperation's Role in Regional Development. Saarbrucken: Lambert Academic Publishing.
16. Lipott, S. (2013). Cross-bordercooperation and city twinning along the Italo-Slovene border. Saarbrucken: Lambert Academic Publishing.
17. Lissandrello, E. (2004). Cross-border region Espace Mont-Blanc. A territorial 'not-yet'? In O. Kramsch, & B. Hooper, Cross-Border Governance in the European Union (pp. 88-120). New York: Routledge.
18. Malloy, T. H. (2010). Creating New Spaces for Politics? The Role of National Minorities in Building Capacity of Cross-border Regions. Regional & Federal Studies, 20(3), 335-351.
19. Marcu, S. (2011). Opening the Mind, Challenging the Space: Cross-border Cooperation between Romania and Moldova. International Planning Studies, 16(2), 109-130.
20. Odendahl, K. (2011). Legal Instruments of Transborder Cooperation in Europe. In B. Wassenberg, & J. Beck, Living and Researching Cross-Border Cooperation (Volume 3): The European Dimension (pp. 89-103). Stuttgart: Franz Steiner Verlag.
21. Pavlakovich-Kochi, V., & Stiperski, Z. (2006). The Croatian-Slovanian Border: Thee Local Experience. In V. Pavlovich-Kochi, B. J. Morehouse, & D. Eastl-Walter, Challenged Borderlands: Transcending Political and Cultural Boundaries (pp. 238-250). London: Ashgate Publishing Limited.
22. Slusarciuc, M. (2013). Partnership and Cooperation Models in Cross-Border Areas. Acta Universitatis Danubius. Œconomica, 9(4), 267-280.
23. Swiatek, D. C. (2013). European regional policy and governance of cross-border regions. The case of Centrope. Saarbrucken: Lambert Academic Publishing.
24. Yoder, J. A. (2003). Bridging the European Union and Eastern Europe: Cross-border Cooperation and the Euroregions. Regional & Federal Studies, 13(3), 90-106.

The USV Annals
of Economics and
Public Administration
Volume 15,
Issue 1(21),
2015
152
THE EUROPEAN UNION “CHASING” A PLURILATERAL MARKET
ACCESS BY NEGOTIATING THE TISA
Ph.D.StudentLudmilaBORTA
"AlexandruIoanCuza"UniversityofIași,RomaniaDoctoralSchoolofEconomicsandBusinessAdministration/DepartmentofEconomicsandInternationalAffairs
Abstract: The international trade is an important and significant area of the world economy which can ensure the
growth and more jobs for countries in a current global world. At the present time, it is represented more by exports and imports of goods than by trade in services. Despite this, the aim of this paper is to show the current interest of the countries and regions of the world, especially of the EU and the USA, to continue the GATS agreement of World Trade Organisation by negotiating a plurilateral agreement in services. Thus, 23 countries of the world have started in 2013 to negotiate aspects of the TiSA (Trade in Services Agreement). This new agreement is based on the General Agreement on Trade in Services ("GATS").
To understand the importance of this plurilateral agreement in services, we analysed the share of world GDP and international trade in services, our research being entire focused on the global place of the European Union for year of 2012. Because the services sector constitute the most dynamic economic activity in the EU, we analysed the trade relations of this region with rest of the countries which are part of TiSA negotiations. In final, we found that these are substantial partners of the EU commercial service exports and imports.
Key words: the TiSA, trade integration in services, the GDP, market access, transparency. JEL classification: F10, F13.
1. INTRODUCTION Currently, 23 countries (members of the World Trade Organisation), including the European
Union, started the negotiations of an agreement based on international trade in services. Because these countries accounted more than 60% of world trade in services, the TiSA become a subject in focus worldwide. It aims at opening up markets and improving rules in areas such as licensing, financial services, telecoms, e-commerce, maritime transport, and professionals moving abroad temporarily to provide services.
The purpose of the present paper is to highlight the importance of the services sector in the international trade. Also, services are a central part of the EU economy. For the moment, the EU suggests to replace GATS provisions into the plurilateral agreement to create a solid basis for the negotiation of additional services liberalisation. TiSA is based on the WTO's General Agreement on Trade in Services (GATS), which involves all WTO members.
In the long run, the results of the plurilateral services negotiations could be transitioned to multilateralization. By all participating countries, the TiSA is seen more as a tool and an initiative that could reinforce the multilateral system. Thus, this agreement could be turned into a broader WTO agreement and its benefits can be extended beyond the current participants.
In the next two sections of this paper we present the image of the international trade in services for year of 2012, focusing on the European Union. The aim of the below market analysis is to find answers at the following questions: What is the place of the European Union in the international trade? And, are the rest of parties of the TiSA negotiations important trade partners for the EU?
Thus, in order to respond on the above questions, in the second (next) section we chose to analyse the share of world GDP and the international trade of the world’s countries. It knows already that goods are an important aspect in the global economy. But, the ongoing negotiations of the TiSA show the fact that the services sector are an important and an essential subject of current bilateral and multilateral negotiations in the world.

The USV Annals of Economics and Public Administration Volume 15, Issue 1(21), 2015
153
The purpose of the third section of this paper is to point out that the aim of the TiSA is to facilitating trade in services between world’s countries and regions. Opening up markets for services will mean more growth and jobs for the countries of the EU. Here, our research is focused on trade relations in commercial services of the EU with the rest of the countries which are parties of the TiSA negotiations.
2. THE PLACE OF THE EUROPEAN UNION IN THE INTERNATIONAL TRADE
IN SERVICES
The main scope of the multilateral/bilateral trade negotiations that takes place between the Parties worldwide is to ensure market access for goods and services, to make trade faster and cheaper, to increase investment opportunities; and all of these to guarantee growth and more jobs for each Parties. Thus, services are an increasingly important aspect in the global economy and a central part of the EU economy. The aim of the TiSA is to facilitating trade in services between world’s countries and regions. The EU is the world's largest exporter of services with tens of millions of jobs throughout Europe in the services sector. Opening up markets for services will mean more growth and jobs for the countries of the EU.
In order to understand better the current interests of the EU in international services trade, we took into consideration the statistical books of Eurostat Database. In these books are published a statistical image of the European Union (EU) in relation to the countries and regions of the world.
In the below figure (Figure no. 1), we can see that the EU accounted for a 23% share of the world’s GDP in 2012 (the world GDP was valued at € 56577 billion in 2012), while the United States share was 22%. The Chinese share from 4.3% in 2002 to 12% in 2012, a higher value than Japan with 8%. In current price terms GDP of China was € 4970 billion, an increase from 2002 equivalent to the combined GDP in 2012 of the Mexico, South Korea, Indonesia, Turkey, Saudi Arabia, South Korea, Argentina and South Africa. Thus, the overall GDP of the EU, the USA, China, and Japan covered more than 50% share of the world’s GDP in 2012.
Figure no. 1. Share of world GDP, in 2012
Source: Own processing after the Eurostat Database According to the Eurostat, the world share of the GDP accounted for the EU was higher than that accounted for China. Despite this, China still has a relative importance within the global economy, accounting for more than two thirds of the EU’s GDP. With regards to sectors that was the subject of exports and imports in 2012, we found that agriculture, forestry and fishing contributed 10% or more of GDP in countries as India, Indonesia and China, whereas its contribution was 2% or less in the United States, Japan, Canada, the EU and

The USV Annals of Economics and Public Administration Volume 15, Issue 1(21), 2015
154
Australia. Industry (including mining and quarrying; manufacturing; electricity, gas and water supply) contributed more than half of Saudi Arabia’s GDP (58%) and more than one third of total GDP in China, Indonesia and South Korea, while in Canada, the EU, India and the United States its contribution was less than one fifth of the total.
The services sector as hotels and restaurants, transport, information and communication services varied least across the world countries from Turkey to China. In the United States, Canada and the euro area (EA-18), services as financial and business services, and services often associated with public sector provision contributed more than half of total GDP, while the EU and Australia recorded contributions from other services just below this level. By contrast, other services contributed a share between one quarter and a little over one third of GDP in Mexico, Turkey, India, Russia and China and even less in Saudi Arabia and Indonesia.
With regard to international trade, the United States reported the second lowest ratio of it of goods and services to GDP (16 %) in 2012 among the G20 members. While trade in goods dominates international trade, trade in services has grown strongly. Trade in services was equivalent to 5.05 % of GDP in Canada, 7.15 % of GDP in India, in the EU at 4.5 % of GDP, and in the USA at 3.3 % of the GDP.
Figure no. 2. Trade integration: Share of services relative to goods, reported to GDP, in 2012 Source: Own processing after the Eurostat Database
For a number of 16 countries (Figure no. 2) we analysed the average value of imports and
exports in goods and services relative to their GDP for 2012. We found that the trade in services was less than 50% of trade in goods relative to GDP for all analysed countries. The higher level was represented by India (34.21%), the EU (33.71%), the United States (27.62%), and Brazil (25.59%). The lowest level was represented by Mexico (6.15%), China (12.34%), Indonesia (15.08%), South Africa (15.45%), and Saudi Arabia (15.56%).
Relative to GDP, Saudi Arabia recorded by far the largest international trade surplus in goods and services (combined) of 23.9% in 2012; Russia with a surplus of 7.3% of GDP, and South Korea with a surplus of 2.7% of GDP. At the other end of the scale, South Africa’s large goods deficit and smaller services deficit combined for a total deficit equivalent to 10.3% of GDP, larger in relative terms than that for India (-9.7%) and Turkey (-7.9%).
The EU recorded a trade surplus of € 147 billion in 2012, with a trade deficit for goods and a trade surplus recorded for services. The United States recorded the second highest trade surplus for services, valued at € 128 billion. A relatively high share of the EU’s trade in services was with the United States which is an important trade partner fort the European Union.

The USV Annals of Economics and Public Administration Volume 15, Issue 1(21), 2015
155
Figure no. 3. Selected G20 trading partners for EU exports and imports of services, in 2012 (% share of extra-EU exports)
Source: Own processing after the Eurostat Database To conclude this section of the present paper, we chose to show the trade relationship of the
EU with the world as a trade partner. From the above analysis (Figure no. 3) of the EU’s trading partners, we can see the importance of the United States (with 29%) as a trading partner for the EU in services, in 2012. According to Eurostat, this is notably higher than it was for goods, whereas the reverse was specific for China and Russia. Also, Switzerland was an important partner for trade in services (around 12%) with a larger share than that recorded for Russia, China and Japan combined (10%).
3. TISA: A NEW LEVEL OF INTERNATIONAL TRADE IN SERVICES In the above research on international trade in services and goods, we saw that the services
represent less than 50% of goods relative to GDP in 2012 though, the services sector are an important and an essential subject of current bilateral and multilateral negotiations in the world.
At the present time, TiSA is an agreement negotiated plurilateral and in which talks taking part 23 members of the World Trade Organisation, namely: Australia, Canada, Chile, Chinese Taipei, Colombia, Costa Rica, the EU, Hong Kong China, Iceland, Israel, Japan, Korea, Liechtenstein, Mexico, New Zealand, Norway, Pakistan, Panama, Paraguay, Peru, Switzerland, Turkey and the United States. It remains open to all of the rest of WTO members who want to open up trade in services. It is not a replacement of multilateral negotiations on services, because TiSA is seen as a part (or a way) to start as soon as possible the stalled multilateral negotiations of the WTO (the Doha Development Round). Thus, this agreement will be based on the General Agreement on Trade in Services (GATS).
According to European Commission, since the talks were launched in March 2013, the European Union makes efforts to ensure that the TiSA is compatible with the GATS, making it easier to integrate it into the WTO. These new and improved commitments are very important for the EU, because the services sector constitute the most dynamic economic activity in this region. EU companies are leading providers of services in many sectors and are the biggest exporters of services worldwide, with almost 26% of world total export of services and half of all foreign investment flowing from the EU to other parts of the world. Legal security and new market access opportunities are therefore crucial for European companies.
The other 22 countries that are participating in the negotiations on the Trade in Services Agreement represent a substantial partners of exports and imports of commercial services of the

The USV Annals of Economics and Public Administration Volume 15, Issue 1(21), 2015
156
EU: 58% of EU’s exports and 59% of EU’s imports. The main values are represented by the trade with countries as the USA, Switzerland, Japan, Norway, Australia and Canada. These alone represent almost 50% of both EU exports and EU imports. With these countries the EU has already signed or is negotiating ambitious bilateral agreements that include both goods and services liberalisation, as following:
- EU-US: Transatlantic Trade an Investment Partnership (TTIP) (when negotiations are completed, this agreement would be the biggest bilateral trade deal ever negotiated);
- EU-Switzerland: a series of bilateral agreements concluded (where Switzerland has agreed to take on certain aspects of EU legislation in exchange for accessing the EU's single market);
- EU-Japan: Free Trade Agreement (ongoing negotiations); - EU-Norway: European Economic Area (EEA) Agreement; - EU-Australia: Trade and economic relations under the EU-Australia Partnership
Framework - EU-Canada: Comprehensive Economic and Trade Agreement (CETA). Only with four countries of other 22 members of TiSA the European Union has bilateral
agreements including a services chapter in force. These countries are the following: Norway, Iceland, Mexico, and South Korea.
Figure no. 4. The level of GDP and the EU’s Trade in commercial services under TiSA, in 2012
Source: Own processing after the European Commission Database For Parties of TiSA (excluding the EU) we analysed the level of GDP, and also the EU trade
relations in commercial services with these countries. The research is placed in year of 2012, as reference. Only for 15 of 22 countries the statistical data was complete and available on European Commission Database (Figure no. 4).
As it can be seen in the above figure, the highest level of the GDP was accounted by four countries of 15, as: the USA by € 12643.7 billion, Japan by € 4621.5 billion, Canada by € 1417.7 billion, and Australia by € 1192.7 billion. These was followed by South Korea (€ 951.7 billion), and Mexico (€ 923.5 billion). The lowest levels was accounted by New Zealand by €133.5 billion, and Iceland by € 10.6 billion.
With regard to EU Trade in commercial services with these countries, in the top of the list made its way Switzerland. Thus, the highest level was reached by the USA with € 155.95 billion, followed by Switzerland with € 70.75 billion (with a GDP of € 491.3 billion), and Japan with € 20.1 billion. The lowest levels was accounted by New Zealand (€ 1.9 billion) and Iceland (€ 0.6 billion).

The USV Annals of Economics and Public Administration Volume 15, Issue 1(21), 2015
157
Figure no. 5. The share of services relative to GDP, in 2012 Source: Own processing after the European Commission Database
But the most interesting was the fact that the share of the international trade in commercial
services with the EU was more representative for Switzerland by 14.4% of its GDP (Figure no. 5). The second in the top of the list was Iceland with 5.66%. For the rest of the countries of 15 accounted a percentage is less than 5% of services relative to their GDP, in trade with the EU. Even the United States accounted only 1.23%. We can concluded that the exports and imports in services with the EU is more important for countries (which are Parties at TiSA negotiations) as Switzerland, Iceland, Hong Kong China (4.79%), Norway (4.56%). But for countries as Japan (0.43%), Mexico (0.56%), Korea (0.75%), Canada (0.95%), and Australia (1.14%) the international trade with the EU is not based on services sector.
Today, we can see an increasing importance on trade in services worldwide. A considerable number of companies are seeing more benefits by practicing this type of trade. The EU has contributed significantly to the TiSA negotiations which are based on texts tabled by the participating countries. In the EU's case, texts submitted by the EU are first agreed with the governments of the EU's Member States, the transparency being important to the European Commission.
The EU's ideas on how the agreement should be structured are set out in a concept paper, intituled “A modular approach to the architecture of a plurilateral agreement on services”, published online by the European Commission and distributed in September 2012. It also includes the EU's ideas on how to eventually make it a part of the World Trade Organization's general rules.
We present below a few general aspects of the paper proposed by the European Union. According to this, the participants to the TiSA would take part in a greater liberalisation of trade in services while eventually reinforcing the multilateral trading system:
- The EU suggests to replace GATS provisions into the plurilateral agreement. The aim of this is to create a solid basis for the negotiation of additional services liberalisation, while ensuring that commitments undertaken will be fully compatible with existing GATS commitments and could eventually be brought to the WTO.
- The Parties to the TiSA could develop additional rules and disciplines that could cover domestic regulation, ICT services, e-commerce or other topics chosen by the participants.
If the existing GATS architecture is respected, then can be ensured a smooth transition to a multilateralization of the results of the plurilateral services negotiations. Ultimately, the plurilateral

The USV Annals of Economics and Public Administration Volume 15, Issue 1(21), 2015
158
agreement on services could disappear and as a consequence, the multilateral system would be reinforced by this initiative.
4. CONCLUSIONS The main scope of the TiSA is to ensure market access for goods and services, to make trade
faster and cheaper, to increase investment opportunities; and all of these to guarantee growth and more jobs for each Parties. It is just a way in order to complete and to conclude the “blocked” negotiations of Doha Development Agenda of World Trade Organisation.
In the following we will offer answers on the questions from the introduction section of this paper. The responses are based on the above research which subject is international trade in services of the European Union.
To answer at the first question – namely, what is the place of the European Union in the international trade? – we analysed the world GDP and the exports and imports of the countries of the world. We found that the overall GDP of the EU, the USA, China, and Japan covered more than 50% share of the world’s GDP in 2012. The EU recorded a trade surplus, with trade deficit for goods and a trade surplus recorded for services. Among the important trading partners in services of the EU was the USA and Switzerland.
To answer at the second question – namely, are the rest of parties of the TiSA negotiations important trade partners for the EU? – we analysed the EU Trade in commercial services with 22 countries that are participating in the negotiations on the Trade in Services Agreement. We found that these was represented in 2012 the substantial partners of exports and imports of commercial services of the EU, more than 50%. The main values was represented by the trade with countries as the USA, Switzerland, Japan, Norway, Australia and Canada.
BIBLIOGRAPHY 1. *** A modular approach to the architecture of a plurilateral agreement on services,
European Commission, this document was distributed in September 2012, accessed on February 2015 at http://trade.ec.europa.eu/doclib/docs/2014/july/tradoc_152686.pdf
2. *** EU chairs next round of plurilateral talks on services, European Commission, Brussels, 19 September 2014, accessed on February 2015 at http://trade.ec.europa.eu/doclib/press/index.cfm?id=115
3. *** Trade in Services Agreement (TiSA), European Commission, accessed on February 2015 at http://ec.europa.eu/trade/policy/in-focus/tisa/
4. *** The Trade in Services Agreement ('TiSA'), European Commission, accessed on February 2015 at http://trade.ec.europa.eu/doclib/docs/2013/june/tradoc_151374.pdf
5. *** The EU in the world 2014 - A statistical portrait, Eurostat Statistical Books, accessed on February 2015 at http://ec.europa.eu/eurostat/documents/3217494/5786625/KS-EX-14-001-EN.PDF/8642be84-659a-4a3d-a451-1ef26101c78f?version=1.0

The USV Annals
of Economics and
Public Administration
Volume 15,
Issue 1(21),
2015
159
SECTION 2
MANAGEMENT AND BUSINESS
ADMINISTRATION

The USV Annals
of Economics and
Public Administration
Volume 15,
Issue 1(21),
2015
160
CLOUD-BASED VS DESKTOP-BASED PROPERTY MANAGEMENT
SYSTEMS IN HOTEL
Prof.Dr.MustafaGULMEZ
TourismFaculty,AkdenizUniversity,Antalya,[email protected]
PhDCandidateEdinaAJANOVIC
InstituteofSocialSciences,AkdenizUniversity,Antalya,[email protected]
Ins.IsmailKARAYUN
AyseSakSchoolofAppliedSciences,AkdenizUniversity,Antalya,[email protected]
Abstract: Even though keeping up with the modern developments in IT sector is crucial for the success and
competitiveness of a hotel, it is usually very hard for new technologies to be accepted and implemented. This is the case with the cloud technology for which the opinions between hoteliers are divided on those who think that it is just another fashion trend, unnecessary to be taken into consideration and those that believe that it helps in performing daily operations more easily, leaving space for more interaction with guests both in virtual and real world. Usage of cloud technology in hotels is still in its beginning phase and hoteliers still have to learn more about its advantages and adequate usage for the benefit of overall hotel operating. On the example of hotel property management system (PMS) and comparison between features of its older desktop-version and new web-based programs, this research aims at finding out at which stage and how effective is usage of cloud technology in hotels. For this, qualitative research with semi-structured interviews with hotel mangers that use one of these programs was conducted. Reasons for usage and advantages of each version are discussed.
Key words: Cloud benefits, Cloud technology, Cloud-based PMS, Desktop-based PM, Hotel PMS JEL classification: L83, M1, M150
1. INTRODUCTION Constant innovation in hardware, software, and network developments and applications
means that only dynamic organizations that can respond efficiently and effectively to these innovations, will be able to outperform their competitors and maintain their long-term prosperity. The more powerful and complex the Information technologies become, they will become more affordable and, user-friendly, enabling more people and organizations to take advantage of them.
Information communication technologies should be used for both operational and strategic management. ICT developments have direct impacts on the competitiveness of enterprises, they determine the two fundamental roots to competitive advantage, i.e. differentiation and cost advantage (Porter, 2001). It is crucial for tourism and hospitality practitioners to proactively incorporate new technologies into their businesses as these will improve service quality and differentiate their products and services.
In order to be able to follow the increasing guests' requests for qualitative services, it is mandatory for hotel management to constantly work on improving its functions and operations. For this it is necessary to keep track of innovations in sectors outside the hospitality, like IT sector that works on creating, developing and introducing new technologies. Humanity is becoming more dependable on Internet, mobile devices (smart phones and tablets) and our everyday and business activities are rapidly moving into virtual (Internet) environment. This is resulting in constant and fast changes in not only human habits but in the way how the business functions will be performed.

The USV Annals of Economics and Public Administration Volume 15, Issue 1(21), 2015
161
One of the developments in IT sector that have impact on our everyday Internet habits and behaviour is cloud technology. Idea of having your information of interest stored in a virtual environment -''cloud'' - is the starting point for many projects that are taking or will take place in IT sector. Hospitality is one of targeted sector that is considered appropriate for application of cloud technologies and services. Hotel Management System or widely known as Property Management System (PMS) is one of the system where IT practitioners saw the chance for improvement by ''moving it to the cloud''.
The topic of the cloud based PMS was already introduced and discussed in various international magazines in hospitality sectors such as- Hotel Management, Hotel Business, Lodging Hospitality, PhoCusWright Innovation, Hospitality Upgrade - as well as international exhibitions and fairs like HITEC 2013, HITEC 2012, WTM 2012 etc. Hotels will be forced to upgrade their current systems so that they can respond to various and changeable guests' habits and requirements. However, until today, there was not enough academic papers related to usage of cloud technology in hospitality industry even though this sector is under continuous changes caused by usage of new technologies which made search, evaluation and payment of the hotel rooms easier than ever.
In this paper, the short review on basic literature and benefits of cloud computing is presented. In continuation importance of PMS for hotels and method used in the research will be described. After comparing the two groups of hotels, from which one was using desktop PMS and other group cloud- based PMS, the results of the research were derived and presented. In conclusion of the paper, challenges with which the hotels are facing and which affect their decision of starting to use cloud- based technology as well as recommendation for future work will be discussed.
2. CLOUD TECHNOLOGY
In the work of Heart and Pliskin (2002), case study on the company, that enables small and medium sized tourism enterprises to have an internet presented by providing application service providers (ASP) for a fixed monthly fee, was conducted. In this research on usage of modern technology for that period, the authors shared the belief of Oracle company that "...in 10 years all business applications will be delivered via the Web as a software service, rather than shipped as a product that customers must implement, manage, and maintain.'' (Heart and Pliskin, 2002) Since 2002, when this paper was published, business applications were constantly developing and the rise of cloud computing proved that Oracle's forecast was correct. As stated by the Sharif (2010), cloud computing is the latest technology that is being introduced by the IT industry as the next (potential) revolution to change how the internet and information systems operate. The term “cloud” was probably inspired by IT text books’ illustrations which depicted remote environments (the Internet) as cloud images in order to conceal the complexity that lies behind them (Sultan,2010).
BASICS OF CLOUD TECHNOLOGY
Similar to traditional utilities such as water, electricity or gas, cloud computing is also being transformed to a model where users access services based on their requirements regardless of where the services are hosted or how they are delivered (Buyya et al., 2009). The goal of a new computing world is to develop software for millions to consume by easily accessing it over a network. Cloud service providers are making profit by charging consumers for accessing these services. In this way both individual and enterprise consumers are attracted by the opportunity to reduce and sometimes even eliminate costs of new software installation. Cloud computing services can provide seamless, convenient and quality-stable technology support for the user (Buyya et al., 2009 and Pyke, 2009).The services offered by cloud computing can be listed in three types (Miller and Veiga, 2009 and Sultan, 2010):
Infrastructure as a Service (IaaS): Products offered via this mode include the remote delivery (through the Internet) of a full computer infrastructure (e.g., virtual computers, servers, storage devices, etc.); the building blocks of an IT enterprise. Those who buy and use IaaS are

The USV Annals of Economics and Public Administration Volume 15, Issue 1(21), 2015
162
predominantly the IT/system administrator types charged with obtaining general processing, storage, database management, and other core IT resources and applications. Services provided in this category include CPU processing on demand, virtual Web hosting, and storage on demand. The most notable vendors are Amazon’s EC2, GoGrid’s Cloud Servers, and Joyent.
Platform as a Service (PaaS): With cloud computing, services and applications that were managed locally in the past requiring hardware, operating systems, web servers, as well as teams of network, database and system management experts are now provided remotely by cloud providers under this layer. PaaS is an emerging category of cloud services where developers can design, build, and test applications that run on the cloud provider’s infrastructure and then deliver those applications to end users from the provider’s servers. The early market leaders in this area include Google’s App Engine, Microsoft’s Azure, Amazon Web services, and Force.com (by Salesforce.com).
Software as a Service (Saas): Under this layer, applications are delivered through the medium of the Internet as a service. Instead of installing and maintaining software, access is provided via the Internet. This type of cloud service offers a complete application functionality that ranges from productivity (e.g., office-type) applications to programs such as those for Customer Relationship Management (CRM) or enterprise-resource management. Yahoo mail, Google Apps, Salesforce.com, WebEx, and Microsoft Office Live are all cloud service “products.”
Cloud computing services can be adopted by firms in three different forms (Goscinski and Brock, 2010):
Public clouds - online applications that are open to everyone for free, such as Google Docs (Stross, 2008),
Private clouds - involves firms deploying key enabling technologies, such as virtualization and multi-tenant applications, to create their own private cloud database (Low et al., 2011) which is less threatening and easy to handle (Tuncay, 2010) and
Hybrid clouds - mix of the previous two types that are emerging with the intention of providing clients with a level of “control” over their resources (Sultan, 2011)
BENEFITS OF THE CLOUD SERVICES Positive sides of implementing cloud technology and usage of cloud services can be
classified and presented (Figure 1) as follows (ISACA, 2009): • Cost containment – The cloud offers enterprises the option of scalability without the financial commitments required for infrastructure purchase and maintenance. • Immediacy – Many early adopters of cloud computing have cited the ability to provision and utilize a service in a single day. • Availability – Cloud providers have the infrastructure and bandwidth to accommodate business requirements for high speed access, storage and applications. • Scalability – With unconstrained capacity, cloud services offer increased flexibility and scalability for evolving IT needs. • Efficiency – Reallocating information management operational activities to the cloud offers businesses a unique opportunity to focus efforts on innovation and research and development. This allows for business and product growth and may be even more beneficial than the financial advantages offered by the cloud. • Resiliency – Cloud providers have mirrored solutions that can be utilized in a disaster scenario as well as for load-balancing traffic.

The USV Annals of Economics and Public Administration Volume 15, Issue 1(21), 2015
163
Figure 1. Benefits of the cloud technology
Source: Cloud Computing: Business Benefits With Security, Governance and Assurance Perspectives 2009,
ISACA
Figure 2. Circle of commodities cloud as a result of services As cloud technology gains more popularity cloud services become commodities from which
users can progressively benefit due to their involvement in circle of commodities (Miller and Veiga, 2009). This circle is presented in the Figure 2. Starting point in this circle is technology advancements that lower infrastructure costs and increase operational efficiency. Operational efficiency as a result, leads to the lower costs which enable providers to apply economies of scale. As natural consequence, economies of scale encourage and increase the customer demand. Strong
Technology Advance
Improved Operational Efficiencies
Investments
in New Technology
Improved Economies Scale for Providers
Competitor
Lower Prices
Increased Customer Demand
Decreased
costs
Cloud services

The USV Annals of Economics and Public Administration Volume 15, Issue 1(21), 2015
164
demand attracts competition which lowers the prices and spurs investments in new technology. These investments and efforts for a new technology to be presented open a new progress circle of technology advancements and it continues in the same way.
3. PROPERTY MANAGEMENT SYSTEM (PMS) IN HOTELS
Research papers related with E-tourism always emphasize that tourism and hotel
organizations should pay special attention to ITs and their usage for business operations. Although, it seems as a very reasonable implication, practical integration of IT industry's way of thinking and working principles with those implemented in a hotel is not an easy work. When creating software or an application for a hotel, IT personnel have to possess a certain level of flexibility, openness and creativity. On the other hand, hotel employees are expected to have more insightful and open-minded approach towards new ways of performing business operations, sometimes take risks and have experiences with using different programs and applications.
Success for some hospitality companies has been achieved, in large part, by taking advantage of information technology (Siguaw and Enz, 1999). A hotel's PMS can gather and keep valuable information about hotel guests by incorporating business intelligence tools which help hoteliers organize and make sense of the gathered data. Regardless of whether room reservations come from Online Travel Agency, Global Distribution Systems or by telephone, all of them are gathered, stored and managed in the PMS. Many PMS offer extensive reporting on the collected data. Business intelligence options provide hoteliers with a three-dimensional view of guest data. PMS helps hotels with keeping a more comprehensive record of its reservations, guest's information and enables more coordination between different departments in the hotel as the record of important functions in hotel is also kept in this system.
In the past, company needed at least three requirements in order to install one hotel management system: software, server and data base system. With cloud based PMS there is no need for upgrades for both software and hardware because Cloud Servers are always updated to latest technology. Cloud Servers work at a very low cost; in fact no investment cost but, usually, reasonable monthly subscription fee is charged. Simplicity of the cloud based property management system allows it to be productive. Cloud based PMS's can operate on any advice that has a web browser and the companies are putting their efforts to make it even more friendly on smaller devices like tablets and smart phones. That is why customizing program to fit into mobile application is and will continue to be of great importance. It is recommendable for a company that intends to develop a cloud based PMS to open their system for clients inputs. These customer's inputs can help enhance the program and at the same time enable company to meet and exceed expectations.
PMS helps hotels with keeping a more comprehensive record of their reservations; guest information by keeping the record of important functions in hotel enables more coordination between different departments. Business intelligence options provide hoteliers with a three-dimensional view of guest data, which allows easily statistical reporting and increased hotel management efficiency.
4. RESEARCH OVERVIEW AND METHOD The aim of this study was to investigate the difference in practical usage of the two types of
PMS systems – cloud based and classical (desktop) ones. In order to obtain participants’ views and experiences of using one of these two PMS solutions as well as extracting key benefits and features of each system, a qualitative research with semi-structured interview was conducted. The questions were concentrated on examining the strong points of one particular system, reasons for using it, financial costs, support conditions and knowledge about the other systems and technologies in IT sector.
With the help of the software company offering both desktop and cloud based solutions to hotels in Turkey, authors managed to contact with general managers, IT supervisors, front office and

The USV Annals of Economics and Public Administration Volume 15, Issue 1(21), 2015
165
marketing managers of hotels that differed in size and location. Hotels were divided in two groups: Group A with hotels that use classical desktop PMS and Group B that use cloud version PMS. Group A, which hotels traditionally use classical desktop PMSs, was consisting of 5 hotels that were 5-star and 4-star categorized, resort type hotels with average room number of 300. In Group B there were 5 boutique and city hotels with category ranging from 3-star to 5-star and a room count that was not exceeding 50 rooms.
5. RESULTS On the question about the reasons for using the current PMS type in hotels, answers of Group
A were based on usage of their current PMS for years and on the fact that employees in all hotel departments were used to work on it. As time passed by, hotels upgraded their system to new versions for several times and additional customization was implemented with regard to hotel preferences. In one of the interviews it was mentioned, that “after technical trainings common when upgrading to the last version of the program, front office manager concluded it with 40 different extra features, processes or buttons that should be added to the new version provided by the developer of PMS”. After new version of PMS was tried for 30 days, 30 changes from the list were implemented and the rest were to be done in the future. This is time consuming for both parties as provider’s employees need extra time to work on additional features and hotel, has to wait a certain period for program to be customized according to its requirements.
Hotels from Group B were consisted of relatively new boutique hotels that operate for more than a year and from those that were not using any kind of PMS solution (they were using Excel tables and creating reservation records manually). The reason why hotels from this group wanted to use cloud PMS was a desire to try the latest technology used in hospitality industry. After the initial test period when some of their additional requirements were compensated, they started to use cloud based PMS. Other reasons for using it were: PMS could be reached from any place where Internet connection is available, simple but effective design with lots of visual solutions, more options to enter the important information and the fact that it is working not only on any PC but also on any mobile device due to its mobile applications.
When it comes to financial aspects, low investment costs were main reason for hotels from Group B to decide in favor of cloud based version. Initial investment in classical PMS starts from 10.000$ and goes up to 100.000$ depending on the system used and its provider. The similar amount of initial investments were confirmed by the Group A. Being considered as great amount of money for newly opened and small sized hotels to invest, management decided to try out the cloud version which allows access to this system based on monthly subscription with very little or no investment cost, depending on the solution provider. This ''pay as you use'' system, similar to those payments made for monthly usage of Internet, was more than affordable and acceptable for newly opened hotels.
For users of classical PMS system, license contracts are made on one-year basis and regulate maintenance and support issues. After initial investments in the system implementation, hardware, software and training of employees, every year hotel makes a one-year-based contract for additional support services and, if needed, extra training. Support is provided any time a hotel reports an issue or malfunction by directly connecting to hotel's computer through remote programs. Fixing a problem sometimes may take a couple of days. With cloud based versions there is no need for connecting with user's computer. By simply logging in to the system, any changes made from the support service will be automatically updated to all users of cloud PMS of this provider. With classical PMS there is no general application of changes to all users. Changes are made either for each hotel at a time, or after releasing new version, when provider try to convince all the current users to upgrade to it. Upgrade is provided by the extra charge, so these costs should be also considered during planning investments in classical PMS.
Regardless of which type of system they used, all participants were very careful about and interested in the matter of data security. For Group A, the fact that server is in the hotel, in place

The USV Annals of Economics and Public Administration Volume 15, Issue 1(21), 2015
166
where it can be controlled and with a certain number of people having access to it, provides a feeling of security for hotel managers. However, it is totally different situation with cloud based system, which is mainly open system where all authorized users and providers from outside have access to. Of course, it is up to hotel management to whom the authorization rights will be given and being an open system it makes support, development and innovation activities much easier. Cloud based PMS are hosted on some of the world's best known servers so there is no need for additional computers to be used as servers.
According to the data obtained from examining these two groups of PMS users, important differences and perceptions in function of classical desktop-based PMS and cloud-based PMS are presented in Table 1 (table no 1).
Table 1. Important differences in functions between classical and cloud based property
management systems
Functions Classic PMS Cloud based PMS
Support
Problem notified to the provider of PMS is solved by distance connecting to the hotel's computer or within one or two days
No need for connection with hotel's server, all the support is given online instantly
Program Changes
Customization of the program according to needs and requirements of each individual hotel
General solution offered to all properties, requires constant working in improving its features to fit all clients
Type of System
In many cases close system that does not allow manipulation from outside
System opened for all authorized users and providers from outside
Server Location
One server computer located inside the property. Without it or if it does not work program cannot work either
No need for special server computer, server is hosted outside
Financial Cost
First investment depending of the hotel 10.000 -100.000$ plus yearly support fee (1.000$) plus upgrading to new version
No first investment costs. Monthly subscription of about 1€ per room
Although there are some great differences in functions and way of managing regarding
classical and cloud based system, both have their advantages from which hotels do not want to give up. They are listed in Table 1 as summary of results obtained by this research.
Table 2. Main advantages of the cloud based versus classical property management
system Cloud Based PMS Desktop PMS
Advantages
Can develop personalized service awareness
Customization according to hotel preferences
Its features can be developed or improved easily
High security control
Online reservations received are directly connected to the PMS
Employees are used to working on it
More open to the end users (Enhanced CRM)
Constant speed of working
Easy follow up on online reservation Backup made from the hotel IT department itself

The USV Annals of Economics and Public Administration Volume 15, Issue 1(21), 2015
167
One of the biggest advantages of cloud based PMS for the Group B is the fact that this
system can be directly integrated with hotel online booking engine. This is considered as a great advantage for the hotels that besides having functional web site, wish to maximize use of its online booking engine, receive more online reservations directly from the guests and gain more profit. Due to integration between PMS and booking engine, prices and room availability information are automatically updated to hotel's booking engine and there is no concern of overbooking. Such a functional connection between hotel’s PMS and online reservation system allow hotels to have a social media integration as well. This means that hotels are able to receive online reservation through their Facebook page as well as receive direct links to its page from the biggest review sites such as TripAdvior.com. As mentioned by the group B, not only did cloud PMS enhanced CRM due to direct contact with potential guests but it also pushed hotels to work more on digital marketing and use the advantages on integration in easily managing its own and other selling channels as well.
6. CONCLUSIONS & RECOMMENDATIONS In this paper two different approaches and perspectives on usage of cloud based and classical
hotel management systems were exposed. Hotels from Group B have shown a tendency for usage of new technologies and readiness to adopt and continuously learn about them. Of course, when matter is considered from the perspectives of each hotel, advantages and options of both systems are valid. Among factors, affecting why hotel prefers one system over another, are type and size of hotel, through which channels are guest reservations coming, previous experience with IT stuff and different programs, etc. At least in Turkey, cloud based solutions at this phase can be implemented in small or medium size hotels which are highly working on receiving more direct online reservations. Cloud based program can help them in order to update prices and room availability information to hotel's booking engine. This prevents overbooking, provides easily management of CRM functions and information, with no first investment costs or extra expenses which results in revenue increase.
However, there are many challenges which cloud technology has to face and they are consisted with the ones mentioned by Miller and Viega (2009) such as question of security, lack of measurement standards for cloud-provided services, interoperability of cloud services with legacy systems and resistance of hotel employees to learn and use cloud-based software. Hotels that use classical PMS pay a great attention to the security issue because they do not want to risk opening their hotel for external intervention. In recent years we can find in media lots of evidence of information linkage from system that had much higher security measures than an average hotel. Cyber security is a burning topic and a matter of potential worry for every company that is considering moving its business online, not only in case of hotels. This is one point that developer of the web based PMS should take into consideration.
Measuring the performance of cloud-provided services is another challenge for the hotel management, primarily due to the lack of measurement standards. Once these standards are defined and they definitely will be, as the number of users is increasing, it will be easier to measure the benefits of cloud services as well as evaluating its negative and positive aspects. Their definition will be also beneficial for academic world as more research and case studies could be performed which will result in new opinions in further development and implementation of cloud technology.
Users and providers face the additional challenge of migrating functions and data from legacy systems to the cloud, as well as the interoperability of cloud services with legacy systems. Because of the significantly higher number of employees and labor intensity, once the stuff is accustomed to one system changing it can cause more difficulties.
While investigating the previous knowledge about the other system solutions, hotels in Group A have claimed lack of information about the cloud technology and its solutions. There is still simplified picture and prejudice among the hotel managers about cloud being a virtual place where one just uploads all kinds of information and takes it whenever it is needed. When cloud computing

The USV Annals of Economics and Public Administration Volume 15, Issue 1(21), 2015
168
logic is explained in this way, hotel managers do not see the point in going into an ''uncertain'' and ''unknown'' virtual area in the clouds when one can continue using current program with server being inside own property and under control. Even though IT stuff in these hotels has some basic knowledge about it, it is still not enough to convince the other managers about its benefits. Therefore it may be concluded that, besides trying to overcome the above mentioned challenges, developers of cloud based solutions to hotels should also work hard on training the potential clients about the positive aspects and correct usage of cloud technologies.
Being a pioneer paper on topic of cloud technology in hospitality, sample size is one of the limitations of this work. Also, the fact that in Turkey there is not such a large number of hotels that are using cloud based PMS, it is not easy to find the adequate number of managers that are willing to share their ideas and experience on this topic. Lack of measurement standards for cloud-provided services in general as well as for hotels is another important limitation due to which qualitative research was conducted. Authors’ recommendation is that academicians should focus more on topics of cloud computing, cloud solutions for other business operations and on defining measurements standards for cloud services. BIBLIOGRAPHY 1. Buyya, R., Yeo, C.S, Venugopal S., Broberg J., & Brandic I. (2009). Cloud computing and emerging IT platforms: Vision, hype, and reality for delivering computing as the 5th utility. Future Generation Computer Systems 25, 599-616. 2. Goscinski, A. & Brock, M. (2010). Toward dynamic and attribute based publication, discovery and selection for cloud computing. Future Generation Computer Systems, 26, 947-70. 3. Heart, T. & Pliskin, N. (2002). Can Application Service Providers Enable Cost-Effective Information Technology for Travel & Tourism?'' Information and Communication Technologies in Tourism, Proceedings of the International Conference in Innsbruck, Austria 207-218. 4. ISACA (2009). Cloud Computing An Auditors Perspective. available from http://www.isaca.org [Accessed date: May 2014]. 5. Low, C., Chen,Y. & Wu, M. (2011). Understanding the determinants of cloud computing adoption, Industrial Management & Data Systems, 111 (7), 1006 – 1023. 6. Miller, H.G. & Veiga J. (2009). Cloud computing: Will Commodity services benefit users long term?, IT Professional, 11 (7), 57–59. 7. Porter, M. (2001). Strategy and the Internet. Harvard Business Review, 79(3), 63–78. 8. Pyke, J. (2009). Now is the time to take the cloud seriously [online], white paper, available from http:// http://www.cordys.com/cordyscms_sites/objects/ [Accessed date: May 2014]. 9. Siguaw, J. A. & Enz, C. A.(1999). Best Practices in Information Technology. Cornell Hotel and Restaurant Administration Quarterly, 40 (1999). 10. Sharif, A. M., (2010) It is written in the cloud: The hype and promise of Cloud Computing, Journal of Enterprise Information Management,23(2), 131-134. 11. Stross, R.E. (2008). Planet Google: How One Company is Transforming Our Lives. Atlantic Books. 12. Sultan, N. (2010). Cloud computing for education: a new dawn?. International Journal of Information Management, 30, 109-16. 13. Tuncay, E. (2010), Effective use of cloud computing in educational institutions. Proscenia Social and Behavioral Sciences, 2, 938-42.

The USV Annals
of Economics and
Public Administration
Volume 15,
Issue 1(21),
2015
169
INKING HUMAN RESOURCES STRATEGY WITH KNOWLEDGE
MANAGEMENT STRATEGY TO DRIVE MEASURABLE RESULTS
Otilia‐MariaBORDEIANU
StefancelMareUniversityofSuceava,[email protected]
SimonaBUTA
StefancelMareUniversityofSuceava,[email protected]
Abstract: Today the human resources are seen as a very valuable asset to achieve long-term performance. Today we
understand that every employee is required to learn throughout life, so to acquire new knowledge, to process such knowledge and possibly disseminate expertise with other members of the organization. The theory on human resources in various organizations has changed over time; recommendations have become more numerous, but there is no consensus on the subject. In other words, the permanent change which defines the competitive environment of business remains a type of constant when analysing the efficiency of human resources within companies; inter-individual relations (formal and informal) and the values to which each employee relates remains crucial for any theoretical construction in this area. Principles and strategies applied by organizations yesterday could prove their inefficiency today; human resource strategies in organizations today should include a separate subcomponent, we believe, i.e. knowledge management (KM) strategy. This is because the competitive advantage obtained or maintained by the company depends today, in large proportion, on the type, quality and value of knowledge possessed by the organization. Therefore, organizational strategy and thus the strategy of acquisition, developing and rewarding of human resources (HR) should take into account this reality from the global environment. Moreover, in the current knowledge-driven economy, organizations must know how to develop and implement knowledge-based strategies to drive measurable business results. The goal of this paper is to describe a potential relation between the overall company strategy, HR strategy and KM strategy.
Key words: human resources, human resources management, knowledge management, knowledge economy, strategy
JEL classification: M10, M12.
1. INTRODUCTION
In the current economy there is a new approach to human resource management, so as to be able to cope with many types of challenges.
The most relevant resources within the knowledge economies are: knowledge, intellectual capital and time (Tottderdill, 2002). Being the only source that has the ability to think and implement new ideas, people occupies the central position within organisations. People are considered the only true source of sustainable competitive advantage. Since knowledge belong to the employees, any activity of the employees will affect the knowledge management. HRM could lead the development of well-rounded KM strategies to add value. HRM face new challenges: to recruit and retain top talent, and to embrace a new skill set to add more value. The HR department has a very crucial and vital role to play in not just its formation but also in giving KM its shape. The new type of human resource management (HRM), evidenced in knowledge-based firms has several characteristics that differ from classic human resource management (Todoruț et al, 2011). First, the focus in addressing human resources is related to amplification and efficient treatment of knowledge. There is also a need of intensive differentiation of approaches, decisions, actions and behaviour of specialists in human resources management, to be able to effectively consider the heterogeneity of human resources involved in the organization, their characteristics, motivations and expectations. HR activities must be designed and implemented in a flexible way, constantly changing content and functions, in accordance with endogenous and exogenous evolutions of the

The USV Annals of Economics and Public Administration Volume 15, Issue 1(21), 2015
170
organization; finally, all human resource activities must be coordinated in accordance with performance objectives of the company, to ensure its sustainability.
Because knowledge management is a fundamental business enabler, it will help organisations to protect their intellectual capital, to focus on their most important assets: their human capital, to link people to people by setting up collaborative methods and re-orient their culture by developing an optimal knowledge sharing strategy.
2. HUMAN RESOURCES FROM THE STRATEGIC VISION OF TOP
MANAGEMENT
Analysing the human resources in organizational context, implicitly the strategic vision of the top management upon them, we identify two diametrically opposed situations, models based on different assumptions on the motivation of human resources (the McGregor optics - the theory of X and Y); we understand that the motivating factor on the employee was and remains one crucial in trying to explain the performance obtained. Most often, the management theory and the business administration theory discusses about a positive motivation regarding the employee (salary, bonuses, promotion, negotiation, shared objectives, etc.) and a negative motivation regarding the organization members (sanctions, removal of the group, layoffs, etc.). The motivation in the organizational context regarding the "n" employees that an entity dispose, depends to a certain extent on the management styles practiced by various executives, on the daily relationship between bosses and subordinates, on the type of leadership which is required by the senior management and depends on the values that give the content to the organizational culture. In other words, intuitively we notice certain connections between the theoretical developments concerning the motivation in management and theory of human capital and / or intellectual capital from the business organizations.
The first perspective concerning motivation, considers that organizations exist only as a sum of "n" individuals (seen as "parts") who work together in order to achieve certain objectives. This perspective is based on a worst-case scenario, enshrined by the traditional optics upon the individual against work, optics that was valid in the industrial enterprise from the beginning of the nineteenth century; basically, this traditional conception considers that (McGregor, 1967):
– the usual individual is evil by its nature and manifests "an inconvenience inherent to work and will avoid it whether he can"; it comes to the typical employee encountered in the classic enterprise, that behaves as a rational person, person belonging to a certain cultural matrix (McGregor, 1960, p. 32);
– due to this characteristic, most people / employees should be obliged, controlled, punished etc. in order to target their efforts toward the "achievement of the organizational objectives” (McGregor, 1960, p. 32);
The second perspective, aiming to motivate the employee, diametrically opposed, considers that human beings cannot exist without a certain social context such as the organization; this assumption starts from another extreme hypothesis, consecrated by "the idealistic optics” towards the individual in the labour process; basically, this view suggests that:
– the ordinary man "does not dislike working" and spending the physical or mental effort can become, under certain created circumstances, a pleasure or a source of satisfaction (McGregor, 1960, p. 47);
– applying the external control is not the only solution for directing the effort toward the organizational objectives, because the individual may self-control / self-drive in order to achieve "the objectives for which he has committed";
– commitment to company goals is a function of an associated reward, therefore, the employee expects a reward when obtaining the performance etc..

The USV Annals of Economics and Public Administration Volume 15, Issue 1(21), 2015
171
Table no. 1. Different perspectives on human resources in the organizational context
Autocratic Paternalist Supportive Collegially Motivational
The basic model Power Economic resources
Leadership Partnership Alignment
Orientation / managerial vision
Authority Money Support Team Coaching (Mentoring)
Orientation / vision on employees
Obedience Security and
benefits Performance
at work Responsible behaviour
Competence and accomplishment /
achievement The psychological consequences of the employees
Dependence on the chief
Dependence on the organization
Participation Self- discipline Fluency / flow
Fulfilling the needs of employees
Subsistence Security Respect Esteem /
consideration Self-realization
The guaranteed performance
Minimal Passive
cooperation Supporting
units Moderate
enthusiasm Dedication
Source: Processing after Newstrom, John W. & Davis, Keith (1993), Organizational Behavior: Human Behavior at Work. New York: McGraw-Hill, Timmers J. S., Mennes M. A. (1998), Fundamentals on Design of Satisfaction
Questionnaires, The European Foundation for Quality Management, Brussel
We will not emphasize the issues related to employee motivation in the organizational context as they are relatively well individualized in the management theory and the optics of the decision-makers from the performing companies has changed greatly over the past three decades. After the appearance of the paper "In search of excellence" (1982), the human resources, including their motivation, have somehow definitively entered in the attention of the "top" management from various companies. The arguments brought by theorists, various people who have held positions of CEO, opinion leaders, extremely tough global competition etc. have required important changes regarding the theoretical hypostasis of the human resource position is in the modern company (Toffler, 2006). Synthetic, in the table no. 1, we present some guidelines on human resources at the level of business organizations.
3. LINKING HR STRATEGY WITH KM STRATEGY
Today the resources are seen as a very valuable asset for achieving the long term performance (various models / guidelines discuss about cooperation, participation, respect, enthusiasm, self-realization, dedication, etc.); Today we understand that every employee is required to lifelong learn, therefore, to acquire new knowledge, such knowledge to process and eventually to disseminate his/her expertise to other members of the organization.
The theoretical/pragmatic optics on human resources in various organizations has changed a lot over time; the approaches and the theoretical recommendations have become more numerous, but there is no consensus on the subject. In other words, the permanent change which defines the competitive business environment remains a type of constant when analysing the efficiency of human resources within companies; inter-individual relations (formal and informal) as well as the values to which each employee reports, are, nonetheless essential assets for any theoretical construction in this area. As implied by Ducker, the principles or the strategies implemented yesterday by organizations, might prove their inefficiency today (Drucker, 2004); the human resources strategies in organizations today should include a separate subcomponent, we believe, that is KM strategy. This is because the competitive advantage obtained/maintained by the company depends today, overwhelmingly by the type, quality and the value of the knowledge that the organization possess.
Therefore, the organizational strategy and thus the acquisition strategy, development and reward human resources (HR) strategy should take into account this reality globally encountered. It is difficult to say as a theoretical description, what is the most appropriate relationship between the

The USV Annals of Economics and Public Administration Volume 15, Issue 1(21), 2015
172
overall company strategy, the HRM strategy and the KM strategy; the experience and the imagination of the decision maker from a particular company must find the right answer to the question raised. From the perspective of our research, in Figure 1 we suggest only the essential components from which one can start to build an effective strategy which can favour the acquisition of knowledge, satisfaction and self-realization of employees and the annual performance of the organization.
Figure no. 1. Directions of HRM in business field
Therefore currently the human resources management concerns in our optics, three basic
directions (Figure no. 1. and 2.): Human resources activities (A); values and organizational/corporate identity (B) and human development (C), directions that fundamentally aim to improve the organizational performance. Moreover, the overall strategy of the organization should harmonize certain interests that are apparently contradictory; in the fact, the objectives aimed by the organization and by the employees can be fully convergent if there is a coherent framework of manifestation. The overall strategy should take into account the type of organizational culture (the importance was also underlined by (Staniewski, 2008)), values of each employee (Nicolescu, Nicolescu, 2005), existing practices in the other organizations and the realities from different markets. In fact, the idea of building a "framework" (i.e. a model, a pragmatic working mechanism etc.) that would harmonize the organizational goals with the goals of each employee is an old idea in the management theory. This idea was argued by Drucker in 1954 (Drucker, 1954); subsequently, it has known dozens of reconceptualization and opinions more or less unitary in the management theory, but there is still no consensus optics on this topic. In addition, it is an obvious truth that any employee within an organization today cannot be efficient (not for himself nor for organization) if he/she fails to constantly acquire/process new knowledge, more selective and sophisticated in the area he/she operates.
The two broad categories of knowledge (tacit-explicit) are mixed; they process and permanently transform from one type to another in various organizations; they offer the vector that can ensure the maintenance of the competitive advantage on markets. Even if today we have some explanations and models concerning the knowledge conversion from one type to, actually this mechanism is less known, as it is essentially dependent on the mechanism of human thinking.

The USV Annals of Economics and Public Administration Volume 15, Issue 1(21), 2015
173
Figure no. 2. Current conditionings of HRM as part of the overall strategy of the organization
In figure no. 2, we suggest some current conditionings to be considered by the top
management of companies in a bid to build a strategic vision that would harmonize/integrate the individual wishes and the organizational objectives. As shown in the graphic suggested, which is enshrined in the management theory under the name of "values" (as part of the organizational culture) is found as a vector type both in various directions of action of the decision maker and in the various stages in the evolution of the organization. In our opinion, the employee self-perfection as hypothetical ideal on long term will remain permanently under the influence of several factors (part dependent on person, part dependent on organization).
Finally, from what we have suggested in figure no. 2, a series of conclusions can be drawn, directly/indirectly related to the theme of our research. Among these conclusions, we selectively mention the following: The component called "values" has been and remains a major vector in the management theory both for the individual and for every organization. In fact, every employee of a company relates to certain values in which he/she believes (as being a member of society) and by which he/she will define certain objectives regarding the work done by him/her in the interest of the organization. So, from the perspective of the employee, this component will play a special role starting in the recruitment stage of the organization, following the maintenance and up to the point where he/she will be asked whether or not to agree particular objectives through negotiation with the company's top management (goals / objectives); The issues mentioned regarding the employees and the values in which he/she believes, remain equally valid when analysing the organizational behaviour and strategies conceived by the top management (company mission, corporate objectives, the type of organizational culture, etc.) are reported in a greatly proportion to the value component; Thirdly, what we have assigned as "organizational values and identity" (figure no.2) has always had, we believe, a special significance in the superior decision maker attempt to build a working environment which can favour human participation, therefore, to highlight the contribution of each

The USV Annals of Economics and Public Administration Volume 15, Issue 1(21), 2015
174
employee in obtain the "common good". Moreover, in the organizational contexts in which the acquisition and the processing of knowledge require extremely well educated employees, this conditioning and / or direction of HRM management analysis should occupy a central position in top management concern. Today it is extremely difficult (perhaps impossible), we say, for the top management of a company to succeed in building an effective overall strategy that ignores or leaves a subsidiary position for the HRM strategy and for the KM strategy; What we have typified by "motivation" and "self-control" constituted a big concern for the greater analysts in the theory of business administration; MBO system proposed by Drucker is intended to be a pragmatic working instrument precisely for the purposes raised (Drucker, 1954). However, the issue of self-motivation and self-control of the employee within an organization has remained open and susceptible, we believe, to other recommendations made by theorists. This is because this requirement is extremely difficult to achieve/to fulfil and should constitute a major concern for long-term for the superior decision maker. In other words, depending on the specificity existing in a company (stated mission, organizational culture type, line of work, competitors practice etc.) the organization should permanently respect certain pre-defined values and to build an organizational identity, best possible public individualized. Moreover, it would be ideal if each member of the organization would feel that he/she is a "part" of this construction that strengthens over time, meaning that he/she finds certain values (as being common with those in which he/she believes) and identifies their own contribution to the organization's identity; Finally, we understand that what we have defined as "human development" can be found in sociology as a normal course of action for each individual, as each seeks a certain ideal (but this ideal appears as a result of what is happening in the organization, society, family and various social micro-groups). In terms of organization, it promotes/supports certain values that tries to induce in the employees behaviour through motivational mechanisms, training programs and personal development; the concrete results which every employee will obtain in the organization's daily life however will be significantly different. Particularly, the manner in which an employee acquires explicit/tacit knowledge transforms them into own tacit knowledge and agrees to transmit them to others (from the same group or to the next generation of employees) remains substantially different from one case to another even in favourable organizational contexts. In other words, self-perfecting (in the sense of self-realization according to Maslow's optics) of each member of the organization can be reflected in completely different plans; some may target some spiritual self-realization, others can predominantly envisage the personal/family self-realization, while others can considered themselves as self-realized, when they obtain a balance in the religious plan.
4. CONCLUSION
The literature review has suggested that effective KM should be a balanced focus on people, process and technology which features at the core of the firm’s strategy. Certainly, implementing any strategy requires, first, a strong commitment of senior managers in this process, as they trigger the whole mechanism of change. Since that reshaping organizational culture means changes at the level of each employee, these depend heavily on the commitment and demonstrated competence of the managers who lead them directly. Active participation of top management levels is necessary for successful change, and learning organizations and creating the right environment for learning and knowledge transfer cannot be built only from the training department / training.
A culture that encourages change is an essential feature of organizational learning. The new organizational culture based on knowledge is an essential component of knowledge supportive environment to which contributes all the components of the organization management and which ultimately condition sustainability and performance decisively.
HRM has to be the catalyst for culture change– connecting the traditional to the new methods, to leverage the collective knowledge in an atmosphere of “openness” with a competitive advantage. Thus, the HRM role can shift into a new value delivery model and can be seen as a more value added, becoming a strategic resource.

The USV Annals of Economics and Public Administration Volume 15, Issue 1(21), 2015
175
Knowledge and knowledge-sharing have become most important factors of organisational potential in this environment of rapid change, since it increases competitiveness. The transition to knowledge management/organization should start with building a new culture, which itself is an intangible management resource of the organization. The values promoted by each organization have a significant impact on the conduct of the employee through the process of internalization. The organisations must create and promote a climate of honesty, productivity and safety orientation. Not the last, the values reflect the harmonization of each person values with organizational values.
The paper demonstrates the importance of building a KM strategy linked to HR strategy, giving important directions for organisations facing a very complex environment.
ACKNOWLEDGMENT
”The author, Otilia-Maria Bordeianu, would like to specify that this paper has been
financially supported within the project entitled „SOCERT. Knowledge society, dynamism through research”, contract number POSDRU/159/1.5/S/132406. This project is co-financed by European Social Fund through Sectoral Operational Programme for Human Resources Development 2007-2013. Investing in people!”
BIBLIOGRAPHY
1. Drucker, P., (1954), The Practice of Management, Heinemann 2. Drucker, P., (2004), Managementul viitorului, Editura ASAB, Bucureşti 3. McGregor, D., (1960), The Human Side of Enterprise, McGraw– Hill, New York 4. McGregor, D. (1967), The professional manager (W.G. Bennis & C. McGregor, Eds). New
York: McGraw-Hill. 5. Newstrom, J. W. & Davis, K. (1993), Organizational Behavior: Human Behavior at Work. New
York: McGraw-Hill 6. Nicolescu O., Nicolescu L. (2005), Economia, firma şi managementul bazat pe
cunoştinţe/Economy, company and knowledge management, Editura Economică, Bucureşti 7. Nonaka, I. (1994), A Dynamic Theory of Organizational Knowledge Creation, Organizational
Science, 5(1), 14-37 8. Peters, T. J., & Waterman, R. H. (1982), In search of excellence: Lessons from America's best-
run companies. New York: Harper & Row. 9. Polanyi, M. (1966), The Tacit Dimension, Anchor Books, New York, USA. 10. Popa, M. (2008), Introducere în Psihologia Muncii/ Introduction to Work Psychology, Ed.
Polirom, p. 259 11. Timmers J. S., Mennes M. A. (1998), Fundamentals on Design of Satisfaction Questionnaires,
The European Foundation for Quality Management, Brussel 12. Todoruț,A., Niculescu, G., Chirtoc, I. (2011), The architecture of the human resources in
management based on knowledge and the impact on reducing unemployment, Revista Economică, Constantin Brâncuşi” University, Târgu-Jiu
13. Toffler, A., Toffler, H., (2006), Revolutionary Wealth; (traducere în limba română Avuţia în mişcare, Editura ANTET, Bucureşti
14. Tottderdill P. (2002), Developing New Forms of Work Organisation: The Role of the Main Actors , Employment & Social Affairs , EU , Bruxelles
15. Staniewski, M, W. (2008), The elements of human resources management supporting knowledge management, Amfiteatrul Economic, special number

The USV Annals
of Economics and
Public Administration
Volume 15,
Issue 1(21),
2015
176
OPINIONS OF ECONOMIC ENTITIES FROM BRAȘOV AND
SUCEAVA COUNTIES REGARDING THE IMPORTANCE OF LEASE
SERVICES FOR DEVELOPING THE BUSINESS ENVIRONMENT
LecturerPhDOanaBĂRBULESCU
TransilvaniaUniversityofBrașov,FacultyofEconomicSciencesandBusinessAdministration,[email protected]
ProfessorPhDCristianValentinHAPENCIUC
“ȘtefancelMare”UniversityofSuceava,FacultyofEconomicsandPublicAdministration,[email protected]
AssistantPhDAndrei‐AlexandruMOROȘAN
“ȘtefancelMare”UniversityofSuceava,FacultyofEconomicsandPublicAdministration,[email protected]
MasterStudentMihaiCOSTEA
“ȘtefancelMare”UniversityofSuceava,FacultyofEconomicsandPublicAdministration,[email protected]
Abstract: We herein aim at identifying some development opportunities for Romanian SMEs within a changing business
environment by using the lease as a means of business financing. In this regard, we undertook a piece of quantitative marketing research using, especially, a series of descriptive and inferential statistics elements so as to meet our research objectives: highlighting the financing forms used by the economic entities in the two counties, identifying the proportion in which lease is used and describing the main constraints existing when financing companies by leasing. The research results underline the fact that the main business entities use this financing system, it being considered more advantageous than the bank loan. Moreover, we notice some differences between the two counties analysed suggesting the existence of an important influence of the local business environment.
Key words: Lease, Development, Financing forms, Financial lease, Operational lease, Leaseback. JEL classification: D23, D24, E22, G23, G32.
I. INTRODUCTION
The development of SMEs plays an important role in the growth and prosperity of every county. The small and middle-sized enterprises (SMEs) are considered to be the engine of the economic growth both in the developed and in the emerging countries as well, if taking into account the level of investment, they generate more workplaces than the large companies. At the same time, SMEs have a significant contribution to GDP, to the national budget through the revenues collected as taxes, to the increase of the entrepreneurial culture, to the development of the skills of the human resources that lead to the increase of the standard of living of the communities where SMEs operate in. The development of SMEs field creates a competitive environment and contributes to the correct distribution of revenues within the economy (Qureshi, Herani, 2011). Due to their small size, SMEs enhance the atomic nature of the market and reduce the power of large companies to influence it. Besides, their large number stimulates competition, limiting the monopole positions of large companies and thus decreasing their possibilities to increase prices. Due to their abilities to respond promptly to the local demands as a result of their flexibility, SMEs often manage to operate on local markets more efficiently than large business entities (Silivestru, 2013). Hence, SMEs may be considered as valuable players of the economy, offering entrepreneurs many opportunities and benefits that they would not be faced with otherwise.

The USV Annals of Economics and Public Administration Volume 15, Issue 1(21), 2015
177
In 2013, SMEs continued to have a major share of 99.7% in the total number of Romanian active companies and had a significant contribution to creating new employment, as 65.7% of the total number of Romanian employees work in SMEs. This can be also explained as SMEs are customer-oriented organizations, possessing considerable resources and technical abilities. But they often do not have the necessary financial resources to create and transfer value to stakeholders (Popescu, Dumitru, Vegheș, Kailani, 2013). Facilitating access to financing represents nothing but the main instrument in ensuring the economic growth, the innovation and the aggregate productivity of a country. Improving SMEs’ access to financing plays a crucial role in promoting the entrepreneurial spirit and in intensifying competition at the level of the entire economy. The access to capital sufficient and adequate to growth and development is one of the main challenges that most SMEs face with. This situation is also intensified by the difficulties they encounter in their relationships with financial intermediaries that consider their financing as highly risky but lowly profitable (Silivestru, 2013). A real scan of the main financing sources of the Romanian SMEs shows that the lease and the bank loan are more accessed by entrepreneurs than venture capital funds, risk capital funds, factoring, European funds and governmental assistance programmes. In this respect, lease has an important role in the modern economy, making possible the meeting on the same market of capital owners/suppliers and capital receivers who need it in order to render their activities more efficient (Vintilă, 2004). In this context, the relationships between the implied parties have been strictly regulated both legally and fiscally. Hence, the volatility of the Romanian business environment generated limitation of the activity of capital users and consequently, the cessation of lease contracts conclusion, creating large disequilibria in the management of the supplying companies. This paper emphasizes on one hand the importance of the lease within all the SMEs’ financing sources and, on the other hand, characterizes the behaviour of the consumers of such financial services with the aim of improving law and practice in this field. In this regard, the novelty of this article consists of the research undertaken, which aims at filling the existing gap in the Romanian specialty literature and which brings as a foreground essential aspects regarding SMEs financing by means of lease. II. SCIENTIFIC LITERATURE REVIEW
The economic and social importance of the SMEs field is also underlined in the specialty literature. A well spread statement in the papers focused on SMEs is that ”SMEs represent the backbone of the economy, being the main engine for economic growth". In order to emphasize SMEs’ role in ensuring economic growth from the point of view of increasing workforce occupancy rate because of the reduced costs associated to the creation of a workplace (Audretsch, Keilbach, 2008), it has been demonstrated that during the period of time from 1980 to 1990, the main regions in Germany registered economic growth as a result of the increase of SMEs’ share as far as the number of employees is concerned, in most of the industrial fields. Some authors (Beck, Demirguc-Kunt, 2005), grounding on three premises: SMEs’ capacity of stimulating competition and developing entrepreneurship, their productive flexibility to produce more sophisticated, varied and innovative goods than the large companies and their significant contribution to the increase of employment, maintain the economic development model that focuses on SMEs. Within their previous analyses, the same authors (Ayyagari, Beck, Demirguc-Kunt, 2003) underline the fact that SMEs’ prevalence on the market is a feature of those economies registering significant growth and not a cause of it. Other authors (Silivestru, 2013) demonstrated the existence of a positive connection between SMEs’ prevalence at the level of an economy as far as the created added value is concerned, and the increase of GDP. But as regards the size, the situation is different: as micro-enterprises do not manage to generate increases of GDP, SMEs significantly contribute to economic welfare. The main cause of the different roles that SMEs play according to their size for our

The USV Annals of Economics and Public Administration Volume 15, Issue 1(21), 2015
178
country’s economy is the efficiency per employee. In small companies, we can find the highest proportion of number of employees of SMEs but the lowest labour productivity per employee. The lack of efficiency is caused by the limited access of small companies to the financing sources for investment projects. It is well recognized in the speciality literature that the reduction of financial constraints for the private sector and the focus on the increase of firm sizes is a means by which the financial system contributes to ensuring the economic growth (Beck, Demirguc-Kunt, Laeven, Levine, 2008). As economy currently passes through some deep changes, economic development theories and models must be adapted to the new realities. More and more specialists attribute to services the role of engine of economic growth (Ioncică, Petrescu, 2005). In the last decades, lease has proven to be one of the most efficient financing ways of investment in the production field and not only, offering high security to capital owners (Georgescu, 2002). Thus, it has become an alternative preferred by 80% of the companies in the developed countries, reaching 70% of the ”wealth” of these companies. The main reasons of using lease as a financing form truly reflects its philosophy referring to the fact that:
Profit is generated by the effective use of the fixed assets and not of their ownership right over them;
Owning some old or obsolete equipment is generally a real disadvantage for the companies; Getting the right of use, with the minimum invested capital, on some modern and proficient
equipment leads to the growth of the business and consequently of its activity, generating in the end a higher profit.
The lease represents a form of trade and financing by which specialized financial companies or producers directly rent some goods to those customers who do not have sufficient own funds or borrow in order to buy (Ciobanu, 1997). By such transaction, a party named lessor or financer transfers to another party named lessee, for a certain period of time, the right of use over an asset against a sum of money, named lease rate (Niţulescu, 2008). At the end of the stipulated period of use, the financer undertakes to respect the user’s right of option to acquire the proprietorship of the good at a residual price or to extend the lease contract, or to terminate the contract (Clocotici, Gheorghiu, 2000). III. THE ROMANIAN LEASE MARKET
When analysing lease operations, we can see that, among all its forms, it is financial, operational, direct lease as well as leaseback that present the highest attractiveness for Romanian entrepreneurs. Following 2008, the Romanian financial lease market got stable to around Euro 1.3 billion whereas last year, as a result of some financing projects that were postponed, it registered a decrease of 9% as compared to 2012, a total funded volume of Euro 1.243 billion (ALB) being realized. Funding given in 2013 was used for the three traditional fields of financial lease: that of the means of transport which has a major proportion of 71% (Euro 879 million), that of equipment to be used in different economic fields with a proportion of 25% (Euro 315 million) and the real estate with a proportion of 4% (Euro 49 million). As in 2013, the automotive market registered significant decreases; the dependency of lease funding on this market is the real reason that negatively and directly affected the total volume of new lease funding at national level. In accordance with the national economy growth sustained by the agricultural production and export growth, financial lease funding proved to be a consistent supporter of the financing need of such fields. Thus, as compared to 2012, in 2013 there was registered an increase of agricultural equipment financing from 14% to 23%, as well as of wood processing industry equipment financing (from 3% to 4%), of food industry financing (from 2% to 5%) and of automotive service companies (from 1% to 3%). With the same dependency on the general evolution of Romanian economic fields, the proportion of financing other industries is decreasing as follows: construction field from 22% to 17%, metallurgy from 9% to 8%, technology financing in the energy field from 19% to 14%. The

The USV Annals of Economics and Public Administration Volume 15, Issue 1(21), 2015
179
financing of the other economic fields preserves a relatively constant proportion. The real estate field maintains the historically low value from 2012, in accordance with the general context of the Romanian real estate market as well. Furthermore, legal persons as customers attracted the highest proportion of total financing that of 97%, increasing by 9% as compared to the same period of 2012. Most legal persons who use financial lease as a financing source necessary to their economic activities are SMEs. The highest market share is registered by the financial lease companies which are affiliated with banks, with 65%, followed by those belonging to producers with 20% and independent financial lease companies with 15%. Operational lease mainly responds to the needs of large companies that possess or want to acquire vehicle fleets. From the point of view of turnover, at the end of 2013, this market reached the value of Euro 200 million, registering a little increase of approximately 3.5% as compared to the previous year, getting to almost 43,000 units (ASLO). The new 11,500 vehicles registered by operational lease in 2013 represent more than 17% of the total number of the new registered light commercial vehicles. This evolution was registered as in 2012 the market had also a positive tendency increasing by 11% to no more than 41,500 units. For 2014, the potential of operational lease market is estimated to Euro 220 million, this being a low increase of approximately 5%. Within all the operational lease services, the main proportion of 70% is of fleet financing and management services (complete services of operational lease) followed by fleet management with 23% and operational lease services consisting exclusively financing with 7%. After a long period of stagnations and declines, for the first four months of 2014 it has a positive evolution, the Romanian lease industry being consolidated by 28% as compared to the first semester of 2013. To conclude, lease is considered an exact barometer of economic development, financing increase or decrease affecting the performance of the overall economy, as a rule between 6 and 8 percentage points in the lease market involving 1 percentage point increase in GDP. In such conditions, if forecasts of lease market increase are to be confirmed, we shall state an increase of economy performance. IV. RESEARCH METHODOLOGY
Given the importance of this financing source, we undertook an enquiry at the level of two
Romanian regions, based on the following hypotheses: 1. More than 40% of business entities of the analysed counties used the services of lease
companies. 2. Less than 60% of business entities of the analysed counties consider that lease is more
advantageous than banking loan. 3. The activity field of business entities of the analysed counties influences the number of
contracts concluded with lease companies. In order to test the hypotheses herein formulated, in April-June 2014, we undertook a piece
of quantitative marketing research at the level of Brașov and Suceava counties on a sample consisting of 886 companies (this sample size was established based on the data published by the county statistics departments – the number of companies in every county, assuming an limit error rate of 5%).
Because we wanted to obtain a sample size similar in structure to the researched population, we chose the proportionally stratified sampling (stratifying according to the activity field: agriculture, industry, construction, trade and services; and according to the firm size: micro-enterprises, small enterprises and medium-sized enterprises). In order to collect data, we used a questionnaire consisting of 42 questions. In terms of the type of questions, we used both closed questions (especially dichotomous and with multiple answer) and open questions. Regarding the types of scales, we used especially the Likert Scale and the semantic differential scale (Osgood) in order to determine the average score (weighted arithmetic mean) representing the overall assessment of the entire sample.

The USV Annals of Economics and Public Administration Volume 15, Issue 1(21), 2015
180
The questions aimed at identifying the information sources used, describing the behaviour and profile of lease services customers, identifying issued appeared during the duration of financing contracts as well as the possibilities of improving such services. Questionnaires were applied by using two methods: applying questionnaires by e-mail and by an interview operator. In both cases, we used lists with the trading companies of the two counties, grouped according to their field of activity and size.
According to the proportion of every stratum, we randomly (we used a random number generator) selected from the two lists the companies to question. With regard to Suceava county, we used only questioning by e-mail so the response rate was lower (data are still representative) as with regard to Brașov county where both data collection methods were used. Further, data were centralized by using the software SPSS version 19.0 for Windows.
In order to test the hypotheses, we used non-parameter correlation tests (Spearman and Kendall) as well as tests for binominal variables. Due to the way that we structured our hypotheses, we used a binomial test to analyze the appearance probability for one of the values (for a alternative variable – H1 and H2). In the case of the third hypotheses we intended to use a chi-square test and as a back-up some correlation tests.
V. SYNTHESIS OF THE MARKETING RESEARCH RESULTS
According to the study we undertook, more than 39.4% of the business entities of Brașov county that demanded offers from the lease companies had as a main information source the recommendations of the suppliers as well as of the dealers of the goods they wanted to buy, a similar situation being registered also at the level of Suceava county where the proportion of the business entities who chose to use this information source is higher (57.4%). Another information source often used by trading companies of Brașov county is the recommendations from their acquaintances or cooperators (35.6%), situation which is different from that registered in Suceava county, where only 19.1% of the economic units use such information sources. In contrast, the least used information sources by companies from both counties are street billboards and mass-media, the results obtained corresponding to the reality if we are to consider the fact that these means of information are focused less on promoting lease services.
A good proportion of the business entities from Suceava county (61.7%) choose as a rule, to demand offers from 1-2 lease companies before making the decision of acquiring a good unlike most of the companies from Brașov county (47.55%) that, in general, require offers from 3-4 lease companies so as to compare them and to choose the best financing option (Figure 1). As a consequence, the companies from Suceava county which demand offers from more than two companies are less represented as compared to the data registered in Brașov county; this denotes a more pragmatic approach of companies from Brașov when it comes to choosing the optimum financing sources.
Figure 1: Comparison regarding the number of lease companies that business entities from
Brașov (left) and Suceava (right) choose to demand offers from Source: Authors

The USV Annals of Economics and Public Administration Volume 15, Issue 1(21), 2015
181
The fact that during the lease process there are not required, as a rule, additional guarantees as in the case of the banking loan, represents for the business entities from Suceava county the main reason for which they appealed up to the present to the services of a lease company (26%). As similar as it regards the economic companies questioned in Braşov county, the rapidness in getting the financing (24.5% - relative value registered at the level of Brașov county, 24% - Suceava county) and the possibility of VAT deduction at vehicle acquisitions (17.17% - Brașov county, 19.8% - Suceava county) are also reasons of high importance that determine entrepreneurs to use lease as a financing method (Table 1).
The opinions with respect to the possibility to renounce at the acquired good during the contract and the possibility of extending the contract at the end of the lease period registered the same values at the level of the two counties herein analysed, the elements invoked not being real reasons so as to determine companies to use the services of a lease company.
Table 1: The main reasons invoked so far by the business entities from Brașov and
Suceava counties for using the services of a lease company Brașov Suceava The leased asset may be replaced anytime during the location period. 9.2% 1.0%One may renounce anytime to the leased asset during the contract. 3.7% 3.1%At the end of the contracting period, there is possible to extend the contract. 6.3% 1.0%Accelerated amortization is possible. 6.5% 7.3%Deduction of almost entire VAT at vehicle acquisition. 17.7% 19.8%Rapidness in getting the financing. 24.5% 24.0%There are not required additional guarantees. 14.8% 26.0%Less advance payment than in the case of other financing instruments. 16.1% 15.6%Other. 1.2% 2.1%
Source: Authors An interesting aspect is that, as the business entities of Braşov county considered, the
services of the lease companies affiliated to producers or goods dealers are different from the services offered by the lease companies affiliated with banks (59,67%), this opinion being also expressed and sustained by the majority of questioned companies from Suceava county (72.34%). Out of the business entities from Brașov county that stated such differences, 37.44% consider that the interest rate used by the lease companies affiliated with manufacturers or dealers is at an average level (neither high, nor low) as 31.29% appreciate that companies offering lease services affiliated with a manufacturer or dealer have high interest rates. However, by taking into consideration the average score of 3.22 on a scale from 1 to 5, where 1 represents the lowest level of the interest rate and 5 its highest level, we can state that business entities from Braşov county have, in general, a neutral opinion with regard to the level of the interest rate demanded by the lease companies affiliated with manufacturers, a similar view having the business entities from Suceava county as well (average score of 3.36).
As regards the interest used by the lease companies affiliated with banks, most business entities from the two counties herein researched consider it as high (36.29% - Brașov county, 41.94% - Suceava county), and less than 32% of the questioned companies of Brașov county and 25.81% of those of Suceava county agree that interest is at an average level. The overall of 3.87 registered in this study for the Suceava county, little higher than that determined for Braşov (3.61) show that on the whole, business entities from the two counties consider that the interest used by lease companies affiliated with banks is a high one and as a consequence, it is higher than that used by the lease companies affiliated to producers or goods dealers.
According to the general opinion of 45.16% of the business entities from Suceava county, interests used by independent lease companies have an average level whereas more than 29% agree that such interest is a high one. As compared to Braşov county, the average reaches approximately the same value (3.36 to 3.32 – value registered at the level of Braşov county) which shows that the

The USV Annals of Economics and Public Administration Volume 15, Issue 1(21), 2015
182
interest rate used by independent lease companies lies at an average level. The same as regards the results registered for Braşov county, we find that business entities from Suceava county use higher interest than independent companies as well as than the companies affiliated with manufacturers or dealers.
According to the research results, the interest used by banking loans institutions is at a higher level than the interest used by lease companies, either independent or affiliated, thing that may be one of the main reasons for which an business entity would choose to finance its activity with the help of a lease operation and not with a banking loan. When the interests used by the lease companies are at a lower level, at least in terms of asset volume, lease would be clearly a more advantageous option.
Among the companies of Braşov county, the opinions regarding the amount of the interests charged for loans are divided: 30.9% consider that they are not either high or low, 30.34% consider that loan interests are high whereas interestingly, unlike the opinions regarding interests used by lease companies, more than 28% of economic units in this study appreciate that loan interest is very high. Furthermore, business entities from Suceava county are more conservative when it comes to banking interest and no more than 40% of them agree that interests used by banking institutions are very high.
Most of the companies (80.65%) operating in Braşov county consider that lease is a more advantageous financing form than the banking loan, the main reasons stated referring to the approval time which is shorter for lease (30.7%), the possibility of VAT deduction at vehicle acquisition (25.4%), respectively the existence of some criteria more flexible to grant the financing for lease than for banking loans (18.2%). With respect to the business entities of Suceava county, there are often expressed the ideas that lease is a more advantageous form, offering the possibility to deduce VAT when acquiring means of transport (29.6%) and lacking of additional real estate securities not being requested than banking loans (22.2%) being the main reasons expressed (Table 2). Even though loans are a frequent option in the economic practice, the business entities most probably remark a number of drawbacks of this financing form, such as: loan securities and meeting some strict financial solvency criteria as well as, sometimes, the fluctuating interest.
Table 2: The main reasons for which business entities choose lease as a means of financing
and not the banking credit Brașov Suceava Shorter time for financing approval 30.7% 14.8%More flexibility in granting financing 18.2% 14.8%VAT deduction at means of transport 25.4% 29.6%Flexibility in establishing the advance payment, instalments and residual value
16.5% 11.1%
Lack of additional real estate securities not requested 8.9% 22.2%Other 0.3% 7.4%
Source: Authors However, it is important to state that those business entities, for instance, who have not
used up to the present the services of a lease company invoke as their reasons the obligation to insure the asset purchased by this form of financing (75%) as well as the fact that the financing period is not long enough, the lease contracts being concluded, as a rule, on periods of time relatively short if compared to the other financing forms as the banking loan (25%). We consider that based on the economic decrease as the present one, the disadvantages of lease as a financing source (either those already invoked by the questioned business entities or other economic or legal reasons) can hardly weigh generating a decrease of the lease market.
Thus, lower interest and longer-term financing possibility represent the main reasons for which the business entities from Braşov county would use a banking loan in order to purchase goods and not the lease. According to the hierarchy made by the respondents according to the

The USV Annals of Economics and Public Administration Volume 15, Issue 1(21), 2015
183
importance, the third ranks the possibility to receive financing for more categories of goods that is not to be offered by a lease operation. It is interesting the fact that, even if possessing the proprietary right at the moment of entering into the possession of the good is a feature specific to banking loans and not offered by leasing, this aspect does not represent the main priority for the business entities from Brașov county, so it may not be considered one of the main reasons for which they would use a banking loan rather than a lease contract. It is also interesting that unlike the business entities from Brașov counties, the companies questioned from Suceava counties give a high importance to the possession of the proprietary right on the goods, this aspect being ranked the second when classifying their priorities. Moreover, unlike the business entities from Braşov counties, SMEs of Suceava counties do not consider that the fact that the user of a lease operation who is obliged to assure the purchased good is an impediment and as a consequence, the lack of such obligation is not a good reason for which they would take a banking loan.
The business entities from Brașov who have not yet used the services of a lease company have financed their activity by other means, of which: own sources (40%) which help them as much as possible to ensure their financial autonomy and to eliminate the risk of accidental capital withdrawal; banking loan (40%) especially in the case of SMEs, as in Romania, the access to loans offered to new or small companies is more difficult; another form used by business entities to ensure their financing is accessing non-reimbursable funds (20%) offered by the European Union or the governmental programmes.
Conversely, at the level of Suceava county, most business entities who have not used by now the services of a lease company have financed their activity by a banking loan (57.6%). Moreover, 12% of the subjects questioned mention non-reimbursable funds as an alternative financing whereas 8.7% of these companies state that they have used factoring so as to financially sustain their activity. Hence, we state that 44.5% of the questioned companies from Brașov county have used many times the services of a certain lease company, the main reasons for such repetitive cooperation being the rapidness in getting the financing (31%), the attractiveness of the lease company’s offer as compared to the offers of their companies on the market (25.3%) and the ease in getting the financing (23.8%).
The reasons for which the business entities from Brașov county chose to use a lease company and not a banking institution so as to get a banking loan, have also based their choice of continuing the cooperation with that lease company and to conclude other financing contracts. But, unlike those companies, the business entities from Suceava county focus more on the ease of getting the financing (more precisely the ease of preparing the documents needed for getting the financing) than on the rapidness of getting the financing itself.
Not more than 60.98% of the companies from Brașov county which made the object of this piece of research state that they invest, on the average, up to 10% of their turnover in the purchase of goods by using lease, whereas 25.57% state that the investment by lease operations do not annually surpass 20% of the company’s turnover. Investments needing a budget higher than 20% of the company’s yearly turnover are made only by 15.41% of the companies of Brașov county. On the contrary, 61.29% of companies from Suceava county declare that they invest, on the average, up to 10% of their annual turnover in the purchase of goods by leasing, whereas 35.48% state that their annual investment by lease operations do not surpass 20% of the company’s turnover.
Most enterprises from Suceava county (69.89%) as well as from Brașov county (65.57%) generally conclude a lease contract at intervals of few years, the number of the companies with more financing needs that determine the more frequent use of lease operations resulting, as a consequence, in a relatively low proportion. (Figure 2).

The USV Annals of Economics and Public Administration Volume 15, Issue 1(21), 2015
184
Figure 2: The frequency that the business entities from Brașov (left) and Suceava (right)
counties choose to conclude financing contracts in lease system Source: Authors
From the point of view of the type of lease operations undertaken, as a result of this study,
we find that enterprises from both Brașov and Suceava counties are familiar more frequently to financial lease operations than to operational and direct lease or leaseback. For instance, not less than 82.9% of the business entities from Brașov county have not yet concluded any operational lease contract, this being explained if the legal provisions in force stipulating that the customer/user may not purchase the good from its financer at the termination of the lease contract, it being obliged to return it, are to be taken into account. Thus, because considerations facilitating ownership, financial lease is more popular among the business entities from the two counties herein analysed.
With respect to leaseback operations, we can state that the companies from Brașov county are familiar as much as the companies from Suceava county to the sale of fixed assets, immediately followed by their rental from the new owner in order to turn them into liquidities. In other words, it seems that questioned companies are pragmatically not aware of the usefulness of such operations, in the sense of improving financial conditions by increasing liquidity indicators without destabilizing company’s activity as the good object of the leaseback contract may be further used in the same conditions as before being turned into liquidity.
With respect to the categories of goods being the object of lease operations, we can state that, as in the case of the business entities from Brașov county, most business entities from Suceava county have used lease contracts so as to purchase vehicles (53.8%), in small proportions lease being used to purchase utility vehicles (19.2%) and goods transportation vehicles (15.4%). If 13.9% of the used lease operations by the business entities from Brașov county consisted from purchasing equipment, in the case of companies from Suceava county, such goods represented the object of only 9% of total acquisitions made by using lease as a financing form.
The interest used by the lease company (average score of 2.50) and the ease in getting the financing (2.63) represented the factors that the business entities from Brașov county based their process of making decisions on when purchasing the last asset by lease system. In their opinion, the lease company’s reputation (3.40) comes the third, this also being a decisive factor when deciding upon the conclusion of a financing contract. On the other side, the business entities from Suceava county consider that the factors taken into account when making decisions to acquire the last asset by leasing are the ease in getting the financing (opinion average of 2.95), the suggestions of the dealer’s or supplier’s representatives (average of 3.37) and the interest used by the lease company (average of 3.43).
A question that this study answered to is to what proportion the current law encourages the lease activity. Thus, not more than half of the economic entities from Brașov county consider that the current Romanian law stimulates on the average the lease activity, whereas 17.91% of them

The USV Annals of Economics and Public Administration Volume 15, Issue 1(21), 2015
185
appreciate that the Lease law no. 287/2006 and the other regulations and governmental ordinances do not stimulate enough this activity. At the level of Suceava county, the dissatisfaction degree is higher, as not less than 37.78% of the questioned economic entities consider that the present law in force slowly stimulates the lease activity whereas 24.44% appreciate that the Romanian regulations do not help in any way the development of the business environment by the lease services (Fig. 3).
Figure 3: The opinion of the business entities from Brașov (left) and Suceava (right) counties
with regard to the measure by which Romanian law stimulates the lease activity In order to encourage the user to choose lease as a financing form, the decrease of the
interest level used by lease companies should firstly be encouraged and secondly, companies should be offered the possibility to totally deduce VAT. Last, but not least, other proposals made by the companies from the two counties refer to fiscal and legal relief with respect to the user’s obligation to conclude a CASCO (no-fault) insurance policy for the vehicle purchased by leasing, the extension of the limited payment periods and legal and fiscal encouragement of entrepreneurs so as to renew their vehicle fleets.
With respect to the three statistical hypotheses herein enounced, as a result of the analysis of the data collected and of the statistical tests made, we can formulate the following: 1. More than 40% of the business entities from the analysed counties used the services of a lease
company; At the level of Braşov county, only 46.1% of the analysed companies used the services of a
lease company whereas at the level of Suceava county, 57.3% of the analysed companies used this type of financing.
In order to test this hypothesis, we used a non-parametric test specific to alternative variables. This test was applied using a 40% probability. The results obtained show that the null hypothesis must be rejected. But, by applying the same test at the level of the two groups (the counties of Braşov and respectively Suceava) we found similar results. As a consequence, the first hypothesis is confirmed (in table 3 Sig. <0,000), more than 40% of the trading companies of the two counties used lease to finance.
Table 3: Binomial Test Category N ObservedProp. Test Prop. Exact Sig. (1-
tailed)
Have you turned, so far, to the services of leasing companies?
Group 1 da 415 .5 .4 .000Group 2 nu 471 .5 Total 886 1.0
Source: Authors
2. Less than 60% of the business entities of the analysed counties consider that lease is more advantageous than banking loan;
In order to test the second hypothesis of this study, we analysed the results to the eighth question. The results show that at least 60% of the business entities analysed consider lease to be

The USV Annals of Economics and Public Administration Volume 15, Issue 1(21), 2015
186
more advantageous than the banking loan. There is a little difference between the results obtained for the two counties, the number of the business entities from Brașov county who consider that lease is more advantageous than the banking loan being higher.
Following the use of a binominal test, at the level of the whole selection collective, the null hypothesis is not rejected (table 4). But, by applying the same test at the level of the two consisting groups, we state that the null hypothesis is rejected only at the level of Suceava county. Thus, we can appreciate that the second hypothesis is just partially confirmed (only at the level of one county analysed).
Tabel 4: Binomial Test
Category N ObservedProp. Test Prop. Exact Sig. (1-
tailed)
Do you consider that leasing is cheaper than bank credit?
Group 1 da 327 .8 .6 .000Group 2 nu 86 .2 Total 413 1.0
Source: Authors
3. The activity field of the business entities from Brașov county influences the number of contracts concluded with lease companies;
In order to test the third hypothesis, we analysed the connection between the number of contracts concluded every year and the field of activity of the companies. The differences existing among the five groups of companies (generated by their activity field) are not noticeable.
Thus, to test the connection between the two variables, we used a chi-square test, but the results could not be taken into account as data did not respect one of the test suppositions (cells registering values below 5 represent more than 20%). Under such circumstances, we chose to use the non-parametrical correlation coefficients (table 5).
Tabel 5: Correlation coefficient
Correlation Total Braşov Suceava
Number of leasing contracts signed
Kendall's tau_b Field of activity of the company
Correlation coefficient -0.045 -0.039 -0.098Sig. (2-tailed) 0.307 0.393 0.466N 409 364 45
Spearman's rho Field of activity of the company
Correlation coefficient -0.052 -0.045 -0.117Sig. (2-tailed) 0.297 0.393 0.445N 409 364 45
Source: Authors Following the testing of the correlation between the two variables, both at the level of the
selection collective and at the level of the two counties, we found that there is no connection between them. In order to test the correlation, we used two non-parametrical coefficients (Kendall’s and Spearman’s correlation coefficients) as the two variables are measured by an ordinal scale. Under such conditions, the null hypothesis may not be rejected (as a consequence, the third hypothesis is invalidated). VI. CONCLUSIONS
SMEs are considered the engine of economic growth and their development plays a vital role in the prosperity of developed and emerging countries. In order to maintain the role of engine of the economy, SMEs need funding to support innovation, higher productivity and, consequently, the aggregate economic growth of a country. However, the access to sufficient and adequate capital to grow and develop is one of the main obstacles facing most SMEs.

The USV Annals of Economics and Public Administration Volume 15, Issue 1(21), 2015
187
In Romania, leasing and bank loans are the most accessible forms of funding for the SMEs. In the Brașov and Suceava counties, the results obtained are extremely interesting and show the importance of lease in financing the activity of SMEs. Most business entities questioned had a favourable opinion regarding this financing instrument considering it more advantageous than the banking loan. For example, the fact that during the lease process there are not required, as a rule, additional guarantees as in the case of the banking loan, represents for the business entities from Suceava county the main reason for which they appealed up to the present to the services of a lease company. As similar as it regards the economic companies questioned in Braşov county, the rapidness in getting the financing and the possibility of VAT deduction at vehicle acquisitions are also reasons of high importance that determine entrepreneurs to use lease as a financing method. Moreover, according to the research results, the interest used by banking loans institutions is at a higher level than the interest used by lease companies, thing that may be one of the main reasons for which an business entity would choose to finance its activity with the help of a lease operation and not with a banking loan.
Following the analysis of the research results, we find that leasing is undoubtedly one of the most important forms of financing to SMEs, both in Brașov county, and in Suceava county. Company managers from the two counties analyzed believes that leasing could become a real growth opportunity in the country's economy, given that the legislation would help in this regard by supporting SMEs in choosing this form of financing. The companies surveyed do not hesitate to come with some proposals in this regard: the decrease of the interest level used by lease companies, companies should be offered the possibility to totally deduce VAT and other proposals regarding the fiscal and legal relief with respect to the user’s obligation to conclude a CASCO (no-fault) insurance policy for the vehicle purchased by leasing etc.
In conclusion, this approach on lease, a field less studied in the specialty literature, confers a great value to the paper. By his study, we shaped a clear image of the present stage of the development of the Romanian lease field, highlighting the fact that the development of SMEs by facilitating the access to financing creates the necessary premises for a sustained economic and social growth, by creating new employment and by ensuring a development framework adequate to the individual and the society as well. VII. LIMITS AND PERSPECTIVES OF RESEARCH DEVELOPMENT
As any piece of scientific research, this paper undoubtedly presents a series of inherent limits that we identified but they do not have significant effects on the conclusions obtained as a result of our analyses. Taking into account that this research does not intend to exhaustively present all the issues related to lease as a business financing form, we consider that there are perspectives for further development of this study.
At the level of the two counties, we observed more important differences; under such circumstances, in order to have a clear image, the research should be conducted for other regions, too, so as to characterize the behaviour of the consumers of financial lease services based on regional particularities.
Wishing to cover a range as large as possible of topics specific to lease, we used an ample questionnaire consisting of 42 questions, either close or open, which many times generated constraints with respect to them being completely answered by business entities. We consider that, in order to get a higher response rate and more accuracy of the results, the questionnaire should be optimized, which means to shorten it. Furthermore, we consider that it is absolutely necessary to use it by some unitary methods (either using it exclusively online or using it exclusively offline with the help of field operators) at the level of all the counties to be analysed.
As a conclusion, we can say that this paper has an introductory mission, shaping a future investigation enterprise that would help formulate real solutions conducting to the elimination of all the issues that SMEs meet when accessing resources with the aim of undertaking and developing investment projects by using lease as a business financing method. In this respect, another

The USV Annals of Economics and Public Administration Volume 15, Issue 1(21), 2015
188
development direction of this study aims at taking into account its annual use so as to process data and to obtain some dynamic analyses that may bring us a clearer image on this phenomenon.
BIBLIOGRAPHY 1. Audretsch, D. B. & Keilbach, M. (2008), Resolving the knowledge paradox: Knowledge-
spillover, entrepreneurship and economic growth, Research Policy, nr. 37, pp. 1697–1705 2. Ayyagari, M., Beck, T., Demirguc-Kunt, A.(2003), Small and Medium Enterprises across the
Globe, World Bank Working Paper WPS2127 [Online], disponibil la: http://www.tilburguniversity.edu/webwijs/files/center/beck/publications/obstacles/globe.pdf
3. Beck T., Demirguc-Kunt, A., Laeven, L., Levine, R. (2008), Finance, Firm Size, and Growth. Journal of Money, Credit and Banking, Vol. 40, No. 7, p. 1384
4. Beck, T., Demirguc-Kunt, A., Levine R. (2005), SMEs, Growth, and Poverty. Journal of Economic Growth, 10, pp. 197–227
5. Beck, T., Demirguc-Kunt, A, Maksimovic V. (2005), Financial and Legal Constraints to Firm Growth: Does Firm Size Matter?, Journal of Finance, No. 60, pp. 137–77
6. Ciobanu, Gh. (1997), Relaţii economice şi tranzacţii internaţionale, Editura Risoprint, Cluj – Napoca, p. 224
7. Clocotici, D., Gheorghiu, Gh. (2000), Operaţiunile de leasing, Editura Lumina Lex, Bucureşti, p. 15
8. Drumea, C. (2008), Rules on business ethics. Sox standard, The Amfiteatru Economic Journal 10, no. 23, pp. 154-160
9. Georgescu Goloşoiu, L. (2002), Business of Banking, vol. 2: Banking in the International Environment, Editura ASE, Bucureşti, p. 27
10. Ioncică, M., Petrescu, E. C. (2005), De la creșterea economică la dezvoltarea durabilă. Rolul serviciilor în procesul de dezvoltare, Revista Amfiteatru Economic nr. 18, p. 61
11. Qureshi, J.A. and Herani, G.M. (2011), The role of small and medium-size enterprises (SMEs) in the socio-economic stability of Karachi Indus, Journal of Management & Social Sciences, 4(2), pp. 30- 44
12. Neacsu, N. A.(2011), Protectia consumatorului, Editura Universitatii Transilvania din Brasov, Brasov, p. 24
13. Niţulescu, G. (2008), Ghidul financiar – bancar al României, realizat sub patronajul Băncii Naţionale a României, ediţia a III – a, Editura House of Guides, p. 111
14. Popescu, I. C., Dumitru, I., Vegheș, C., Kailani, C. (2013), Comunicarea de marketing – vector al consolidării afacerilor întreprinderilor mici și mijlocii, din perspectiva dezvoltării durabile. Revista Amfiteatru Economic nr. Special 7, pp. 493-509
15. Ramalho, J., da Silva, J. (2009), A two-part fractional regression model for the financial leverage decisions of micro, small, medium and large firms, Quantitative Finance, Taylor and Francis Journals, vol. 9(5), pp. 621-636
16. Silivestru, D.R. (2013), Finanțarea IMM-urilor din România în context european. Teză de doctorat. Universitatea Babeș – Bolyai, Cluj-Napoca
17. Vintilă, A. (2004), Aspecte teoretice şi practice privind operaţiunile de leasing (II), Revista Curentul Juridic, anul VII, nr. 1 – 2 (16 – 17), p. 1
18. http://www.dailybusiness.ro/stiri-finante-banci/piata-de-leasing-financiar-s-a-contractat-cu-9-anul-trecut-98647/ accessed at: 29.08.2014
19. www.wall-street.ro/tag/piata-de-leasing.html#ixzz3BwxAMZGu accessed at: 29.08.2014

The USV Annals
of Economics and
Public Administration
Volume 15,
Issue 1(21),
2015
189
PHARMACEUTICAL COMPANIES
BETWEEN CRISIS AND COMPETITIVENESS - SECTORAL
DIAGNOSIS
AssociateProfessorPhDMihaelaBÎRSANUniversitylecturerPhDŞtefăniţăŞUŞU
Economics,BusinessAdministrationandTourismDepartmentFacultyofEconomicsandPublicAdministration„ŞtefancelMare”UniversityofSuceava,Romania
[email protected]@seap.usv.ro
Abstract: The evolution of the pharmaceutical industry was a positive constant with the indicators of industrial
production even in years of crisis. Although the economic crisis in Romania decreased average growth rate of pharmaceutical companies, market value is expected to increase.
The explanation comes from the fact that in order to boost productivity, pharmaceutical companies are turning to emerging countries with aging populations such as open new markets for future development. Add to this the recent health policies implemented by newly industrialized countries that are aimed at ensuring increased access to care.
Analysts see the field phenomenon called "Farma-merger" a good chance for European pharmaceutical companies oriented to developing countries where drug sales should record a double-digit annual growth until 2017.
In Erste Group reports stated that the impact of the crisis on the pharmaceutical industry should be limited markets for EU only their economic slowdown. This will be possible because the external indebtedness of pharmaceutical companies in the EU remains at a minimum, they are able to finance their investment plans without tapping financial markets, are not adversely affected by the current limited availability of credit resources. Therefore major pharmaceutical companies in the EU will remain a solid investment on the long term, the negative developments are limited due to high resistance to the crisis their business model segment "generic".
The consequence of these developments is reflected in the recognition for the first time, the pharmaceutical sector as a strategic sector for the Romanian economy. In the context of public debate launching the National Strategy for Competitiveness 2014-2020, Generic Medicines Industry Association of Romania (APMGR) local pharmaceutical industry reminds the Government proposals on correcting the current fiscal and operational regulatory framework, to allow unlocking investments in facilities local production and increasing the stability of the business environment in this sector.
Key words: diagnosis, competitiveness, crisis, pharmaceutical companies JEL classification: M10, M40
1. COMPETITIVENESS - EVOLVING CONCEPT The literature reveals, on competitiveness, a complex concept, difficult to catch in a
comprehensive definition. The complexity comes from the numerous indicators that may be relevant sources of competitiveness that are not always the same for all the domains or enterprises.
In a general manner, Explanatory Dictionary of the Romanian language (http://www.archeus.ro/lingvistica/CautareDex?query=COMPETITIV) provides for competitive explanation "Suspected of support competition; where it can compete where competition is possible. In other words, competitiveness is the ability of a system to cope with competition being tied to a given competitive environment and the ability to obtain performance after participating on the profile market". (http://ro.paradox.wikia.com/wiki/Competitivitatea)
In the economic competitiveness of a state express complex and dynamic economic system, the potential competitive advantages and become effective regardless of the position held: global (global/international), regional, national, sectoral, organizational, product/service, individual, mirroring, as defined by the Statistical Office of the European Union (Eurostat)

The USV Annals of Economics and Public Administration Volume 15, Issue 1(21), 2015
190
(http://ec.europa.eu/eurostat), their ability to generate a sustainable manner and in conditions of competition, a level of revenues and occupancy levels/use of relatively high makers.
Although the literature searches are, most often, definitions of the size of its global competitiveness, macroeconomic, regional or national, it points out that the level is the microeconomic competitiveness is generated and it supports macroeconomic competitiveness.
In macroeconomic perspective, considering the fact that this is the level at which support and reinforce competitiveness, it refers to the ability of a nation to form an environment economically, socially and politically to support accelerated creation of added value (Constantin Ciupagea, coordinating, Direcţii strategice ale dezvoltarii durabile în România, European Institute of Romania Study III, 2006: http://strategia.ncsd.ro/docs/comentarii/3_fc.pdf). A country becomes competitive when you manage to build that climate that allows each company creating added value to be efficient, to be able to survive or grow in any domestic or international economic environment. The country maintains or improves its profitability internationally when it decides to apply the set of economic policies required to foster the achieving optimal expansion at the micro level.
At microeconomic competitiveness you essentially internal conditions, the companys, conditions expressing all components and functions that define and identified the following competitive categories:
global competitiveness financial competitiveness commercial competitiveness human resource competitiveness managerial competitiveness technical competitiveness, material resources organizational competitiveness. Basically, a company is competitive when under the influence of operating conditions
(material resources, human, financial, technical, managerial and marketing capabilities, etc.) achieve a sustainable advantage over competitors (on costs, prices, diversity and quality of supply, market share, profits, growth/development, sustainability), giving it the strength to face competition by responding to customer goods (by price, quality and diversity) and economic performance remunerates them according to participants marginal productivity of factors of production that they own.
Competitiveness is seen as part of the company's performance, inextricably linked to the concept of competitive advantage (competitive advantage) obtained the right combination of resources (infrastructure, finance, technology, people) with some competitive processes (quality, service, adapting to customer needs quickly).
Regarded as a quality that allows the company to face competition in a particular sector of activity, competitiveness is a way to pressure and control over the evolution of economic performance parameters.
Globalization has brought increased interdependence of national economies favored by reducing and eliminating obstacles of all kinds in the way of international flows of goods, services, capital and labor, accompanied by more intense competition:
between firms, to occupy a better position as the market; between countries, to create a favorable business environment that will attract capital and
talent, wherever they are in the world (Theodor Stolojan, Globalizare şi competitivitate, http://econ.unitbv.ro/ed/pag-rom/cursuri_on_line/globalizare.html).
Distinguished today as sources of competitive advantage designed to make a sustainable business in a global economy:
classical sources of competitive advantage: economies of scale, standardization of products backed by operations being carried out at lower costs, in case a higher production volume;
mix of resources (infrastructure, finance, technology, people); competitive processes (quality, service, adaptation to customer needs, speed);

The USV Annals of Economics and Public Administration Volume 15, Issue 1(21), 2015
191
knowledge as intangible resources of the company to be acquired and developed within the company in a "knowledge economy". This is an economy in which welfare is created through knowledge management and not by the financial and physical assets;
Knowledge is central to the Lisbon strategy of the European Union to become the "most dynamic competitive knowledge-based economy in the world". The "knowledge triangle"- research, education and innovation - is a core factor in European efforts to achieve the ambitious Lisbon.
innovation - will lead to improved products and processes, reduce costs and annual financial results best. This will lead to the development of business strategies that will include aspects of research, development and innovation.
information - competitiveness through information, is an activity that requires the acquisition, analysis and exploitation of data, news and information about products, services, customers, competitors and any other issues about the environment in which an organization operates or has interests in order to support top management's decision-making processes of the organization (https://ro.wikipedia.org/wiki/Competitivitate_prin_informa%C8%9Bie)
stakeholder relations may also become sources of competitive advantage companies such as Marks & Spencer, Benetton and Toyota have grown very close relationships with their suppliers and dealers, which contributed to the uniqueness of their products and sometimes vertical integration.
location can also be seen as an important source of competitive advantage, basic questions as which countries or what region to be chosen for the opening of a branch or even a factory and then what type of activity to be executed in each of locations. Sometimes cultural influences can tell in dramatic fashion word.
corporate social responsibility, corporate governance Interest shown for ethical or environmental sustainability can also be seen as sources of
competitive advantage. It adds its corporate governance. Good corporate governance is a powerful tool for increasing competitiveness, for developping
these practices and ensure compliance with the new requirements and trends, easily assimilating opportunities. A transparent decision-making process, based on clear and objective rules, enhances the confidence of shareholders in any company ensuring the protection of shareholders' rights, improving the overall performance of the company, providing better access to capital and risk prevention.
The organizational culture is also an important source of competitiveness for companies. Companies must develop a culture that reflects openness, accountability and focus on development orientation that aim to generate competitive advantages.
Measuring practice the level of competitiveness is considering interdependent factors which characterize (Tălmaciu Mihai, Mihai Costică, Îmbunăţăţirea competitivităţii firmelor printr-o strategie axată pe calitate, Analele ştiinţifice ale Universităţii Al. Cuza Iaşi, TOM LII/LIII, Ştiinţe Economice, 2005/2006)
profitability - the ability to earn money and make a profit; investing profits in the improvement and development activities; improve product quality while reducing costs; expand markets - due to a price / performance advantage for the consumer; increase production capacity and hiring new employees; adapting existing products to changing customer requirements, design and marketing of
new products. Modern management does not regard profit as an objective of the company, but as a means to
ensure the existence, development and economic and social goals which it has stability through customer satisfaction and society as a whole.
However profit performance remains a key indicator for the company and its competitiveness, regarded as a consequence of economic objectives - established social enterprise as a reward for success in a competitive market.

The USV Annals of Economics and Public Administration Volume 15, Issue 1(21), 2015
192
Table 1. Size of the competitiveness of the company The basis of comparison Indicators
1. Financial Competitiveness Size profit Ability to auto financing, loan amount and maturity Potential financial performance: Return on Equity Potential solvency: the ability to cope reimbursements
2. Competitiveness commercial The market, evolution of turnover, profitability threshold, position in the life cycle of each product Commercial reputation: brand image, customer loyalty, coherent range of products, the advertising budget
3. Human Competitiveness The skill labor, skill levels, absenteeism rate, enrollment rate
4. Competitiveness technique Nature equipment: seniority, performance Technical advances, the importance of research and development, the level of automation The supply relationships with suppliers, stock rotation
5. Competitiveness Management Profile leaders: age, experience, education, training Driving ability: ability command, the delegation, negotiation, the spirit of synthesis Value collaborators, team cohesion degree
6. Organizational Competitiveness Shape organizational structure, the number of hierarchical levels Nature delegating decisions, the degree of decentralization, the information flow The degree of integration of services to individuals and business objectives, how the completion of targets, the achievement of control, state social climate
Source: Dan Vasile, Strategii si structuri industriale competitive, All Educational, Bucureşti, 1997
2. THE PHARMACEUTICAL INDUSTRY - DEVELOPMENT AND GROWTH ASSUMPTIONS
Europe recognizes the link between health and growth and the importance of their role in
providing pharmaceutical industry. Given the fact that access to medicines directly determines the results of national health consequences related to life expectancy and quality of life standards and a considerable impact on productivity, innovation and competitiveness of a state, the European Union issued Motion for the third program of EU action on health (2014-2020), "Health for Growth" (Proposal for a Regulation of the European Parliament and of the Council establishing a program "Health for Growth", the annual program The EU action in the field of health for 2014-2020 http://eur-lex.europa.eu/legal-content/RO/TXT/?uri=celex:52011PC0709).
The program is geared towards actions with clear EU added value in line with the current policy objectives and priorities of the Europe 2020 strategy.
The Commission stressed that "promoting good health is an integral part of the objectives of smart and inclusive growth for Europe 2020. Keeping people healthy and active for longer has a positive impact on productivity and competitiveness. Innovation in healthcare helps to successfully addressing the challenge of sustainability in the sector in the context of demographic change".
Pharmaceutical companies contribute in a strategic manner to create jobs, education, innovation and financing system, playing an important role for growth and future competitiveness of nations. In fact one of the three industries ranked by the Statistical Office of the European Union (Eurostat) in group "High Technology", the pharmaceutical industry is characterized by high added value. Countries such as Ireland, with an added value of 777314 euros/employee are well above the European average (158453 euros/employee), opposite hovering Romania with only 33396 euro/employee. The High Technology category, according to Eurostat, enter high value-added products from aerospace, computers, electronics and telecommunications equipment, TV and radio,

The USV Annals of Economics and Public Administration Volume 15, Issue 1(21), 2015
193
pharmaceuticals, electrical equipment, armament industry, medical instruments, precision and optical, watches etc.
The pharmaceutical industry is highly globalized, with a particular business model (http://www.minind.ro/presa_2013/septembrie/Sinteza_consultari_Industria_produselor_farmaceutice_de_baza_25092013.pdf). Within the industry, Research, Development and Innovation (RDI) are vital, the world that concentrates the highest values of investments in research.
In this context, scholars such as(P. Kirkbride, in the work Globalization. The External Pressures, Ashridge: Ashridge School of Management, 2001, p. 251) argue that the pharmaceutical industry "has technological complexity, uncertainty of the future and long-term investments of the energy industry, but on the other hand, it has new product development challenges and pressures that resembles the consumer goods industry".
Europe faces new challenges in public health, scientific and economic by relating the (European Commission, Making Europe a center for safe and innovative medicines, http://ec.europa.eu/enterprise/newsroom/cf/_getdocument. cfm? DOC_ID = 3348):
globalization and internationalization growing sector of the value chain; Globalization offers challenges and opportunities. The emergence of new threats to global
health, such as an increasing number of counterfeit medicines or pandemic flu, the internationalization of the value chain and the rise of new actors in the global competition provide compelling reasons for stepping up international cooperation.
In this context two objectives are met: - Better health protection of EU citizens; - Improving the competitiveness of European companies by removing regulatory or non-
regulatory barriers which impede access to foreign markets and by ensuring fair international competition.
proper functioning of the internal market in an expanding Europe; The proper functioning of the EU internal market is also a major challenge for the future. As
regards regulatory issues, implementation and interpretation of Community law by Member States still create obstacles to the free movement of medicines. Excessive requirements also affect competitiveness, especially for small and medium enterprises, without always bringing public health benefits.
There is the possibility of better regulation, for example in the modification of existing authorizations and possibly clinical trials.
progress in science and technology Technologies, therapies and new drugs are emerging. This applies in particular regenerative
medicine, personalized treatments, and the development nanoterapiilor. This trend is already affecting the development strategy of EU companies, the industry structure - the creation of small and medium enterprises particularly innovative - concept clinical trials and the way medicines are prescribed. These should be gradually implemented within the EU pharmaceutical industry XXI century.
For companies that are on the market today, the stakes are enormous because powerful innovative products are needed that to fuel further growth and to cover losses caused by the expiration of patents or market protection. At the same time, small firms continue to specialize in different segments of the value chain, resulting in a fragmentation of power between big pharmaceutical companies and specialized firms.
They dominate in this area two business models (RB Helms, Competitive Strategies in the Pharmaceutical Industry, American Enterprise Institute for Public Policy Research, Washington DC, 1996). The first is companies specialized in activities that become key players in a segment of the value chain, such as product development, clinical trials and production. The second model is the specialized marketing firms that are integrated into the entire value chain about markets certain products, such as vaccines, HIV treatment, hormones or dermatology.
In preparation for future action, integrated pharmaceutical companies have at their disposal several strategic alternatives:

The USV Annals of Economics and Public Administration Volume 15, Issue 1(21), 2015
194
(Ciulu, Ruxandra, Abordări strategice în industria farmaceutică mondială, Revista Management-Marketing:http://www.managementmarketing.ro/pdf/articole/44.pdf)
1. are able to focus on specific parts of the value chain, such as cardiology, urology, central nervous system. This strategy will involve companies in a total organizational reform;
2. are able to opt for sections of the value chain, such as the discovery of compounds, product development, production and marketing and sales;
3. are able to continue the current strategy based on acquisitions and integrating new companies into their organizational structures.
PricewatehouseCoopers (PwC) (http://www.wall-street.ro/articol/Companii/99964/PwC-Companiile-farma-trebuie-sa-si-regandeasca-radical-lanturile-de-distributie.html#ixzz3f8yXcdlq) identified in his report, "Pharma 2020: Supplying the future. Which Path Will You Take? "As the challenge for the coming years that the pharmaceutical industry must radically rethink their supply chains to adapt to rapid market developments and the shift from product to patient. The same report states that "The growing importance of emerging markets, new medical therapies and environmental concerns are putting pressure on supply chains of pharmaceutical companies and there is a risk that many of these are discontinued. Accordingly, PwC believes that the next decade many companies will have to reassess from a strategic perspective and to radically change the model of production and distribution".
Regarding the economic crisis, some pharma sector analysts at Erste Group (www.erstegroup.com/de/Downloads/a160e563.../pi20090129-ro.pdf) consider its impact on the pharmaceutical business should be limited, even if EU markets will also witness a slowdown of their economy. This will be possible because the external indebtedness of pharmaceutical companies in the European Union remains fairly minimal and they can finance their investment plans without tapping financial markets, is not adversely affected by the current limited availability of resources lending. Secondly, regional currencies have continued their weakening trend, to the benefit of European Union pharmaceutical companies focused on export.
While EU markets have experienced crisis pharmaceutical companies' balance sheets Union remained solid, with substantial cash. Generics will keep their status as drugs of choice in European Union countries, and preference will get even more in the West. According to Erste Group analysts, generic drug consumption is about to grow even in times of crisis, as cheaper generic drugs will become increasingly attractive to health insurers, becoming more cost both in East and in the West.
3. PHARMACEUTICAL INDUSTRY IN ROMANIA Regarding drug market in Romania, 2013 was a favorable one. Even in an economic crisis,
while other areas recorded heavy losses, plus the pharmaceutical industry has remained and continues to grow at a sustained pace, according to specialists.
Besides the pharmaceutical industry has become a strategic sector for the Romanian economy being included in the National Strategy for Competitiveness 2014-2020, under which the country's strategic priorities set out in this document are intended to create the conditions that Romania can compete effectively with the rest European countries (National Competitiveness Strategy 2014-2020.(http://www.minind.ro/%5C/strategie_competitivitate/Strategia_Nationala_de_Competitivitate_iunie_2014.pdf)
If in 2008 the pharmaceutical industry was considered to be focused on producing generic and not very competitive, the situation seems to have evolved over time, becoming the sector with competitive potential, smart specialization.
Studies conducted recently (http://www.lawg.ro/files/assets/userfiles/files/Industria%20Farmaceutica%20din%20Romania.pdf) it shows that the pharmaceutical industry has seen considerable growth over the last decade in all its segments, reaching to contribute more than 1% to the GDP. Although local manufacturers of drugs are in a minority, they have expanded capabilities production, while the big players in the pharmaceutical industry in Romania have entered the market by acquiring local manufacturers or by

The USV Annals of Economics and Public Administration Volume 15, Issue 1(21), 2015
195
opening representative offices. The total number of drug manufacturers market presence is significant in Romania (184), but the top 10 players, depending on the volume of sales, controls almost 60% of this market. The market drug distribution is restricted to a small number of players despite the difficulties encountered by the pharmaceutical industry since the beginning of the crisis of 2008 have continued to invest in expanding storage capacity.
In terms of sales dynamics, the same study reveals that medicines subject to prescription (RX) gained a larger share of total retail sales, up from 79% in 2005 to 84% in 2011, representing a total 1.9 billion. Drugs without prescription (OTC) lost market share in favor of RX drugs, reaching a total of 0.35 billion in 2011, which equals a 16% share in total retail sales. Innovative medicines represent over 70% of value sales and only 25% by volume, while generics represent 30% of total market value and 75% by volume. Data on generics market in Europe suggests, moreover, that Romania is in fifth place after Poland, Slovakia, Germany and Slovenia in terms of market share of generic medicines. The imports of pharmaceutical products are the main source for domestic consumption of drugs. Price differences of RX drugs which appear between countries led to a parallel increase in exports, particularly for pharmaceutical distributors.
4. PHARMACEUTICAL COMPANIES COMPETITIVENESS OF ROMANIAN This report aims to brief the addition radiography pharmaceutical field in Romania,
highlighting the evolution of four Romanian companies, in terms of competitiveness in 2009-2013. Currently (at the time of the research) at the Bucharest Stock Exchange listed companies
Antiobiotice SA Iaşi, Biofarm S.A. Bucharest, Zentiva SA (formerly called Sicomed) and Farmaceutica Remedia SA, the only company in Iasi Romanian society where the state is still the majority shareholder.
Table 2. Top 10 Romanian companies for 2013 Company name County Employees Net turnover Net income
TERAPIA S.A. Cluj 801 500629696 109059553 ANTIBIOTICE S.A. Iaşi 1465 318625015 31380855 ZENTIVA S.A. Bucureşti 484 290362767 40297608 SANDOZ S.A. Mureş 257 268037485 21849078 LABORMED-PHARMA S.A. Bucureşti 235 141782355 -17969560 GEDEON RICHTER ROMANIA S.A. Mureş 544 119175198 -44192159 BIOFARM S.A. Bucureşti 360 119072518 25581079 BIO EEL S.R.L. Mureş 165 112690579 1337923 INFOMED FLUIDS S.R.L. Bucureşti 409 110651746 3451357 ROMPHARM COMPANY S.R.L. Ilfov 263 98005719 2320132
Source: http://www.med-farm.ro/top-10-companii-farmaceutice-din-romania-2013-an-favorabil-pentru-piata-medicamentelor/
Hierarchies change in 2014, as follows:
Table 3. Top 10 Romanian companies for 2014 Company name County Employees Net turnover Net income
TERAPIA S.A. Cluj 859 521047272 86105757 EUROPHARM S.A. Braşov 213 426324960 -9104204 ZENTIVA S.A. Bucureşti 488 394072623 54242886 ANTIBIOTICE S.A. Iaşi 1465 320058303 31138739 SANDOZ S.A. Mureş 270 307301739 10904722 BIO EEL S.R.L. Mureş 165 140726524 2170440 LABORMED-PHARMA S.A. Bucureşti 241 136686016 -20130437 BIOFARM S.A. Bucureşti 380 128508056 26559851 INFOMED FLUIDS S.R.L. Bucureşti 418 115750485 1877062 GEDEON RICHTER ROMANIA S.A. Mureş 548 114021588 -56920366
Source: http://www.risco.ro/suport/comunicate-risco/evolutia-pietei-de-produse-farmaceutice-2014-top-10-companii-92

The USV Annals of Economics and Public Administration Volume 15, Issue 1(21), 2015
196
The situation Antibiotice, Iasi, listed on the Bucharest Stock Exchange, the size and dynamics of turnover, the operating result, the net result and the average number of employees is shown in the following table.
Table 4. Situation company Antibiotice, Iaşi
Company Indicators The period of analysis
2009 2010 2011 2012 2013
Antiobiotice S.A.
Net turnover (lei) 219754104 243626062 281847455 304731950 318625024 Indices of evolution (%) 100 110.86 115.69 108.12 104.56 Operating profit (lei) 26172761 30562500 32062861 44191919 52297136 Indices of evolution (%) 100 116.77 104.91 137.83 118.34 Operating margin (%) 11.91 12.54 11.38 14.50 16.41 Absolute deviation (%) 0 0.63 -1.17 3.13 1.91 Net profit (lei) 11916807 12539100 20298909 27110836 31380856 Indices of evolution (%) 100 105.22 161.88 133.56 115.75 Net margin (%) 5.42 5.15 7.20 8.90 9.85 Absolute deviation (%) 0 -0.28 2.06 1.69 0.95 Average number of employees 1430 1441 1450 1465 1465 Indices of evolution (%) 100 100.77 100.62 101.03 100.00 Labour productivity 153674.19 169067.35 194377.55 208008.15 217491.48 Indices of evolution (%) 100 110.02 114.97 107.01 104.56 The average salary/employee 33997.89 35365.05 36937.69 36675.68 37742.39 Indices of evolution (%) 100 104.02 104.45 99.29 102.91 The average expenditure (‰) 929.30 929.71 912.75 899.45 898.82 Market share (%) 9.35 8.86 10.15 9.77 11.01 Added value 109803815 147639567 170426273 184358122 203450879 Indices of evolution (%) 100 134.46 115.43 108.17 110.36
Source: Information retrieved and processed on site Bucharest Stock Exchange (http://www2.bvb.ro/), www.antibiotice.ro and Ministry of Finance (www.mfinante.ro)
Antibiotice, the most important Romanian producer of generic drugs, has the mission to
transform valuable treatments in a more accessible way to improve the quality of life. The portfolio of 137 drugs covering a range of therapeutic areas, product development
strategy is focused today on drugs in classes cardiovascular, infectious and central nervous system (http://www.antibiotice.ro/companie.php).
The results recorded by the company the entire period confirms the upward evolution that the company has pursued despite difficult market condition in the onset of the global economic downturn.
The turnover shows an increase to another, reaching its peak at the end of 2013 (318625024 RON), which confirms the viability of the core business market.
It is worth mentioning that there is a decrease in the duration of storage of goods in the market through careful management structure of the product portfolio both at entry and exit of the pharmacy.
The products that define the company's core business, such as Ampicillin and Amoxicillin capsules or tablets - Ciproquin (ciprofloxacin), Ranitidine and Erythromycin recorded an upward trend in market share relative to its main competitors and amid a reference markets regressing.
According to data from the table above, operating profit and the net also had positive developments during that period, peaking in 2013, the 5229713610 lei and 31380856 lei, up by 18.34% or 15.75% compared to 2012.
The achievment of this economic performance was possible by implementing the management team of the company, since mid-2008, a plan of measures to streamline the business and reduce costs, which aimed to increase business profitability.
These measures may include:

The USV Annals of Economics and Public Administration Volume 15, Issue 1(21), 2015
197
the implementation of a cost reduction plan which aimed to reduce material expenses of any nature, without affecting the pharmaceutical industry-specific manufacturing standards, product quality or safety of employees. This plan resulted in reduced fuel consumption and utilities (electricity - 15%, gas - 21% and drinking water - 22%, fuel - 23%) in the first quarter of 2009 by approximately 14% over the same period 2008 and raw material costs fell 20%.
the hiring freeze and redeployment of staff within the company, including through appropriate channels promoting hardworking staff who graduated from higher education.
adjusting the number of staff from 1624 employees at the end of the first quarter of 2008-1480 at the end of March 2009 by boosting voluntary termination of the collective work and retirement demand, which led to a reduction in salary costs over 7%.
improving the collection rate of the graphics market by establishing staggered payments, the insurers cover claims related tools customers and expanding domestic insurance policies for risk of default external clients.
The effects of these measures are already visible in the first quarter of 2009, they began to produce effects both in terms of profit growth and cash flow.
Trading Antibiotice (ATB) on the Bucharest Stock Exchange and inclusion in the index BET-XT (which reflects the evolution of prices of the most liquid 25 companies), BET-Plus (which includes companies listed on BSE Romanian who meet the minimum criteria Selection excluding investment companies) and BET-BK (which reflect price trends shares issued by domestic and foreign companies traded on the BVB regulated market) reflects the fact that it is a solid, competitive, developed on a sound economic trainic.
Maintaining between pharmaceutical manufacturers brands in Romania and internationally favorable development was possible due to the continuous investments in manufacturing technology, employee training and obtain certificates valued internationally recognized quality.
Recognition performance at national level has resulted in obtaining 2014 1st place for the fifth consecutive year in the category "large enterprises industry-based pharmaceuticals", a top compiled by The Chambers of Commerce in Romania. Also, Antibiotice received for the sixth consecutive Trophy and Diploma of Honor from the National Association of Exporters and Importers in Romania, in its capacity as the largest exporter worldwide of Nystatin, having the most diverse Export offers of drugs.
The balanced growth in turnover and profit, based on a well defined business plan, supported by five pillars of development that determine the future development of the company, confirmed that Antibiotice is a competitive player in national and international pharmaceutical landscape.
Biofarm situation, listed on the Bucharest Stock Exchange, the size and dynamics of turnover, the operating result, the net result and the average number of employees is shown in the following table.
Table 5. Situation company Biofarm, Bucharest
Company Indicators The period of analysis
2009 2010 2011 2012 2013
Biofarm S.A.
Net turnover (lei) 67108836 82294885 93443090 104970886 119072520 Indices of evolution (%) 100 122.63 113.55 112.34 113.43 Operating profit (lei) 13711173 16934705 15707018 16416857 22587898 Indices of evolution (%) 100 123.51 92.75 104.52 137.59 Operating margin (%) 20.43 20.58 16.81 15.64 18.97 Absolute deviation (%) 0 0.15 -3.77 -1.17 3.33 Net profit (lei) 19636090 14414793 14220788 21036200 25581080 Indices of evolution (%) 100 73.41 98.65 147.93 121.61 Net margin (%) 29.26 17.52 15.22 20.04 21.48 Absolute deviation (%) 0 -11.74 -2.30 4.82 1.44 Average number of employees
343 343 362 340 360
Indices of evolution (%) 100 100.00 105.54 93.92 105.88

The USV Annals of Economics and Public Administration Volume 15, Issue 1(21), 2015
198
Labour productivity 195652.58 239926.78 258130.08 308737.90 330757.00 Indices of evolution (%) 100 122.63 107.59 119.61 107.13 The average salary/employee
29804.57 32344.79 31012.24 37620.70 38942.58
Indices of evolution (%) 100 108.52 95.88 121.31 103.51 The average expenditure (‰)
692.26 796.66 828.86 788.01 766.60
Market share (%) 2.85 2.99 3.36 3.37 4.11 Added value 33625751 49904027 52401029 61247835 69277943 Indices of evolution (%) 100 148.41 105.00 116.88 113.11
Source: Information retrieved and processed on site Bucharest Stock Exchange (http://www2.bvb.ro/), www.biofarm.ro and Ministry of Finance (www.mfinante.ro)
With a tradition of over 90 years in the Romanian pharmaceutical industry with a portfolio of
over 200 products, Biofarm covers 61 therapeutic areas and continuously invests in media campaigns, commercial and marketing to promote their products.
During 2013, Biofarm has maintained market trend and kept its position among the top 10 Romanian producers in terms of sales in stores.
With a stable position on the Romanian pharmaceutical market, Biofarm and improving its position in the international arena. At the moment, Biofarm is present in 12 countries, with an export value growth of 53% in 2013 compared to 2012 and aims expanding in the near future.
The turnover of the company is primarily from sales of finished products directly to pharmaceutical distributors, the internal market, the point of sale steward Tăutu Street, no. 99, Bucharest.
Turnover growths throughout the period, the highest value recorded in 2013 of 119072520 lei. Operating profit and net profit recorded oscillatory developments in the period. Despite record operating margin and net margin developments oscillators are above the sector average.
From 2010 Biofarm initiated a project for the distribution of its products directly to pharmacies in 2013 which led to an increase in sales through this distribution by 48% compared to 2012.
The company's development strategy includes improving the company's presence in the retail market, further development of the sales force and increasing the number of products. Continued investments in research, launch and promote their products will help strengthen the company's position in the market.
The research - development Biofarm aims to strengthen the market position of pharmaceutical products both quantitatively and qualitatively. The launch of new products and improving portfolio are key points of the development strategy of the company. To improve its position both domestically, as well as internationally, Biofarm aims to develop and launch about 10 products every year. In 2013 the formulas were developed 20 new drugs and dietary supplements and have been obtained marketing authorization for six new products.
Zentiva situation, listed on the Bucharest Stock Exchange the size and dynamics of turnover, the operating result, the net result and number of employees, it is shown in the following table:
Table 6. Situation company Zentiva, Bucharest
Company Indicators The period of analysis
2009 2010 2011 2012 2013
Zentiva S.A.
Net turnover (lei) 175765574 259644377 235648166 242491029 290362752 Indices of evolution (%) 100 147.72 90.76 102.90 119.74 Operating profit (lei) -10270467 62929082 38020442 37381079 50578068 Indices of evolution (%) 100 -612.72 60.42 98.32 135.30 Operating margin (%) -5.84 24.24 16.13 15.42 17.42 Absolute deviation (%) 0 30.08 -8.10 -0.72 2.00 Net profit (lei) -2882789 57377448 33857309 32181076 40297608 Indices of evolution (%) 100 -1990.35 59.01 95.05 125.22

The USV Annals of Economics and Public Administration Volume 15, Issue 1(21), 2015
199
Net margin (%) -1.64 22.10 14.37 13.27 13.88 Absolute deviation (%) 0 23.74 -7.73 -1.10 0.61 Average number of employees
691 585 555 531 484
Indices of evolution (%) 100 84.66 94.87 95.68 91.15 Labour productivity 254364.07 443836.54 424591.29 456668.60 599923.04 Indices of evolution (%) 100 174.49 95.66 107.55 131.37 The average salary/employee
52088.48 61677.41 62323.73 65894.04 73169.71
Indices of evolution (%) 100 118.41 101.05 105.73 111.04 The average expenditure (‰)
1003.55 744.27 830.94 846.20 830.15
Market share (%) 7.48 9.45 8.48 7.77 10.03 Added value 62105104 142407929 157366572 129301554 137458104 Indices of evolution (%) 100 229.30 110.50 82.17 106.31
Source: Information retrieved and processed on site Bucharest Stock Exchange (http://www2.bvb.ro/), www.zentiva.ro and Ministry of Finance (www.mfinante.ro)
ZENTIVA (http://www.zentiva.com/about-us/Documents/2004_EN.pdf. p. 4), one of the
largest generic pharmaceutical companies in Central and Eastern Europe, focuses on the development, production and marketing of new versions of branded generic pharmaceutical products which the company believes can be successfully introduced in the markets of Central and Eastern Europe. The company is market leader in the Czech Republic, Romania and Slovakia and its importance increases rapidly in Poland, Russia, Bulgaria, Ukraine and in the Baltic countries.
Regarding the growth of turnover, it records the entire period increases (less than in 2011), reaching its peak at the end of 2013 (290362752 RON).
The operating result has an oscillating evolution, reached a peak in 2010 (62929082 lei), continued to decrease in the next two years.
In terms of net result, there is a loss in 2009 (-2882789 lei), followed by profit in the future. Regarding human resources, there is a decrease in the average number of employees during
the entire period of analysis, caused by the global economic recession. The company's strategy is built around a number of key elements, namely
(http://www.zentiva.com/about-us/Documents/2004_EN.pdf. p. 6): rank bringing innovative brand generic drug market; promotion of these products to primary care through a highly trained sales force that is
able to educate this market about the value of these new drugs; cooperation with healthcare providers in the countries where it works to expand the
primary care market. These benefits increase the number of patients who have access to modern therapy without significantly increasing healthcare costs;
focus on cost competitiveness. In the last three years the Bucharest factory has undergone a process of investment of 12
million Euros in new technologies and cost optimization. The situation Farmaceutica Remedia was listed on the Bucharest Stock Exchange, the size
and dynamics of turnover, the operating result, the net result and number of employees, it is shown in the following table:
Table 7. Situation company Farmaceutica Remedia, Deva
Company Indicators The period of analysis
2009 2010 2011 2012 2013
Farmaceutica Remedia
S.A.
Net turnover (lei) 154401289 182561836 203467822 237446333 237835520 Indices of evolution (%) 100 118.24 111.45 116.70 100.16 Operating profit (lei) 5138892 3533326 5568914 6762860 3609909 Indices of evolution (%) 100 68.76 157.61 121.44 53.38 Operating margin (%) 3.33 1.94 2.74 2.85 1.52

The USV Annals of Economics and Public Administration Volume 15, Issue 1(21), 2015
200
Absolute deviation (%) 0 -1.39 0.80 0.11 -1.33 Net profit (lei) 918157 1959398 4077449 5553843 3013374 Indices of evolution (%) 100 213.41 208.10 136.21 54.26 Net margin (%) 0.59 1.07 2.00 2.34 1.27 Absolute deviation (%) 0 0.48 0.93 0.34 -1.07 Average number of employees
398 415 395 424 447
Indices of evolution (%) 100 104.27 95.18 107.34 105.42 Labour productivity 387942.94 439908.04 515108.41 560014.94 532070.51 Indices of evolution (%) 100 113.40 117.09 108.72 95.01 The average salary/employee
26458.91 27873.94 31760.97 36016.79 33650.82
Indices of evolution (%) 100 105.35 113.95 113.40 93.43 The average expenditure (‰)
991.64 984.86 973.77 971.49 985.57
Market share (%) 6.57 6.64 7.33 7.61 8.22
Added value 24666779 25789431 30141060 32098886 27792438 Indices of evolution (%) 100 104.55 116.87 106.50 86.58
Source: Information retrieved and processed on site Bucharest Stock Exchange (http://www2.bvb.ro/), www.remedia.ro and Ministry of Finance (www.mfinante.ro)
Farmaceutica Remedia (http://www.remedia.ro/wp-content/uploads/2014/05/raport-anual-
CA-2013-consolidat.pdf, p. 3) is present on the market with a network of eight centers logistics, a chain of 73 pharmacies and local distribution, integrated with selling drugs activities, health promotion and marketing, having a market share of medicines and products market frmaceutice below 2%.
The company's mission (http://www.remedia.ro/companie/misiune/) is to promote and launch innovative concepts pharmaceutical business, providing quality health services adapted to the needs of customers; respecting international standards of ethics and professionalism.
The company continued during 2013 ongoing process of refurbishment and logistic centers both in their pharmacies, consisting of both facilities with new equipment (furniture, by car, computers) and the continuous improvement of both software systems used (http://www.remedia.ro/wp-content/uploads/2014/05/raport- 2013-CA-year consolidat.pdf, p. 6).
Turnover growths throughout the period, with different growth rates, the most significant being recorded in 2010 by 18.24%.
Operating margin recorded an upward trend in 2009-2012, followed by a fall of 1.33% in the last year of analysis, hovering well below the sector average, without putting the company in difficulty.
Net margin recorded an upward trend in 2009-2012 due to the fact that the growth rate of net profit growth rate ahead of the turnover, followed by a fall of 1.07% in the last year of analysis, reaching 1.27%, which is below the sector average.
Shopping online has a strong upward trend in urban population and therefore during the previous year was implemented a new platform for online sale (e-shop) for increasing the number of visitors and to shorten the time of order.
Farmaceutica Remedia continued during 2013 and the ongoing process of revamping both logistics centers and in their own pharmacies that consisted in the equipment with new equipment (furniture, by car, computers) and in the continuous improvement of both software systems used.
As elements of perspective on the company's activity is envisaged that there was a high probability that in the first half of 2014 the financial difficulties of independent pharmacies - customers Farmaceutica Remedia - to emphasize. In this context, the company will work with partners who offer guarantees priority for payment of goods purchased from Farmaceutica Remedia.
Given the above, in 2014 Farmaceutica Remedia will maintain a policy of accelerated collection of receivables from market including by offering additional discounts. Also, capital

The USV Annals of Economics and Public Administration Volume 15, Issue 1(21), 2015
201
expenditures will be made strictly on the basis of the investment budget and within available funds, without affecting operational activity.
On the other hand, especially the difficulties encountered by independent pharmacies free, market opportunities direction to find new forms of collaboration, mergers and acquisitions.
5. PHARMACEUTICAL MARKET RISKS Among the factors influencing drug manufacturers affairs mention: the long service Receivable (250-300 days) and delayed payments of invoices by the
National Health Insurance; the setting a fixed exchange rate to calculate the prices of medicines. For 2009 drug price
was calculated at an exchange rate of 4 lei for one euro, while the 2010 rate announced is 4.25. Drug manufacturers are thus disadvantaged if the national currency depreciates against the euro above 4.25. But winning at a rate euro/USD below 4.25;
new way of calculating the prices of medicinal products for manufacturers that provides basic selection of lower producer price of the same drug existing in the Czech Republic, Hungary, Greece, Bulgaria, Poland, Spain, Germany, Slovakia, Austria, Belgium, Italy and Lithuania. The minimum price selected is converted from euros to lei at a fixed exchange rate;
the claw-back system which requires three months once drug manufacturers to transfer tax equivalent government accounts for 11.5% of revenues (http://www.med-farm.ro/top-10-companii-farmaceutice-din-romania-2013-an-favorabil-pentru-piata-medicamentelor/).
The economic crisis in Romania has decreased the average growth rate of pharmaceutical companies, but the market value is estimated to grow because pharmaceutical companies are influenced to a lesser extent by economic cycles.
6. CONCLUSION At present, Pharmaceutical industry companies are divided into several areas (life sciences,
Healthcare, disease management), and recently appeared other new fields (biotechnology, genetic products, foodaceuticals). Fundamental changes in the pharmaceutical industry have led to an explosion of companies specializing in limited areas, generally in one or several sections of the value chain and an integrated firms attempt to advance the pace of transition.
In the new economy changes the role of pharmaceutical companies and some already emerging trends will increase. These relate to:
increase the number of specialists in biotechnology and research companies that companies will increasingly rely, which can provide new compounds licensed and partnerships;
specialized firms will increasingly focus on technologies that will lead to new research; rethinking of clinical trials and other product development functions; new alliances with companies in the healthcare system for the distribution of medicines. Romanian pharmaceutical sector can be characterized by dynamism expressed both in the
manufacturing sector and in the distribution, makers with an important contribution to increasing competition are composed of market growth and high profitability prospects of investment in production capacity or distribution units (http://www.analizeeconomice.ro/2013/04/analiza-pietei- Pharmaceutical-between-anii.html).
Romanian pharmaceutical companies are moving towards exports so as not to be affected too much by local market, "diseased" clawback tax high pressure or poor payment discipline, persisting (http://www.romanialibera.ro/economie/companii/sectorul-farmaceutic--o-investitie-sigura-pentru-romania-277058).
Specialists from Tradeville (http://www.tradeville.eu/despre-tradeville), financial investment services company with a successful history of over 19 years of capital market in Romania, recommends investors as part of a long-term portfolio should be allocated to the pharmaceutical

The USV Annals of Economics and Public Administration Volume 15, Issue 1(21), 2015
202
sector for, in the coming years, amid generalized aging of the population, application of medicaments for cardiovascular diseases, CNS or respiratory diseases will increase.
All four pharmaceutical companies, listed on the Bucharest Stock Exchange (BVB) were positive developments this year. So, "Antibiotice Iaşi" (ATB) has increased in early by 50%, followed by "Biofarm" Bucharest (BIO) -with 39%, Zentiva (SCD) - 30%, the lowest increase recorded a Farmaceutica Remedia (RMAH) - 12%. Brokers bring these positive developments are due financial results of companies, how, especially in the case of BIO and ATB securities exchanges on behalf of companies, made by their major shareholders (http://www.remedia.ro/companiile-farmaceutice-au-crescut-pe-fondul-schimburilor-intre-actionarii-strategici/).
For the future, product development portfolio, business internationalization, protecting working capital, human resource focus to increase competitiveness of the company, remain the cornerstones of the strategic development of the company Antibiotice (http://www.antibiotice.ro/investitori.php?sid=20).
Capitalization of three of the four companies fluctuates between 200 and 315 million, while the market value of Farmaceutica Remedia Deva is about 10 times lower. But Farmaceutica Remedia business volume is comparable to the sales of the other three companies. The explanation comes from the fact that the main activity of the company is Deva pharmaceutical products, while the other three companies are manufacturers of pharmaceutical products. As a result, the need to make investments in fixed assets and in research is higher for eventually (http://www.ziare.com/bani/bursa/tradeville-investitiile-in-sectorul-farmaceutic-recomandate-pe-termen-lung-1052968).
REFERENCES 1. Ciulu, Ruxandra, Abordări strategice în industria farmaceutică mondială, Revista
Management-Marketing, http://www.managementmarketing.ro/pdf/articole/44.pdf 2. Ciupagea, Constantin, coordonator, Direcţii strategice ale dezvoltarii durabile în
România, Institutul European din România, Studiul III, 2006, http://strategia.ncsd.ro/docs/comentarii/3_fc.pdf
3. Helms R.B., Competitive Strategies in the Pharmaceutical Industry, American Enterprise Institute for Public Policy Research, Washington D.C., 1996
4. Hugues, Kirsty, European Competitiveness, Cambridge University press, 1993, p. 5 5. Kirkbride, P., Globalization. The External Pressures, Ashridge: Ashridge School of
Management, 2001, p. 251 6. Schifko, Peter, Langage Economique, Service, Wien, 1989, p. 210 7. Stolojan, Theodor, Globalozare şi competitivitate, http://econ.unitbv.ro/ed/pag-
rom/cursuri_on_line/globalizare.html 8. Tălmaciu, Mihai, Mihai, Costică, Îmbunăţăţirea competitivităţii firmelor printr-o strategie
axată pe calitate, Analele ştiinţifice ale Universităţii Al. Cuza Iaşi, TOM LII/LIII, Ştiinţe Economice, 2005/2006
9. Vasile, Dan, Strategii şi structuri industriale competitive, All Educational, Bucureşti, 1997 10. *** Comisia Europeană - Annual Economic Report 11. *** Comisia Europeană, Transformarea Europei într-un centru pentru medicamente
sigure şi inovatoare, http://ec.europa.eu/enterprise/newsroom/cf/_getdocument.cfm?doc_id=3348 12. *** Propunere de Regulament al Parlamentului European şi al Consiliului privind Instituirea unui Program
„Sănătate pentru creştere economică”, al treilea program multianual de acţiune a UE în domeniul sănătăţii pentru perioada 2014-2020, http://eur-lex.europa.eu/legal-content/RO/TXT/?uri=celex:52011PC0709
13. http://ec.europa.eu/eurostat 14. http://ro.paradox.wikia.com/wiki/Competitivitatea 15. http://www.analizeeconomice.ro/2013/04/analiza-pietei-farmaceutice-intre-anii.html 16. http://www.antibiotice.ro/companie.php

The USV Annals of Economics and Public Administration Volume 15, Issue 1(21), 2015
203
17. http://www.antibiotice.ro/investitori.php?sid=20 18. http://www.archeus.ro/lingvistica/CautareDex?query=COMPETITIV 19. http://www.lawg.ro/files/assets/userfiles/files/Industria%20Farmaceutica%20din%20Rom
ania.pdf 20. http://www.med-farm.ro/top-10-companii-farmaceutice-din-romania-2013-an-favorabil-
pentru-piata-medicamentelor/ 21. http://www.minind.ro/%5C/strategie_competitivitate/Strategia_Nationala_de_Competitivi
tate_iunie_2014.pdf 22. http://www.minind.ro/presa_2013/septembrie/Sinteza_consultari_Industria_produselor_fa
rmaceutice_de_baza_25092013.pdf 23. http://www.remedia.ro/companie/misiune/ 24. http://www.remedia.ro/wp-content/uploads/2014/05/raport-anual-CA-2013-consolidat.pdf,
p. 3 25. http://www.remedia.ro/wp-content/uploads/2014/05/raport-anual-CA-2013-consolidat.pdf,
p. 6 26. http://www.tradeville.eu/despre-tradeville 27. http://www.wall-street.ro/articol/Companii/99964/PwC-Companiile-farma-trebuie-sa-si-
regandeasca-radical-lanturile-de-distributie.html#ixzz3f8yXcdlq 28. http://www.zentiva.com/about-us/Documents/2004_EN.pdf, 29. http://www.ziare.com/bani/bursa/tradeville-investitiile-in-sectorul-farmaceutic-
recomandate-pe-termen-lung-1052968 30. http://www2.bvb.ro/ListedCompanies/SecurityDetail.aspx?s=ATB&t=2 31. http://www2.bvb.ro/ListedCompanies/SecurityDetail.aspx?s=BIO&t=2 32. http://www2.bvb.ro/ListedCompanies/SecurityDetail.aspx?s=RMAH&t=2 33. http://www2.bvb.ro/ListedCompanies/SecurityDetail.aspx?s=SCD&t=2 34. https://ro.wikipedia.org/wiki/Competitivitate_prin_informa%C8%9Bie 35. www.erstegroup.com/de/Downloads/a160e563.../pi20090129-ro.pdf

The USV Annals
of Economics and
Public Administration
Volume 15,
Issue 1(21),
2015
204
A TERRITORIAL PROFILE OF PUBLIC EXPENDITURES AT LAU 2
LEVEL, FOR 2007-2013 PERIOD IN ROMANIA
SeniorresearcherCristinaLINCARU
NationalScientificResearchInstituteforLabourandSocialProtection‐INCSMPS,[email protected]
SeniorresearcherSperantaPIRCIOG
NationalScientificResearchInstituteforLabourandSocialProtection‐INCSMPS,[email protected]
SeniorresearcherVasilicaCIUCĂ
NationalScientificResearchInstituteforLabourandSocialProtection‐INCSMPS,[email protected]
SeniorresearcherDragaATANASIU
NationalScientificResearchInstituteforLabourandSocialProtection‐INCSMPS,[email protected]
SeniorresearcherBeatriceCHIRIAC
NationalScientificResearchInstituteforLabourandSocialProtection‐INCSMPS,[email protected]
Abstract: In view to improve the use of Cohesion policy resources more effectively and efficiently, we propose to explore
the achievements of Structural and Cohesion Funds in 2007-13 in Romania at NUTS 5 /LAU 2 level in rural and urban areas. The common reformed cohesion policy represented by the EU Regulation 1303/2013 proposes the integrated approach of territorial development. On this background the territorial unit of analysis is the local administrative unit as the smallest regional hub for integrated public policies, including cohesion policy as well. This analysis involves administrative data provided by MDRP – Regional Development and Public Administration Ministry, connected with socio-economic indicators provided by INS TEMPO.
The budgetary capacity of the LAU2 is evaluated using the spatial analysis applications according Anselin (2005, 2006 - using ARC GIS and GEODA software) for period 2007-2013.
The main result of this article is the territorial heterogenic profile of public expenditures at LAU 2 level with focus on expenditures on projects funded by external grants (irredeemable), useful input for regional policy efficient targeting, especially on the background of the Jobs – Growth - Investment Plan’s New EU Initiative. Looking at the big picture it is visible the higher the spatial heterogeneity tendency in terms of socio economic indicators than the terms of local budget indicators, when is applied the LISA clusters analysis.
Key words: public expenditures at local level LAU2; expenditures on projects funded by external grants
(irredeemable) at LAU 2 level, total incomes at LAU2 level, endogenous incomes total incomes at LAU2 level. JEL classification: H53, H72, O20
INTRODUCTION
This territorial profile of public expenditures associated to cohesion policy, using spatial
analysis tools, has its start point from The Sixth report on economic, social and territorial cohesion (2014) under the perspective "Investment for jobs and growth, Promoting development and good governance in EU regions and cities". This report describes the new role of the public expenditures in general and at regional and local level in special, following 2008's crises impact with a consequence in increasing the contribution of Cohesion Policy to public investment as share in total public investment in the Member States. The increasing importance share of public expenditures and public investment at regional and local level increases the responsibility of regional and local level of government administrative units in an integrated development strategic perspective (Regulation 1303/2013 of the EU Parliament and Council).

The USV Annals of Economics and Public Administration Volume 15, Issue 1(21), 2015
205
One approach is focused on Cohesion policy impact evaluation is provided by Martin Ferry in the report "The Achievements of Cohesion Policy: Evidence and Methodological Challenges from a EU10 Perspective". Author "include a range of perspectives and methodologies: assessing Cohesion policy's input in terms of: the reduction of regional disparities; contribution to growth and competitiveness (including at an EU level); impact in specific policy-fields. (Ferry, 2013, 1). Coccossis and Psycharis, Ed. (2008) presents The Greek Experience in cohesion policy implementation after 20 years, using some spatial analysis tools. As an example of regional pattern analysis Monastiriotis explores the spatial patterns and spatial heterogeneity across the regions at prefectures level: using "exploratory spatial data analysis (ESDA), the author explores the persistence of spatial clustering across socio-economic indicators through the application of simple statistical tests." (Monastiriotis, Coccossis and Psycharis, Ed. 2008, 16) The Greece spatial pattern identified indicates "that policy spill overs for interventions targeting spatial cohesion may be also limited" (Monastiriotis; Coccossis and Psycharis, Ed. 2008, 16). Another regional pattern analysis is made by Psycharis (2008) regarding the Public Spending Patterns - The Regional Distribution of Public Investment in Greece. This profile highlight the spatial spending pattern governments of period 1976-2005, to compare the changes (between) different periods and to try to explain whether redistribution of national wealth or other factors such as political ones could be held as sufficient evidence for explaining the pattern and its temporal changes." (Psycharis; Coccossis and Psycharis, Ed. 2008, 41)
Public expenditure programmes on regional level represents a debate topic exploited in Central and Eastern Europe. Problems of public expenditures programmes on regional level in Czech Republic is signalled by Šumpíková, Krbová et.al in 2004.- these findings fully support heavy criticism of the quality of public financial control and audit in Central and Eastern Europe". (Šumpíková, M., Krbová J., et.al., 2004, 323),
In Romania in 2014 Huşman analyses the local budget place in the general consolidate budget, exploring theoretical aspects regarding the new role of local budgets "in the context of constantly increasing the importance and impact of local budgets both on the economy at European and national level through the decentralization processes that are more intensely debated and implemented (Huşman, 2014, 105).
2. RESEARCH QUESTION
Our research is centred to realise an territorial heterogenic profile of public expenditures at
LAU 2 level with focus on expenditures on projects funded by external grants (irredeemable), useful input for regional policy efficient targeting, especially on the background of the Jobs – Growth - Investment Plan’s New EU Initiative, for 2007-2013 period in Romania.
The local public budget [1] is a management instrument for multilevel governance, regulated according to Law No. 273 of 29 June 2006 updated in 24 April 2014. Among the budget typology from the source point of view, the external non-refundable budget funds (introduced by the Emergency Ordinance 63/2010, becoming active since 1 January 2011 as indicated by the Art.1 (2) L237/2006) plays an important role from the policy cohesion perspective. We consider this category the best proxy for monitoring at LAU2 level the input of cohesion funds.
3. MODELS, VARIABLES AND DATA
3.1. SPATIAL DATA
The specific of spatial / geographic data is to link place (location), time and attribute.
(Fisher, Wang, 201, 2) Administrative and geographical data – area data: a. Area data are provided by Romania ESRI shape polygons that reflects territorial
description of LAU2 are regulated according Law 351/6th July 2001 regarding the National

The USV Annals of Economics and Public Administration Volume 15, Issue 1(21), 2015
206
Territory Arrangement Plan - spatially vectorised using the polygons areas for LAU2 described by ESRI Romania using Arc GIS Software. The territorial administrative units LAU2 level are represented in SIRUTA [2] code by municipality,
b. town, commune and County residence and are equivalent with NUTS5 level [3].
3.2. ATTRIBUTE DATA
Local budget data are provided by MDRAP / Finance Ministry: The execution of revenue and expenditures budgets of administrative-territorial units [4] is
reported at national level by the General Direction of Public Finance from the Finance Ministry at county level by the County Administration of the Public Finance annually at the 31’th of December. Our data source is provided by the MDRAP [5] site.
Variable on which is made the LISA spatial analysis, on which we calculated “high-high” (H-H), “low-low” (L-L), “low-high” (L-H), and “high-low” (H-L) clusters for 2013 in GeoDA (Anselin), are:
Expenditures (RON) in 2013 on projects funded by external grants at LAU2 level in Romania
Variables used to characterize the territorial profile of public expenditures at LAU 2 level, for 2007-2013 period in Romania: A1) Total incomes (RON) in years: 2007, 2009 and 2013 at LAU2 level; A2) Total endogenous incomes (RON) in the years: 2007, 2009 and 2013 at LAU2 level; A3) Total expenditures (RON) in the years: 2007, 2009 and 2013 at LAU2 level; A4) Expenditures (RON) in the years 2009 and 2013 on projects funded by external grants at LAU2 level
Socio-economic indicators (Romania, provided by INS) as attribute information B1) Number of LAU2 in the specific cluster type B2) Average number of employees in the years 2007, 2009 and 2013 at LAU2 level, FOM104D
INS TEMPO B3) Registered unemployed persons at the end of the month in the years: 2010 and 2013 at
LAU2 level, SOM101E INS TEMPO B4) Demography data 2011 Census Data INS –ESRI for the indicators: Total population, Total masculine population; Total feminine population; Total population aged 15-64 years old; Total masculine population aged 15-64 years old; Total feminine population aged 15-64 years old; B5) Number of persons that entered in a locality 2009 (*)-Total population which who arrived and proved to have ensured a dwelling in a locality in 2009: Settling of domicile (including external migration) by counties POP307A - TEMPO INS - Origin–destination flow.
3.3. MODELS
Our territorial profile of public expenditures is focused in direct relation with its specific subcomponent of expenditures on projects funded by external grants at LAU2 level in Romania through the instruments of spatial analysis. The spatial perspective is built in 5 steps of spatial analyse with the objective of spatial variation analyse and agglomeration tendency identification for the mentioned indicator:
1. Exploratory spatial data analysis (ESDA) procedures applying the tool Choropleth maps using the classification [6] scheme by natural breaks (Jenks) [7] in 5 classes, from the software ARC GIS 10.2.3 [8]. Using the Chrolopleth maps classification by natural breaks (Jenks) then the error distributions of the "error blanket" is homogenous on the mapped surfaces. This classification scheme allows the using of less than 7 classes of data. Each class of data “minimize the average deviation from the class mean, while maximizing the deviation from the means of the other groups. The method reduces the variance within classes and maximizes the variance between

The USV Annals of Economics and Public Administration Volume 15, Issue 1(21), 2015
207
classes. See (map no. 1) with expenditures (RON) in 2013 on projects funded by external grants at LAU2 level in Romania and by area of residence (urban/rural) are presented. The share of expenditures on projects funded by unrefundable external grants in total expenditures at LAU2 level (%) in 2013 in Romania and by area of residence (urban/rural) are presented in (map no.2);
2. Neighbourhood analysis / contiguity and spatial weighting technique used. Spatial relation conceptualization spatial LAG modelling is based on rook contiguity, first order type. Among the 3189 LAU2 with data there are 805 locations with 5 neighbours, 799 locations with 6 neighbours, 577 locations with 7 neighbours, 408 with 4 neighbours and 282 with 8 neighbours, summing a cumulative percent of 90.1%. The maximum number of neighbours is 16 and minimum 1 in 4 locations.
3. Analysis of global and local spatial autocorrelation is realised through the Moran‘s I [9] and LISA Local Indicators of Spatial Association Maps [10], local clusters highlighting in 2013 the spatial pattern for expenditures on projects funded by external unrefundable grants at LAU2 level. (Anselin, 2003,p.99)
It is evident a slight clustering tendency in 2013 while Global Moran I Index (Anselin 1995, 1996) =0.0220969 > 0. In this case, Global Moran’s I values are higher than its theoretical value E[I]= - 0.0003 indicates a significant correlation, corresponding to a total of 999 permutations, with a pseudo-significance level of p=0.027 є [0.27; 0.316] <0.32 (low confidence level of 68%. Based on the scheme of interpretation, Z score of Moran’s I є [0.1467; 0.3081] Sd=0.097 <1.65 Sd, we accept the null hypothesis and we conclude that the identified pattern is a result of chance.
We present in (map no. 3) the 4 clusters types that reflect 4 types of spatial autocorrelation: The high-high [HH] and low-low [LL] locations (positive local spatial autocorrelation) are typically referred to as spatial clusters, while the high-low [HL] and low-high [LH] locations (negative local spatial autocorrelation) are termed spatial outliers. While outliers are single locations by definition, this is not the case for clusters. It should be kept in mind that the so-called spatial clusters shown on the LISA cluster map only refer to the core of the cluster.” (Anselin, 2005, p.145) This agglomeration profile is obtained at LAU2 level in Romania at general Significance 0.05, for 999 permutation in (map no. 4.) LISA Cluster Map for expenditures (RON) in 2013 on projects funded by external grants and in (map no. 5). LISA Significance Map for expenditures (RON) in 2009 on projects funded by external grants.
4. Selection of LAU2 units included in HH and LL clusters types (Anselin 1995, 1996) [11] refers to the spatial clusters on the map refer to the core of the cluster. The cluster is classified as such when the value at a location (either high or low) is more similar to its neighbours (as summarized by the weighted average of the neighbouring values, the spatial lag) than would be the case under spatial randomness. The cluster itself extends to its neighbours. [12] The (maps no. 3 and no. 4) shows at least p<0.05 and 999 permutation HH and LL spatial clusters and HL and LH spatial outliers
5. Comparing the means of some relevant socio-economic indicators at LAU2 level in the period 2007 - 2013, differentiated by spatial variation and agglomeration tendency of the cluster level with national means and emphasis some tendencies. See for the LISA clusters express the spatial association tendency for “expenditures on projects funded by external grants (un-refundable) in 2013 in locations at LAU2 level the (table no. 1). A measure of spatial heterogeneity is expressed through ratio of local budget indicators means at national level to means by clusters type during 2007-2013 and (table no. 2). Measure of spatial heterogeneity expressed through the share calculated for means of some socio-economic means by clusters type in the means at national level during 2007-2012.
4. RESULTS AND DISCUSSIONS
Our first set of results is represented by the geo-visualisation for the Expenditures (RON)
in 2013 on projects funded by external grants at LAU 2 both in absolute terms in (map no. 1) and in relative terms in (map no. 2.) The natural groupings of the data values emphasis some break points

The USV Annals of Economics and Public Administration Volume 15, Issue 1(21), 2015
208
with relevance to policy budget projecting. In (map no. 1), is visible that the large majority of LAU2 locations execute expenditures on projects are funded by external grants (un-refundable) in 2013 are below 2.4 million RON / LAU2 and in (map no. 2) below 6.7% as a share in total expenditures/LAU2. The outliers look to appear in locations with expenditures on projects that are funded by external grants (un-refundable) over the 27.8 million RON / LAU2 visible in (map no. 1) and over 21.3% as a share in total expenditures /LAU2 as it is visible in (map no. 2).
The second set of results is represents by the description of spatial dependence / spatial association characteristic for execute expenditures on projects are funded by external grants (un-refundable) at LAU2 level in 2013. In purpose to keep the full spectrum of diversity we identified with a low significance level (p<0.05) the locations included in clusters and outliers according (Fisher, Wang, 2011 p.15). In (map no. 3) are presented the LISA cluster map with 40 HH locations as nucleus for clusters with positive externalities and 42 LL locations as nucleus for clusters with negative externalities. There are identified 123 LH outliers type locations and 51 HL outlier’s locations. In (map no. 4) are presented the LISA significance levels for the locations included in LISA
Map no. 1. Map no. 2. Expenditures (RON) in 2013 on projects funded by external grants at LAU2 level in Romania and by area of residence (urban/rural). Map classification by Natural Breaks (Jenks) in 5 classes
The share of expenditures on projects funded by external grants in total expenditures at LAU2 level (%) in 2013 in Romania and by area of residence (urban/rural). Map classification by Natural Breaks (Jenks) in 5 classes
Map no. 3. Map no. 4. LISA Cluster Map for expenditures (RON) in 2013 on projects funded by external grants at LAU2 level in Romania. [Cpffen2013] Significance 0.05, Number of permutation 999
LISA Significance Map for expenditures (RON) in 2013 on projects funded by external grants at LAU2 level in Romania

The USV Annals of Economics and Public Administration Volume 15, Issue 1(21), 2015
209
Legend NotSig. High-High Low-Low Low-High High-Low Not Sig. p=0,05 p=0,01 p=0,001 p=0,0001
2933 40 42 123 51 2933 179 50 27 0
Source: Own elaboration using data from MDRAP, INS-TEMPO and ESRI-RO Cluster Map. From the 179 locations with a significance level of p<0.05 there are 50 locations with a significance level of p=0.01 and respectively there are 27 locations with a significance level of p<0.001.
The locations with HH cluster type for expenditures are mostly in rural area, with high level of p< 0.01 level of significance are entirely communes. We mention for 2013 this type of cluster in county Gorj Comuna Hurezani and comuna Stoina, in county Vaslui/ Comuna Dimitrie Cantemir and Comuna Hoceni, in county Mures there are included in the list the following communes: Papiu Ilarian, Ceuasu de campie and Band, and not least in Salaj counthy the Comuna Sanmihaiu Almasului. With the same level of significance we point out the the only one center of LL cluster for comuna Ruginoasa from county Neamț. The 3rd set of results reflects the spatial heterogeneity of the attributes of location included in the identified cluster by the LISA for Expenditures (RON) in 2013 on projects funded by external grants at LAU 2 level. For each type of location (HH, LL cluster, HL or LH outlier or not significant) at national level and at rural area are calculated the following aggregate characteristics for local budget and for some socio economic indicators: mean, the share of each category in total sum, the Standard Deviation and the Standard Error of Mean.
In synthesis our territorial heterogenic profile of public expenditures at LAU 2 level with focus on expenditures on projects funded by external grants (irredeemable) is presented in (table no. 1 and no. 2). According with the structure of clusters identified the national mean for any indicator (from the mentioned list) is very close to the means of location included in NS (Not Significant) clusters. A measure of spatial heterogeneity is presented in (table no. 1) as the ratio of local budget indicators means at national level to means by clusters type during 2007-2013 and in (table no. 2) as the share calculated for means of some socio-economic means by clusters type in the means at national level during 2007-2012 (according with the best existing data).
Table no. 1. Measure of spatial heterogeneity calculated as a ratio of local budget indicators
means by clusters type (NS, HH, LL, LH and HL for the means corresponding to the numbers by location type) to national level means (T for the total number of LAU2) during 2007-2013
[Ratio]
Indicator year Rural area location type average location
NS/ T
HH/ T
LL/ T
LH/ T
HL/ T
NS/ T
HH/ T
LL/ T
LH/ T
HL/ T
Total income
2007 1 0,9 1,1 1 0,9 1 0,7 2,1 0,8 1,1
2009 1 1 1,2 1 1 1 0,7 2,1 0,8 1
2013 1 3,7 0,4 0,3 2,8 1 4,1 0,4 0,4 2,7
Total endogenous incomes
2007 1 1 1,1 1 0,9 1 0,6 1,9 0,7 1,2
2009 1 1 1,2 1 1 1 0,6 1,9 0,7 1,1
2013 1 3,3 0,3 0,3 2,3 1 3,6 0,3 0,3 2,2
Total expenditures
2007 1 0,9 1,1 1 1 1 0,7 2,2 0,8 1,2
2009 1 1 1,2 1 1 1 0,7 2,1 0,8 1,1
2013 1 3,7 0,4 0,3 2,7 1 4,1 0,4 0,4 2,7
Expenditures on projects funded by external grants
2009 1,1 0,3 0 0 0 1,1 0,1 0,1 0 0,2
2013 0,9 7,4 0,1 0,1 3,3 0,9 8,2 0,1 0,1 3,4 Source: data calculated by authors, LISA clusters express the spatial association tendency for “expenditures on projects funded by external grants (un-refundable) in 2013 in locations at LAU2 level Note: all communes are included in rural area / average commune location type

The USV Annals of Economics and Public Administration Volume 15, Issue 1(21), 2015
210
Table no. 2. Measure of spatial heterogeneity expressed through the share calculated for means of some socio-economic means by clusters type
(NS, HH, LL, LH and HL for the means corresponding to the numbers by location type) in the means at national level (T for means corresponding to the total number of LAU2) during 2007-2012 [share %]
Indicator
year
Rural area location type average location
NS/ T
HH/ T
LL/ T
LH/ T
HL/T NS/ T HH/ T
LL/ T
LH/T
HL/ T
Average number of employees
2007 99,7 90,0 101,4 114,7 88,0 99,2 56,2 253,1 77,0 111,2 2009 99,7 96,5 107,5 108,1 95,9 99,3 55,7 239,9 76,4 119,4 2012 99,7 95,7 99,8 114,2 87,4 99,1 53,8 236,2 78,0 126,9
Registered unemployed 2010 100,9 95,6 110,4 84,4 84,1 99,9 91,7 193,2 80,9 82,6 2013 101,0 88,9 113,2 81,7 83,2 100,4 91,3 176,6 77,0 78,4
Total Population
T 2011 100,2 93,5 122,0 93,9 95,3 99,7 81,1 191,7 80,6 102,4 M 2011 100,2 93,8 121,6 93,8 94,5 99,7 82,0 191,0 80,8 101,5 F 2011 100,1 93,1 122,5 94,0 96,0 99,7 80,3 192,4 80,3 103,3
Population 15-64 years
T 2011 100,2 92,9 118,5 94,5 96,7 99,7 78,3 196,5 79,5 103,5 M 2011 100,2 93,2 118,9 94,6 95,8 99,7 79,6 194,2 80,1 102,5 F 2011 100,2 92,5 118,0 94,4 97,6 99,7 77,1 198,8 79,0 104,5
Persons entering in location 2009 100,0 88,2 110,2 99,4 102,9 100,1 67,2 200,5 74,5 99,1 Source: data calculated by authors, LISA clusters express the spatial association tendency for “expenditures on projects funded by external grants (un-refundable) in 2013 in locations at LAU2 level

The USV Annals
of Economics and
Public Administration
Volume 15,
Issue 1(21),
2015
211
In HH commune location type the expenditures on projects funded by external grants, un-
refundable are 7.4 times higher than national mean in 2013 (while the same ratio was only 0.3 in 2009), the total expenditures are 3.7 timed higher than national mean in 2013 (while this ratio was 0.9 in 2007 and 1 in 2009), total endogenous incomes are 3.3 times higher than national mean in 2013 (in 2007 and 2009 the national and HH commune mean were equal) and the total income is 3.7 times higher than national mean (in 2007 and 2009 the national and HH commune mean were equal).
In HH commune location or rural location type the mean values for the demographic indicators is much below the mean of the same indicators in the “average national rural location”, respectively this share is 93.5% for total population, 93.8% for masculine population, 93.1% for feminine population in 2011. For persons entering in a location in 2009 the share of mean in HH rural location type in the national mean location 95.7% is registered the lowest level compared with the other share of means by cluster type (LL, HL, LH, NS). In HH rural location type the mean values for the labour market indicators is also below the mean of the same indicators in the “average national rural location”, respectively this share is for population in working age 15-64 years in 2011 is 92.9% for total population, 93.2% for masculine population and 92.5% for feminine population, for the average number of employees in 2012 (decreasing from 96.5% in 2009 but increasing with 3.5pp comparing to 90% in 2007), is 88.9% for registered unemployed persons in 2013 (decreasing from 95.6% in 2010).
5. CONCLUSION
Looking at the big picture it is visible the tendency that the spatial heterogeneity for attributes in terms of socio economic indicators is higher than the terms of local budget indicators for the LISA clusters identified (HH, LL, HL, LH, NS) by the public expenditures on projects funded by external grants (non-refundable) criteria. The highest differences are registered between the HH and LL clusters locations, conserving the general tendency that the levels for budgetary indicators are inverse proportional variation to socio-economic indicators. The degree of spatial heterogeneity has a higher variation among the labour market indicators and especially by the dimension of LAU2 by population. Because of the high level of heterogeneity of urban areas (municipality, town and county residence) we presented only the results from rural areas – results more reliable and more homogenous.
Our research considers that the public expenditures on projects funded by external grants (non-refundable) outside the process of local budget balance procedure according to L273/2006 and working under the cohesion policy demands, subordinated to strategic objectives (cohesion policy, employment strategy, etc.).
This article is an attempt to fill the gap in Romania’s spatial processes identification in literature. The spatial processes understanding offers a useful instrument to the cohesion policy in identifying the barriers and opportunities in development.
The presence in the local budget of the external grants (irredeemable / non-refundable) as instrument to implement cohesion policy highlight the need to improve the public local expenditures management, on the background of integrated approach of territorial development requested by the 1303/2013 Regulation of the EU Parliament and Council.
ACKNOWLEDGMENT
This work was supported by a grant of the Romanian National Authority for Scientific
Research, UEFISCDI under the DYNAHU project (number PN-II-PT-PCCA-2011-3.2-0084).

The USV Annals of Economics and Public Administration Volume 15, Issue 1(21), 2015
212
ENDNOTES [1] According to Article 5/L273/2006 is presented the public local budget structure includes: “a) own revenue
[endogenous revenues/ incomes] consisting of: taxes, contributions and other payments, other income and allowances deducted from income tax; b) amounts deducted from certain income of the state budget; c) subventions received from the state budget and other budgets; d) donations and sponsorships; e) amounts received from the European Union and / or other donors made payments and pre-financing.”
[2] ***, Romania’s National Institute of Statistic (INS) – The National Interest Nomenclature Server – SENIN, Methodology SIRUTA –General Presentation, http://colectaredate.insse.ro/senin/classifications.htm?selectedClassification=SIRUTA_AN_2014&action=download
[3] NUTS - Nomenclature of Territorial Units for Statistics (Nomenclatorul unităţilor teritoriale pentru statistici la nivelul Uniunii Europone - Autoritatea de origină : Oficiul de Statistică al Uniunii Europene EUROSTAT)
[4] MDRAP’s data published on 17.12.2014 -http://www.dpfbl.mdrap.ro/sit_ven_si_chelt_uat.html, Romanian Ministry of Regional Development and Public Administration, Direction for Local Budget and Fiscal Policy is organized and is part of Ministry of Regional Development and Public Administration. Direction and operates under the General Direction of Public Administration under the Government Decision no. 1/2013 on the organization and functioning of the Ministry of Regional Development and Public Administration.
[5] http://www.dpfbl.mdrap.ro/sit_ven_si_chelt_uat.html [6] Smith, Goodchild, Longley, Univariate classification schemes in Geospatial Analysis—A Comprehensive
Guide, 3rd edition; © 2006–2009, http://www.spatialanalysisonline.com/HTML/index.html; [7] http://www.spatialanalysisonline.com/HTML/index.html [8] http://wiki.gis.com/wiki/index.php/Ecological_fallacy [9] http://help.arcgis.com/en/arcgisdesktop/10.0/help/index.html#//005p0000000t000000 [10] L. Anselin. Local indicators of spatial association | LISA. Geographical Analysis, 27:93{115, 1995. [11] Luc Anselin, GeoDa™ 0.9 User’s Guide, Spatial Analysis Laboratory, Department of Agricultural and
Consumer Economics University of Illinois, Urbana-Champaign, Urbana, IL 61801, http://sal.agecon.uiuc.edu/ and Center for Spatially Integrated Social Science http://www.csiss.org/, Revised, June 15, 2003, Copyright © 2003 Luc Anselin, All Rights Reserved
[12] Spatial Statistics: Spatial Autocorrelation, Workshop Exercise 1/24/2013, http://libraries.mit.edu/files/gis/spatial_auto_exercise_iap2013.pdf
BIBLIOGRAPHY
1. Anselin, L (2005) Exploring Spatial Data with GeoDaTM : A Workbook, Center for Spatially Integrated Social Science, Illinois, U.S.A; 2. Anselin, L., (1995) Local indicators of spatial association. | LISA. Geographical Analysis; 3. Anselin, L., (2002) Short Course Introduction to Spatial Data Analysis, ICPSR-CSISS, University of California, Santa Barbara June 24-28; 4. Anselin, L., (2003) GeoDa™ 0.9 User’s Guide, Spatial Analysis Laboratory, Department of Agricultural and Consumer Economics University of Illinois, Urbana-Champaign, Urbana, IL 61801, http://sal.agecon.uiuc.edu/ and Center for Spatially Integrated Social Science http://www.csiss.org/, Revised, June 15, 2003, Copyright © 2003 Luc Anselin, All Rights Reserved; 5. Ferry, M., (2013), “The Achievements of Cohesion Policy: Evidence and Methodological Challenges from an EU10 Perspective”, Growth-Innovation-Competitiveness: Fostering Cohesion in Central and Eastern Europe (GRNCOH); 6. Fischer, M.M., and Getis A., Ed. (2010), Handbook of Applied Spatial Analysis Software Tools, Methods and Applications, Springer; 7. Fischer, M.M., and Wang, J., (2011), Spatial Data Analysis, Models, Methods and Techniques. Springer, pp.13; 8. http://geodacenter.asu.edu/ 9. Huşman A.I., (2014), Rolul bugetelor locale în cadrul bugetului general consolidate, Coordonatorul lucrării, Lect. univ. dr. Lazăr Paula Colecţia de working papers, ABC-UL Lumii Financiare WP nr. 2/2014 10. Llloyd C. D., (2011), Local models for spatial analysis. Second edition, CRC Press, Taylor and Francis Group, pp.65 & pp.80;

The USV Annals of Economics and Public Administration Volume 15, Issue 1(21), 2015
213
11. Monastiriotis, V., (2008), The Geography of Spatial Association Across the Greek Regions: Patterns and Heterogenity, in Part I, Coccossis de H. and Psycharis, Y., Ed. (2008), Regional Analysis and Policy: The Greek Experience, Physica-Verlag, A Springer Company, 2008, pp.16., 12. Psycharis, Y., Ed. (2008), Public Spending Patterns: The Regional Distribution of Public Investment in Greece. In Part I, Coccossis de H. and Psycharis, Y., Ed. (2008), Regional Analysis and Policy: The Greek Experience, Physica-Verlag, A Springer Company, 2008, pp. 41; 13. Scott, L. M. And Janikas M.V., (2010), Spatial statistics in ArcGIS. Online available at. file:///C:/Users/Cristina/Downloads/9783642036460-c1.pdf, cited from Fischer, M.M., and Getis A.,(editors), 2010, Handbook of Applied Spatial Analysis: Software Tools, Methods and Applications, Springer, available at. http://www.spatialcapability.com/Library/Handbook_of_Applied_Spatial_Analysis.pdf, pp. 27-41; 14. Stewart,R. and Rogerson, P., (2005) Spatial analysis and GIS. Department of Geography, SUNY at Buffalo, Taylor and Francis, pp.1; 15. Šumpíková, M., Krbová J., Pavel, J., Nemec J. (2004), Selected problems of public expenditure programmes on regional level in the Czech Republic, Prague Economic Papers, 4, 2004, pp. 323; 16. *** Politica de coeziune 2014-2020. nvestiții în creștere economică și ocuparea forței de muncă, Uniunea Europeană, Politica de coeziune, http://ec.europa.eu/inforegio 17. ***, (2014), Romania’s National Institute of Statistic (INS) – The National Interest Nomenclature Server – SENIN, Methodology SIRUTA –General Presentation, Cohesion policy issues 18. ***, (2011), Ghidul instituţiilor administraţiei publice pentru îmbunătățirea procesului politicilor publice la nivel local, unitatea de politici publice ministerul administrației și internelor bucurești, 2011, pp. 30 19. ***, (2014) Descentralizarea financiar fiscală în România; evoluţie, concepte, perspective, http://www.dpfbl.mdrap.ro/articole.html 20. ***, (2014), Investment for jobs and growth, Promoting development and good governance in EU regions and cities, Sixth report on economic, social and territorial cohesion, European Commission, Brussels 2014, http://ec.europa.eu/regional_policy/cohesion_report 21. ***, (2014), Procesul Bugetar Local, http://www.dpfbl.mdrap.ro/articole/art_5_procesul_bugetar_local.pdf 22. ***, Criza financiară şi Insolvenţa unităţilor administrativ-teritoriale, http://www.dpfbl.mdrap.ro/articole.html 23. ***, L 273/ 29.06.2006, privind finanţele publice locale (actualizată până la data de 24 aprilie 2014), http://www.dpfbl.mdrap.ro/domeniul_finante_publice_locale.html#

The USV Annals
of Economics and
Public Administration
Volume 15,
Issue 1(21),
2015
214
IMPACT OF MARKETING STRATEGIES ON SACHET
PRODUCTS IN BANGLADESH
HossainShahidSHOHROWARDHYUniversityofChittagong,Bangladesh
H.M.KamrulHASSANUniversityofChittagong,Bangladesh
Abstract: A product is anything that can be accessible to the market for satisfaction. The basic objective of marketing is
maximum satisfaction since satisfaction of consumer and business performance is positively related to each other. For satisfaction, product is diversified in different categories i.e. generic product, product type product, substitute product and product line etc. Sachet product is one of the expansions of product line. The term ‘Sachet’ is originated from the French word which means “mini”. In Bangladesh, sachet product has a strong market share. Thus, this study attempts to determine the exiting share of sachet product and measure the impact of marketing strategies on sachet product in Bangladesh. This study uses the selective 22 dimensions to favor the sachet product on the basis of 4Ps (Product, Price, Place and Promotion). To accomplish the study, 125 samples have been taken from selective markets in Cosmopolitan city, Chittagong. The study found that sachet product has strong market position comparative with other categories of products, where promotional effect is the dominant factor who played the vital role to sustain the sachet product in Bangladesh. The results of this study will be constructive for executives and policy-makers of business organization who works with fast moving consumer good (FMCG) items effectively in Bangladesh.
Key words: Sachet Product, Sales-Profit Pyramid and Marketing Strategies. JEL classification: M31, L11 1. INTRODUCTION Consumers are the key element of product/service industry. Consumer satisfaction is the
prime enhancing factor of ‘revenue and profit’ generation. Consumers are predominantly attached with business in case of delivering different types of products or services (Nichols, 1998). Therefore, in order to get the competitive advantage (Porter, 2010), it is necessary to offer new dimension of products in the market which would assist in ensuring sustainability of the market performance of an organization. Sharma (2005) suggested that new dimension of product or service leads to the efficiency of consumer satisfaction and creates huge scope for business sustainability. Therefore, the innovated product, sachet is the current issue that lug apex priority in the field of sustainability of business performance of any organization in Bangladesh.
The French Word, ‘sachet’ means the mini. Application of sachet product is much better in developing countries like Bangladesh than developed countries (David, 2004). In Bangladesh, maximum company use sachet product concept in their business operation (Examples: Clear Shampoo Mini pricing with Taka 2). Sachet product is a powerful category to attract a huge number of consumers mainly for its price, size, packaging, user-friendliness, cost incentive, more profitable, attractive demonstration of sales etc (Granger and Billson, 1972; Wansink, 1996; Krishnan, 2001; Prahalad, 2004; Rundh, 2005; Crockett and Wallendorf, 2004; Ramirez, 2006; Lee,2006; Jardine, 2006; Santoz, 2006 and Sing, 2009). Sen (2001) suggested that scope of sachet product is included in the following fields i.e. Soap (Lux-mini), Biscuits, Aerated drinks (Coca-Cola and Pepsi-Cola), Toothpaste (Pepsodent-mini), Chocolate (Dairy Milk), Tea (Ispahani tea bag), Detergents (Surf Excel-mini), Wheat Flour (Atta-200 gms pack), Shampoo (Clear Tk.2), Grocery Items, Oil, Bread etc. Therefore, Sachet is identified as the micro form of existing product/s offered to the market for faster business performance both in consumers and company perspective. In Bangladesh, maximum people maintain their living standard below the poverty level that’s why government declares

The USV Annals of Economics and Public Administration Volume 15, Issue 1(21), 2015
215
Vision-21 to establish Bangladesh as mid-level country in the world. From the survey report, it is found that at present, Sachet product’s share is 94% of total sales volume, 59% of total sales amount, 75% of profit per unit and 96% of profit per gram. This study is supported by Prahalad (2004) and Hammond (2007). Now a day, all sorts of production oriented business organizations use sachet product concept in their business operation in Bangladesh.
2. STATEMENT OF THE PROBLEMS The problem of the study has been developed by an extrusive survey in different business
points in Chittagong city. It was found that business performance of sachet product market is much better than other product available in the market. We have conducted the survey to find the comparative market structure of sachet products on the basis of sales volume, sales price, cost price and profit (Wansink, 1996; Prahalad, 2004; Crockett and Wallendorf, 2004; Mahajan and Banga, 2006). 25 outlets are selected on the basis of transaction of business on the sample business points. We consider 30 sachet product from the area of Soap (Lux-mini), Biscuits, Aerated drinks (Coca-Cola and Pepsi-Cola), Toothpaste (Pepsodent-mini), Chocolate (Dairy Milk), Tea (Ispahani tea bag), Detergents (Surf Excel-mini), Shampoo (Clear Tk.2), Grocery Items, Oil, Bread etc to determine the .market position of sachet product. We explain the finding by using pyramid techniques i.e. sales volume pyramid, profit per unit pyramid, profit per mg pyramid and sales amount pyramid.
Pyramid-1 & 2 expresses the comparative position of sachet product and other product on the basis of sales volume and sales amount. It is worth mentioning here that sachet product market position is much better than other product. That indicates that sachet product position is 94% and 51% on sales volume and sales amount where other product position is 6% and 41% respectively.
Pyramid-3 & 4 expresses the comparative position of sachet product and other product on the basis of profit per mg and profit per unit. It would mention here that sachet product market position also better than other product. That indicates that sachet product position is 96% and 75%
6%
94%
Pyramid-1: Sales Volume
Other Product
Sachet Product
41%
59%
Pyramid-2: Sales Amount
Sachet Product
Other Product
25%
75%
Pyramid-3: Profit per Unit
Sachet Product
Other Product
4%
96%
Pyramid-4: Profit per mg
Other Product
Sachet Product

The USV Annals of Economics and Public Administration Volume 15, Issue 1(21), 2015
216
on profit per mg and profit per unit where other product position is 4% and 25% respectively. The above explanations create a question why consumer are habituated in using sachet product though their expenditure (Business Profit) level of living is going to be high in perspective of using sachet products than others. Then, the study attempts to determine the effect of marketing strategies i.e. 4Ps concept of marketing (Product Strategy, Pricing Strategy, Placing Strategy and Promotional Strategy) on the existing business performance of sachet product in Bangladesh.
3. THEORETICAL FRAMEWORK AND METHODS We developed a theoretical framework on the basis of evidence available in the above-
mentioned literature and market survey. At the first time, we conduct a survey to determine the share of sachet product. Secondly, we use another quarry behind the consumer tendency towards the sachet product tendency of consumers. In this perspective, dependent variable is consumer’s tendency on sachet product and independent variables are marketing strategies i.e. 4Ps expressed in Figure 1.
Figure 1: The Research Framework (Figure shows the imagination of effect of marketing
strategies on the business performance of sachet product in Bangladesh)
4. OBJECTIVES OF THE STUDY The broad objective of this study is to identify the market position of sachet product in
Bangladesh. The more specific objectives in this regards are as follows: 1. To identify the present market position of sachet product in Bangladesh. 2. To measure the level of effectiveness of marketing strategies on sachet product in
Bangladesh. 3. To analyze, the extent of dependence of 4Ps (Marketing Strategies) on business position of
sachet product in Bangladesh. 5. HYPOTHESES OF THE STUDY Considering the objectives of the study, the following operational hypotheses have been
developed and tested: H1: There is no market position of sachet product existed in Bangladesh. H2: There is no significant association among the components of 4Ps irrespective with sachet product in Bangladesh. H3: There is no significant dependency of the dimensions related to 4Ps on effect of performance of sachet product in Bangladesh.
6. DATA COLLECTION METHOD For this study, data was collected by using two self-administrative questionnaires. The first
questionnaire was used to determine the market position of sachet product in Bangladesh, specifically some selected points in cosmopolitan city, Chittagong. This survey questionnaire was

The USV Annals of Economics and Public Administration Volume 15, Issue 1(21), 2015
217
determinately used for businessman. The second questionnaire was used to measure the consumer perception on sachet product consisting of basic two sections. The first section has been designed to collect the information about the respondents regarding their demographic and socio-economic characteristics along with some other factors such as gender, sex, marital status, age, education, income level while second section consists of 22 dimensional questions with four constructs related with 4Ps to measure the effect of marketing strategies on the performance of sachet product available in Bangladesh. The responses of the respondents were collected by using the Likert non-comparative five-point scale of the range of attitude; from 1-strongly disagree to 5-strongly agree.
7. SAMPLING There are two types of questionnaire were used in this study. Firstly, a total of 50
questionnaires were distributed purposively to the businessman for determining the market position of sachet product comparative with other products consisting with basic four identity i.e. Sales volume, Sales amount, Voucher cost price, MRP then calculate the profit per unit and profit per gram. Secondly, a total of 200 questionnaires were distributed for measuring effect of marketing strategies on sachet product and out of them, only 125 questionnaires were received useable for analysis (63% response rate). Specifically, questionnaires were distributed to the selective consumers considering the shopping hour of the respective points of shopping (Usually from 4 PM to 10 PM) or their convenience time. However the data were collected from five (05) businesses points/shopping points of Chittagong i.e. New Market, Agora Super Store , Agrabad, Bohoddar Hat and Kornophulli Market.
8. STATISTICAL TOOLS USED IN THE STUDY FOR ANALYZING The statistical techniques were used in this study are as follows: descriptive and frequency
analyses were conducted to determine the market position of sachet product and represent the respondents’ demographic and socio-economic characteristic. In addition, reliability tests to check for the “internal consistency” of the questionnaire by applying Cronbach’s coefficient, Alpha. Normality distribution was tested using Skewness and kurtosis. Finally, Multiple Regression Model (MLM) is used in this study to measure the effect of 4Ps on the business performance of sachet product in Bangladesh.
9. RESULTS 9.1 RESPONDENTS’ DEMOGRAPHIC AND SOCIO-ECONOMIC PROFILE Consumer is the blood circulation of business organization. So, the demographic characters and socio-
economic profile must qualitatively qualify due to the proper justification of respondent’s responses. In this sturdy, the majority of respondents are males (57.06%) followed by female (42.94%) from which 82% are educated in which 18% respondents come from housewife group. It is worth mentioning here that 56% respondents are incorporated in this study whose expenditure level is more than BDT 30,000 per month.
9.2 RELIABILITY TEST The results of Cronbach’s alpha coefficient of all variables having multi dimensions item shows a moderate to very high coefficient ranging from 0.59 to 0.89.
Table-1: Shows the Cronbach’s alpha coefficient of constructs for reliability test
SL Marketing Strategies No. of Items Cronbach’s alpha coefficient 1 Product Strategy 7 0.716 2 Pricing Strategy 4 0.586 3 Placing Strategy 4 0.596 4 Promotional Strategy 7 0.697 Total Items 22 0.878
Source: Calculated by Authors

The USV Annals of Economics and Public Administration Volume 15, Issue 1(21), 2015
218
Table-1 explore the Cronbach’s alpha coefficient of constructs used in the study for measuring the normality of the data are found little bit lower to standard but in an acceptable form which is supported by earlier study 0.59 to 0.83 (Finn & Lamb, 1991).
9.3 DESCRIPTIVE STATISTICS Descriptive statistic is explained using mean, standard deviation, variance, skewness and
kurtosis.
Table-2: Shows the descriptive statistics of the variables/constructs used in the study
Variables/Constructs Mean STD Variance Skewness Kurtosis
Product Strategy (P1) 3.78 0.65 0.42 -0.30 0.30 Absolute Product (P11) 3.71 1.38 1.92 -0.77 -0.67 Innovated Product (P12) 3.74 1.02 1.03 -0.22 -0.52 Affordable Product (P13) 4.08 1.13 1.28 -1.24 0.91 Friendly Usable Product (P14) 3.60 1.35 1.82 -0.66 -0.66 Comfortable Product (P15) 4.00 0.99 0.98 -0.91 0.30 Easy Carry Product (P16) 4.34 0.94 0.89 -1.31 0.93 Full Consuming Product (P17) 4.04 0.99 0.97 -0.80 -0.16 Pricing Strategy (P2) 4.49 0.68 0.46 -1.13 0.69 Cost Incentive (P21) 4.25 1.00 0.99 -1.21 0.75 Profitable (P22) 3.71 1.38 1.92 -0.77 -0.67 Low MRP (P23) 4.55 0.73 0.54 -1.67 2.32 Affordable Price (p24) 4.18 0.81 0.65 -0.82 0.74 Place Strategy (P3) 4.25 0.76 0.58 -0.90 0.71 Available (P31) 3.60 1.35 1.82 -0.66 -0.66 Found in all Location (P32) 3.92 1.06 1.12 -1.24 1.47 Easy Demonstration (P33) 4.12 0.85 0.72 -1.04 1.25 Comfortable Transporting (P34) 3.83 1.04 1.08 -0.49 -0.55
Variables/Constructs Mean STD Variance Skewness Kurtosis
Promotion Strategy (P4) 4.19 0.67 0.45 -0.57 0.64 Attract by sachet Interior Decoration (P41) 3.55 1.15 1.31 -0.19 -0.92
Create awareness (P42) 3.84 1.11 1.23 -0.79 0.07 Encourage to retain (P43) 4.01 1.23 1.51 -1.08 0.15 Simplest Communication (P44) 3.86 1.01 1.01 -0.82 0.25 Auto demo 3.75 1.06 1.12 -0.56 -0.24 Assist for Comport Living 3.56 1.03 1.07 -0.27 -0.03 Create perception on Changing Habit 3.74 0.99 0.99 -0.55 0.14
Source: Calculated by Authors Table-2 explores the various parameters of descriptive statistics of variables or constructs
using in this study. There is no evidence found these statistics to indicate abnormality of respondent’s responses used in this study.
9.4 CORRELATION AMONG THE CONSTRUCTS Correlation explores the power of relationship among the constructs. Table-3 indicates the
Pearson coefficient of correlation at 1% level of significant.
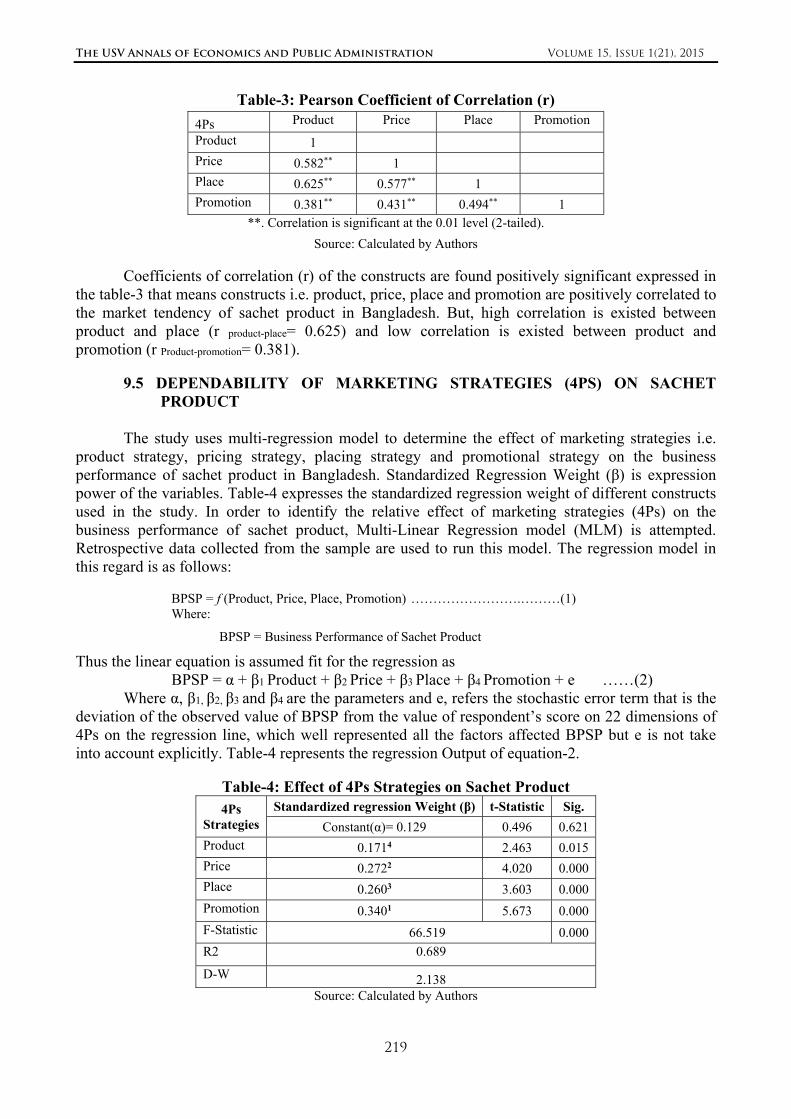
The USV Annals of Economics and Public Administration Volume 15, Issue 1(21), 2015
219
Table-3: Pearson Coefficient of Correlation (r)
4Ps Product Price Place Promotion
Product 1 Price 0.582** 1 Place 0.625** 0.577** 1 Promotion 0.381** 0.431** 0.494** 1
**. Correlation is significant at the 0.01 level (2-tailed).
Source: Calculated by Authors Coefficients of correlation (r) of the constructs are found positively significant expressed in
the table-3 that means constructs i.e. product, price, place and promotion are positively correlated to the market tendency of sachet product in Bangladesh. But, high correlation is existed between product and place (r product-place= 0.625) and low correlation is existed between product and promotion (r Product-promotion= 0.381).
9.5 DEPENDABILITY OF MARKETING STRATEGIES (4PS) ON SACHET PRODUCT
The study uses multi-regression model to determine the effect of marketing strategies i.e.
product strategy, pricing strategy, placing strategy and promotional strategy on the business performance of sachet product in Bangladesh. Standardized Regression Weight (β) is expression power of the variables. Table-4 expresses the standardized regression weight of different constructs used in the study. In order to identify the relative effect of marketing strategies (4Ps) on the business performance of sachet product, Multi-Linear Regression model (MLM) is attempted. Retrospective data collected from the sample are used to run this model. The regression model in this regard is as follows:
BPSP = f (Product, Price, Place, Promotion) …………………….………(1) Where:
BPSP = Business Performance of Sachet Product
Thus the linear equation is assumed fit for the regression as BPSP = α + β1 Product + β2 Price + β3 Place + β4 Promotion + e ……(2)
Where α, β1, β2, β3 and β4 are the parameters and e, refers the stochastic error term that is the deviation of the observed value of BPSP from the value of respondent’s score on 22 dimensions of 4Ps on the regression line, which well represented all the factors affected BPSP but e is not take into account explicitly. Table-4 represents the regression Output of equation-2.
Table-4: Effect of 4Ps Strategies on Sachet Product 4Ps
Strategies Standardized regression Weight (β) t-Statistic Sig.
Constant(α)= 0.129 0.496 0.621 Product 0.1714 2.463 0.015 Price 0.2722 4.020 0.000 Place 0.2603 3.603 0.000
Promotion 0.3401 5.673 0.000
F-Statistic 66.519 0.000
R2 0.689
D-W 2.138 Source: Calculated by Authors

The USV Annals of Economics and Public Administration Volume 15, Issue 1(21), 2015
220
For better performance of sachet product than other product, 4Ps are significantly effective. High values of t-statistics with low level of p-values (0.000) indicate the significant relationship among the constructs that is supported by F-statistics (66.519, p=0.000). This findings are also recognized by standard R-squire value (R2=0.689) and D-W value shows the stationary nature (Rule of thumb, DW< 2, DW = 2, DW >4) of the finding.
BPSP = 0.129 + 0.171 Product + 0.272 Price + 0.260 Place + 0.340 Promotion …(3) From the equation-3, it is found that promotional strategy is the highest effective (β
Promotion=0.340) factor of better business performance of sachet product in Bangladesh followed by pricing strategy (β Price=0.272), placing (β Place=0.260) and product strategy (β Product=0.171) consecutively.
Table-5: Orderly Arrangement of factors affecting to the performance of sachet product in
Bangladesh
Variables
Mea
n
SR
W(β
)
t-St
atis
tic
Sig
.
F-S
tati
stic
R2
D-W
Promotional Strategy (P4) β Promotion=0.3401
68.9
90 (
0.00
0)
0.86
0
1.81
9
Encourage to retain (P43) 4.01 0.25 5.17 0.00 Attract by sachet Interior Decoration (P41) 3.55 0.24 5.38 0.00 Simplest Communication (P44) 3.86 0.24 4.67 0.00 Auto demo 3.75 0.24 4.53 0.00 Assist for Comport Living 3.56 0.22 4.61 0.00 Create perception on Changing Habit 3.74 0.16 3.29 0.00 Create awareness (P42) 3.84 0.16 3.17 0.00 Pricing Strategy (P2) β Price=0.2722
156.
870
(0.0
00)
0.83
9
1.59
3 Highly benefited (P22) 3.71 0.55 13.88 0.00 Low MRP (P23) 4.55 0.32 6.80 0.00 Cost Incentive (P21) 4.25 0.26 6.50 0.00 Affordable Price (p24) 4.18 0.23 5.02 0.00 Place Strategy (P3) β Place=0.2603
186.
485
(0.0
00)
0.86
1
1.75
2 Available (P31) 3.60 0.43 12.06 0.00 Comfortable Transporting (P34) 3.83 0.40 11.21 0.00 Easy Demonstration (P33) 4.12 0.28 6.96 0.00 Found in all Location (P32) 3.92 0.26 6.41 0.00 Product Strategy (P1) β Product=0.1714
80.0
65 (
0.00
0)
0.82
7
2.10
3 Friendly Usable Product (P14) 3.60 0.28 4.76 0.00 Absolute Product (P11) 3.71 0.27 4.84 0.00 Innovated Product (P12) 3.74 0.25 5.43 0.00 Full Consuming Product (P17) 4.04 0.21 4.96 0.00 Affordable Product (P13) 4.08 0.18 3.05 0.00 Easy Carry Product (P16) 4.34 0.17 3.97 0.00 Comfortable Product (P15) 4.00 0.10 2.22 0.03
Source: Calculated by Authors
Table-5 explores the orderly arranged of factors affecting the business performance of sachet product in Bangladesh on the basis on their standard regression weight. All the arranging factors are significantly effect to the business performance of sachet product.
10. RESULTS From Pyramid-1,2,3,4, it is shown that 94% of Total sales volume, 59% of total sales
amount, 75% of profit per unit and 96% of profit per gram position of sachet product is existed in Bangladeshi market. So, hyppthesis-1 is rejected. From the table-3, Pearson coefficient of correlations among the constructs i.e. product, price, place and promotion are significantly positive.

The USV Annals of Economics and Public Administration Volume 15, Issue 1(21), 2015
221
Therefore, hypothesis-2 is rejected that means the constructs are significantly attached for the present situation of sachet product and finally, table-4 & 5 explore that hypothesis-3 is also rejected that indicated that pro-determined factors are significantly affected to the market position of sachet product in Bangladesh.
11. CONCLUSION In Bangladesh, consumers of sachet product have been performed themselves on the basis of
promotional effectiveness of sachet arrangement supported by Ramirz (2007), where consumer’s retention, internal decoration on outlets, Simplest communication, and comfort living natures are treated as more priority effective factors. Moreover, it would be mentioned that auto demonstration nature of sachet product is significantly effective to attract the consumers. Pricing is the second significant strategy to attract the consumers of sachet product where consumers feel that sachet is more benefited product. In case of placing strategy, consumers favor product availability and comfort bearing to choose sachet product. Finally, product strategy is the little effective factors for better business performance of sachet product where friendly use pattern is the highest favorite criteria to select sachet product in Bangladesh. The entities that are offered sachet product in Bangladesh must consider social and ethical factors to survive in the market since promotional facts are most effective factors rather than product criteria to favor sachet product in Bangladesh.
REFERENCES
1. Crockett, D. and Wallendorf, M. (2004), “The role of normative Political ideology in Customer Behavior”, Journal of Consumer Behavior, December Issue, 2004, pp 511-528 2. David J. (2010), “Marketing Metrics: The Definitive Guide to Measuring Marketing Performance”, Upper Saddle River, New Jersey: Pearson Education, Inc. ISBN 0-13-705829-2. 3. Finn, D.W. and Lamb, C.W. (1991),"An Evaluation of the SERVQUAL Scales in a Retailing Setting", Journal of Advances in Consumer Research, Vol.-18, pp 483-490. 4. Granger, C. W. J. and Billson, A. (1972), “Consumers’ Attitudes Toward Package Size and Price”, Journal of Marketing Research, Vol.-9, No.- 3, pp. 239-248. 5. Hammond, A. and Prahalad, C.K., (2004), “Selling to the Poor”, Foreign Policy, pp. 30-37. 6. Jardine, A. (2006), “Why Size Matters,” Promotions and Incentives, June Issue, pp 21–22. 7. Krishnan, A. (2001), “Sachet Revolution: Buy Less, Save More!” Available at www.blonnet.com /iw /2001/01/21/stories/0521e052.htm. 8. Lee, A. M. (2006), “Catch Me If You Can,” Journal of Potentials, pp 20–28 9. Mahajan, V. and Banga, K. (2006), “The 86% Opportunity: How to Succeed in the Biggest Market Opportunity of the Next 50 Years”, Philadelphia, PA: Wharton School Publishing. 10. Nichols, K. (1998), “Definition of the Differentiated Services Field (DS Field) in the IPv4 and IPv6 Headers”, Network Working Group, available on https://tools.ietf.org/html/rfc2474. 11. Porter, M (1990), “ The Competitive Advantage of Nations”, The Free Press Publishing, 1230, Avenues of the Americas, NY-10020, First Edition. 12. Prahalad, C. K. and Hart, S. L., (2002), “The Fortune at the Bottom the Pyramid,” Journal of Strategy Business, Vol.-26, pp.1-14. 13. Prahalad, C.K. (2004), “The Fortune at the Bottom of the Pyramid: Eradicating Poverty Through Profits”, Philadelphia: Wharton School Publishing. 14. Ramirez, C. P. (2006), Senior Vice President, Consumer Affairs Group, Philippine Long Distance Telephone Company, former Brand Manager, Colgate Philippines, Inc., Interview, (21 June, 2006) available in Wikipedia. 15. Rundh, B. (2005), "The multi‐faceted dimension of packaging: Marketing logistic or marketing tool?", British Food Journal , Vol. 107 Iss: 9, pp.670 - 684.

The USV Annals of Economics and Public Administration Volume 15, Issue 1(21), 2015
222
16. Santos, E. (2006), AC Nielsen Data, Business Unit Director, Kimberly-Clark Philippines, Inc., formerly Regional Category Major Products Manager, Kimberly-Clark Corporation, Asia-Pacific Headquarters, (August). 17. Sen, S. (2001), “Less Profits From Low Unit Packs?”, Business Line , Available onlineat:www.thehindubusinessline.com/businessline/catalyst/2001/12/06/stories /1906o05g.htm. 18. Sharma, P.(2004), “Family Business Research: A Strategic Reflection”, Journal of Family Firm Institute, Vol.-17, Issue-4, pp 331-346 19. Singh, R. (2009), “Buying Less, More Often: An Evaluation of Sachet Marketing Strategy in an Emerging Market”, The Marketing Review, Delft University of Technology, Vol.-9, No.-1, pp. 3-17 (doi: 10.1362/146934709X414297 ISSN1469-347X print / ISSN 1472-1384 online ©Westburn Publishers Ltd.) 20. Wallendorf, M. (2004), “The Role of Normative Political Ideology in Consumer Behavior”, Journal of Consumer Research, Vol.-31, No.-3, pp. 511-528. 21. Wansink, B. (1996), “Can Package Size Accelerate Usage Volume,” Journal of Marketing, Vol.-60, (July), pp1–14.

The USV Annals
of Economics and
Public Administration
Volume 15,
Issue 1(21),
2015
223
SECTION 3
ACCOUNTING - FINANCES

The USV Annals
of Economics and
Public Administration
Volume 15,
Issue 1(21),
2015
224
ACCOUNTING REPORTS AND BUDGET PROCESS IN THE
ROMANIAN PUBLIC SECTOR BETWEEN CONVERGENCE AND
CHALLENGE
ProfessorPhDElenaHLACIUC“ŞtefancelMare”UniversityofSuceava,Romania
LecturerPhDMarianSOCOLIUC“ŞtefancelMare”UniversityofSuceava,Romania
PhDStudentGeaninaMACIUCA“ŞtefancelMare”UniversityofSuceava,Romania
PhDStudentAntonelaURSACHI“ŞtefancelMare”UniversityofSuceava,Romania
Abstract: Starting with the 1st of January 2014, the Romanian public sector has undergone a long transformation
process: the change in the order of the organization and management of public institutions accounting, the chart of accounts and the instructions for its implementation, the implementation of an electronic reporting system for financial statements, the automatic verification within the system of whether the payments are within the budget or not, providing information on revenue achievement and payments made. Other measures are to be implemented such as the electronic signing by the credit release authorities of the revenue and expense budget. Even if these measures were for testing purposes in 2014, they influenced the work of the public sector professional accountant, on the one hand, and the public sector as a whole, on the other hand.
In the present paper, we will present the effects of these changes on the budget transparency and especially on budgetary efficiency and the accounting reports.
Key words: budget, public sector, reform, convergence JEL classification: M41
INTRODUCTION In recent years, efforts have been made to modernise the accounting system in the public
sector in most OECD countries. The main goal of these efforts is firstly the need to obtain an efficient management of public resources. The global financial crisis has put the governments of various countries in the situation of being unable to effectively control the budget revenues and expenditures, which means that the modernisation efforts in the field must continue.
The main aspects which have characterised this reform process were aimed at the implementation of accrual accounting and the introduction of techniques to improve the management of public funds by the government (Brusca, 2010). As a result, the public sector worldwide has evolved to meet the stability requirements (Diamond, 2002).
Often, due to the unforeseen economic circumstances, the budget must be adjusted during a financial year and if we take into account the fact that the decisions regarding public expenditures have an impact on the economy before the payments are made (according to the Romanian legislation, for an expenditure to be paid, it must go through certain steps regarding: employment, liquidation, authorisation and, later, payment) then it is easy to understand the need to monitor all the stages, including those of a non-monetary nature. Therefore, with the compliance and improvement of the mechanisms which ensure the objectives of macroeconomic stability, in the last

The USV Annals of Economics and Public Administration Volume 15, Issue 1(21), 2015
225
thirty years, the OECD governments have focused their attention on the goals regarding efficiency and effectiveness (OECD, 1994, 1995). The factors which determine the need for a reform in the public sector as well as the areas of interest which arise from these reforms are shown in figure no. 1.
Factors Areas of Interest
Figure nr.1- Areas of interest in accounting and management in the public sector Source: processed after Brusca, I., (2010), Treinta anos de investigacion en contabilidad y gestion publica en Espana, Revista de Contabilidad, vol.13, no. 2, p. 182
It is noteworthy that in the public sector, the annual and quarterly financial statements show
the relationship between the approved budget, the items of expenditure (budget items according to the economic classification established by the body for accounting normalisation, in Romania’s case, the Ministry of Public Finances) and the actual expenses. In this context, the budget commitments would be a solution recommended by the large international organisations.
In this context, Romania has made a number of changes in the public sector. In this paper, we will present the latest changes in this regard and our point of view concerning the impact of
Reforms and
evolution in public
accounng
The control of fraud and corruption
The new public management
Good governance
Globalization and the
international
Decentralisation
The new technologies
In search for budgetary stability
Accounting normalisation
The analysis and presentation of
information: improving the quality of financial and statistical information
Management accounting
The consolidation of the financial statements
National accounting
The comparability and accounting harmonisation
Electronic management: increasing the speed with
which information is obtained
Audit and control
New forms of financing of public institutions

The USV Annals of Economics and Public Administration Volume 15, Issue 1(21), 2015
226
these changes on both the professional accountant, as well as on the budget system. For the present study, we have consulted scientific articles published on this topic, papers on accounting and national and international accounting regulations. Moreover, the research is also based on our experience in the implementation of the accounting regulations.
THE BUDGETARY PROCESS IN ROMANIA – FACING NEW CHALLENGES
Brusca (2010) believes that although the need for the harmonisation of public accounting
cannot be justified similarly to the private sector reform, other aspects support the importance of the existence of comparable accounts between the public administrations of different countries. The role of the International Standards for the Public Sector is that of making the accounting systems of different countries convergent at a formal level, because most countries adapt their legislation to these rules.
The Spanish philosopher Jose Ortega y Gasset stated that, first of all, there is a need to do something and then the instrument needed to do so is invented. The same is true in accounting: first we need to make a change and then we invent the method to achieve it (Gonzalo et al, 2013). That was the case with the Romanian public accounting reform. Due to the necessity of joining the European Union, Romania had to initiate a series of reforms, including those in the public sector (fig. 2).
Cash accounting Accrual accounting-convergence towards IPSAS
1984 1989 2002 2003 2004 2005 2006 2014
Communist period, centralised
Changing of the legal framework
Order no.2021/2013
Order no. 324/1984
OMFP 1792/2002 approving the Methodological Norms Order no. 1917/2005 approving the regarding the employment, validation, methodological norms regarding the organization authorization and payment of expenditure and management of public institutions accounting, of public institutions and the organization, recording chart of accounts for public institutions and reporting of budgetary and legal commitments; and instructions on its application.
Ordinance 81/2003 on revaluation and depreciation of fixed assets owned by public institutions;
Order 1487/2003 approving the methodological norms on revaluation and depreciation of fixed assets owned by public institutions and non-profit legal persons
Figure 2- Short presentation on the evolution of public accounting in Romania Source: own processing
The latest stage is that of 2014, when the Ministry of Public Finances launched the
implementation process of the national system of verification, monitoring, reporting and control of financial statements, legal commitments and budgets.
In the public sector, the public institutions face the following types of reports: financial reports (in accordance with IPSAS or, as in the case of Romania, with the national regulations convergent with IPSAS), statistical reports and budget execution (fig. 3).
STATISTICAL REPORTS

The USV Annals of Economics and Public Administration Volume 15, Issue 1(21), 2015
227
Figure 3- Types of reports of the public institutions in Romania
Source: Tiron Tudor, A., (2013), Conferința Internațională Implicarea profesiei contabile în dezvoltarea calității
raportărilor financiare din sectorul public (Involvement of the accounting profession in developing the quality of financial reporting in the public sector International Conference), CECCAR, material accessed on the 18th of March,
2015, on the website http://ceccar.ro/ro/wp-content/uploads/2013/11/Implicarea-profesiei-contabile-%C3%AEn-sectorul-public-Adriana-Tiron.pdf
Without attempting to create discordance between statistics and accounting, we will pay
attention to the financial reporting and budget execution. In this context, accrual accounting presents certain advantages, particularly in terms of improving resource allocation and especially in reinforcing the responsibility of managers and increasing the transparency regarding the costs of government activities.
The need to continue the reforms in the public sector and, implicitly, in the reporting system derive from (Alec, 2014):
- the obligation to send EUROSTAT the COFOG III level data of the member states of the European Union (implicitly, Romania as well);
- the request from the international bodies for detailed information on the budgetary and legal commitments, budget execution, in the functional and economic profile;
- increasing the speed with which information is gathered; - increasing the data storage capacity; - improving the quality of the financial and statistical information. Thus, the public institutions will need to report the aggregated and individual budgets
according to the system’s operation procedure, the approval and electronic signature of the credit release authorities of the revenue and expenditure budgets, the provision of information on the income execution rate and on the incurrence of expenditure, the automatic check within the system if the payments are kept within the budget, the collection of the budgets in accordance with the COFOG III standard. In the category of reporting entities we find: the main, secondary and tertiary credit release authority, autonomous public institutions, state-owned economic operators, the local departments of public finance and other public institutions. The main beneficiaries are the international organisations (the World Bank, the International Monetary Fund, the European Commission), internal bodies (the Court of Auditors, the Government, the Parliament, the National Institute of Statistics, the National Bank of Romania).
In this respect, the following were proposed: the development of the cash revenue and expenditure accounts within the tresury at COFOG III level, the control of the legal commitments
REPORTS IN THE PUBLIC
SECTOR
FINANCIAL REPORTS
BUDGET EXECUTION

The USV Annals of Economics and Public Administration Volume 15, Issue 1(21), 2015
228
within the treasury, the transmission of some standardised analytical balances by each public institution at the MFS level, the elimination of the financial statements’ centralisation (aggregation) at the level of the main and secondary credit release authorities, the consolidation of the financial statements (Alecu, 2014). The public institutions will no longer prepare the annexes for the income and expenditure execution accounts, these being automatically generated by the treasury.
Romania has indeed started on this path with timid steps. By issuing Order no. 720/2014 on the execution of the income and expenditure budget of the autonomous public institutions, of the public institutions financed entirely or partially by their own revenues and by the activities which are entirely financed from their own revenues, for these institutions, starting with the 1st of July 2014, income and expenditure accounts were opened on the COFOG III budget classification structure. Thus, the state, through its treasury, provides data validation regarding the budget execution of income and expenditure as well as the automatic validation of payments, through their inclusion within the limits of the approved budget.
budget execution budgets collection commitments management consolidated reports accounting reporting
Figure 4- The reporting process through the FOREXEBUG program Source : The electronic reporting system of the financial statements in the public sector (2014), accessed on
16.03.2015 on the web address https://chat.anaf.ro/forexebug.../prezentare%20proiect%20forexebug.ppt
Instead, the process of reporting, approval and signing of the budget within the electronic system has been delayed.
As in the other countries of the European Union, we also notice that, in Romania, the treasury institution, in this case, plays an important role. In France, all payment orders go through the treasury’s system, which centralises the data on commitments and payment orders while, in Spain, all transactions which are processed by the treasury’s system go through six stages (budget allocation, commitment, verification of actual expenditure, payment requests, payment orders and payment) (Allen and Tommasi, 2001). CONCLUSION
If for the Ministry of Public Finances, as the main beneficiary, these changes have a positive result on the budgetary reporting, there is more safety in the data submitted by the public institutions, the time needed to obtain the information is shorter while the professional accountant faces greater challenges. By creating these income and expenditure accounts in the COFOG 3 system, the issues regarding immediately knowing what is available are determined, which leads to finding additional ways to cover this syncope and thus increasing the workload. Furthermore, there are disruptions between the treasury’s reasoning and that of the professional accountant, working in a public institution, regarding many accounting issues. Moreover, the public institutions must spend more to adapt the software to the new changes.

The USV Annals of Economics and Public Administration Volume 15, Issue 1(21), 2015
229
Acknowledgment
This paper has been financially supported within the project entitled „SOCERT. Knowledge
society, dynamism through research”, contract number POSDRU/159/1.5/S/132406. This project is co-financed by European Social Fund through Sectoral Operational Programme for Human Resources Development 2007-2013. Investing in people!” BIBLIOGRAPHY 1. Newberry, S., (2015), Public sector reforms and sovereign debt management: Capital market development as strategy, Critical Perspective on Accounting, no.27, pp. 101-117. 2. Allen, R., Tommasi, D., (2001), Administrarea cheltuielilor publice. Manual de referință pentru țările în tranziție, OECD. 3. Alecu, G.,(2014), Dezvoltări și inovări privind raportarea financiară în instituțiile publice din România, Ceccar, material accesat în data de 08.03.2015 de pe pagina web http://ceccar.ro/ro/wp-content/uploads/2013/11/Dezvoltari-si-inovari-privind-raportarea-financiara-in-institutiile-publice-G.-Alecu.pdf 4. Brusca, I., (2010), Treinta anos de investigacion en contabilidad y gestion publica en Espana, Revista de Contabilidad, vol.13, no. 2, pp.175-209 5. Sistemul electronic de raportare a situațiilor financiare din sectorul public (2014), accesat în data de 16.03.2015 de adresa de web https://chat.anaf.ro/forexebug.../prezentare%20proiect%20forexebug.ppt 6. Tiron Tudor, A., (2013), Conferința Internațională Implicarea profesiei contabile în dezvoltarea calității raportărilor financiare din sectorul public, CECCAR, material accesat în data de 18.03.2015 de pe pagina web http://ceccar.ro/ro/wp-content/uploads/2013/11/Implicarea-profesiei-contabile-%C3%AEn-sectorul-public-Adriana-Tiron.pdf 7. Diamond, J., (2002), “Performance Budgeting-Is Accrual Accounting Required”, International Monetary Fund Working Paper. Fiscal Affairs Department (WP/02/240). 8. Gonzalo Angulo J.A., Tenant K., Riquelme Alvarado M., Royano Muro L., (2013), El camino hacia la convergencia. Comparacion y analisis critico entre la normativa contable internacional (NIC/NIIF) y la estadounidense, Ed., Edisofer S.L., Madrid, p. 49

The USV Annals
of Economics and
Public Administration
Volume 15,
Issue 1(21),
2015
230
RECENT ADAPTATIONS OF THE LEGAL STANDARDS APPLIED
TO TAX LIABILITIES THROUGH GOVERNMENT ORDINANCES
ProfessorPhDIonelBOSTAN
DoctoralSchoolofEconomicsandBusinessAdministration,StefancelMareUniversity,Suceava,[email protected]
Abstract: Our endeavour is directed at revealing certain difficulties identified during the actual process of levying the
government revenue that have “lasted” in time, as well as the methods used in solving or merely alleviating such difficulties, as imposed and applied by the Executive authority. Among the above mentioned issues, we will specifically refer to the measures taken to discourage tax payers from using arrears as a source to fund their own activities, with important mentions on the special correction (“undeclared tax penalty”) for cases when certain sums payable to the public budget are not declared (either totally or partially). The 2nd part approaches the setting up of the ancillary obligations system which is specifically directed at protecting the real value of the fiscal claims and at sanctioning defaults of payment upon the due date. Key words: Tax procedure code, Government, debtors/tax-payers, taxes receivable, ancillary obligations, special correction.
JEL classification: K40
1. INTRODUCTION The institutional mechanisms designed to ensure the smooth operation of the budget system can be rather rigid at times, and this fact has been often approached in the professional literature. Renowned researchers and academics specialised in the field of financial-budgetary and taxation law have actually approached this specific issue in a compared manner in their papers, often pointing out the available solutions, based on the best practices identified in the juridical and financial systems of other states [1-4]. To a certain extent, the author of the present paper has approached the proposed topic by revealing the strengths and also the weaknesses identified as concerns the establishment and enforcement of financial and taxation law regulations, both during the transition of the Romanian economy to the market economy, and also after the year 2007 when Romania became a member state of the European Union [5-10], in the context of sustainable development [11]. Our endeavour is directed at revealing certain difficulties identified during the actual process of levying the government revenue that have “lasted” in time, as well as the methods used in solving or merely alleviating such difficulties, as imposed and applied by the Executive authority. Among the above mentioned issues, we will specifically refer to the special correction (“undeclared tax penalty”) for cases when certain sums payable to the public budget are not declared (either totally or partially) and the double standard of the ancillary obligations. Additionally, we will make certain references to the defective and unequitable standards, in terms of the sums, and in relation to the ancillary obligations. 2. THE SPECIAL CORRECTION (“UNDECLARED TAX PENALTY”) FOR CASES WHEN CERTAIN SUMS PAYABLE TO THE PUBLIC BUDGET (EITHER TOTALLY OR PARTIALLY) ARE NOT DECLARED The tax-payers attempt to default on the tax liabilities due to the public budget – namely to correctly ascertain and declare the tax liabilities and then to pay in due time – is a separate case to be sanctioned. Thus, the New Code of taxation procedure (NCPF) [12], which is currently in the project stage, provides the enforcement of a special correction in the case of a possible “oblivion” to

The USV Annals of Economics and Public Administration Volume 15, Issue 1(21), 2015
231
declare revenues (either totally or partially). We are specifically referring to the “undeclared tax penalty” penalty (UTP), whose enforcement refers to the “application of a fair treatment in terms of the tax-payers’ behaviour, in order to differentiate those who fill in their tax return correctly but do not pay and those who do not declare their revenues.” Certainly, the measure ensures the submission of accurate and timely tax return forms and the subsequent payment of the tax liabilities, thus helping alleviate tax evasion. The detection of the failure to declare revenues through tax investigation, will entail the enforcement of UTPs that may differ depending on the amount of the unpaid liability. If the sum does not exceed the 25% margin related to each tax liability declared by the tax-payer in the tax return submitted for a certain taxation period, the UTPs will amount to 5% of the main tax liabilities undeclared by the tax-payer and established by the tax investigation authority (through tax return enforceability). If tax-payers exceed the margin, they will be liable to pay a fine that is five times higher than in the previous case (25%). Nevertheless, the UTP is limited to 1 000 000 lei every time the specific enforcement measures cause it to exceed this specific margin. This limit does not apply if the undeclared amounts were generated by deeds falling under the scope of Law no. 241/2005, concerning the prevention and combating of tax evasion [13]. On the contrary, in this case, the penalty increases by 100%. However, the UTP is reduced by 75% if the main tax liabilities established through a decision are paid by the due time as set by the Taxation Procedure Code or are legally set to be paid by instalments. We noted that the taxation procedure code also provides a measure that is in the favour of the tax-payer, namely that UTPs are not levied when the tax differences are generated after the interpretation conducted by the National Agency of Fiscal Administration (NAFA) in that particular tax-related issue. However, the prerequisite is that the respective interpretation would result from documents such as circular letters, instructions or methodological guidelines. 3. THE DOUBLE STANDARD OF ANCILLARY OBLIGATIONS As far as taxation is concerned, the introduction of the ancillary obligations system is only directed at protecting the actual amount of the due tax liability and at sanctioning the default on payment. However, as the New Taxation Code continues to be delayed, we will also be stuck in a situation in which interests calculated according to two separate formulae will be levied when tax liabilities consisting of the same amount and with equal maturities are delayed. That is the case because when we deal with the state budget, defaulting on the payment of taxation liabilities will result in an 0.03% interest rate per day (10.95% a year) for delays, but also late fines of 0.02% a day (7.3% a year) as well. Adding up, we get 18.25%, which means that forgetting/omitting to pay an amount in the NAFA account for one year entails, apart from the payment itself, another one fifth of the capital. On the other hand, if the tax-payer’s “oblivion” entails the default on a payment due to the local authority, the penalty will be even higher. This entails that, apart from the principal debt (tax, etc.), an ancillary tax is added, which, in the case of a one year delay, tends to amount to one quarter of the initial sum. Defaulting on the payment of tax liabilities due to the local authorities would namely result in late fines of 2% per month or fraction of a month (thus amounting to 24% a year). Such a regulatory action, apart from the above shown differences in the applied financial treatment, is regarded by finance professionals as “a defective and unequitable regime in terms of the sums related to ancillary payments” [12]. And here are the arguments. Upon examination, the described system (that of the ancillary payments applied for defaulting on the due payments to the local authorities, consisting of interests and late fines) also applies to the additional tax differences established by the supervision authorities. The major inconvenience arising is that the system does not take into account the two taxation obligation to do, namely (1) to correctly ascertain and state the amount of tax liability and (2) to pay the respective tax liability in due time. The tax-payers’ behaviour in terms of the obligation to accurately state their tax liabilities is practically of no importance. Thus, taxpayer A, who correctly states his tax liability (but does not pay), is fines just as taxpayer B, who hasn’t paid the same amount due to the fact that his tax return was inaccurate. What we believe is rather counterproductive is that there is no distinction between

The USV Annals of Economics and Public Administration Volume 15, Issue 1(21), 2015
232
the fact that B is in breach of two obligations stated in the taxation law: to correctly ascertain and state his tax liabilities and, as a consequence, to pay the respective liability in due time. 4. CONCLUSIONS
The references we have made in the present paper have taken into account only a few of the recent adaptations related to the legal standards applied to taxation liabilities – adaptations conducted by means of government ordinances. Clearly, they are all important, but the institutional mechanisms that were meant to ensure the smooth functioning of the public budget are yet to be improved. They should lead to the increased efficiency of NAFA/ DGAF and augment the voluntary compliance degree (VCD) with the payment of tax liabilities. We would like to close by showing that the above mentioned degree (VCD, percentage), at the end of 2014, hasn’t increased significantly, as previously expected. In exact percentage points, it has reached 83.7, by half a percentage higher than it had amounted to in 2013. Acknowledgments. The author would like to thank the anonymous reviewers for their valuable comments and suggestions to improve the quality of the paper. REFERENCES [1]. Drosu-Şaguna, D., Tofan, Mihaela (2010), Drept financiar şi fiscal european, Editura C.H. Beck, Bucureşti, 2010. [2]. Maha, L.G., Mariciuc, D.F. (2009), Characteristics of the financial crisis in 2008 and its implications on Romanian economy, Paper no. 27180, MPRA/ Munich Personal RePEc Archive. [3]. Oprea, F., Mehdian, S. and Stoica, O. (2013), Fiscal and Financial Stability in Romania – an Overview. Transylvanian Review of Administrative Sciences, 40 E, pp. 159-182. [4]. Stoica, O., Capraru, B. (2012), The Current International Financial Crisis And The Financial Supervision Institutional Arrangements Effectiveness In The European Union Countries, Revista Economica, Lucian Blaga University of Sibiu, no. 4: 590-597. [5]. Bostan, I., (2014), Fundamentarea ordonanțelor și a hotărârilor guvernamentale cu impact financiar, Editura Lumen, Iași. [6]. Bostan, I., (2014), Juridical tools of Governmental nature used to mitigate various difficulties of the Financial and Budgetary System, Scientific Annals of the "Alexandru Ioan Cuza" University of Iasi, Economic Sciences Section, 61(2): 133-148, DOI:10.2478/aicue-2014-0010/ [7]. Bostan, I., Radu, P. (2003), Controlul financiar şi auditul intern la instituţiile publice, Editura Sedcom Libris, Iași. [8]. Bostan, I. (2007), Drept financiar comunitar, Editura Tipo Moldova, Iași. [9]. Bostan, I. (2010), Proceduri privind auditul public financiar şi al performanţei, Editura Tipo Moldova, Iași. [10]. Bostan, I., V. Grosu (2009), Limits on legislative harmonization financial accounting, The 33-rd Annul Congress of the American Romanian Academy of Arts and Sciences (ARA), Politechnic International Press Montreal, Quebec, pp. 250-253. [11]. Pohoață, I., Bostan, I., Prelipceanu, Druguș, D., Morariu, A., Bunget, O. (2014), Equity, intra/inter-generation equalization and profit, in the context of the right to a healthy life and a clean environment, Rev. Rom. Bio. 12, no. 2: 58-69. [12]. Noul Cod de procedură fiscală (NCPF), Proiect, http://www.mfinante.ro/ transparent.html?method=transparenta&pagina=acasa&locale=ro [13]. Legea nr. 241/2005 privind prevenirea și combaterea evaziunii fiscale http://codfiscal.net/21775/legea-2412005-prevenirea-si-combaterea-evaziunii-fiscale

The USV Annals
of Economics and
Public Administration
Volume 15,
Issue 1(21),
2015
233
ECONOMIC MEASURES DESIGNED BY INTERNATIONAL
FINANCIAL INSTITUTION IN ORDER TO MACROSTABILIZE
AND TO AUGUMENT ECONOMIC RECOVERY PROCESS
PhDLecturerAncaMariaPARASCHIVBucharestUniversityofEconomicStudies,Bucharest,Romania
PhDAssistantProfessorAlexandruPOTORACStefancelMareUniversityofSuceava,Suceava,Romania
PostgraduatedStudentIoanaENACHEBucharestUniversityofEconomicStudies,Bucharest,Romania
[email protected] Abstract:
The recent economic crisis has affected the world economy in general, but the contagion degree for each member economy was different, depending on the specific economic situation existing at the crisis debut. Some European economies were very seriously affected, especially those who have expressed a number of internal and external imbalances in the pre-crisis period, and who did not take countermeasures. The economic crisis and the recession that followed were felt strong also in the USA, but the flexibility of the US economy and the measures taken since the onset of the crisis allowed a faster recovery than in European vulnerable economies. The accommodative US monetary policy permitted to avert liquidity crises and to clean the bank balance sheets, which was also a premise of resuming lending in order to get out of the recession. In this article we conducted an extensive analysis of management measures adopted in different states which are carrying out programs with IFIs, taking into account both short-term effects and implications of these economic policy measures in the medium and long term horizon.
Key words: economic crisis, macro stabilization policies, IFI’s agreement; JEL classification: E 60, E 61, G28;
1. OVERVIEW
The economic crisis that started in 2008 affected most world economies. In many cases they
were forced to seek financial support from international financial institutions (IFI) like the International Monetary Fund (IMF), European Commission (EC), European Central Bank (ECB) and the World Bank (WB) in order to ensure macroeconomic stability,to regain access on international financial markets and to restor investor confidence in the economic prospects of these economies. A number of countries, especially in Europe, are still in the financing agreements with international financial institutions, since the economic problems there economies are facing persists, although the situation in the last five years significantly improved. The paper provides an analysis of financial assistance programs concluded by international financial institutions, the causes of these programs and the types of measures and their effectiveness in eliminating internal and external imbalances that these states have faced.
The literature has been enriched with many papers that analyzed funding and the effectiveness of economic policy in these programs. However, it is worth noting that international financial institutions do not provide estimates of the effectiveness of these measures, for example in the form of indicators that provide a ranking of Member States in terms of success and recommended reforms implemented by these states.
An important study on the success of EU and IMF financial assistance programs during the crisis was developed by Jean Pisani-Ferry, André Sapir and Guntram Wolfe and published in 2013 [1]. The review examines EU and IMF assistance programs (EC and ECB) taking into account three

The USV Annals of Economics and Public Administration Volume 15, Issue 1(21), 2015
234
euro area Member States, namely Greece, Ireland and Portugal. The authors concluded that, from an institutional perspective, the cooperation between the EC and the IMF was inevitable, given the lack of experience of EU in funding crises and also a lack of confidence in the Union in their own institutions. Despite the differences in organization and approach between the two institutions, the cooperative process worked. The topics on which there were the most serious disagreements were related to the restructuring of Greek debt and to the acceptance of losses by holders of bonds (senior) issued by Irish banks. Regarding the success of these programs, the authors concluded that the results were mixed. An obvious success has been made in reducing current account deficits in the three countries, even if the reduction occurred predominantly on the basis of reduced imports due to the collapse in domestic demand, in which case the success may be questionable.
Compared to other European countries which have signed one or two financing agreements, Romania has signed three agreements, the last to be finalized in 2015 [2-4, 6]. In 2013, even before the signing of the third agreement, the European Commission has prepared an analysis of the first two funding programs concluded with Romania in 2009-2013, 'Overall assessment of the two balance-of-payments assistance Program for Romania , 2009-2013 '[3]. The purpose of the two programs funded by 5 and 1.4 billion euros, was to provide financial support for financial and economic crisis and to create prerequisites for a sustainable and inclusive growth by promoting structural reforms in order to substantiate this economic growth. The role of the first program, with a value much higher than the value of the second and third one, was to ensure macroeconomic stability in terms of the balance of payments, public finance, inflation and financial stability.
Once that macroeconomic stability was ensured, the second program focused on structural reforms, particularly in transport and energy to ensure a raise in potential GDP**. Other areas of interest important reform measures were those of health, fiscal governance and state enterprises, employment and business . The evaluation findings show that in general, most of the benchmarks contained in the two funding programs have been met.
International financial institutions such as the IMF and WB have clear mandates to support Member States in case of economic difficulties. Thanks to a long period of operation and intervention in crises , these institutions have developed appropriate tools and specialized personnel. Despite having responsibilities in supporting Member States under the Treaties in force, at the onset of the economic crisis, the European institutions experience was almost inexistent, not having a practice in the design and monitoring of economic programs for overcoming economic imbalances. In the near future, the EU has enriched the tools to prevent macroeconomic imbalances and to promote economic governance by adopting new regulations in the economic packages.
Thus, since the economic crisis started, international financial institutions were more or less prepared to meet the needs of Member States in terms of financial resources, intervention instruments, as well as experience in economic development programs. At the onset of the crisis, the IMF was the only institution that possesses the kind of economic programs, legislation, professional experience and financial resources needed for the formulation, negotiation and implementation of these programs. However, to assist countries with sound macroeconomic policies, but indirectly affected by contagion, the IMF has developed two new financial instruments, respectively the Flexible Credit Line (2009) and the Precautionary Liquidity Line (2011). At the same time the IMF has increased the capital available to support Member States through economic programs with funding from 250-1000 billion. This operation started in 2009 through loans from member states less affected by the economic crisis.
European Commission and the ECB were less prepared to support member countries, because they had the tools and financial resources, but no professional experience. In case of the European Union, the only financial instrument (type of economic program) was available for non euro area countries which were facing balance of payments difficulties. With this type of program (balance of payments assistance), the European Union through the European Commission could give countries outside the euro area financial resources from the EC loans on international financial markets. Until the onset of the economic crisis the European Union never used this tool. The same situation was also in the case of ECB, which did not have a clear mandate to support Member States

The USV Annals of Economics and Public Administration Volume 15, Issue 1(21), 2015
235
in the euro area and beyond. However, both the EC and the ECB have developed legal framework, logistic and financial support to help Member States facing great economic problems. The ECB played an active role, as partner, in the euro-area countries while in non-euro states this institution had an observer role. ECB role under these programs was to provide liquidity to banks which were in difficulty.
World Bank was part of the economic program especially with the IMF in emerging countries. Experience and financial resources of the first previous mentioned institution aimed primarily structural adjustment and modernization in different areas - such as education, transport, environment, governance of public institutions, agriculture, etc - specific especially in emerging economies. In Europe, the World Bank has been a partner in economic programs with the IMF and EC only in Hungary and Romania and Latvia.
2. INVENTORY OF MEASURES TAKEN IN ROMANIA
External financing agreements signed by Romania with IMF aimed to limit spread of the financial crisis effects in Romania through the transmission channel of external financing and promoting economic package of measures to limit the negative effects on the Romanian economy and ensuring the necessary conditions to resume economic growth .
The first economic program with funding from IFIs aimed at restoring macroeconomic stability which was severely affected during the boom economic registered in the 2003 – 2008 period, and which led to overheating and unsustainable imbalances. GDP growth averaged over 6½% per year in 2003-2008 (showed by Figure no.1) fueled by foreign direct investment and capital inflows (in part by foreign bank branches in Romania). Robust increase exports to the EU countries reflected a process of integration increasingly higher in Western European economies. Domestic demand growth was even faster, generating current account deficits increasingly larger, which culminated in 2007, reaching 14% of GDP. The overheating economy and the rapid capital inflows complicated a lot the Monetary policy of the country, which drew after itself the National Bank of Romania inability to achieve the inflation target despite rising interest rates and reserve requirements [5].
Figure no.1 Real Growth Evolution between 2003 - 2015 Source: Own calculation based on Eurostat data
Real Exchange Rate (RRES) has appreciated by approx. 50% during the interval 2004 -
2007, the value being determined by massive capital input and by the economic convergence expectations due to the EU aderathion.
The rapid increase of credit that fueled the boom led to a large exposure of Romania to the global financial temporary obstacles and to the exchange rate volatility. External loans of the banking system led to an increase of domestic credit, which reached an average of 50% per year

The USV Annals of Economics and Public Administration Volume 15, Issue 1(21), 2015
236
over the past four years until 2007. The companies' access to foreign loans also contributed to the boom, increasing from a net 4% of GDP in 2005 to almost 11% in 2007.
Moreover, over half the domestic private loans were in foreign currencies, much of them belonging to people or companies exposed at risk, which generated a significant indirect exposure of the banks to currency risks (Figure no. 2). The maturity structure of external debt also deteriorated in those years, the coverage of short-term external debt to gross international reserves decreasing to about 75% in February 2009 from over 170% in 2003.
Figure no. 2 Romania – Public Debt as GDP percentage, 2008-2014
Source: Self Calculation based on MPF data The second grant agreement signed by Romania focused on stimulating growth potential
through structural reforms. Structural deficiencies in key economic areas slowed economic growth. Improving the eficiency in public sector should have the effect of reducing bureaucratic barriers and increase the absorption of EU structural funds, boosting in the same time the capital expenditure for improving national infrastructure.
The new program also aimed at reaching reforms in the transport and energy sectors, including reforms in terms of pricing mechanisms, better regulation and restructuring and privatization of state enterprises in the transport and energy sectors. Precautionary assistance from the International Monetary Fund and the EU was a reinsurance to private markets and an opportunity to mitigate future shocks in the event of their occurance.
Target for fiscal balance at the end of December 2011 was met by a substantial margin, reflecting bigger tax revenue than anticipated. Fiscal policy has played a strong pro cyclical role, the budget deficit rising from under 1% of GDP in 2005 to almost 5% of GDP in 2008. Difficult fiscal measures adopted in 2010, supplemented by the prudent policies on spending, make Cash fiscal deficit target of 3.0% in 2012 to be achievable (See Figure no.3).
However, to ensure sustained deficit reduction was essential to continue efforts to improve tax collection, to reduce expenditure pressures (especially in the health sector), and to reduce the arrears [8]. Under sustained efforts to improve tax administration, the government approved a decision on indirect methods of control, as a prior action for the new joint agreement (with IMF and EC) [7].

The USV Annals of Economics and Public Administration Volume 15, Issue 1(21), 2015
237
Figure no.3 – GCB Deficit (GDP percentage)
Source: Own Calculation based on AMECO data The banking system faced well the crisis, being well capitalized and liquid. Nonperforming
loans (NPLs ) continued to grow, althow at a slower pace , and reached a peak in mid 2011. Banks were still well capitalized, at the end of 2010 recording an average of capital adequacy ratio of 14.7%, all banks hovering above 11% [21]. However , the vigilence was maintained, given the fact that performance varied significantly from bank to bank. In March 2011 , the authorities discussed with the largest foreign banks an extension of the European Bank Coordination Initiative (ICBE ), in order to continue the stabilizing effects that this initiative have had.
The third funding program provides a valuable anchor of policies and supports the comprehensive economic program of Romania for the period 2013-2015. The purpose was to maintain sound macroeconomic policies and financial sector stability and also the continuation of structural reforms designed to enhance growth prospects.
In particular, the program seeks : ( i ) to protect a healthy public finance system, supported by a stronger institutional fiscal framework; ( ii ) to continue monetary and financial sector policies that restore the reserves and protect the economy against external shocks; ( iii ) to reduce economic bottlenecks which are impeding the country's growth potential and competitiveness, through structural reforms.
The program aims to maintain investor confidence by ensuring discipline and stability of policy design. This agreement also allows the targeting of measures in order to support domestic demand. Because people, banks and companies continue to lower the debt level, domestic consumption and investment demand remain modest. The program combines long-term institutional responses to short-term measures, targeted, such as the extension of mortgage guarantee scheme, aimed at putting recovery on a firmer basis.
Specifically, measures were related to fiscal consolidation, financial stability and structural reforms in order to facilitate and accelerate economic recovery. Adjustment program demanded that the consolidation proccess to focus mainly on spending cuts, given the pre-crisis fiscal slippages in current spending and financial constraints. The strategy also involved reducing the deficit below 3 % of GDP by the deadline set by the European Council in the context of the excessive deficit procedure***. The European Council initially set 2011 as the deadline for reaching a deficit below 3% of GDP, but in 2010 this deadline was extended until 2012 because of a significant deterioration in economic conditions [9-14].
The category of fiscal consolidation measures includes both measures designed to reduce costs but also to increase revenue. Reducing expenses covered all categories of expenditure, respectively expenditure on wages, goods and services and capital expenditure. The income increase aimed all income categories, but especially tax revenues which are the majority in the budget and are easier to control.

The USV Annals of Economics and Public Administration Volume 15, Issue 1(21), 2015
238
After the timeframe for implementation and action we can distinguish [9-20, 22]: • short-term measures. In the category of short-term economic measures are the ones that can be implemented immediately and have immediate effects on relevant economic indicator (for example - reducing the budget deficit), such as increasing some taxes (VAT, social security contributions ) and reduction of expenses (wages , pension and investment ) . • long-term measures. Long-term measures are involving improvement of strategy in the aimed field and requires a development of the strategy, appropriate legislation, the possibly to set up institutions with clear responsabilities in the frame of the new strategy. In this respect we can mention fiscal consolidation measures by strengthening the fiscal framework and by developing the fiscal budget strategy on the medium term, public pension reform, healthcare reform, governance reform at state enterprises, local public finance reform, public administration reform, etc. Development and implementation of these reforms is a lengthy process, and consequently the results are supposed to be visible at least on a medium timeframe. For example, in case of the reform of public pensions, the results can appear even after a period of 20-50 years, if one of the measures is to increase the period of retirement or relocation scheme of contributions and benefits. Other reforms in the energy, transport, business environment, etc are a plus in the reform field with a direct effect on public finances.
3. THE IMPACT AND THE EFFICIENCY OF ECONOMIC MEASURES DESIGNED BY THE FINANCIAL ASSISTANCE PROGRAMS
Romania had the most drastic fiscal adjustment during programs in comparison with similar
countries in the region. The structural deficit improved by 5.5 percentage points of GDP in 2009-2011. Romania had also the weakest starting position, with a unsustainable structural deficit of 9.5 % of GDP in 2009, highly generated by a pro-cyclical fiscal policy during the years of growth from 2004 to 2008. Despite drastic fiscal adjustment measures which had negative effects on domestic demand Romania returned to economic growth since 2011, after a significant decline in real GDP to almost minus 7 % [15-21]. The resumption of economic growth process is accompanied by increasing levels of confidence in the economy, expressed by economic sentiment indicator.
The success of financing is directly reflected in the reduction of the perceived risk by markets toward Romanian economy. The CDS spreads (the cost of insurance in case of bankruptcy, practical the bankruptcy likelihood of a country) followed a similar trend and fell below 200 basis points in mid- June 2013, from a peak of about 800 basis points in March 2009. (note that the market believes that the risks of failure are higher in Hungary than in Romania, so that the cost of insurance in case of bankruptcy in the first mentioned country is at about 300 basis points, which is almost double than in Romania). The interests on government loans followed a downward trend since 2011 and dropped to a historical low in the spring of 2013 (Figure no.4). Figure no. 4 Government bond yields-as weighted average of 3, 5, 10, 12 and 15 year bonds
Source: OWN Calculation based on MFP data

The USV Annals of Economics and Public Administration Volume 15, Issue 1(21), 2015
239
Generally, programs have attained their recovery macroeconomic stability objectives, restoring market access to finance sovereign debt and maintaining financial stability.
4.CONCLUSION
The three programs signed by Romania with IFI had some slippages and unconvinients but also had the effect of restoring macroeconomic balance and economic recovery, so that in 2014 Romania recorded the highest GDP growth rates in the EU. Although some economic measures have had negative effects on household income (wage cuts, reduction of employment in the state sector, increasing inflation due to the VAT increase), the Romanian economy is back in the area of sustainable economic growth with sound macroeconomic fundamentals. Macroeconomic adjustment that occurred in the last 4 years in Romania and the return indicates positive growth due to the economic reforms implemented during the three IFI’s financing economic programs.
* This work was co-financed from the European Social Fund through Sectorial Operational Program Human Resources Development 2007-2013, project number POSDRU/159/1.5/S/134197 „Performance and excellence in doctoral and postdoctoral research in Romanian economics science domain”
** The third program aims to protect and deepen the initial reforms, and expanding particularly in modernizing public administration.
*** According to the Stability and Growth Pact of the EU, European Union Member States should maintain the general government deficit below 3 percent of GDP. Exceeding this limit attracts a specific procedure (excessive deficit procedure) to return the budget deficit below 3 percent of GDP.
REFRENCES:
1. Pisani-Ferry, Jean, Sapir Andre, Wolfe, Guntram (2013) ‘EU-IMF assistance to euro-area countries: an early assessment’ Bruegel Blueprint No. 19 2. European Commission (2013) ‘Overall assessment of the two balance-of-payments assistance program for Romania, 2009-2013‘, Occasional Papers 156 3. FMI (2014) ”Romania: First and Second Reviews Under the Stand-By Arrangement and Request for Waiver of Nonobservance of a Performance Criterion, Modification of Program Conditionality, and Rephasing of the Availability Dates of Purchases; Staff Report; Press Release; and Statement by the Executive Director for Romania”, Country Report No. 14/87 4. FMI (2014) ”Romania: First and Second Reviews Under the Stand-By Arrangement and Request for Waiver of Nonobservance of a Performance Criterion, Modification of Program Conditionality, and Rephasing of the Availability Dates of Purchases; Staff Report; Press Release; and Statement by the Executive Director for Romania” , Country Report No. 14/87. 5. FMI ( 2014) “Romania: Ex Post Evaluation of Exceptional Access Under the 2011 Stand-By Arrangement” ,Country Report No. 14/88. 6. FMI (2013) “Romania: Request for a Stand-By Arrangement”, Country Report No. 13/307. 7. FMI (2013) “Romania: Seventh and Eighth Reviews Under the Stand-By Arrangement and Request for Waiver of Nonobservance of Performance Criteria—Staff Report; Staff Supplement; Press Release on the Executive Board Discussion; and Statement by the Executive Director for Romania” , Country Report No. 13/204. 8. FMI (2012) “Romania: Selected Issues Paper”, Country Report No. 12/291. 9. FMI (2012) “Romania: Staff Report for the 2012 Article IV Consultation, Sixth Review Under the Stand-By Arrangement, and Requests for Waiver of Nonobservance of Performance Criterion and Modification of Performance Criteria”, Country Report No. 12/290.

The USV Annals of Economics and Public Administration Volume 15, Issue 1(21), 2015
240
10. FMI (2012) “Romania: Fifth Review Under the Stand-By Arrangement - Staff Report; Staff Supplement; Press Release on the Executive Board Discussion; and Statement by the Executive Director for Romania”, Country Report No. 12/157. 11. FMI (2012) “Romania: Fourth Review Under the Stand-By Arrangement and Request for Modification of Performance Criteria - Staff Report; Staff Supplement; Press Release on the Executive Board Discussion; and Statement by the Executive Director for Romania”, Country Report No. 12/73. 12. FMI (2012) “Romania: Ex Post Evaluation of Exceptional Access Under the 2009 Stand-By Arrangement”, Country Report No. 12/64. 13. FMI (2012) “Romania: Third Review Under the Stand-By Arrangement—Staff Report; Staff Supplement; Press Release on the Executive Board Discussion; and Statement by the Executive Director for Romania”, Country Report No. 12/11. 14. FMI (2011) “Romania: Second Review under the Stand-By Arrangement and Request for Modification of Performance Criteria-Staff Report; Staff Supplement; Press Release on the Executive Board Discussion; and Statement by the Executive Director for Romania”, Country Report No. 11/297. 15. FMI (2011) “Romania: First Review under the Stand-By Arrangement and Request for Modification of Performance Criteria—Staff Report; Staff Supplement; Press Release on the Executive Board Discussion; and Statement by the Executive Director for Romania”, Country Report No. 11/158. 16. FMI (2011) “-- Romania-Seventh Review Under the Stand-By Arrangement, Cancellation of Current Stand-By Arrangement, and Request for a New Stand-By Arrangement-Staff Report; Supplement on the Assessment of the Risks to the Fund and the Fund’s Liquidity Position; Supplementary Information; Press Release on the Executive Board Discussion; Statement by the Executive Director and the Senior Advisor to the Executive Director for Romania”, Country Report No. 11/80. 17. FMI ( 2011) “Romania- Sixth Review Under the Stand-By Arrangement, and Requests for Waiver of Nonobservance of Performance Criterion, and Request for Modification and Establishment of Performance Criteria-Staff Report; Supplementary Information; Press Release on the Executive Board Discussion; Statement by the Executive Director and the Senior Advisor to the Executive Director for Romania”, Country Report No. 11/14. 18. FMI (2010) “Romania - Fifth Review Under the Stand-By Arrangement, and Requests for Waiver of Nonobservance of Performance Criterion, and Request for Modification and Establishment of Performance Criteria - Staff Report; Supplementary Information; Press Release on the Executive Board Discussion; Statement by the Executive Director for Romania”, Country Report No. 10/301. 19. FMI (2010) “Romania - Staff Report for the 2010 Article IV Consultation, Fourth Review Under the Stand-By Arrangement, and Requests for Modification and Waiver of Nonobservance of Performance Criteria—Staff Report; Staff Supplement; Public Information Notice and Press Release on the Executive Board Discussion; Statement by the Executive Director for Romania”, Country Report No. 10/227. 20. FMI (2010) “Romania: Financial Sector Stability Assessment”, Country Report No. 10/47. 21. FMI (2010) “Romania: Second and Third Reviews under the Stand-By Arrangement, Request Re-phasing and Waiver of Nonobservance of Performance Criterion; Statement by the IMF Staff Representative; and Press Release on the Executive Board Discussion”, Country Report No. 10/49.

The USV Annals
of Economics and
Public Administration
Volume 15,
Issue 1(21),
2015
241
SHOULD TAX COURSES BE REQUIRED FOR ALL ROMANIAN
UNIVERSITIES’ BUSINESS STUDENTS? THE NEW FUTURE OF
BUSINESS EDUCATION
KevinA.DIEHL
WesternIllinoisUniversity(QC),UnitedStatesofAmericaKA‐[email protected]
Abstract:
Typically, Romanian university colleges of business require students to pursue basic accounting, economics, finance, and management classes at the undergraduate level or, for the first time, while pursuing studies in the masters of business administration (MBA) program. Generally, university administrators do not impose tax courses on business students (economics, finance, management, etc.) and sometimes do not even require them for accounting students. Administrators likely do not require tax studies because of the combination of their real-world advisors, managers, not truly understanding the value of tax planning in their own businesses let alone in university curricula and few available tax professors. Many real-world managers, universities’ advisors, also do not truly comprehend the value of tax planning. With these beliefs then, they generally do not advise university administrators to require tax courses for students who are about to enter the business field. Too few tax professors are available not just in Romania but also globally. Individuals in the tax field earn so much that they rarely consider entering academia because of the pay cut. The paper then provides examples, evidencing the necessity of combining tax knowledge with financial accounting, economics, finance, and management studies. Next, solutions to the lack of professors are discussed. These results are then analyzed with implications for Romanian universities with the conclusion following.
Key words: Romanian universities; tax courses; required curriculum; business students.
JEL classification: M40. 1. INTRODUCTION Many Romanian universities emerged in the early 1990s. Given that specific timing, an opportunity has existed to pursue new-world educational methods. Romanian universities have capitalized on this opportunity, becoming leaders of emerging nations with regard to business education development (Popescu and Crenicean, 2012). Part of this effort was required because of the 1999 Bologna Declaration (Scarlat, 2007). However, at least in one area then, tax studies, an old-world notion still exists (Scarlat, 2007). More specifically, Romanian university administrators have not yet necessarily found the value of tax courses to the extent that other countries’ university administrators have. This paper seeks to change that attitude toward tax courses. In fact, it endeavors to demonstrate that not only should tax courses be provided but also required of all business students because of the necessity of this knowledge to the new-world business professional. The paper begins with the discussion of the reasons for the current lack of required tax courses in Romanian university business curricula. In explanation, it mentions the combination of real-world managers, not just in Romania but elsewhere, not truly understanding the value of tax planning and then advising universities on what courses should be offered and of few available tax professors. The paper then pursues the case studies to show the importance of tax knowledge to managers. It then shows how the issue of insufficient tax professors can be solved. The paper ends by considering implications to Romanian university administrators with the conclusion following.

The USV Annals of Economics and Public Administration Volume 15, Issue 1(21), 2015
242
2. LITERATURE REVIEW Romania is definitely at the leading edge of education for developing countries (Popescu and Crenicean, 2012). However, in the survey of 94 fourth-year students, Romanian business schools were seen as not matching the level of preparation in certain business skills that these students were seeking (Glazer-Segura et al., 2007). Also, Romanian university administrators have been forced to rely more on real-world managers for curricula advice has occurred (Scarlat, 2007). This idea has received additional support (Bordean, 2012). 3. CASE STUDIES 3.1. APPLE Many Romanian business students, academics, and professionals look to Apple as the world’s ideally managed business. Innovations occur at the highest levels possible. Sales are in hundreds of billions. The company has the largest market capitalization in the history of the world and continues to improve on that record. Most importantly for at least those student Apple idolizers, the company is extremely profitable, $41.7 billion in net income in 2012, leading to some of the world’s highest salaries. In fact, compensation is so high at Apple that even the directors on its board earn $1 million each year. Leaders of Romanian companies would consider such compensation to be equivalent to winning the lottery. While the leadership style, innovations, sales, market capitalization, and profitability in general are ever cited, what gets lost in these specific successes is how important it is to Apple’s executives to manage their tax expenses and how that emphasis results in their record-setting innovations, sales, market capitalization, and profitability. Any company’s decisions can be judged as to how ethical they are. However, with that point to the side and not just an important consideration in the tax area but in any business area, the case can be analyzed for what it stands, how important tax knowledge is to any business professional. Because Apple’s executives had knowledge of not just of the currently required business core courses but also of taxes, the company was able to create offshore entities, such as Apple Operations International, without tax residency in any jurisdiction (US Senate, 2013). While Ireland utilizes management and control to test the location of tax residency, the US refers to the place of incorporation. With AOI incorporated in Ireland but not managed and controlled from there, neither taxing authority would consider it to be resident in its jurisdiction. Because of this tax knowledge then, the entity had $30 billion of financial accounting income from 2009 to 2012 but paid zero dollars in taxes (US Senate, 2013). Based on US tax rates then, this structuring literally saved over $10 billion. Further, Apple established Apple Sales International to own its offshore intellectual property in exchange for sharing in the main company’s research and development costs. Similarly, without being resident in any tax jurisdiction, its income of $74 billion from 2009 to 2012 was taxed at the rate of zero percent (US Senate, 2013). In essence, to get this rate, Apple Sales International had to be expertly structured with general business and tax knowledge to buy finished products from its Chinese supplier, sell at higher prices to other Apple entities, and then maintain those earnings. This structuring could have saved Apple, based on US tax rates on global income, almost $25 billion. For many years then, knowledge of global taxes led Apple executives to establish these entities in Ireland. The Irish government provided the special tax rate of 2 percent or less, which was below its already lowest (other than zero-percent jurisdictions) tax rate in the EU (US Senate, 2013). The less meant rates so low as .05%, .0005 in the decimal form (US Senate, 2013). Relying on check-the-box and look-through tax rules, Apple executives also deferred taxes on $44 billion of offshore income from 2009 to 2012. Check-the-box rules enabled executives to ignore lower-tier overseas entities for taxation purposes and instead have them treated as part of

The USV Annals of Economics and Public Administration Volume 15, Issue 1(21), 2015
243
higher-tier overseas entities. Transactions between ignored entities then do not exist under the US tax system and their payments to each other then become payments from and to the same higher-tier entity. Payments to and from the same entity are not considered in the US tax system. This case is true whether the payments were based on sales revenue or were dividends. Because of the time value of money, any tax payments deferred to later dates can in the interim be reinvested to earn returns on that money. Thus, roughly $15 billion in money could be reinvested. If only 4 percent return on the investment were earned over just the single year, $600 million dollars would be received. While roughly $36 billion could have been in the pocket of governments, Apple instead had access to it and could invest it on more research and development to create even more innovations, sales staff to reach even higher sales, or at the least on showing higher profitability, leading to ever higher stock prices and market capitalization. Thus, knowledge of taxes matters to business leaders. Many times, it can matter more than knowledge in any other single discipline. 3.2. HEWLETT PACKARD While not to the level of Apple in legendary status, Hewlett Packard has been at the Fortune 20 level for many years. The company’s executives used loans to return offshore earnings to the US from two overseas entities (US Senate, 2012). Hewlett Packard executives did not directly return earnings to the US as doing so would result in those earnings being subject to US taxation under the interaction between the Tax Code and Accounting Principles Board (APB) 23. Indeed, APB 23 would have required the company to report more expenses and less profitability if those earnings were not deemed to be permanently reinvested overseas and therein not subject to consideration of US tax liabilities on them. These loans were so extensive that they completely funded the cash requirements for the company’s US operations (US Senate, 2012). In fact, Hewlett Packard would have had insufficient cash to continue in business in the US if not for these loans (US Senate, 2012). In any given year, the US parent could have been borrowing between from $6 to $9 billion (US Senate, 2012). 4. SOLUTIONS TO SHORTAGE OF TAX PROFESSORS University administrators can seek funding from private sources to endow professors’ salaries. For instance, the Big Four accounting firms utilize endowing and then naming professors as an important advertising method to get future students from those respective universities interested in working for their firms. Also, the Big Four enjoy the opportunity to collaborate with such academics, in exchange for the endowment then, in providing tax advice for their clients. Many universities have as currently employed “so-and-so,” the Deloitte, Ernst & Young, KPMG, or PwC professor of accounting or tax. By approaching the Big Four for funding, administrators could then provide the necessary level of compensation to attract tax professionals to higher education. However, university administrators with an interest in change with regard to tax should also try to push their universities and therein the Romanian government at large to fund and require that discipline. 5. IMPLICATIONS The successful negotiation to get funding for, provide, and require tax courses would involve sharing some of what has already been discussed in the case studies. First, graduates of Romanian university colleges of business should have the requisite knowledge necessary to succeed in that field, or the university is not completing its educational mission. As the paper has previously demonstrated, tax knowledge is equally (if not many times then more) important to business professionals as other required courses, financial accounting, economics, finance, and management.

The USV Annals of Economics and Public Administration Volume 15, Issue 1(21), 2015
244
Second, individuals who decide to enter the tax field, given the high level of compensation, can actually give back to the university who educated them. Donations to be able to employ more tax professors can come from the students who have just been educated at this university in this discipline. Next, if the tax course of study is provided, more students would be attracted to enroll at that particular Romanian university. For example, if any consumer has only enough time to shop at one location, all other things equal, that consumer would likely choose the store that has more products to offer. Fourth, current professors who have less students because of the newly required tax courses can be consoled easily. In the long run, as more students choose that university with its greater offering of study opportunities, the entire business program enrollment would grow. Students who enroll at the university to study tax could find financial accounting, economics, finance, or management more interesting and end up choosing those other disciplines. The end result would permit any short-term student losses to be more than compensated for in the long run with the aggregate greater enrollment. 6. CONCLUSION While there is not extensive research on the implementation of new disciplines in the Romanian context, the Bologna Declaration at the least requires universities to try to provide knowledge-based educations. As such, students should be offered the opportunity to study tax but also required to study it as part of the business core curriculum. As Scarlat (2007) mentioned, the role of Romanian universities is to prepare students for their specialized interest but also in general for the area in which they are to be employed. This approach requires tax courses to be implemented in Romanian universities. However, in the end then, Romanian universities benefit from inclusion of this course of study. 7. FUTURE RESEARCH OPPORTUNITIES THEN The future of business education is now in the balance. It is up to those individuals who care the most to push for this change. While not every university could want to follow this new approach, including tax courses is the good starting point. However, ultimately, tax courses should be required as part of the general business curricula at every university. Other research opportunities exist. Surveys of current students’ perceptions on the issue could be completed at the various universities. However, before surveying, the researcher should provide the students with the opportunity to understand the value of tax courses. To be fair then, the alternative view could be presented. Tax courses as require would lessen the amount of electives or remove other business core courses from the curricula. Students do enjoy the opportunity to have electives so as to better construct what subjects are of primary importance to each of them individually. Removing other business core courses should primarily be of an issue to the current professors in those areas. Nevertheless, if the growth occurs by being first to the market with these offerings, long-run growth in enrollments should reach the courses with lower enrollment in the beginning because of this proposal. While surveys of specific Romanian universities can be of importance, comparative surveys would be of even more benefit. The French university v. the Romanian university would be an example. The researcher could analyze the various options at the French university, the related costs, and students’ perceptions. Then, the researcher could compare those results to the Romanian university’s results. More research should be finished on how important taxes are to managers in Romania. While anecdotal evidence supports the discussions in this paper, greater information in the area can only be more helpful.

The USV Annals of Economics and Public Administration Volume 15, Issue 1(21), 2015
245
More research should be completed on the availability of tax professors and venues to educate tax professors in Romania. This knowledge would better enable schools of business to deal with how to fund the employment of such professors. Finally, government support of this move should be considered. While governments should not necessarily have strong influences on business school curricula, involving the Romanian government could lead to greater support for this endeavor. Surveys could be the primary methodology. This research could lead to projects on what the budgetary support has been for universities over the years. Those results could provide greater background for how difficult it would be to support the creation of tax courses.
BIBLIOGRAPHY 1. Bordean, O., (2012), Business Students’ Perceptions on Corporate Governance, International Journal of Arts and Commerce, 1, 4. 2. Glaser-Segura, D., Mudge, S., Batianu, C., and Jianu, I., (2007), Quality Improvement of Business Education in Romanian Universities: The Student as Customer and Client, Higher Education in Europe, 32, 2-3. 3. Popescu, M., and Crenicean, L., (2012), Innovation and Change in Education—Economic Growth . . . in Romania in the Context of Knowledge-Based Economy, Procedia—Social and Behavioral Sciences, 46, 3982-3988. 4. Scarlat, C., (2007), Developing New Curricula for Engineers’ Entrepreneurial Education: Romanian Experience, World Transactions on Engineering and Technology Education, 6, 2. 5. US Senate, Permanent Subcommittee on Investigations, (2012), Offshore Profit Shifting and the US Tax Code – Part 1 (Hewlett Packard), http://www.hsgac.senate.gov/subcommittees/investigations/hearings/offshore-profit-shifting-and-the-us-tax-code (Accessed on December 11, 2014). 6. US Senate, Permanent Subcommittee on Investigations, (2013), Offshore Profit Shifting and the US Tax Code – Part 2 (Apple), http://www.hsgac.senate.gov/subcommittees/investigations/hearings/offshore-profit-shifting-and-the-us-tax-code_-part-2 (Accessed on December 11, 2014).

The USV Annals
of Economics and
Public Administration
Volume 15,
Issue 1(21),
2015
246
THE IMPACT OF THE FOREIGN CAPITAL BANKS ON
ENSURING FINANCIAL STABILITY ON LONG TERM
IsacBORS
UniversityofEconomicStudies,Bucharest,[email protected]
Abstract: The present study is focusing on analysing the role played by the foreign banks within the national and
international banking system as well the impact the foreign banks have on the autochthon banking system, on the financial activity, on the real economy and on the financial stability on long terms.
The research conducted highlights the fact that along the positive impact on the banking system and on the economy of the host country, generated by their quality as vectors of mobilizing and directioning the international financial flows towards the host country, there can also be considered a negative impact. The study shows that the impact of the negative effects, that have as main cause the reversibility of the international financial flows, depends, on a great extent, on the specific conditions of the host country, on the characteristics of the foreign banks, but mostly, by the share held by the foreign countries within the framework of the host banking system.
Starting from the role played by the capitalization of the banking system to ensure financial stability, the research made on Romania’s case shows both, the positive effects generated by the presence of the foreign banks and also, their vulnerability in front of this excessive dependence on the foreign capital induced by this presence. The solution to reduce this dependence can only come from the autochthon capital direction whose mobilization may countervail the gap made by the foreign banks and, by surceasing the process of financial disintermediation, to ensure the maintenance of the financial stability on long term.
Key words: financial stability, foreign banks, banking capital, globalization, financial crisis.
JEL classification: F21, F23, G21, G28.
1. INTRODUCTION
The globalization phenomenon that has started since the 70s and that materialized mainly through ample profound deregulation and capital market liberalization processes, has become the determinant for a long period of economic growth registered in the last forty years on the global level. There are undisputable economic and social benefits deriving from this process, the financial globalization bringing its contribution to the improvement of the macroeconomic performance, to the institutional development and to the appropriate risk management, not only in the developed countries as in the emerging ones, as well.
However, the global crisis registered between the years 2007-2008 represents, according to Lane (2012), a test for globalization as model, as, apart from the positive contribution brought to the economic and social development, this globalization process has determined the spread of the financial crisis. The foreign banks action as well as the quick swelling of the banking balance sheet represent the two lines identified by the author, that, induced by the financial globalization, have contributed, to the increase of the vulnerability of the loaning market and eventually, to the activation of the crisis spread. Definitely, I have to emphasize the idea that, in the absence of these vectors, I generally consider the foreign banks and investors, whose activity is based on the freedom of capital movement, and, under these circumstances, it is difficult to say which were the exact funding resources needed to support the process of economic growth recorded especially in the emerging countries.
The reformation of the regulation and supervision setting to ensure the financial stability has to consider both, identification and management of systemic risk, induced or aggravated by the phenomenon of globalization, as well as the need to ensure future economic development conditions. Strengthening the resilience of the financial system should not lead to stagnation or even economic underdevelopment.

The USV Annals of Economics and Public Administration Volume 15, Issue 1(21), 2015
247
One of the most important course of action in reforming the framework of ensuring financial stability is focusing on the capitalization of the banking system as an important post in the process, direction that is promoted and supported by the new Basel III agreement on the global level. By the macroprudential approach, the reform suggested by the new Basel III agreement, is aiming at improving the financial system resistance to shocks by actions focusing on two main directions: the improvement of the capital base and of the liquidity. As the first course of action, namely, the improvement of the banking system capitalization, that, in my opinion is the most important, is expected to improve the capital basis from the quantity and quality points of view, it is to raise the question which direction to follow in the case of the emerging countries, as in the case of Romania, considering the modest capacity of mobilizing the necessary amount and the necessary quality of capital. The present article has the main objective of studying the positive or negative effects, as appropriate, of the presence of the foreign banks in the autochthon financial system and the identification of solutions to the issue of improving the banking capital base, a recurrent problem of the countries with less developed financial systems, also considering the fact financial stability is not the last objective of the reform, it is just one of the means of ensuring sustainable development.
Further, the work is structured as follows: Section 1 Introduction; Section 2 Review of scientific literature on the role of recapitalizing the banking system in order to ensure stability; Section 3 Analysis of the impact of the presence of foreign banks in the autochthon banking system; Section 4 Conclusions.
2. RECAPITALISATION OF THE BANKING SYSTEM – THE MAIN STEP TO IMPROVE THE RESILIENCE TO SHOCK
The literature is replete with studies supporting the role of capital as an important pillar in
supporting financial stability. Most researchers who considered this issue concluded the fact, supported by Caruana (2012) or by Brei and Gadacnez (2012), that more capital and better quality is the appropriate step that can lead to strengthening the resilience of the financial system to shocks.
Vasquez and Federico (2012), seeing the complementarity of the two courses of action of the Basel III, respectively, capitalization and liquidity, demonstrate that a better capitalization improves the banks capacity to be more resistant to crisis situations. Providing liquidity is essential in fighting against a crisis situation, however, the banks capacity to generate liquidity is closely related to the leverage. In the same time, the leverage, that is a measure of capital relative to total risk-weighted assets held, besides the fact that it is closely correlated with the size and quality of the capital ratio, it is one of the causes of the pro-cyclicality phenomenon which is specific to the financial activity.
Pro-cyclicality of the banking activity amplifies the business cycle and is seen by many researchers (Drehmann, and Tsatsaronis Borio (2011), Caprio (2010), Cardarelli, Elekdag, Lall (2009)) as the main cause of financial instability. The explanation is simple, during the economic boom, the banks, under the impact of leverage, of the increase of the assets value and of the undervaluation of risk, they expand their balance sheets at an accelerated rate. Subsequently, during the phase of economic decline, when the financial shocks result into great loss, simultaneously takes place an erosion of the capital ration, a diminishing in the value of the assets and an increase of the associated risks, so that, in the end, a phenomenon of credit compression and of financial disintermediation takes place which leads to economic collapse.
In the given case, the most appropriate instrument to fight against pro-cyclicality is the capital that can contribute, by an established anti cyclical component, to shock attenuation. Practically, the anti cyclical characteristics of the instrument is determined by the possibility to make up some capital buffers during the good times (economic growth) that can be used for shock absorption occurred in bad times (economic decline).
For this purpose Cardarelli, Elekdag and Lall (2009) state that restoring the capital base of banks is the most secure way to stop the economic downturn, when the banks were caught with over expanded balance sheets when the economic crisis set off, and that is at the regulators’ hand.

The USV Annals of Economics and Public Administration Volume 15, Issue 1(21), 2015
248
Nier et al. (2008) in their turn show that there is a direct link between the aggregated capital of the entire banking system and the probability of bankruptcy of banks in the system, given the fact that a low level of aggregated capital weakens its resistance, seen as a whole, by amplifying the systemic risk and the contagion effect.
Therefore, as you can see, the literature shows unequivocally the importance of capital in an greater amount and of a better quality, for ensuring financial stability, however, designing an operational framework of capital management remains a major challenge. Capital is the most appropriate instrument to counter pro-cyclicality and to restore confidence, which is relatively a simple instrument and which eliminates issues of discretionary policies. Capital management challenges are related to the sizing the optimal level and to the timing, in other words, when the capital reserve should be increased, to what extent and when to be used.
Given this objective, to make the banking system more resistant, regulators have proposed, in their turn, through Basel regulatory framework, a series of measures that emphasize the role of capital. Since 2004 the Basel II standards have been established which introduced minimum capital requirements for banks to cover credit risk and operational risk. By this regulatory framework they established principles for the necessary estimates can be made both for banks and for supervisors regarding capital adequacy to the assumed risks. The financial crisis has shown the need to review these standards, so in 2010 the Basel Committee published the new agreement Basel III (BCBS, 2010). The new regulatory framework is a reform of the previous agreement designed to increase resistance to the existing banks and of the financial system in general.
Basel III aims to increase the strength of the system / banks based on the important combined role played by the liquidity and capital, the conclusion being that a stronger capitalization is associated with a lower probability of recording banking crises and with less severe costs to affect the system.
Finally, restoring capital base is seen by the literature as the first step in restoring confidence and ensuring financial stability, however, for countries with less developed financial systems, affected by the shortage of resources and where the banking system is dominated by banks with foreign capital, solving this problem can become particularly difficult, with adverse effects on the level of financial intermediation.
3. IMPACT OF THE FOREIGN BANKS ON THE EVOLUTION OF THE
AUTOCHTHON FINANCIAL SYSTEM 3.1 ADVANTAGES AND DISADVANTEGES OF FOREIGN BANKS PRESENCE
On the background of globalization the role of foreign banks has increased permanently on a
global level occupying an important position in the domestic financial intermediation. The inability of some countries to raise sufficient capital to support banking activities and hence the real economy was offset by the increased role of foreign banks in the local financial systems that, entering these markets have contributed decisively to increase levels of capitalization and liquidity through intake capital and easier access to international financial resources.
The process of strengthening the role and position of foreign banks in the global financial system, shown graphically in Table no. 1, confirms the extent of the phenomenon and the accelerating trend in recent years.
Table no. 1 Evolution of the capital percentage of foreign banks among total banking sector in different countries Tara 1996 1997 1998 1999 2000 2001 2002 2003 2004 2005 2006 2007 2008 2009
Romania 21 32 39 45 57 57 63 70 70 74 81 85 81 81 OECD 22 22 23 24 24 25 26 27 27 27 27 28 28 28 USA 16 16 15 17 19 21 21 21 23 24 24 27 29 32 UK 45 46 47 48 48 48 49 51 53 54 54 56 57 57

The USV Annals of Economics and Public Administration Volume 15, Issue 1(21), 2015
249
Japan 0 0 0 0 0 1 1 1 1 1 1 2 1 1 Italy 3 3 4 5 5 5 5 5 5 5 7 10 10 10 France 7 7 6 7 8 8 7 7 6 6 6 6 6 6 Germany 10 11 10 10 11 12 13 13 12 13 13 13 14 14 Hungary 68 73 75 78 78 81 79 86 85 85 90 93 93 92 Ireland 83 83 84 80 81 85 89 89 89 89 90 90 90 90 Czech R 39 39 44 52 52 54 54 57 57 55 59 64 67 67
Sources: Claessens and van Horen 2012
As it can be seen there has been a lasting phenomenon which affected all countries, certainly on a greater or lesser extent depending on the characteristics and evolution of each economy. On the other hand it is clear, however, that less developed countries were affected earlier, Romania being included in this category. In Table 1 we made a selective presentation of the evolution of some banking systems in the countries of Europe, nevertheless, the analysis and the data presented by the authors (Claessens and van Hören, 2012) are more comprehensive and reinforce the idea that, in particular, less developed economies experienced this kind of development, so that, shares above 80% are to be found in Albania, Bolivia, Nicaragua, Slovakia, Burkina Faso, Burundi, Cameroon, Rwanda, Uganda, etc.
This process has been accompanied by a number of beneficial effects, in addition to increased capitalization and liquidity of the system, which favored its acceleration and which are highlighted by Cull and Peria (2011) such as increased autochthon banking competition, potentiation/ building up of the customers’ economic competition, increasing accessibility of financial services and even ensuring financial stability. Romania was no exception to these global trends and introducing technical progress, novelties in the field, the contribution of know-how, but mostly, the easy access to foreign funds, generated by the presence of foreign banks, have brought their contribution to registering a stronger stabilization and development of the banking business in Romania. As shown in Figure 1, recovering the capital base after the banking crisis of 1998-1999, it was achieved solely on their own merits, for later the financial intermediation to grow strongly foreign banks have expanded their networks in many areas of the country, providing banking services to relatively broad categories of the population.
The extent and the evolution of the penetration process of the autochthon financial systems by foreign banks, accompanied by the benefits listed above, are explained by McCauley (2012) who argue that the meaning of international financial flows and capital liquidity are in close correlation with the capital market conditions. When financial and capital markets are characterized by calm and low volatility, the capital flows from developed economies to emerging markets, and when volatility increases, the flows are reversed.
Therefore, this phenomenon is reversible and precisely, this reversibility induces the prerequisite of some negative effects that may occur. Claessens and van Hören (2012) show that in addition to beneficial effects, since 2007 there has been a number of adverse effects that can be highlighted, among which, the most important one is reducing lending facilities of the host country economies during the financial crisis.
The problem of adverse effects generated by the position improvement of the foreign banks in the local financial sector has been addressed in other studies which point out that there are difficulties that may occur, caused by contagion effect, namely, transmission of shocks from parent banks to their subsidiaries, with negative consequences for their current work (Cetorelli and Goldberg, 2011).
Risks induced by the foreign banks to financial stability are pointed out by Danila (2011, 2013) who highlights the vulnerability of an economy, such as the autochthon one, which is induced by the dependence of major banks on the capital coming from the outside and the volatility of these financial flows.
Provided to the change of direction of the financial flows the new capital and liquidity requirements imposed by Basel III are added, it is expected a worsening of the adverse effects in the

The USV Annals of Economics and Public Administration Volume 15, Issue 1(21), 2015
250
absence of adequate support from their own groups of shareholders of the foreign banks. The consequence of this kind of situation is that foreign banks will be forced to reorganize their activity which will be based mainly on resources resulting from savings and less on loans, fact that will affect lending, especially supporting projects of investment on long terms.
3.2 MORE OR LESS RECENT EVOLUTIONS AND THE CURRENT SITUATION
To emphasize the positive or negative impact, as appropriate, of the presence of foreign banks in Romania, I have made, in this present study, an analysis of the evolution of the Romanian banking system over a long period of time, in order to point out the significant events that have happened. The present analysis focused on studying the evolution of the banking capitalization in the period 1996-2013, which is, in my opinion, a relevant indicator on the commitment of foreign banks present on the autochthonous market and, consequently, to determine the positive or negative effects recorded. The analysis took into account both quantitative aspects, expressed by the variation of total own funds at aggregate level, and qualitative aspects, expressed by the variation analysis of Tier 1 capital, noting that, the study focused on the real changes to eliminate the effect induced by inflation, the situation is shown in Figure no. 1.
Figure no. 1 Evolution of banking capitalization in Romania Sources: NBR;author’s calculations;
Following the analysis of the evolution of the capital base of the autochthonous banking system there can be identified three distinct phases:
first stage 1996 - 2000 is characterized by a phenomenon of strong erosion of the capital base determined by the economic crisis that hit Romania and brought the banking system to the brink of collapse (there were some resounding bank failures), requiring extensive rehabilitation and reorganizing processes;
the second phase 2000 - 1998 is characterized by accelerated development of the banking system and a permanent consolidation of the capital base. Following the banking system reorganization and its repositioning on sound bases, under the impact of foreign capital injection, there is an unprecedented development recorded. However, it will be stopped in 2008, once with the start of global financial crisis;
the third stage 2008 - 2013 is characterized by the inability of the system to recover its capital base to the required level, so that, even if there were not significant problems

The USV Annals of Economics and Public Administration Volume 15, Issue 1(21), 2015
251
recorded, it suffered a process of financial disintermediation, counterproductive to the development needs of domestic economy and to ensure financial stability;
The phenomenon of erosion of the capital base can be seen much better in a comparative analysis Romania versus EU of the capitalization variation in real terms, in which the year 2008 is taken as reference point (Figure no. 2):
Figure no. 2 Evolution of bank capitalization –Romania vs EU - real variations fixed base 2008
Sources: NBR; ECB; author's calculations; As it can be seen until 2008 the capital base has permanently been improved in the EU and
in Romania, for later, if in the EU the recapitalization efforts continued, in our country this has not happened any longer. The explanation must be studied in the big share the foreign banks are holding in the domestic banking system under the pressure of the problems in their own financial centers that have not provided sufficient support so that it came to an erosion of capital, significant decreases being recorded in real terms in 2011, the trend being the same for the following period of time. It is worth pointing out that while in the EU the financial and banking system is still improving through new capital contributions, registering an increase of 30.76% in mid-2012 comparing to December 2008, in Romania it is registered a decrease of 9.23% in real terms, of the volume of aggregated capital.
4. CONCLUSIONS In the present study I investigated the effects of the presence of the foreign banks on both
levels - the domestic banking system and the economy of the host country, looking at things from the perspective of the need to ensure financial stability. The analysis conducted on the development of the banking sector shows that the beneficial effects of their presence are undeniable. Without their presence it is difficult to explain how it could have sustained the economic development of Romania in the period 2000 - 2008 in the absence of capital injections and funds attracted from foreign banks. It is also hard to believe that restoring the capital base and the banking system after the crisis of 1998-1999 would have been achieved within such a short period of time without the contribution of these banks.

The USV Annals of Economics and Public Administration Volume 15, Issue 1(21), 2015
252
At the same time the reversibility of financial flows and reform of the global regulatory framework, shows that in addition to benefits, especially in the given case of big shares held by foreign banks in the domestic banking system. The effects of this presence on the domestic financial system therefore depend primarily on the share but also on specific local conditions and the type and characteristics of the respective banks. However, looking at things from the perspective of financial stability and the necessity of increasing financial intermediation, excessive dependence on external capital induced by foreign banks is an extreme vulnerability.
Solving this problem must be sought in improving the capacity of local capital to take over the activities of foreign banks, in this way, Claessens and van Hören (2012) show that domestic banks in emerging countries can take the opportunities of market redistribution, thus gaining a stronger position on the market, this way, reducing the effects generated by reversal of financial flows at the global level and the acceleration of disintermediation process. In the same sense, there comes the proposal made by Danila (2011) to allot, in the case of Romania, local public and private resources for the establishment of a systemically important bank through which the public policies can be implemented so that they can achieve financial stability in the context of macro-prudential approach.
Promoting some policies to support the development of local banks with domestic capital, either it is the establishment of a new financial institution or recapitalization of some existing ones, such as banks that are part of the Creditcoop network, it may help to increase financial intermediation, especially in those areas of the country and those activities for which any other credit institutions show no interest.
BIBLIOGRAPHY
1. Brei, M., Gadanecz, B. (2012), Public recapitalizations and bank risck: evidence from loan spreads and leverag, BIS Working Papers No 383, Bank for International Settlements;
2. Basel Committe on Banking Supervision - BCBS (2010), Basel III: A global regulatory framework for more resilient banks and banking systems, December 2010 (rev June 2011), Bank for International Settlements, http://www.bis.org/publ/bcbs189.pdf;
3. Caruana, J. (2012), Financial and real sector interactions: enter the sovereign ex machina, BIS Papers No 62, Proceedings of conference “Financial sector regulation for growth, equity and stability”, Monetary and Economic Department, Bank for International Settlements;
4. Cardarelli, R., Elekdag, S., Lall, S. (2009), Financial Stress, Downturns, and Recoveries, IMF Working Paper No. 09100, International Monetary Fund.
5. Cetorelli, N., Goldberg, L. (2011), „Global Banks and international Shock Transmission: Evidence from the Crisis”, IMF Economic Review, Vol. 59, Pp. 41-76, International Monetary Fund;
6. Claessens, S., van Horen, N. (2012), Foreign Banks: Trends, Impact and Financial Stability, IMF Working Paper No. 1210, International Monetary Fund;
7. Cull, R., Peria, M. (2011), Foreign Bank Participation în Developing Countries: What do We Know about the Drivers and Consequences of this Phenomenon, forthcoming în Gerard Caprio (Ed.): Encyclopedia of Financial Globalization, Elsevier, Amsterdam;
8. Dănilă, N. (2011), Poate contribui la stabilitatea financiară o bancă de importanţă sistemică având capital autohton?, Banca Naţională a României, http://www.bnr.ro/Prezentari-si-interviuri--1332.aspx;
9. Dănilă, N. (2013), Noul model de business al băncilor comerciale și provocările lui, Banca Naţională a României; http://www.bnr.ro/Prezentari-si-interviuri--1332.aspx;

The USV Annals of Economics and Public Administration Volume 15, Issue 1(21), 2015
253
10. Drehmann, M., Borio, C., Tsatsaronis, K. (2011), Anchoring countercyclical capital buffers: the role of credit aggregates, BIS Working Papers No 355, Bank for International Settlements.
11. Lane, P.R. (2012), Financial Globalisation and the Crisis, BIS Working Papers No. 397, Bank for International Settlements ;
12. McCauley, R.N. (2012), Risk-on/risk-off, capital flows, leverage and safe asset, BIS Working Papers No. 382, Bank for International Settlements;
13. Nier, E., Yang, J., Yorulmazer, T, Alentorn, A. (2008), Network models and financial stability, Working Papers No. 346, Bank of England.

The USV Annals
of Economics and
Public Administration
Volume 15,
Issue 1(21),
2015
254
SECTION 4
STATISTICS, ECONOMIC INFORMATICS
AND MATHEMATICS

The USV Annals
of Economics and
Public Administration
Volume 15,
Issue 1(21),
2015
255
TERTIARY EDUCATION: WHERE TO?
AN ANALYSIS AT THE REGIONAL LEVEL IN ROMANIA
ProfessorPhDMarianZAHARIA
Petroleum‐GasUniversityofPloiesti,[email protected]
LecturerPhDAnielaBĂLĂCESCU
“ConstantinBrancusi”UniversityofTarguJiu,[email protected]
LecturerPhDAdrianNEDELCU
Petroleum‐GasUniversityofPloiesti,[email protected]
Abstract: Education, alongside of employment, research and innovation, climate change and energy, and combating
poverty are the fundamental directions of action within the framework of the Europe 2020 strategy. Though still before 1990, Romania has granted very high attention to this area, unfortunately, next years have marked a series of regressions which led to alarming increases in dropout rates. In 2002, the rate of persons who leave early systems of education and vocational training between the ages of 18 and 24 recorded in 2002 a level of 23%. On the other hand, the economic crisis has had a strong impact on this indicator. If in the period 2003-2008 it had fallen to 15.9%, in 2013 was 17.3%, the 2020 target is 11.3%. Based on these observations, the paper analyzes the evolution of tertiary education in Romania, at the regional level in the period 2003-2013 and the ways that it is influenced by the evolution of gross domestic product in developing regions in Romania.
Key words: dropout, econometric model, Romania, tertiary education. JEL classification: C320, I250, I290, R110 1. INTRODUCTION Until 2013, according to the International Standard Classification of Education (ISCED 97),
tertiary education was by level 5, and access to it was a condition of completion of upper-secondary education. Regarding the structure of tertiary education, there were two categories: short cycle (the duration of studies was 2-3 years and at the end of study finalized with the graduation diploma) and long-cycle (the duration of studies was 4-6 years and at the end of study finalized with the Bachelor's degree).
After 2013, according to the International Standard Classification of Education (ISCED 2011) tertiary education contents and academic education license with durations of studies by 3-4 years (level 6), academic education license with durations of studies by 5-6 years (level 7) and higher education with doctoral studies and postdoctoral (level 8). Although in UE28 is acting towards convergence in all fields, in education, in Romania still exists some particularities (Enăchescu and Zaharia, 2013) also related to the development and implementation of ICT in education (Enăchescu, 2014) and other sectors (Zaharia et al., 2010)
In the Europe 2020 Strategy, the target for tertiary graduation rates is 40%. For many European countries, included Romania this target is very difficult to achieve. The tertiary graduation rate has to be increased by more than 20% by 2020, which means more than doubling the number of tertiary graduates in just one decade. (Roth and Thum, 2010).
Low graduation rate of tertiary education and dropout produce serious consequences, easy to predict, such as: unemployment, poverty, low quality of life.

The USV Annals of Economics and Public Administration Volume 15, Issue 1(21), 2015
256
Dropout is determined by a variety of factors and it should be analyzed by two points of view, firstly from the individual perspective of dropping out (such as motivation, etc.) and secondly from the institutional perspective (Rumberger, 2001).
Dropout from learning is not only (or perhaps mainly) the result of academic weakness. Unforeseen financial difficulties may play a role in many cases, particularly when brought on by such factors as tuition fee increases or a downturn in the economy (with less student employment opportunities). In such circumstances, the availability of student loans (for tuition fees or for living expenses, as appropriate) may be important in mitigating potential student dropout. (Ziderman, 2013).
Another aspect to be considered in analysis of tertiary education is the migration for education. Within the last years, an ever higher number of youngsters started migrating – at least temporarily – to finish their studies. These international students are not always considered migrants, in the formal sense of the word, but they do have a significant social and economic impact, not only in the countries they leave behind, but also in the ones where they study. In many cases, this migration for education is also a prelude for longer trips abroad or even permanent emigration. (Pociovălşteanu, 2012). Half of all incoming students from inside the European Higher Education Area choose United Kingdom, Germany, France and Austria as their study destination. (Nicolescu, 2014)
In elaborating this study, the research method used was the quantitative method, based on linear multi-factor econometric model. (Zaharia and Gogonea, 2008).
Econometric analysis aims to identify a functional relation between percentage of total population for age 18 to 24 years which early leavers from education and training, percentage of population aged 25-64 with tertiary education and GDP per capita, at regional level in Romania.
The main problems pursued in analysis are: estimation of parameters of the model, the quality of the estimate, the verification of the hypothesis, quality of prediction, the choice of the best model and parametric and nonparametric correlations. In the analysis, as IT support, were used SPSS and Excel (Oprea and Zaharia, 2011) and were used the official data series provided online by the Eurostat on the above-mentioned indicators, for the period from 2003–2013, and for the following economic development regions of Romania: North West, the Central Region, North-East, South-East, South-Muntenia, Bucharest-Ilfov, South-West, West.
The Evolution of Territorial Distribution on the Population with Tertiary Education In the period 2003-2013, the percentage of population with tertiary education in the total
population aged 25-64 years have been upward trends, both in Romania and in the four Macro-regions. Average annual increases have ranged from 0.49 percentage points in Macro 2 and 0.76 percentage points in Macro 3, average annual growth in Romania was 0.61 percentage points (Fig. 1).
In the same period, at the level of EU-28, the average annual growth rate was 0.77 percentage points, with 0.16 percentage points more than in Romania. These evolutions have made that the gap between Romania and EU-28 in this area to grow up from 11.2 percentage points in 2003, to 12.8 percentage points in 2013. It is also pointed out that in none of macro regions haven't recorded growth which leading to convergence towards the EU average.
Regarding the evolution of the gender of the population with tertiary education, in the period under review recorded some differences.
The share of population with tertiary education, the male population, increased by an annual average values between 0.37 percentage points in Macro 2 and 0.57 percentage points in Macro 3. With the exception of Macro 2, both in the other macroregions and in Romania the gap average from UE28 has continued to increase. Noting that, in 2009, with the exception of Macro 4, there has been a stagnation and even regression (Macro 1) of share of male population with tertiary education. This is a consequence of the outbreak of the economic crisis which has led to unemployment and reducing the incomes of households. Also, the percentage of the female population with tertiary education in the total female population aged 25-64 years has registered

The USV Annals of Economics and Public Administration Volume 15, Issue 1(21), 2015
257
increases. Their annual average values have evolved between 0.60 percentage points in Macro 2 and 0.96 percentage points in Macro 3.
%
5%
10%
15%
20%
25%
30%
2003 2004 2005 2006 2007 2008 2009 2010 2011 2012 2013
Macro 1 Macro 2 Macro 3 Macro 4 EU28 Romania
Figure 1 - Population aged 25-64 with tertiary education attainment at Macro level Source: own construction based on Eurostat data series: http://ec.europa.eu/eurostat/data/database, Population
aged 25-64 with tertiary education attainment by sex and NUTS 2 regions [edat_lfse_11], accessed on 15.02.2015
Comparing the annual average increases of persons with tertiary education in the male
population, respectively the female population, results that increases recorded by the share of tertiary education in the female population is higher than those recorded in the case of the male population. If until 2008, the share of male population with tertiary education was higher than that of the female population, starting 2009 the places are change Thus, at the level of Romania in 2003, 10.3% of the male population aged 25-64 years have tertiary education, while the female population share was 9.1%, in 2013 the share of female population with tertiary education reaches 16.4%, and the share of the male population reaches only 14.9%.
In Romania, this change of places occurred since 2009 and it could be a consequence of the decline in the standard of living due to the breakout of the economic crisis. But on the other hand, considering the fact that this phenomenon has been posted at EU-28 level since 2006 and continues to increase (in EU-28, the difference between the share of the female population with tertiary education and the share of male population increasing from 0.1 percentage points in 2006 to 2.9 percentage points in 2013), this phenomenon is also the consequence of increasing the role of the female population in the EU countries.
In the period 2003-2013, the evolution of population aged 25-64 with tertiary education attainment at development region levels recorded both similarities and differences. Of course, the largest share of the population aged 25-64 with tertiary education was recorded throughout the period, in Bucharest-Ilfov region where their share has increased from 22.6% in 2003 to 33.3% in 2013, the biggest increase recorded by 2011, with 2.8 percentage points from the previous year.
Also, in 2008 the share of population aged 25-64 with tertiary education exceeds the average value of the EU-28 with 4.7 percentage points, and with 16.5 percentage points, the value of this indicator registered in Romania. After 2011, the intensity of increase has decreased so that in 2013, the share of population aged 25-64 with tertiary education in Bucharest-Ilfov region was with 4.8 percentage points over the average EU-28 and with 17.6 percentage points above the average recorded in the country.
In the others seven development regions of Romania (Fig. 2), evolutions have been more modest. The values recorded in these were far below the average of both EU-28 as well as below

The USV Annals of Economics and Public Administration Volume 15, Issue 1(21), 2015
258
the average recorded in Romania. So in 2013, the biggest gap was recorded in the regions North-East and South-Muntenia (-13.6 percentage points compared to the average registered in EU-28 and -2.4 percentage points compared to the average registered in Romania), and in 2013, the last place was occupied by South-Muntenia region (-16.6 percentage points compared to the average registered in EU-28 and -3.8 percentage points compared with the average registered in Romania).
7%
8%9%
10%
11%12%
13%
14%15%
16%
2003 2004 2005 2006 2007 2008 2009 2010 2011 2012 2013
North-West
Center
North-East
South-East
South -MunteniaSouth-WestOlteniaWest
Figure 2 - Population aged 25-64 with tertiary education attainment at development
region levels without Bucharest-Ilfov region Source: own construction based on Eurostat data series: http://ec.europa.eu/eurostat/data/database, Population
aged 25-64 with tertiary education attainment by sex and NUTS 2 regions [edat_lfse_11], accessed on 15.02.2015
Economic evolutions from the period 2003-2013 have influenced the evolutions of share
population aged 25-64 with tertiary education in the seven regions causing periods of convergence and periods of divergence. Thus, if in 2003 differences between the highest and the lowest share was 2.5 percentage points, in 2006 this difference drops to 2.1 percentage points, and in 2009 to 5.2 percentage points, the highest value recorded in the West Region by 14.3% , and the lowest in South-Muntenia region by 9.1% . In 2013, the gap was reduced to 2.8 percentage points, the biggest values registering in the South-West Oltenia and Center regions (14.7%), and lowest in South-Muntenia region 9.1% (11.9 percent).
Analyzing the evolutions of the shares population aged 25-64 with tertiary education it can observed a grouping of the seven regions into two groups. The first group includes the North-West, Center, South-West Oltenia and West regions, with the values of the shares of the population aged 25-64 with tertiary education ranging from 14.3% to 14.7%. The second group includes the Moldova and Eastern of Muntenia regions (North-East, South-East and South-Muntenia) with the values of the shares of the population aged 25-64 with tertiary education between 11.9% and 12.5%.
Regarding the shares of male population and female population with tertiary education regions by the regions, in generally remains the trend highlighted above regarding gap of share of male population with education tertiary by the female population with tertiary education. Exception makes the West region where, throughout the period under review, the share of male population with tertiary education to exceed the value recorded by the female population. Thus, while in EU-28, at the level of Romania and in all other regions the differences between shares of male population and female population with tertiary education were negative; in the West region the

The USV Annals of Economics and Public Administration Volume 15, Issue 1(21), 2015
259
difference was by 2 percentage points (15.5% for the male population and 13.5% of the female population).
2. EVOLUTIONS OF DROPOUT RATE Percentage of population from 18 to 24 years which early leavers from education and
training to the total population in the period 2003-2008 had a downward trend, approaching the average of EU-28 (Fig. 3). If in 2003 in Romania, the percentage population from 18 to 24 years which early leavers from education and training was 22.5%, with 6.1 percentage points, in 2008 it reduced to 15.9%, with 1.2 percentage points than EU-28 average.
5%
10%
15%
20%
25%
30%
2003 2004 2005 2006 2007 2008 2009 2010 2011 2012 2013
EU28
Romania
North-West
Center
North-East
South-East
South -MunteniaBucuresti -IlfovSouth-WestOlteniaWest
Figure 3 – Evolution of percentage of total population from 18 to 24 years which early
leavers from education and training by NUTS 2 regions. Source: own construction based on Eurostat data series: http://ec.europa.eu/eurostat/data/database, Early leavers
from education and training by sex and NUTS 2 regions [edat_lfse_16], accessed on 27.02.2015
The most significant decreases of percentage of total population from 18 to 24 years which
early leavers from education and training in the period 2003 - 2008, over the average decrease at Romania level, were registered in the regions of North-West (from 23.3% to 15.9%), the West (from 22.4% to 12.6%), the North-East (from 28.0% to 18.4%) and Center (from 21.1% to 13.6 %). However, in 2008, in four of the eight regions of Romania the percentage of total population from 18 to 24 years which early leavers from education and training, was over EU-28 average with the values between 5.8 percentage points in South-Muntenia region and 1.0 percentage points in South-West Oltenia.
Unfortunately, in the period 2008-2013, in most regions appear negative phenomena which lead either to the decrease of the rate reduction the percentage of total population from 18 to 24 years which early leavers from education and training, either its increases. In 2013 compared to 2008, in EU-28 the percentage of the total population from 18 to 24 years which early leavers from education and training, decreased by 2.8 percentage points. Compared to this evolution, with the exception of the Bucharest-Ilfov region where the decreases was 3.3 percentage points, in all other seven regions have registered unfavorable evolutions in comparison with the EU average. The most unfavorable evolutions were registered in the Center, North-East and North-West regions, where in 2013 the percentage of the total population from 18 to 24 years which early leavers from education and training, reaching 17.9%, 22.5% and respectively 15.9%. On the other hand, although in the

The USV Annals of Economics and Public Administration Volume 15, Issue 1(21), 2015
260
South-East region the percentage of total population from 18 to 24 years which early leavers from education and training, decreases with 1.0 points, this was 18.2 percent, over average of EU-28 (12.0%) and over average of Romania (17.3).
The evolution of the percentage of total population by gender from 18 to 24 years which early leavers from education and training, record some differences. In comparison with the values recorded for the total population aged 18-24 years, in 2008 the percentage of male population which early leavers from education and training, was under the average EU-28 in five regions (North-West Center Bucharest-Ilfov South-Muntenia West, and West), while the percentage of female population which early leavers from education and training, was below the average EU-28 in only four regions (North-West, Center, Bucharest-Ilfov and West). Comparing the percentages of male and female populations of which early leavers from education and training, at level of EU-28, the corresponding percentages of male population are higher than those recorded by the female population.
In Romania, except Bucharest-Ilfov region where recorded an evolution similar to the Europe, in the other regions differences are both positive and negative, being determined primarily by characteristics of economic evolutions in each region. A special situation is recorded in South-West Oltenia region where the whole period under review, the percentages of female populations which early leavers from education and training, is significantly higher than the corresponding male population. Thus, in 2003 the percentages of female populations which early leavers from education and training was 21.2%, compared with 13.8% for the male population, values recorded in 2008 was 18.8% respectively 12.6%, and in 2013 the percentages of female populations which early leavers from education and training was 16.0% compared with 13.9% for the male population.
3. CORRELATIONS AND IMPLICATIONS The percentage of total population from 18 to 24 years which early leavers from education
and training is an important indicator in evaluating the place occupied by Romania between countries of EU-28. Till now, values recorded are far from the 2020 target (11.3%).
Starting from the above observations and conclusions and as the evolution of GDP per capita in the period 2003-2011 were tested two hypotheses: on the one hand the existence of correlations between percentage of total population from 18 to 24 years which early leavers from education and training, percentage of population aged 25-64 with tertiary education and GDP per capita, on the other hand the existence of a functional relation between these. The significance level was 05.0 , corresponding to a probability of 95%. For testing the existence of correlations between the three variables, the hypotheses were:
H0: No significant dependence between parameter values H1: Between percentage of total population from 18 to 24 years which early leavers from
education and training, percentage of population aged 25-64 with tertiary education and GDP per capita there are significant correlations.
Testing the null hypothesis (H0) was carried out from three rows of 72 registered values of
the indicators analyzed in period 2003-2011 in the eight development regions. The results are presented in table 1. Both values corresponding nonparametric correlations (Kendall and Spearman) and the Pearson correlations indicate the inverse strong relations between percentages of total population from 18 to 24 years which early leavers from education and training (E_L), percentage of population aged 25-64 with tertiary education (T_E) and GDP per capita.
Taking into account the fact that all values of bilateral test (SIG. 2-tailed) are lower than the significance threshold result that the null hypothesis (H0) is rejected and accepted alternative hypothesis (H1): between the percentage of total population from 18 to 24 years which early leavers from education and training (E_L), percentage of population aged 25-64 with tertiary education (T_E) and GDP per capita there are significant correlations.

The USV Annals of Economics and Public Administration Volume 15, Issue 1(21), 2015
261
Table 1 Correlation between variables E_L, T_E and GDP
Pearson Kendall Spearman
E_L T_E GDP E_L T_E GDP E_L T_E GDP
E_L Value 1 1 1
Sig.(2-tailed) 0.000 0.00 0.00
T_E Value -0.714 1 -0.609 1 -0.779 1
Sig.(2-tailed) 0.00 0.00 0.00 0.00 0.00 0.00
GDP Value -0.734 -0.892 1 -0.619 0.621 1 -0.789 -0.796 1
Sig.(2-tailed) 0.00 0.00 0.00 0.00 0.00 0.00 0.00 0.00 0.00 Source: own assessments using SPSS
For testing the existence of a functional relation between the percentage of total population from 18 to 24 years which early leavers from education and training (E_L) and percentage of population aged 25-64 with tertiary education (T_E) and GDP there is a significant functional relation has been chosen the model:
GDPaETaaLE 210 __ (1)
The hypotheses of the test were: H0: There aren’t significant functional dependencies between the parameter values E_L,
T_E and GDP. H1: Between the parameter values E_L, T_E and GDP there is a significant functional
dependence characterized by the model (1) Taking into account the fact that the Bucharest-Ilfov region presents a series of
particularities, statistical significance testing of the model (1), was carried out in two variants. In the first variant (Variant A) have been taken into account the values of the three parameters recorded during the period 2003-2011 in all 8 regions. In the second variant (Variant B) have been removed parameter values, E_L T_E and GDP, values recorded in Bucharest-Ilfov region resulting in three data series of 63 submissions. The results are presented in Table 2.
Taking into account the Significance values F (6.64E-13 variant A and 6.53E-14 for variant B) much lower than the significance threshold chosen ( 05.0 ), result that the null hypothesis (H0) is rejected and accepted alternative hypothesis (H1): between E_L T_E values, and GDP there is a significant functional dependence described by model (1).
Table 2 Comparison between the performances of A and B variants of the model (1)
Variant A: 8 regions Multiple R R Square Std.Err Observations F Significance F
0.74590 0.55637 3.13867 72 43.26873 6.64E-13 Coefficients t Stat P-value Lower 95% Upper 95%
a0 24.70210 26.69542 4.28E-38 22.85612 26.54809 a1 -0.23464 -1.63452 0.106704 -0.52104 0.051742 a2 -0.00073 -2.68099 0.009175 -0.00127 -0.00019
Variant B: 7 regions (without Bucuresti-Ilfov region) Multiple R R Square Std.Err Observations F Significance F
0.79780 0.63650 2.53119 63 52.53113 6.53E-14 Coefficients t Stat P-value Lower 95% Upper 95%
a0 33.75014 18.15863 4.65E-26 30.03233 37.46795

The USV Annals of Economics and Public Administration Volume 15, Issue 1(21), 2015
262
a1 -0.84116 -3.46870 0.00097 -1.32623 -0.35609 a2 -0.00141 -4.21800 0.00008 -0.00208 -0.00074
Source: own assessments using SPSS and Excel (Data Analysis)
Taking into account the values of Multiple R and Std.Err, result that Variant B offers a better approximation of dependence of E_L and factorial variables T_E and GDP. This conclusion is underlined by the fact that, in the case of the variant A, the coefficient a1 corresponding variable influence T_E (percentage of population aged 25-64 with tertiary education) on E_L (percentage of total population from 18 to 24 years which early leavers from education and training), for the selected significance threshold, is not statistically significant (P_value=0.106704>0.05) and, in consequence, can not be taken into account.
On the other hand, taking into account the above observations, we believe that the model Variant B is the one that can be taken into account to describe the functional relation between percentage of total population from 18 to 24 years which early leavers from education and training and the factorial variable percentage of population aged 25-64 with tertiary education and GDP.
In these circumstances, with a probability of 95%, can be considered that an increase of 1 percentage point of percentage of population aged 25-64, with tertiary education, will cause a decrease of percentage of total population from 18 to 24 years, which early leavers from education and training, with a value between 0.35 and 1.32 percentage points. Also, GDP per capita growth with 1000 euro can lead to reduced percentage of total population from 18 to 24 years which early leavers from education and training with values between 0.74 and 2.08 percentage points.
4. CONCLUSIONS Economic evolutions in the period 2003-2013 influenced the evolutions of shares of
population aged 25-64 with tertiary education in the seven regions causing periods of convergence and divergence of these. In seven of the eight development regions of Romania, the ratio between the male population and female population with tertiary education is the same as in the EU: the share of female population with tertiary education in the total female population aged 25-64 years is higher than share of male population with tertiary education in the total male population aged 25-64 years. The exception is the West development region where, in the entire analyzed period the share of male population with tertiary education is higher than that of the female population.
In the period before the economic crisis, the share of the population from 18 to 24 years which early leavers from education and training in the period 2003-2008 had a downward trend closer to the average for the UE28. Unfortunately, the economic crisis has not only stopped the process, but reversed its trend of development. Thus, while in 2013, compared to 2008, in the UE28, the share of total Population from 18 to 24 years which early leavers from education and training, decreased by 2.8 percentage points, with the exception of the Bucharest-Ilfov region, all the other seven development regions were recorded unfavorable developments. The most unfavorable developments were recorded in the regions Center, North-East and North-West. So far, the values recorded by the share of the population from 18 to 24 years which early leavers from education and training are relatively far from the 2020 target, which for Romania is 11.3%.
The model estimated in this study shows the influence of the percentage of total population from 18 to 24 years which early leavers from education and training on the factorial variable percentage of population aged 25-64 with tertiary education and the influence of GDP per capita on percentage of total population from 18 to 24 years which early leavers from education and training. During the period analyzed, the functional connection between them is significant. Under these conditions, with a probability of 95% can be considered both increasing share of population aged 25-64 with tertiary education, as well as, the GDP per capita led to the reduce of share of total population from 18 to 24 years which early leavers from education and training, with significant value. Correlated increase in the level of education and in the standard of living of the population in all development regions of Romania, especially in disadvantaged areas constitute important strands.

The USV Annals of Economics and Public Administration Volume 15, Issue 1(21), 2015
263
Also, proper sizing of funds for education, and more attention of the legislative and executive powers for education are imperative
The results obtained can be used as decision support for decision-makers. The analysis can be improved by taking into account other influencing factors such as
financing of education, small values of this are often among the causes of dropout. This is a future research direction for the authors.
BIBLIOGRAPHY 1. Enăchescu, D. (2014). Developing ITC domain premise of sustainable development in
Romania. Annals of the „Constantin Brâncuşi” University of Târgu Jiu, Economy Series, Special Issue/2014- Information society and sustainable development, 230-235
2. Enăchescu, D.& Zaharia, M. (2013). Considerations on the evolution of attention paid to education in Romania compared to EU, in the 1998-2010 period, IEEE-MIPRO 36th International Convention, May 20-24, 2013, Opatija, Croatia, 673-678.
3. http://ec.europa.eu/europe2020/index_ro.htm 4. http://ec.europa.eu/eurostat/data/database, Early leavers from education and training by sex and
NUTS 2 regions [edat_lfse_16], accessed on 27.02.2015 5. http://ec.europa.eu/eurostat/data/database, Gross domestic product (GDP) at current market
prices by NUTS 2 regions [nama_r_e2gdp], accessed on 02.03.2015 6. http://ec.europa.eu/eurostat/data/database, Population aged 25-64 with tertiary education
attainment by sex and NUTS 2 regions [edat_lfse_11], accessed on 15.02.2015 7. http://www.uis.unesco.org/Education/Pages/international-standard-classification-of-
education.aspx 8. Nicolescu, L. (2014) Convergence and internationalization of higher education in Europe: the
case of Romania, chapter 12 in Handbook of research on trends in european higher education convergence, IGI Global
9. Oprea, C. & Zaharia, M. (2011). Elemente de analiza datelor şi modelare utilizând Excel. Editura Universitară, Bucureşti, România.
10. Pociovălişteanu, D. M. (2012). Migration for education nowadays, in Annals of the „Constantin Brâncuşi” University of Târgu Jiu, Economy Series, Issue 1/2012,
11. Roth, F. Thum, A.E., (2010), the key role of education. 2020 EU Strategy, Centre for European Policy Studies.
12. Rumberger, R. (2001). Why students drop out of school and what can be done. Conference proceedings Dropouts in America: How Severe is the Problem? What Do We Know about Intervention and Prevention? Harvard University, January 13/2001.
13. Zaharia, M. & Gogonea, R.M. (2008). Econometrie. Elemente fundamentale, Editura Universitară, Bucureşti.
14. Zaharia, M., Gogonea R.M., Busuioc M.F. & Oprea, C. (2010). The place of metalurgical high education in higher tehnical and industrial education in Romania, in Metalurgia International, vol XV, Special Issue no. 8, 187-192, 1582-2214.
15. Ziderman, A. (2013). Increasing access to higher education through student loans. CESifo DICE REPORT Journal for Institutional Comparisons, 11(2), 11-18.

The USV Annals
of Economics and
Public Administration
Volume 15,
Issue 1(21),
2015
264
MASTER STUDENTS’ PERCEPTION ON THE CORRELATION
BETWEEN ACADEMIC CURRICULA AND LABOR MARKET
REQUIREMENTS - A COMPARATIVE ANALYSIS OF MASTER
PROGRAMS IN ECONOMICS FROM BUCHAREST AND SIBIU
ProfessorPhDErikaMARIN
BucharestUniversityofEconomicStudies,DepartmentofStatisticsandEconometrics,[email protected]
AlexandraHOROBET
BucharestUniversityofEconomicStudies,[email protected]
LucianBELASCU
LucianBlagaUniversityofSibiu,[email protected]
Abstract: The correlation between academic curricula and labor market requirements is a key issue of modern education
and a primary pillar of the Bologna process. Romanian universities have adjusted in the last decade or so their curricula and academic offer to the labor market needs. Recently, the field of Project Management has gained more prominence in the Romanian labor market, which makes one enquire about the academic preparation that Master students get in this area of study.
Our research aims at shedding light on the way competences, abilities and academic curricula in Economics specializations are related to the Romanian labor market needs, with a focus in the field of Project Management. We are conducting a survey among Master students of two renowned Romanian universities - Bucharest University of Economic Studies and Lucian Blaga University of Sibiu. A number of two samples of students will be selected to conduct the survey, one for each university. The students and all enrolled in Master program with a specialization in Economics.
Our study is useful for both academics and labor market, as interested bodies from both sides might learn more about the perception of future graduates on the academic program they follow and the competences and abilities they gain, on one hand, and on the labor market realities in terms of requirements for future employees, on the other hand.
Key words: academic curricula, labor market, Master program JEL classification: A23 C83 J21
1. INTRODUCTION
The Romanian business environment is facing a number of challenges that need to be addressed by academic curricula in higher education institutions (Ilie, Horobet (2007): (i) an increased maturity of companies, observable through the adoption of modern business techniques and market approaches; (ii) the transformations due to the country’s EU membership, reflected in an increased competition on the domestic market coming from foreign companies, besides the competition between local companies; (iii) the high extent of business globalization, which forces Romanian companies to compete not only at a national and European level, but at a global level. As such, mastering modern management strategies should support Romanian companies’ efforts to consolidate their competitive positions in the European and global business environment. But learning these strategies cannot be done without the help of academia, by the means of knowledge, competences and abilities gained during education years by the potential and future employees of these companies.
Nevertheless, the effects of the global financial crisis on the Romanian educational system are felt throughout and force it to change in order to better adapt to the requirements of the labor

The USV Annals of Economics and Public Administration Volume 15, Issue 1(21), 2015
265
market. As Serban-Oprescu et al. (2012) note, one of the problems faced by the Romanian higher education system is the reduced rate of participation in training programs and professional development courses for employees, including here master programs. This is the result of a low level of adaptation of Romanian higher education curricula to the labor market requirements, in terms of competencies obtained by graduates.
On the other hand, the quality of the education system in general, and a curricula development adapted to labor market requirements, in particular, varied both conceptually as well as how they are perceived by all the actors involved in the university – labor market relationship.
Usually, the universities were compared to some ivory towers, defining themselves the quality of the academic process and their own way of responding to the labor market requirements, adapting only to those new societal requirements compatible to their own mission and vision (Korka, 2009).
After signing in 1999 the Bologna Declaration, the EU countries started an educational reform. The universities understood the importance of developing strategies to link all the external factors impacting on the academic environment and to develop academic curricula dated to the employers’ requirements. Lisbon 200 Strategy has a central element exactly the need to correlate the academic supply to the labor market demand.
Implementing a strategic vision raises some challenges in a changing financial and economic environment in general and labor market in particular – especially in the last few years, when the world economy was confronted to an economic and financial crises.
The changes in the required qualifications by the labor market are dictated by the labor market restrictions or the market pressure (Crosier et al., 2007). The master graduates should respond to the labor market requirements using the competences and abilities acquired during their studies.
In the same vein, the universities should focus their attention both on the students’ needs as well the employers’ need in order to harmonize the two sides of the labor market. On the other hand, the students and graduates as well should participate actively to this process, mainly by providing active feedback to universities on how well the academic curricula is fitting the labor market requirements.
This paper aims exactly to offer an image of the master students’ perception regarding the match between the design of their Master studies and the requirements of the labor market.
2. DATA AND METHODOLOGY The data of this paper is collected from a survey on the student’s perception on the academic
program, the competences and abilities they gain as result of their master studies and how these are currently helping or will help them to meet the labor market requirements.
The survey was conducted in March 2015 for Master students with a specialization in Economics from two universities: Bucharest University of Economic Studies (BUES), the International Business Faculty and the Lucian Blaga University of Sibiu (LBUS).
Two cohorts of students – first and second year students – received the questionnaire. The questionnaire was distributed to all students present in the class in the allocated timeframe for data collecting in each of the two universities.
In total, there were 110 questionnaires received from students, of which 65 students (or 59%) are first year students and 45 students (or 41%) are second year students.
In terms of regional comparison, 44% of the questionnaires are from the Bucharest University of Economic Studies and 56% from Lucian Blaga University of Sibiu.
Close-ended questions using ordinal scales as the answer options were used, in order to measure the students’ preferences.

The USV Annals of Economics and Public Administration Volume 15, Issue 1(21), 2015
266
3. RESULTS The students were asked to rate on a typical five-level Likert scale their satisfaction related
to the following aspects (on a balanced scale from 1 - very satisfied to 5 – very dissatisfied): 1. Courses’ relevance and utility for the master program’s specialization 2. Courses’ complementarities and links between them 3. Courses’ diversity 4. Competences acquired and valued on the labor market 5. Courses’ fitting to labor market requirements
The main descriptive measures resulting from the students responses are presented in Table 1, first for the total number of students, and then for each of the two universities.
The results show some similarities, on one hand, between the first three aspects analyzed, and, on the other hand, the last two aspects.
All the averages for the five analyzed aspects are between 2 and 3 (with one exception - the last criteria in the case of Bucharest University of Economic Studies) as the students’ perception is on average, between ‘somewhat satisfied’ and neutral.
Table no. 1 – The main descriptive statistical indicator – comparison of BUES, LBUS and total sample
Total Relevance Complementarity Diversity Valued
competences
Fit to labor
market
Average - TOTAL 2.34 2.35 2.49 2.95 2.94
BUES 2.29 2.40 2.50 2.98 3.02
LBUS 2.37 2.32 2.48 2.94 2.87
Median -TOTAL 2 2 2 3 3
BUES 2 2 2 3 3
LBUS 2 2 2 3 3
Mode - TOTAL 2 2 2 3 3
BUES 2 2 2 3 3
LBUS 2 2 2 3 3
Standard deviation - TOTAL
0.78 0.82 0.91 0.85 0.99
BUES 0.77 0.98 0.90 0.90 1.02
LBUS 0.79 0.67 0.92 0.83 0.97
Coefficient of variation TOTAL
33.4% 34.8% 36.4% 28.9% 33.7%
BUES 33.6% 41.1% 36.0% 30.1% 33.8%
LBUS 33.5% 28.9% 37.0% 28.2% 33.7%
In terms of the median and modal values, the values are identical in both universities: for the
first three criteria the median is equal to the mode and equal to 2, as the most of the master students are satisfied with the courses’ relevance, complementarity and diversity.
The students’ are less satisfied with the Competences acquired and valued on the labor market and the Courses’ fitting to labor market requirements. Most of the students’ have a neutral perception of these aspects, but around one quarter of the students said that they are unsatisfied with these two aspects.
A better image of the responses for these two aspects related to the labor market is presented in Figure no. 1.

The USV Annals of Economics and Public Administration Volume 15, Issue 1(21), 2015
267
Figure no. 1. The comparative presentation of the students’ satisfaction regarding the
Competences acquired and valued on the labor market – a) BUES; - b) LBUS Source: Own survey data
The student’s satisfaction regarding the Courses’ fitting to labor market requirements is the
lowest one from all the five analyzed criteria.
Figure no.2. The comparative presentation of the students’ satisfaction regarding the Courses’ fitting to labor market requirements – a) BUES; - b) LBUS
Source: Own survey data
Under 30% of students have a positive perception of the correlation between the academic curricula and the labor market requirements, most of the students’ appreciation being neutral (41% from BUES students and 47% of LBUS students).
The graphical representation shows an important similarity of the master students’ responses from the two universities from Bucharest and Sibiu that are summarized in similar values from the descriptive statistical indicators presented in Table 1.

The USV Annals of Economics and Public Administration Volume 15, Issue 1(21), 2015
268
Testing the difference between the means in the two universities
As noted earlier, at a first glance, the results presented seem very similar. In order to
conclude on the significance of the difference between means for the sample data collected in the two universities, the statistical Student test (t test) is performed.
The null hypothesis used in the t-Test is that the means of two populations are equal.(H0: μ1-μ2 = 0) and the alternative hypothesis is that the means of two populations are different – (H1: μ1 - μ2 ≠ 0). The statistical results of the two tailed t test used for comparing the differences between means are presented in Table no 2.
Table no. 2 – The statistical results of t test for comparing the differences between means
Criteria P(T<=t) two-tail t Critical two-tail t Stat Relevance 0.5985 1.9833 -0.5281 Complementarity 0.6596 1.9905 0.4422 Diversity 0.9265 1.9835 0.0924 Valued competences 0.7626 2.0369 -0.3047 Fit to labor market 0.4364 1.9845 0.7815
The values of Critical two-tail t Stat and p value give us overwhelming statistical evidence
not to reject the null hypothesis and infer that the observed difference between the means in Bucharest and Sibiu is not convincing enough to say that the average is significantly different. In other words, there is no statistically significant difference between the students’ perception from the two universities.
4. DISCUSSIONS AND CONCLUSIONS The goal of this survey is to collect information on master students’ perception regarding the
link between academic curricula and labor market requirements. One of the most interesting result is the similarity of the responses among the two
universities, with less than 5% difference between the averages calculated for each variables. Statistical testing showed there is no statistically significant difference between the students’ perception from the two universities.
The analysis was performed on first and second year students of Master programs with a specialization in Economics from two different universities in Bucharest and Sibiu show a reserved level of satisfaction regarding the curricula in general and its perceived fitting to labor market requirements.
A concerning fact is the perception of students related to the Competences acquired and valued on the labor market and Courses’ fitting to labor market requirements, were the most common answer regarding their satisfaction was that they are neither satisfied or dissatisfied.
In the case of their Courses’ fitting to labor market requirements, only one third of the total number of students perceived as satisfying of very satisfying their acquired competences during the master classes in relationship to the labor market requirements. There are as well some minor territorial differences, the students from ASE Bucharest being less satisfied compared to ULB Sibiu. Nevertheless, the difference is not statistically significant.
On the other hand, around two thirds of the students appreciated the Courses’ relevance and utility for the master program’s specialization (more precisely 65% of ASE students and 71% of ULBS students) and Courses’ complementarities and links between them (58% of ASE students and 69% of ULBS students).

The USV Annals of Economics and Public Administration Volume 15, Issue 1(21), 2015
269
In conclusion, the study shows a moderate level of satisfaction of master students regarding the programs’ design with respect to the labor market requirements. Their opinion is supported as well by their own experience, as 62% of the respondents are currently employed.
The appreciation of the Courses’ relevance and utility for the master program leads though to a double folded conclusion: one hand, there is an obvious necessity to improve university curricula to keep up to the ongoing changes of the labor market.
On the other hand, there is a clear need to improving students’ career orientation after graduating Bachelor studies in order to help them select the master program that suits the best their career of choice. Acknowledgement This work was co-financed from the European Social Fund through Sectoral Operational Programme Human Resources Development 2007-2013, project number POSDRU/156/1.2/G/141729 “Innovative Higher Education in Project Management using Modern Educational Techniques”. BIBLIOGRAPHY 1. Livia Ilie, Alexandra Horobeţ (2007), Educaţia managerială postuniversitară : o necesitate pentru un mediu de afaceri competitiv în România, Revista de Management şi Inginerie Economică, vol.6, nr. 2A(23), pp. 135-142 2. David Crosier, Lewis Purser şi Hanne Smidt (2007), Tendinţe V: Universităţi configurează Spaţiul European al Învăţământului Superior. Raportul EUA, Brussels 3. Mihai Korka (2009), Educatia de calitate in invatamantul superior – Quality education for labor market, Editura Universitara, Bucharest 4. George-Laurențiu Șerban-Oprescu, Alexandra Horobeț, Anca-Teodora Șerban-Oprescu (2012) - Assessment of the Romanian Tertiary Educational System in the Context of the Economic Crisis. Lessons Learned and Lifelong Strategy Tools for Improvement, in Procedia - Social and Behavioral Sciences, vol. 46 - 4th WORLD CONFERENCE ON EDUCATIONAL SCIENCES (WCES-2012) 02-05 February 2012 Barcelona, Spain, Gülsün A. Baskan, Fezile Ozdamli, Sezer Kanbul and Deniz Özcan (editors), pp. 4575-4579

The USV Annals
of Economics and
Public Administration
Volume 15,
Issue 1(21),
2015
270
SECTION 5
LAW AND PUBLIC ADMINISTRATION

The USV Annals
of Economics and
Public Administration
Volume 15,
Issue 1(21),
2015
271
ETHICS IN PUBLIC ADMINISTRATION. CASE STUDY –
ROMANIA
LecturerPh.D.RăzvanVIORESCU“StefancelMare”UniversityofSuceava,Romania
LecturerPh.D.GabrielaNEMŢOI“StefancelMare”UniversityofSuceava,Romania
Abstract: Public services represent useful activities designated to meet a social need. The laws and regulations empower
the activities of public services, without indicating the motives for public services. The impact of government in day to day life of citizens and communities is increasingly greater in terms of both public affairs management and budgetary aspect. The power to spend the community resources and to influence the lives of others means at the same time a great responsibility. That is the responsibility to act morally (with integrity) and ensure effective spending of resources. This means not to corrupt and do not let yourself be bribed, but it also means openness to dialogue with stakeholders, internal organizational climate of trust and cooperation, internal procedures to ensure ethical advise. In this sense, in the last 20 years, the public sector has developed legal rules or internal policies, procedures and organizational tools to ensure the integrity and responsible leadership. Public organizations have adopted and applied ethics codes, procedures regarding conflicts of interest, whistleblowing, declaring gifts and other measures to prevent corruption.
Key words: ethics training for public officials, Code of conduct, Civil servants statute JEL classification: K39, K10, K40 INTRODUCTION
Integrity in the public administration is an important condition for the effective functioning of the state, for ensuring public trust in the government, and for creating conditions for sustainable social and economic development. Ethics training for public officials is one of the instruments for building integrity in state institutions and ensuring good quality public governance.
This study presents the findings of a project on ethics training for public officials implemented by the Romanian Government.
According to OECD (1) , the ethics training is a useful tool for strengthening ethics and preventing corruption in public administration if applied together with other tools as part of a comprehensive anti-corruption and pro-integrity policy. Ethics training alone cannot produce sustainable results, especially in countries with high levels of corruption. Ethics training produces observable results only in the long-term.
The main aim of ethics trainings for public officials is to prevent corruption and to provide good public service. Ethics training is provided to public officials in all countries examined by this study, both in countries with high and low levels of corruption. While both groups of countries confirmed that integrity in their public administration is a concern, the challenges they face are of different scale. It appears that countries with lower levels of corruption and with better developed public administration systems provide better ethics training for their public officials (2)
While public service users wish to circumvent the law, officials must apply the law precisely and the discretionary power of public administration should not exceed the provision of laws the public administration should chose the best alternative according to the given situation and beneficiary’s requirements.

The USV Annals of Economics and Public Administration Volume 15, Issue 1(21), 2015
272
Since in his official actions the civil servant expresses himself he/she must not forget that he/she is in the service of citizens, public interest. As public officials are the bearers of government discretion, and may often be corrupt or abusive by violating of the rights and interests of citizens, it is necessary that the rules relating to professional conduct and moral public servant, the deontology, to refer both to relations with superiors, with subordinates, the entire staff and the beneficiaries of his work, with other legal entities, including other state institutions, in fact the whole society. The field literature appealed to certain ambiguities in the public administration regarding the boundaries between law and ethics, on one hand and ethics and corruption, on the other hand. Thus, some authors consider necessary to study legal issues such as conflict of interest and to avoid attracting liability under the law, while others bring in question the ethics of decisions made by public chooses that are not covered by legal provisions. Some ethical perceptions are implicit, some are explicit, some are contradictory. However, these principles are based on ethics seen as a virtue and responsibility.
VALUES, ETHICS AND CONDUCT IN PUBLIC ORGANISATION
Although we can notice the lack of consensus concerning the real meaning of concepts values, ethics and conduct - often used interchangeably – we consider that some clarifications are needed here, which can be applied in the context of public service ethics: Values: principles or standards that guide independent concerning that is good and correct; Ethics: rules transposing the ideals and ethos in typical daily activities; Conduct: actions and actual behaviour of civil servants. As the ethos becomes conduct, a transfer from abstract to concrete is in place. The relations between these concepts are still complex and overlapping.
PRINCIPLES CONCERNING ETHICS IN PUBLIC ADMINISTRATION (Victor Alistar,2010): Ethical standards must be clear; Ethical standards should be reflected in the legislative framework; The civil servants must receive mentoring concerning the application of ethical standards; The civil servants should know their obligations and rights; The political class must affirm its support for ethical values and support implementation of ethical values; Decision making process must be transparent; A clear set of rules for interaction between public and private sector; Managers need to promote and to behave ethically; Public policies, procedures and practices must be created according to ethical values; Working conditions and the management of human resources should be according to ethical values; Appropriate accountability mechanisms must be implemented; There must be adequate procedures and mechanisms to punish inappropriate behaviour.
CODE OF CONDUCT FOR CIVIL SERVANTS (4)
The rules of professional conduct provided by this code are mandatory for civil servants and persons temporarily occupying a position in civil service, public authorities and institutions.
The objectives of this code of conduct aim at ensuring higher quality public services, good governance in achieving the public interest as well as contribute to eliminating red tape and corruption in government, by (5): regulating rules of professional conduct rules necessary for appropriate social and professional relationships in order to create and to maintain at a high level the prestige of civil service and civil servants; public information on professional conduct of civil servants while to which he is entitled to expect from the civil servant exercising public positions; creating a climate of trust and mutual respect between citizens and civil servants on one hand, and between citizens and public authorities, on the other hand.
Most of the member states have defined their official ethics, i.e. official values and standards of behaviour for the civil servants. (Androniceanu Armenia,2008) We find it useful to make a distinction between a value declaration and a code of ethics. Value declarations are used to announce the core values but they usually do not provide detailed rules on how to adopt these values in practical situations. For example, value declarations generally state that transparency is a core value, but value declaration does not provide guidelines on, for instance, how open civil

The USV Annals of Economics and Public Administration Volume 15, Issue 1(21), 2015
273
servants can be towards the public on matters that are still under preparation. These kinds of guidelines or detailed standards of behaviour can be found from the code of conduct. A code of conduct can be seen as an extended value declaration that transforms the values into practice. (7)
The member states have a number of laws that implicitly or explicitly define their official public-service values and standards of conduct. A legal framework typically consists of the following laws, acts and regulations: - constitutional provisions - penal code - public service law - administrative procedure act - procurement law - laws on secrecy, free information and publicity of information - ethics and anticorruption laws and instructions - conflict of interest provisions. (8)
In Romania, the code of ethics for the civil servants has been approved by the National Agency for Civil Servants, but the effect is minimal. ( Armenia Androniceanu, 2007) The public managers and the civil servants are much more motivated to follow the legal framework and the job description than to make an effort for integrate the ethical values in their daily activities.
Romania is establishing a network of ethic counsellors that is coordinated by National Agency of Civil Servants.
PRINCIPLES WHICH SHOULD GOVERN THE CONDUCT OF CIVIL SERVANTS ( Danielle Bossaert and Christoph Demmke,2004)
According to Art. 3 of the Act, the principles governing the professional conduct of civil servants are as follow: supremacy of the Constitution and law – the civil servants have a duty to respect the Constitution and laws of the country; priority of public interest - the civil servants have a duty to consider the public interest above personal interest only, in exercising of his public duties; assuring equal treatment of citizens before public authorities and institutions - the civil servants have the duty to apply the same legal status in identical or similar situations; professionalism - the civil servants should to perform duties with responsibility, competence, efficiency, honesty and conscientiousness; impartiality and independence - the civil servants should have an objective attitude, neutral to any political interest, economic, religious or otherwise, in exercising public positions; moral integrity – the civil servants are forbidden to solicit or accept, directly or indirectly, for themselves or others, any advantage or benefit in consideration of public office they hold or to abuse in any way by this position; freedom of thought and expression – the civil servants may express and substantiate their views with respect for the rule of law and morality; honesty and fairness - in exercising and carrying out public duties the civil servants must have good faith; openness and transparency - the activities of civil servants can be monitored by citizens.
GENERAL RULES OF PROFESSIONAL CONDUCT OF CIVIL SERVANTS ACOORDING TO ROMANIAN LEGISLATION ( Virginia Vedinas, 1998):
a) Providing a quality public service. Civil servants are required to ensure a quality public service for the benefit of citizens, through active participation in decisions and their implementation in practice, in order to achieve competencies of public institutions and authorities. The civil servant should behave professionally and ensure, by law, the administrative transparency in order to gain and maintain public confidence in the integrity, impartiality and effectiveness of public authorities and institutions.
b) Loyalty to the Constitution and law. The civil servants are obliged, through their acts and deeds, to respect the Constitution, laws of the country and work for the implementation of laws, in accordance with their respective functions, in compliance with professional ethics. The civil servants must comply with laws restricting the exercise of certain rights due to the nature of public position.
c) Loyalty to the public authorities and institutions. The civil servants are obliged to defend the prestige of public authority or institution and to refrain from any action which could prejudice its image or legal interests. In this respect, civil servants are forbidden: to publicly express appreciations inconsistent with reality in relation to the work of public authority or institution that operates with its policies and strategies or with drafts of normative or individual acts; to make

The USV Annals of Economics and Public Administration Volume 15, Issue 1(21), 2015
274
unauthorised assessments about the ongoing litigation settlement in the public authority or institution in which they operate as a party; to disclose non-public information in circumstances other than those prescribed by law; to disclose the information to which they have access by their public position, if that disclosure is likely to draw undue advantage or to damage the image of the institution, or rights of civil servants and individuals or legal entities; to offer assistance and advice to individuals or entities aimed to take legal actions against the state or public institution or authority. Disclosure of information that is non-public or submitting documents containing such information, at the request of representatives of other authorities or public institutions is permitted only with the agreement of the public authority or institution. The provisions of the It is noted that the Code of Conduct should not be interpreted as derogation from the legal obligation of civil servants to provide public information of to those interested, according to the law.
d) Freedom of opinion. In performing official duties, the civil servants are obliged to respect the dignity of public office, linking the freedom of dialogue with public authority or institution in which they operate. In their work, public officials are obliged to respect freedom of opinion and not be influenced by personal considerations or popularity. In expressing opinions, public officials must have a conciliatory attitude and to avoid generating conflicts through the exchange of views.
e) Public activity. The relations with media shall be provided by civil servants, appointed for that purpose by the head of public authority or institution according to law. The civil servants appointed to participate in activities or public debates must respect the mandate entrusted by the chief representative of public authority or institution in which they operate.
f) Political activity. In exercising of their position, the civil servants are prohibited: to participate in fundraising for political parties activity; to provide logistical support the candidates for high public office; to collaborate outside employment relationships with natural or legal persons which make donations or sponsorship to political parties; to show, inside the authorities or public institutions, signs or objects with initials or name of political parties or their candidates.
g) Use of own image. In their public positions, the civil servants are forbidden to use their name or image in their advertising activities to promote business or for electoral purposes.
h) Acting in public relations. In relationships with staff of the public authority or institution, in relationships with individuals or legal persons, the civil servants are obliged to behave based on respect, good faith, fairness and kindness. Civil servants have an obligation not to prejudice the honour, reputation and dignity of persons in public institution or the authority by: the use of offensive expressions; disclosure of certain aspects of privacy; formulation of slanderous complaints or accusations. The civil servants should adopt an impartial and justified attitude for clear and effective problem solving of the citizens. Civil servants are obliged to respect the principle of equality of citizens before the law and government by: promoting similar or identical solutions reported to the same class of facts; eliminating all forms of discrimination based on nationality issues, religious and political beliefs, wealth, health, age, gender or other issues.
i) The conduct in international relations. Civil servants representing public authority or institution within international organizations, education institutions, conferences, seminars and other activities have an international obligation to promote a positive image of the country and public authority or institution they represent. When dealing with representatives of other states, civil servants are forbidden to express personal opinions on matters of national or international disputes. In external visits the civil servants are obliged to take an appropriate course of protocol rules and they are forbidden to infringe laws and customs of the host country.
j) The prohibition on accepting gifts, services and benefits. Civil servants should not require or accept gifts, services, favours, invitations or any other advantages, which are designed to them, to their family, parents, friends or people with whom they have business or political relations, that can affect impartiality in the exercise of public functions or can represent a reward in relation to these functions.
k) Participation in decision making. In making decisions, the civil servants are obliged to act according to legal provisions and to exercise their capacity impartially. Civil servants are

The USV Annals of Economics and Public Administration Volume 15, Issue 1(21), 2015
275
forbidden to promise a decision by the public authority or institution, by other public officials and the performance of the duties in a privileged way.
l) Objectivity in evaluation. In carrying out specific public management functions, civil servants are required to ensure equal opportunities and equal treatment with regard to career development for civil servants under their jurisdiction. Management civil servants are obliged to consider and apply objective criteria for assessment of professional competence for staff, when proposing or approving promotions, transfers, appointment or termination of office or material or moral incentives, excluding any form of favouritism or discrimination. It is prohibited to top management civil servants to advantage or to disadvantage the access or promotion in civil service on discrimination criteria based on, family, affinity or other criteria inconsistent with the principles of the Code.
m) Use of exercise of public powers. It is forbidden to civil servants, to use the public powers in others purposes than those provided by law, of that they detained. In the decision making activity of, counselling, preparation of draft legislation, assessment or participation in surveys or control actions, civil servants were not allowed to obtain personal benefits or to produce material damages for others. Civil servants are forbidden to use their official positions or relationships that have been established in a public position in order to influence the internal or external investigations or to determine a specific action. Civil servants are forbidden to impose other civil servants to join the organization or association, regardless of their nature or to suggest that, promising material benefits or professional awards.
n) Use of public resources. Civil servants are obliged to provide care for public and private property of the state and administrative-territorial units, to avoid causing any harm, acting as a good owner. Civil servants are required to use work-time, and property belonging to public authority or institution only for activities related to the civil service positions. Civil servants must propose and ensure the efficient use of public money in accordance with law. The civil servants engaged in publishing or teaching activities are prohibited to use the logistics of the authority or public institution in order to achieve them.
o) Limiting participation in procurement, concession or lease. Any civil servant may acquire a private property owned by the state or administrativeterritorial units, subject to sale under the law, except: when he became aware, during or following the performance of duties of the value or quality of goods to be sold; when he participated in the exercise of official duties, at the organization of property sales; when they can influence the sales operations or information obtained from persons interested in purchasing the property.
The above rules shall apply accordingly also in the case of concession or lease of property owned by public or private or state administrative-territorial units. Civil servants are not allowed to provide information on public or private property or state administrative-territorial units, subject to sales transactions, leasing or renting, in other conditions than those provided by law. ( Matei Ani, Popa Florin, 2010)
LIABILITY OF PUBLIC SERVANTS
In accordance with Law No. 7/2004 (art. 24 of Law No. 7/2004 regarding Code of Conduct), the infringement of the Code of Conduct attracts disciplinary responsibility of civil servants according to the law. Thus, the disciplinary committees have the authority to investigate violation of the Code of Conduct and to propose disciplinary sanctions under the law. Where facts meet the elements of offences, they will be submitted to competent prosecution bodies. Civil servants are responsible for the acts committed with violation of rules of professional conduct, when they have created damages to individuals or legal entities.
Disciplinary liability of civil servants is regulated in Chapter VIII of Law. 188/1999 (13), entitled "Disciplinary sanctions and accountability of civil servants."
According to the provisions contained in this chapter, violation by civil servants, with guilt of his duties attracts disciplinary liability, civil or criminal contravention, as appropriate.

The USV Annals of Economics and Public Administration Volume 15, Issue 1(21), 2015
276
Infringement with guilt by the civil servants of duties according to their position and of norms of conduct determines disciplinary actions and draws up their disciplinary liability.
The following determine disciplinary actions: systematic delay in performing the work; negligence in solving work; absences in work programme; repeated failure of the work programme; interventions to address specific demands or insistence outside the legal framework; breach of professional secrecy or confidentiality work; manifestations affecting the prestige of public authority or institution; conduct of political activities during the working hours; refusal to perform duties; breaching the statutory duties, incompatibilities, conflicts of interest and prohibitions established by law for civil servants; direct relationships with the petitioners to settle their claims.
The disciplinary sanctions are: written reprimand; 5-20% decrease wage rights for a period of up to 3 months; suspension of the right for pay grade advancement or, where appropriate, promotion for a period of 1 to 3 years; shift in an inferior public position for a period of up to one year with the appropriate reduction of income; dismissal from public office.
The individualisation of the disciplinary sanction should take into account the seriousness of the misconduct, the circumstances, the degree of guilt and consequences of misconduct, the general behaviour during the service of civil servants and the existence 14 of other sanctions. Disciplinary sanctions shall apply within 6 months from the date of committing irregularities.
According to Art. 72 of Law no. 188/1999 as amended, in the framework of public authorities or public institutions a discipline committee has to exist. Depending on the number of civil servants in each public authority or institution, the disciplinary committee may be set for a single authority or public institution or more. In the discipline committee there is an equal number of representatives appointed by the chief authority or public institution and civil servants' union. In the case that the union is not representative or the civil servants are not organized into unions, representatives will be nominated by a majority of civil servants in that authority or public institution. Disciplinary Commission for senior civil servants is composed of 7 senior civil servants. Disciplinary Committees are competent to investigate the facts and propose disciplinary sanctions applicable to civil servants or public authorities concerned. The constitution of disciplinary committees, composition, functions, mode of referral and their working procedure shall be established by Government decision on a proposal from the National Agency of Civil Servants.
Any civil servant unsatisfied with the penalty may appeal the administrative court requesting cancellation or amendment, of the order or sanction as appropriate. To highlight the disciplinary situation of civil servant, the National Civil Servants Agency will issue an administrative record, according to the database. The administrative record is an act that includes the disciplinary sanctions imposed and not removed by law. (Nemţoi Gabriela, Ungureanu Ciprian, 2010). The administrative record is necessary in the following cases: appointment of a civil servant as a member of the competition commission for recruiting civil servants; appointment of a civil servant as chairman and member of discipline committee; occupying a public office relevant to the class or category of senior civil servants of management civil service; in any other circumstances stipulated by law. The administrative record is issued on request to: 15 civil servant concerned; head of public authority or institution in which they operate; chairman of the discipline committee; others provisions provided by law.
CONCLUSIONS The inclusion of ethics training in strategic documents is a positive indicator of the growing
recognition of its importance, especially if these documents include implementation action plans, with specific actions, allocation of tasks to responsible institutions, timelines and budgets. However, the strategies may not be not sufficient to ensure the practical implementation of the training, especially in countries where such strategies do not establish a legally binding obligation, do not have their own budgets, and where their implementation depends on the budgets of various public institutions. In these cases, it may be useful to establish ethics training as a legal requirement,

The USV Annals of Economics and Public Administration Volume 15, Issue 1(21), 2015
277
at least for some categories of public officials, such as new officials or officials working in sectors with high integrity risks.
REFERENCES
1. Alistar Victor, Deontology of civil servants, ongoing support, NSPSPA, 2010 2. Androniceanu Armenia - New public management, Economica Publishing House, Bucharest, 2008 3. Androniceanu Armenia, Essential Values of Ethical Behavior inside the public organizations- Case of Romania, p.7 (https://www.law.kuleuven.be/integriteit/egpa/previous-egpa-conferences/madrid-2007/armenia.pdf) 4. Bossaert Danielle, Demmke Christoph, Main Challenges in the Field of Ethics and Integrity in the EU Member States (Viorescu R. (2006), Principalele provocări în domeniul Eticii și Integrității în Statele Membre UE (traducere în limba română a publicaţiei: Main Challenges in the Field of Ethics and Integrity in the EU Member States, Danielle Bossaert and Christoph Demmke) ISBN 13 978-90-6779-196-0 EIPA Code #: 2005/01 Year: 2005 Pages: 270 Copyright © EIPA) 5. Dubnick, Melvin & Ciarán O’Kelly: Accountability through Thick and Thin. Moral Agency in Public Service. In Fredrickson, George & Ghere, Richard (eds.): Ethics in Public Management. Armonk 2005. 6. Landman, Todd: Issues and Methods in Comparative Politics: an Introduction. 2nd ed. Routledge, London 2005. 7. Matei Ani, Popa Florin, Ethical Aspects in the Activity of Civil Servants. Case Study Romania, 2010 (http://mpra.ub.uni-muenchen.de/22469) 8. Moilanen Timo, Salminen Ari, Comparative Study on the Public-service Ethics of the EU (http://vm.fi/documents/10623/307711/Comparative_Study_on_the_Public_Service_Ethics_of_the_EU_Member_States_publication+131206.pdf/524e908b-5388-4d1c-9199-59b4f3e567a9) 9. Năstase Carmen, Scutariu Adrian Liviu, Chaşovschi Carmen, Educating and informing tourism consumers in the context of sustainable development, Revista de Turism - studii şi cercetări în turism, Nr.12, 2011 10. Nemţoi Gabriela, Ungureanu Ciprian « Administrative reform enhancing people participantion in local affairs » JOURNAL OF LAW AND PSYCHOLOGIC, ISSN 2078-1083, IJAR JLP, pag.37, www.ijar.lit.az 2010 11. Scutariu Adrian Liviu, Năstase Carmen, Comparative evolution of tourism in the North-Eastern Region of Romania, Subcarpathia of Poland and Central Slovakia, Bulletin UASVM Horticulture, Nr. 67 (2), 2010 12. Vedinas Virginia – The status of civil servant, Nemira Publishing House, Bucharest, 1998 13. Main features of an Ethics Framework for the Public Sector. As proposed by the Dutch Presidency and adopted by the Directors General responsible for Public Administration in the members states and the institutions of the Euro-pean Union in their 43rd Meeting in Maastricht (NL). 22 November 2004 14. ***Ethics Training for Public Officials, OECD 2013 (http://www.oecd.org/corruption/acn/library/EthicsTrainingforPublicOfficialsBrochureEN.pdf) 15. ***www.oecd.org/dataoecd/3/17/47912383.pdf. 16. Law 7 / 2004 republished in 2007 published in Official Monitor 525 of 02/08/2007 17. Law no.188/1999 on the Status of Civil Servants 18. ***Principles for managing ethics in the public service - OECD 1998

The USV Annals
of Economics and
Public Administration
Volume 15,
Issue 1(21),
2015
278
FORECAST, ORGANIZATION-COORDINATION AND
MOTIVATION IN LOCAL PUBLIC ADMINISTRATION
MANAGEMENT
LecturerPhDPetronelaSCUTARIU
„ȘtefancelMare”UniversityofSuceava,[email protected]
Abstract: The proper functioning of local administrative system is not possible without the exercise of the functions of
local public administration management. From such a direction, in this article we intend to analyze the contents of the functions of forecast, of organization-coordination and of motivation, in order to show how each of these contributes to good management of local public affairs.
Defining the mission, the objectives of local government and the actions to be taken to achieve them, the design and harmonization of optimal local organizational structure components to achieve preset objectives, but also the human resources training from local public administration to use their skills and capacities towards achieving the objectives of the local public organization contribute to improving the local administrative process with effect on satisfying the interests of the local community.
Key words: foresight, organization-coordination, motivation, public organization, local public administration management
JEL classification: H83
1. INTRODUCTION
Management of every entity revolves around some activities that it has to fulfill and which, in essence, are reflected in its functions.
Using management in local public administration, with its main functions, is inevitable if one desires the efficiency improvement of the local administrative system (Adroniceanu, 1999, 37) and the management in the best conditions of the difficulties that the local community and the authorities which they represent faces with.
In a brief inventory of the opinions formulated in the specialty literature on functions of management in the public sector, we are entitled to say that they are not less discussed, various approaches of them being identified.
A first approach belongs to Professor D. O. Durasaro, who speaks about seven functions of management in the educational system, distinct domain of the public sector, namely: planning, organization, leadership, personnel, coordination, reporting, budget preparation (Durasaro, 2-5).
Referring to management functions in public service organizations, Professor M. V. Bedrule-Grigoruţă retains four functions: planning (forecast), organization, training-coordination and control (Bedrule-Grigoruţă, 2008, 80-84).
By D. Rais, A. Simionescu and T. Pendiuc, the main public administration management functions refer to: forecast, organization, decision, coordination, training, control (Rais et al., 1999, 11-27).
On this support, in the space of this article we intend to analyze three of the functions of management in local government to highlight their role in streamlining the activities of local administrative system. The question we aim to find the answer through this process is: Whether and how forecast, organization-coordination and motivation contribute to the efficiency of the local administration process?
From such a way, the aim followed by the present investigation consists in analysis of contents of functions of forecast, of organization-coordination and of motivation in order to show how each of these contributes to good management of local public affairs.

The USV Annals of Economics and Public Administration Volume 15, Issue 1(21), 2015
279
To achieve this objective we resort to investigation of specialty literature and of reference regulations, their interpretation allowing highlighting the role that these functions they hold in improving the local public administration process.
2. ACHIEVING FORECAST FUNCTION IN LOCAL PUBLIC ADMINISTRATION MANAGEMENT Initiating the management process from every entity, the forecast supposes defining the
mission, its objectives, as well as the actions to be taken to achieve them (Olum, 2004, 3). The way this function is performed depends on the achievement of the other functions (Nica
and Iftimescu, 2004, 14), Professor P. Nica assures us. In connection with this first function, V. A. Munteanu tells us, in a crystalline way, that
forecast expresses the connection of uncertainties and possibilities of tomorrow and operation of realities of today and yesterday, with the aim of agreeing, in whole or in part, determining the conditions of future (Munteanu, 2009, 26).
In our opinion, in the management of local public administration, the forecast function includes all the management processes through which are defined the objectives of local public authorities, in line with the needs of the local community, are determined the ways of acting to achieve the objectives defined, specifying, for each way of action proposed, the needed resources.
In graphical representation, forecast function of the local public administration management is illustrated as follows (figure no. 1):
Figure no. 1. Schematic representation of the forecast function
of the local public administration management
Analyzing the content of the figure, we see that exercising the forecast function in local public administration management ensures establishing objectives to achieve in the future, identifying ways of action to be accomplished towards achieving expected objectives, showing resources for each of the ways of action, all them to meet local community needs.
On the objectives projected, P. Filip believes that a number of peculiarities should be taken into account (Filip, 2007, 36):
- the potential of human, material and financial resources of local communities involved in the process of providing local public services;
- the political, electoral commitment to local electorate, of the principal authorizing officers (mayor, county council chairman);
THE AUTHORITIES OF LOCAL PUBLIC
ADMINISTRATION
satisfy
identify
establishshow
Local needs
Objectives
Actions
Resources

The USV Annals of Economics and Public Administration Volume 15, Issue 1(21), 2015
280
- the level of professionalization of civil servants, depending on level of experience or training;
- the specific organizational culture values of local communities; - the system of motivation of civil servants; - the material and technical-material base available to the local community.
We believe that are necessary the other two points, which gives a distinctive note to the formulation of objectives - as act of forecast function in local public administration management [1]. First, the determination of the objectives to be achieved in the future should be made, necessarily, in compliance with the existing legislative framework, under the incidence of which local public administration is organized and operates (for example, Law no. 215/2001 on local public administration, Framework Law of Decentralization no. 195/2006, Law no. 273/2006 on local public finances). Second, between the forecasted objectives and the needs of the local community (water, public lighting, sewerage, construction, maintenance, modernization of public roads) must operate a full correspondence.
For exercising forecast function, one uses specific functional tools, such as: forecasts, plans, programs.
Forecasts are time investigative tools, by means of which one investigates and highlights the future trends (Imbrescu, 2009, 36) of the administrative system. Based on the forecast shall be determined current and future decisions and the strategic objectives are based (Munteanu, 2009, 27). Given that the forecasts envisage a long time horizon of between 10 and 20 years, most often they make not possible the formulation of some realistic strategies. In local public administration, except for financing strategies by long term loans, the forecasts are often not used. The explanation is simple. In a time so long, completed with a state of permanent reform and modernization that characterizes local public administration and not only, it is very difficult, if not impossible, developing some strategies to ensure full correspondence between the objectives proposed and the potential of resources (human, material, financial) necessary to achieve them.
Plans are instruments by means of which the assignment of the current activity of local government in the perspective trends of its development and of economic and social development as a whole. With the help of plans not only the objectives to be achieved are established, but also it is stated how they will be achieved, by what means (Imbrescu, 2009, 36). Developed for short periods of time, usually between one and five years, plans are widely used in local public administration.
Programs are another way to realize the forecast function that describes in detail the sequence and the interacting of the actions to be taken to achieve plans (Imbrescu, 2009, 36). They are made for a reduced time horizon (decade, week, day, hour) and are characterized by a high degree of certainty and maximum particularization (Iordan, 2010, 20).
On this support, forecast function in local public administration management is reflected in the elaboration and approval of strategies, forecasts and development programs for the administrative-territorial unit concerned [2].
It must be said that, although the forecast has long been neglected by the leaders of the local system, with many reforms and changes in its organization and functioning, in consonance with the need to harmonize to the situation in the European administration, forecast function finds its place in the management of local public administration. For example, in local government the forecast function of management manifests itself concretely by (Munteanu, 2009, 28):
- elaboration of administration reform strategy adjusted to economic and social reform and sustainable development;
- elaboration of plans on development of people local public transport systems; - elaboration of programs for training and retraining of civil servants to implement the
strategy. On this support, we consider that by exercising forecast function of management, local
authorities determine the way forward to meet the expectations of the local community and to meet in a higher degree their interests.

The USV Annals of Economics and Public Administration Volume 15, Issue 1(21), 2015
281
3. ORGANIZATION-COORDINATION IN THE MANAGEMENT PROCESS OF LOCAL PUBLIC ADMINISTRATION Being in close link and as an extension of the function of forecast, organization-
coordination is the most visible (Imbrescu, 2009, 37) function in the management of every entity. Once objectives have been set, it is the turn of organization-ordination function to ensure
the frame of their achievement. The organization-coordination is the process of establishing relations between people and resources to achieve the proposed objectives, which involves the interaction of different responsibilities of the personnel and of different compartments of the entity concerned (Waldron et al., 1997).
Referring at this function, Professor A. Androniceanu tells us that through it there are designed and harmonized the internal organizational frame components necessary to achieve the priorities and objectives in the public institution and in the field in which it fills (Androniceanu, 2005, 40).
As far as we are concerned, the organization-coordination function sums all management processes through which the optimal local organizational structure is established, providing a full concordance between its components, to allow the achievement with maximum efficiency of the preset objectives in the management of local public administration.
In support of a correct reception of content of organization-coordination function in local public administration management, we propose a graphical representation of it (figure no. 2):
Figure no. 2. Schematic representation of the organization-coordination function
of the local public administration management
According to the figure, at local public administration level by organization-coordination function of management, local authorities establish local organizational structure in an optimal configuration, the components of which to be in a perfect cohesion, which permit to achieve the preset objectives.
A comprehensive picture of the local internal organizational configuration, at which we also concur, is presented by P. Philip, who lists the following components of it (figure no. 3):
Authorities of local public
administration
Local organizational configuration
Achieving the forecast objectives
establish allow
Posts Public Functions Compartments
COHESION

The USV Annals of Economics and Public Administration Volume 15, Issue 1(21), 2015
282
Figure no. 3. The components of local organizational structure
Source: processing from Filip, Petru, (2007), Managementul administraţiei publice locale. O abordare proactivă, Editura Economică, Bucureşti, pp. 38-39
For how all these components fully chime with each other, the proper functioning of the
entire local administrative system depends on. Unquestionably, the powers of local government in the organization-coordination matter is
an essential component through which the government from administrative-territorial units fulfills its mission and which influences the achievement of its objectives.
In the remit of the local council is the organization and functioning of the mayor's specialized staff, of the local public institutions and services and of the companies and autonomous administrations of local interest [3]. Similarly, the county council carries out duties on organization and functioning of the county council specialized staff, of the county public institutions and services and of the companies and autonomous administrations of county [4].
In this regard, Law no. 215/2001 on local public administration orders the following: the local council approve the regulation of organization and functioning and, at the mayor's proposal, the establishment, the organization and the positions of mayor's specialized apparatus, of local public institutions and services, as well as the reorganization and the positions of the autonomous administrations of local interest (art. 36 par. 3 letter a and b); county council approves the regulation of organization and functioning, the organization chart, the positions, the regulation of organization and functioning of specialized apparatus, as well as of the public institutions and services of county interest, as well as the reorganization and the positions of the companies and autonomous administrations of county interest (art. 91 par. 2 letter c).
In exercising these powers, deliberative authorities of the local government approves management tools (regulation of organization and functioning, organization chart) needed to configure a local organizational framework as operative.
By interpretation, the exercise of organization-coordination function in local government management is reflected in the local public administration authorities’ obligation to ensure ergonomic organizational conditions necessary for the progress of the administration activity in the best conditions at the level of the administrative-territorial unit concerned.
In light of the foregoing, we note that both the establishment of local internal organizational framework and the ensuring the cohesion of its components, through the exercise of organization-coordination function, should be oriented towards a clear purpose, namely to achieve the objectives forecasted in local government.
C O M P O N E N T S
- the domain of activity of local government; in this respect, Chapter IV of Frame Law of decentralization no. 195/2006 establishes the scope of domains where local authorities are competent;
- the organizational subdivisions for each domain of activity of local government: public institutions, operators of local public services, companies and autonomous entities of local interest;
- the intellectual work processes carried out by each domain and organizational subdivision, including the own system of local authority;
- the area of tasks, responsibilities and activities specific to each intellectual work process;
- the posts, the leadership and the execution public functions, corresponding functions of contractual staff;
- the organizational relations between subdivisions, posts, leadership and execution public functions, corresponding functions of contractual staff;
- the weights for leadership posts and public functions; in this regard, Law no. 188/1999 on the Status of civil servants disposes, through art. 112 par. 1 that ,, the leadership public functions in each public authority or institution, except territorial-administrative unit secretary public functions and head of the prefectural office, is up to 12% of all public functions ".
- the hierarchical levels within the local organizational structure: executive director, deputy executive director, head of department, head of office.

The USV Annals of Economics and Public Administration Volume 15, Issue 1(21), 2015
283
4. BASIC RELATIONS IN THE ACHIEVING MOTIVATION FUNCTION OF MANAGEMENT IN LOCAL PUBLIC ADMINISTRATION How the achievement of the proposed objectives is possible only through the involvement
and participation of human resources, we can only imagine how important is the motivation function in the management of every entity. Putting people moving, motivation function conditions the effects of the other management functions.
From such a direction, W. Adamus believes that motivation reveals the action through which people are convinced to make further efforts, intellectual and physical, and to use their skills and capabilities to fulfill the objectives of the organization (Adamus, 2005, 2).
In connection with this function, professors I. Bordean and C. Tureac opine that, by exercising it in public administration management, the public institution staff is determined to contribute to the satisfaction of public interest (Bordean and Tureac, 2009, 29).
In a brief statement, A. Morariu thinks that motivation of civil servants is a way to streamline the public administration (Morariu, 2007, p. 139).
In our opinion, the motivation function in local public administration management brings together all the managerial processes involving training civil servants from the local government apparatus in achieving the objectives set by forecast function.
To facilitate the understanding the content of motivation function in management of the local public administration, we illustrate it schematically in the figure below (figure no. 4):
Figure no. 4. Schematic approach of the motivation function
of the local public administration management
As shown in the figure, motivation ensure correlation between the satisfaction of individual needs of civil servants in the local administrative system, on the one hand, and the objectives achievement, on the other hand, destined to satisfy the needs of the local community. A civil servant whose own needs are satisfied will be motivated to achieve performance and put all its expertise available to the citizen, seeking to find the best solution to meet its interest. In other words, by this function it is performed the connection among the satisfaction of private interests of civil servants - motivation - meeting the interests of the community in general. The essence of the function of motivation is given by this trichotomy dimension.
The performance of local government is regarded as the extent in which, through the whole activity of civil servants and through local interest services offered, the entity government respond to citizens’ expectations (Ştefănescu et al., 2010, 232).
At the level of an organizational, performance can be defined as a function of three factors (Popescu and Popescu, 2011, 142):
Pi = f (M, C, I), (1) where Pi – the performance of a member of the organization M – his/her motivation C – his/her professional capacity I – the image he/she has of his/her own role in the organization.
Satisfaction Motivation
Effective engagement in the exercise of duty Achieving
objectives
Individual needs of civil
servants
Satisfaction General needs
of the local community Achieving
performance

The USV Annals of Economics and Public Administration Volume 15, Issue 1(21), 2015
284
By applying at the local government level, the performance of this sector depends on the performance level of each civil servant who works in local structures, his/her motivation, the competence and the image that he/she perceives about his/her role in local government apparatus. Thus, according to the above formula, the motivation is one of the factors that influence individual performance of public servant.
By exercising motivation function of management in local public administration, public servants who work at this structure level are determined to achieve higher performance.
But achieving performance by civil servants in local administrative apparatus is related to their reward system. The current unified salary scheme and exclusion of bonuses and premiums from the whole administrative system will only lead to a demotivation of public servants, to a flattening of their performance, which ultimately will lead to a decline in service quality offered to citizens.
Beyond this shortcoming, by exercising the motivation function of management in local government the best solutions are looked for to stimulate all those implicated in the administration act, in order to satisfy the interests of the local community.
5. CONCLUSIONS
Amid those shown in the contents of this article, we conclude that the analyzed functions -
forecast, organization-coordination and motivation, offer themselves as support for improving local government, both in terms of activity it performs, but also from structural point of view.
Without defining objectives and indicating actions to be taken in achieving them, without establishing optimal organizational framework and without training civil servants from local government in achieving the projected objectives, local administration process will prove ineffective and, consequently, serving the local public interest would be affected.
Overall, we noted that each of these functions and all alike influence, by being exercised in the management of local government, the good management of local communities affairs.
ENDNOTES
[1] These two aspects are retained, inter alia, by Androniceanu, Armenia, (2005), Noutăţi în managementul public, Ediţia a II-a, Editura Universitară, Bucureşti, p. 37 [2] According to the Law no. 215/2001 on local public administration, the city council approved strategies for economic, social and environmental development of administrative-territorial unit (art. 36 par. 4 letter e); mayor prepares draft strategies regarding the economic, social and environmental status of territorial-administrative unit and submit them for approval to local council (art. 63 par. 3 letter c); county council adopts strategies, forecasts and programs of socio-economic development and environment of the county, based on proposals received from local councils; it dispose, approves and monitors, in cooperation with local communal and town authorities interested, the necessary measures, including the financial ones, to achieve them (art. 91 par. 3 letter d). [3] According to art. 36 par. 2 letter a of Law no. 215/2001 on local public administration [4] According to art. 91 par. 1 letter a of Law no. 215/2001 on local public administration
BIBLIOGRAPHY
1. Adamus, Wiktor, (2005), Function of Motivation in the Management Process in the AHP Framework, pp. 1-22, available at http://www.isahp.org/2005Proceedings/Papers/AdamusW_motivation.pdf [accessed on 31.03.2015]

The USV Annals of Economics and Public Administration Volume 15, Issue 1(21), 2015
285
2. Androniceanu, Armenia, (2005), Noutăţi în managementul public, Ediţia a II-a, Editura Universitară, Bucureşti
3. Androniceanu, Armenia, (1999), Management public, Editura Economică, Bucureşti 4. Bedrule-Grigoruţă, Maria Viorica, (2008), Managementul serviciilor publice, Editura
Tehnopress, Iaşi 5. Bordean, Ioan, Tureac, Cornelia, (2009), Management în administraţia publică, Editura
Didactică şi Pedagogică, Bucureşti 6. Durasaro, D. O., Management functions, principles and leadership styles in Kwara state
public primary schools, pp. 1-15, available at http://www.ilorin.info/kwsubeb/continuous-assessment/management-functions-principles-and-leadership-styles-in-kwara-state-public-primary-school.pdf, [accessed on 2.03.2015]
7. Filip, Petru, (2007), Managementul administraţiei publice locale. O abordare proactivă, Editura Economică, Bucureşti
8. Imbrescu, Ion, (2009), Elemente de management public (specie a managementului general), Editura Lumina Lex, Bucureşti
9. Legea privind administraţia publică locală nr. 215/2001, republicată în Monitorul Oficial nr. 132 din 20 februarie 2007
10. Morariu, Alunica, (2007), Managementul resurselor umane în administrația publică, Editura Tipo Moldova, Iași
11. Munteanu, Vasile A., (2009), Management public local, Editura Tipo Moldova, Iaşi 12. Nica, Panaite, Iftimescu, Aurelian, (2004), Management: Concepte şi aplicaţii, Editura
Sedcom Libris, Iaşi 13. Iordan, Nicola, (2010), Managementul serviciilor publice locale, Editura C. H. Beck,
Bucureşti 14. Olum, Yasin, (2004), Modern management theories and practices, Paper presented at the
15th East African Central Banking Course, held on 12th July 2004, at Kenya School of Monetary Studies, pp. 1-25, available at http://unpan1.un.org/intradoc/groups/public/documents/AAPAM/UNPAN025765.pdf [accessed on 7.03.2015]
15. Popescu, M., Popescu, E., (2011), Motivation and performance at S.C. Tasmania - optimal performance, Review of General Management, Volume 13, Issue 1, pp. 140-145, available at http://www.managementgeneral.ro/pdf/1_2011_15.pdf [accessed on 4.04. 2015]
16. Rais, Dorian, Simionescu, Aurel, Pendiuc, Tudor, (1999), Managementul administraţiei publice, Editura Independenţa Economică, Brăila
17. Scutariu, Adrian Liviu, (2012), Aspects regarding the interconnection of regional science with regional development, The USV Annals of Economics and Public Administration, Volume 12, Issue 1(15), pp. 84-90
18. Stancu, Adrian, (2006), Globalizarea calităţii versus calitate globală, A XI-a Sesiune de Comunicări Ştiinţifice a Cadrelor Didactice cu participare internaţională Creşterea Competitivităţii Economice a României în Contextul Integrării în Uniunea Europeană, 19-20 mai 2006, Universitatea Româno-Americană Bucureşti, pp. 115-119
19. Ştefănescu, Aurelia, Dobrin, Cosmin, Calu, Daniela Artemisa, Ţurlea, Eugenia, (2010), Controverse privind măsurarea performanţei entităţilor administraţiei publice din România, Revista Transilvăneană de Ştiinţe administrative, nr. 1 (25), pp. 225-242, available at http://www.rtsa.ro/rtsa/index.php/rtsa/article/viewFile/105/101 [accessed on 3.04.2015]
20. Waldron, Mark W., Vsanthakumar, Jeyarajan, Arulraj, S., (1997), Chaper 13 - Improving the organization and management of extension, in Improving agricultural extension. A reference manual, Edited by Swanson, Burton E., Bentz, Robert P., Sofranko, Andrew J., Food and Agriculture Organization of the United Nations, Rome, available at http://www.fao.org/docrep/W5830E/w5830e0f.htm#TopOfPage [accessed on 20.03.2015]
21. Zaharia, Petronela, (2013), Autonomia în managementul administraţiei publice locale, Teză de doctorat, Universitatea „Alexandru Ioan Cuza” din Iaşi

The USV Annals
of Economics and
Public Administration
Volume 15,
Issue 1(21),
2015
286
PARADIGMS REGARDING CONCERTED PRACTICES OF
COMPETITION POLICY
LecturerPh.D.GabrielaNEMŢOI
“StefancelMare”UniversityofSuceava,[email protected]
LecturerPh.D.RăzvanVIORESCU
“StefancelMare”UniversityofSuceava,[email protected]
Abstract: The process of completing the single market requires the application of appropriate measures also in
competition field. Rather, it is a truism that, once are removed the non-tariff barriers (physical, technical, fiscal) of hindering trade, companies and governments will seek new ways to limit the restrictions so that competition laws to protect domestic industries.
This study is a reflection on competitive practices regarding the theoretical and practical aspects in the phenomenon of economic competition.
Keywords: concerted practices, competitive market, economic relations, abuse of dominant power JEL classification: K39, K40
1. INTRODUCTION
According to EU rules, the competition policy is not perceived as an end in itself, but as a necessary condition for the internal market. Thus, Article 3 of TCE emphasizes that the aim is to allow setting of a "system ensuring that, in the single market, competition is not distorted.
In this regard, we emphasize the idea that Community rules from competition domain prohibit only those conducts and acts, which may adversely affect trade between Member States, without regard to situations where negative effects are visible only within a single Member State (such situations are the competence of national authorities in the field).
On the other hand, as competition in the market economy is essential in ensuring the economic success, are considered acceptable some practices, which generate positive effects on the economy.
Competition policy has been and continues to be a policy complementary to concerns related to completing the single market, since it provides a mechanism for removing trade barriers between Member States, creating favourable premises the most complete market integration.
European competition policy is based on a Community legislative framework provided essentially by the EC Treaty art. 81-90. Also, additional regulations are assured by decisions issued by the Council. Based on these competition policy focuses on the four areas of action.
Agreements and arrangements concluded between businesses in order to increase production, promoting scientific research and technology in order to ensure economic progress, can have positive effects on the market and influence the best way the competition in the internal market.
Thus, it should be understood that economic integration is not a goal in itself, but a means, a path toward achieving objectives. One of the objectives to be achieved is to have a perfect competition, ideally, if is not achieved this goal then is trying by any means to reduce the factors that lead to unfair competition.
Competition is seen as a reference situation in which there is a complete free confrontation between all operators in the supply and the demand for goods and capital and production services and goods ( Michelle Cini, Lee Mc Gowan, 1998).

The USV Annals of Economics and Public Administration Volume 15, Issue 1(21), 2015
287
Analysing from this perspective the general provisions of the Treaty, may be noted that competition principles are based on the achievement of a common commercial policy for the purposes of creating an internal market in Member States and to remove barriers that may appear in circuit of goods, persons, services and capital, by implementing a legal framework that does not allow distortion of competition.
Competition protection presents a particular interest to the national economy, but also in Europe, which has faced and is facing the abuse of dominance, anti-competitive agreements and mergers, unfair practices that result in worsening competitive environment.
Competition is the essence of the market economy. It means the choice between several alternative products or services.
In the battle for market conquest, bidders apply a number of principles, such as sophisticated concepts concerning business strategies and marketing, concepts to gain dominant market share in the segments concerned, a simultaneous commitment to high quality and strong productivity, without compromising on strategy of high performance requirement or an orientation to economic sectors involving high technologies and gradual reduction of activities in the declining areas.
Often, from the desire to achieve a dominant market position, to attract more customers and eliminate current and potential competitors, companies resort to a series of actions and illegal acts that have an adverse effect on competition.
As the 60s were dominated by the interventions made under Article 85 (81) (regarding restrictive practices), the 70s were characterized by attention to the abuse of the existence of dominant positions, toward possibilities of mergers and merger control (see the case of Continental Can, 6/72, ECR 21 5). The objective was to "introduce an institutionalized system of preventive control" ( Bernini, G, 1983)
It should be underlined, however, that in those years, within the Council, had failed to find a compromise between anti-supranational general attitude and the desire of some Member States to maintain absolute control of national industrial policies, the attitude remained until the mid 80s. As such, neither at the Commission’s level was not obvious an unified opinion regarding this issue.
It should be pointed out that competition policy is not an end in itself but a means to achieve a goal, which, most often, is defined as meeting consumers’ interests.
Amid natural concerns inscribed on the path to progress, development and modernization of production and distribution, as well as the creation of a specific case regarding contractual relationships between companies, the need for creating the competition environment and compliance with fair behaviours of those facing the fight for winning some favourable market position is becoming more acute and real.
One of the essential conditions for the creation and consolidation of a market economy is the existence of a functioning competitive environment.
2. COMPETITION POLICY AND ANTI-COMPETITIVE PRACTICES
Competition can be defined as the ensemble of relations of economic agents generated by their desire to achieve a better market place and a more advantageous price. (Birsan, Maria , 1999; Căpăţână, Octavian, 1992)
From the economic point of view, the competition is always linked to transactions on the market, supply and demand and the exchange process. It is known that “the most important regulators of the market economy is competition" (4)
Exercise of competition is a right of all economic operators. As any right recognized and protected by law, competition law must be exercised in good faith and according to fair practices without violating the right and freedoms of citizens and economic operators.
If certain agreements, agreements between companies may have beneficial effects on the market, others may adversely affect competition ( Jacques Neme, Colette Neme, 1995). Article 81 (formerly Article 85) of the EU Treaty (TEU) introduces the principle of prohibiting agreements between companies, decisions and concerted practices, which have as their object or effect the

The USV Annals of Economics and Public Administration Volume 15, Issue 1(21), 2015
288
prevention, restriction or distortion of competition within the Community space, and who are likely to "affect trade between Member States".
A restrictive agreement is an agreement between two or more firms, which the parties undertake to adopt a certain behaviour, by which are bypassed the rules and effects of free market competition. The prohibitions to which Art. 81/1 (formerly 85/1) applies to both horizontal agreements (which are covered by shares of firms in the same stage of production, processing and marketing) and vertical agreements (are covered actions of firms placed in different stages of production and marketing, not competing with each other).
Understanding is an agreement between two or more firms in which one or more partners are forced to act in a definite way.
The concerted practice is at a lower level to agreements and a process of coordination is achieved between different companies but not reflected in an agreement itself (does not require a clearly expressed will manifestation, but only a coordination at the level of commercial strategies).
3. THE DIFFERENCE BETWEEN UNFAIR COMPETITION AND MONOPOLISTIC PRACTICES
The first of the issues concerned is that of finalities: unfair competition involves capturing
the customers of the injured contestant, while monopolistic practices involve capturing market as such, which alternatively leads also to gaining the customers of harmed competitors.
The second aspect is the results: unfair competition leads to distortion of competition while monopolistic practices result in suppression of competition.
Unfair competition is a violation of ethical norms, while monopolistic practices lead to socio-economic imbalances. Unfair competition revolves around the concept of "customer", while monopolistic practices take into consideration the concept of "market". The certain trend is that both practices have as main pillar the consumer.
The common denominator of both practices is that both require the existence of a competitive relationship between aggressor and aggressed economic operators, learned on the same relevant market. In comparative law, such a concept already enshrined in Swiss law, by the entry into force in March 1988 of the new Law against Unfair Competition (Bundesgesetz gegen den unlauteren Wettbewerb). (6)
The reason for extending the scope of the rules regarding unfair competition is as follows: These regulations not only protect the interests of individual competitors to take part in trade relations based on morality, but also the interests of all market participants and finally to the whole community to exist a functional competition. Unfair competition law is not only impregnated by individualism, but also by the concept of social justice.
The enlargement of the concept of competition allows taking into account the actions of third parties that are important for competition, but do not fall directly into competitive play (such as media bodies, institutes of comparative tests). The mere risk that these actions will produce an anti-competitive outcome is sufficiently, independent of the use or not of specific means.
Also, fall within the economic domain economic the performances of economic nature of public communities, to the extent they influence the market, irrespective of the existence of a competitive relationship. As for the unfair nature of the action, he is in violation of rules of economic behaviour, regardless of the existence of a form of guilt. However, guilt plays a role in the prosecution and claims for compensation for damage.
The act of unfair competition likely to injure a competitor, several competitors or even an entire economic sector, the customers (they are the recipients of the efforts of competitors and have the interest to freely choose between offered services, those which meet better to their needs). Protection of clients' interests, especially when they are consumers, responds to a requirement of social policy, namely the protection of the weaker economic party.
The facts provided by the Law no.21 / 1996 as monopolistic acts can also be classified as acts of unfair competition, if their impact on the market is reduced. This is because both types of

The USV Annals of Economics and Public Administration Volume 15, Issue 1(21), 2015
289
acts are contrary to fair practices. As a result, the main criterion for distinguishing between acts of unfair competition and monopoly is given by the magnitude of the economic power of the infringer fair usage.
Thus, there was a tendency within the legislature to include in consumers sphere also the small businesses, small traders.
As a result, also businesses seek to apply consumer protection laws because in this way achieve suppression of unfair practices.
On the other hand, consumer protection standards are not purely local, they should be seen in the international context.
This legislation also seeks to promote full and timely information to consumers, especially in relation to complex property and intervene in the balance of power between consumers and traders, in case the first is deprived of the effective power of negotiating contractual terms.
There is no exclusive right over their merchant clientele. To attract this clientele by another trader is lawful as long as it is not accompanied by acts of unfair competition. Hijacking customers is, to a point, a game result of supply and demand, but freedom of competition cannot be without limits. Freedom of competition is a corollary of freedom of trade. Trade freedom is a fundamental freedom, which is to be exercised with respect for the freedom of others.
In the absence of any control, could occur and develop practices contrary to honest commercial practice, the winner of the competition battle is not the best one, but certainly being unscrupulous. In other words, the competitive harm (transfer of customers from one trader to another) is lawful, but only if the relevant trade usages freedom includes freedom of fair trade price. Thus, a trader does not commit an act of unfair competition as long as it sells its products at a price below that of competitors, as long as this price is not ridiculous or contrary to customary trade.
The law of Member states in competition field does not excel, an example is French law where there is no special legal basis of unfair competition. There is no special regulation acts of unfair competition. Therefore, it is considered that unfair competition action - as a tool to ensure that competition is fair - is an action based on tort for his own deed (art. 1382-1383 of French Civil Cod). The foundation of action for unfair competition, even if only allows retrospective punishment (the court intervention) of unfair behaviour, is seen as an advantage due to its suppleness, the articles of the Civil Code, regarding the tort liability for its own act can be used to sanction such a wide variety of behaviours. (7)
Yet, French doctrine and jurisprudence established in time that unfair competition action has a wider scope than the action in tort, because the penalties for committing acts of unfair competition aimed not only to repair the damage, they are equally preventive (may as object the termination of a fact that distorts artificially the fair competition), protecting the victim against possible diversion of their clientele. In addition, injurious of unfair competition has a certain specificity, being considered less rigorous than in civil matters. Recent developments in French jurisprudence was with the purpose of recognizing the existence of injury in this matter without any loss of clientele.
Such an approach exists in the German, Dutch and Belgian systems, combining the ethical functions of action in unfair competition with the consumers and end-users law (general interest) to make use of unfair competition action to compel traders to comply with their ethic obligations. Therefore, may thus be sanctioned acts, which would not be indictable between competitors.
Some authors (Gavrilă Ilie, Gavrilă Tatiana, Popescu Anisia, 2006), starting from the observation that the action for unfair competition is mainly repressive and not indemnitar, consider however, that the purpose of action is not disciplinary, in the sense of punishing the infringement of professional practice of operators, but a repressive action by taking into account a broader range of interests, both interest of economic actors to have a normal competitive environment, and also the consumer interests.
Italian authors have proposed another cornerstone of unfair competition action, namely the protection of a right, namely the right of ownership on the customers. The consequence of this approach is that was claimed that the action in unfair competition recognizes a privative right over a competitive value that is not protected by a special law. As regards the foundation of action on a

The USV Annals of Economics and Public Administration Volume 15, Issue 1(21), 2015
290
deprivation right, even this might not support, because law requires the prohibition of any competing deprivation, while action in unfair competition exists precisely because there are no free competition, in certain limits. ( Moşteanu, Tatiana, 2000)
Italian case law has stipulated the view that action is the basis for sanctioning an illegal act. This orientation of action is considered as the best, being consistent with her action character in tort liability.
Unlawful act consists in the abuse of freedom of trade that comes from business and not in violation of a general obligation not to harm others, because the competition by definition implies a 'damage' caused to competitors. It is a case of unlawful conduct for whose existence requires an intentional element.
According to art. 6 of Law 11/1991 updated, who commits an act of unfair competition, will be forced to cease or to remove it and pay compensation for the damages caused, as appropriate. If by facts of unfair competition was caused patrimonial or moral damage, the injured will be able to act against the author liability claims.
The action for unfair competition is an action with special tort liability. The basis of this action is the violation of a social obligation to respect certain moral rules in the relations of competition, which means an excessive exercise of freedom of competition.
The action for unfair competition seeks primarily the cessation or prohibition of acts of unfair competition and then repair the damage. It tends mainly "to suppress the facts whose perpetuation would certainly lead to injury", and the compensation will be paid in addition, if it proves that the applicant suffered a damage.
Due to the specific of competition relationships, unfair competition action is a action in special civil liability.
The following are its peculiarities: - The existence of an act of unfair competition and character of this competitor; - The existence of a created and present interest, condition of any action; - Evidence of harm is necessary not only to obtain compensation and to allow the action; - The repair pursued will be mainly a repair in such in order to restore the previous situation,
the prohibition of committing future acts of unfair competition and suppression or destruction of material used to commit acts of unfair competition (distinctive signs, advertising);
- If damage was caused, the action may have as object the payment of compensations, the specific action in unfair competition allowing cancellation of the two forms of reparation;
- Unfair competition action is an action in achieving a right taking mainly the form of prohibition;
- The action belongs to both individuals and legal persons exercising a right or industry, with the condition that between them and the author is competition, meaning to exercise a trade or identical or similar industry;
- Liability of the trader and his employee, who has committed the act of unfair competition in the exercise of its powers, and persons, who caused the injury shall be joint together.
The action of unfair competition is limited by a legal framework, very real, the fact itself arguing the presence of a rich jurisprudence.
Therefore, we can say that competitive practice places in the centre a vulnerable representative namely the consumer, and he has as a regulatory and sanctioning tool a series of institutions devoted to the protection of consumer rights.
4. CONCLUSIONS In conclusion, the only way of effective control of restrictive business practices is
compliance with the legislation on competition, because only compliance with competition legislation ensures protection, maintenance and competition in order to promote fair competition.
Solutions aimed the competitive loyalty between economic partners is based on establishing a unitary market unit, in promoting fair partnership techniques.

The USV Annals of Economics and Public Administration Volume 15, Issue 1(21), 2015
291
REFERENCES:
1. Bernini, G., The Rules on Competition, Thirty Years of Comunity Law, 1983, Luxemburg, 2. Birsan, Maria , Integrarea economică europeană. Volumul II, Editura Fundaţiei CDIMM, Maramures, 1999; Căpăţână, Octavian, Noţiunea concurenţei comerciale, Revista de drept comercial, no. 1/1992, 3. Colectivul de Economie, Microeconomie – note de curs – ediţia a II- a, revizuită, Editura Universităţii de Vest, Timisoara, 2006 4. Gavrilă Ilie, Gavrilă Tatiana, Popescu Anisia, Mediul concurenţial şi politica Uniunii Europene în domeniul concurenţei, Colecţia Prelegeri Nr. 14, Editura Economică, Bucharest, 2006 5. Jacques Neme, Colette Neme, Economie de l`Union Europeenne. Analyse d un processus d integration, Litec, Economie, Paris, 1995 6. Michelle Cini, Lee Mc Gowan, Competition Policy in the European Union, The European Union Series, 1998 7. Moşteanu, Tatiana, Concurenţa. Abordări teoretice şi practice, Editura Economică, Bucharest, 2000. 8. Zaharia, Petronela, Autonomy and decentralization-current priorities in the local public administration management, The Annals of The "Ştefan cel Mare" University of Suceava. Fascicle of The Faculty of Economics and Public Administration, Vol. 11, No. 2(14), 2011, pp.288-292
http://ec.europa.eu/energy/observatory/electricity/doc/qreem_2009_quarter3.pdf http://www.juspedia.ro/13177/practici-anticoncurentiale-si-politici-antitrust-in-uniunea-europeana/

The USV Annals of Economics and Public Administration Volume 15, Issue 1(21), 2015
292
INSTRUCŢIUNI UTILE PENTRU AUTORI /
AUTHOR GUIDELINES RO
Revista The USV Annals of Economics and Public Administration primeste articole, din
toate domeniile economice, pe cele 5 sectiuni: � Economie, comert, servicii � Management si administrarea afacerilor � Contabilitate-finante � Statistica, informatica si matematica economica � Drept si administratie publica Este recomandabil ca lucrarile sa fie bine structurate astfel încât sa asigure claritatea continutului precum si esenta temei tratate. Toate articolele trebuie sa prezinte cercetari originale care nu au mai fost publicate sau trimise spre publicare în alta parte. Lucrarile prezentate la conferinte sunt acceptate cu conditia ca ele sa nu fi fost publicate în întregime in volumul conferintei. Lucrarile vor fi redactate în întregime în limba engleza. Lucrarile vor fi recenzate in sistem blind review. Titlul lucrarii Se va scrie cu Times New Roman, caracter 14, bold, centrat în partea de sus a paginii, si se va scrie cu majuscule. Autorii lucrarii Numele lor se va scrie la un rând după titlul lucrării, centrat, precizându-se: titlul stiintific, universitatea/instituţia, localitatea, ţara si e-mailul. Se va folosi Times New Roman, caracter 10, cu litere mici. Numele si prenumele autorului/autorilor va fi scris cu litere bold, iar numele de familie va fi scris cu litere mari (caps). Rezumatul lucrarii Rezumatul se va scrie după autori, lăsând un rând liber înainte; trebuie sa cuprinda informatii suficiente pentru ca cititorii sa poata aprecia natura si semnificatia subiectului, caracterul adecvat al metodei de cercetare, rezultatele si concluziile lucrarii. Rezumatul nu este o introducere, acesta prezinta în sinteza rezultatele esentiale ale cercetarii. Rezumatul se va scrie cu Times New Roman, caracter 10, italic, justify. Este necesar ca el sa aiba un numar de 200-250 de cuvinte, spatiate la un rând. Cuvinte cheie Selectati 5-6 cuvinte cheie (cuvinte sau expresii) care surprind esenta lucrarii. Enumerati acesti termeni în ordinea descrescatoare a importantei lor. Acestia se vor scrie cu Times New Roman, caracter 10, la un rând liber după rezumat. Clasificare JEL Se va trece unul sau mai multe coduri JEL, in care lucrarea poate fi inclusa din perspectiva subiectului abordat. Lista cu coduri o gasiti la adresa: http://www.aeaweb.org/journal/jel_class_system.html Introducerea Pentru introducere, formulati scopul lucrarii, motivatia temei alese si explicati pe scurt modul de abordare si argumentele necesare. Înainte de introducere se lasă 2 rânduri libere. Continutul lucrarii Organizati corpul lucrarii utilizând titluri si subtitluri pentru a accentua atât continutul cât si claritatea acesteia. Titlurile şi subtitlurile se vor scrie cu litere mari, 12, bold, aliniate la stânga. Se va lăsa un rând liber înainte şi unul după. Trebuie avute în vedere urmatoarele:
terminologia recunoscuta a domeniului pentru a descrie orice subiecte sau proceduri experimentale folosite pentru colectarea si analiza datelor;
includerea metodelor detaliate, astfel încât cititorii sa poata urmari prezentarea materialului; formularea rezultatelor în mod clar si succint; evidentierea rezultatelor cercetarii si impactul acestora, atât global cât si specific.
Textul lucrarii se va scrie cu Times New Roman, caracter 12, spatiat la un rând. Tabelele si figurile sa fie dimensionate si plasate în corpul lucrarii asa cum doresc autorii sa apara în revista. Trebuie avut grija ca acestea sa se încadreze pe o singura pagina. Continutul lor se va scrie cu Times New Roman, caracter 10, iar titlul coloanelor tabelelor se va scrie cu Times New Roman, caracter 10, bold. Titlul si numarul tabelelor vor fi pozitionate deasupra acestora, iar titlul si numarul figurilor, sub acestea. Atunci când este cazul se va mentiona si sursa. Numarul tabelelor si figurilor va fi amplasat în corpul textului, într-o paranteza, acolo unde se fac referiri la ele, de exemplu: (figure no. 1); (table no. 1) Graficele trebuie sa fie clar executate astfel încât sa ofere copii alb-negru cât mai lizibile. Numerotati toate ecuatiile si formulele folosite plasând numerele lor în paranteze, în dreapta acestora. Explicati abrevierile si acronimele prima data când apar în corpul textului, chiar daca au fost definite în rezumat.

The USV Annals of Economics and Public Administration Volume 15, Issue 1(21), 2015
293
Nu se vor folosi note de subsol, dar se poate opta pentru unul din urmatoarele moduri de citare: - sunt permise note la finalul lucrarii (endnotes), situate înaintea bibliografiei si introduse manual. Ele se vor scrie cu Times New Roman, caracter 10, italic. Trimiterile bibliografice din textul lucrarii se pot numerota cu cifre arabe [1], [2] etc. - trimiteri in text intr-o paranteza specificand numele autorului si anul aparitiei lucrarii: (Johnson, 2000), (Johnson and Jackson, 2001) - lucrare cu 2 autori, (Johnson et al., 2002) - acolo unde sunt mai multi autori, (Johnson, 2000; Peterson, 2001) - daca ideea se regaseste la mai multi autori, sau (Johnson, 2000a) si (Johnson, 2000b) - in cazul in care exista doua lucrari diferite ale aceluiasi autor aparute in acelasi an (a si b indicand ordinea in care apar la bibliografie). Se poate specifica si pagina in paranteza (Johnson, 2000, 250). Este obligatoriu ca autorii citati in text sa se regaseasca la bibliografie. Concluzii Concluziile pot recapitula punctele principale ale lucrarii, dar nu trebuie sa reproduca rezumatul. Ele pot cuprinde aspecte legate de importanta lucrarii sau pot oferi sugestii referitoare la aplicatii ale acesteia sau directii de extindere a cercetarilor. Bibliografie Lista bibliografica, de la sfârsitul lucrarii, se va scrie în ordine alfabetica, dupa numele autorului, numerotându-se. Când anumite studii, lucrari, articole sunt publicate în volum, atunci se va mentiona numarul acestuia si paginile. Titlul lucrarii va fi scris cu font italic. Precizari importante
Articolele trebuie sa aiba 6-10 pagini, pe formatul A4, marginile stanga, dreapta, sus, jos: 2 cm. Lucrarile trimise trebuie sa fie formatate în Word cu extensia doc. Articolele care nu respecta aceste instructiuni vor fi respinse inainte de a fi date la peer review.
Vă rugăm manifestaţi foarte mare grijă pentru corectitudinea traducerii în limba engleză. Vă rugăm să trimiteţi şi varianta în limba română a art icolului, necesară pentru controlul ştiinţific (intr-un document separat, incarcat ca fisier suplimentar). Veţi primi un răspuns în urma procesului de recenzare. Lucrarile se vor incarca on-line, astfel: pana pe 31 martie pt nr.1 si pana pe 30 septembrie pentru nr.2. In cazul in care se primesc foarte multe lucrari, ordinea publicarii este cea cronologica a datei in care au fost trimise. Pentru alte detalii sau noutăţi vă rugam urmăriţi site-ul revistei: www.annals.seap.usv.ro .
EN
The USV Annals of Economics and Public Administration welcomes theoretical and
empirical articles, from all economic fields, according to the 5 sections: � Economy, trade, services � Management and business administration � Accounting-finance � Statisitics, economic informatics and mathematics � Law and public administration It is expected that manuscripts will be organized in such a manner that maximize both the substance and clarity of the document. All articles should report original research that has not been published or submitted for publication elsewhere. Papers presented at conferences are accepted, provided that they have not been published in full in Conference Proceedings. The papers will be all written in English. The papers will be checked in blind review system. Paper Title Must be in 14-point bold type, Times New Roman, centered across the top of the page and will be writen in uppercase. Paper Authors Author’s names will be written under the paper title after a blank line, centered across the page, single spaced specifing: title, university/institution affiliation, country and e-mail address. It must be written in 10 point type, Times New Roman in lowercase. First name will be in caps and the whole author(s) names will be in bold. Paper Abstract It will be written after authors leaving a blank line before. The abstract must include sufficient information for readers to judge the nature and significance of the topic, the adequacy of the investigative strategy, the nature of the results and the conclusions. An abstract is not an introduction, it summarizes the substantive results of the work. The abstract will be written in 10 point type italic, Times New Roman, justify. It must have 200 to 250 words, single spaced type. Keywords Select 5 to 6 keywords (words or expresions) that capture the essence of your paper. List the words in decreasing order of importance. All the key terms must be translated in English and attached to your

The USV Annals of Economics and Public Administration Volume 15, Issue 1(21), 2015
294
abstract. It will be written in 10 point type, Times New Roman, after abstract leaving a blank line before. JEL Classification Please put one or several JEL codes, according to the subject of your paper. The codes can be found here: http://www.aeaweb.org/journal/jel_class_system.html Introduction For introduction, state the purpose of the work, the motivation of the chosen theme and, briefly explain your approach and the necessary arguments.Before introduction please let 2 blank lines. Paper Content Organize the body of the paper using titles and subtitles to emphasize both content and clarity. The titles and subtitles will be written in caps, 12, bold, left aligned. Please let a blank line before and one after. Consider the following:
the accepted terminology of the field to describe any subjects or experimental procedures used to gather and analyze data;
include detailed methods, so readers could be able to follow the investigation; state the results clearly and succinctly; the implications of the findings and minutely discuss the impact of the results, both globally and
specifically. Typeface must be 12-point Times New Roman type single spaced. Tables and figures should be sized and placed in the body of the paper just as the authors want them printed in the journal. Care should be taken so that tables and figures could be on one page. The tables contents will be written in 10 point type, Times New Roman and the heading of the tables will be in 10 point type bold, Times New Roman. The titles and numbers will be positioned above the table and the title and number of the figures bellow. When it is needed, the source will be mentioned. The number of the tables and figures are to be positioned in the body of the text, in a paranthesis, wherever they are mentioned, for example: (figure no.1), (table no.1). The graphs must be executed clearly so as to give clear black and white copies. Number all the equations and formulas used positioning the numbers in paranthesis on their right side. Define abbreviations and acronyms the first time they are used in the text, even after they had already been defined in the abstract. Footnotes are not allowed, but you can choose one of the following citation ways: - endnotes at the end of the paper, situated before bibliography and introduced manually. They will be written in Times New Roman, size 10, italic. The bibliographic references in the text of the work will be numbered with [1], [2] etc. - citations in text in a parenthesis specifying the author name and the year of the work apparition: (Johnson, 2000), (Johnson and Jackson, 2001) – work with 2 authors, (Johnson et al., 2002) - work with several authors, (Johnson, 2000; Peterson, 2001) – if the idea is found at many authors, or (Johnson, 2000a) and (Johnson, 2000b) - in the case where there are 2 different works of the same author appeared in the same year (a and b indicating the order in which they appear at bibliography). It can be also specified the page in the parenthesis (Johnson, 2000, 250). Authors cited in the text must be found in the bibliography. Conclusions Conclusions may review the main points of the paper, do not replicate the abstract as the conclusion. A conclusion might elaborate on the importance of the work or suggest applications and extensions and extensions of the research. References Sources should be in alphabetical order by author’s last name, the list being numbered. When certain studies, research, articles are published in a volume, the volume numbers and pages will be specified. The title of the work will be written in italic. Important Specifications The articles must be at least 6 to 10 pages long in the style A4 sheet, margins left, right, top, bottom: 2
cm. Submitted documents must be in PC-formatted Word (.doc) file. The articles that don't respect specified guidelines will be rejected before they are sent to peer review.
The Romanian authors will also send the article in Romanian language (in another document, uploaded as a supplementary file), necessary for the scientific control. The journal appears twice a year (June and December). For the first number of the review (June), the manuscripts should be submitted on-line until 31 March and for the second issue until 30 September. In the case that a lot of articles are received, the publication order is settled chronologically by the date when they were submissed to us. For other details or news, please check our site: www.annals.seap.usv.ro .
Pentru comenzi va rugam sa ne contactati pe adresa de e-mail a revistei: [email protected] . For commands, please contact us by e-mail at the address: [email protected] .