The use of magnetic measurements to investigate the mineralogy of Icelandic lake sediments and to...
13
The use of magnetic measurements to investigate the mineralogy of Icelandic lake sediments and to study catchment processes RICHARD BRADSHAW AND ROY THOMPSON Bradshaw, Richard & Thompson, Roy 19850901: The use of magnetic measurements to invcstigate the mineralogy of Icelandic lake sediments and to study catchment processes. Borem, vol. 14. pp. 203-215. Born A Oslo. ISSN 03W9483. Magnetic measurements made on sediment and eatchmcnt samplcs from two contrasting Icelandic lakes show how susceotibility and saturation isothermal remanent magnetisation alter as magnctic minerals pass from rock to'soil to stream and into the lakes. There is no detectable growth of sccondary magnetic minerals in Icelandic soil profiles and susceptibility peaks in the 62.5-10()0 vrn size range of mineral particles in the lake sediments. Changes in sediment source can be detected using combinations of magnetic measurements. Richard Bradshaw, School of Botany, Triniry College, Dublin 2, Ireland; Roy Thompwrr. Ikparmirnt if Geophysics, University of Edinburgh, Mayfield Road. Edinburgh EHY 352, United Kingdom; Jul!. 1981. Fast, non-destructive magnetic measurements are gaining acceptance as a research tool for investigating long-term lake-catchment processes (Thompson et al. 1980). Total sediment flux can be estimated (Dearing 1982), and in certain cases sediment sources can be identified by measuring magnetic susceptibility (x, x) or the magnetism retained by samples under various kinds of im- posed magnetic fields (Oldfield et al. 1979a). This paper examines the relationship between two Icelandic lakes and their catchments by mag- netically characterising the recent lake sediments and samples of rock, stream bedload and soil from the lake catchments. The present-day mag- netic relationships between lake sediments and their catchments must be understood before we can use magnetic data to describe environmental history. Studies using synthetic minerals have shown that magnetic grain size as well as composition influences the magnetic properties of materials (Parry 1965; Day et al. 1977). The relevance of these observations to field data has been dis- cussed (Dearing et al. 1981; Bjorck et al. 1982) but more field data are required before generali- sations can be made about the relationship be- tween x, magnetic grain size and mineral particle size. We provide such data from Iceland and help develop the art of interpreting x and x measure- ments of lake sediment cofes. Finally, we pro- pose a new combination of magnetic parameters that is particularly sensitive in the detection of changing source materials for sediments through time. Principles of environmental palaeomagnetism Iron materials are among the most common com- ponents of natural materials. The chemical com- position of iron oxides and sulphides can readily be investigated using magnetic methods, such as measuring magnetic hysteresis parameters, ther- momagnetic parameters or laboratory-imparted remanent magnetisations. The magnetic mineral- ogy of a rock can be quite varied. A basalt, for example, can contain iron oxides of different chemical compositions and different crystal structures, of a range of grain sizes and varying amounts of accessory elements. Sediments and soils which are made up of mixtures of rocks. their weathering products and diagenetic miner- als can have a very complex magnetic mineral- ogy: consequently only their broad magnetic characteristics can be determined. In environ- mental investigations it is the changes in these characteristics which are of interest, and these can be monitored. Magnetic methods, on ac- count of their speed and versatility, become par- ticularly valuable when many sites or samples are to be examined.
-
Upload
richard-bradshaw -
Category
Documents
-
view
216 -
download
0
Transcript of The use of magnetic measurements to investigate the mineralogy of Icelandic lake sediments and to...

The use of magnetic measurements to investigate the mineralogy of Icelandic lake sediments and to study catchment processes RICHARD BRADSHAW AND ROY THOMPSON
Bradshaw, Richard & Thompson, Roy 19850901: The use of magnetic measurements to invcstigate the mineralogy of Icelandic lake sediments and to study catchment processes. Borem, vol. 14. pp. 203-215. Born
A Oslo. ISSN 03W9483.
Magnetic measurements made on sediment and eatchmcnt samplcs from two contrasting Icelandic lakes show how susceotibility and saturation isothermal remanent magnetisation alter as magnctic minerals pass from rock to'soil to stream and into the lakes. There is no detectable growth of sccondary magnetic minerals in Icelandic soil profiles and susceptibility peaks in the 62.5-10()0 vrn size range of mineral particles in the lake sediments. Changes in sediment source can be detected using combinations of magnetic measurements.
Richard Bradshaw, School of Botany, Triniry College, Dublin 2 , Ireland; Roy Thompwrr. Ikparmirnt if Geophysics, University of Edinburgh, Mayfield Road. Edinburgh EHY 352, United Kingdom; Jul!. 1981.
Fast, non-destructive magnetic measurements are gaining acceptance as a research tool for investigating long-term lake-catchment processes (Thompson et al. 1980). Total sediment flux can be estimated (Dearing 1982), and in certain cases sediment sources can be identified by measuring magnetic susceptibility (x, x ) or the magnetism retained by samples under various kinds of im- posed magnetic fields (Oldfield et al. 1979a). This paper examines the relationship between two Icelandic lakes and their catchments by mag- netically characterising the recent lake sediments and samples of rock, stream bedload and soil from the lake catchments. The present-day mag- netic relationships between lake sediments and their catchments must be understood before we can use magnetic data to describe environmental history.
Studies using synthetic minerals have shown that magnetic grain size as well as composition influences the magnetic properties of materials (Parry 1965; Day et al. 1977). The relevance of these observations to field data has been dis- cussed (Dearing et al. 1981; Bjorck et al. 1982) but more field data are required before generali- sations can be made about the relationship be- tween x, magnetic grain size and mineral particle size. We provide such data from Iceland and help develop the art of interpreting x and x measure- ments of lake sediment cofes. Finally, we pro- pose a new combination of magnetic parameters
that is particularly sensitive in the detection of changing source materials for sediments through time.
Principles of environmental palaeomagnetism Iron materials are among the most common com- ponents of natural materials. The chemical com- position of iron oxides and sulphides can readily be investigated using magnetic methods, such as measuring magnetic hysteresis parameters, ther- momagnetic parameters or laboratory-imparted remanent magnetisations. The magnetic mineral- ogy of a rock can be quite varied. A basalt, for example, can contain iron oxides of different chemical compositions and different crystal structures, of a range of grain sizes and varying amounts of accessory elements. Sediments and soils which are made up of mixtures of rocks. their weathering products and diagenetic miner- als can have a very complex magnetic mineral- ogy: consequently only their broad magnetic characteristics can be determined. In environ- mental investigations it is the changes in these characteristics which are of interest, and these can be monitored. Magnetic methods, on ac- count of their speed and versatility, become par- ticularly valuable when many sites or samples are to be examined.

214 Richurd Brudshaw und Roy Tliomy.~on BOREAS 14 (1985)
Iron oxides and sulphides display a wide range o f physical a n d chemical stabilities in response t o environmental processes. On the one hand these \.:iried responsca lead to complexities in the mag- nctic record hut on the other hand they result in ;I great diversity o f potential applications of mag- netopetrology a n d granulometry in exploring en- \ironmental systems. Thompson d. ( I Y X O ) re- vieaed ii number of these environmental applica- tions. I n 5tudyirig sediments and soils. hysteresis parameters are more useful than therniomagne- tic variations. as they avoid chemical changes associated with laboratory heatings. Laboratory- imparted remaneiit magnetisations and 10% field magnetisations are extremely convenient and fast and the hasic instrumentation (e .p . a fluxgate magnetometer. electromagnetic or pulse dis- charger and induction balance metalhineral de- tector) is within the reaches o f environmental and Earth science iabaratories.
Site descriptions This paper presents data from two Icelandic lakes and their catchments: Glanimastadavatn (GT) in southwestern Iceland and Svinavatn iSV) in northern Iceland (Fig. I ) . We also refer t o magnetic measurements made on sediments from EyjafjOrdur, Vesturhopsvatn. Vatnsdals- katn ;ind I.atra\,atn (Fig. 1) . and for comparison. riieasurrments from Lake Annccy. France (Hogg 197X; Dearing 1979). GT and SV were chosen for cfctiiiled srudy as they lie in contrasting land- \capes tsith different present-day land uses. Dr.
Fig. 2. A . Glammastadavatn (GT) and i ts catchment and B. Svinavntn ( S V ) and it\ catchmcni. Open \ v a t u IS shaded. Spot hcights UIC' m a r k d In metres ahove sea level.
C. Shennan described the vegetation of both catchments. and full species lists are available from the authors.
Glammastada vatri
Glammastadavatn (21"31'W, 64"25'N) is the cen- tral lake of three connected basins which drain through the river Laxi into Grunnafjordur (Fig. 2A). It lies 77 m above sea level, covers 117 ha
BOREAS 14 (1985) Magnetic measurements 205
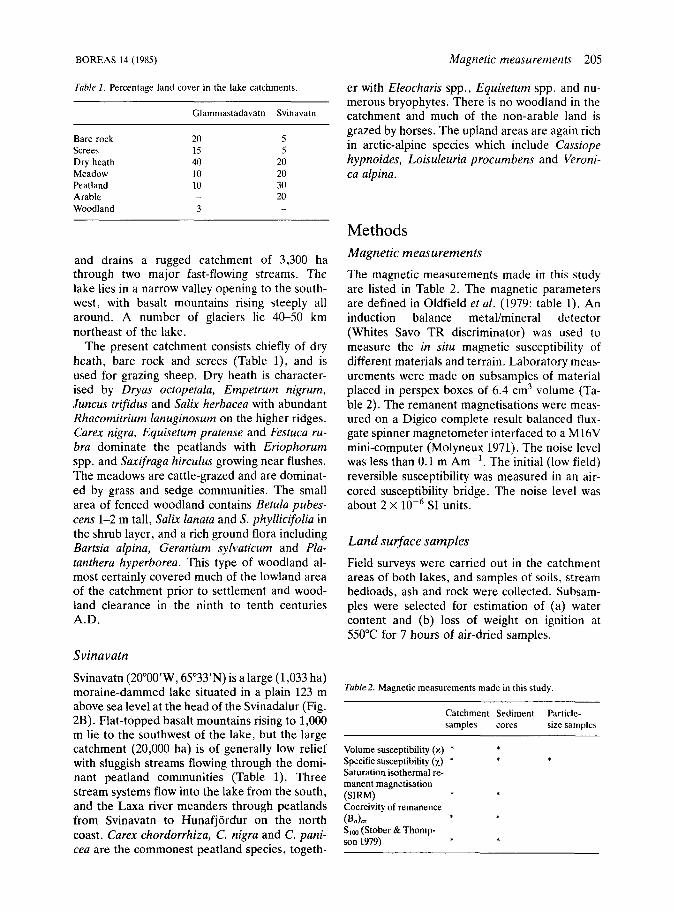
er with Eleocharis spp., Equisetum spp. and nu- merous bryophytes. There is no woodland in the catchment and much of the non-arable land is grazed by horses. The upland areas are again rich in arctic-alpine species which include Cassiope hypnoides, Loisuleuria procumbens and Veroni- ca alpina.
Table I. Percentage land cover in the lake catchments
Glammastadavatn Svinavatn
Bare rock 20 5 Screes 15 5 Dry heath 40 20 Meadow 10 20 Peatland 10 30 Arable - 20 Woodland 3 -
and drains a rugged catchment of 3,300 ha through two major fast-flowing streams. The lake lies in a narrow valley opening to the south- west, with basalt mountains rising steeply all around. A number of glaciers lie 40-50 km northeast of the lake.
The present catchment consists chiefly of dry heath, bare rock and screes (Table l), and is used for grazing sheep. Dry heath is character- ised by Dryas octopetala, Empetrum nigrum, Juncus trifidus and Salix herbacea with abundant Rhacomitrium lanuginosum on the higher ridges. Carex nigra, Equisetum pratense and Festuca ru- bra dominate the peatlands with Eriophorum spp. and Saxifraga hirculus growing near flushes. The meadows are cattle-grazed and are dominat- ed by grass and sedge communities. The small area of fenced woodland contains Betula pubes- cens 1-2 m tall, Salk lanata and S. phyllicifolia in the shrub layer, and a rich ground flora including Bartsia alpina, Geranium syhaticum and Pla- tanthera hyperborea. This type of woodland al- most certainly covered much of the lowland area of the catchment prior to settlement and wood- land clearance in the ninth to tenth centuries A.D.
Svinavatn
Svinavatn (2O0O0’W, 65’33”) is a large (1,033 ha) moraine-dammed lake situated in a plain 123 m above sea level at the head of the Svinadalur (Fig. 2B). Flat-topped basalt mountains rising to 1,000 m lie to the southwest of the lake, but the large catchment (20,000 ha) is of generally low relief with sluggish streams flowing through the domi- nant peatland communities (Table 1). Three stream systems flow into the lake from the south, and the Laxa river meanders through peatlands from Svinavatn to Hunafjordur on the north coast. Carex chordorrhiza, C. nigra and C. pani-
Methods Magnetic measurements
The magnetic measurements made in this study are listed in Table 2. The magnetic parameters are defined in Oldfield et al. (1979: table 1). An induction balance metahinera1 detector (Whites Savo TR discriminator) was used to measure the in situ magnetic susceptibility of different materials and terrain. Laboratory meas- urements were made on subsamples of material placed in perspex boxes of 6.4 cm3 volume (Ta- ble 2 ) . The remanent magnetisations were meas- ured on a Digico complete result balanced flux- gate spinner magnetometer interfaced to a M16V mini-computer (Molyneux 1971). The noise level was less than 0.1 m Am-‘. The initial (low field) reversible susceptibility was measured in an air- cored susceptibility bridge. The noise level was about 2 x SI units.
Land surface samples
Field surveys were carried out in the catchment areas of both lakes, and samples of soils, stream bedloads, ash and rock were collected. Subsam- ples were selected for estimation of (a) water content and (b) loss of weight on ignition at 550°C for 7 hours of air-dried samples.
Table2. Magnetic measurements made in this study
Catchment Sediment Particlc- samples cores size samples
Volume susceptibility ( x ) * Specific susceptibility ( x ) * Saturation isothermal re- manent magnetisation (SIRM) * Coercivity of remanence
Slm (Stober & Thomp- son 1979)
*
(B&r * *
* * tea are the commonest peatland species, togeth-

206 Richard Bradshaw and Roy Thompson
I I 100
sv
h
67
- 33
0
Racks. Stro-.. . Salts
Sediment core stiniples
Six-metre sediment cores were collected using a pneumatically controlled piston corer operated from a small boat (Mackereth 1958). The cores were taken from the deeper. flatter parts of the basins, The core selected for detailed mineral magnetic analysis from Glammastadavatn (GT3) came from 24 m of water. and the Svinavatn core (SVI) came from 30 m of water. The cores se- lected were those that preliminary whole core remanence studics (Thompson et al . 1980) sug- gested had the most complete sedimentary se- quences. The 6 m opaque pvc drainpipes were sealed in the field and sequentially subsampled in the laboratory into the perspex boxes. Subsam- ples were chosen for estimation of (a) water content, (b) organic content by loss of weight on ignition. and (c) particle-size distribution.
Particle-size studies The particle-size distributions of subsamples of the sediment cores were determined by sieving and pipette analysis (Folk 1974). About 10 g dry weight of sediment was dispersed in a sonic tank (15 mins at 45 Hz) and wet sieved through a 63 urn sieve. Clay fraction floccules were physically dispersed by a jet of water during sieving. but tended to reform during subsequent pipette ana- lysis (Holmes 1968). A few drops of NH3 were added to the settling tubes adjusting the p H to between 9 and 10 and this dispersed the floccules
.Lakes.
BOKEAS 14 ( I Y X S )
Fig 3. Volume susceptibility for various substrates in the catch- ments of Svinavatn (SV) and Glammastadavatn (GT).
in most of the analyses. The organic material was not removed from the samples prior to analysis as the necessary oxidising agents would have in- fluenced the subsequent magnetic measurements (Bjorck et al. 1982).
The residues from the particle-size analyses were dried at 50°C and their x was measured to see if the magnetic minerals were concentrated in particular size fractions. Pipette analysis assumes that all the particles are isodiametric with the same density as quartz (2,600 kg m-3). Magnetic grains (density: 5,250 kg m-3) especially those of elongate shape will tend to settle with quartz grains of larger size. Very coarse material from Latravatn (LTV) (Fig. l ) , and SV sediment were split into purified size fractions of range 1 rp unit by repeating sieving and settling for known time intervals.
Results and interpretation Susceptibility The field measurements made with the induction balance were of susceptibility per unit volume (x), and considerable variation was found between rocks, stream bedloads and soils in the lake catchments studied (Fig. 3). Bare rock faces, boulders and screes have the highest x in both catchments. Stream bedloads tend to have a higher x than the soils, while both are higher than the lake sediments. Basalts are the chief

BOREAS 14 (1985) Magnetic measurements 207
Table 3. Magnetic measurements from surface samples and sediments.
Sample Catchment Description No.
1 2 3 4 5 6 7 8 9
10 11 12 13 14 15 16 17 18 19 20 21 22 23 24 25 26 27 28 29 30 31 32 33 34 35
GT GT GT GT GT GT GT GT GT GT GT GT GT GT GT GT GT GT
sv sv sv sv sv sv sv sv sv
GT G T G T GT sv sv sv sv
Fine stream bedload Subsoil Stream bank Fine scree Subsoil Fine stream bedload Fine stream bedload Subsoil Topsoil Stream bank Woodland fine strcam bedload Woodland stream bedload Woodland subsoil Woodland subsoil Woodland topsoil Lake shore gravel Lake shore sand Grey clay River mouth black sand Lake shore gravel Subsoil Grey silt Subsoil Fine stream bedload Peat Outwash sand Topsoil Subsoil Glacial outwash Glacial outwash Subsoil-central plateau Subsoil-central plateau Subsoil-central plateau Lake shore black sand Fresh volcanic ash Lake sediment Lake sediment Lake sediment Lake sediment Lake sediment Lake sediment Lake sediment Lake sediment
296 141 218 397 163 206 238 123 133 270 31
168 124 132 80
285 375 238 158 267 202 338 207 198 54 33
162 41 47 50 28
115 102 14 42
183 156 235 268 143 144 125 117
39 54 34 37 56 35 40 51 44 38 75 28 49 50 51 32 35 23 52 30 33 35 42 43 40 66 45 64 83 86 60 64 63 64 23 31 34 29 34 37 38 44 38
11.9 5.6
11.1 16.9 6.3 9.5 9.6 5.1 5.7
10.5 1.3 1.5 4.8 5.3 3.1
13.0 15.1 15.3 4.4
11.0 9.2
12.6 10.0 6.1 2.1 1.9 5.9 1.6 1.7 1.6 1.1 3.7 2.9 0.4
15.6 8.5 7 .O
11.2 10.4 3.5 4.9 4.2 4.2
.64
.43
.71
.72
.44
.74
.64
.48
.5Y
.70
.16
.85
.55
.55
.52
.77
.71
.93
.49
.83
.81
.72
.60
.58
.49
.25 3 7 .27 .13 .11 .40 .34 .35 .29 .78 .83 .76 .84 17
.73
.74
.M) 73
parent rock in both catchments, and the eroding rock, rich in magnetite, appears to be the major contributor to x throughout the catchments. GT stream bedloads, soils and sediments have a higher x than their SV counterparts.
Measurements of x , though quick to make, will be influenced by dilution of the minerals with air, water and organic matter. x with the water and organic content subtracted from the weight of the samples is shown for the surface sample collections and for selected sediment samples (Table 3). Fine scree, fresh ash, sands, silts and gravels have the highest x, while the
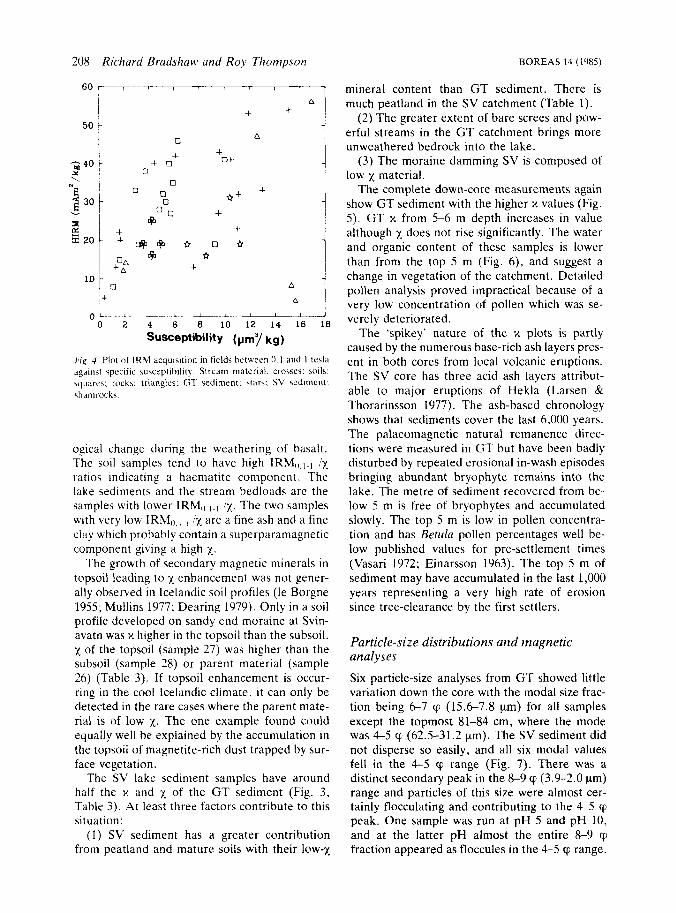
stream bedloads in general have values higher than the soils: these are trends similar to those from the x data. These trends suggest that the magnetic minerals are changing as bare rock erodes into streams or contributes to soil forma- tion. This change could either be a change from large multi-domain magnetite to elongate single- domain or even oxidation of magnetite to form haematite. A plot of IRM acquisition in fields between 0.1 and 1 Tesla (IRMo,l.l) against x (Fig. 4), which can be interpreted as haematite content plotted against magnetite content, pro- vides further support for this postulated mineral-
208
60
50
C 40 Y \.
3 30 3 v
8 20
10
Richard Bradshaw and Roy Thompson
+ +
A 0
- 0 2 4 6 8 10 12 14 16 18
Susceptibility ( p y kg) Fi,c, 4. Plot oi IRM acquisition in field\ between 11.1 and 1 tesla apdin\t specific su\ceptihilit) Stream material. crosses: soils: q u a r e \ : rock\: trrangles; GT sediment: st:trb: SV Sediment: \hamrock\.
ogical change during the weathering of basalt. The soil samples tend to have high IRM,,,,., /x ratios indicating a haematite component. The lake sediments and the stream bedloads are the samples with lower IRM,, ix. The two samples with very low IRMo,l-l ix are a fine ash and a fine clay which probably contain a superparamagnetic component giving a high x.
The growth of secondary magnetic minerals in topsoil leading to x enhancement was not gener- ally observed in Icelandic soil profiles (le Borgne 1955; Mullins 1977; Dearing 1979). Only in a soil profile developed on sandy end moraine at Svin- avatn was x higher in the topsoil than the subsoil. x of the topsoil (sample 27) was higher than the subsoil (sample 28) or parent material (sample 26) (Table 3). If topsoil enhancement is occur- ring in the cool Icelandic climate, it can only be detected in the rare cases where the parent mate- rial is of low x. The one example found could equally well be explained by the accumulation in the topsoil of magnetite-rich dust trapped by sur- face vegetation.
The SV lake sediment samples have around half the x and x of the GT sediment (Fig. 3, Table 3). At least three factors contribute to this situation:
(1) SV sediment has a greater contribution from peatland and mature soils with their low-x
BOREAS 14 (lY85)
mineral content than G T sediment. There is much peatland in the SV catchment (Table 1).
(2) The greater extent of bare screes and pow- erful streams in the GT catchment brings more unweathered bedrock into the lake.
(3) The moraine damming SV is composed of low x material.
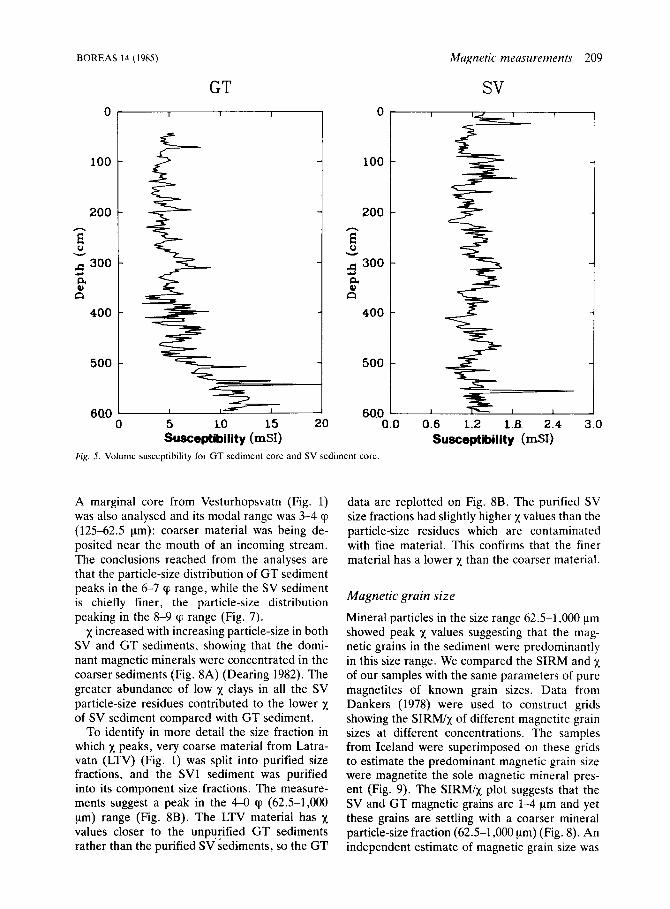
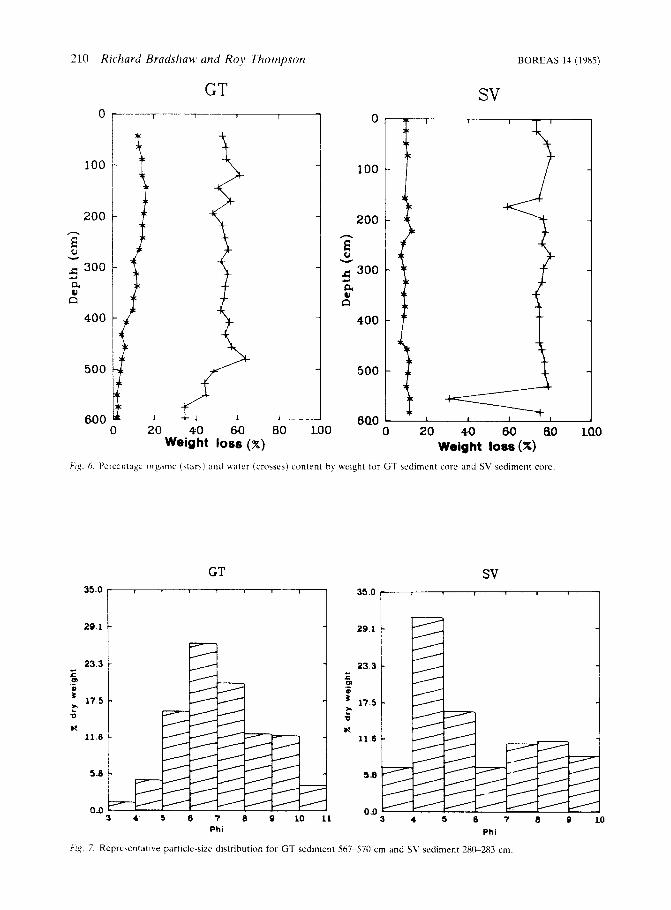
The complete down-core measurements again show G T sediment with the higher x values (Fig. 5). G T x from 5-6 m depth increases in value although x does not rise significantly. The water and organic content of these samples is lower than from the top 5 m (Fig. 6), and suggest a change in vegetation of the catchment. Detailed pollen analysis proved impractical because of a very low concentration of pollen which was se- verely deteriorated.
The 'spikey' nature of the x plots is partly caused by the numerous base-rich ash layers pres- ent in both cores from local volcanic eruptions. The SV core has three acid ash layers attribut- able to major eruptions of Hekla (Larsen & Thorarinsson 1977). The ash-based chronology shows that sediments cover the last 6,000 years. The palaeomagnetic natural remanence direc- tions were measured in G T but have been badly disturbed by repeated erosional in-wash episodes bringing abundant bryophyte remains into the lake. The metre of sediment recovered from be- low 5 m is free of bryophytes and accumulated slowly. The top 5 m is low in pollen concentra- tion and has Betula pollen percentages well be- low published values for pre-settlement times (Vasari 1972; Einarsson 1963). The top 5 m of sediment may have accumulated in the last 1,000 years representing a very high rate of erosion since tree-clearance by the first settlers.
Particle-size distributions and magnetic analyses Six particle-size analyses from GT showed little variation down the core with the modal size frac- tion being 6-7 cp (15.6-7.8 pm) for all samples except the topmost 81-84 cm, where the mode was 4-5 cp (62.5-31.2 pm). The SV sediment did not disperse so easily, and all six modal values fell in the 4-5 cp range (Fig. 7) . There was a distinct secondary peak in the 8-9 cp (3.9-2.0 pm) range and particles of this size were almost cer- tainly flocculating and contributing to the 4-5 cp peak. One sample was run at p H 5 and p H 10, and at the latter p H almost the entire &9 cp fraction appeared as floccules in the 4-5 cp range.
BOREAS 14 (1985) Magnetic measurements 209
GT SV 0
100
200 h
E
5 0 v
300 a 9)
CI
400
500
5==- I
/.=- 5 I a I
i
600 0 5 LO 15 20
Susceptibility (mS> .o
Susceptibility Fig. 5. Volume susceptibility for GT sediment core and SV sediment core.
A marginal core from Vesturhopsvatn (Fig. 1) was also analysed and its modal range was 3-4 cp (12562.5 pm): coarser material was being de- posited near the mouth of an incoming stream. The conclusions reached from the analyses are that the particle-size distribution of GT sediment peaks in the 6-7 cp range, while the SV sediment is chiefly finer, the particle-size distribution peaking in the 8-9 cp range (Fig. 7).
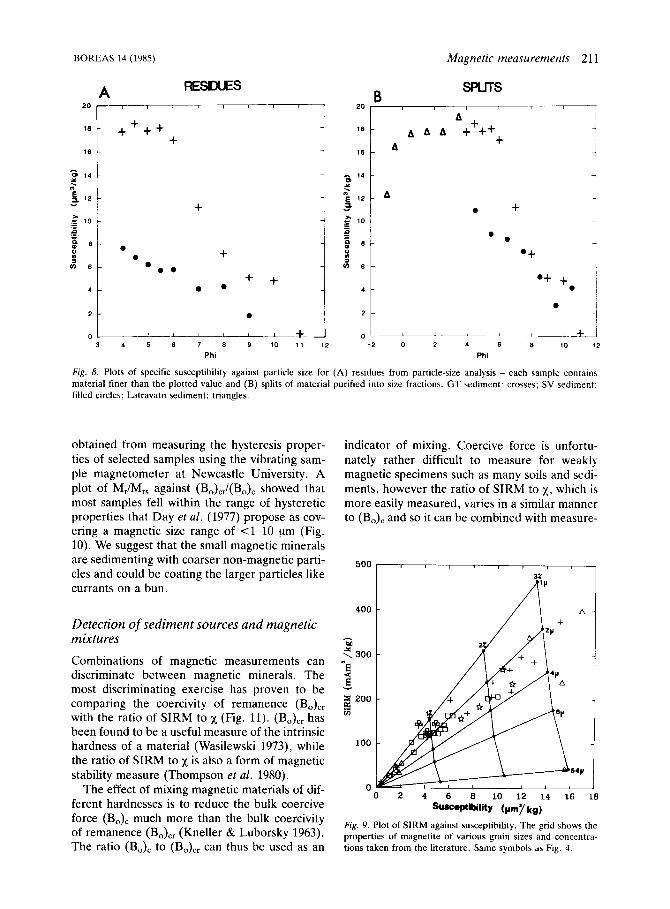
x increased with increasing particle-size in both SV and GT sediments, showing that the domi- nant magnetic minerals were concentrated in the coarser sediments (Fig. 8A) (Dearing 1982). The greater abundance of low x clays in all the SV particle-size residues contributed to the lower x of SV sediment compared with GT sediment.
To identify in more detail the size fraction in which x peaks, very coarse material from Latra- vatn (LTV) (Fig. 1) was split into purified size fractions, and the SV1 sediment was purified into its component size fractions. The measure- ments suggest a peak in the 4-0 cp (62.5-1,000 pm) range (Fig. 8B). The LTV material has x values closer to the unpurified GT sediments rather than the purified SV sediments, so the GT
data are replotted on Fig. 8B. The purified SV size fractions had slightly higher x values than the particle-size residues which are contaminated with fine material. This confirms that the finer material has a lower x than the coarser material.
Magnetic grain size
Mineral particles in the size range 62.5-1,000 pm showed peak x values suggesting that the mag- netic grains in the sediment were predominantly in this size range. We compared the SIRM and x of our samples with the same parameters of pure magnetites of known grain sizes. Data from Dankers (1978) were used to construct grids showing the SIRMlx of different magnetite grain sizes at different concentrations. The samples from Iceland were superimposed on these grids to estimate the predominant magnetic grain size were magnetite the sole magnetic mineral pres- ent (Fig. 9). The SIRMIX plot suggests that the SV and GT magnetic grains are 1-4 pm and yet these grains are settling with a coarser mineral particle-size fraction (62.5-1,000 pm) (Fig. 8). An independent estimate of magnetic grain size was
210 Richard Brudshaw und Roy Tiionzpson
GT
BOREAS 14 (IYXS)
SV 0
100
200
E
9 0 v
300 a e, Q
400
500
I 1 1 I
c
i: t I I
0
100
200
E
s n
0 Y
300 a V
400
500
I I
I I I I 6QO
Weight loss ( x ) Weight loss ( X ) 1 - 1 ~ . h Percentage organic (\ tars) and u a w r (cr05se5) content h) weight tor GT tcdimcnt core and SV sediment core.
GT
35'0 7 7 28.1 1 23.3
I c 0 .- a
17.5 E 0
K 11.6
5 d
OD
I w
3 4 S 6 7 8 9 LO 11
sv
35'0 t 29.1 1 i 23.3 -
5 m .- ' 17.5 ? U
K 11.6
5E
OD 3 4 5 6 7 8 9 1 0
Phi Phi
f i g 7 Represenfatibe particle-size di\trihution for GT sed~ment 567-5711 cm and SV sediment 2XG283 cm
BOREAS 14 (1985)
RESCLES A I I
I
+ 18 + + + +
- 14 a x
g 1 2 -
Y
.- E 10
4 8 -
- .- P
m v) 6 -
4 -
Magnetic measurements 21 1
-
A
-
4 t
0 ‘ ‘-I 3 4 5 8
+ 1 i i I + 4
+ + i 0 . . L I L r t -
7 8 9 10 1 1 12
Phi
SPLITS B 20 , I
l L p L L i L - l - L - C
-2 0 2 4 6 8 1 0 1 2
Phi
Fig. 8. Plots of specific susceptibility against particle size for (A) residues from particle-size analysis - each sample contains material finer than the plotted value and (B) splits of material purified into size fractions. GT sediment: crosses; SV sediment: filled circles; Latravatn sediment: triangles.
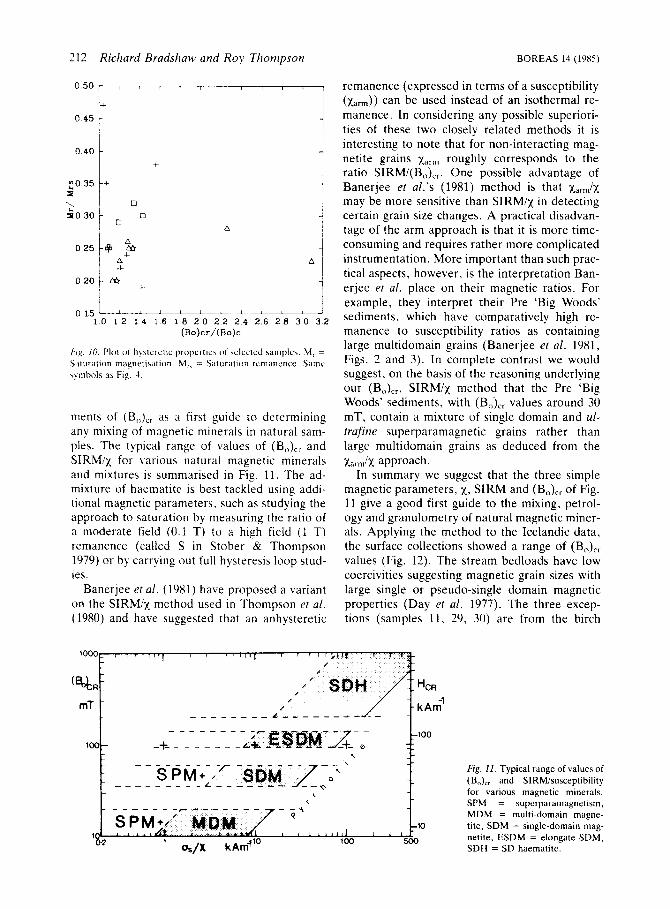
obtained from measuring the hysteresis proper- ties of selected samples using the vibrating sam- ple magnetometer at Newcastle University. A plot of MJM,, against (BJCr/(BJC showed that most samples fell within the range of hysteretic properties that Day et al. (1977) propose as cov- ering a magnetic size range of <1-10 pm (Fig. 10). We suggest that the small magnetic minerals are sedimenting with coarser non-magnetic parti- cles and could be coating the larger particles like currants on a bun.
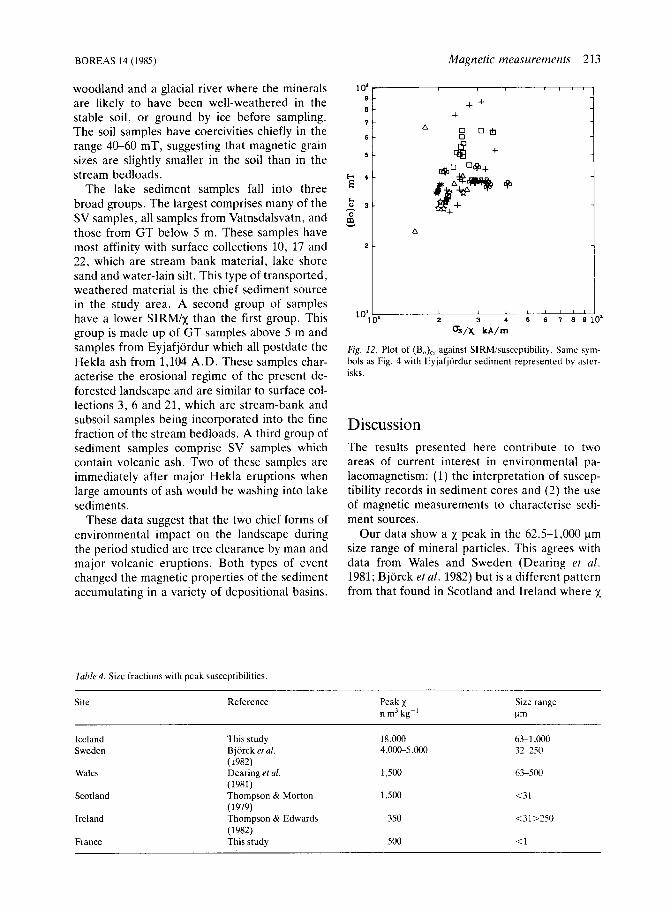
Detection of sediment sources and magnetic mixtures Combinations of magnetic measurements can discriminate between magnetic minerals. The most discriminating exercise has proven to be comparing the coercivity of remanence (BJCr with the ratio of SIRM to x (Fig. 11). (B& has been found to be a useful measure of the intrinsic hardness of a material (Wasilewski 1973), while the ratio of SIRM to x is also a form of magnetic stability measure (Thompson et al. 1980).
The effect of mixing magnetic materials of dif- ferent hardnesses is to reduce the bulk coercive force (B& much more than the bulk coercivity of remanence (B& (Kneller & Luborsky 1963).
indicator of mixing. Coercive force is unfortu- nately rather difficult to measure for weakly magnetic specimens such as many soils and sedi- ments, however the ratio of SIRM to x, which is more easily measured, varies in a similar manner to (B& and so it can be combined with measure-
500
400
w 300
“6
B
- 3 9 200
100
0
A
Fig. 9. Plot of SIRM against susceptibility. The grid shows the properties of magnetite of various grain sizes and concentra-
The ratio (Bo)C to (Bo)Cr can thus be used as an tlons taken from the literature Same symbols as Fig 4
212 Richard Bradshaw and Roy Thonipson BOREAS 14 (1985)
0.50 I------- P 0 4 5 i-‘ 0 4 0 1
+
A
0 2 5 / + 3 A !
I A ‘ 2 .
0 2 0 ~ & +
0L5iL_L-11i-i i 1. -L J 1 D 1 2 1 4 1 6 1 8 2 0 2.2 2 4 2 6 2 8 3 0 3.2
(Bo)cr/(Bo)c
F ’ I . ~ . If?. Plot of hybteretic propertie5 of selected smplcs. M, = Sdturation magnetisation. M,, = Saturation rcmanence Samc <ymbol\ as Fig. A
ments of (B,,),, as a first guide to determining any mixing of magnetic minerals in natural sam- ples. The typical range of values of (BJCr and SIRMix for various natural magnetic minerals and mixtures is summarised in Fig. 1 1 . The ad- mixture of haematite is best tackled using addi- tional magnetic parameters, such as studying the approach to saturation by measuring the ratio of a moderate field (0.1 T) to a high field (1 T) remanence (called S in Stober & Thompson 1979) or by carrying out full hysteresis loop stud- ies.
Banerjee e t a / . (1981) have proposed a variant on the SIRMiX method used in Thompson et a/ . (1980) and have suggested that an anhysteretic
remanence (expressed in terms of a susceptibility ( L ~ ~ ) ) can be used instead of an isothermal re- manence. In considering any possible superiori- ties of these two closely related methods it is interesting to note that for non-interacting mag- netite grains xarm roughly corresponds to the ratio SIRM/(B,),,. One possible advantage of Banerjee et al.’s (1981) method is that xarmix may be more sensitive than SIRMix in detecting certain grain size changes. A practical disadvan- tage of the arm approach is that it is more time- consuming and requires rather more complicated instrumentation. More important than such prac- tical aspects, however. is the interpretation Ban- erjee et al. place on their magnetic ratios. For example, they interpret their Pre ‘Big Woods’ sediments, which have comparatively high re- manence to susceptibility ratios as containing large multidomain grains (Banerjee et al. 1981, Figs. 2 and 3). In complete contrast we would suggest, on the basis of the reasoning underlying our (Bc,),,, SIRMix method that the Pre ‘Big Woods’ sediments, with (BJ,, values around 30 mT, contain a mixture of single domain and ul- trufine superparamagnetic grains rather than large multidomain grains as deduced from the
In summary we suggest that the three simple magnetic parameters, x, SIRM and (BJ,, of Fig. 11 give a good first guide to the mixing, petrol- ogy and granulometry of natural magnetic miner- als. Applying the method to the Icelandic data, the surface collections showed a range of (BJCr values (Fig. 12). The stream bedloads have low coercivities suggesting magnetic grain sizes with large single or pseudo-single domain magnetic properties (Day et a / . 1977). The three excep- tions (samples 11, 29, 30) are from the birch
XarmlX approach.
t i” 0
1
Fig. 1 2 . Typical range of values of (B& and SIRMisusceptibility for various magnetic minerals. SPM = superparamagnetism, MDM = multi-domain magne- tite, SDM = single-domain mag- netite, ESDM = elongate SDM, SDH = SD haematitc.
BOREAS 14 (1985) Magnetic measurements 213
woodland and a glacial river where the minerals are likely to have been well-weathered in the stable soil, or ground by ice before sampling. The soil samples have coercivities chiefly in the range 40-60 mT, suggesting that magnetic grain sizes are slightly smaller in the soil than in the stream bedloads.
The lake sediment samples fall into three broad groups. The largest comprises many of the SV samples, all samples from Vatnsdalsvatn, and those from GT below 5 m. These samples have most affinity with surface collections 10, 17 and 22, which are stream bank material, lake shore sand and water-lain silt. This type of transported, weathered material is the chief sediment source in the study area. A second group of samples have a lower SIRMix than the first group. This group is made up of GT samples above 5 m and samples from Eyjafjordur which all postdate the Hekla ash from 1,104 A.D. These samples char- acterise the erosional regime of the present de- forested landscape and are similar to surface col- lections 3, 6 and 21, which are stream-bank and subsoil samples being incorporated into the fine fraction of the stream bedloads. A third group of sediment samples comprise SV samples which contain volcanic ash. Two of these samples are immediately after major Hekla eruptions when large amounts of ash would be washing into lake sediments.
These data suggest that the two chief forms of environmental impact on the landscape during the period studied are tree clearance by man and major volcanic eruptions. Both types of event changed the magnetic properties of the sediment accumulating in a variety of depositional basins.
Table 4. Size fractions with peak susceptibilities.
10' r I
+ + +
I A
Fig. 12. Plot of (B,,),, against SIRMisusccptibility. Same sym- bols as Fig. 4 with EyjafjBrdur sediment represented by aater- isks.
Discussion The results presented here contribute to two areas of current interest in environmental pa- laeomagnetism: (1) the interpretation of suscep- tibility records in sediment cores and (2) the use of magnetic measurements to characterise sedi- ment sources.
Our data show a x peak in the 62.5-1.000 pm size range of mineral particles. This agrees with data from Wales and Sweden (Dearing et al. 1981; Bjorck et al. 1982) but is a different pattern from that found in Scotland and Ireland where x
Site Reference Peak x n m3 kg-'
Size range Pm
Iceland Sweden
Wales
Scotland
Ireland
France
This study 18,000
Dearing ef al. 1,500 (1981) Thompson & Morton 1,500 (1 979)
Bjorck ef al. 4,0W.5,000 (1982)
Thompson & Edwards 3.50 (1982) This study 500
63-1.000 32-250
63-500
<31
<31>250
<1

214
peaks in fine particles (<31 pm) and coarse parti- cles (>250 pm) (Table 4) (Thompson & Morton 1979; Thompson & Edwards 1982). Where the source rocks are of high % in Iceland and Sweden, the magnetic parent material is being sorted into the silt and fine sand fraction, and its high x is masking any contribution from fine secondary minerals developing in topsoil. Where the bed- rock i s of low % the contribution to y. by secon- dary minerals is represented by a x peak in parti- cles of <31 pm diameter. Some recent sediment from a lake in a limestone region of France (fJogg 1978) proved to have twice the y, value in the size range < I p than in the range 16-62 Iim (Table 4). The development of secondary mag- netic minerals in topsoil may not occur under Swedish or Icelandic climates, but it could only be detected in areas where the bedrock shows low x. The Welsh data are anomalous with a low peak value of x occurring in the range 63-500 pm. Perhaps the topsoil and its secondary miner- als has been eroded aw’ay at this site in the past. and is not found in contemporary stream bed- loads.
Down-core susceptibility records can be influ- enced by several variables. If volume susceptibil- ity is measured, the record will be influenced by the water and organic content of the core. For specific susceptibility data from an area of Fe- rich bedrock. the record will be sensitive to changing particle-size o f the sediment. and from an area of nonmagnetic bedrock the record will record inwash of fine secondary magnetic miner- als from the topsoil. A change in the major source of the lake sediment will also affect x. but we argue that other magnetic measurements such as SIRMix and (BJcr contain a more unequivo- cal record of the source material.
Susceptibility data are a valuable tool for core correlation, and they contain some information about sediment sources, but further magnetic measurements are needed to unequivocally inter- pret the environmental causes of down-core mag- netic variation
Richard Rradshaw and Roy Thompson
Acknowledgemenr.~. - The authors acknowledge financial sup- port from the Natural Environment Research Council. We would like to thank Dr Leo Kristjansson for helping arrange fieldwork in Iceland and Dr. Bill O’Reilly for access to the vihrating \ample magnetometer at Newcastle University. Dr. C Shcnnan assisted with the fieldwnrk.
BOREAS 14 (1985)
References Banerlee, S . K., King, J . & Marvin, 1. 1981: A rapid method
for magnetic granulometry with applications to environmcn- tal studies. Geophysical Reseurch Lerter 8 , 333-336.
Bjorck. S.. Dearing. J . A. & Jonsson, A . 1982: Magnctic susceptibility of Late Weichselian deposits in south-eastcrn Sweden Roreas 1 I . 99- 11 1
Dankers. P. H. M. 1978: Magnetic properties of dispersed natural iron-oxides of known grain-size Ph.D. Thesis. Uni- versity of Utrecht.
Day. R. , Fuller. M . & Schmidt, V. A. 1977: Hysteresis propcr- tics of titanomagnetites: Grain-sire and compositional de- pendence. Physics of the Earrh arid Planetary Interiors 13. 2 6 2 6 7 .
Dearing, J. A 1979: Thc application of magnctic measurc- mcnts to studies of particulate flux in lake-watershed ccosys- tcms. Ph.D. Thesis, Univeriity of Liverpool.
Dearing, J. A. 1982: Core correlation and total sediment in- flux. Iri Berglund. B. (ed.): Pi~Iueohydrolo~ic.ci1 Changes in the Ternperate Zone in the Lust 15,000 years. Subproject R. Lake and Mire Environments. Volume Ill. Specific Methods, 1-23. International Geological Correlation Programme.
Dearing. J . A, . Elncr. J . K. & Happcy-Wood, C 1981: Recent sediment flux and erosional processes in a Welsh upland lake-catchment hased on magnetic susceptibility mcasure- ments. Quaternary Research 16. 356372.
Einarsson. T. 1963: Pollen-analytical studies on the vcgctation and climatc history of Iceland in late and post-glacial times. In Love. A. & Love. D. (eds.): North Atlantic Biota und Thew History. 355-365. Pergamon Press, Oxford.
Folk. R . L. 1974: Petrology of’ Sedbnentary Rocks. 1x2 pp. Hemphill. Austin.
Hogg. T E 1978: The Holocene geomagnetic field in Europe. Ph.D. Thesis. University of Edinburgh.
Holmcs. P. W. 1968: Sedimcntary studies of late-Quaternary material in Lake Windermcrc (Great Britain). Sedimentary Geology -7. 201-224.
Kncller. E. F. & Lubor\ky, F. E. 1963: Particle size depend- ence of coercivity and remancnce of singlc-domain particles. Journal of Applied Physics 3 4 . 656-658.
Larscn. G . & Thorarinsson. S. 1977: H, and other acid Hekla tephrd layers. Jokull 27, 2g3-16.
Lc Borgnc. E. 1955: Susceptibilitb inagnktiquc anormale du sol superficiel. Annales de Geophysique 11. 399-419.
Mackereth, F. J . H. 1958: A portable core sampler for lake deposits. Limrrology and Oceunography 3 , 181-191.
Mol>neux. L. 1971: A completc result magnetometer for meas- uring the remancnt magnetisation of rocks. Geophysicul Journal of the Royal Asrronomical Sociery 2 4 , 429-434.
Mullins. C. E. 1977: Magnctic susceptibility of the soil and its significance in \oil science ~ a rcview. Journal o f s o i l Science 28. 223-246.
Oldfield. F.. Rummery. T . , Thompson, R. & Walling, D. E. 1979a: ldcntification of suspended sediment sources by means of magnetic measurements: some preliminary results. Wafer Resources Research 15, 21 1-217.
Oldfield. F. . Brown. A. & Thompson, R. 1979: The effect of microtopography and vegetation on the catchment of air- borne particles measured by remanent magnetism. Quurer- nary Rebearch 12, 326332.
Parry, L. G. 1965: Magnetic properties of dispersed magnetite powders. Philosophical Magazine 11. 30S312.
Stober. J. C. & Thompson, R. 1979: An investigation into the source of magnetic minerals in some Finnish lake sediments. Earth and Planetary Science Lerrers 45, 464474.
BOREAS 14 (1985) Magnetic measurements 215
Thompson, R. , Bloemendal, J . , Dcaring, J . A, . Oldfield, F., Rummery, T . A., Stober. J . C. & Turner, G. M. 1980: Environmental applications of magnetic measurements. Sci- ence 207, 481-486.
Thompson, R. &Edwards, K. J. 1982: A Holocene palaeomag- netic record and a geomagnetic master curve from Ireland. Borem 11, 335-349.
Thompson, R. & Morton, D. J. 1979: Magnetic susceptibility and particle-size distribution in recent sediments of the Loch
Lomond drainage basin, Scotland. Journal o,f Srdinientary Petrology 49, 801-811.
Vasari, Y. 1972: The history of the vegetation of Iceland during the Holocene. In Vasari. Y . , Hyvarinen, H. & Hicks. S. (cds.): Climatic Change in Arctic Areas during the Lust 10,000 Yeurs. Actu Universitatis Oulurnsis, Serio A , Geolo- gica I , 23%252.
Wasilewski, P. J . 1973: Magnetic hysteresis in natural materi- als. Earth und Planetary Science Letters 20. 67-72,
BOREAS BOOK REVIEWS
Boreus, Vol. 14, pp. 215-216. Oslo, 19850901
A collection of papers on Lake Biwa ROY THOMPSON
Horic, Shoji (ed.) 1984: Luke Biwu. Dr W. Junk Publishers, Kluwer Academic Publishers Group, Dordrccht. ISBN 90- 6193-095-2. Price NLG 350.- / USD 145.-.
All limnologists and Quaternary scientists will find something of interest in this comprehensive volume.
Thirty-seven articles by forty-five contributors cover cvcry aspect of both the present day and ancient limnology of Lake Biwa. The English of some of the articles i s rather quaint: otherwise the book is well produced, neatly set out with clear diagrams and typeface and very readable.
Following a short introduction by the ‘guru’ of Lake Biwa studies - Shoji Horie - the book is divided into five sections. The first section covers the gcomorphology, Quaternary strati- graphy and tectonic setting of Lake Biwa and its surroundings. Lake Biwa, like many of the world’s great lakes, lies in a tcctonically active area. Indccd it occurs at one of the major triple junctions of the earth’s great lithospheric plates, where the Pacific, Philippine and Eurasian plates collide causing rc- lease of seismic energy down to depths of 700 km. The surface expression of these plate collisions is the widespread active faulting and volcanism of Japan and the creation of alternating basin and range topography. The details of thc faulting and structural framework in the region of Lake Biwa are described in an absorbing article by Isamu Murai which emphasizes the long history of fault and block movement in the district and its relationship with the formation and longevity of Lake Biwa. Results of gravity measurements are briefly alluded to which have demonstrated a remarkable mass deficiency in the Lake Biwa region. The 40 m gal Bouguer anomaly is brought about by over loo0 m of sediment fill in the lake.
The second section about the present day lake embraces meteorology, physical limnology, chemical limnology, biologi- cal limnology and lake metabolism. Half of the sixteen articles in this section deal with biological.aspects of the lake. Several of these articles clearly point out the need of a thorough
understanding of present day processes and activities in order that a more precise understanding of past changes, as rccordcd in lake sediments, can be made. For example, thc article by M . Koyama, M. Kawashima and T. Takamatsu carefully discusses chemical aspects of the lake waters and the uppermml Biua sediments. It critically examines present day accumulation pro- cesses and element redistribution cffccts, estimates chcniicnl budgets and points to the value of the studies in understanding past processes and to possibilities for further work o n heii\y metal pollution studics.
The third section on palacolimnology is not surprihingly the longest section in the book as Lake Biwa is one of the world’s oldest lakes, having appeared over five million years ago. The fourteen articles in the palaeolimnology section are divided roughly equally into four subsections dealing with chronology, climatic change. biostratigraphy and geochemistry. The basis of the work lies with the rcmarkahle achievcmcnt of ohtciining a 200 m long core from a present water depth of 65 m. A chronology for the Biwa sediments can be crccted on account of the volcanic activity of the region which has resulted in numerous tephra horizons throughout the sediment sequencc. Minerals in the tephra are amenable to fission track rtudies. Counts of the number of fission tracks and the uranium activity in zircon crystals yield a time scale hack to 4.6 x 10’ years for the 200 m core. Radiocarbon dating provides further control o n the younger sediments.
A palaeomagnetic study reviewed by thc late Naoto Kawai is less successful in providing a chronology. The main palacornag- netic result lies in the absence of the magnetostratigraphy boundary of the Matuyama-Bruhnes polarity transitions at 7.3 x lo5 years B.P. so placing a maximum age on the base of the core. Secular changes at the top of the core are claimed to show considerable resemblance with Japanese archaeomagne- tic variations. However, no quantitative analysis of the data has been carried out and it is doubtful if the correlation could he substantiated mathematically. Many of the earlier inclination