The Use of IPASS to Improve Mobility and Safety Through Traveler Information April 2004.
20
The Use of IPASS to The Use of IPASS to Improve Mobility and Improve Mobility and Safety Through Traveler Safety Through Traveler Information Information April 2004 April 2004
-
Upload
francis-bryant -
Category
Documents
-
view
214 -
download
0
Transcript of The Use of IPASS to Improve Mobility and Safety Through Traveler Information April 2004.

The Use of IPASS to Improve The Use of IPASS to Improve Mobility and Safety Through Mobility and Safety Through
Traveler InformationTraveler InformationApril 2004April 2004

BackgroundBackground
• The Illinois State Toll Highway Authority (ISTHA) has 274 Miles of Toll Highways
• 24 Mainline and 43 Entrance / Exit Ramp Plazas
• IPASS Automatic Toll Collection
• Over 2 million transactions per day 50% of which are IPASS

• Incident Management• Fully Integrated 2 Way CAD • CCTV• DMS
• Incident Response Plans• Travel Times• Safety Messages
• Weather Data• Queue Detection• Center to Center Interface• Open Architecture • UNIX Servers / PC Workstations• IPASS Travel Times
Traffic & Incident Management System (TIMS)Traffic & Incident Management System (TIMS) 2004 Best of ITS Public Safety Award Winner2004 Best of ITS Public Safety Award Winner

Travel TimesTravel Times

Point Travel Time AlgorithmsPoint Travel Time Algorithms
ExtrapolationTT = L/S
Detector Station (s)Provides
Speed Data
InterpolationTT = 2L/(S1+S2)

IPASS Travel Time DataIPASS Travel Time Data
• When a vehicle arrives at a Plaza the following origin and destination data are transmitted to the TIMS
• Date
• Time
• Plaza ID
• Lane

IPASS Basic TT AlgorithmIPASS Basic TT Algorithm
Traffic Flow
A B C D E FRequired Travel Time LinksAB {AE-BE, AF-BF, %AF}
BC {%BE, %BF, %AF}CD {%BE, %BF, %AF}DE {%BE, %BF, %AF)
EF {BF-BE, AF-AE, %AF}
TDLsAEAFBEBF TollTag Reader
AFAEBEBFAB
182

RAWTOLLTAG
READS
PARSEDTOLLTAG
READS
TDL 001 TDL 002 TDL N
VDS 1000 VDS MVDS 1003VDS 1002VDS 1001
IPASSSERVER
MAP GUIs GCMDMS
CongestionManagement
Data FlowData Flow

Lessons LearnedLessons Learned
Traffic Flow
A B C D E FOriginal Travel Time EqsAB {AE-BE, AF-BF, %AF}
BC {%BE, %BF, %AF}CD {%BE, %BF, %AF}DE {%BE, %BF, %AF)
EF {BF-BE, AF-AE, %AF}
TDLsAEAFBEBF
EF
Revised Link EquationsWhen two TDLS are usedVi = num Tag Reads TDLiSi = Speed TDLiAvg Speed = V1S1+V2S2/(V1+V2)TT = SegLen/(Avg Speed)

Lessons LearnedLessons Learned
Standard Deviation Method All Data Near Minimum Method

Algorithm ValidationAlgorithm Validation
• Floating Car Runs Throughout the System during Peak and Off Peak Periods
• Overall - Expected Results were Closely Correlated to Actual
5 6 7 8 9 10 11
Time of Day
20
30
40
50
60
70
Spe
ed ActualMeasured
Theoretical Tag Speed Measurement Lagging

Validation ResultsValidation Results
• The calculated travel times for long sections of roadway are less accurate during times of unstable flow.
• The availability of data for the segment travel times vary significantly.
• The impact that variable delays at exit ramp plazas have on computations can be significant.
• The sample size for computations and the number of actual tag reads affect the overall quality of the data.

Travel Time UsagesTravel Time Usages

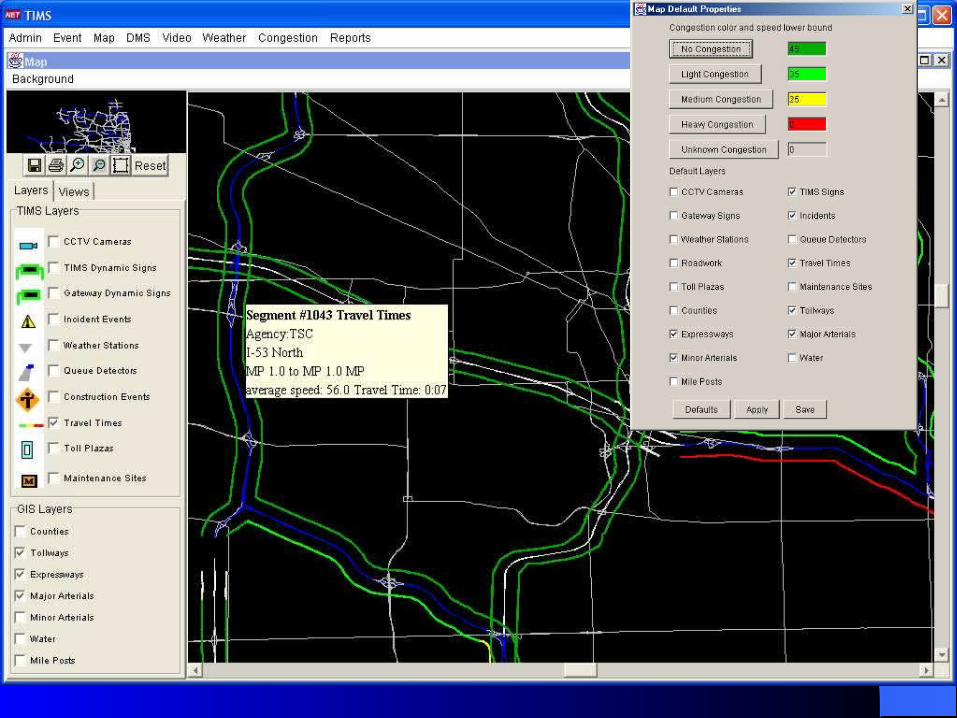
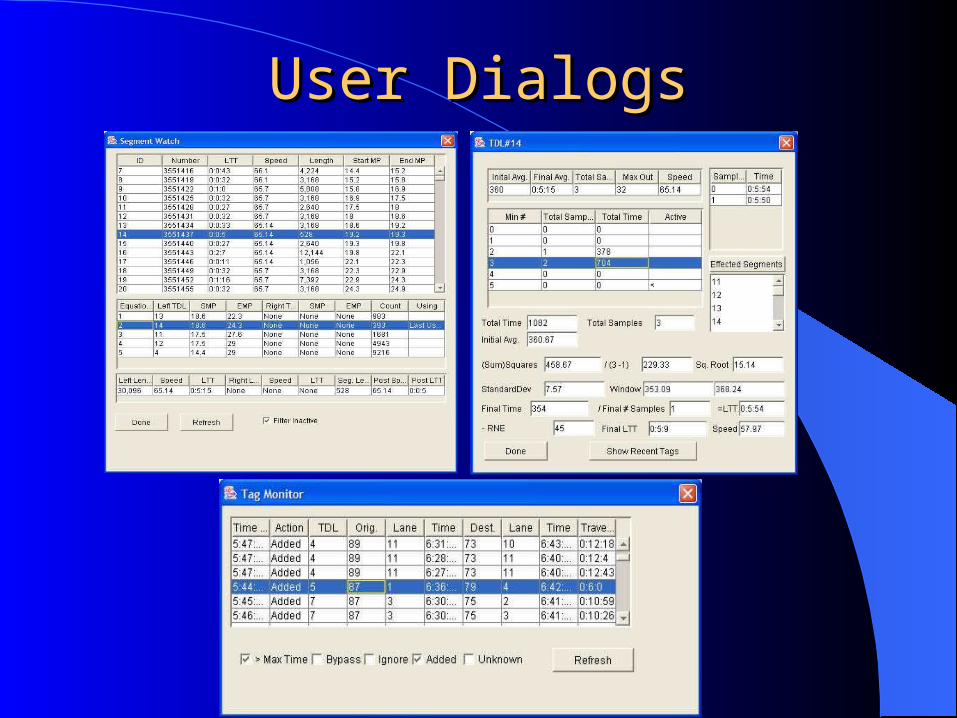
User DialogsUser Dialogs

GCM Travel Web PageGCM Travel Web Page

DMSDMS

ConclusionsConclusions
• PROS• Uses Existing Infrastructure
• Actual data is very accurate
• Over one million daily tag reads
• CONS• Existing Infrastructure
Optimized for Toll Collections not Traffic Data
• Where plazas are widely separated (up to 30 miles) TT can lag significantly
• Only 25% pass the tests for validity

Future EffortsFuture Efforts
• Addition IPASS Readers are planned at the endpoints in conjunction with IDOT
• 34 new DMS are being added• Additional IPASS Readers are being planed at more
frequent intervals to further improve data resolution • AVL for maintenance, police, and money trucks may be
added • Currently through a Federally Funded Program RTMS
data is being added in the urban areas to improve data resolution and to add a new incident detection algorithm