Irc.gov.in.sp.058.1999_guidelines for Use of Fly Ash is Road Embankments

JOINT HIGHWAY RESEARCH PROJECT
Final Report
THE USE OF BOTTOM ASH IN HIGHWAY EMBANKMENTS, SUBGRADES, AND SUBBASES
Wei-Hsing Huang

FINAL REPORT
THE USE OF BOTTOM ASH IN HIGHWAY EMBANKMENTS, SUBGRADES, AND SUBBASES
To: H. L. Michael, Director Feb. 15, 1990 Joint Highway Research Project
Project : C-3 6-501 From: C. W. Lovell and J. E. Lovell
Joint Highway Research Project File: 6-19-9
Attached is the Final Report of the HPR Part I1 study titled "The Use of Bottom Ash in Highway Emba.nkments, Subgrades, and Subbases.l1 The report was prepared by Mr. Wei-Hsing Huang, Graduate Research Assistant, under our direction.
A total of eleven Indiana bottom ashes was selected, sampled from ten power plants, and tested extensively to provide information on the properties of Indiana bottom ashes. The results of detailed evaluations show that the properties of bottom ash compare favorably with conventional highway materials, and they would also meet specification requirements set for conventional materials.
The potential environmental effects of bottom ash utilization were evaluated by performing the EP toxicity test and an Indiana leaching method. It was found that bottom ash can be classified as nonhazardous according to the current EPA regulations. Also, bottom ash leachate would meet the requirements for the most restrictive type of waste site specified in the Indiana Administrative Code.
The report is submitted for review, comment and acceptance in fulfillment of the referenced study.
C. W. Lovell Research Engineer
. Love11 Professional Research Assistant
cc: A. G. Altschaeffl R. A. Howden B. K. Partridge J. M. Bell M. K. Hunter G. T. Satterly M. E. Cantrall J. P. Isenbarger C. F. Scholar W. F. Chen J. F. McLaughlin K. C. Sinha W. L. Dolch K. M. Mellinger C. A. Venable R. L. Eskew R. D. Miles T. D. White J. D. Fricker P. L. Owens L. E. Wood D. E. Hancher

TECHNICAL REPORT STANDARD T ITLE PACE
1. Roport No. I 2. Covrrront Accession No. ( 3. Rwcipient'r Catolog Ha.. . b 1
I
4. Title m d Subsitlo
THE USE OF BOTTOM ASH IN HIGHWAY EMBANKMENTS, SUBGRADES, AND SUBBASES
1 Wei-Hsing Huang I ?XWA/IN/JHRP-9014 - I
5. Roport D ~ I O . Feb. 15, 1990
6. Pufonning Ovgonizorion Code
7. &hods)
9. Perlonminp Orgmizatiqn N m o and Addroar I 10. Worb Unit No.
, 8 . Puforming Orgonizotion Report No.
Joint Highway Research Project Civil Engineering Building Purdue University
11. Controct or Cront No.
HPR Part I1
100 North Senate Avenue Indianapolis, Indiana 46204
West Lafayette, Indiana 47907 . 12. Sponsoring b e n c y Nome m d Addre.- Indiana Department of Transportation State Office Building
14. Sponsoring Agency Cod-
11. TYPO 01 Report ond Pariod Corered
Final Report
Prepared in cooperation with the U.S. Department of Transportation, Federal Highway Administration.
16. Absrroct
This research assessed those properties of power plant bottom ash likely to affect its use as highway fill or pavement material, based on laboratory investigation con- ducted on eleven Indiana bottom ashes. Laboratory tests included: chemical analysis, mineralogical study, microscopic examination of ash particles, specific gravity, grain size distribution, sulfate soundness, Los Angeles abrasion, permeability, shear strength, moisture-density relations, degradation under compaction, compressibility, and California bearing ratio.
The various test values and properties were compared to- those of representative granular soils or appropriate specifications. These comparisons provide information necessary for judging the suitability of bqttom ash in Indiana highway construction.
The potential environmental effects of bottom ash utuization were evaluated by performing leaching tests outlined in the EP toxicity test and an Indiana leaching method. Chemical analysis of the leachates showed that bottom ash is nonhazardous, and its effects on the quality of'ground water are minimal.
I 17. Key Cord.
bottom ash, boiler slag, waste materials, , highway materials, embankment, pavement, leaching test, leachate, ash disposal
18. Gistribution Srotement
No restrictions. This document is available to the public through the National Technics:. Information Service, Springfield, Virginia 22161.
I 19. Security CloaaIf. (el hi. -pot*)
Unclassified
F c r r . DOT F 1700.7 ( 8 - t S )
a. Securlcy CIoraIf. (01 thlr pop.)
Unclassified
21- No. ol Poger
269
22. Price

FINAL REPORT
THE USE OF BOTTOM ASH IN HIGHWAY
EMBANKMENTS, SUBGRADES, AND SUBBASES
Wei-Hsing Huang Graduate Research Assistant
Joint Highway Research Project
Project No.: C-36-501
File No. : 6-19-9
Prepared as Part of an Investigation
,Conducted by the
Joint Highway Research Project Engineering Experiment Station
Purdue University
In cooperation with the
Indiana Department of Transportation
and the
U.S. Department of Transportation Federal Highway Administration
The contents of this report reflect the views of the author who is responsible for the facts and accuracy of the data presented herein. The contents do not necessarily reflect the official views or policies of the Federal Highway. Administration. This report does not constitute a standard specification or regulation.
Purdue University West Lafayette, Indiana 47907
Feb. 15, 1990

The author wishes to express his gratitute to his major
professor, Dr. C. W. Lovell, for his valuable guidance and
encouragement throughout the course ~f this study. Special
thanks are expressed to Dr. A. G. Altschaeffl, Dr. T. D.
White, and Dr. D. N. Winslow for serving on the advisory
committee and critical review of the dissertation.
The author is indebted to Mrs. Janet Lovell for her
valuable suggestions in the laboratory studies and comments
pertaining to the final manuscript. Special thanks are due
Mr. Bob Rahn of INDOT for his assistance and advice in this
study. Appreciation is also expressed to Messrs. Te-Chih Ke,
Ross Duckworth, and Joe Walters for their assistance in
laboratory testing. Mr. Xiaotian Mao is acknowledged for his
assistance in radioactivity testing. Part of the leachate
analysis was performed by the Environmental Laboratory
Division, Indiana State Board of Health, Indianapolis,
Indiana.
The author also wishes to express his thanks to the staff
at the power stations who provided invariable cooperation and
. guidance during the sampling of bottom ash in this project.

iii
The financial support for this research project was
provided by the Indiana Department of Transportation and
Federal Highway Administration through .the Joint Highway
Research Project, School of Civil Engineering, Purdue - .. - - - . - - -. - - - - -- - - - -- -
University, West Lafayette, Indiana.
Finally, the author wishes to express his love and
gratitude to his families, especially his wife Tzer-Min, for
the continuous support, encouragement, and understanding given
him during his study.

TABLE OF CONTENTS
Page
. . . . . . . . . . . . . . . . . . . . . LIST OF TABLES viii
LIST OF FIGURES . . . . . . . . . . . . . . . . . . . . xi
. . . . . . . . . . . . . . . . . . . . . . . . ABSTRACT xvi
. . . . . . . . . . . . . . . . . . . . . INTRODUCTION 1
Problem Statement . . . . . . . . . . . . . . . . 1 Research Objectives . . . . . . . . . . . . . . . 4 Research Approach . . . . . . . . . . . . . . . . 5 . . . . . . . . . . . . . . . Literature Review 5
Experimental Program . . . . . . . . . . . . 6 Environmental Evaluation . . . . . . . . . . 7 Economic Evaluation . . . . . . . . . . . . . 8
. . . . . . . . . . . . . . . . . . . LITERATURE REVIEW 9
Origin of Power Plant Ash . . . . . Collection of Ash . . . . . . . . .
Pulverized Coal-Fired Furnaces Cyclone urna aces . . . . . . . Stoker-Fired Furnaces . . . . .
Disposal of Ash . . . . . . . . . . Production and Utilization . . . . . Properties of Bottom Ash . . . . . .
Physical Characteristics . . . Physical Appearance . . . Specific Gravity and Water Gradation . . . . . . . .
. . . . . . . 14 . . . . . . . 16 . . . . . . . 17 . . . . . . . 18 . . . . . . . 20 . . . . . . 23 . . . . . . . 29 . . . . . . . 30 . . . . . . . 30 Adsorption . 3 1 . . . . . . . 33
Chemical Properties . . . . . . . . . . . . . 40 Chemical Composition . . . . . . . . . . 40 Trace Elements . . . . . . . . . . . . . 45 Mineralogy . . . . . . . . . . . . . . . 46
Engineering Properties of Bottom Ash . 48 Soundness . . . . . . . . . . . . . . . 48 . . . . . . . . . . Los Angeles Abrasion 50 . . . . . . . . . Deleterious Materials 54 Angle of Shearing Resistance . . . . . . 58 Permeability . . . . . . . . . . . . . . 61 Compaction Characteristics . . . . . . . 64 Compressibility . . . . . . . . . . . . 72

v
Page
. . . . . . . . . . . . . . . . Stabilization Mechanical Stabilization . . . . Admixture Stabilization . . . . . . . . . . . . . . Environmental Aspects of Ash Utilization . . . . . . . . . . Environmental Legislation
Environmental Impacts of Ash Utilization . . Waste Classification . . . . . . . . . . . . . . . . . . Characteristics of Corrosivity
Extraction Procedure Toxicity Characteristics (EPTC) . . . . . .
Toxicity Characteristics Leaching Procedure (TCLP) . . . . . . . . .
Indiana Leaching Method,, . . . . . . . . Leaching Properties of Ash . . . . . . . . .
Leaching Mechanism . . . . . . . . . . Attenuation Mechanisms . . . . . . . . Leachate Content . . . . . . . . . . . . . . . . . . . . . . . . . . Radioactivity
TESTING MATERIALS . . . . . . . . . . . . . . . . . . Selection of Ash Sources . . . . Sampling of Ash Bottom Ash . . . . . . . . . . . Gibson Ash
Gallagher Ash . . . Wabash Ash . . . . . . . . . Brown Ash
. Culley Ash . . . . Schahfer Unit 17 . Schahfer Unit 14 . . . . Mitchell Ash Richmond Ash . . . Perry Ash . . . . . Stout Ash . . . . .
Fly Ash . . . . . . . . . LABORATORY TESTING PROGRAM . . . . . . . . . . . . .
Introduction . . . . . . . . . . . . . . . . . . Ash Characterization Tests . . . . . . . . . . .
Chemical Analysis . . . : . . . . . . . . . Loss on Ignition . . . . . . . . . . . . . Microscopic Examination . . . . . . . . . . X-Ray Diffraction . . . . . . . . . . . . . Grain Size Distribution . . . . . . . . . . Specific Gravity . . . . . . . . . . . . .
Aggregate Tests . . . . . . . . . . . . . . . . Los Angeles Abrasion . . . . . . . . . . . Sulfate Soundness . . . . . . . . . . . . .

Page
Geotechnical Property Tests . . . . . . . . . . Maximum and Minimum Densities . . . . . . . Permeability . . . . . . . . . . . . . . Angle of Shearing Resistance . . . . . . . Compact ion . . . . . . . . . . . . . . Degradation . . . . . . . . . . . . . . . . One-Dimensional Compression . . . . . . . California Bearing Ratio (CBR) . . . . . . . . . . . . . . . . . . . . . Stabilization . . . . . . . . . . . . . . Compressive Strength . . . . . . . . . . . . . . . . . ~eaching Tests Extraction Procedure (EP) Toxicity . . . . Indiana Leaching Method . . . . . . . . . . . Leachate Analysis . . . . . . . . . . . . . . . . . . . . . . . . . . . . . . . Radioactivity '
RESULTS AND DISCUSSION . . . . . . . . . . . . . . . Shape and Surface Texture . . . . . . . . . . . Mineralogical Analysis . . . . . . . . . . . . . Chemical Analysis . . . . . . . . . . . . . . . Grain Size Distribution . . . . . . . . . . . . . . Specific Gravity . . . . . . . . . . . . . . . . Soundness . . . . . . . . . . . . . . . . . . . Los Angeles Abrasion . . . . . . . . . . . . . . Relative Density and Void Ratio . . . . . . . . permeability . . . . . . . . . . . . . . . . . . Angle of Shearing Resistance . . . . . . . . . . Moisture-Density Relations . . . . . . . . . . . Degradation . . . . . . . . . . . . . . . . . . . One-Dimensional Com@ression . . . . . . . . . . California Bearing Ratio (CBR) . . . . . . . . . Mechanical Stabilization . . . . . . . . . . . .
Densification Behavior . . . . . . . . . . . Load-Deformation Characteristics . . . . . .
Cement Stabilization . . . . . . . . . . . . . . Leachate Properties . . . . . . . . . . . . . . Radioactivity.'. . . . . . . . . . . . . . . . .
ECONOMIC EVALUATION . . . . . . . . . . . . . . . . . . . . . . . . Locations and Quantities Available
Cost Factors Influencing Ash Utilization . . . . Disposal Costs . . . . . . . . . . . . . . . . . . . . . . . . . . Processing Costs
. . . . . . . Conventional Aggregate Costs Transportation Costs . . . . . . . . . . .
Assessment of Economic Potential . . . . . . . . .

v i i
Page
RECOMMENDATIONS FOR IMPLEMENTATION . . . . . . . . . 270
Ash Selection Guidelines . . . . . . . . . . . . 270 Source Selection . . . . . . . . . . . . . 271 Acceptance Criteria . . . . . . . . . . . 274
Environmental Concerns . . . . . . . . . . . . . 276
SUMMARY AND CONCLUSIONS . . . . . . . . . . . . . . . 278
. . . . . . . . . . . . SUGGESTIONS FOR FURTHER STUDIES 282
BIBLIOGRAPHY . . . . . . . . . . . . . . . . . . . . 284
APPENDICES . . . . . . . . . . . . . . . . . . . . . . 299
Appendix A: X-ray Diffraction Patterns of Bottom Ashes . . . . . . . . . . . . . . . . . . . 299
~ppendix B: Sample Form for Calculation of the Index of Crushing . . . . . . . . . . . . . 310
. Appendix C: Moisture-Density Cunes for Various Ash Mixtures . . . . . . . . . . . . . . . . 312
VITA . . . . . . . . . . . . . . . . . . . . . . . . . 316

. . . . . - s u ~ e x b jo L q ~ l e ~ n b u e pue ' u o ~ q e p e x b ' a z ~ s ' u o r q s e d m o ~ 30 aqeqs d q paqsas je
se s ~ ~ o s l e ~ n u e x b 203 d 20 sanTeA aqemyxoxddy
. . . . . . . . . . . . . . . . -qsaq uoTsezqe s a p b u y so? 103 s u o ~ q e ~ ~ j - p a d s ~ e ~ ? d &
. . . . . . . . . . . . . . . qsaq ssaupunos aqe jTns u m ~ p o s 202 s u o ~ q e s r j ? 3 a d s ~ e q U ; t
. . . . . . . . . *yuel snoTxeA jo sTeoD * S *n mol j qse aqq j o squaquoa q u a u t a ~ a - a ~ e l q a b e x a ~ y
. . . . . . . . . . qse jo s ? s d ~ e u e ~ e ~ ~ m a q 3
. . . . . . . . . . . . . . .sTeTxaqem aseqqns p u e a s e q l o j siuamaxrnbax b u ~ p e x b eueTpuI
. . . . . . . . . . . . . . . *sasxnoD a s e j x n s pue a s e q ' s a s e q q n s x o j sTeTxaqem aqe6ax6be
- T J O S pue aqebaxbbe l o j squautaxpbal b u ~ p e x s
. . . . . . . . . . . . . saseqqns pue s a s e q aqebazbbe 103 squamax~nbal x p - q o f pue b u ~ p e x s P
' 2 8 6 ~ - U f qse q u e ~ d lamod x o j a ~ ~ j o l d a s n pug t
. . . . . . . . . . . . . . . . . . -suoyqesoT snoTzeA qe p a q s a ~ ~ o ~ qse TeoD jo s a ~ q ~ q u e n b Z

EPA Criteria pollutants - primary metals . . . Additional toxicity characteristic contaminants and regulatory levels . . . . . . Allowable concentrations of waste constituents using the EP toxicity test - Indiana . . . . . Allowable concentrations of waste constituents using the Indiana leaching method test . . . . Bottom ash sources in the study. . . . . . . . Coal sources and ash type. . . . . . . . . . . Index properties of selected fly ashes . . . . Results of X-ray analysis on bottom ashes. . . Glass in bottom ash. . . . . . . . . . . . . . Chemical composition of Indiana bottom ashes . Unified soil Classification of bottom ashes. . AASHTO classification of bottom ashes. . . . . Specific gravity of bottom ashes . . . . . . . Specific gravity of the first ash sample using differentmethods. . . . . . . . . . . . . . . Sulfate soundness of bottom ashes. . . . . . . Results of the Los Angeles abrasion test . . . Maximum and minimum void ratios and densities of selected bottom ashes . . . . . . . . . . . 18 8
Coefficients'of permeability of bottom ashes . 19 0
Results of direct shear tests on bottom ashes. 198
Moisture-density properties of bottom ashes. . 206
Degradation of bottom ashes under compaction . 214
CBR test results on selected bottom ashes. . . 221
Secant constrained modulus bottom ashes

Table Page
39 Compressive strength of cement stabilized bottom ashes and bottom ash-fly ash mixtures .
40 Results of the EP toxicity test on selected . . . . . . . . . . . . . . . . bottom ashes , 41 Results of the 1ndiana.leaching method test on . . . . . . . . . . . . selected bottom ashes.
42 Radium-226 activity of bottom ash. . . . . . . 43 Potential bottom ash sources in Indiana. . . . 44 Average bid prices for borrow and subbase
materials in Indiana . . . . . . . . . . . . . Appendix Table
B-1 Sample form for calculation of the index of crushing from sieve analysis . . . . . . . . .

LIST OF FIGURES . - - - - - - - - . .
Figure
1 Net generation of electricity by coal. . . . . 2 Coal consumption by electric utilities . . . . 3 Schematic diagram of the ash handling system . 4 Dry disposal of ash. . . . . . . . . . . . . . 5 Ash production by electric utilities . . . . . 6 Ash utilization trends - 1980 to 1985. . . . . 7 Coal consumption by Indiana electric utilities
8 Gradation range for dry bottom ash . . . . . . 9 Gradation range for wet bottom ash . . . . . . 10 Average gradations for d r y and wet bottom
ashes. . . . . . . . . . . . . . . . . . . . . 11 Gradations of dry and wet bottom ashes as
compared with AASHTO M 147 Gradation D for base and subbase materials . . . . . . . . . .
12 Gradations of dry and wet bottom ashes as compared with AASHTO M 147 Gradation E for base and subbase materials . . . . . . . . . . 42
13 Typical moisture-density curve . . . . . . . . 67
14 Typical moisture-density cume for cohesionless soils . . . . . . . . . . . . . . 69
15 Grain structure of soil-aggregate mixtures . . 76
16 The possible effects'of an ash deposit on human health and environment . . . . . . . . . 92
17 Approximate locations of bottom ashes sampled in the study . . . . . . . . . . . . . . . . . 114

xii
18 Micrograph of Schahfer Unit 14 wet bottom ash . 19 Micrograph of Schahfer Unit 17 ash . . . . . . 20 Micrograph of Mitchell ash . . . . . . . . . .
. . . . . . . . . . . 21 Micrograph of Gibson ash ...... . . . . . . . . . . 22 Micrograph of Gallagher ash
23 Micrograph of Wabash ash . . . . . . . . . . . . . . . . . . . . . . . 24 Micrograph of Brown ash
.... 25 ' ~icrograph of Culley ash . . .' . . . . . . . .
Micrograph of Richmond ash . . . . . . . . . . 27 Micrograph of Perry ash . . . . . . . . . . . .
. . . . . . . . . . . . 28 Micrograph of Stout ash
. . . . . . 29 Micrograph of standard Ottawa sand
30 Typical X-ray diffraction pattern of dry bottom ash (Richmond) . . . . . . . . . . . . .
31 Typical X-ray diffraction pattern of wet bottom ash (Schahfer Unit 14) . . . . . . . . .
32 Variation in chemical constituents of bottom ash . . . . . . . . . . . . . . . . . . . . . .
33 As-sampled gradations of Schahfer Unit 14 ash . 34 As-sampled gradations of Schahfer Unit 17 ash . 35 As-sampled gradations of Gibson ash . . . . 36 As-sampled gradations of Perry ash . . . . . . 37 As-sampled gradations of Gallagher ash . . . . 38 As-sampled gradations of Mitchell ash . . . . . 39 As-sampled gradations of Wabash ash . . . . . .
. . . . . . . 40 As-sampled gradations of Stout ash
41 As-sampled gradations of Brown ash . . . . . . 42 As-sampled gradations of Culley ash . . . . . .

xiii
As-sampled gradations of Richmond ash. . . . . 172
Range of gradations for bottom and fly ashes . Results of direct shear tests on Perry ash . . Results of direct shear tests on Gallagher ash
Results of direct shear tests on Gibson ash. . Results of direct shear tests on Schahfer Unit 1 7 a s h . . . . . . . . . . . . . . . . . . . .
Results of direct shear tests on Schahfer Unit 14 ash. . . . . . . . . . . v . . . . . . . . Moisture-density relations for Schahfer Unit 1 4 a s h . . . . . . . . . . . . . . . . . . . .
Moisture-density relations for Schahfer Unit 1 7 a s h . . . . . . . . . . . . . . . . . . . .
Moisture-density relations for ~ibson ash. . . Moisture-density relations for Gallagher ash . Gradations of Schahfer Unit 14 ash before and after compaction . . . . . . . . . . . . . . . Gradations of Schahfer Unit 17 ash before and after compaction . . . . . . . . . . . . . . . Gradations of Gibson ash before and after compaction . . . . . . . . . . . . . . . . . . Gradations of Perry ash before and after compaction . . . . . . . . . . . . . . . . . . Gradations of Gallagher ash before and after compaction . . . . . . . . . . . . . . . . . . One-dimensional compression curves for bottom ashes and a medium sand. . . . . . . . . . . . One-dimensional compression curves for bottom ashes and a medium sand. . . . . . . . . . . . Constrained modulus vs. vertical stress for bottom ashes and a medium sand . . . . . . . . Moisture-density-CBR relations for Schahfer Unit14ash . . . . . . . . . . . . . . . . . .

xiv
Moisture-density-CBR r e l a t i o n s fo r Schahfer U n i t 1 7 a s h . . . . . . . . . . . . . . . . . . 2 2 5
Moisture-density-CBR re l a t i ons f o r Gibson ash. 226
Maximum densi ty and optimum moisture f o r various proportions of Gibson bottom and f l y a s h e s . . . . . . . . . . . . . . . . . . . . . 2 2 8 .. - - - .
Maximum densi ty and optimum moisture f o r various proportions of Schahfer 17 bottom . . . . . . . . . . . . . . . . . a n d f l y a s h e s 229
Maximum densi ty and optimum moisture f o r various proportions of Schahfer 17 bottom ash and Schahfer 1 4 f l y ash. . . . . . . . . . 230
Maximum densi ty and optimum moisture f o r various proportions of Schahfer 1 4 bottom a n d f l y a s h e s . . . . . . . . . . . . . . . . . 2 3 1
Densification behavior of various bottom ash- . . . . . . . . . . . . . . . f l y a s h m i x t u r e s 233
Absolute volumes of bottom ash, f l y ash, and voids i n Gibson ash m i x t u r e s . . . 234
CBR values and percent swelling of various proportions of Gibson bottom ash-fly ash m i x t u r e s . . . . . . . . . . . . . . . . . . . 237
Maximumdensity and CBR values f o r various proportions of Gibson ash mixtures . . . . . . 2 4 0
Seven-day compressive s t reng th f o r var ious proportions of Schahfer 17 bottom ash and S c h a h f e r 1 4 f l y a s h . . . . . . . . . . . . . . 2 4 1
Seven-day compressive s t reng th f o r various proportions of Schahfer 1 4 bottom and f l y a s h e s . . . . . . . . . . . . . . . . . . . . . 2 4 2
Compressive s t reng th of cement s t a b i l i z e d . . . . . . . . . . . . . . Gibson ashmixtures . 245
Compressive s t reng th of cement s t a b i l i z e d Schahfer 17 ash mixtures . . . . . . . . . . . 2 4 6
Locations of coal-burning power p l an t s i n Indiana. . . . . . . . . . . . . . . . . . . . 258
. . . . . Areas lacking aggregates in Indiana. 262

Figure Page
77 Location of coal-burning power plants in Indiana. . . . . . . . . . . . . . . . . . . . 258
78 Areas lacking aggregates in Indiana. . . . . . 79 Areas showing economic potential for use of
bottom ash in highway fills. . . . . . . . . . Appendix Figure
A-1 X-ray diffraction pattern of Schahfer Unit 17 ash. . . . . . . . . . . . . ,. . . . . . . . .
A-2 X-ray diffraction pattern of Mitchell ash. . . A-3 X-ray diffraction pattern of Gibson ash. . . . A-4 X-ray diffraction pattern of Gallagher ash . . A-5 X-ray diffraction pattern of Wabash' ash. . . . A-6 X-ray diffraction pattern of Perry ash . . . . A-7 X-ray diffraction pattern of Stout ash (first
sample). . .' . . . . . . . . . . . . . . . . . A-8 X-ray diffraction pattern of Stout ash (second
sample) . . . . . . . . . . . . . . . . . . . . A-9 X-ray diffraction pattern of Culley ash. . . . A-10 X-ray diffraction pattern of Brown ash . . . . C-1 Moisture-density curves for various
proportions of Gibson bottom ash-fly ash mixtures . . . . . . . . . . . . . . . . . . .
C-2 Moisture-density curves for various proportions of Schahfer 17 bottom ash-fly ash mixtures . . . . . . . . . . . . . . . . . . .
C-3 Moisture-density curves for fly ashes. . . . . 315

xvi
HIGHLIGHT SUMMARY
Interest in coal ash produced from power generating
plants as a substitute for conventional construction material
has increased considerably in recent years. The utilization
of coal ash not only solves a waste disposal problem but also
provides an economic construction material. In the past,
studies on power plant ash have been concentrated on
properties of fly ash. Very little has been developed on the
productive use of bottom ash, primarily because of the lack of
information 'on properties on this material. This report
assesses those properties of bottom ash likely to affect its
use in highway fill and pavement construction.
Laboratory investigations were conducted on eleven bottom
ashes collected from all parts of Indiana. Chemical property
tests included a complete chemical analysis and mineralogical
analysis. Physical properties such as appearance, grain size
distribution, and specific gravity of bottom ash were also
studied. The assessment of mechanical performance involved a
series of tests consisting of sulfate soundness, Los Angeles
abrasion, permeability, shear strength, compaction
characteristics, compressibility, and California bearing
ratio. To evaluate potential highway construction uses, the

xvii
test results were compared with those of representative
granular materials and appropriate existing specifications.
The potential environmental effects of bottom ash
utilization center around possible leaching of heavy metals
and soluable salts from ash-constructed embankments. Leaching
tests were performed using the extraction procedure outlined
in the EP toxicity test and an Indiana leaching method.
Chemical analysis of the leachates generated from these tests
showed that bottom ash is nonhazardous, and its effects on the
quality of ground water are minimal.
The economic potential was assessed for Indiana bottom
ashes based on the quantities available and their location
with respect to potential market areas. A qualitative study
of the cost factors determining the cost of bottom ash in
place was also included.
Based on this laboratory investigation, it is concluded
that the properties of bottom ash compare favorably with
conventional granular materials. It is obvious that .
utilization of such extensively produced by-products of the
power industry as an economic highway material should be
encouraged in the immediate future. It is recommended that
the Indiana Department of Transportation proceed to schedule
the construction of experimental sections of embankment and
pavement using bottom ash.

INTRODUCTION
Problem Statement
Power plant ash is the by-product produced from the
burning of coal in utility power plants. The growing demand
for electricity has resulted in the construction of many coal-
fired power plants and as a result the production of power
plant ash has continued to increase. For example, in the 10-
year period of 1976 to 1986, the annual production of power
plant ash increased from 54 to 67 million tons [I]. Disposal
of power plant ash has become more costly to the power
industry. Costs are ultimately transferred to the power
consumer.
the other hand, many areas of the United States are
faced with a shortage of conventional construction materials.
Most urban areas, where demands of construction material are
high, are deficient in the supply of conventional aggregates
121. In addition, zoning restrictions and environmental
regulations often remove acceptable materials from
availability. Usually these same urban areas are served by
many power stations that produce large quantities of ash.
Obviously, a favorable combination of circumstances is created
for utilization of power plant ash as a partial or full

substitute for conventional aggregates in various
applications.
The materials collected from the burning of coal at
electric utility plants are referred to as power plant ash.
These materials are produced in two forms: fly ash and bottom
ash. Bottom ash is the slag which builds up on the heat-
absorbing surfaces of the furnace, and which subsequently
falls through the furnace bottom to the ash hopper below. Fly
ash is the fine-grained dusty material that is recovered and
collected from furnace flue gases by ash precipitators.
In view of the benefits to be gained from the utilization
of power plant ash as a construction material, much research
and other efforts devoted to exploring productive uses for
this material in the construction of highways, buildings, and
other structures is justified. In the past, much of the
available research has focused on the properties and uses of
fly ash. This is understandable because fly ash represents
approximately two-thirds of the total ash production (11.
However, other studies [ 3 , 4 ] have indicated that engineering
properties of many bottom ashes compare favorably with those
of conventional highway construction materials.
Unfortunately, an extensive review of the literature
reveals that the amount of laboratory and field data on the
properties and performance of this material is very limited.
Therefore, in order to develop productive uses of bottom
ashes, a substantial data base on their properties is needed.

-qse moqqoq
go a s n zog LOaNI oq s a u ~ ~ a p ~ n 6 pue uoTqemojuT k e s s a 3 a u aqq
a p ~ ~ o z d o q p a u b ~ s a p ST mezbozd q3zeasaz s ~ q ~ * u o ~ q 3 r u q s u o a
A ~ M ~ ~ ~ T z I eueTPuI uT qse uoqqoq a s n oq ( ; L O ~ N I ) u o ~ q e ~ o d s u e z ; ~
go quamqzedaa eueTpuI aqq z o j uoTqeATqom ST azaqq ' [ L ]
s a q e q s paqTun aqq u~ saqeqs b u ~ ~ n p o z d - q s e q s a b z e ~ q q b ~ a aqq
go auo ST eueTpuI j o aqeqs aqq a3uTS ' a z n q n j aqq u~ s ~ s e q d m a
azom uaAa q q ~ ~ a n u ~ q u o 3 I I T M qse Teo3 j o uoTqezTITqn a m
a b e z n o ~ u a oq puazq aqq qeqq paqaadxa ST 31 - [ g ] qse I e o 3 j o
suoq 0 0 0 ' ~ ueqq azom apnTauT qeqq sqaafozd d e ~ q b ~ q z o j q3qem
p?e-Iezapad q u a ~ z a d s TeuoTqTppe u e 6 u ~ p ~ ~ o z d d q qse I e o 3 j o
a s n a u m ~ o ~ - a b x e ~ b u ~ b e z n o ~ u a ST uoTqezqsTuTtnpy d e m q b ~ ~ Iezapad
aqq ' A 1 b u ~ p z 0 3 3 y - u o ~ q 3 r u q s u 0 3 Xemqb~q UT a s n qse
go quauaszopua buozqs e p a p n p u ? ~ 8 6 ~ j o [ s I q3y a3ueqsTssy
u o ~ q e 3 0 1 a x w o g T u n pue u o t q e q z o d s u e x ~ a3egzns aqL
esasn u o ~ q 3 r u q s u o 3 ~ e ~ q u a q o d
o s a q s e uoqqoq aIqeITeAe A11e3o~: aqenIeAa o a z n p a ~ o z d
3~qeuraqsAs e zog paau .e ST axaqq ' a x o ~ a x a q ; ~ * s a z n p a ~ o x d
pue s u o ~ q ~ p u o ~ b u ~ q e x a d o aqq u o b u ~ p u a d a p a IqeTzeA a q ~ n b a q
u e 3 a x n o s a ~ b u ~ s e uoxg p a ~ n p o x d qse moqqoq u a m - s a ~ ? q ~ e z d
b u ~ ~ p u e q qse ( a pue ' a ~ e u z n j aqq u~ s u o ~ q ~ p u o ~ b u ~ z ~ j
( p ' u o ~ q e z ~ x a ~ ~ n d ~ e o 3 go aazbap ( 3 'sadX7 zaTToq ( q ' p a u n q
1eo3 go u ~ b ~ x o pue adXq aqq ( e : u ~ sa3uaxa j jTp j o asne3aq
s x n m o A q ~ I ~ q e t z e ~ aqL * A q ~ I ~ q e ? z e ~ s q ~ ST qse moqqoq q u e ~ d
xamod j o a s n aqq q q ~ ~ paqeT3osse m a ~ q o x d ~ e ~ q u a q o d y

Research Obiectives
The primary objective of this research was to determine
the various ways in which bottom ashes can be used in Indiana
highways, with emphases on large tonnage uses such as highway
fills, select subgrades, and stabilized or unstabilized
subbases and bases. Based on laboratory investigations
conducted on Indiana bottom ashes, this study assessed those
properties of bottom ash that are likely to affect its use in
highway fill and pavement construction. Specifically, these
included index properties, moisture-density relationships,
shear strength, and compressibility of bottom ash, as well as
mechanical and chemical stabilization of the material.
Characterization of representative Indiana bottom ashes needed
be accomplished to provide guidelines in the selection of
locally available bottom ashes for various highway
applications. It was also intended to evaluate the potential
environmental impacts resulting from bottom ash uses.
Radioactivity of bottom ash and the leaching potential of the
material were examined.
Another objective was to evaluate the validity and the
extent of applicability of the conventional test methods and
the pertinent material specifications in the utilization of
bottom ashes. This is intended to establish general
guidelines for the modifications of conventional test methods
and material specifications as applied to bottom ash.

Research Amroach
In order to accomplish the objectives, the following
tasks were completed: a) a thorough literature review, b) a
complete experimental program on physical, chemical, and
engineering properties of Indiana bottom ashes, c) an
evaluation of the potential environmental effects, and d) an
examination of the economics of bottom ash use in Indiana.
Literature Review
More than 200 relevant documents were reviewed on the
nature, production, properties, disposal and utilization, and
service performance of power plant ash. This review focused
on publications concerning:
1. Production and disposal of power plant ash.
2. Primary and supplementary areas of utilization.
3. Laboratory test results on the physical, chemical, and
engineering properties of power plant ashes.
4 . Environmental effects resulted from ash disposal and
utilization.
5 . Quantities and locations of available ashes.
6. Use of other waste materials in highway construction.
As mentioned earlier, most publications concentrated
. their attention on fly ash, with limited discussions on bottom
ash. Nevertheless, these publications on power plant ash,

along with some on blast furnace slag and coal mine refuse,
contributed significant information for this study.
Experimental Program
A total of 11 bottom ashes were'collected for study from
10 power stations in Indiana, with consideration to: boiler
type, type and source of coal, geographic distribution, and
ash disposal method. First, these samples were subjected to
a series of physical and chemical characteristic tests. The
remainder of the experimental program was devoted to tests on
the engineering properties of the ashes, especially those
which would relate to their use in highway fills and
pavements.
The characterization tests consisted of:
- complete chemical analysis of each bottom ash; - mineralogical study using X-ray diffraction techniques;
- microscopic examination of the shape and texture of the particles;
- grain size distribution, ASTM C 136 [8]; - specific gravity, ASTM and
Selected bottom ashes were evaluated using the following
tests:
- sulphate soundness, ASTM C 88 [Ill;

- Los Angeles abrasion, ASTM C 131 [12]. - maximum and minimum index density, ASTM D 4253 [13] and 4254 [14];
- falling head permeability; - shear strength; - standard Proctor compaction, ASTM D 698 [15]; - degradation under compaction; - one-dimensional compressibility;, - California bearing ratio, ASTM D 1883 [16].
Finally, selected bottom ashes were subjected to
mechanical and chemical stabilization to broden the potential
application of the material in pavement construction.
The test results were compared with those of
representative granular materials, to further evaluate the
potential of bottom ash for highway uses.
Environmental Evaluation
Representative bottom ash samples were subjected to
leaching tests designated by Environmental Protection Agency
(EPA) [17] to determine whether bottom ash is environmentally
hazardous. Leachates generated from the Extraction Procedure
(EP) toxicity tests conducted on bottom ashes were analyzed
for heavy metals to predict their hazardous characteristics.
In addition, to evaluate the possible groundwater
pollution potential of bottom ash, the Indiana leaching method

test (181 was performed. Similarly, the leachates were
analyzed for the parameters specified in state regulations to
determine the groundwater pollution potential.
The radioactivity of bottom ash was examined by
determining the radium-226 activity and the results were
compared to those of natural soils.
Economic Evaluation
The economic evaluation of the use of bottom ash in
highway construction focuses on two phases:
1. An assessment of economic potential for 1ndiana bottom
ash based largely on the quantities available and their
location with respect to potential market areas.
2. A study of the factors that would determine the cost
of bottom ash in place for development as a highway
construction material.

LITERATURE REVIEW
More than SO percent of the electrical energy produced in
the United States comes from the burning of coal (191. During
1988, approximately 756 million tons of coal were consumed by
electric utilities [20]. Figure 1 shows the annual total
generation of electricity and that generated by coal-burning
from 1949 to 1988 (191. Although the growth of electricity
generation has slowed, indications are that coal will continue
to play an increasing role in the future generation of
electricity. As a result, the production of coal combustion
by-products, including power plant ash, will certainly
increase considerably.
Fiyre 2 shows the past'and projected quzntities of coal
consumed by electric utilities (19,211 . Projections are based on future utility consumption estimates furnished by the
American Coal Ash Association (ACAA) and the Department of
Energy (DOE). These projections indicate that more than one
billion tons of coal will be burned by electric utilities in
1995 and approximately 1.25 billion tons per year by 2000.
In the state of Indiana, the trend of increasing ash
production by electric utilities is particularly true, because

Billion Kilowatthours

Mil lion tons --L

98 percent of the Indiana electricity is generated from the
burning of c o a l [22].
Or ia in of Power P l a n t Ash
The by-products produced from t h e combustion of coa l a r e
t h e r e s i d u a l m a t e r i a l s which c o n s i s t p r imar i ly of t h e
inorganic mineral mat te r i n t h e c o a l , bu t a l s o of organic
mat te r which i s no t f u l l y burned. ~ h e s e r e s i d u a l ma te r i a l s
a r e r e f e r r e d t o a s power p l a n t ash. The amount of ash
produced by c c a l combustion is a func t ion of t h e ash content
of t k e c o a l . I n genera l , h igher ranks of coa l w i l l have less
ash than lower ranks. Table 1 summarizes t h e ASTM
c l a s s i f i c a t F o n of coa l by rank [ 2 3 ] . By and l a r g e , t h e most
important c l a s s e s a re :
- Anthrac i te
- Bituminous
- Subbituminous
- Lign i t e .
General ly , t h e bulk of bituminous c o a l used f o r power
genera t ion i n t h e U. S. has an ash content wi th in t h e range of
6 t o 20 percent . Low va lues of 3 o r 4 pe rcen t a r e encountered
in f requen t ly , and such coa l s f i n d o t h e r commercial uses ,
p a r t i c u l a r l y i n t h e me ta l lu rg ica l f i e l d . On t h e o the r hand,
some l i g n i t e coa l s may have an ash content a s high a s 30
percent [24].

v cn r.C e v 5 l r- I 0
i?
mmcn C C C v v c trcv r. r - r- e e e C C C Ela3 r- r- I-'. I I I 0 0 0 C C C m m m nws'
I l l
I I I
I I I
I l l
P 0 3 U O - . - W U l U l 0 0 0 0 0 0
P P W O P -.. UlUlUl 0 0 0 0 0 0
C C C C I ElElElHO r- r- r- r- C I I I I ( n 2 , 0 9 2
5 e 3 rl P 0 r. e r- C]
ms'z (D I (D El e e r.=rw wrl l I W P , en I 3r.e rl e 3 P o w 0 0, r - 0 e r. ID e
(D
03 a a m h ) w
\3 U, h ) w l
ah) 1
P P W h )
I I I
I l l
a r El rl rr. P 'Z C1.X ve- 3 0
P e _ r -a t l ; ( t r , e r- rl r. m C) V1 I I- P 'M(D w
ti w *c (Do, 0 o r I

The formation of ash takes place in the furnace of the
boilers which produce the steam used in generating
electricity. During the burning process, the organic
component of coal is burned off quickly, whereas the
incombustible material undergoes partial melting and tends to
fuse together to form ash. A typical schematic of the ash-
handling configuration at a coal-burning power plant is shown
in Figure 3 [ 2 5 ] . The ash is collected in several areas, and
the physical and chemical characteristics of the ash vary.
Bottom ash is the slag that is deposited on the heat-
absorbing surfaces of the furnace and that subsequently falls
into the furnace bottom. Ash hoppers or conveyers are under
the furnace bottom to collect bottom ash which can be in
either a solid or molten state.
Hoppers under the rear convection pass and air heaters of
the boiler are called economizer and air-heater hoppers. It
is here that smaller quantities of coarser ash drop from the
gas stream with direction changes in the gas flow.
Fly ash is the fine-grained residue that is collected by
ash precipitators and baghouses from the stream of combustion
gases prior to its discharge into the atmosphere.
Collection of Ash
The type of bottom ash produced at a particular power
plant is determined mainly by the design and operation of the
boiler units. Depending upon the boiler type, the ash


collected under the furnace bottom is categorized as Itdry
bottomM or "wet bottoml1 ash. If the ash is in a solid state
at the furnace bottom, it is called dry bottom ash. Wet
bottom ash refers to the molten state of the ash which leaves
the furnace as a liquid. Wet bottom ash ismore often called
boiler slag.
At present, there are three categories of coal burning
boilers which produce different types of bottog ash
[24,25,26]. These are:
(a) Pulverized coal-fired furnaces.
(b) Stoker-f ired furnaces.
(c) Cyclone furnzces.
Pulverized Coal-Fired Furnaces
Pulverized coal-fired units are most widely used in the
electrical utilities, especially for new power installations.
Solid fossil fuels, varying from anthracite to peat, are all
possible energy sources. The coal is pulverized (the
recommended fuel fineness varies from 70 percent passing a No.
200-mesh sieve (75 pm) for lignite coal to 90 percent for
bituminous coal), and then injected into the furnace where
combustion takes place. Ash can be removed from the bottom of
the furnace in a molten state and quenched in water (boiler
. slag) or in a solid granular form (bottom ash). If the ash is
removed in a solid, granular form, the boiler is called "dry-

bottomIt; and if the ash leaves the furnace in a molten state,
the boiler is referred to as a nwet-bottom" or "slag-tap"
boiler.
In a dry bottom boiler, the ash that is not fine enough
to go up the stack with the boiler gases in the form of fly
ash, solidifies and agglomerates into coarse particles. A
certain amount of molten slag which forms on the internal
surface 02 the' boiler also drops into the ash hopper.
Typically, 60 to 80 percent of the ash produced in a
pulverized dry bottom boiler leaves the furnace in the flue
gas stream of fly ash, and 20 to 40 percent of the ash falls
to the furnace bottom to form dry bottom ash. The ash hopper
is generally filled with water. When a sufficient amount of
bottom ash drops into the hopper, it is removed by means of
high pressure water jets, conveyed by a sluiceway to a coarse
crusher, and on to a storage area.
In a slag-tap furnace, as much as 50 percent of the ash
originally in the coal is retained in the furnace to form
boiler slag. The other 50 percent of total ash leaves the
furnace in the form of fly ash.
Cyclone Furnaces
Cyclone furnaces burn crushed coal that is 95 percent
finer than the No. 4 sieve. The primary furnace is a
relatively small horizontal cylinder, into which crushed fuel
and air are introduced tangentially at high velocity. Heat is

released at extremely high rates and gas temperatures
exceeding 1650°C (3000'F) are developed. These temperatures
are sufficiently high to melt the ash into a liquid slag,
which forms a layer on the walls of the cyclone. Molten slag,
in excess of the thin layer retained on the walls, continually
drains away and discharges to the boiler furnace, from which
it is tapped into a slag tank. Here, it is quenched and
breaks up into a granular form. Seventy to 85 percent of the
ash melts and is tapped from the furnace as boiler slag,
leaving 15 to 30 percent of the ash to be carried by the flue
gases as fly ash.
Stoker-Fired Furnaces
Stoker-fired boilers are practical only for power plant
generating less than 40 megawatts (MW) of electricity. Thus
many small and medium-size boilers are fired with mechanical
stokers. The stoker-fired units are designed mechanically to
feed the coal into the furnace, to provide the air for
combustion, and then to remove the unburned refuse.
Mechanical stokers can be classified in four groups, based on
the method of introducing fuel to the furnace:
(1) Spreader stokers.
(2) Underfeed stokers.
(3) Water-cooled vibrating-grate stokers.
(4) chain-grate or travelling-grate stokers.
The underfeed stoker is most suitable for use with coking
coals; the travelling or chain-grate stoker is used primarily
for those furnaces which burn anthracite or midwestern
bituminous coal; and spreader stokers are used with a variety
of coals.
In the fuel bed of a stoker, ash particles tend to become
fused together. In a properly operating stoker burning a
suitable coal, the passage of air and the agitation of the
fuel bed sente to keep the ash more or less porous, and the
ash is discharged to an ashpit in fairly large pieces.
Therefore, the bottom ash produced by stoker-fired units is
coarser than that produced by pulverized coal-fired units or
cyclone furnaces.
The total amount of ash produced depends less on the ash
content of the coal than on a number of factors relating to
the source of coal and design and operating characteristics of
the boiler. Underfeed stokers and travelling grate stokers
will produce 10 to 20 percent fly ash with the remainder of
the ash being collected as bottom ash. Fifteen to 55 percent
of the total ash produced by spreader stokers is fly ash and,
accordingly, 85 to 45 percent of the ash is produced as bottom
ash.
Table 2 gives a typical distribution of coal ash over the
various collection ports at a widely uked pulverized dry-
bottom boiler [27]. Because power plant ashes are generally
considered as waste materials, the ash handling systems are

designed only to facilitate disposal and not to save ash
quality. Although fly ash and bottom ash or boiler slag are
collected separately, at many power plants these materials may
be combined prior to or during waste disposal.
Dis~osal of Ash
Because the production rate at a given plant would be
less than the rate at which the ash is used in a typical
highway construction operation, stockpiling of the ash would
be necessary. For'example, an entire year's ash production at
a plant may be used in a very short construction period.
Again, the current stockpiling operations are not designed to
maintain the quality of the ash, but to facilitate handling
and disposal. Often, the primary purpose of the stockpiling
is only to dispose of the ash.
Table 2. Quantities of coal ash collected at various locationsa
Ash type percent
Bottom ash 20 Fly ash Economizer 3 Air heater 2 Precipitator 75
Total 100
a Source: Baker [27]

The disposal of ash is accomplished either by a dry or a
wet method [28,29]. Dry disposal implies transport and
deposition of dry or moist ash. This may involve temporary
storage of the ash in silos, subsequent hauling by trucks, and
compacting at a disposal site. Most power stations in urban
area handle their ash by the dry method, due to difficulties
in land acquisition and environmental restrictions. Figure 4
illustrates a typical dry disposal system.
An alternative method of ash disposal is to add
sufficient amount of water to produce a slurry and enable
transport of the ash by pipeline to settling ponds or lagoons.
The advantages of wet disposal are that ash ponds minimize
dust problems and are simple to operate. On the other hand,
ponding may produce undesirable segregation; however, this may
also be used advantageously if it is used to settle out
excessive fines [3 01 . According to information reported in 1981 by utility
companies to the U. S. Department of Energy, at least $370
million is expended annually by coal-burning utilities in the
operation and maintenance of ash disposal areas [7]. On a
national scale, ash disposal costs range from $5 to $10 per
ton and the total cost of ash disposal to the electric
utilities in 1980 ranged from $375 to $740 million [31].

yse 30 ~ e s o d s ~ p LIa * p a ~ n . 6 ~ ~

Production and Utilization
The production of ash in the United States has stsadily
increased along with the increase in coal-fired generating
capacity. Figure 5 shows a compilation by year of ash
production by electric utilities in the U. S., based on data
from the American Coal Ash Association (ACAA) [I]. Annual ash
production has increased from 39.2 million tons in 1970 to
66.8 million tons in 1986 [I]. The use of high-ash content
western coals and a switch to coal from other energy sources
could further increase this figure (32,331.
Of the 17.5 million tons of bottom ash and boiler slag
produced in 1986, 13.4 and 4.1 million tons were dry bottom
ash and boiler slag, respectively. Only 26.7 percent of the
dry bottom ash was used, whereas 51.9 percent of the boiler
slag was used (341. Figure 6 illustrates the trends in ash
utilization in the 1980s expressed as a percentage of the
amount of ash used (351. An examination of the statistics
indicates that the percent of bottom ash and boiler slag uses
have remained unchanged in the 1980s, while the use of fly ash
has improved significantly. These statistics also indicate
that a substantial volume of ash must currently be placed in
disposal areas each year. There is no reliable estimate of
the quantity of ash that has been accumulated over the years
in storage.
According to the reports prepared by the coal-burning
utility companies and submitted to the Federal Energy

Million tons


Regulatory Commission on Form 67 in 1981, annual ash
production in Indiana was 3.5 million tons, which made Indiana
the fifth largest ash production state in the U. S.
Approximately 2.4 million tons of fly ash and 1.1 million tons
of bottom ash (dry bottom ash and boiler slag) were produced.
Due to changes in the FERC Form 67, the state by state ash
production figures are not available for later years.
Figure 7 shows the coal consumption by electric utilities
in Indiana :22]. Because the coal consumption by electric
utilities in Indiana shows an increasing trend, it is expected
that ash production will increase accordingly. If the ash
content of the coal presently burned in Indiana remains the
same as in 1981, an estimate of current ash production can be
made using the proportion of ash to coal. This results in an
estimated ash production of 4.1 million tons which consists of
2.8 million tons of fly ash and 1.3 million tons of bottom ash
in Indiana.
Table 3 gives data compiled by the ACAA on the end uses
of power plant ash during 1982 [l]. A total of 8 ash
utilization categories are included in this table. Boiler
slag is widely used for applications such as blasting grit,
roof granules, and snow and ice control. Bottom ash is used
mainly as fill material, antiskid and ice-control material,
and road base material.

Million tons

Table 3. End use profile for power plant ash in 1982' (mil lions of tons)
End Use
Fly Ash Bottom Ash Boiler Slaq Quantity Percent Quantity Percent Quantity Percent Used of Use Used of Use Used of Use
Cement and Concrete Products 2.7 Structural Fills, Embankments 2.1 Road Base 0.3 Filler in Asphalt Mixes 0.1 Snow ,and Ice Control - Blasting Grit, Roofing Granules 0.1 Grouting 0.3 Miscellaneous 2.4
Total Utilized Total Produced Percent Utilized
' From National Coal Ash Association [35]

Pro~erties of Bottom Ash
Published data on the physical, chemical, and engineering
characteristics of bottom ash are somewhat limited. A major
portion of the information available on bottom ash
characteristics has been generated through research conducted
on West Virginia bottom ashes. However, not all bottom ash is
the same, because of the basic variations in: a) the type and
origin of coal burned, b) boiler types, c) degree of coal
pulverization, d) firing conditions in the furnace, and e) ash
handling practices.
The information on bottom ash characteristics has been
reported in the literature by Seals,et. al. [3], Moulton, et.
al. [36], Moulton [37], Anderson, et. al. [33], Usmen [38],
and Majidzadeh, et. al. [4]. It has been emphasized by most
of these authors that bottom ash has quite variable physical,
chemical, and engineering characteristics. These
characteristics of bottom ash can vary not only from one plant
to another, but also from day to day production within a
single plant over time. ' Therefore, the values for various
characteristics reported by researchers apply only to the ash
samples tested by those researchers and must not be taken as
absolutes.
Usually, the variation within the same plant is quite
predictable, provided that the coal source and plant
operations remain the same [39]. In other words, laboratory
and field data on characteristics of bottom ash from a given

source are valid as long as the plant's operating parameters
do not change. Bottom ashes obtained from different sources
must be tested separately and care must be taken to insure
that the samples are representative of the entire supply.
As mentioned earlier, there are two different types of
bottom ash: dry bottom ash and wet bottom boiler slag. In
this section, the two types of ash will be discussed
separately, since their characteristics are somewhat
different. Generally, wet bottom boiler slag tends to have
more uniform characteristics than dry bottom ash. This is
true in terms of both plant-to-plant variations and variations
within the same plant (331, because dry bottom ash is the
direct product of burning while boiler slag is solidified from
the molten slag.
Physical Characteristics
Due to the differences in the formation of the two types
of ash, bottom ash and boiler slag have distinctly different
physical appearances. Wet bottom ash is composed of hard and
angular to subangular particles with a shiny black color and
a smooth surface texture much like crushed glass. Some
coarser particles may be porous, if gases are trapped in the
slag as it is tapped from the furnace [30]. In addition, a
small portion of the particles are spherical or rod-shaped.

Most of the boiler slag particles feature fractured faces, as
a result of the rapid quenching as the molten slag flows from
the furnace bottom into the water-filled hopper. Boiler slag
produced from the burning of lignite and sub-bituminous coals
tends to be more vesicular than that of eastern bituminous
coals [40].
Dry bottom ash is gray to black in color, is quite
angular, and has a porous structure and rough surface texture.
Some of the particles resemble boiler slag, i.e., black and
glassy in appearance, especially in the smaller sizes. These
glassy particles represent the molten slag from the internal
surface of the boiler. The predominant material is gray in
color with an irregular shape.
Particle shape and surface texture will significantly
affect the frictional characteristics of material and, in
turn, the stability of earthworks [41]. Angularity
contributes to particle interlock, and a rough surface texture
inhibits movement of one particle on another. Therefore,
materials with greater angularity and rough surface texture
are preferred in highway bases and subbases [42 ] . In this
context, bottom ash compares favorably with conventional
highway materials.
Specific Gravity and Water Adsomtion
The specific gravity of bottom ash depends on the
chemical compositions of the ash as well as the porosity of

the ash particles. Obviously, those ashes with high iron
contents will have correspondingly higher specific gravities.
The specific gravities reported in the literature for dry
bottom ash range from 2.0 to 2.6 with an average of 2.35
[3,4,33,37,38]. A dense dry bottom ash may have a specific
gravity as high as 2.8, while a poor ash with high percentages
of porous and popcornlike particles may exhibit a specific
gravity as low as or even lower than 1.6, as emphasized by
Anderson, et. al. [33]. Therefore, it was suggested that the
specific gravity of bottom ash might be used as an indicator
of the material's quality, because higher specific gravity
generally indicate a denser ash that contains smaller
quantities of porous and popcornlike particles.
Due to its dense nature, wet bottom boiler slag tends to
have a higher specific gravity than dry bottom ash. The
specific gravities reported in the literature for boiler slag
vary from 2.6 to 2.9 with an average of about 2.75 [3,4,37].
Water adsorption data vary considerably depending on the
porosity and surface texture of the ash. Dry bottom ash
generally shows higher water adsorption values, ranging from
0.5 to 8 percent by weight, than those for boiler slag, due to
the porous surface texture of the material [3,4,37,38].
oiler slag, having a glassy texture, exhibits lower water
absorptivity varying from 0.4 to 3 percent [3,4,42].

Gradation
As described by many researchers [ 3/4/33 ] , bottom ash and
boiler slag have quite different gradation characteristics.
Generally, bottom ash is a well-graded material with a
gradation ranging from 1 inch (25.4 mm) to the No. 200 sieve
(75 pm) . The portion of bottom ash passing the No. 200 sieve, typically ranges from 0 to 10 percent by weight, is
essentially coarse fly ash, and is nonplastic. Figure 8 shows
the range of particle size distribution of 12 bottom ashes
found in the literature [3,4,37,38,43]. It should be noted
that it is not unusual to obtain bottom ash samples that have
quite different grain size distributions, especially if the
ashes have been stockpiled in ash ponds for some time.
In contrast to dry bottom ash, the grain size
distribution of boiler slag is quite uniform, with a majority
of the sizes falling within a narrow range between the No. 4
(4.75 mm) and the No. 30 (600 pm) sieves. Except for the
oversized material, boiler slag is generally lacking in the
coarser sizes. Figure 9 shows the range of the grain size
distribution of 9 boiler slags reported in several studies
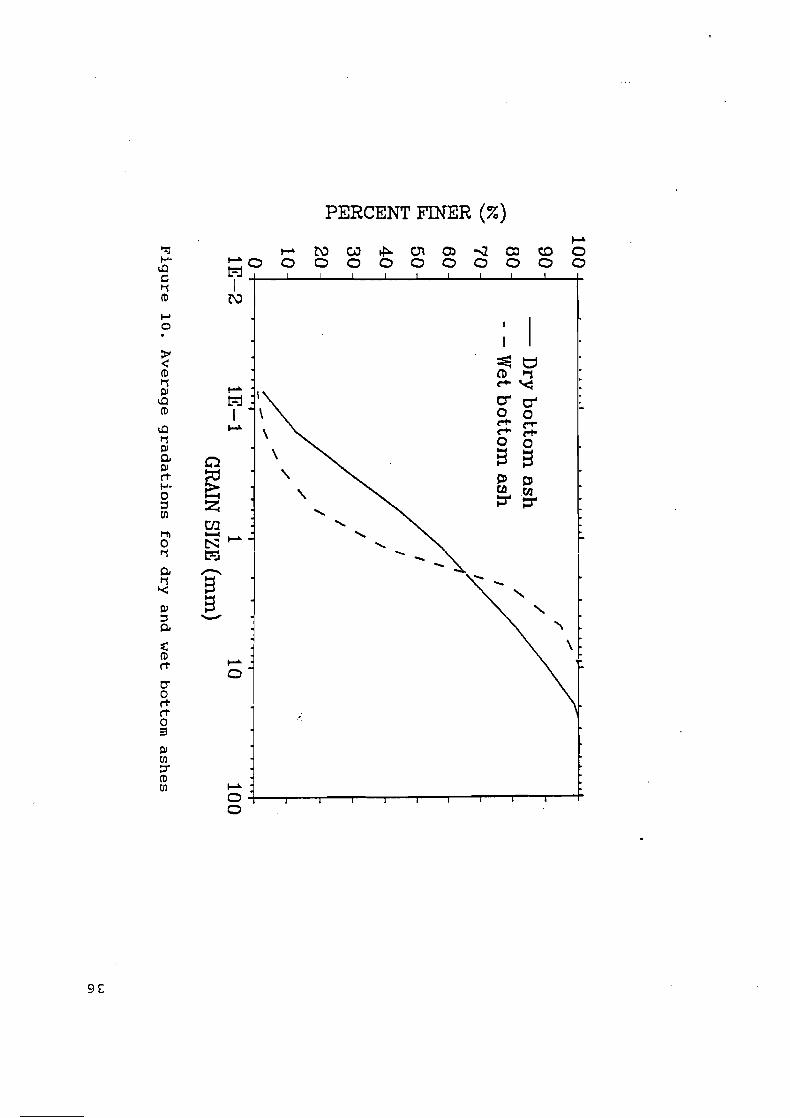
[3,4,38,44]. In ~igure 10, the average grain size
distributions of the 12 bottom ashes and 9 boiler slags are
compared. The differences between the gradation of the two
ash types are readily apparent.
The grain size distribution is normally expressed as
relative percentages of the total weight. For materials that

PERCENT FINER (%)

PERCENT FINER (%)
PERCENT FINER (%) Y

have variable specific gravities dependent on particle sizes,
the standard "percent finer by weight" plots may result in
misleading interpretation of the material's gradation [45].
Indeed, some coal ashes, especially ponded ashes that contain
both bottom and fly ashes, were found to have different
specific gravities in different size ranges [46]. In such
cases, it would be physically more meaningful to plot particle
sizes as a function of solid volume rather than weight,
because volume is generally the parameter of interest [46].
In other words, a grain size distribution based on "percent
finer by solid volumeu would provide a more realistic
indication of the gradation.
Due to its highly porous structure, bottom ash is likely
to have variable specific gravities dependent on particle
size. This is particularly true for bottom ashes that contain
large amount of lightweight particles. Unfortunately, the
specific gravities of bottom ash in different size ranges are
not available in the literature.
The grain size distribution has been considered as a key
factor in determining the behavior of base and subbase
materials, since it affects the stability, drainage, and frost
susceptibility of highway bases and subbases [47]. Experience
has shown that a wide variation of gradations may be
successfully used for highway bases and subbases depending on
. the type of base or subbase sought [47,48].

Generally, the gradation specifications for materials are
expressed in the form of gradation bands which consist of the
allowable ranges of weight percentages passing a series of
sieve sizes. Table 4 indicates the gradation and job-mix
requirements for aggregate material to be used for bases and
subbases for highways or airports, as given by the ASTM
Designation D 2940 [49]. The gradation requirements for
aggregate and soil-aggregate materia.1~ for use in subbases,
base and surface courses are given in AASHTO ~esi~nation M 147
[50] and ASTM Designation' D 1241 [51], and are presented in
Table 5. These gradation requirements are of national rather
than local character. Hence they should beregarded primarily
as guides rather than an absolute standard [52].
Table 4. Grading and job-mix requirements for aggregate bases and subbasesa
Sieve Size (Square Openings)
Over-all Job-Mix Percentages Tolerances Passing (Master Ranges) Bases Subbases
2 in. (50 mm) 100 1 1/2 in. (37.5 mm) 88 to 100 3/4 in. (19.0 mm) 60 to 100 3/8 in. (9.5 mm) 40 to 77 No. 4 (4.75 mm) 25 to 60 No. 30 (600 m) 7 to 24
. No. 200 (75 m) 0 to 10
a From ASTM Designation D 2940 [49]

T a b l e 5. Grading r e q u i r e m e n t s f o r a g g r e g a t e and s o i l - a g g r e g a t e m a t e r i a l s f o r s u b b a s e s , b a s e and s u r f a c e coursesa
Weight Percent Passing Square Mesh Sieves
Sieve S i z e TYPe I Type I1 (Square Openings)
Gradation Gradation Gradation Gradation Gradation Gradat ion
2 i n . (50 mm) 100 100 . . . . . . 1 i n . (25.0 mm) ... ' 75 t o 95 100 100 3/4 i n . (9.5 mm) 30 t o 65 40 t o 75 50 t o 85 60 t o 100 No. 4 (4.75 mm) 25 t o 55 30 t o 60 35 t o 65 50 t o 85 No. 10 (2.00 mm) 15 t o 40 20 t o 45 25 t o 50 40 t o 70 No. 40 (425 pm) 8 t o 20 15 t o 30 15 t o 30 2 5 t o 45" No. 200 (75 pm) 2 t o 8 5 t o 20 5 t o 15 5 t o 20
(5 t o 151b (8 t o 151b
" AASIiTO Designation M 147 [SO] and ASTM Desicjnation D 1241 (except a s noted) Figures i n parentheses i n d i c a t e percent passing No. 200 s i e v e according t o ASTM D 1241.

Figure 11 and 12 show two gradations in the U S H T O
Designation M 147 reproduced in the form of gradation bands,
along with the average gradation curves for dry bottom ash and
boiler slag. Comparing the average gradations of dry bottom
ash and boiler slag to the AASHTO specifications, it is found
that most dry bottom ashes would meet some of the gradation
requirements; boiler slag, however, seems to be so uniform
that it needs to be blended with other botton ashes or fly
ashes to meet the gradation requirements for base and subbase
materials.
Each of the state highway departments also has standard
s~ecifications for base and subbase materials. The lccal
experience and availability of materials are important factors
in the determination of these specifications. Table 6
presents the gradation requirements specified by the Indiana
Department of Transportation (INDOT) for base and subbase
materials [53]. In general, the INDOT specifications are very
similar to those of AASHTO M-147, except that the INDOT
specifications allow fewer fines (minus No. 200 sieve) in the
materials.
Chemical Properties
Chemical Com~osition
The composition of ash materials is controlled primarily
by the source of the coal and not by the type of the furnace.

PERCENT FINER (%)

PERCENT FINER (%) Y

Table 6. Indiana grading requirements for base and subbase materialsa
Total Percent Passing Sieves Having Square Openings
Approximate Permissible 2-1/211 2It 1-1/2" 1" 3/4" 1/211 No.4 No.8 No.30 #200b Top Size
2 inch 100 95-100 75-98 60-90 50-85 40-80 1-1/2 inch 100 95-100 75-98 60-90 45-85 1 inch 100 90-100 75-98 60-90 1/2 inch 100 --- --- 90-100 No. 4 100 No. 30 100
a Source: Indiana Department of Highways [53] In addition to other requirements, the amount passing exceed 2/3 the amount passing the No. 30 sieve.
the No. 200 sieve shall not

The Bureau of Mines has investigated the occurrence of mineral
matter in coal which forms the common constituents of coal ash
[54,55] . Ten major constituents were determined from more
than 600 ash samples from commercial coals which are
representative of coal produced throughout the United States.
The main constituents are silica (Si02), ferric oxide (Fe203) ,
and alumina (Alto3). Smaller quantities of calcium oxide
(CaO) , potassium oxide (qO), sodium oxide (Na20), magnesium
oxide (MgO) , titanium oxide (Ti02) , phosphorous pentoxide
(P205), and sulfur trioxide (SO3) are also present in coal ash.
Althoughthese constituents are reported as oxides, they occur
in ash as a mixture of silicate, oxides, and sulfates with
small quantities of phosphates and other compounds (551.
The chemical composition of over 600 coal ashes is
. compiled in Table 7 along with.results obtained from West
Virginia and Kentucky bottom ashes. The average analysis of
coal ash for the three main constituents SiO,, A1203, and Fe203
is 45.7, 26.0, and 18.1 percent, respectively. In other
words, these three constituents make up almost 90 percent of
the ash from bituminous coals. Lignite and some subbituminous
coal ashes have relatively high percentages of CaO and MgO
and, correspondingly, have larger amounts of sulfur in the ash
as SO3 [55].
The loss on ignition serves as an indication of the
. unburned carbon content in the ash. This is dependent upon
the efficiency of the particular boiler unit and the fineness

to which the coal is pulverized. Old boilers, stokers, etc.,
tend to produce higher carbon ash than the new, more efficient
units [56]. From an engineering point of view, unburned
carbon is considered a contaminant in the ash.
Trace Elements
Almost any trace element which is present in the earth's
crust may be present in coal. Therefore, a large number of
trace elements can be present in coal ash depending on the
source of the coal. The trace elements commonly found in coal
Table 7. Chemical analysis of ash
Percent by weight
Constituents 686 coal W. Virginia Kentucky ashesa bottom ashb bottom ashC
S i02 20-60
A1203 10-35 Fe203 5-35 CaO 1-20 MgO 0.3-4 Na20 0-2
%O 0.1-3 T102 0.5-2
P2°s 0.5-3 so3 0.1-12
a From Selvig and Gibson [54] and Abernethy, et al. [55] From Seals, et al. [3 ]
C From Rose, et al. [44]

ash are: antimony, arsenic, barium, beryllium, boron, cadmium,
cesium, cobalt, chromium, copper, fluorine, germanium, lead,
magnesium, manganese, mercury, molybdenum, nickel, selenium,
sodium, tin, titanium, vanadium, and zinc. Table 8 presents
data on the average trace element contents of ash from U.S.
coals of various ranks [ 5 7 ] .
Mineralosv
The mineralogy of a coal ash is important to its
utilization or disposal. Ash reactivity during utilization
results in interaction between the crystalline and glassy
phases that make up the ash and the matrix into which it is
placed. The crystalline and glassy phases and their behavior
must be known in order to go beyond simple empirical testing
as the basis of product design. For disposal, it is 'the
mineralogy of the ash, and its water-reacted products, that
controls the release rate of the potentially harmful trace
elements [58,59].
The mineralogical analysis of coal ash reveals that the
major chemical constituents are present in either a
crystalline form or as a glass. Mineralogical examination
shows that the silica is present partly in the crystalline
forms of quartz (SiO,) and in association with the alumina as
mullite (2Si02. 3A1203), the rest being present mostly in the
glassy phase. The iron appears partly as the oxides magnetite
(Fez03) and hematite (Fe,O,); the remainder is in the glassy

Table 8. Average trace-element contents of the ash from U.S. coals of various ranka (ppm)
Medium High Lignite Low Volatile Volatile Volatile and Sub-
Element Anthracite Bituminous Bituminous Bituminous bituminous
Silver Boron Barium Beryl1 ium Cobalt Chromium Copper Gallium Geranium Lanthanum Manganese Nickel Lead Scandium Tin Strontium Vanadium Yttrium Ytterbium Zinc Zirconium
a Source: Los Alamos Scientific Laboratory [57]

phase. Actually, the greater proportion of coal ash is glass.
Typical glass contents of fly ash range from 66 to 88 percent
[60,61].
Engineering Characteristics of Bottom Ash
Soundness
The soundness of aggregates is considered a measure of
the material's resistance to disintegration caused by
weathering actions such as alternate freezing and thawing,
wetting and drying, heating and cooling, and action of
aggressive waters [62]. Most specifications for materials
include a provision for soundness which is designed to ensure
the selection of material that is durable in freezing and
thawing.
The most widely used method for determining the soundness
of materials is the sodium or magnesium sulfate soundness
test, which is described in ASTM Designation C 88 [ll].
Unfortunately, the test method often appears to be unreliable
for distinguishing sound aggregate from that which is unsound
[41]. It has been suggested that the sulfate test may be used
for acceptance of material but that rejection should be based
on other determinations such as freezing and thawing tests
[64]. A low loss in sulfate soundness test is usually, but
not always, evidence of good durability, while a high loss

places the material in a questionable category until
performance data become available [62].
Sulfate soundness data on wet bottom ash may vary between
0.5 and 20 percent, typical values are less than 6 percent
[3,4,371 A significant difference between the sulfate
soundness losses of the coarse (plus No. 4 sieve) and fine
(minus No. 4 sieve) fractions of wet bottom boiler slag was
observed by Usmen et. al. 1651 and Majidzadeh et. a1 [4]. An
explanation of this phenomenon is the build-up of high thermal
stresses in wet bottom ashes during the quenching and
solidification processes which may result in the formation of
internal fracture planes [4,33]. This may yield, in turn, an
anomalously high soundness loss due to the effects of thermal
cycling and energy release, rather than to the expansive
forces of the sodium or magnesium sulfate [33]. On the other
hand, the finer fraction of boiler slag, having been fractured
to smaller sizes, shows lower soundness loss because of the
relief of the residual stresses.
The soundness loss for dry bottom ash, ranging from 2 to
30 percent, tends to be higher than for wet bottom ash. It
was reported that many of the pores in dry bottom ash are so
large that the sulfate solution readily drains from the ash
particles before it can crystalize to form expansive forces
during drying [33,38]. Consequently, the test does not
' discriminate for bottom ash quality. Therefore, the sulfate

soundness test, while often criticized, is especially
criticized for its applicability to dry bottom ash.
In spite of the continuing belief that the sodium or
magnesium sulfate soundness test is not precise, the test is
generally required to evaluate conventional aggregates. Table
9 summarizes typical specification limits of percent sulfate
soundness loss after 5 cycles. On the basis of these limits,
most bottom ashes (dry and wet) would meet the specifications
for.all types of uses.
Los Anaeles Abrasion
The qualities of a material known as hardness and
toughness have been regarded as two desirable properties of
aggregate. According to Shelburn [ 6 6 ] , hardness is made up by abrasion resistance, and toughness is the ability of a
material to resist fracture under impact. Unfortunately,
there is no truly satisfactory test for measuring the hardness
and toughness of a material. The Los Angeles abrasion test is
by far the most commonly used test that is related to the
hardness and toughness of aggregates.
The percentage of "wearw obtained from the Los Angeles
abrasion test is considered as an indicator of the resistance
of a material to breakdown under processing and handling,
construction rolling, and service traffic [ 4 7 ] . Aggregate
breakdown may take place from concentrated loads at points of
contact between aggregate particles and by abrasive action

Table 9. Typical specifications for sodium sulfate soundness test
Source of Use of Material Maximum Specification loss ( % )
ASTM C 33 concrete aggregates 10 (15)
ASTM D 1073 ' fine aggregates for bituminous 15 (20) AASHTO M 29 paving mixture
ASTM D 692 coarse aggregates for bituminous 12 (18) AASHTO M 283 paving mixture
ASTM D 693 crushed stone, crushed slag, and 20 crushed gravel for pavements
AASHTO M 6 fine aggregates for portland 10 cement concrete
AASHTO M 80 coarse aggregates for portland 12 (18) cement concrete
AASHTO M 45 fine aggregate for masonry 10 (15) mortar
Indiana DOT aggregate for all variety of 12-20 uses
a Numbers in parenthesis represent maximum losses by use of magnesium sulfate

between t h e ind iv idua l p i e c e s moving with r e s p e c t t o one
another [64] .
Wear o r l o s s i n t h e Los Angeles ab ras ion t e s t is t h e
r e s u l t of impact and s u r f a c e ab ras ion i n t h e drum. Impact is
l i k e l y t o cause more l o s s , e s p e c i a l l y du t ing t h e e a r l y s t a g e
of t h e test where e s s e n t i a l l y no f i n e s have been produced t o
cushion t h e impact fo rces . To some e x t e n t , ha rde r minera l s
tend t o f r a c t u r e more than s o f t e r ; m i n e r a l s because s o f t
minera ls a r e b e t t e r i n absorbing t h e impact f o r c e s . On t h e
o t h e r hand, s o f t e r minera ls a r e expected t o be more
s u s c e p t i b l e t o t h e wearing of t h e p a r t i c l e s u r f a c e s . I n t h i s
case , t h e r e s u l t of t h e degradat ion a c t i o n i n t h e drum w i l l be
more of a powdery d u s t r a t h e r than t h e l a r g e r angu la r p i e c e s
r e s u l t i n g from t h e f r a c t u r i n g of hard p a r t i c l e s [65] .
Values f o r percentage of wear by Los Angeles ab ras ion
test f o r d r y bottom ash v a r i e s from 27 t o 53 pe rcen t .
Exceptional va lues a s high a s 78 pe rcen t were obta ined from
bottom ash conta in ing degradable popcorn t y p e p a r t i c l e s
[4,67] . Los Angeles abras ion d a t a f o r wet bottom ash range
from 2 4 t o 47 pe rcen t , which a r e comparable t o t h o s e of d r y
bottom ash.
V'isual inspec t ion of t h e f i n e s produced by t h e Los
Angeles ab ras ion t e s t from bottom ash (d ry and wet) r e v e a l s
t h a t t h e f i n e s a r e in te rmedia te i n s i z e and appear a s smal l
broken p i e c e s of t h e l a r g e r p a r t i c l e s , with sha rp edges and
Porous s u r f a c e s [65]. This sugges t s t h a t t h e mechanism of

degradation for bottom ash is primarily a fracturing process
rather than the surface wearing of the particles.
The applicability of the Los Angeles abrasion test to
bottom ash has also been questioned on the grounds that the
test is performed only on the coarse fraction of the ash
material, which is not representative of the total sample
[4,65]. As mentioned earlier, the coarse and fine fractions
of bottom ash have different degrees of vesicularity, and the
degree of vesicularity has an important bearing on the
toughness of the material. Generally, the coarser fraction of
bottom ash is more porous than the finer fraction, and
subsequently has a higher abrasion potential in the Los
Angeles test. Therefore, results obtained from abrasion on
coarse aggregate. only may not be representative of the
abrasion potential of the total sample.
It should also be noted that the Los Angeles abrasion
test was designed for four gradation limits, on the assumption
that the gradation of the material being tested would fall
within these limits. With materials like many bottom ashes,
having predominantly fines (minus No. 8 sieve), only a small
amount of the sample may fall within the gradation limit and
be used for the test. Since different ashes have different
gradations, the percentages of samples tested by the method
varies from one ash to another, making the comparison of test
' results very difficult [4].

Table 10 shows a collection of specification limits on
Los Angeles abrasion test. Generally, the percent wear values
for dry bottom ash and boiler slag would seem to satisfy most
specifications. However, in some cases, bottom ash would be
considered close to the border-line between an acceptable and
unacceptable material for surface courses and bituminous
paving mixtures.
Deleterious Materials
It is generally recognized'that the presence of certain
substances in aggregates is undesirable, and these substances
are considered deleterious. Most of the literature dealing
with deleterious materials has focused the effects of
deleterious particles on the durability of portland cement
concrete. Very little discussion on deleterious materials
appears in the literature with regard to aggregates used in
subbases and bases.
A wide variety of materials may be regarded as
deleterious depending on the use of aggregate. In dealing
with aggregates for bases and subbases, deleterious materials
can be classified in four groups according to their
composition or physical properties.
1. Material finer than 75-pm sieve are determined by the
wash test described in ASTM C 117 [68 ] or AASHTO T 11 [69] . Excessive fines in an aggregate increase the mixing water
requirement of portland cement concrete and subsequently

Table 1 0 . Typical s p e c i f i c a t i o n s f o r Los Angeles abras ion t e s t
Source of Use of Material S p e c i f i c a t i o n
Max. Wear ( % I
ASTM D 1 2 4 1
ASTM C 33
ASTM D 692 AASHTO M 283
ASTM D 693
AASHTO M 80
AASHTO M 147
Indiana DOTa
soi l -aggregate subbase, base, and su r face course
concre te aggregates
coarse aggregates f o r bituminous paving mixture
crushed s tone , crushed s l a g , & crushed gravel f o r pavements
coarse aggregates f o r por t l and cement concre te
aggregate base and subbase
aggregate f o r a l l v a r i e t y of uses
surface:40 base: 50
surface:40 base: 50
-
a 1988 S p e c i f i c a t i o n [ 5 3 ]

result in low strength of the hardened concrete [70]. The
material finer than the No. 200 sieve is especially important
in evaluating base course aggregates for the determination of
potential susceptibility to frost action [71].
2. Clay lumps are lumps of clay and silt in the aggregate
which remain cohesive during processing. These lumps survive
the processing of a concrete mix but may breakdown from
freezing and thawing [71]. Base course aggregates containing
clay lumps which degrade during handling and construction may
increase the amount of deleterious plastic fines in the
aggregate.
3. Friable particles are characterized by a poor bond
between the grains, hence they break down easily into many
smaller pieces. Large quantities of friable particles in the
aggregate cause a reduction in concrete strength, and small
quantities downgrade the abrasion resistance of concrete
significantly [41]. Friable particles in base course
aggregates are subjectedto degradation under construction and
traffic.
4. Lightweight particles are highly porous particles
which float on a liquid with a high density, typically 2.0.
These particles are considered unsound and lacking frost
resistance because they are easily saturated with water [41].
Published data on the deleterious materials in bottom ash
. are relatively limited. Usmen [38 ] investigated the
deleterious materials in two dry bottom ashes and one boiler

slag and found that dry bottom ash and boiler slag have high
percentages of lightweight particles but are free of clay
lumps. The amount of friable particles in bottom ash varies.
An examination of the lightweight particles floated on
the heavy liquid reveals that the majority of the lightweight
bottom ash particles are highly vesicular [38]. Vesicularity
of the particles is judged to be the major factor affecting
the lightweight particle content of bottom ash. On the other
hand, the amount of popcornlike particles, i.e. poorly
agglomerated particles, present in the ash materials
determines the percentage of friable particles.
Current specifications for deleterious materials cover a
wide variety of deleterious substances and the requirements
vary depending on the use of aggregate. For example, ASTM
Designation D 692 [72], the Standard Specification for
Concrete Aggregates, include rigid quantitative requirements
on various deleterious materials. But in the specification
for base and subbase materials, no quantitative restrictions
on deleterious materials are stipulated. Actually, the
deleterious materials are covered in the general requirements
section with a qualitative statement which reads ". . . shall consist of hard, durable particles ..., materials that break when alternately frozen and thawed or wetted and dried shall
not be used". This recognizes that small amounts of
deleterious materials are not as harmful to bases and subbases
as they are to portland cement concrete.

Ansle of Shearina Resistance
The strength parameter of granular soil is the angle of
internal friction or, preferably, angle of shearing
resistance. It has an important bearing on analyzing the
stability of slopes and embankments; it significantly
influences the bearing capacity of a foundation; and governs
the lateral pressure a backfill exerts against a retaining
structure. The angle of shearing resistance also affects the
magnitude of the earth load on underground structures such as
culverts and sewers. Besides, it indirectly affects other
characteristics of a material, such as modulus of subgrade
reaction [71] . The grain strength of a cohesionless soil is usually
sufficient that the grains themselves do not fail until
extremely high stresses are reached. Therefore, failure of
such a soil requires that the grains slide over one another.
In this case, the angle of shearing resistance is analogous to
the angle of sliding friction between two sliding blocks.
However, in addition to the mineral-to-mineral frictional
resistance, the interlocking of the soil grains contributes
significantly to the shear resistance of cohesionless soils
[ 7 3 1
In general, the factors that influence the angle of
shearing resistance of a soil are numerous and can be divided
into two groups. The first group includes those factors that
affect the angle of shearing resistance of a given soil.

These are: void ratio or relative density of the soil, the
confining stress, the type of test used in the determination
of the angle, criterion for failure, and the rate of load
application. The second group consists of those factors that
cause the angle of shearing resistance to differ from sand to
sand. These are: grain size distribution, and the size,
shape, and surface texture of the particles making up the
soil. Among all of these factors, vdid ratio is perhaps the
most important single parameter that affects the angle of
shearing resistance.
A greater angle of shearing resistance can be obtained in
well-graded materials than in uniformly graded materials
because higher density can be achieved in the well-graded
material. Angular particles can be fitted together in a very
dense condition which results in a high degree of
interlocking, whereas rounded or spherical particles cannot be
so fitted. Particle size affects the shearing resistance by
influencing the amount of shearing displacement required to
overcome interlocking and to bring the grains to a free-
sliding position ( 7 4 1 . For a coarse material, the amount of
movement required for this purpose is, of course, greater than
that for a finer material.
Table 11 gives typical values of the angle of shearing
resistance for granular soils [75]. As discussed above, the
angle of shearing resistance increases with relative density
or degree of compaction, angularity of grains, and grain size.

Table 11. Approximate va lues of $I f o r g r a n u l a r s o i l s a s a f f e c t e d by s t a t e of compaction, s i z e , g r ada t ion , and a n g u l a r i t y o f g r a i n s a
Values of $I, deg
S i z e of g r a i n s
Rounded g r a i n s , S t a t e o f u n i f o m Angular g r a i n s ,
compaction g r a d a t i o n w e l l graded
Medium sand Very l o o s e 28-30 Moderately dense 32-34 Very dense 35-38
Sand and g r a v e l 65% G-35% S Loose --- - - 3 9 65% G-35% S Moderately dense 3 7 41 80% G-20% S Dense ----- 4 5 80% G-20% S Loose 3 4
Blas t ed r o c k fragments -- - - -
a From Leonards [75]

Also, the angle of shearing resistance is larger for well-
graded than for uniformly graded granular soils.
Data appearing in the literature on the angle of shearing
resistance for bottom ash were measured by means of the direct
shear test [3,4]. Friction angles obtained from dry bottom
ashes in loose conditions vary from 32 to 44 degrees. Data
reported on boiler slag ranges from 37 to 46 degrees, which
are slightly higher than those for dry bottom ash. Comparing
these values with those derived from natural granular
materials, it is found that bottom ashes have friction angles
that are comparable to well-graded angular sands, and are
higher than Ottawa sand and other similar uniform, rounded
sands.
permeability
Permeability of soils is dependent upon the nature of the
pore system, including number, size, continuity, and
tortuosity, within the soil. Since it is very difficult to
measure the pore system, a common practice is to relate
permeability of granular soils to particle size, gradation,
and relative density. In the drainage design for highway
embankments, bases, and subbases, permeability is of
considerable importance.
The coefficient of permeability for soils ranges from
1x10-~ cm/sec to 1x10' cm/sec. There is no other engineering
Property of construction materials that has so wide a range.

Because of such large variation, the numerical value of
permeability for a soil is considered only as an order of
magnitude. Table 12 lists the coefficient of permeability for
various types of soils [ 7 4 ] . Table 13 gives a classification
of soil on the basis of permeability, as suggested by Terzaghi
and Peck [ 7 6 ] .
Logic and experimental data suggest that the finer
particles in a soil have the most influence on permeability.
Hazen [ 7 7 ] established an empirical equation correlating the
coefficient of permeability to the effective grain size, Dl0.
This correlation assumes that there is a consistent
relationship between Dl, and the pore size of clean granular
materials. For clean sands (less that 5 percent passing the
No. 200 sieve) with D,, size between 0 . 1 and 3.0 mm, the
coefficient of permeability k is
where the units of k are in cm/sec, and Dl, in mm. The
constant C ranges from 0.4 to 1 .2 with an average of 1.0 .
Relatively limited data are available on the coefficient
of permeability of dry bottom ash and boiler slag. Seals et.
al. [ 3 ] measured the coefficients of permeability for six
bottom ashes and found them to vary from 5 . 0 x l 0 - ~ cm/sec to
9.4x10-' cm/sec, which falls in a medium permeability range.
. These values are also comparable to the corresponding values
for sand. The values of Hazen's C for bottom ashes vary from

o o o w o o w 0
I-'. 0 I- (D =I rr "'m

Table 13. Classification of soils according to their coefficient of permeabilitya
Degree of permeability Value of h (cm/sec)
High over 10" Medium lo-' to Low to Very low to Practically impermeable less than
a From Terzaghi and Peck [76]
0.1 to 2.8 with an average of 1.2. Considering the wide range
of &, the Hazen1s formula is valuable in estimating the k
value for bottom ashes, at least within an order of magnitude.
When testing is not practicable, the Hazen's formula can be
used for bottom ash to obtain an approximate coefficient of
permeability.
Compaction characteristics
Compaction is the densification of soil and soil-
aggregate mixture by the application of mechanical energy.
The objective of the compaction is twofold: to provide a
stable material and to provide a material whose properties are
predictable, at least within limits [47]. Investigation and
experience have shown that physical properties of a soil mass
are greatly affected by increases in unit weight or degree of
density brought about by compaction. There are several
advantages which occur through compaction: a) soil strength

increases and slope stability can be improved, b) detrimental
settlements can be-reduced, c) bearing capacity of structural
fills or pavement subgrades can be improved, and d)
undesirable volume changesmay be controlled (781.
The purpose of the compaction differs in different
structures. Thus the density requirements necessary to
satisfy the needs for the conditions involved may be
different. Table 14 lists the purpose of compaction in
different highway components [79]. It is important to
identify the purpose of compaction in the structure so that
the compaction specifications can be properly prescribed.
Table 14. Purpose of compaction in different highway componentsa
Highway component Purpose of compaction
Embankments to prevent detrimental settlement to aid improving stable slopes
Subgrade materials to provide bearing capacity to control volume change to provide uniformity
Bases and subbases to provide uniform high bearing capacity
a From Highway Research Board [79]

There are a number of factors which influence the density
obtained by compaction. Those of primary importance are: a)
the moisture content of the soil, b) the characteristics of
the soil, and c) the type and level of the compactive effort.
Other factors influencing density, but to a lesser extent,
are: a) the temperature of the soil and b) the amount of
manipulation given the soil during the compaction process
[791.
The compaction characteristics of soils are commonly
discussed in terms of their moisture-density relations. If a
soil is compacted with a given type and amount of compactive
effort at various moisture contents, a moisture-density curve
such as the one in Figure 13 is obtained. Such a curve
clearly indicates that the density obtainable for a given soil
and compactive effort is dependent on the moisture content at
time of compaction. As the water content increases from a low
level, soil particles develop larger and larger water films
around them, which tend to lubricate the particles and allow
them to slide, one particle against another, to produce a
denser packing [47,78]. However, a point is eventually
reached such that increases in water content result in
decreases in density. At this point, water starts to displace
soil particles and the density decreases. Thus, the curve
develops a more or less well-defined peak which indicates the
optimum moisture content at which a maximum dry density may
be obtained for each type of soil and compactive effort.

0'2 SZ OZ S 1 0 1 S I I I I I S 6
I I I
-
- - SOL
- - 011

If a second set of soil samples is compacted by a
different effort at various moisture contents, a similar
moisture-density curve will be produced but with a different
optimum moisture and maximum density. For any particular type
of soil, the greater the effort, the higher the maximum
density and the lower the optimum moisture content. Thus it
is obvious that both maximum density and optimum moisture
content must be related to compactive effort.
The compaction behavior described as above is typical of
cohesive soils for both field and laboratory compaction. The
curves will vary somewhat in the shapes and positions on the
density versus water content plot, but the response will be
similar to that shown in Figure 13. However, cohesionless
soils do not respond to variation in water content and
compactive effort in the manner characteristic of cohesive
soils.
Because cohesionless soils are relatively pervious even
when compacted, they are not affected significantly by their
water content during the compaction process. Figure 14 shows
the typical moisture-density curve for cohesionless soils
[ 8 0 ] . For a given compactive effort on cohesionless soils,
the dry density obtained is high when the soil is dry and high
when the soil is saturated, with somewhat lower densities
occurring when the soil has intermediate amounts of water.
This phenomenon is known as bulking [73,80,81]. Under these
circumstances, water acts like an antilubricant. At low water

Water contnt C
Figure 14. Typical moisture-density curve for cohesionless soils.(After Foster [80])

content some menisci begin to form in the partially saturated
soil. These menisci formed by capillary stresses cause an
apparent cohesion between particles [ 8 2 ] , thus increasing the
shear strength which, in turn, resists rearrangement of the
sand grains. Upon the addition of more water, the negative
pore water pressure and the antilubrication effect come in
balance. At water content larger than those at which
significant negative pore water pressure exists, the water
produces a lubrication effect on the soil particles and causes /
an increase in density. The limit of lubrication of the
particles is reached when the voids become filled with water
[83,84].
The influence of compactive effort on the moisture-
density relation is much less for cohesionless soils than for
cohesive soils. For example, according to data reported by
Highway Research Board [79], an increase in compactive effort
from standard Proctor effort (ASTM D.698) to modified Proctor
effort (ASTM D 1557) results in an increase in maximum density
of 12 pcf for clay and 2 pcf for sand. The corresponding
decreases in optimum moisture content are 6 percent and 1
percent for clay and sand, respectively.
Some materials have been observed to exhibit irregularly
shaped moisture-density compaction curves. Johnson and
Sallberg [85] indicated that relatively free draining
materials may show no consistent relationship between moisture
content and dry density or may show an increase in dry density

with increase in moisture content to a saturated condition
during compaction. Spenser et. al. [86] reported that very
irregular moisture-density curves were found in performing the
standard compaction test for open-graded or predominantly one-
sized materials. The materials either exhibited no distinct
optimum at any water content or yielded the highest dry
density at the maximum moisture content used. Lee and
Suedkamp [84] confirmed the existenc.e of irregularly shaped
compaction curves by testing 35 soil samples, and established
four types of compaction curves. In addition to the typical
single-peak compaction curve, their results indicated a l'/z-
peak curve, a double-peak curve, and a curve with no distinct
optimum water content or an oddly shaped curve. It was also
found that soils with a liquid limit greater than 70 or less
than 30 produced irregularly shaped compaction curves.
Available data on the compaction characteristics of dry
bottom ash and boiler slag obtained from different
investigators show wide variations in both the optimum
moisture content and maximum density. Seals et. al. [3] and
Usmen [38] presented data obtained from West Virginia bottom
ashes. The standard Proctor maximum densities for dry bottom
ash varied between 74 and 117 pcf; the optimum moisture
content ranged from 12 to 34 percent. For boiler slags, the
maximum densities were between 91 and 102 pcf, and the optimum
. moisture contents varied from 14 to 22 percent. Data reported
by Majidzadeh et. al. [4] indicated that the optimum moisture

contents for dry bottom ash range from 13 to 18 percent and
those for boiler slag vary between 6 and 8 percent, which are
considerably lower than those reported by Seals et. al.
Because of the complex pore structure of particles,
bottom ash may produce irregularly shaped compaction curves
[87]. Usmen [38] suggested a "pore saturation point" to
explain the erratic moisture-density relation observed on a
very vesicular bottom ash in the lower'moisture content range.
Majidzadeh et. al. [4] reported that the "optimum11 moisture
content of each ash actually occurred within a zone rather
than exhibiting a clear optimum value.
The compressibility of a fill or embankment determines
the magnitude of the vertical deformation at the surface of
the fill or embankment. Consider the case where granular
materials are one-dimensionally compressed; an example would
be the deformation caused by a fill covering a very large
area. Because of the high permeability of granular materials,
the deformations take place in a very short time.
Practically, the compression of sands and gravels occurs
during construction and most of the settlements have taken
place by the time the structure is completed. However, it
. should be noted that, for structures that are sensitive to
rapid settlements, small total settlements can be detrimental
if they occurs rapidly [78].

The deformation of g ranu la r s o i l s is caused by two
mechanism: d i s t o r t i o n and crushing of i n d i v i d u a l p a r t i c l e s ,
and r e l a t i v e motion between p a r t i c l e s a s t h e r e s u l t of s l i d i n g
o r r o l l i n g [73]. S l id ing between p a r t i c l e s occurs a t a l l
s t r e s s l e v e l s . Crushing and f r a c t u r i n g of p a r t i c l e s begins i n
a minor way a t very small s t r e s s e s , but becomes evident when
some c r i t i c a l s t r e s s is reached [88] . This c r i t i c a l s t r e s s is
dependent upon t h e p a r t i c l e s i z e , t h e a n g u l a r i t y of p a r t i c l e s ,
t h e s t r e n g t h of t h e ind iv idua l p a r t i c l e s , and t h e g rada t ion .
Previously published work on sand compression have been
reported by Roberts and DeSouza [88] , Schu l tze and Moussa
[89] , Hendron [90] , and Lee and Farhoomand [91] . The r e s u l t s
of each of t h e s e i n v e s t i g a t i o n s a r e q u a l i t a t i v e l y t h e same.
I n genera l , a uniformly graded s o i l compressed more than a
well-graded s o i l ; and an angular sand is more compressible
than a rounded sand. Roberts and DeSouza [88] observed t h a t ,
a t moderately low pressures , angular sands crushed and
compressed more than rounded sands; but a t very high p ressures
t h e compression behavior of angular and rounded s o i l is very
s imi la r . Lee and Farhoomand [91] t e s t e d d i f f e r e n t g ranu la r
s o i l s and found t h a t coarse s o i l s compressed more and showed
more p a r t i c l e crushing than f i n e s o i l s .
Sea l s e t . a l . [3] performed one-dimensional compression
t e s t s on West Virginia bottom ashes. I t was found t h a t , a t
, low s t r e s s l e v e l s , t h e compress ib i l i ty of bottom ash is

comparable to natural granular soils placed at the same
relative density.
Stabilization
Soil stabilization, in a broad sense, is the alteration
of any property of a soil to improve its engineering
performance. Engineering properties such as strength,
compressibility, permeability, volume change characteristics,
frost susceptibility, and durability may be improved by many
stabilization techniques, including mechanical, chemical,
electrical, or thermal treatments. In this section, only
mechanical and chemical stabilization will be discussed.
Mechanical Stabilization
Mechanical stabilization is the improvement of the soil
by changing the gradation. It is usually accomplished by
blending the existing soil with other suitable soil to obtain
a composite material which is superior to either of its
components.
,A stable soil texture is considered to be made up of two
components. The portion of the mixture that is coarser than
some arbitrary limit, such as a No. 40 sieve or a No. 200
sieve, is usually termed aggregate. Its principal functions
are to provide internal friction and incompressibility. The
best aggregates are those which are composed of hard, angular,

durable particles. The gradation of the aggregate is
important because well-graded materials can be more readily
compacted than poorly graded mixtures and generally have
greater stability after compaction [92]. The finer portion of
the mixture, often referred to as "binder", contributes
cohesion and imperviousness. Ideally, the binder soil should
have sufficient plasticity to develop high cohesion but not so
much that it tends to cause excessive volume change with
change in moisture constant [92,93].
The relative amounts of aggregate and binder determine
the physical properties of the compacted stabilized soil.
When small amounts of binder soil are added to an aggregate,
the strength is increased due to the increase in density. The
density is increased because the binder fills the voids
between aggregate particles. However, with excessive amount
of binder, the strength of the soil-aggregate mixture can be
markedly reduced [94]. In order to produce acceptable
stabilized mixtures with adequate strength and incompressi-
bility, the choice of a proper proportion of the aggregate to
binder is considered to be essential [92,93,95] . Based on
test results on the internal friction and cohesion of a series
of soil-aggregate mixes, Miller and Sowers [96] showed the
grain structure for different amounts of aggregate and binder,
as in Figure 15.
An aggregate that contains little or no fines is
illustrated in Figure 15a. It has high internal friction and

a. Compacted aggregare b. Aggregate with small alone with grain to grain amount of binder. Binder contact. highly compacted between
contact points of aggregate, and loosa in voids.
c. Aggregate with sufficient d. Aggregate floating in a binder to fill voids loosely. matrix of well-compacted
binder.
:.::< .... 5,. ;. .. - ..". .,,.P:: -'.,.. ..>
Loose binder Well-compacted Highly compacted binder binder
Figure 15. Grain structure of soil-aggregate mixtures. (From Miller and Sowers [961)

is relatively incompressible because the loads are carried by
grain-to-grain contact of bulky particles. Having no fines
present, it is quite permeable and non-frost susceptible.
However, this material is unstable and difficult to compact,
unless it is in a confined condition [47,48].
Figure 15b shows the grain structure of a mixture with
small amount of fines. Some of the binder is highly compacted
between the contact points of the aggregate but some of the
aggregates still make direct contact and the grain-to-grain
friction persists. Part of the voids are loosely filled with
binder while the remainder of the voids are still open. In
the meantime, the cohesion of the mixture begins to increase.
Figure 15c illustrates an aggregate with sufficient
binder to fill voids loosely. There is highly compacted
binder between the contact points of the aggregate and
partially compacted binder filling the voids. The optimum
amount is reached when the compacted binder fills the voids
without destroying all the grain-to-grain contact of bulky
particles. The result is an increase in cohesion, a slight
decrease in the angle of internal friction, slightly greater
compressibility, and lower permeability [93,96].
In Figure 15d the aggregate particles are surrounded by
compacted binder and the grain-to-grain contact is virtually
nonexistent; that is, the aggregate floats in the binder. In
this case, the strength of the mixture drops to that of the

binder alone [96] . In addition, the stability of this type of
mixture is greatly affected by adverse water conditions [ 4 8 ] .
It is apparent that the stability of a soil-aggregate
mixture is dependent on the size distribution of the
particles. Theoretically, for maximum stability, a soil-
aggregate mixture should have sufficient fines to just fill
the voids among aggregate particles, with the entire gradation
curve representing a very dense mixture resembling that of the
Fuller's maximum density curve [97]. Data published on the
strength characteristics of soil-aggregate mixtures showed
that the optimum fines (finer than the No. 200 sieve) content
ranged from 7 to 22 percent depending on the character of the
aggregate [94,96,98]. Important factors affecting the optimum
fines content include the gradation of aggregate, particle
shape, and size of the largest aggregate pieces.
In a study by Yoder and Woods [94,99] , various amounts of
binder soil were added to several granular materials to
determine the maximum compaction density and California
bearing ratio (CBR). It was found that both density and CBR
increased as the size of aggregate increased, but optimum soil
content decreased. It was also indicated that maximum CBR
resulted when the quantity of soil was about 0 to 3 percent
less than that the optimum required for maximum density.
Yoder and Witczak [48] later pointed out that the use of a
criterion of density as a measure of stability could be
misleading if the gradation is not known. Mixtures on the

I1rich" side of optimum soil content have considerably less
strength than those on the llleanll side of optimum soil
content. This is due to the fact that in rich mixes the
stability is provided primarily by the cohesive binder while
in lean mixtures it largely depends on grain-to-grain contact
of aggregate particles.
The working principles employed in mechanical
stabilization with reference to the gradation of the particles
and the cohesive properties of the binder soil are empirical.
Although a wide variation of gradations may be successfully
used for highway bases and subbases depending on the
prevailing conditions, knowledge on the subject has not
progressed to the point where a soil-aggregate mixture can be
designed on a rational basis. AASHTO Designation M 147 and
ASTM Designation D 1241, as reproduced in Table 5, cover the
gradation requirements for soil-aggregate mixtures for.use in
subbase, base, and surface courses. However, it was pointed
out by Miller and Sowers [96] that the gradation
specifications could result in both a very strong mixture and
a weak one. It appears that total reliance upon these rigid
specifications in all instances may not always be
satisfactory. Local practice and experience with the material
and experimental tests provide the best guide for proper
proportion of soil-aggregate mixtures [100,101].
Since bottom ash and fly ash are both by-products from
coal-burning power plants, it is logical to use fly ash as the

binder for mechanical stabilization of bottom ash. Often,
bottom ash is more finely graded than the coarse aggregate
generally specified for use in most soil-aggregate
compositions. As a result, a greater percentage of fines
(finer than No. 200 sieve) are needed to achieve the maximum
density. As previously discussed, optimum fines content for
conventional aggregates can normally be expected to range from
7 to 22 percent by weight of dry mix., In bottom ash-fly ash
mixes, optimum fines content could range from 25 to 40 percent
[21,36].
There have not been many applications of mechanically
stabilized bottom ash in highway bases and subbases. These
uses have been on private or municipal types of construction
projects [3,21,36].
In the construction of West Virginia Route 2 base course,
bottom ash from the American Electric Power Company's Mitchell
plant was blended with blast furnace slag in order to satisfy
the gradation requirements of the West Virginia Department of
Highways for class 1 crushed-aggregate base course [36].
Percentages of slag varying from 15 to 40 percent by weight
were used to construct the base course.
Also in West Virginia, several proportions of bottom ash-
fly ash mixtures were used as base course for the
reconstruction of the access roads to the Fort Martin Station
of Allegheny Power System [36]. Finally, a 60-40 bottom ash-
fly ash combination was proved to be satisfactory for the

construction. Field densities ranged from 96 to 106 percent
of standard Proctor maximum density were achieved at wet-of-
optimum moisture conditions. It should be pointed out that
the percentage of fly ash (fines) used in this project would
not satisfy those specified for base course materials. Thus,
considering the unique engineering properties of bottom ash,
strict adherence to standard specifications may not be
reasonable in all instances.
Admixture Stabilization
Admixture stabilization is the physical mixing and
blending of a stabilizing agent with a soil. A number of
stabilizing agents have been used in highway engineering. As
indicated by Yoder and Witczak [ 4 8 ] , the various types of
stabilizing agents can be categorized according to properties
imparted to the soil. Thus, the more important of these
admixtures can be classified in three categories: cementing
agents, modifiers, and waterproofing agents. Selection of
stabilizing agents is based on the type of soil and the
intended use of stabilized soil. In general, the use of
relatively large quantities of the agents is intended to
produce substantial increase in strength by bonding soil
particles together, whereas smaller quantities are used to
modify the plasticity and water-holding capacity of the soil
[38].
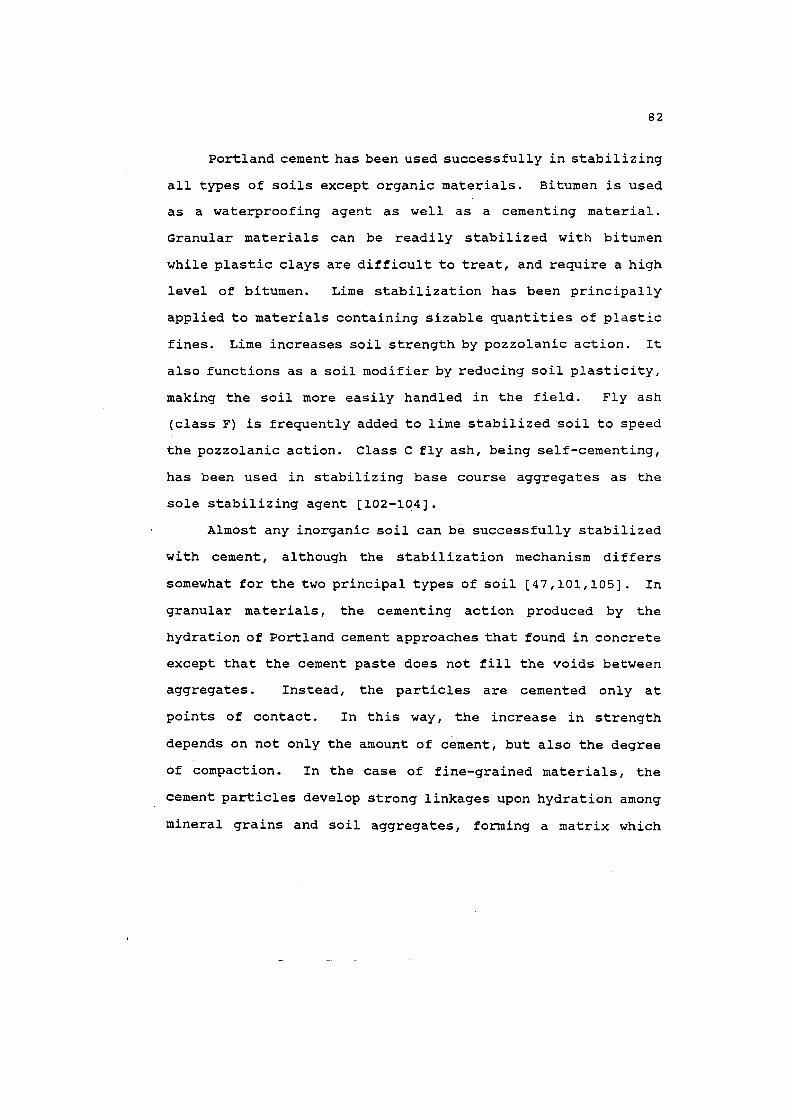
Portland cement has been used successfully in stabilizing
all types of soils except organic materials. Bitumen is used
as a waterproofing agent as well as a cementing material.
Granular materials can be readily stabilized with bitumen
while plastic clays are difficult to treat, and require a high
level of bitumen. Lime stabilization has been principally
applied to materials containing sizable quantities of plastic
fines. Lime increases soil strength by pozzolanic action. It
also functions as a soil modifier by reducing soil plasticity,
making the soil more easily handled in the field. Fly ash
(class F) is frequently added to lime stabilized soil to speed
the pozzolanic action. Class C fly ash, being self-cementing,
has been used in stabilizing base course aggregates as the
sole stabilizing agent [102-1041.
Almost any inorganic soil can be successfully stabilized
with cement, although the stabilization mechanism differs
somewhat for the two principal types of soil [47,101,105] . In granular materials, the cementing action produced by the
hydration of Portland cement approaches that found in concrete
except that the cement paste does not fill the voids between
aggregates. Instead, the particles are cemented only at
points of contact. In this way, the increase in strength
depends on not only the amount of cement, but also the degree
of compaction. In the case of fine-grained materials, the
cement particles develop strong linkages upon hydration among
mineral grains and soil aggregates, forming a matrix which

effectively encases the soil aggregates. The strength of the
soil is thus increased because the particles are fixed in the
matrix. Also, the surface chemical effects of cement reduce
the plasticity and water affinity of clayey soils. As a
result, the soil resists swelling and softening upon
absorption of moisture. For any type of soil, the quality of
the resulting cement-stabilized product is dependent to a
large degree on the molding water content and the density
achieved by compaction, as well as the curing conditions
[101,105].
Lime stabilization is most effective when applied to
clayey soils but the rate of strength gain is considerably
slower than that of cement. Two types of chemical reactions
occur when lime is mixed with moist soil [47,101,106]. The
first is the cation exchange and flocculation which cause
immediate improvement in soil plasticity, workability, uncured
strength, and load-deformation properties. The second type of
reaction is a slow, long-term cementation of compacted
mixtures of soil and lime. The cementing action, known as
pozzolanic reactions, involves interaction between the
hydrated lime and the reactive aluminous and siliceous
minerals in soils. ~ozzolanic reactions are time and
temperature dependent. They can be greatly accelerated by
adding a material high in alumina and silica such as fly ash.
Soil-cement mixtures have been commonly evaluated in the
laboratory by strength and durability tests for determining

minimum cement requirements. However, because of the
complexity and time consuming nature of the durability tests
such as freezing-and-thawing and wetting-and-drying tests,
many agencies have adopted only the unconfined compression
test to evaluate soil-cement mixtures. As cited by Yoder and
Witczak [47], the states of Texas and ~alifornia as well as
the United Kingdom have based their quality criteria on
unconfined compression strength. In general, the unconfined
compression strength requirement will insure adequate
durability of soil-cement mixtures. Only in extreme cases
will it be considered necessary to perform the durability
tests [48]. Table 15 shows the criteria for soil-cement as
established by various agencies.
The engineering properties of cement-stabilized bottom
ash are essentially the same as those of cement-stabilized
conventional aggregates. Of particular concern are the
strength development and durability characteristics,
especially resistance to freezing and thawing.
Table 15. Strength criteria for soil cement
7-day unconfined Agency compression strength
(psi)
Texas 6 5 0 ~alifornia, Class A, up to 5% cement 7 5 0 California, Class B, up to 4% cement 4 0 0 British, light traffic 250 British, heavy traffic 4 00

Applications of cement stabilized bottom ash have been
focused on base and subbase courses. The first known large-
scale application of a cement stabilized bottom ash base
course in the U.S. was the 1971-72 relocation and
reconstruction of West virginia Route 2 south of Wheeling.
The aggregate for this project was a blend of 46 percent by
dry weight of the boiler slag from one power plant and 54
percent bottom ash from another power plant nearby. This
blend was necessary in order to meet the West Virginia
gradation specification for class 5 cement-treated aggregate
base course. The aggregate blend was stabilized with 5
percent portland cement by weight of dry aggregate [36].
In Australia, the base and subbase courses of two trial
sections were constructed using stabilized bottom ash. In
these field trials, 6-in to 14-in thick layers of bottom ash
were stabilized with 3 to 6 percent of lime (CaO). It was
concluded that bottom ash is in its natural form a good
subbase material and in its stabilized form is an excellent
base course material [107].
In 1985, a highway demonstration project on the by-pass
section of Georgia Route 22 near Crawfordville was completed.
In this project, the base course of a 1000 ft. long test
section was constructed using pond ash (fine and coarse)
stabilized with 11 percent Type I portland cement. The cement
. content was determined based on a minimum compressive strength
of 400 psi after 7 days of curing. According to Georgia

Department of Transportation, handling of the cement treated
pond ash was found to be superior to typical soil-cement
[108].
Environmental As~ects of Ash Utilization
Environmental Legislation
Besides evaluating the suitability of the ash material as
a highway construction material, there is also considerable
interest on the part of federal and state regulatory agencies
on the environmental acceptability of ash utilization. In
fact, the national interest in solid waste disposal was
expressed by Congress in the Resource Conservation and
Recovery Act (RCRA) of 1976 [log]. The two basic objectives
' of the RCRA are: 1) protection of public health and the
environment, and 2) the conservation of valuable material and
energy resources. The Act set forth cooperative efforts among
federal, state, and local agencies to achieve these objectives
by improving solid waste management practices. The provisions
of the Act include: 1) requirements for control of the
generation, transportation, treatment, storage and disposal of
hazardous waste, 2) establishment of environmentally sound
disposal practices for all wastes, and 3) investigation and
creation of incentives for resource recovery and conservation
, activities.

The basic need to use recovered materials, including
power plant ash, while at the same time to alleviate the
problem of disposal, will continue to draw increased attention
in the future. However, Subtitle C of the RCRA also requires
the U. S. Environment Protection Agency (EPA) to promulgate
regulations to identify hazardous wastes and to set standards
for generators, transporters, and management facilities for
such wastes. The RCRA definition of solid waste is quite
broad, and a material is a RCRA solid waste irrespective of
whether it is discarded, used, recycled, reused, reclaimed,
stored or accumulated- (1101. The ma j or component in
implementing Subtitle C of the Act lies in the definition of
hazardous waste [109]:
Hazardous waste is a Itsolid waste", which because of its quantity . . . or physical, chemical . . . characteristics may ... pose a substantial present or potential hazard to human health or the environment when improperly ... disposed of, or otherwise managed.
Thus, by definition, "hazardous waste" is a subclass of
"solid wastett causing or significantly contributing to death
or illness, or posing a hazard to human health or the
environment when improperly managed. In amendments made to
RCRA in May of 1980, Congress specifically exempted
conventional coal combustion wastes (including fly ash, bottom
ash, boiler slag, and flue gas desulfurization sludge) from
regulation as a hazardous waste until further studies were
conducted [Ill]. This temporary exemption holds until the EPA

completes studies to establish actual environmental impacts of
waste management of coal combustion wastes, and issues a final
decision as to the hazardous or non-hazardous nature of these
materials. Because of the large quantities of solid waste
produced by electric utilities, a classification under the
hazardous waste provisions could cost the industry billions of
additional dollars [112]. It is believed that the coal
combustion wastes are exempted because their regulation could
cause significant increases in- energy costs [112,113].
Although coal combustion wastes are presently exempted from
regulation under RCRA, they may still be regulated in the
future . In the meantime, state requirements on solid waste
disposal facilities have become more restrictive. The issue
of protecting groundwater quality from chemical contamination
caused by solid waste has been common to all state and federal
regulation debates [112]. Awareness of the environmental
risks has drawn increased attention to groundwater quality
degradation by coal combustion wastes.
At present, power plant ash is treated differently in the
various states. In some states, no special requirements are
placed on the use of power plant ash as a construction
material. In other states, power plant ash is considered to
be a solid waste and is subject to appropriate requirements
' for disposal. Those disposal procedures may require a permit
to build a structural fill or embankment. In other words, the

fill or embankment is treated as a disposal site, and the
environmental requirements for utilization are as strict as
for disposal. In general, the permit will require ground
water monitoring to determine if compounds are leaching from
the site [6].
Environmental Impacts of Ash Utilization
Considerable attention has been focused on the
environmental acceptability of using power plant ash as
construction materials, and in particular, the degree of
impact these materials have on the environment when used as a
construction material. Because of some similarities between
structural fills and landfills, certain environmental aspects
of ash disposal are also mentioned in this section.
The most immediately obvious environmental effect of the
disposal or utilization of power plant ash is spreading of
dust and the appearance of ash deposits as an aesthetically
undesirable feature of the landscape. Because typical bottom
ash has less than 10 percent fines, dust spreading is not
expected to be a significant problem. Also dust can be
prevented by rapid covering of exposed ash surfaces, and by
appropriate handling during construction, e.g., sprinkling.
The principal environmental concern about the use of
power plant ash is the possible leaching of toxic substances
or other potentially harmful constituents from the ash and the
possibility of ground water degradation as a result of such

leaching. Power plant ash, like the coals from which it is
produced, does contain trace amounts of certain elements
which, if released in sufficient concentrations, may be
harmful to the environment. These contaminants are leached
out by and carried along with percolating precipitation and
possibly penetrating groundwater and surface water. The
leachate released to the groundwater or surface water may
contaminate present and future drinkipg water supplies.
The degree of environmental impact is determined by the
amount of these elements leached from an ash deposit. Small
amounts of heavy metals released to the environment may
constitute a hazard both to health and environment. The high
content of salts may adversely affect the quality of ground
water, although it does not constitute any danger to human
health. These salts are primarily calcium and sulfate.
Sodium, potassium, magnesium , and chloride also contribute to high contents. The salts are easily soluble and, as a result,
are leached relatively rapidly. In most cases, this means a
hundred years or so [114]. Heavy metals in the ash are not
as readily soluble as the salts, but are nevertheless soluble
to such an extent that the content of heavy metals in the
leachate is noticeably elevated. An important difference in
comparison with the salts is that the elevated levels remain
for a very long time, viz., several thousand years [114].
Environmental risks due to radioactivity are present only
in deposits of certain peat ashes [114]. Radioactivity can be

limited by covering the ash deposit with a low radioactivity
material.
In summary, the environmental effects which need to be
considered in either utilization or disposal of coal
combustion wastes are:
- the release of salts to groundwater and surface water
- the release of heavy metals to groundwater and surface
water
- spreading of dust from the deposit or from construction
- radioactive emission from the deposit
- the aesthetical influence on the surrounding landscape.
A schematic of the possible effects of ash deposit on human
health and environment is shown in Figure 16.
Waste Classification
In implementing Section 3001 of the RCRA,. EPA has
promulgated procedures for determining whether a waste will be
classified as hazardous. A waste may be classified as
hazardous in three ways: 1) it is a listed waste, 2) it is a
mixture containing listed waste, or 3) it has any of four
specific characteristics defined in the RCRA for hazardous
wastes. An unlisted waste is classified as hazardous if it
exhibits one of the four properties: 1) ignitability, 2)
corrosivity, 3) reactivity, and 4) extraction procedure
toxicity [115]. Since power plant ash is very inert, it is
not likely that it would be ignitable or reactive. Therefore


only the categories of corrosivity and toxicity will be
reviewed.
Characteristics of Corrosivitv
~ccording to EPA's regulations, a solid waste exhibits
the characteristics of corrosivity if a representative sample
of the waste has either of the following properties:
1) it is aqueous and has a pH less than or equal to 2
or greater than or equal to 12.5.
2) it is a liquid and corrodes steel (SAE 1020) at a
rate greater than 6.35 mm (0.25 in.) per year at a
temperature of 55°C (13O8F).
Extraction Procedure Toxicitv Characteristics (EPTC)
The accurate prediction of ash leachate composition
(contaminants and concentrations) is not possible at present.
The chemical composition of the ash is important to the
leaching processes, but it forms an insufficient basis for an
estimate of the leachate composition. Furthermore, leaching
of waste materials will generally occur very slowly in the
environment. Therefore the challenge in assessing
leachability is to develop a quick and inexpensive laboratory
test that can accurately predict the long t e n leaching
behavior in the field. A number of testing protocols have
been proposed and investigated. The EPA has adopted a

regulatory method known as the Extraction Procedure (EP)
toxicity test. The EP toxicity test was developed to provide
a method for classifying wastes as hazardous or nonhazardous
under standard conditions, rather than for predicting the
amount of contamination that could occur from the waste.
Three major postulates of EP toxicity are chosen: 1)
groundwater as the exposure pathway, 2) landfill as the
particular disposal environment model, and 3) multiples of
drinking water standards as thresholds indicative of
unacceptable levels of contamination [116].
In the EP toxicity test, a representative sample of a
solid waste is extracted with deionized water maintained at a
pH of 5 using acetic acid [117]. The extract derived from the
EP toxicity test is then analyzed for eight elements to
determine if the waste is classified as hazardous or
nonhazardous. The maximum contaminant levels specified for
characterizing hazardous waste are such that they are one
hundred ( 100) times the National Primary Drinking Water
Standards [118]. The test also considers six herbicides and
pesticides which are not found in coal combustion wastes.
Table 16 lists the maximum acceptable extract concentrations
for a nonhazardous waste, along with the Primary Drinking
Water Standards.
The EP test were designed to model the performance of
wastes in a co-disposal situation, wherein the waste to be
tested is leached in an acidic environment similar to that

which could occur when the waste is co-disposed with municipal
wastes [119,120]. In the EPAts view, such a test serves as a J
I8worse case" scenario and reflects the maximum leaching
effects which could result from the mismanagement of wastes.
If this occurs in actual practice, it may lead to exposing the
wastes to an acidic leach medium as the municipal waste
decomposes. Because the majority of utility wastes are
disposed in well engineered landfills, the electric utility
industry has vigorously opposed the use of the EPA's "worse
case" disposal scenario [119] .
Table 16. EPA criteria pollutants - primary metals
EP toxicity Primary Maximum
Drinking Water acceptable Contaminant S tandarda amountb
(mg/litre) (mg/litre)
Arsenic Barium Cadmium Chromium Lead Mercury Selenium Silver
a EPA Interim Primary Drinking Water Standards [118] Extract concentrations equal to or exceeding one or more of the levels given will classify the solid waste as hazardous from EPA [115]

Toxicitv Characteristics Leachinu Procedure (TCLP)
In 1984, the RCRA amendments dramatically changed the
nature of hazardous waste regulation [121]. The
characteristic of toxicity was expanded to include a wide
range of volatile and non-volatile organic compounds. The
same amendments also required the EPA to examine the
deficiencies of the EPTC and develop a more accurate leaching
test. The new test was first presentel3 to the public in April
1985 [122]. Three modified versions of the test have been
published by EPA since [123,124,125]. None has appeared in a
final version as the replacement for the EPTC. The new test
is known as the Toxicity Characteristics Leaching Procedure
(TCLP) . Differences between the EPTC and the TCLP can be
grouped into three general classes: 1) changes in the
equipment, 2) leach medium, and 3) regulated analytes. These
differences are discussed in the following paragraphs.
Chanues in Ecrui~ment. The TCLP includes volatile and
non-volatile organic compounds as analytes in the
classification of wastes, whereas the EPTC did not. Therefore
the TCLP requires that all equipment be made of materials
inert towards organic and inorganic analytes.
The filter in the EPTC is a 0.45 micron nitrocellulose
membrane while the TCLP specifies a 0.7 micron glass fiber
filter containing no binders. The TCLP also introduces the
' zero headspace extractor which is designed to run the leach

testing of a waste. without losing the volatile components
during the extraction.
Leach Medium. The TCLP requires a determination of the
appropriate extraction fluid be carried out before running the
TCLP. Once the extraction fluid has been selected, the
extraction fluid is added to the waste at one time. Thus the
constant pH monitoring of the slurry, as required by the EPTC,
is not necessary.
Recrulated Analvtes. As previously noted, the EPTC
classifies wastes based on the concentrations of eight metals
and six herbicides and pesticides found in the EPTC leachate.
The TCLP includes organic compounds in the classification.
The list of TCLP regulated organic compounds and their current
regulatory levels is given in Table 17. Note that the
regulatory levels for some components are footnoted. These
compounds are regulated at the lowest level of current
analytical methods. The EPA intends to lower these levels
still further when they believe the analytical methods are
reliable. Nickel and thallium are added to the list of
inorganic analytes but no regulatory level is given.
An important impact of the TCLP on the classification of
coal combustion wastes is economic. It is estimated that the
cost for the analysis of metals by the TCLP is approximately
equal to or less than the EPTC. However, the cost for the
analysis of volatile and semi-volatile organics is estimated
to be three to six times the cost for metals determination

Table 17. ~dditional toxicity characteristic contaminants and regulatory levelsa
Contaminants Regulatory Levels (mg/L)
Acrylonitrile Benzene Bis(2-chloroethyl) ether Carbon Disulfide Carbon tetrachloride Chlordane Chlorobenzene Chloroform o-Cresol m-Cresol p-Cresol 1,2-Dichlorobenzene ,4-Dichlorobenzene 1,2-Dichloroethane 1,l-Dichloroethylene 2,4-Dinitrotoluene Heptachlor (and its hydroxide) Hexachlorobenzene Hexachlorobutadiene Hexachloroethane Isobutanol Methylene chloride Methyl ethyl ketone Nickel Nitrobenzene Pentachlorophenol Phenol Pyridine 1,1,1,2-Tetrachloroethane 1,1,2,2-Tetrachloroethane Tetrachloroethylene 2,3,4,6-Tetrachlorophenol Thallium Toluene l,l,l-Trichloroethane 1,1,2-Trichloroethane ~richloroethylene 2,4,5-Trichlorophenol 2,4,6-Trichlorophenol Vinyl Chloride
a From Federal Register [125] no value proposed
' Values in parenthesis will be methods improve
lowered as analytical

[119]. Therefore, the possibility of running less expensive
screening tests as permitted under section 1.2 of the TCLP
[125] is being investigated by the industry.
Indiana Leachinq Method
According to Indiana's regulations (Title 329 of Indiana
Administration Codes, Article 2) [18], coal ash and flue gas
desulfurization sludge may be disposed at a restricted waste
site type I without testing. But for disposal at restricted
waste site types 11, 111, or IV, these wastes are required to
be analyzed by both the EP toxicity test and the Indiana
leaching method test. The Indiana leaching method test is
conducted as specified for EP toxicity testing, except with no
addition of acetic acid. The contaminants and corresponding
concentrations for each restricted waste site type are
tabulated in Table 18 and Table 19 for the EP toxicity test
and Indiana leaching method test, respectively.
Leaching Properties of Ash
The extent to which a waste is hazardous to the
environment is dependent upon the amount of contaminants that
will be released from a deposit. At present, the prediction
of ash leachate properties is not possible because leaching of
. ash materials is a very complex process. In general, the
leachate properties are governed by the physical-chemical

I ad^& 11 ad& 111 ad& AI ad&
( r a 2 ~ ~ rad s m e x h ~ ~ ~ ~ m ) raqamered suoTqerquaauo3

Table 19. Allowable concentrations of waste constituents using the Indiana leaching method testa
Parameter Concentrations
(milligrams per liter)
Type IV Type I11 Type I1 Type I
Barium Boron Chlorides Copper Cyanide, Total Fluoride Iron Manganese Nickel Phenols Sodium Sulfate Sulfide, Total Total Dissolved Solids Zinc
Parameter Acceptable range (standard units)
TypeIV Type I11 Type I1 TYPe I
a Source: Indiana Register [18] Testing is not required

characteristics of the ash and the soil-water matrix through
which the leachate flows. In order to estimate the leachate
quality at any point, one must know the laboratory leachate
properties and the specific attenuation-translocation factors
of the soil-ash system [126].
Leachins Mechanism
The majority of power plant ashes and desulfurization
products are alkaline in character to the extent that the
first leachate has a pH above 7.0. The alkaline and buffer
substances in the waste are also dissolved and removed, and
the pH of the pore water in the deposit will gradually fall.
Calculations based on laboratory tests indicate that this will
take a very long time, and consequently the leachate will
continue to be alkaline in character.
During its slow downward passage, the leaching water
progressively dissolves components until a state of chemical
equilibrium is reached. Substances already in solution may be
precipitated, as the water constantly passes through zones of
differing pH. The contaminants exist in different parts of
the ash. Some exist in the form of easily-soluble particles,
others are bound in vitrified silicate matrices. Thus they
have varying solubilities under the varying conditions in the
deposit.
The first leachate from coal combustion wastes contains
relatively high concentrations of dissolved salts. In

laboratory tests, these high concentrations rapidly fall off.
However, when scaled up to the real size of a deposit, this
can be equivalent to several hundred years' leachate
production.
The alkaline and buffer character of the ash results in
slow leaching of trace elements (heavy metals). This also
leads to comparatively low concentrations of trace elements in
the leachate, but at the same time it means that leaching will
continue for a very long time. Easily-soluble trace elements
are the first to be leached. Consequently, the highest trace
element concentration appear in the leachate that is first
produced. As time increases, the less soluble trace elements
are also released. In consequence, trace element
concentrations in the leachate will be elevated for thousands
of years. Eventually, when the pH-buffer substances in the
ash are consumed, acid conditions may arise in the deposit,
which may result in an increased leaching of trace elements.
Before that time, at least the easily leached fraction of the
elements will be leached, which compensates for increased
concentrations.
However, coal ashes can also be acid in character. The
acidity is due to the sulfur dioxide that has been sorbed to
the ash and occurs as sulfate or free so3. It is easily
leached and the ash thereby turns neutral or alkaline in
, character. As long as the acid conditions in the deposit
remain, leaching is more rapid and the trace element
concentrations in the leachate produced will be elevated.
Attenuation Mechanisms
There are various physical and chemical attenuation
mechanisms that are believed to generally prevent any
contaminants leached into the ground from concentrating in
groundwater at significant levels. The mechanisms
contributing to the reduction of concentrations of the
leachate contaminants in soil-groundwater systems can be
grouped into two categories:
- adsorption and precipitation of contaminants in soil
and/or rock
- dispersion and dilution of leachate in groundwater and
surface water.
The adsorption and precipitation of contaminants to/on
soil particles involve complex physical and chemical
processes. Knowledge of these processes is not complete and
the prediction of their effects on leachate -attenuation is
very difficult, if not impossible. In fact, these processes
vary greatly due to differences in soil/rock type, pH
environment, and elements of contamination [114]. Dilution
and dispersion reduce leachate concentrations by adding to the
volume in which the leachate is contained [21].

A study performed by the ~llinois Geological Survey used
a dispersed soil technique with soils of varying character.
It was found that the contaminants in coal waste leachates
were attenuated to a great degree by each of the soils [127].
Leachate Content
As earlier stated, the potential environmental hazard of
a waste is determined by the amount ,of contaminants leached
from a deposit or from utilization. The concentrations of
different contaminants in the leachate may vary within wide
limits for ashes from different sources. This is also true
for ashes produced from the same plant at different times.
The reasons for this are varying contents of trace elements in
the coal, along with differing conditions during combustion.
Groundwater Monitorinq There are very limited published
groundwater monitoring data from ash fill and embankment
sites. Groundwater monitoring data reported from four
embankment and fill construction sites have been summarized by
the Valley Forge Laboratories. These sites include two fly
ash highway embankments and two fly ash structural fills.
None of the groundwater quality measurements from these sites
has approached or exceeded the maximum toxicity levels defined
in the RCRA for hazardous waste. In fact, the levels of
contaminants in samples from monitoring wells showed either no
noticeable change or insignificant increases compared to pre-
operational conditions [21].

Groundwater monitoring work performed at power plant ash
disposal sites has produced results that are essentially
similar to those described for construction sites. In the
majority of cases, the data from monitoring of disposal sites
showed little adverse effect on drinking water quality. Only
a small percentage of the data showed a potential variation
attributable to the disposal sites from either the primary or
secondary drinking water standards. None of the data was
found to exceed the RCRA toxicity standards [128].
However, in 1980, the water from a domestic well near a
closed fly ash disposal site in Chisman Creek watershed,
Virginia was found to contain elevated levels of several trace
elements, notably vanadium and nickel. In 1983, EPA placed
the site on the Superfund List and the Chisman Creek Superfund
Site became the only ash disposal site on the National
Priority List. Virginia Power closed three ash disposal pits
at the site and the remedial action cost $8.6 million [129].
It should be noted , from the Chisman Creek case, that samples
of fly ash taken from the site did not contain hazardous
concentrations of trace metals, as determined by the EP
toxicity test. Virginia Power also contended that fly ash has
been exempted from EPA regulation by RCRA. However, the court
ruled that EPA could list sites containing any wastes,
exempted or otherwise [129].
Laboratorv Evaluations Most of the experimental work on
environmental effects of ash utilization has been restricted

to laboratory evaluations, and analyses have been limited to
inorganic contaminants. Repeated laboratory studies have been
performed by EPA, Department of Energy, Electric Power
Research ~nstitute, and utility companies to analyze the
presence of trace metals in leachates from fly ash. The
findings of these studies, as cited by Valley Forge
Laboratories, have demonstrated consistently that "... heavy metals and other elements have a very low potential of
leaching from coal combustion wastesl1 [21]. Leaching tests
conducted according to EPA1s extraction procedure show that
the concentrations of the elements in leachate do not exceed
RCRA toxicity standards, and rarely even exceed the primary
drinking water standards.
There are very limited data reported on the analysis of
leachate from bottom ash samples. In a study performed by the
Radian Corporation for the U. S. Department of Energy, seven
bottom ash samples were analyzed. Again, none of the
concentrations has exceeded the RCRA toxicity standards. only
four analyses on trace elements, out of a possible 56
analyses, were in excess of the primary drinking water
standards, and all of these excesses were less than ten times
the drinking water standard limits. Although these data were
obtained from limited sources of bottom ash, they do indicate
that not only is bottom ash not hazardous, but that the
. concentration levels for leachate from bottom ash generally
appear to be lower than those for fly ash.

108
A laboratory investigation was conducted by Western
Research Institute to compare the results on utility wastes of
the proposed Toxicity Characteristic Leaching Procedure with
the Extraction Procedure Toxicity Test [119]. The study
examined a total of 41 coal combustion waste samples in
duplicates. The analytical results from the TCLP showed about
83 percent of the mean concentrations to be equal to or
greater than the EPTC concentrations, and all materials tested
fell into the nonhazardous class. It was also found that
regulated organic constituents are associated with coal
combustion wastes. While the differences were significant
when comparing one test with the other, there was no
significant difference when the two ' tests were compared
against the regulatory levels. In all cases, the
concentrations of regulated analytes, both organic and
inorganic, were well below the regulatory threshold, in most
cases one to three orders of magnitude lower.
Radioactivity
Each atom of matter is composed of a nucleus surrounded
by a cloud of electrons. An atom is called radioactive if its
nucleus can emit one or more energetic radiations.
Starting with a collection of identical radioactive
atoms, the time it takes for one-half of them to decay is
called the half-life. The decay of uranium-238 is the first
step in a chain of successive decays of radioactive isotopes,

with radium-226 and radon-222 as intermediate products. The
decay chain finally terminates when a stable isotope, lead-206
is reached. Omitting minor sidesteps, this decay chain is
[130,131,132] :
-- pb-210 - Bi-210 -- Po-210 -- Pb-206 (stable) ~ X ~ O - ~ S 22.3~ 5. Old 13 8d
The lines with arrows specify the nuclei in the chain, and the
numbers underneath the arrows are their half-lives, in years
(y), days (d), minutes (m) , or seconds (s) . The standard
chemical symbols are used: U for uranium, Th for thorium, Pa
for protactinium, Ra for radium, Rn for radon, Po for
polonium, Pb for lead, and Bi for bismuth.
The decay rate has traditionally been specified in Curies
(Ci). The original curie unit was based on the decay rate of
one gram of radium-226, which is approximately 37 billion
(3.7~10'~) disintegrations per second [ 133 ] . It is often
convenient to use a smaller unit, the picocurie (pCi), where
1 pci = lo-'* ci.
Uranium and its daughter, radium-226, are ubiquitous in
the earth's crust, being present in almost all forms of rock
' and soil, including coal. Therefore, they are also present in

coal ash. When an atom of radium-226 decays, an atom of radon
is formed. The radon, chemically a gas, can then diffuse out
of ash deposits into the atmosphere. A rough average radium
concentration in the soil is 0.8 pCi/g [134].
Radon-222 is a colorless, odorless, noble gas which
happens to be radioactive. Radon hazards come primarily from
radioactive products formed in the decay of radon-222. These
products, called the "radon da~ghters,,~~ are also radioactive
but, unlike radon, they are atoms of heavy metals and readily
attach themselves to whatever they contact. Inhalation of
radon, or more specifically the radon daughters, leads to
deposition of radioactive atoms on the walls of the lung
[135]. If a radioactive ash is soluble, atoms of radon and
its daughters can pass into the blood and settle in bone
tissue [136].
Prior to December 1978, solid wastes were classified as
radioactive if the radium-226 activity was above 5 pCi/g.
Currently, no regulatory criterium exist for solid waste
radioactivity. If sluice water from ash ponds is of concern,
the maximum alpha particle activity defined in the National
Primary Drinking Water Standards [118] is 15 pCi/l.
A study of 69 eastern and western fly ashes showed that
the mean radium-226 activity was 3.7 pCi/g for ash produced
from eastern coal and 2.6 pCi/g for ash from western coal.
Only seven of these ashes had values greater than 5 pCi/g,
with a maximum value of 7 pci/g [137]. The results of a

separate study determined that 6 out of 12 fly ashes from
western bituminous and lignite coal had radium-226 activity
levels above 5 pCi/g [138]. Another study on the
radioactivity of power plant sluice-pond water showed the
alpha radioactivity ranged from 1 to 9 pCi/l for the 10 power
plants studied [139].
No data have been reported on the radioactivity of bottom
ash. However, it is believed that radioactive emissions from
power plants are proportional to particulate release [136].
Therefore, the radioactivity of bottom ash is expected to be
less than the values reported for fly ashes.

TESTING MATERIALS
Eleven d i f f e r e n t bottom ashes from t e n u t i l i t y s t a t i o n s
were s e l e c t e d f o r l a b o r a t o r y t e s t i n g i n t h i s s t u d y . The a sh
m a t e r i a l s c o n s i s t e d of n i n e d r y bottom a s h e s , one wet bottom
a s h , and a s o u r c e which was a combinat ion of b o t h w e t and d r y
a shes . The a s h ranged i n c h a r a c t e r from g r a y , f r i a b l e , and
porous t o b l a c k , d u r a b l e , and g l a s s y .
S e l e c t i o n o f A s h Sources
The s e l e c t i o n of t h e s o u r c e of each a s h was based on a
p rev ious s t u d y completed i n 1985 on Ind i ana f l y a s h e s [140].
Because some chemical p r o p e r t i e s of f l y and bottom a s h e s a r e
expec ted t o b e s i m i l a r , it would b e advantageous t o s e l e c t
bottom a s h from power p l a n t s a t which t h e p r o p e r t i e s of t h e
f l y a sh had been s t u d i e d . For example, i f bottom a s h and f l y
a s h a r e t o b e mixed f o r u t i l i z a t i o n , knowledge of t h e
p r o p e r t i e s o f t h e f l y a sh may s a v e t h e t i m e and e f f o r t of
r epea t ed t e s t i n g .
A s t h e u t i l i z a t i o n of a s h m a t e r i a l w i l l b e economic on ly
on a r e g i o n a l o r l o c a l b a s i s , one of t h e impor t an t c r i t e r i a
f o r t h e s e l e c t i o n was t h e geographic d i s t r i b u t i o n of t h e
sou rces . A r e a s o n a b l e geographic ba l ance among t h e e l e v e n

ashes s e l e c t e d f o r s tudy was accomplished, w i t h t h r e e bottom
ashes i d e n t i f i e d a s be ing from nor thwes tern I n d i a n a , f o u r from
c e n t r a l I n d i a n a , and 4 from sou the rn Ind iana . The approximate
l o c a t i o n s o f t h e s e l e c t e d ash s o u r c e s a r e shown i n F igu re 17.
Another c r i t e r i o n f o r s e l e c t i o n was w i t h r e s p e c t t o t h e
u t i l i t y companies. I t was in tended t o o b t a i n bottom a s h from
a t l e a s t one g e n e r a t i n g s t a t i o n ope ra t ed by each of t h e
f r anch i sed power u t i l i t i e s i n t h e s t a t e , and a l s o bottom a s h
from a t l e a s t one municipal power s t a t i o n . The f i n a l
c o l l e c t i o n covered f o u r f r anch i sed u t i l i t i e s , and inc luded
t h r e e bottom ashes from s t a t i o n s o f P u b l i c S e r v i c e Ind iana
( P S I ) , t h r e e from Northern Ind iana P u b l i c S e r v i c e Company
(NIPSCO) , two from I n d i a n a p o l i s Power and L igh t Company (IPL) ,
and two from Southern Indiana Gas and E l e c t r i c Company
(SIGECO). I n a d d i t i o n , one bottom ash was ob ta ined from
Richmond Power and Light (RPL) , which is a municipal-owned
power s t a t i o n .
I t was a l s o decided t o sample bottom a s h from s t a t i o n s of
vary ing s i z e s , i n terms of g e n e r a t i n g c a p a c i t y , from t h e
s m a l l e s t t o t h e l a r g e s t . The s t a t i o n s sampled ranged from t h e
4 6 Megawatt (MW) Perry K. s t a t i o n t o t h e 3340 MW Gibson
s t a t i o n , t h e l a t t e r being t h e l a r g e s t i n t h e s t a t e . Tab le 2 0
lists t h e s t a t i o n s sampled i n t h e s t u d y , t o g e t h e r w i th t h e i r
l o c a t i o n and r a t e d c a p a c i t y .

Lpnqs aqq ur p a ~ d m e s saqse moqqoq 30 suorqeao~ aqemrxo~ddy ' L T a z n h r ~

Table 20. Bottom ash sources in the study
Utility Company Station
Location Capacity (county) (megawatts)
NIPSCO~ NIPSCO NIPSCO PS IC PSI PS I SIGECO~ SIGECO RPL~ IPL' IPL
R. M. Schahfer, Unit 14 R. M. Schahfer, Unit 17 D. H. Mitchell Gibson R. A. Gallagher Wabash River A. B. Brown F. B. Culley Whitewater Valley C. C. Perry E. W. Stout
Jasper Jasper Lake Gibson Floyd Vigo Posey Warrick Wayne Marion Marion
a Northern Indiana Public Service Co. total capacity of Schahfer station is 1943 megawatts Public Service Indiana Southern Indiana Gas and Electric Co. Richmond Power and Light Indianapolis Power and Light
Sam~lins of Ash
In most power plants, bottom ash is transported to a
disposal lagoon as a slurry flowing through closed conduits.
The closed ash transport and handling systems are seldom
equipped with sampling ports at convenient locations. In such
cases, bottom ashes were collected as grab specimens from ash
deposits at the outlet of sluice pipes. In fact, at power
plants where bottom and fly ashes are co-disposed, the ash
sampled represented the coarse fraction of the ash in the
lagoon. Only two stations disposed their ash by the dry
method. In this case ashes are temporarily stored in storage

s i l o s , b e f o r e be ing t r ucked t o l a n d f i l l s . Sampling o f a l l
a shes was guided by t h e in format ion and adv ice provided by
p l a n t s t a f f i n charge of ash handl ing and d i s p o s a l f o r each
power s t a t i o n .
Of t h e e leven a shes used i n t h e s tudy , two a shes were
sampled from bottom ash s i l o s , f o u r were from ash lagoons
s t o r i n g bottom ash on ly , and f i v e were from ash lagoons o r
l a n d f i l l s con ta in ing bo th bottom and f l y ashes . A s p r ev ious ly
d i scussed , it is l i k e l y t h a t bottom ash needs t o be s t o c k p i l e d
be fo re it is reclaimed f o r large-volume uses . The re fo re , t h e
sampling techniques used i n t h i s s tudy a r e judged t o be
r ep re sen ta t ive , of t h e m a t e r i a l s t o be recla imed.
The a c t u a l c o l l e c t i o n on s i t e was performed by hand-
load ing of 10-gallon p l a s t i c cans . Care was t aken t o o b t a i n
a s r e p r e s e n t a t i v e a sample a s p o s s i b l e . Each sample was
p rope r ly tagged, r e tu rned t o t h e l a b o r a t o r y , and c a r e f u l l y
s t o r e d i n a des igna ted a r e a f o r subsampling. Each a sh sou rce
was sampled a t two d i f f e r e n t t i m e s t o s tudy t h e p o t e n t i a l
v a r i a b i l i t y of bottom ash produced from t h e same source . Four
bottom ashes were s e l e c t e d f o r d e t a i l e d t e s t i n g on eng inee r ing
p r o p e r t i e s , and a t h i r d sample was obta ined from each of t h e s e
f o u r sources . These inc luded Gibson, Schahfer Un i t 1 4 ,
Schahfer Un i t 1 7 , and Per ry a shes . Fly ash was a l s o sampled
from t h e s e f o u r sou rces f o r t e s t i n g bottom ash - f ly ash
. mixtures f o r pavement m a t e r i a l .

Bottom Ash
Most of the power plants were burning Illinois Basin
bituminous coals at the time of sampling. Generally, coal was
supplied from a major source and was supplemented from various
minor sources. Very few plants burned single-source coal.
Table 21 summarizes the major source of coal being burned at
the time of sampling, along with the resulting type of bottom
ash. The following sections describe the ash handling method
used in each power station as well as the physical appearance
of each ash.
Table 21. Coal source and 'ash type
Power Coal type Bottom station and source ash type
Schahf er Unit 14 Western lignite wet Unit 17 Illinois bituminous dry Mitchell Western lignitea Gibson
dry Illinois bituminous dry
Gallagher Indiana bituminous Wabash
dry Indiana bituminous dry
Brown Indiana bituminous Culley
dry Indiana bituminous dry
Richmond Indiana bituminous Perry
dry Indiana bituminous
Stout dry
Indiana bituminous wet & dry
a From Wyoming
Gibson Ash
This generating station is the largest in the state, and
is located in southwestern Indiana. The ash was produced from
burning Illinois basin bituminous coal in a pulverized dry
bottom furnace. Bottom ash is sluiced to the ash pond, and
the pipe position is periodically moved to facilitate ash
storage. A considerable amount of ash has been accumulated in
the ash pond and the station is producing bottom ash at a rate
of 200,000 tons per year. Bottom ash and fly ash are stored
separately at the station. The bottom ash lagoon is easily
accessible by trucks and other construction equipment. This
ash exhibited a dull appearance and some particles showed a
shiny luster resembling wet bottom ash particles. At the time
of sampling, the ash was being mined by a concrete block firm
to supplement natural aggregate.
Gallagher Ash
This ash was produced at the R. A. Gallagher Station of
Public Service In'diana near New Albany, Indiana. The coal
burned here was a bituminous coal from southwestern Indiana;
occasionally a small amount of western Kentucky coal was also
burned. This dry bottom ash was sluiced to the ash lagoon and
mixed with the fly ash. The appearance of this ash was of a
dull nature, with a light gray color. There are filled and
abandoned ash lagoons, which indicate abundant quantities of
ash stored on site. The access to ash deposits at Gallagher
Station is good, but bottom ash was not being marketed at the
time of sampling.
Wabash Ash
This ash was obtained from the Wabash River Station at
Terre Haute, Indiana. It was produced from coal obtained from
the Hawthorn Mine in southern Indiana.' The ash is of the dry
bottom type, and was not being marketed commercially at the
time of sampling. This ash resembled the Gallagher ash, as it
was light gray in color and dull in appearance. 1t was
estimated that there was over three million tons of ash on
site, and the access to the filled lagoon is in good
condition.
Brown Ash
This ash was obtained at the A. B. Brown Station of the
Southern Indiana Gas and Electric Co. (SIGECO), near
Evansville, ~ndiana. It was produced from coal acquired from
the Old Ben I mine in southern Indiana. The station has been
burning this single source of coal since its installation in
1978, and the plan is to continue the use of that coal for the
indefinite future. The 16-acre ash pond in this station is,
in fact, a natural valley on the Ohio River. Bottom ash and
fly ash here have different sluiceways and different outlets

which are located about 50 yards apart in the pond. Bottom
ash was sampled near the outlet of the bottom ash sluiceway.
It was a hard, dense material of dark gray color, with traces
of shiny luster. The ash was not being marketed at the time
of sampling.
Culley Ash
The F. B . Culley station of SIGECO was the source of this
ash. Several different Indiana coals were burned in the
station. Bottom ash is separated from fly ash in lagoons, and
ash lagoons are periodically emptied by trucking ash to a
landfill, where the bottom and fly ashes are mixed randomly.
Bottom ash sample was obtained from the bottom ash lagoon.
This material has high specific gravity and unit weight, with
a dull appearance. The ash was not marketed at the time of
sampling.
Schahfer Unit 17
This unit, part of the large R. M. Schahfer Station of
the Northern Indiana Public service Co. (NIPSCO), burned
pulverized Illinois bituminous coal in a dry bottom furnace.
Bottom ash was sluiced to a well-engineered ash pond which was
maintained in good condition. The ash pond received bottom
ash only and a representative sample was obtained from the
pond. This bottom ash was composed of clean sand and gravel

s i z e s , w i t h no f i n e s . I t had r e l a t i v e l y h i g h p o r o s i t y and a
d a r k g r a y c o l o r . F ly and bottom a s h e s were s t o r e d s e p a r a t e l y .
Schahfe r U n i t 1 4
T h i s bottom a s h was sampled from a companion u n i t o f t h e
S c h a h f e r S t a t i o n . The u n i t burned wes te rn l i g n i t e c o a l i n a
cyc lone f u r n a c e and produced w e t bot tom a s h . T h i s was t h e
o n l y m a t e r i a l i n t h e s t u d y t h a t was e x c l u s i v e l y w e t bot tom
a s h . Bottom a s h was s t o r e d s e p a r a t e l y from f l y a s h , and was
b e i n g marketed th rough an a s h b r o k e r u s i n g t h e t r a d e m a r k
" b l a c k b e a u t y u .
P h y s i c a l appearance of t h i s w e t . bot tom a s h was v e r y
d i f f e r e n t from t h o s e of d r y bot tom a s h e s . The a s h was h a r d ,
d e n s e , and s h i n y b l a c k i n c o l o r . The g r a d a t i o n was v e r y
uni form, and t h e r e were s m a l l amount of needle-shaped
p a r t i c l e s p r e s e n t i n t h e ash . U n l i k e d r y bottom a s h , w e t
bot tom a s h p a r t i c l e s had smooth s u r f a c e t e x t u r e and appeared
much l i k e c rushed g l a s s .
M i t c h e l l Ash
T h i s m a t e r i a l was o b t a i n e d from t h e D. H . M i t c h e l l
S t a t i o n of NIPSCO a t Gary, I n d i a n a . I t was produced from
b u r n i n g two d i f f e r e n t wes te rn l i g n i t e c o a l s from Wyoming. The
c o n t e n t of t h e uncombust ible m a t e r i a l i n t h i s c o a l was s o h i g h
t h a t t h e bottom a s h had t r a c e s o f f o r e i g n s u b s t a n c e s u c h a s

rock f ragments and p e b b l e s . Bottom a s h was t r a n s p o r t e d
through p i p e s t o a s h p i t s which s t o r e d b o t h f l y and bottom
a s h e s . Access t o t h e a s h p i t s was v e r y p o o r . The s t a t i o n
would need t o remove a p o r t i o n of t h e d i k e i n o r d e r t o t r u c k
t h e a s h , and t h e n r e c o n s t r u c t t h e d i k e . The a s h was n o t b e i n g
marketed a t t h e t i m e of sampl ing .
Richmond Ash .
The a s h was o b t a i n e d from t h e Whitewater V a l l e y S t a t i o n
of Richmond Power and L i g h t Co. The m a j o r i t y of t h e c o a l
burned a t t h i s s t a t i o n was I n d i a n a b i tuminous c o a l from t h e
Miller Creek mine. About 2 0 p e r c e n t of t h e c o a l burned was
from o t h e r s o u r c e s . Bottom a s h was produced i n a p u l v e r i z e d
d r y bottom f u r n a c e . I t was c r u s h e d and t h e n f l u s h e d t o a
dewate r ing b i n f o r t r a n s p o r t a t i o n . Bottom a s h was sampled
d i r e c t l y from t r u c k s w h i l e b e i n g loaded from t h e bot tom a s h
b i n . T h i s a s h was p redominan t ly sand i n s i z e , w i t h v e r y few
g r a v e l - s i z e d p a r t i c l e s . Bottom a s h and f l y a s h were t r u c k e d
s e p a r a t e l y t o a n ' o l d q u a r r y where t h e y were mixed t o g e t h e r .
The a c c e s s t o t h e q u a r r y is good.
P e r r y Ash
T h i s a s h o r i g i n a t e d from t h e C. C . P e r r y S t a t i o n ( S e c t i o n
K ) of I n d i a n a p o l i s Power and L i g h t Co. ( I P L ) i n downtown
I n d i a n a p o l i s . T h i s s t a t i o n was sampled t h r e e t i m e s i n 1 9 8 7 ,

1988, and 1989, respectively. Each time the station was
sampled, it was burning different sources of coal. Bottom ash
here was produced in stoker furnaces and temporarily stored in
silos before it was trucked to a landfill. The ash was
sampled from a port underneath the ash hopper. Hence, this
was the only ash sampled that had never been washed by water.
Bottom ash and fly ash were stored separately in silos at the
station, but subsequently they are comined at the landfill
several miles away. Access to the landfill is good.
The physical characteristics of Perry ash were quite
different from the other dry bottom ashes. This ash had so
low a specific gravity that some particles floated in water.
Ash particles were light weight, highly porous, and appeared
red to brown in color, with a popcorn-like surface texture.
Some particles were very friable, and crushing of these
particles with fingers was easily accomplished.
Stout Ash
The E. W. Stout Station of IPL was the source of this
bottom ash. The coal burned was a mixture of several Illinois
Basin bituminous coals from southern Indiana. The bottom ash
was stockpiled with fly ash in the lagoon. Two wet bottom and
three dry bottom furnaces contributed ash to the ash pond.
The overall appearance of the ash was of a dull nature with a
gray color. The ash sample was obtained near the outlet where
a significant amount of coarse ash had accumulated. The

access t o t h e a s h lagoon is f a i r l y good. The a s h was n o t
b e i n g marketed a t t h e t i m e of sampl ing .
F l y Ash
F ly a s h was a l s o o b t a i n e d from f o u r s o u r c e s , namely,
Gibson, S c h a h f e r U n i t 1 4 , S c h a h f e r U n i t 1 7 , and P e r r y , when
t h e t h i r d bot tom a s h sample was t a k e n from e a c h o f t h e f o u r
s o u r c e s i n s p r i n g 1989. Most of t h e f l y a s h e s were c l a s s i f i e d
a s C l a s s F. Only f l y a s h from S c h a h f e r U n i t 1 7 was a n ASTM
C l a s s C m a t e r i a l .
F ly a s h e s were sampled from t h e f l y a s h t r a n s f e r l i n e a t
Gibson and S c h a h f e r s t a t i o n s . P e r r y f l y a s h was o b t a i n e d from
p i p e c o n n e c t i n g t o t h e t empera ry s t o r a g e s i l o . Some index
p r o p e r t i e s of t h e s e f l y a s h e s a r e summarized i n T a b l e 2 2 . The
m o i s t u r e - d e n s i t y r e l a t i o n s of f l y a s h e s a r e p r e s e n t e d i n
Appendix C .
Tab le 2 2 . Index p r o p e r t i e s of s e l e c t e d f l y a s h e s
P r o p e r t y Gibson Schahf e r Schahf e r U n i t 1 4 U n i t 1 7
S p e c i f i c g r a v i t y 2.394 2.850 2.502
P l a s t i c i t y Index N P ~ NP NP
P e r c e n t r e t a i n e d on No. 200 s i e v e 9 . 4 1 4 . 9
a ASTM ~ e s i g n a t i o n C 618 [ I411 Denotes n o n - p l a s t i c

LABORATORY TESTING PROGRAM
Introduction
The experimental program of this study consisted
essentially of a laboratory investigation aimed at testing
bottom ash samples by standard as well as nonstandard methods.
The objective of the laboratory testing program was to
evaluate bottom ash both as a soil material and as an
aggregate for highway construction, viz., highway embankments,
subgrades, subbases, and bases.
This chapter primarily describes the experimental methods
or procedures used in the course of the laboratory
investigations. Some of the methods used were the standard
ASTM or AASHTO tests. For such methods, the ASTM or AASHTO
Designation is given and only a brief description of the
procedures is provided. In cases where nonstandard testing
procedures were used, a more detailed description of the
procedures is presented.
A large number of diverse laboratory measurements were
performed to develop an overall profile of the characteristics
of each bottom ash. The laboratory testing program was
implemented in three phases. The first phase was to conduct
a characterization analysis of the ash materials. A means of

classifying these materials is desirable since ash varies so
greatly from source to source. The second phase consisted of
testing the bottom ash materials for their geotechnical
properties. Since time would not allow testing each ash
source for its geotechnical properties, only selected bottom
ashes were subject to the second phase testing. The third
phase of the testing program was a laboratory evaluation of
potential environmental effects of bottom ash utilization.
This involved laboratory leaching tests and chemical analysis
of the leachates.
Two replicate tests were performed throughout the course
of the testing program to verify reproducibility. In case
significant disagreements existed between the two consecutive
test results, additional replicates were performed. The
material behavior during the preparation and testing operation
was critically observed as part of the laboratory studies. It
was believed that these observations would assist ,the
appropriate interpretation of the test results obtained on
bottom ashes.
Ash Characterization Tests
Chemical Analysis
The chemical analysis of bottom ashes was performed
, primarily by means of atomic absorption spectrophotometric
methods (Varian SpectrM-20). All bottom ashes were analyzed

for a total of eight elements. Among these, iron, sodium, and
potassium were analyzed by the flame emission method; and the
analysis of aluminum, magnesium, silicon, and calcium was
performed by the atomic absorption method. Finally, in the
analysis of sulfur trioxide, procedures described in the ASTM
Designation C 311 [I421 were followed.
Procedures for chemical analysis of bottom ashes were
complicated by the difficulty in dissolving all ash particles.
The dissolution of ground bottom ash was by fusion with
lithium metaborate at 900'C in a gold crucible. The weight
ratio of the ignited ash to lithium metaborate in the fusion
was 1 to 10, and 5 ml lanthanum (0.36 M) was added to the
solution. The solution was then diluted to 250 ml, and the
resulting solution was used for elemental analysis.
The same dissolution technique was used in the analysis
of sulfur trioxide. In this case, the melt of ash and lithium
metaborate was filtered using a filter paper, and the filtrate
was slightly acidified with HC1. The 250 ml solution was
boiled and about 10 ml of hot barium chloride (BaClZ)
(100 g/liter) was added to the solution. After the solution
was digested overnight, the precipitate was filtered using a
ceramic filter. The ceramic filter was finally oven-dried to
determine the weight of the precipitate (barium sulfate) so
that the sulfur content could be determined.
Analyses for all of the eight elements were converted to
their equivalent oxides and expressed as weight percentages on

an oven-dried basis. The sum of these elemental percentages
should be equal or close to 100. This provided a good
indication of the overall validity of the analyses.
Loss on ~gnition
Theoretically, since all ash materials had undergone
furnace firing temperatures higher than 100O0C, all carbon and
organic matter in the coal should have been combusted.
However, not all power plant boilers are operated with such
efficiency. Also, if the ash had been ponded or stockpiled
for some time, it could have been contaminated with various
foreign materials. Therefore, it is customary to determine
the loss on ignition of ash materials. This is determined by
the weight loss on heating the ash material from 110°C to
600°C, and is usually expressed as a percentage of the oven-
dried weight.
About 20 grams of oven-dried specimen were ground up in
a grinder (Brinkman Retsch Co. ) , with a 0.5pm sieve. A sample
splitter was used in deriving the 20-g sample out of a sample
of about 2 kgs. Next, approximately one gram of the ground
specimens was ignited in uncovered porcelain crucibles at
600°C. A muffle furnace (Thermolyne 2000) capable of
generating a maximum temperature of 1,10O0C was used in the
test.

Microscopic Examination
This was performed by use of the Stereozoom microscope
manufactured by Bausch & Lomb Inc. The microscope was also
equipped with a 3-1/4 in. x 4-1/4 in. camera.
Photomicrographs were taken at a magnification of 30, using
Polaroid type 107 film (black and white). All bottom ashes
were subjected to microscopic examination in order to
characterize particle shape, angularity, and surface texture
of ash materials. For comparison purposes, standard Ottawa
sand was also microscopically examined.
X-Ray Diffraction
X-ray diffraction analyses were conducted by use of a
Siemens D-500 diffractometer using copper radiation. All
specimens were ground prior to analysis by the grinder
previously described. The diffraction was performed over a
range of 2 8 angles from about 10 to 65 degrees, at a speed of
2 degrees/min. The standard X-ray diffraction patterns
published by the Joint Committee on Powder Diffraction
Standards (JCPDS) [I431 were used in the identification of
crystalline substances.
Grain Size Distr ibut ion
The gradations of bottom ash specimens were determined by
the ASTM Designation C 136, which is designed for aggregates.

The dry sieve analysis was carried out using a Ro-Tap Testing
Sieve Shaker (Tyler Co.). All sieves were U.S. Standard
Sieves conforming to ASTM E 11 specifications [144]. Since
all bottom ashes have less than 12 percent fines, the washing
test, or ASTM C 117, was judged to be unnecessary.
Specific Gravity
The specific gravities of bottom ashes were determined
using three different methods. The first two methods were
standard ASTM tests, namely, C 128 and D 854 designed for
aggregates and soils, respectively. The third method was
performed by use of a gas pycnometer.
In the application of these two standard methods to
bottom ashes, the difference existed in the techniques used to
remove the entrapped air in the pycnometer. The former method
eliminated air bubbles by agitating, rolling, and inverting
the pycnometer, whereas boiling of the contents in the
pycnometer was used in the latter method.
The gas pycnometer method was conducted in a two-chamber
device [140]. The volume of gas in the sample chamber is
inferred by a measurement of the pressure drop on opening the
valve connecting the two chambers of known volume. By use of
the Boyle's Law PIV1 = P2V2, the initial volume of the gas in
the sample chamber can be calculated, from which the volume of
the sample is derived.

The reason f o r d e t e r m i n i n g t h e s p e c i f i c g r a v i t y by
s e v e r a l d i f f e r e n t methods was t o a t t e m p t t o u n d e r s t a n d t h e
d i f f e r i n g s t r u c t u r e of d i f f e r e n t bottom a s h e s which would
cause v a r i a t i o n s among t h e r e s u l t s o b t a i n e d from t h e s e v e r a l
methods.
Aqqreqate T e s t s
Los Angeles ~ b r a s l o n
The a b r a s i o n r e s i s t a n c e of bot tom a s h was t e s t e d by t h e
s t a n d a r d Los Angeles a b r a s i o n t e s t , a s d e s c r i b e d i n ASTM C
1 3 1 . The p e r c e n t wears a t 100 r e v o l u t i o n s and 5 0 0 r e v o l u t i o n s
were both r e p o r t e d , t o de te rmine t h e u n i f o r m i t y of t h e sample
under t e s t . The g r a d i n g s used i n t h e t e s t were s e l e c t e d t o
r e p r e s e n t t h e most predominant s i z e r ange i n t h e m a t e r i a l s a s
sampled. A l l specimens were p r e p a r e d by washing and oven-
d r y i n g .
S u l f a t e Soundness
The soundness of bottom a s h specimens were de te rmined by
t h e sodium s u l f a t e soundness t e s t which was performed i n
accordance w i t h ASTM Des igna t ion C 88 . Due t o t h e l i m i t e d
amounts of c o a r s e f r a c t i o n , o n l y t h e f i n e a g g r e g a t e t e s t u s i n g
t h e m a t e r i a l p a s s i n g t h e 3/8-in. s i e v e was performed. The
weighted l o s s e s a f t e r f i v e c y c l e s of immersion and oven-drying
were de te rmined .

Geotechn ica l P rope r tv T e s t s
Maximum and Minimum D e n s i t i e s
The maximum d e n s i t y o f s e l e c t e d bottom a s h e s was
determined i n a 4 i n . -d iameter mold by u s i n g a v e r t i c a l l y
v i b r a t i n g t a b l e . The t e s t was performed i n accordance w i t h
t h e Dry Method s p e c i f i e d i n ASTM Des igna t ion D 4253. A s -
sampled g r a d a t i o n was used , excep t t h a t t h e o v e r s i z e d f r a c t i o n
was s c a l p e d by s c r e e n i n g th rough a 3 / 4 i n . s i e v e .
The minimum d e n s i t y t e s t was performed u s i n g a s t a n d a r d
compaction mold ( 4 i n . i n d i ame te r ) f o l l owing t h e p rocedu re s
d e s c r i b e d i n Method B ( t u b e method) of ASTM Des igna t i on
D 4254. The th in -wal led t u b e h a s a 2.8 i n . i n s i d e d i a m e t e r ,
and t h e t e s t i n g m a t e r i a l was p l a c e d i n t h e t u b e w i t h a scoop .
A s i n t h e maximum d e n s i t y t e s t , o v e r s i z e d p a r t i c l e s were
s ca lped p r i o r t o t e s t i n g . ~ a x i m u m and minimum v o i d r a t i o s
were c a l c u l a t e d acco rd ing t o ASTM D 4254 method.
P e r m e a b i l i t y
The c o e f f i c i e n t of p e r m e a b i l i t y of bottom a s h e s was
measured by f a l l i n g head p e r m e a b i l i t y t e s t s . The permeameter
was r i g i d - w a l l e d and had a 4 i n . ( 1 0 c m ) d i a m e t e r . A l l
specimens w e r e abou t 8 i n . ( 2 0 c m ) h i gh and w e r e s a t u r a t e d f o r
2 4 hours b e f o r e t h e t e s t was performed. Ash m a t e r i a l s were
compacted a t s t a n d a r d e f f o r t (ASTM D 698) and t h e n p l a c e d i n
t h e permeameter a t 95 p e r c e n t maximum d r y d e n s i t y u s i n g a

vibratory table. This was intended to determine the
permeability of ash in its compacted condition, because bottom
ash will always be well compacted for all highway
applications.
Angle of Shearing Resistance
The angle of shearing resistance of bottom ash was
determined by direct shear tests. ~he.direct shear box had a
diameter of 2.5 in. (64 mm) and a height of 1.5 in. (38 mm).
Only materials finer than 3/8 in. (3.6 mm) were used in the
test. The test was conducted on bottom ash at numerous
relative densities, varying from very loose to very dense
states. The normal stress used in the test ranged from about
5 psi (34 kPa) to 33 psi (240 kPa).
Compaction
The standard Proctor test, as described in the ASTM
Designation D 698, was performed on selected bottom ashes to
establish the moisture density relations in ash materials.
Method C in the ASTM D 698 procedure, utilizing materials
passing the 3/4 in. sieve, was adopted throughout the study.
At each moisture content, fresh materials were used for the
compaction test.
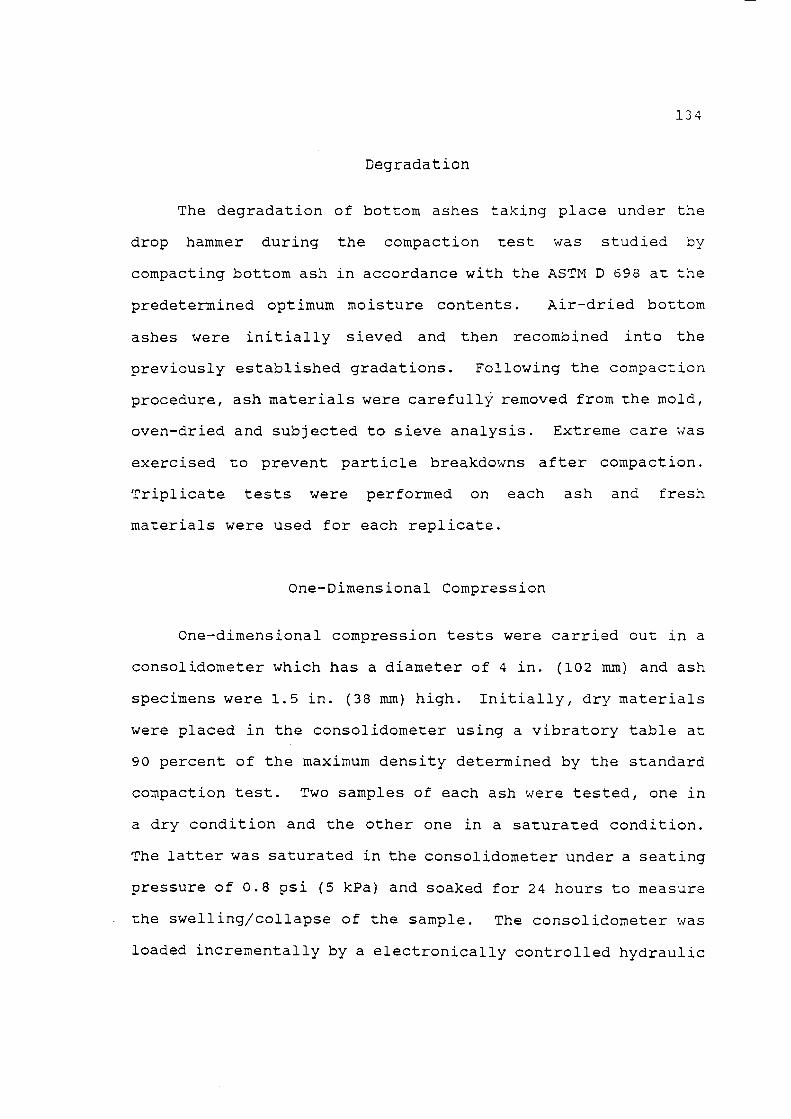
Degradation
The degradation of bottom ashes taking place under the
drop hammer during the compaction test was studied by
compacting bottom ash in accordance with the ASTM D 698 at the
predetermined optimum moisture contents. Air-dried bottom
ashes were initially sieved and then recombined into the
previously established gradations. Following the compaction
procedure, ash materials were carefully removed from the mold,
oven-dried and subjected to sieve analysis. Extreme care was
exercised to prevent particle breakdowns after compaction.
Triplicate tests were performed on each ash and fresh
materials were used for each replicate.
One-Dimensional Compression
One-dimensional compression tests were carried out in a
consolidometer which has a diameter of 4 in. (102 mm) and ash
specimens were 1.5 in. (38 mm) high. Initially, dry materials
were placed in the consolidometer using a vibratory table at
90 percent of the maximum density determined by the standard
compaction test. Two samples of each ash were tested, one in
a dry condition and the other one in a saturated condition.
The latter was saturated in the consolidometer under a seating
pressure of 0.8 psi (5 kPa) and soaked for 24 hours to measure
. the swelling/collapse of the sample. The consolidometer was
loaded incrementally by a electronically controlled hydraulic

l o a d i n g sys tem. Immediate measurements of d e f o r m a t i o n were
made a t 1 minute a f t e r t h e a p p l i c a t i o n of each l o a d . F i n a l l y ,
t h e specimens were main ta ined under maximum s t r e s s u n t i l no
f u r t h e r de fo rmat ion was obse rved . A maximum s t r e s s of 1 5 0 p s i
(1000 kPa) was used i n t h e t e s t .
C a l i f o r n i a Bear ing R a t i o ( C B R )
S e l e c t e d bottom a s h e s were s u b j e c t e d t o t h e C a l i f o r n i a
Bear ing R a t i o t e s t f o l l o w i n g a n improved p r o c e d u r e proposed by
Franco and Lee (1451. I n t h i s t e s t , t h e a s h m a t e r i a l s were
d r i e d and p r e t r e a t e d f o r compaction p e r ASTM D 6 9 8 . Water was
added t o t h e a s h sample t o p r e p a r e t h r e e specimens such t h a t
t h e m o i s t u r e c o n t e n t s ranged around t h e optimum m o i s t u r e
c o n t e n t . Each specimen was t h a n compacted a c c o r d i n g t o Method
D o f ASTM D 698 . The compacted a s h i n t h e mold was trimmed
l e v e l w i t h t h e t o p s u r f a c e and t h e specimen was weighed t o
d e t e r m i n e w e t d e n s i t y and f i n a l l y d r y d e n s i t y .
The CBR o f each a s h t e s t e d was o b t a i n e d f o r t h e a s -
compacted and t h e soaked c o n d i t i o n . For t h e d r y c o n d i t i o n ,
t h e p e n e t r a t i o n t e s t was performed immedia te ly a f t e r t h e
compaction. For t h e soaked c o n d i t i o n , t h e s o a k i n g p r o c e d u r e
of ASTM D 1883 was fo l lowed . A f t e r t h e p e r c e n t s w e l l had been
de te rmined , t h e p e n e t r a t i o n t e s t was performed on t h e soaked
a s h . The s u r c h a r g e s used d u r i n g t h e s o a k i n g p e r i o d and t h e
. p e n e t r a t i o n were b o t h 1 0 l b s . The c o r r e c t i o n of l o a d -

penetration curves was carried out following the correction
procedure of ASTM D 1883.
stabilization
Three bottom ashes were selected for this phase of the
experimental program because they were stored separately from
fly ash at their source power plants. Bottom ashes from
Gibson, Schahfer Unit 14, and Schahfer Unit 17 were used as
the aggregate portion of two categories of mixtures.
The first category of mixtures was prepared using bottom
and fly ashes from the same source. The bottom ash-fly ash
proportions by weight considered in the mixtures were 90-10,
80-20, 70-30, and 60-40. The standard Proctor compaction test
(ASTM D 698) was performed on the mixtures as well as fly ash
alone to establish the moisture-density relations in these
materials. Bottom ashes were initially sieved and fractioned
into various sizes and then recombined into the gradations
established earlier. After compaction, the materials were
subjected to degradation analysis as previously described.
The second category of mixtures encompassed cement
stabilized bottom ashes and bottom ash-fly ash combinations.
The selection of bottom ash-fly ash proportions was based on
the maximum dry density obtained from the first category of
mixtures. The cement contents were selected arbitrarily at 6
and 10 percent by weight of the mixture. Accordingly, the fly
ash contents were reduced in such a manner that the volume of
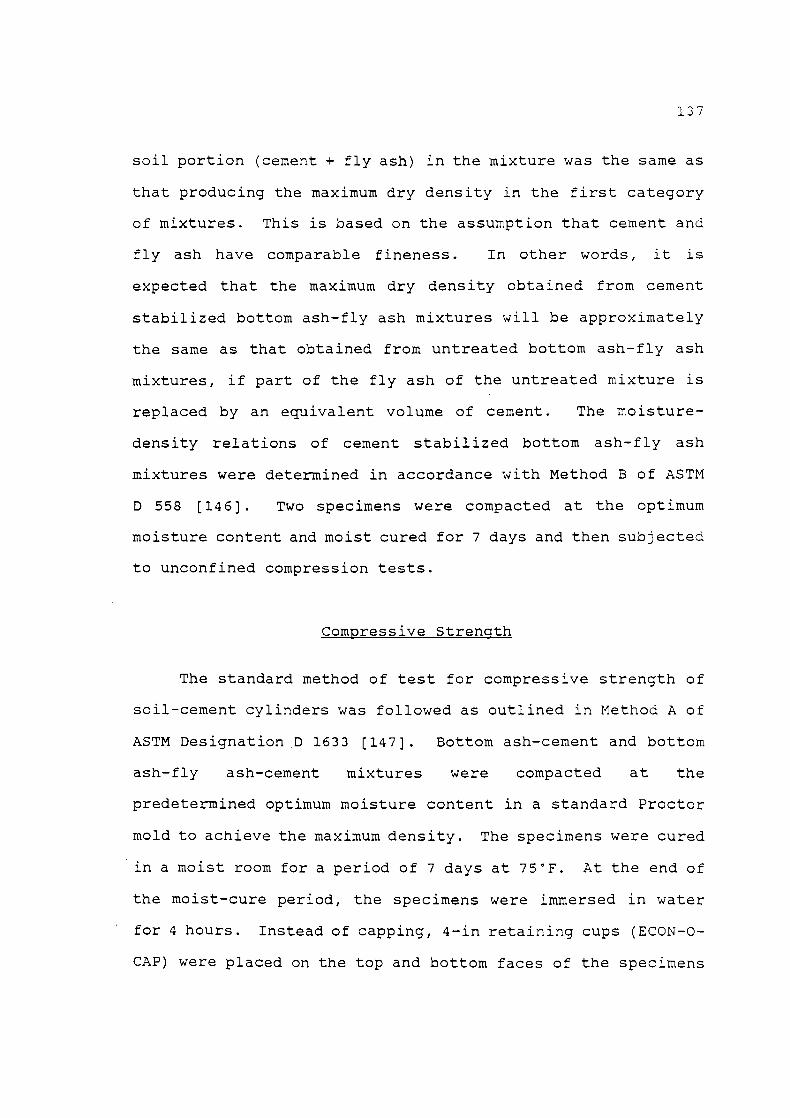
soil portion (cement + fly ash) in the mixture was the same as
that producing the maximum dry density in the first category
of mixtures. This is based on the assumption that cement and
fly ash have comparable fineness. In other words, it is
expected that the maximum dry density obtained from cement
stabilized bottom ash-fly ash mixtures will be approximately
the same as that obtained from untreated bottom ash-fly ash
mixtures, if part of the fly ash of the untreated mixture is
replaced by an equivalent volume of cement. The moisture-
density relations of cement stabilized bottom ash-fly ash
mixtures were determined in accordance with Method B of ASTM
D 558 [146]. Two specimens were compacted at the optimum
moisture content and moist cured for 7 days and then subjected
to unconfined compression tests.
Compressive Strencrth
The standard method of test for compressive strength of
soil-cement cylinders was followed as outlined in Method A of
ASTM Designation ,D 1633 [147]. Bottom ash-cement and bottom
ash-fly ash-cement mixtures were compacted at the
predetermined optimum moisture content in a standard Proctor
mold to achieve the maximum density. The specimens were cured
in a moist room for a period of 7 days at 75°F. At the end of
the moist-cure period, the specimens were immersed in water
' for 4 hours. Instead of capping, 4-in retaining cups (ECON-0-
CAP) were placed on the top and bottom faces of the specimens

f o r compression t e s t i n g . The compression l o a d was a p p l i e d a t
a r a t e of 0 .05 in/min. The maximum load reached du r ing t h e
compression was recorded , and t h e u n i t compression s t r e n g t h
was c a l c u l a t e d by d i v i d i n g t h e maximum load by t h e i n i t i a l
c r o s s - s e c t i o n a l a r e a of t h e specimens.
Leachinq T e s t s
E x t r a c t i o n Procedure (EP) T o x i c i t y
The EP t o x i c i t y t e s t s were performed on s e l e c t e d bottom
a shes i n accordance w i th t h e EPA Method 1 3 1 0 , a s s p e c i f i e d i n
EPA SW-846: "Test Methods f o r Eva lua t i ng S o l i d Waste,
Physical /Chemical Methods, Th i rd E d i t i o n [I171 . A sample
s i z e of 100 gm was used f o r a l l t h e a shes t e s t e d . Coarse
p a r t i c l e s w e r e broken down s o t h a t t h e y would p a s s t h e 3/8 i n .
s i e v e . Next, 1600 g m o f de ion i zed wa te r was added t o t h e a sh
and t h e ash-water mix ture was a g i t a t e d i n a p l e x i g l a s s
c o n t a i n e r . The pH of t h e s o i l - w a t e r mix ture was monitored by
u s ing a g l a s s e l e c t r o d e pH mete r . I t was main ta ined a t
5.020.2 th roughout t h e 24-hour e x t r a c t i o n p e r i o d , u s ing a c e t i c
a c i d . A t t h e end of t h e e x t r a c t i o n , t h e wa te r : a sh
( 1 i q u i d : s o l i d ) r a t i o was a d j u s t e d t o 20: 1. Then t h e mixed
s o l i d and e x t r a c t i o n l i q u i d were s e p a r a t e d by f i l t e r i n g t h e
mixture th rough a f i l t r a t i o n membrane having a nominal pore
s i z e of 0.45 micrometers . The s o l i d was d i s c a r d e d and t h e
l i q u i d o b t a i n e d from f i l t r a t i o n was t h e E P E x t r a c t which was

subsequently analyzed for eight trace metals. Generally, 5
ml/L concentrated nitric acid (HN03) was added to the solution
to preserve the extract.
Indiana Leaching Method
The Indiana leaching method test was conducted by the
method as specified for EP toxicity testing, except with no
addition of acetic acid. The pH of the extract was determined
at the end of the 24-hour extraction period.
Leachate Analysis
The extract obtained from the EP toxicity test was
analyzed by using the atomic absorption spectrophotometer
equipped with a graphite tube atomizer. The analytical
working range in the analysis for most elements was as low as
g/ml. Eight elements, namely, arsenic, barium, cadmium,
chromium, lead, mercury, selenium, and silver, were analyzed
using the appropriate test methods specified in EPA SW-846.
The extract produced from the Indiana leaching method
test was analyzed for barium, boron, chloride, total cyanide,
fluoride, pH, sodium, sulfate, total sulfide, and total
dissolved solids. Of these, the analyses for boron, chloride,
fluoride, sodium, sulfate, and total dissolved solids were
conducted as specified in "Methods for Chemical Analysis of
Water and Wastes," EPA 600/4-79-020 [148]; and total cyanide,

pH, and total sulfide were analyzed by methods specified in
EPA SW-846.
The analyses for boron, total cyanide, fluoride, and
total sulfide in the leachate were performed by the
Environmental Laboratory Division, Indiana State Board of
Health, Indianapolis, Indiana.
Radioactivity
For a chain of radioactive isotopes headed by a
relatively long lived parent, the amount of each chain member
will adjust until the sources and losses of each are in
balance. When the only source is an original amount of a
long-lived parent and the only losses are by the radioactive
decay of each member of the chain, the equilibrium reached is
one in which the activities of the long-lived parent and each
of its shorter lived daughters are equal. Thus, the
concentration of the long-lived parent can be determined by
counting the decay of its short-lived daughters.
If one starts from pure radium as the "long-lived"
parent, the time to attain 99% of the secular equilibrium of
the radium daughters is approximately 27 days. Therefore, in
this study, bottom ash samples were sealed in plastic
canisters for 30 days to allow the short-lived radium
daughters to reach equilibrium with radium. The canister had
a 7-cm diameter and a height of 1.5 cm. After the 30-day
storage, detection of radium was accomplished by counting

gamma rays emitted by its short-lived daughters in secular
equilibrium with radium. Counting was carried out with a
sodium iodine (NaI) detector connected to a multichannel
analyzer (CANBERRA, Series 85). The window of the analyzer
was set to count gamma rays between 270 to 720 keV. This
range covered the Pb-214 peaks and the Bi-214 peak, both are
daughters of radium-226. All counting lasted for one hour.
A standard canister of fly ash obtained from the National
Bureau of Standards (NBS) was tested to provide a scale of the
activity. This standard material (ID No. INJNS 8991) is
reported to have 203 pCi radium. The background of the
detector was obtained by counting a blank canister. Also, for
comparison purposes, a soil obtained from the Agronomy farm at
Purdue University, West Lafayette, Indiana, was tested. The
soil was a clay with a liquid limit of 40.5% and a plasticity
index of 21.2%.
The radium activity in each bottom ash sample was
determined using the following formula:
N e t C o u n t ( b o t t o m a s h ) ~ ~ t i ~ i ty of s t a n d a r d Accivi ty (pci ) = N e t c o u n t ( s t a n d a r d )
where Net count = gross count - background count, and Activity of standard material = 203 pCi.

' b / ~ 3 d U T q s e moqqoq 20 A ~ T A T ~ ~ P 3 ~ ~ ~ 3 a d s mnTpel
aqq uKeqqo oq x a q s ~ u e 3 aqq u~ qse moqqoq aqq 20 q q b ~ a m aqq Aq
papTATp uaqq s e n eTnuog s?yq Aq pauTuuaqap A ~ T A T ~ ~ P ayL

RESULTS AND DISCUSSION
As described in the foregoing sections, the laboratory
experimental program consisted of a series of physical,
chemical, and engineering property tests as well as leaching
tests and leachate analysis. In the following sections, the
results of these tests will be presented and discussed.
Shape and Surface Texture
In order to characterize the particle shape and surface
texture of bottom ashes, and to gain some insight to the
behavior of ash materials during the following testing
operations, a microscopic examination was conducted on bottom
ashes. Figures 18 through 28 are photomicrographs of all the
ash materials studied. For purpose of comparison, Figure 29
shows the shape and surface characteristics of a standard 20-
30 Ottawa sand. These photomicrographs were taken at a
magnification of 40 to permit observation of the features of
a number of particles at one time. It can be seen from the
photomicrographs that the shape and surface characteristics of
the ashes show some variation from plant to plant due to
differences in coal type, burning processes, and different
collection and handling methods used.

yse LT: qrun zagqeqas go q d e z b o z ~ r ~ ' 6 1 a lnb rd
y se moqqoq qaM p ~ : qTun zagqeqDS go q d e z b o z x ~ - 8 1 a z n b ~ ~

-. . - - -. . .. .
Figu re 2 0 . Micrograph of itche ell a s h
F igu re 2 1 . Micrograph of Gibson a s h

Figure 22. Micrograph of Gallagher ash
. ... - -
Figure 23. Micrograph of Wabash ash

. --. - -. . -
Figure 24. Micrograph of Brown ash
Figure 2 5 . Micrograph of Culley ash

. . . . . - -. - - - - - . - - - - --. . . - - -. .
Figure 26. Micrograph of Richmond ash
Figure 27. Micrograph of Perry ash

-- -
Figure 2 8 . Micrograph of Stout ash
Figure 2 9 . Micrograph of standard Ottawa sand

The majority of wet bottom ash particles were angular to
subangular in shape and had a smooth surface texture. Also
present was a small amount of rod-shaped particles, one of
which is shown in Figure 18. Most of the particles featured
fractured faces, which made wet bottom ash much like crushed
glass. Some of the larger particles exhibited somewhat porous
surface textures. The surfaces of the particles were quite
clean and free of dust.
In general, the dry bottom ashes had quite angular
particles, and a highly porous surface texture was observed
even in fine ash particles. Particles resembling wet bottom
ash were occasionally found, especially in the smaller sizes.
It was also observed that dry bottom ashes were both
externally and internally porous, resulting in an irregular
particle shape and rough, gritty surface texture. They were
usually light grey to black in color. The surfaces of the
bottom ash particles were essentially free of dust, but some
fly ash particles were observed to be loosely held to the
surfaces of larger particles.
Perry ash, produced from stoker-firing furnaces, showed
distinctively different features from the other dry bottom
ashes. It appeared to have an extremely porous structure, and
appreciable quantities of popcorn-like particles were
identified in this ash. Furthermore, the internal porosity of
many of the large particles were so high that it caused weak
planes in the particle structure. Hence crushing of these

larger particles can be accomplished with fingers. Perry ash
was red to brown in color. Some particles in the Stout ash
exhibited green to yellowish color, which is an indication of
pyrite particles.
In summary, the ashes that resulted from burning
pulverized coal in dry bottom furnaces were similar, in terms
of the shape and surface texture. The ash produced from
stoker-firing furnaces was extremely porous and had low
resistance to breaking with the fingers. Wet bottom ash
exhibited distinctly different shape and surface
characteristics than dry bottom ash. Although only one wet
bottom ash was examined in this study, the observation was
consistent with that reported by other researchers [3,4,38].
Mineralosical Analysis
X-ray diffraction analysis is the most powerful and
probably the only tool for direct identification and
determination of constituent minerals. It is known that the
chemical constituents of ash material may exist in either
crystalline form or as a glass. Figures 30 and 3 1 show the
typical X-ray diffraction patterns for dry and wet bottom
ashes, respectively. The crystalline contents of dry bottom
ash are characterized by the angles of 20 of the peaks. In
contrast, the X-ray diffraction pattern for wet bottom ash
shows no pronounced peaks (Fig. 31) . In other words, the
chemical constituents of wet bottom ash simply exist as a


glass, which indeed is suggested by the physical appearance of
this type of ash.
In addition, the glass is indicated by a broad band of
intensity that shifts the background upward over a range of 20
angles. The relative intensity of the peaks and the glass
band can be used as a measure of the relative amount of
crystalline substances and glass, respectively, present in the
ash. Furthermore, the angle 28 at which the maximum of the
glass band occurs provides an indication of the basic
structure of the glass. Table 23 tabulates the crystalline
compounds present in each ash. Crystalline compounds such as
quartz (Si02) and hematite (Fe203) are found in almost all dry
bottom ashes. Mullite (3A1203* 2Si02) and magnetite (Fe30,) are
also frequently found in dry bottom ash. Pyrite (FeSZ) was
identified in two ash samples, one in significant content
(Stout) and the other one in a minute amount only (Mitchell).
characteristics of the glass present in bottom ash vary
considerably. Interpretation of the glass band for bottom
ashes is summarized in Table 24 [140]. The X-ray diffraction
patterns for all bottom ashes studied are reproduced in
Appendix A.
Chemical Analvsis
The chemical compositions of bottom ashes sampled at
different times, determined on an oven-dry weight basis, are
shown in Table 25. The principal ash constituents are silica

I l l l l X l l X I I I
l X X X X l X X X X X X
I % X X X X X X X X X 1

T a b l e 2 4 . G l a s s i n bot tom a s h
Ash G l a s s 2ea G l a s s Source c o n t e n t ( d e g r e e s ) s t r u c t u r e
S c h a h f e r U n i t 1 4 U n i t 1 7
M i t c h e l l Gibson G a l l a g h e r Wabash Brown C u l l e y Richmond P e r r y s t o u t b #1
# 2
v e r y h i g h low low
h i g h low low low
t r a c e h i g h
low - h i g h
27 s i l i c a 2 4 s i l i c a 2 4 s i l i c a 2 4 s i l i c a 3 1 c a l c i u m a l u m i n a t e 23 s i l i c a 2 5 s i l i c a 3 1 c a l c i u m a l u m i n a t e 2 4 s i l i c a 23 s i l i c a - ( l i t t l e o r no g l a s s )
2 4 s i l i c a
a Angle o f 2 9 f o r t h e maximum i n t e n s i t y o f t h e g l a s s band.
A second se t of d a t a a r e p r e s e n t e d o n l y i f t h e g l a s s of t h e two samples a r e d e t e r m i n e d t o b e d i f f e r e n t .

(SiOz), alumina (A120,), and iron oxide (Fe203). There are
smaller quantities of calcium oxide (CaO), magnesium oxide
(MgO) , potassium oxide (K20), sodium oxide (Na20) , and sulfur
trioxide (SO,), as well as minute traces of other elements.
As can be seen from Table 25, the chemical compositions of
each bottom ash show a reasonable degree of uniformity, except
those ashes from Perry and Richmond. These stations were
burning different sources of coal just prior to the dates of
sampling, and this is reflected by greater variations in the
chemical composition of the bottom ash. Stout ash also shows
significant variation in chemical composition, due to the
presence of pyrite particles in the first sample.
As expected, bottom ashes produced from western lignite
coal (Schahfer Unit 14 and itche ell) have higher calcium
content than those produced from eastern bituminous coal. The
first sample of Stout ash has an iron oxide content of as high
as 42 percent. The significant amount of pyrite particles, as
demonstrated by the X-ray diffraction analysis, accounts for
the unusual high iron content in this sample. The high
calcium contents (18% and 8%) are also accompanied by higher
magnesium contents. However, the reported calcium content of
fly ashes from the same sources were well over 30 percent
[140]. In other words, calcium is partitioned preferably in
fly ash rather than in bottom ash.
The loss on ignition values represent the unburned carbon
content in the ash samples. Again, an extremely high value

T a b l e 25. Chemica l c o m p o s i t i o n o f I n d i a n a b o t t o m a s h e s
P e r c e n t b y w e i g h t
Ash s o u r c e
Date SiO, FezO3 A120, CaO MgO K 2 0 Na20 SO, L o s s o n s a m p l e d i g n i t i o n
S c h a h f e r U n i t 14
S c h a h f er U n i t 1 7
G i b s o n
G a l l a g h e r
M i t c h e l l
Wabash
a P l a n t s were b u r n i n g d i f f e r e n t s o u r c e s o f c o a l p r i o r t o t h e d a t e s o f s a m p l i n g

Table 25. (cont inued)
Percent by weight
Ash source
Date SiO, Fe203 A1203 CaO MgO K 2 0 Na20 SO, Loss on sampled i g n i t i o n
C u l l e y 8-21-87 35.6 30.1 11.7 14.6 0.8 1.4 0.3 1.0 0.0 5-14-88 31.0 31.1 11.8 13.9 1.1 0.5 0.2 0.9 0.3
Brown 8-21-87 48.1 27.6 13.4 3.1 0.8 2.1 0.3 1.7 1.9 5-17-88 38.5 38.0 12.6 3.8 0.7 1.3 0.2 3.3 1.1
Average
Typ ica l range f o r ashb 20-60 5-35 10-35 1-20 0.3-4 1-4' 0-12 -
From S e l v i g and ~ i b s o n 1541 and Abernethy, e t a l . [55] Range f o r t h e sum o f K 2 0 and Na20

was found for the first sample of Stout ash, due to the
presence of pyrite particles in the sample. The same reason
may also explain the rather high values reported on Mitchell
ashes. Considering the stoker furnace used at Perry station,
the relatively high loss on ignition values are expected for
this type of ash.
For comparison purposes, the results of chemical analysis
reported by other investigators [3,42,54,55] are shown at the
bottom of Table 25. In general, Indiana bottom ashes are
reasonably typical in chemical composition, except the high
content of iron in Stout ash. The ranges in contents and
associated averages for each constituent in Indiana bottom
ashes are presented graphically in Figure 32.
Grain Size Distribution
The results of the gradation analyses obtained by dry
sieving each of the bottom ashes sampled at different times
are presented graphically in Figures 33 through 43. As can be
seen in these figures, dry bottom ash and wet bottom boiler
slag have quite different gradation characteristics. Dry
bottom ashes (Figures 34 through 43) exhibit well-graded size
distribution ranging from fine gravel to fine sand sizes,
whereas the gradation of the wet bottom ash (Figure 33) is
quite uniform with a majority of the sizes occurring in a
narrow range between the No. 8 and No. 30 sieves. The
coefficient of uniformity (Cu) for bottom ashes range from 8

Const i tuent
Figure 32. Variation in chemical constituents of bottom ash


to 50, while that for wet bottom ash is about 3. Table 26
summarizes the coefficient of uniformity and the coefficient
of curvature (C,) for all the bottom ashes studied, along with
the resulting classification based on the Unified Soil
classification System (USCS). Of the 11 bottom ashes studied,
ten (10) are classified as sand and the other one as gravel.
The wet bottom ash is found to be poorly graded because of its
low coefficient of uniformity. Richmond ash is also
classified as poorly graded, due to the low value of the
coefficient of curvature. Classification of bottom ashes by
the AASHTO system [149] is presented in Table 27. All bottom
ashes fall in the A-1 group, with 7 ashes classified as A-1-a
and the remaining four as A-1-b.
The fine portions passing the No. 200 sieve for dry
bottom ashes range from 0 to 12 percent, with an average of
4.4 percent. The wet bottom ash is essentially free of fines.
Attempts were made to perform the Atterburg limits tests on
the fines passing the No. 200 sieve. However, it was not
possible to establish either a liquid limit or a plastic limit
for the bottom ashes. Therefore, the fines present in bottom
ashes are non-plastic.
The gradation curves for bottom ashes sampled at
different times provide an indication of the potential
variability in the gradation. Generally, lesser variations
are found in bottom ashes which were handled and stored
separately from fly ash. For power plants where bottom and

Table 26. Unified soil classification of bottom ashes
Ash First Second First Second USCSC Source sample sample sample sample Classification
Schahfer Unit 1 4 ~ Unit 17
Mitchell Gibson Gallagher Wabash Brown Culley Richmond Perry Stout
a Coefficient of uniformity = C6,/Cl0
Coef Picient of curvature = c3,'/ (c,; C,,)
Unified Soil Classification System Wet bottom ash

Table 27 . AASHTO classification of bottom ashesa
Percent passing Ash AASHTO
source No. l o b No. 40' No. 200d Classification
Schahfer Unit 14 Unit 1 7
Mitchell Gibson Gallagher Wabash Brown Culley Richmond Perry Stout
a All values reported are the average from two samples 2.00 mm
' 0.425 mm 0.075 mm

f l y a she s w e r e mixed i n t h e s t o r a g e , t h e v a r i a t i o n s i n t h e
g r a d a t i o n t end t o be h ighe r . F i g u r e 4 4 i l l u s t r a t e s t h e range
of g r a d a t i o n f o r t h e 11 bottom a s h e s , a s w e l l a s f o r f l y a she s
from t h e same s o u r c e s , which was determined i n a p r e v i o u s
s t u d y [140] . The f i n e s i n bottom a s h e s a r e , i n f a c t , composed
of c o a r s e f l y a s h p a r t i c l e s .
Comparing t h e g r a d a t i o n s of bottom a s h w i t h t h e
s p e c i f i c a t i o n l i m i t s g i ven by t h e Ind i ana Department of
T r a n s p o r t a t i o n (Tab le 6 ) shows t h a t most d r y bottom a s h e s
would s a t i s f y t h e g r a d a t i o n s p e c i f i c a t i o n s f o r e i t h e r t h e 1
i n . o r 1 / 2 i n . t o p s i z e m a t e r i a l s . The w e t bottom a s h , be ing
t o o uniform and c o a r s e , f a l l s o u t s i d e t h e g r a d a t i o n
s p e c i f i c a t i o n s f o r ba se s and subbase s .
S p e c i f i c G r a v i t y
The s p e c i f i c g r a v i t y of bottom a s h , a s de te rmined by t h e
t e s t methods a p p l i c a b l e t o a g g r e g a t e s and s o i l s , a r e t a b u l a t e d
i n Table 28. A s can be s een from t h e Tab le , t h e s p e c i f i c
g r a v i t y o f bottom a shes r anges from 1 . 9 t o 3 .4 , which is much
wider t h a n t h a t f o r most s o i l s ( r a n g e s from 2 . 5 t o 2 .8 [ 7 4 ] ) . It i s known t h a t t h e s p e c i f i c g r a v i t y of bottom a s h is a
f u n c t i o n of i t s chemical compos i t ion . Thus, t h e h igh s p e c i f i c
g r a v i t y f o r S t o u t a sh i s exp l a ined by i ts ex t remely h i g h i r o n
c o n t e n t , which i n t u r n r e s u l t s from t h e l a r g e amount of p y r i t e
p a r t i c l e s p r e s e n t i n t h e f i r s t sample from S t o u t . A l so , t h e
h igh s p e c i f i c g r a v i t y ( 3 . 2 ) found on Cul ley a s h e s a r e no t


Table 2 8 . Apparent s p e c i f i c g r a v i t y of bottom a s h e s
ASTM C 1 2 8 a ASTM D 854b A s h
s ou rce lstC 2 ndd lstC 2 ndd
Schahf e r Uni t 1 4 Uni t 1 7
Mi t che l l Gibson Gal lagher Wabash Brown Cul ley Richmond Pe r ry S t o u t
a Standa rd t e s t method f o r s p e c i f i c g r a v i t y and a b s o r p t i o n o f f i n e a g g r e g a t e S tandard t e s t method f o r s p e c i f i c g r a v i t y of s o i l s The f i r s t sample from t h e s o u r c e The second sample from t h e sou rce

unreasonab le , c o n s i d e r i n g t h e h igh i r o n c o n t e n t i n t h e a s h ( 3 0
t o 3 1 % ) . O n t h e o t h e r hand, t h e low s p e c i f i c g r a v i t y v a l u e s
recorded f o r P e r r y a s h e s ( 1 . 9 t o 2 . 1 ) i n d i c a t e an a p p r e c i a b l e
c l o s e d o r i n a c c e s s i b l e p o r o s i t y i n t h i s a s h .
It shou ld be no ted from Tab le 28 t h a t , f o r most bottom
a s h e s , t h e s p e c i f i c g r a v i t y v a l u e s determined by t e s t methods
f o r s o i l s (ASTM D 854) a r e g r e a t e r t han t h o s e de te rmined by
t e s t method for a g g r e g a t e s (ASTM C 128) . The two t e s t methods
were c a r r i e d o u t i n t h e same pycnometer a p p a r a t u s , b u t
d i f f e r e d o n l y i n t h e t e c h n i q u e s used i n removing t h e e n t r a p p e d
a i r . The ASTM C 128 method removed a i r bubb l e s by a g i t a t i n g ,
r o l l i n g , and i n v e r t i n g t h e pycnometer, w h i l e b o i l i n g o f t h e
c o n t e n t s i n t h e pycnometer was used i n t h e ASTM D 854 method.
A comparison of t h e r e s u l t s i n d i c a t e s t h a t b o i l i n g is more
e f f e c t i v e i n removing t h e en t rapped a i r t h a n a g i t a t i n g .
Of g r e a t e r impor tance is t h e i m p l i c a t i o n t h a t bottom a s h
pos se s se s a complex s t r u c t u r e i n its pore sys tem. T h i s is
f u r t h e r demons t ra ted by comparing t h e r e s u l t s from t h e
p r ev ious two wa t e r pycnometer tes ts w i th t h e s p e c i f i c g r a v i t y
measured by t h e g a s pycnometer, as shown i n T a b l e 2 9 . The
v a l u e s o b t a i n e d from t h e g a s pycnometer a r e a lways g r e a t e r
t h a n t h o s e de te rmined by t h e wa t e r pycnometer t e s t s , because
some po re s o r v o i d s can be p e n e t r a t e d by g a s b u t n o t by w a t e r .
The re fo r e , t h e v a r i a t i o n s i n t h e s p e c i f i c g r a v i t y v a l u e s
recorded by d i f f e r e n t methods seem t o p rov ide a n i n d i c a t o r o f
t h e degree of complexi ty i n t h e po re s t r u c t u r e o f bottom
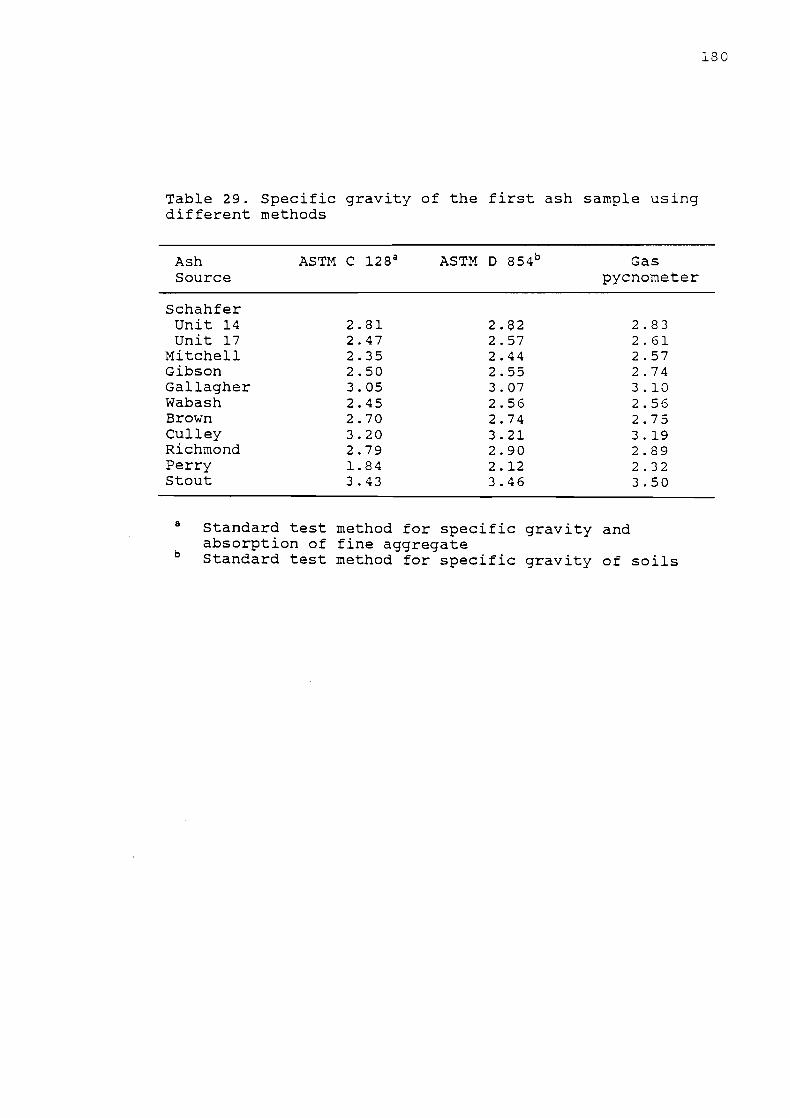
Table 2 9 . Specific gravity of the first ash sample using different methods
Ash ASTM C 1 2 8 a ASTM D 8 ~ 4 ~ Gas Source pycnometer
Schahfer Unit 1 4 2 . 8 1 2 . 8 2 2 . 8 3 Unit 1 7 2 . 4 7 2 . 5 7 2 . 6 1
Mitchell 2 . 3 5 2 . 4 4 2 . 5 7 Gibson 2 . 5 0 2 . 5 5 2 . 7 4 Gallagher 3 . 0 5 3 . 0 7 3 . 1 0 Wabash 2 . 4 5 2 . 5 6 2 . 5 6 Brown 2 . 7 0 2 . 7 4 2 . 7 5 Culley 3 . 2 0 3 . 2 1 3 . 1 9 Richmond 2 . 7 9 2 . 9 0 2 . 8 9 Perry 1 . 8 4 2 . 1 2 2 . 3 2 Stout 3 . 4 3 3 . 4 6 3 . 5 0
a Standard test method for specific gravity and absorption of fine aggregate Standard test method for specific gravity of soils

ashes . For example, t h e t h r e e s p e c i f i c g r a v i t y v a l u e s
r epo r t ed on Schahfer 1 4 a sh , which was determined t o be ha rd ,
dense , and wi th a g l a s s y s u r f a c e t e x t u r e , a g r e e ve ry w e l l . On
t h e o t h e r hand, Per ry ash , w i th an extremely porous t e x t u r e
and t h e p resence of popcorn l ike p a r t i c l e s , shows a s i g n i f i c a n t
v a r i a t i o n among t h e t h r e e s p e c i f i c g r a v i t y measurements.
Genera l ly , t h e more porous o r v e s i c u l a r an ash appea r s ,
t h e g r e a t e r t h e v a r i a t i o n i n t h e s p e c i f i c g r a v i t y determined
by d i f f e r e n t methods. I t is a l s o found t h a t low s p e c i f i c
g r a v i t i e s a r e always accompanied by g r e a t e r v a r i a t i o n s i n t h e
measurements. Thus, it is r ea sonab le t o s t a t e t h a t a low
s p e c i f i c g r a v i t y r e p r e s e n t s a h i g h l y porous o r v e s i c u l a r
t e x t u r e , which is t h e c h a r a c t e r i s t i c of popco rn l ike p a r t i c l e s .
S ince popcorn l ike p a r t i c l e s a r e r e a d i l y deg radab le under
l oad ing o r compaction, bottom a s h c o n t a i n i n g a l a r g e amount of
t h e s e p a r t i c l e s may be undes i r ab l e f o r eng inee r ing purposes .
Indeed, t h e r e s u l t s from t h e s p e c i f i c g r a v i t y t e s t s sugges t
t h a t t h e s p e c i f i c g r a v i t y of bottom ash may be used a s an
i n d i c a t o r of t h e m a t e r i a l q u a l i t y , a s proposed by Anderson,
e t . a l . [ 33 ] .
Soundness
Only f i n e aggrega te t e s t u s ing m a t e r i a l p a s s i n g t h e 3/8-
i n . s i e v e was performed. The f r a c t i o n of bottom a s h c o a r s e r
t h a n t h e 3/8-in. s i e v e is assumed t o have t h e same l o s s a s t h e
nex t s m a l l e r s i z e f o r which t e s t d a t a a r e a v a i l a b l e . The

sodium sulfate soundness losses on bottom ashes after five
cycles of soaking and drying are presented in Table 30.
The soundness loss for bottom ashes tested in the study
varies from 1.3 to 10.8 percent. As expected, the wet bottom
ash has the lowest sulfate soundness loss because of its
glassy surface texture and its low porosity. Significant
differences between the soundness losses of the coarse and
fine fractions of wet bottom ash have been reported in the
literature 133,381. Due to the lack of coarse particles in
the wet bottom ash studied, the comparison of the losses
between the coarse and fine fractions is not possible.
However, no noticeable difference on the soundness loss is
observed in the size range tested. In fact, there is no
evidence demonstrating the existence of residual stress in
particles of the wet bottom ash studied. This residual
stress, resulting from the quenching of the molten ash, has
been identified by researchers [30,33,38] as the cause of the
high soundness loss found on wet bottom ash.
The soundness losses for dry bottom ashes ranged from
about 2 to 6 percent except for Perry ash produced from stoker
furnaces. The presence of porous and popcornlike particles
has caused a significant increase in the soundness loss of
Perry ash (10.8 percent). On the basis of the specification
limits given by Indiana Department of Transportation [53] all
bottom ashes studied would be considered adequate for class A
subbase material.

Table 30. S u l f a t a soundness of bottom ashesa
Ash Source
- - -- -- -
sodium s u l f a t e soundness l o s s ( % ) b
Schahfer Unit 1 4 U n i t 17
Mi t che l l Gibson Gal l aghe r Wabash Brown Cul ley Richmond Perry S t o u t
Crushed l imestoneC 12.9 Natura l r i v e r aggregatec 10.3
INDOT s p e c i f i c a t i o n s Class C subbase ' 16.0 C la s s A subbase 12.0
a Fine agg rea t e t e s t on ly Weighted l o s s a f t e r 5 c y c l e s of soaking and d ry ing From Usmen [38 ]

The behav ior of bottom a shes du r ing t h e soundness t e s t
was c a r e f u l l y i n s p e c t e d t o g a i n i n s i g h t i n t o t h e n a t u r e of
d i s i n t e g r a t i o n o c c u r r i n g i n a s h p a r t i c l e s . I t was observed
t h a t a p p r e c i a b l e d r a i n a g e of t h e s u l f a t e s o l u t i o n from t h e
l a r g e p o r e s of t h e c o a r s e r p a r t i c l e s t a k e s p l a c e p r i o r t o t h e
placement o f t h e specimens i n t o oven f o r d r y i n g . T h i s h a s
g r e a t l y reduced t h e s a l t c r y s t a l l i z a t i o n i n a s h p a r t i c l e s
du r ing d r y i n g . Consequently, it was p o s s i b l e t o i d e n t i f y some
ve ry porous p a r t i c l e s which cou ld be c rushed w i th f i n g e r s
a f t e r f i v e c y c l e s of t h e soak ing and d r y i n g . I t is l i k e l y
t h a t t h e t e s t would p r e d i c t t h e f reeze- thaw d u r a b i l i t y of
bottom a shes . However, t h e s u l f a t e soundness t e s t is n o t
recommended t o d i s c r i m i n a t e among bottom a s h e s f o r q u a l i t y .
Los Anqeles Abrasion
The p e r c e n t wear v a l u e s determined by t h e Los Angeles
a b r a s i o n t e s t on bottom a shes a r e summarized i n Tab l e 3 1 . The
g r ad ings used f o r bottom a sh samples , a s shown i n t h e Tab l e ,
were s e l e c t e d t o r e p r e s e n t t h e p a r t i c l e s izes o c c u r r i n g i n t h e
l a r g e s t q u a n t i t i e s of t h e a shes . A s can b e s e e n from t h i s
Tab le , a l l a s h e s , b u t one, have Los Angeles a b r a s i o n v a l u e s
l e s s t h a n 50. The re fo r e , a l l of t h e bottom a s h e s s t u d i e d ,
excep t one , would m e e t t h e ASTM D 1241 and AASHTO M 1 4 7
s p e c i f i c a t i o n s f o r s o i l - a g g r e g a t e b a s e and subbase [ 5 0 ] . Some
samples have a b r a s i o n v a l u e s g r e a t e r t h a n 40 b u t less t h a n 4 5 .
Thus, most bottom a s h e s would meet t h e s p e c i f i c a t i o n s g i v e n by

Table 31. R e s u l t s of t h e Los Angeles a b r a s i o n t e s t
Grading M a t e r i a l
% wear
Schahf er Uni t 1 4 Uni t 17
M i t c h e l l Gibson G a l l a g h e r Wabash Brown Cul ley Richmond Per ry S t o u t
Crushed l imes toneC B I n d i a n a c a r b o n a t e
aggregated
ASTM D 1241 s o i l - a g g r e g a t e subbase , b a s e , and s u r f a c e 50
AASHTO M 147 a g g r e g a t e b a s e and subbase 50
INDOT s p e c i f i c a t i o n s C l a s s C subbase 45 C l a s s A subbase 40
a The r a t i o of t h e l o s s a f t e r 100 r e v o l u t i o n s t o t h e l o s s a f t e r 500 r e v o l u t i o n s Denotes samples w i t h less t h a n 10 p e r c e n t c o a r s e r t h a n t h e No. 8 s i e v e From Usmen [38] From Aughenbaugh, e t a l . [ I581

INDOT for class C subbase, and some ashes are able to meet the
specifications for class A subbase [53]. However, it can also
be noted from Table 31 that none of the bottom ashes show the
abrasion resistant quality possessed by conventional
aggregates [38] . The ratio of the loss after 100 revolutions to the loss
after 500 revolutions provides an indication of the uniformity
of the material hardness. A value of the ratio close to 0.2
represents an uniform hardness of the material tested. The
ratios obtained from bottom ash samples range from 0.28 to
0.39, which indicates that more particle breakdowns occurred
during the early stage of the test. This is understandable
because the weaker and popcornlike particles readily break
under the impact during the initial revolutions of the
abrasion test.
A comparison between the sulfate soundness losses and
abrasion values reveals that bottom ashes with high sulfate
soundness losses also have high percentage wears under an
abrasion test. Since the applicability of the sulfate
soundness test on bottom ash material has been previously
questioned, the Los Angeles abrasion test may provide a
superior measure of the quality of bottom ash as an aggregate.
However, a shortcoming of the Los Angeles abrasion test as
applied to bottom ash is that the test is designed for four
gradations, on the assumption that the materials tested will
fall within one of the four gradation limits. With materials

l i k e many bottom a s h e s , having h i g h p e r c e n t f i n e s ( f i n e r t h a n
t h e No. 8 s i e v e ) , o n l y a smal l p o r t i o n o f t h e sample may f a l l
w i t h i n t h e s p e c i f i e d g r a d a t i o n s . I n t h i s s t u d y , o n l y 1 5 t o 3 0
p e r c e n t o f any sample cou ld be used i n a b r a s i o n t e s t i n g , s o
t h e r e s u l t s may n o t r e p r e s e n t t h e a b r a s i o n p o t e n t i a l of t h e
e n t i r e sample.
V i s u a l i n s p e c t i o n s on t h e f i n e s ( p a s s i n g t h e No. 1 2
s i e v e ) produced from bottom a s h e s were performed a f t e r t h e
t es t . I n c o n t r a s t t o t h e powdery f i n e s produced from n a t u r a l
a g g r e g a t e s , t h e f i n e s produced from bot tom a s h e s were
i n t e r m e d i a t e i n s i z e and appeared a s s m a l l b roken p i e c e s of
l a r g e r a s h p a r t i c l e s , having a n g u l a r shape and porous t e x t u r e .
A s i m i l a r o b s e r v a t i o n was r e p o r t e d by Usmen [ 3 8 ] and Usmen e t .
a l . [65] on s e l e c t e d West V i r g i n i a bottom a s h e s .
I t was a l s o r e p o r t e d t h a t due t o t h e l i g h t w e i g h t n a t u r e
of t h e porous and popcorn l ike p a r t i c l e s , some a s h p a r t i c l e s
might e s c a p e t h e a b r a s i o n p r o c e s s and c o u l d s t i l l be c r u s h e d
w i t h f i n g e r s a f t e r t h e a b r a s i o n t e s t [ 3 8 ] . P r a c t i c a l l y , no
such phenomenon was observed i n t h i s s t u d y .
R e l a t i v e Densi ty and Void R a t i o
The maximum and minimum d e n s i t i e s o f s e l e c t e d bottom
a s h e s , a l o n g w i t h t h e cor respond ing minimum and maximum v o i d
r a t i o s , a r e summarized i n T a b l e 32. The r e s u l t s show
s i g n i f i c a n t v a r i a t i o n s from p l a n t t o p l a n t , p r i m a r i l y
r e f l e c t i n g t h e s p e c i f i c g r a v i t y and t h e g r a d a t i o n o f t h e

Table 32. Maximum and minimum void ratios and densities of selected bottom ashes
Void ratio Unit weight (pcf)
Material Maximum Minimum Maximum Minimum
Schahf er Unit 1 4 a Unit 17
Gibson perryb Gallagher
Standard Ottawa sandC 0.80
Fine to coarse sandC 0.95
Silty sand and gravelC 0.85
a Wet bottom ash Stoker ash From Hough [74]

ashes . The w e t bottom a s h (Schahfe r Uni t 1 4 ) h a s t h e h i g h e s t
d e n s i t i e s , w i t h a maximum of 118.5 pcf and a minimum of 9 6 . 3
p c f . Due t o a h i g h l y porous n a t u r e , Pe r ry a s h h a s t h e lowes t
d e n s i t i e s of 57.3 and 37.0 pcf a s t h e maximum and minimum
d e n s i t i e s , r e s p e c t i v e l y . S i m i l a r l y , vo id r a t i o s o b t a i n e d from
bottom a s h e s a l s o show a wide range , va ry ing from 0.48 t o 1 . 3 1
f o r t h e minimum and 0.82 t o 2.58 f o r t h e maximum.
When compared t o t h e d e n s i t y and vo id r a t i o of n a t u r a l
s o i l s w i th s i m i l a r g r ad ings (Tab le 3 2 ) , t h e w e t bot tom a s h ha s
d e n s i t i e s comparable t o Ottawa sand; and most bottom a shes
y i e l d e d much l a r g e r minimum void r a t i o t h a n n a t u r a l s ands .
However, t h e maximum void r a t i o s f o r bottom a s h e s and n a t u r a l
sands a r e q u i t e s i m i l a r . I n g e n e r a l , bo th t h e maximum and
minimum d e n s i t i e s f o r samples o f bottom a sh a r e somewhat lower
t h a n t h o s e f o r most sands . However, most bottom a s h e s would
m e e t t h e ASTM s p e c i f i c a t i o n s r e q u i r i n g t h e u n i t weight of s l a g
f o r b i tuminous mix tu re s l a r g e r t h a n 70 p c f . Cu r r en t INDOT
s p e c i f i c a t i o n s on u n i t weight of s tee l f u r n a c e s l a g range from
7 0 t o 75 p c f , depending on agg rega t e c l a s s .
Pe rmeab i l i t v
Table 33 g i v e s t h e r e s u l t s of f a l l i n g head p e r m e a b i l i t y
t es t s conducted on bottom a s h e s a t a r e l a t i v e d e n s i t y of
approx imate ly 9 0 p e r c e n t . The measured c o e f f i c i e n t s of
. p e r m e a b i l i t y ranged from 0.003 t o 0 . 1 0 cm/sec f o r s e l e c t e d
bottom a s h e s . The w e t bottom a s h (Schahfe r u n i t 1 4 ) d i s p l a y s

Table 33 . Coefficients of permeability of bottom ashes
Coefficient of Void Percent permeability Hazenls
Material ratio f inesa k (cm/sec) cb
Schahf er Unit 14' 0 . 5 1 0 .3 0 . 1 0 1 0 .57 Unit 1 7 0.73 3 .5 '0 .034 0 . 8 5
Gibson 0.55 6.5 0 .009 0 .45 perryd 1.44 5 .9 0.014 0 . 1 2 Gallagher 0.59 1 0 . 1 0 .003 0 .53
Uniform coarse sande 0.4 Well-graded sand and gravele 0 . 0 1
a Percent finer than the No. 2 3 0 sieve ( 0 . 0 7 5 mm) C = k / ~ , ~ ~
' Wet bottom ash Stoker furnace From Hough [ 7 4 ]

the largest value of coefficient of permeability due to its
uniform size distribution and absence of fines. Generally,
the coefficients of permeability of bottom ash fall in a
medium permeability range (Table 33) , and are comparable to
those of granular soils with similar gradings.
It can also be noted from Table 33 that the percentages
of fines have a predominant effect on the permeability of
bottom ash. This can be expected because finer particles in
a soil are known to have the most influence on the
permeability. Based on Hazenls equation, a consistent
relationship between the coefficient of permeability (k) and
the effective grain size (Dlo) exists in clean sands as
The calculated C constant in Hazen ' s equation varies from
0.1 to 0.9 for bottom ash samples. Considering the wide range
of coefficient for soils, the Hazenls equation may be used in
estimating the coefficient of permeability for bottom ashes,
when testing is not practicable.
Anqle of Shearinq Resistance
In order to determine the angle of shearing resistance
, a series of direct shear tests were conducted on dry
bottom ashes at various relative densities. The normal stress
varied from 5 to 34 psi. Figures 45 through 49 present the
results of these tests on ash samples in different relative

Perry
Normal Stress, psi
F i g u r e 4 5 . R e s u l t s of d i r e c t s h e a r t e s t on P e r r y a s h

Gallagher
10 20 30 40
Normal Stress, psi
F i g u r e 4 6 . R e s u l t s of d i r e c t s h e a r t e s t on G a l l a g h e r a s h

Gibson
Normal Stress, psi
Figure 4 7 . R e s u l t s of d i r e c t s h e a r t e s t on Gibson ash

Schahfer 17
0 10 20 30 40
Normal Stress, psi
Figure 4 8 . R e s u l t s of d i r e c t s h e a r t e s t on S c h a h f e r 1 7 a s h

Schahfer 14
0 10 20 30 40
Normal Stress, psi
Figure 4 9 . Resu l t s of d i r e c t s h e a r t e s t on Schahfer 14 ash

densities. It is noted that a straight line fitted to the
failure values yields a small strength intercept. The
measured angles of shearing resistance along with the strength
intercepts are summarized in Table 34. The values of @ I in
this Table represent those corresponding to the peak strength,
which is considerably higher than the value calculated from
the ultimate strengths of compacted dense samples, which
expand during shear. On the other hand, because loose samples
did not exhibit this peak during shear, the values of @ ' for
bottom ashes in a loose condition were determined at a strain
of 15 percent.
The angles of shearing resistance for bottom ash samples
in a loose condition are quite large in magnitude, ranging
from 35 to 45 degrees. These values are compared to the
values obtained from conventional granular soils, as tabulated
in Table 34. It is found that the angle of shearing
resistance for the wet bottom ash falls within the same range
as that for conventional soils. The values obtained from dry
bottom ashes are higher than those from conventional soils.
This can be attributed to the rough surface texture and
angularity of the bottom ash particles, such that a higher
degree of interlocking was developed in the shear process.
However, it is generally believed that the angles of shearing
resistance from direct shear tests are greater by 2 degrees
than those from triaxial tests [73,150].

Table 3 4 . R e s u l t s of d i r e c t s h e a r tes ts on bottom a s h e s
Loose Dense
S t r e n g t h S t r e n g t h i n t e r c e p t Values of i n t e r c e p t Values of
M a t e r i a l ( p s i ) @ I I deg ( p s i ) @ I I deg
Schahf er Uni t 1 4 a 0 . 4 8 3 5 . 1 1 . 4 9 4 6 . 3 Uni t 1 7 0 . 1 4 3 9 . 2 ' 3 . 1 2 4 7 . 7
Gibson 0 . 2 0 4 4 . 8 1 . 6 6 5 5 . 0 Gal lagher 0 . 4 9 4 1 . 3 2 . 0 0 5 1 . 6 P e r r y 0 . 4 9 4 1 . 5 3 . 0 0 5 0 . 6
Medium sand , angula rb 3 2 - 3 4 4 4 - 4 6
Sand and g r a v e l b 3 4 4 5
W e l l g raded , angu l a r sandC 3 9 4 5
W e l l graded rounded sandC 3 4 4 0
a W e t bottom a s h From Leonards [ 7 5 ] From Sowers [ 9 3 ]

Bottom ashes tested in a dense condition yielded angles
of shearing resistance approximately 8 to 10 degrees larger
than those in a loose condition. The strength intercepts are
also larger in a dense state. This can be expected because
the curvature of the Mohr envelope increases as a granular
soil becomes denser [73]. It should be pointed out that
because of the possibility of progressive failure in backfill
or embankment, use of @ I corresponding to the peak value may
not be warranted. Burmister suggested that only 50 to 75
percent of the increase of the value of @ over its value at a
very loose state be used, depending on the amount of restraint
against progressive failure [151].
If bottom ash is used as an embankment material, based on
present test results, the stability of the embankment can be
higher than that for natural granular soils. If it is used in
highway subgrades or subbases, the bearing value may be higher
than that encountered with a natural sand.
~oisture-Density Relations
The relationship between dry density and moisture content
was determined by the standard Proctor compaction procedures
for several bottom ash samples [15]. Samples were tested at
a range of moisture contents from air-dried to essentially
saturated. The resulting moisture-density relations are
, presented in Figures 50 through 53. The shapes of the
moisture-density curves are typical of those for cohesionless

Water Content (%)
4 8 12 16 20
Water Content Prior to Compaction (%)
Figure 50. ~oisture-density relations for Schahfer 14 ash

Water Content (%)
Schahfer Unit 17
96 -
88
Water Content Prior to Compaction (%)
1 i 1 I 1
100
9 6 -
Figure 51. Moisture-density relations for Schahfer 17 ash
0 5 10 15 20 25 30
I I 1 I I
Schahfer Unit 17
-
t
- 9 2 -
88 0 5 10 15 20 25 30
a I I I I

5 10 15 20
Water Content (%)
-
-
-
I I I I I ,
Gibson
- -
- 0
I I I I
Gibson
0 0 0
3
Water Content Prior to Compaction (%)
Figure 52. Moisture-density relations for Gibson ash

I I I
Gallagher
0
-
-
0
I I I
10 15
Water Content (%)
Gallagher . Water Content Prior to Compaction (%)
Figure 53. Moisture-density relations for Gallagher ash

m a t e r i a l s [ 8 1 , 8 2 ] . The d r y d e n s i t i e s o b t a i n e d a r e h i g h when
t h e s o i l is a i r - d r i e d , and h i g h when t h e s o i l i s c o m p l e t e l y
s a t u r a t e d , w i t h somewhat lower d e n s i t i e s o c c u r r i n g when t h e
s o i l h a s i n t e r m e d i a t e w a t e r c o n t e n t s . A s d i s c u s s e d e a r l i e r ,
t h e low d e n s i t i e s o b t a i n e d a t i n t e r m e d i a t e w a t e r c o n t e n t s ,
f r e q u e n t l y c a l l e d "bu lk ing t1 , a r e due t o c a p i l l a r y f o r c e s
r e s i s t i n g rea r rangements of t h e sand g r a i n s [ 7 3 , 1 5 1 ] . his
b u l k i n g phenomenon is n o t p r e s e n t i n a i r - d r i e d samples and
d i s a p p e a r s i n t h e s a t u r a t e d s t a t e .
The compaction c u r v e s show a s l i g h t d e c r e a s e i n d e n s i t y
a t t h e h i g h e s t wa te r c o n t e n t s . F i e l d compaction d a t a r e p o r t e d
on f r e e d r a i n i n g m a t e r i a l s i n d i c a t e s t h a t f i e l d compaction
c u r v e s do n o t show such a d e c r e a s e [79 ,152 ] . F i e l d c u r v e s
g e n e r a l l y e x h i b i t maximum d r y d e n s i t y a t e i t h e r an a i r - d r i e d
c o n d i t i o n o r a u f l u s h e d l l c o n d i t i o n . T h i s can b e b e t t e r
i l l u s t r a t e d by p l o t t i n g t h e d r y d e n s i t y v e r s u s t h e w a t e r
c o n t e n t p r i o r t o compaction, a s i n F i g u r e s 50 t h r o u g h 53 ,
because some l o s s of w a t e r o c c u r r e d d u r i n g compaction a t h i g h
w a t e r c o n t e n t s .
Sometimes, t h e a i r - d r i e d c o n d i t i o n may n o t b e p r a c t i c a b l e
f o r f i e l d c o n s t r u c t i o n , b u t it is p r a c t i c a b l e t o m a i n t a i n t h e
m a t e r i a l i n a f l u s h e d c o n d i t i o n d u r i n g t h e compaction p r o c e s s .
I f a d e q u a t e measures have been t a k e n t o p r o t e c t t h e u n d e r l y i n g
l a y e r s , c l o s e c o n t r o l of t h e w a t e r c o n t e n t w i l l n o t be
n e c e s s a r y , and t h e f l u s h e d c o n d i t i o n can b e a c h i e v e d s i m p l y by
a p p l y i n g a n e x c e s s of w a t e r . Although t h e d i f f e r e n c e s i n

laboratory densities between the bulking water content and the
flushed condition are only about 5 pcf, the differences are
expected to be greater for field compaction. Therefore, it is
necessary to maintain a high water content to achieve the
greatest densification.
The maximum dry densities and optimum moisture contents
determined by the compaction tests on bottom ashes are
summarized in Table 35. Because of the wide variation in the
specific gravities of ashes, a normalized density appears to
be a better indicator of the degree of densification in the
compacted materials than the dry density. The normalized
density is obtained by dividing the dry density of the
material by its specific gravity
where yn = normalized density
yd = compacted dry density
Gs = specific gravity of the solids
y,, = density of water
Vs = volume of solids
V = total volume, and
VV = volume of voids.
The specific gravity and the normalized density of the
materials tested are also shown in Table 35. It is seen that,

Table 35. Moisture-density properties of bottom ashes
Optimum Maximum Normalized moisture dry Specific maximum dry content density gravitya density
Material ( % I Yd (~cf) s yn b
Schahf er Unit 14' 1 2 . 9 1 1 2 . 2 2 . 8 1 0 . 6 3 9 Unit 1 7 2 1 . 5 95 .4 2 . 5 7 0 .594 Gibson 1 9 . 5 1 0 1 . 3 2 . 5 5 0 . 6 3 7 Galla her 7 1 6 . 1 108 .7 2 . 6 4 0 . 6 6 0 Perry 40 .8 63 .0 2 . 1 2 0 . 4 7 6 Brown 20 .8 1 0 2 . 1 2 . 7 4 0 .597
Crushed LS aggregatee 8 . 9 130 .6 2.72 0 . 7 6 9
Natural. river aggregatee 10.5 1 2 3 . 2 2 . 6 6 0 . 7 4 2
a As determined by ASTM Designation D 8 5 4 b y, = y d ( G , ) (y,) , where y, is the density of water
Wet bottom ash Stoker ash From Usmen [ 3 8 ]

when compared to conventional materials, bottom ashes have
lower normalized maximum dry densities which indicate high air
voids in the bulk compacted volume. This can be attributed to
the rough, gritty surface texture and irregular shape of the
bottom ash particles.
Desradation
During the compaction process, fracturing and abrasion
break down individual ash particles. The result is a
compacted material that has a gradation different from that of
the uncompacted material. The degradation of bottom ash
samples occurring under standard Proctor compaction (ASTM D
698) at optimum moisture content is presented in Figures 54
through 58 . It can be seen from Figure 54 that the wet bottom
ash underwent essentially negligible degradation under
compaction, due to the hard and dense nature of wet bottom ash
particles. On the other hand, dry bottom ash samples
exhibited substantial degradation upon compaction. As can be
expected on the basis of the soundness and Los Angeles
abrasion test results, Perry ash showed the most severe
degradation upon compaction.
In order to quantify the degradation, the "index of
crushingM and the increase in percent passing the No. 200
sieve are evaluated. The increase in percent passing the No.
200 sieve provides information on the amount of fines
generated. The index of crushing, as developed by the British


Road Research Laboratory [153], evaluates the general
breakdown in the aggregate over a size range of the 3/4 in. to
the No. 100 sieves. It is a gradation index based on the
summation of the weighted fractions of several size groups.
Hale, et al. [I541 have used the index of crushing
successfully as a measure of shale degradation during
compaction. It is obtained by calculating the weighted mean
size of the aggregate sample before and after compaction and
expressing the percent reduction between the two mean sizes
based on the initial mean size. As the numerical value
increases, the degree of crushing increases [155]. A sample
calculation form for the index of crushing is shown in
Appendix B.
Values of the index of crushing and the increase in
percent of fines for bottom ashes and several conventional
aggregates are shown in Table 36. The indices of crushing for
bottom ashes are found to be higher than those of conventional
aggregates. Again, this is attributed to the breakdown of the
weak and porous particles present in the materials.
It has been'reported that excessive amounts of plastic
fines produced from aggregate degradation are responsible for
the loss of base course support, the reduction of drainage,
and the creation of frost-susceptible material [156,157]. 1t
is interesting to note that the increases in percent fines for
bottom ashes are less than those for conventional aggregates,
with the exception of Perry ash. Besides, the fines produced

T a b l e 36. Degradat ion of bot tom a s h e s under compaction
P e r c e n t f i n e s Index of
Before A f t e r c r u s h i n g M a t e r i a l compaction compaction I n c r e a s e %
S c h a h f e r U n i t 14a Uni t 17
Gibson G a l l a g h e r pe r ryb
- - - -
Crushed l i m e s t o n e a g g r e g a t e C 3.0 6.0 3.0 4.9
N a t u r a l r i v e r a g g r e g a t e C 1.0 3.0 2.0 6.5
Carbonate aggrega ted 0.0 1.0-2.2 1.0-2.2 8-15
a W e t bot tom a s h S t o k e r a s h From Usmen [38] From Aughenbaugh, e t a l . [158]

from bottom ashes are known to be non-plastic. Therefore, the
detrimental effect of bottom ash degradation may not be as
severe as that suggested by the index of crushing.
Furthermore, aggregate degradation is not always detrimental.
The limited breakdown during placement of the aggregate can be
beneficial in producing the desired density [158].
Nevertheless, continued degradation allows further
densification to occur in the aggregate mass as the particles
are reduced in size and differential settlement can develop.
Although this detrimental effect has not been identified
positively as a principal cause of highway settlement, it
appears that there should be further research efforts to study
the densification effect upon degradation.
One-Dimensional Compression
One-dimensional compression tests were performed on
bottom ashes in a dense condition. The samples were densified
using a vibratory table. One bottom ash (Schahfer Unit 14)
experienced a small swelling of 0.07 percent after the 24-hour
soaking period and the swelling pressure was found to be only
6 psi. Due to the high permeability of bottom ash, the
deformations took place almost immediately. All specimens
were also maintained at the maximum stress for at least 24
hours to allow creep to develop. Only one of the bottom ashes
produced measurable creep. A small amount of creep of 2
percent was observed on Perry ash.

The stress-strain relationships for several bottom ashes
obtained from one-dimensional compression tests are presented
graphically in Figures 59 and 60. In order to relate the
compressibility of bottom ashes to more familiar soil
materials, the stress-strain curve obtained from an uniform
medium sand is also shown in the Figures 59 and 60 [89]. It
can be seen that bottom ashes are slightly more compressible
than the sand.
Two factors are believed to contribute to this finding.
The first is the angularity and rough surface texture of
bottom ash particles. Sands with angular particles are known
to be more compressible than the well-rounded sands, because
the sharp edges become overstressed during movement and
reorientation of the particles and hence break to allow
compression [88,89]. The second factor is the presence of
weak and popcornlike particles. These particles break at a
relatively low stress level resulting in increased
deformations.
If bottom ash is used as a fill material the compression
of the bottom ash layer is usually estimated by elastic
theory. When vertical loads of large lateral extent are
applied to the bottom ash layer, the compression behavior
becomes one-dimensional and the parameter used in estimating
settlement is the secant constrained modulus. The secant
constrained modulus is the rate of change of vertical stress

Vertical stress, psi
I LO 100 1000
O-o Schahfer 14 .- Schahfer 17 A-A Gibson
Figure 59. One-dimensional compression curves for bottom ashes and a medium sand

Vertical stress, psi
Figure 60. One-dimensional compression curves for bottom ashes and a medium sand

with respect to the vertical strain under conditions of zero
lateral strain, and can be expressed as
where D = secant constrained modulus,
E,, = vertical strain at a stress level of aV,, and
V2 = vertical strain at a stress level of a,*.
Figure 61 shows the secant constrained modulus calculated
from zero stress to various stress levels. A comparison is
made between the constrained moduli for bottom ash and those
for a uniform medium sand [89], and the results are shown in
Table 37. It is found that the moduli for one ash (Schahfer
Unit 14) are comparable to those of the well graded sand. The
values for the other two ashes are somewhat lower than those
for sand, especially at the high stress level. The crushing
of angular particles at high stress may play an important part
in this phenomenon [go].
California Bearins Ratio (CBR)
In this study, at least two samples were prepared for
each moisture content and density condition and the CBR values
obtained from these two samples averaged. Results of the test
on selected bottom ashes are summarized in Table 38. As

0 Gibson
Gallagher
A Schahfer 1 4
Medium sand
Vertical s t ress , psi
Figure 61. Constrained modulus vs. vertical stress curves for bottom ashes and a medium sand

Table 37. Secant constrained modulus of bottom ashes
Constrained modulus (ksi)
Relative avl= 6 ksi avl=112 ksi Materials density, % av2=13 ksi av2=146 ksi
Schahf er Unit 14a 98 7.5 21.2 Unit 17 91 5.1 7.1 Gibson 85 3.8 12.0 Gallagher 90 4.4 10.6 perryb 95 2.6 1.6
Uniform medium sandC (0.1 mm<dd<0.6 mm) 89 7.8
a Wet bottom ash Stoker ash From Schultze and Moussa [89] d = particle size

T a b l e 3 8 . CBR t e s t r e s u l t s o n s e l e c t e d bo t t om a s h e s
CBR I n i t i a l M o i s t u r e Unsoaked Unsoaked Soaked Soaked
Ash c o n t e n t a a t a t a t a t s o u r c e ( % I , 0 . 1 i n . 0.2 i n . 0 . 1 i n . 0 . 2 i n .
Schah f e r 0 . 2 u n i t 1 4 ~ 8 . 5
1 0 . 6 1 2 . 8 1 4 . 1
S c h a h f e r 1 4 . 3 U n i t 1 7 1 8 . 1
2 0 . 9 22.3 2 4 . 1
Gibson
a Wate r c o n t e n t p r i o r t o c o m p a c t i o n W e t bo t t om a s h

suggested by Yoder and Witczak [48], granular soils often
yield erratic results from the CBR test. The CBR values in
this study havg' an average coefficient of variation of about
29 percent.
As can be seen from Table 38, soaking does not affect the
CBR of bottom ashes, which is to be expected because of the
granular nature of bottom ash [160]. An unusual finding is
that, in all cases, the 0.1-in CBR value is less than the 0.2-
in value. A similar phenomenon was also reported by Franco
and Lee [I451 on a set of sandy gravel base course materials
which were classified as A-1-a and A-1-b by the AASHTO system.
Note that of the 11 bottom ashes studied, 7 are classified as
A-1-a and the remaining 4 as A-1-b. The CBR values for bottom
ash range from 40 to 70. Compared to the typical values for
a number of soils and base course materials, bottom ash falls
in the categories of "good subbases" and I1good gravel basesu
on the basis of the CBR values [161].
Figures 62 through 64 show the moisture-density-CBR
relations of bottom ashes. In general, the shapes of the CBR
curves follow the same pattern as those of the compaction
curve. Although the CBR curves have their peaks to the dry
side of optimum moisture content, the CBR values at the wet
side of the peak are higher than those at the dry side. As
discussed previously in the Compaction section, this again
suggests that it is advantageous to compact bottom ash in a
flushed condition.