Selection of Design Strengths of Untreated Soil Subgrades ...
18
Interim Research Report KTC-93-33 Selection of Design Stngths of Untreated Soil Subgrades and Subgrades eated with Cement and Hydrated Lime by TO C. HOPS Head of Geotechnology David Q. Hunsucker Head of Materials and Tony L. Beckham Research Geolost Kentucky Transportation Center Coege of Engineering University of Kentucky in cooperation with Transportation Cabinet Commonwealth of Kentucky and Federal Highway Administration U.S. Department of Transportation The Contents of this report reflect the views of the author, who is responsible for the facts and accacy of the data presented herein. The contents do not necessarily reflect the official views or poliicies of the University of Kentucky, the Kentucky Transportation Cabinet, nor the Federal Highway Administration. This report does not constitute a standard, specification, or regulation. December 1993
Transcript of Selection of Design Strengths of Untreated Soil Subgrades ...

Interim Research Report KTC-93-33
Selection of Design Strengths of Untreated Soil Subgrades and Subgrades Treated
with Cement and Hydrated Lime
by
TOMMY C. HOPKINS Head of Geotechnology
David Q. Hunsucker Head of Materials
and
Tony L. Beckham Research Geologist
Kentucky Transportation Center College of Engineering University of Kentucky
in cooperation with Transportation Cabinet
Commonwealth of Kentucky
and
Federal Highway Administration U.S. Department of Transportation
The Contents of this report reflect the views of the author, who is responsible for the facts and accuracy of the data presented herein. The contents do not necessarily reflect the official views or poliicies of the University of Kentucky, the Kentucky Transportation Cabinet, nor the Federal Highway Administration. This report does not constitute a standard,
specification, or regulation.
December 1993

Technical Report Documentation Page
1. Report No. 2. Government Accession No. 3. Recipient's Catalog No.
KTC-93-33 - - - - -- -
4. Title and SubtiUe 5. Report Date
December 1993 Selection of Design Strengths of Untreated Soil Subgrades and Subgrades Treated with Cement and Hydrated Lime 6. Performing OrganlzaUon Code
7. Author(s) B. Performing Organization Report No.
Tommy C. Hopkins, David Q. Hunsucker, and Tony L Beckham KTC -93-33
9. Performing Organization Name and Address 10. Work UnH No. (TRAIS)
Kentucky Transportation Center College of Engineering 11. Contract or Grant No.
University of Kentucky KYH PR-90-132 Lexington, KY 40506-0043 13. Type of Report and Period Covered
Interim 12. Sponsoring Agency Name and Address
Kentucky Transportation Cabinet State Office Building 14. Sponsoring Agency Code
Frankfort, KY 40622
15. Supplementary Notes
Prepared in cooperation with the Kentucky Department ol Transportation and the U.S. Department of Transportation,
Federal Highway Administration
16. Abstract
Selection of design strengths of soil subgrades and subgrades treated with cement or hydrated llme is a problem in pavement design analysis and construction because a variety of different types of soils may exist in a highway corridor and a wide range of different strengths may exist after the soils are compacted to form the pavement subgrade. The selected subgrade strength will largely affect the pavement thickness obtained from the design analysis. the future pavement perlormances. and the overall bearing capacities of the subgrade during construction and the pavement structure after construction. In developing the proposed selection scheme, a newly developed mathematical model, based on limit equilibrium, is used. Relationships between undrained shear strength {and CBR) and tire contact stresses are developed foriactors of safety 1.0 and 1.5. The minimum subgrade strength required to sustain anticipated construction tire contact stresses to avoid bearing capacity failures of the subgrade and partially constructed pavements during construction is determined. Also, a criterion is proposed for determining when subgrade stabilization is needed. Methods of selecting the design subgrade strength are examined. A previOusly published method, based on a least cost analysis. appears to be an appropriate approach as shown by analysis of a case study involving pavement failures during construction. Two case studies show that soaked laboratory strengths appear to be fairly representative of long-term fiek:l subgrade strengths. Hence, using soaked laboratory strengths and least cost analysis appears to be reasonable means for selecting the design strength of subgrades for pavement analysis. When chemical stabilization is used, it is suggested that the net strength gain obtained at the end of a 7-day curing period may be used in the pavement design analysis. To avoid failures of chemically stabilized layers, relationships between thicknesses ot chemically treated layers and the CBR values of the untreated subgrade for a factor safety of 1.5 are presented. Layer coefficients {a3), based on 7-day strengths, are also presented for hydrated line-and cement-treated subgrades.
17. Key Words 18. Distribution Statement
Subgrade; stabilization; Design; Strengths; Soils; Cement; Hydrated Lime Unlimited, with approval of the
Kentucky Transportation Cabinet.
19. Security Classlt. (of this report) 20. Securtty Classif. (of this page) 21. No. of Pages 22. Price
Unclassified Unclassified 16
Form DOT 1700.7 (8-72) Reproduction of completed page authorized

�·
" o Ul I � ;. SI (MODERN METRIC) CONVERSION FACTORS 1 ,\( � APPROXIMATE CONVERSIONS TO Sl UNITS APPROXIMATE CONVERSIONS FROM Sl UNITS I �S(ll Symbol When You Know Multiply By To Find Symbol Symbol When You Know Multiply By To Find 1 Symbol 0 '
a , "' [ LENGTH LENGTH I I g' 0' in. inches 25.40000 millimetres mm mm milbmetres 0.03937 inches in. � ::!. ft feet 0.30480 metres m m metres 3.28084 feet ft g. g' yd yards 0.91440 metres m m metres 1.09361 yanb yd O 5" rni miles 1.60934 kilometres km km kilometres 0.62137 miles mi 8 :; 9 � AREA AHEA
'tl ..,. - - .I � o· in.:. square inches 645.16000 milhmetres mm- mm- milhmetres 0.00155 square mch s 0 !. e;. squared squared j ;. oo re square feet o.o9290 metres squared m1 mJ metres squared 10.76392 square feet I W 1 yd� square yards 0.83613 metres squared m� m2 metres squared 1.19599 square yard� g._ a ac acres o.4o4s9 hectares ha ha hectares 2.47103 acres 1 g o m1J square miles 2.58999 kilometres km� km� kilometre:; 0.38610 square mile�
� I � C:: squared squared i o � I ·- '
HI
tt' yd' ac till�
1;; !' VOLUME VOLUME I I � .G'" fl oz fluid ounces 29.57353 milhlitres ml ml milhlitres 0.03381 fluid ounces! fl oz Ill tr:l '=: gal. gallons 3.78541 litres I I litres 0.26417 gallons il gal. ?: � ft3 cubic feet 0.02832 metres cubed m:l m3 metre� cubed :35.31448 cubic feet . fe ? ;: ydJ cubic yards 0.76455 metres cubed m3 m3 metres cubed 1.30795 cubic yards I yd'1 � I
• I
oz Jb T
lbt psi
ounces pounds short tons (2000 !b)
MASS
28.34952 0.45359
0.90718
grams kilograms megagrams
g kg Mg
g kg Mg
grams kilograms megagrams
MASS
0.03527 2.20462
1.10231
ounces pounds short tons (2000 ]b)
I
FORCE AND PRESSURE �'ORCE
pound-force pound-force per square inch
4.44822 6.89476
newtons kilopascal
N kPa
N kPa
newtons kilopasca\
0.22481 0.14504
poul1if-Torcfil pound-fared per square �nch
I ILLUMINATION I ILLUMINATION I
� tC foot-candles 10.76426 UX X \x \ux 0.09290 foot-candle� � fl foot-Lamberts 3.42583 candelalm2 cdlm2 cdlmj cande\a/m� 0.29190 foot-Lambefts � I � I � . � TEMPERATURE (exact) TEMPERATURE (exact) I
oz Jb T
Jlif psi
fc n
"F Fahrenheit S(F-32)19 Celsius "C "C Celsius 1.8C + 32 Fahrenheiq "F temperature temperature temperature temperatu¥
INTRODUCTION
_ _ __ ____________________ AJ.o.ug,_an:�chighway_corridorrhefureJ:.OD.Str:u.ctini4JLYari ej;y _ _g_Lgifierei1t..S oil_hC>ri�g_r1S _ _ _ � __ and soil types are normally encountered and a wide range of bearing strengths may exist when the different types of soils are used to construct pavement subgrades. To avoid bearing capacity failures during construction of the subgrade and placement of the pavement layers, a certain minimum subgrade strength must exist to sustain construction traffic. Hence, the design strength selected for pavement analysis should consider the issue of pavement construction. The method of selecting the design strength is complicated when different subgrade strengths exist along the route to be paved. Additionally, when the design analysis is based on a selected laboratory strength, the question arises whether the laboratory strength is representative of the long-term field strengths existing after paving.
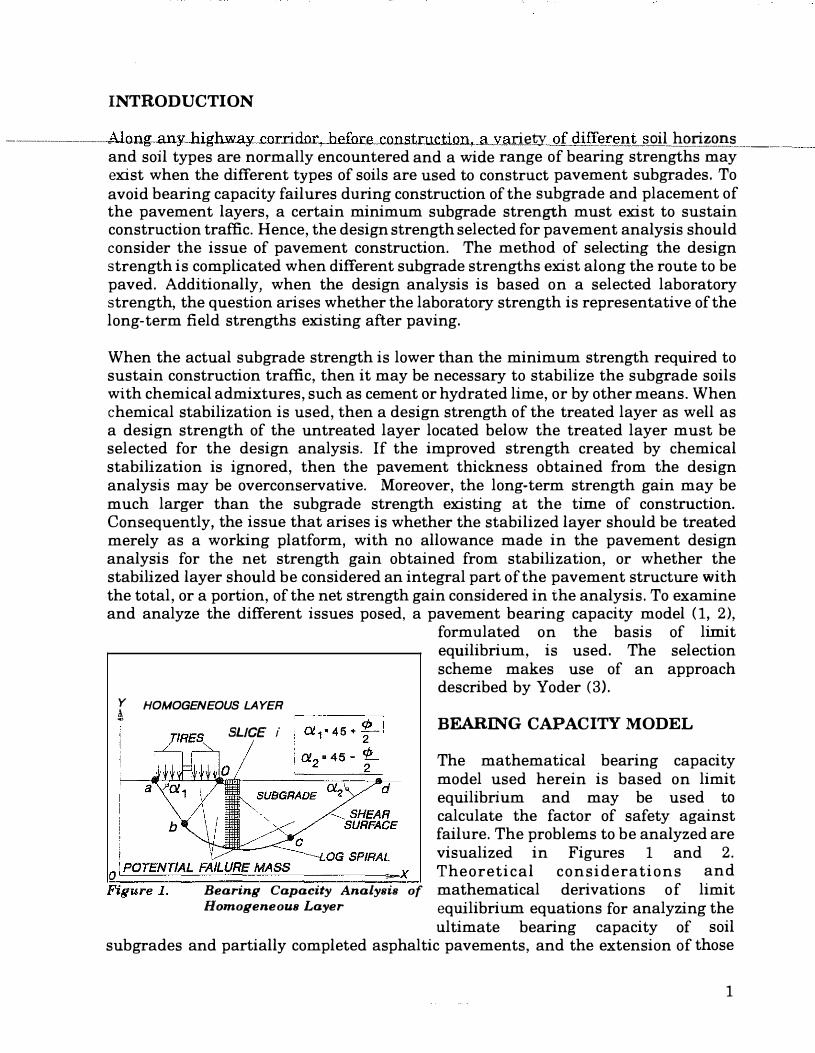
When the actual subgrade strength is lower than the minimum strength required to sustain construction traffic, then it may be necessary to stabilize the subgrade soils with chemical admixtures, such as cement or hydrated lime, or by other means. When chemical stabilization is used, then a design strength of the treated layer as well as a design strength of the untreated layer located below the treated layer must be selected for the design analysis. If the improved strength created by chemical stabilization is ignored, then the pavement thickness obtained from the design analysis may be overconservative. Moreover, the long-term strength gain may be much larger than the subgrade strength existing at the time of construction. Consequently, the issue that arises is whether the stabilized layer should be treated merely as a working platform, with no allowance made in the pavement design analysis for the net strength gain obtained from stabilization, or whether the stabilized layer should be considered an integral part of the pavement structure with the total, or a portion, of the net strength gain considered in the analysis. To examine and analyze the different issues posed, a pavement bearing capacity model (1, 2),
0
Y HOMOGENEOUS LAYER �
SLICE i
formulated on the basis of limit equilibrium, is used. The selection scheme makes use of an approach described by Yoder (3).
BEARING CAPACITY MODEL
The mathematical bearing capacity model used herein is based on limit equilibrium and may be used to calculate the factor of safety against failure. The problems to be analyzed are visualized in Figures 1 and 2. Theoretical considerations and
Bearing Capacity Analysis of mathematical derivations of limit Homogeneous Layer equilibrium equations for analyzing the
ultimate bearing capacity of soil sub grades and partially completed asphaltic pavements, and the extension of those
1

Hopkins, Hunsucker, Beckham 2
equations to the analyses of asphaltic pavements composed of multiple layers, have - ----------------- --b-een pr-esented -elsewhereTITaD.<ra:r-;;--Ee:Yo-:iicrflie--scoiJe-ortms--iJa!J-er.-RacnTa:Yer-or · · ---------
material--subgrade, base, and asphaltic layers--in the pavement structure are described in the model using shear strength parameters, the angle of intemal friction, <j>, and cohesion, c, and unit weights. Problems involving total stress and effective stress analyses may be solved.
0
LAYERED SYSTEM
a 1 a.ya,2 / '-.LAYER2 a ·'
ct. ., 45 +(/)am am 2
_ rflom • Ol.pm -45 2 d
a, •. ,(<>aim-11 LAYER""-! "'o!m-t!X a,;;� LAYERm X PASSIVE
WEDGE
Figure 2. Bearing Capacity Analysia of a Layered System
The assumed theoretical failure mass consists of three zones--active and passive wedges connected by a central wedge whose shear surface is a logarithmic spiral curve. The shear surface assumed in the model analysis for a homogeneous layer of material consists of a lower boundary, identified in Figure 1, as abed. This surface consists of two straight lines, ab and ed. The portion of the shear surface shown as line ab is inclined at an entry angle, a1. Line ed is inclined at an exit angle, a2• The angles, a1, and a2, are defined in Figure 1. The shear surface, be, is determined from the properties of a
logarithmic spiral. For a layered system, the shear surface is visualized as shown in Figure.2.
The approach is a generalized method of slices and is an adaptation of a slope stability method developed by Hopkins (2). Vertical, horizontal, and moment equilibrium equations are considered for each slice. In the solution of these equations, the factor of safety appears on both sides of the final equation. Iteration and numerical techniques are used to solve for the factor of safety ( 1). To facilitate the use of the approach, all algorithms were programmed for the mainframe computer (3090) at the University of Kentucky.
Because the shear strength of asphaltic materials varies with temperature and temperatures within the asphaltic layer vary with depth, the shear strength varies with depth. To account for this variation in the model analysis, unconsolidatedundrained triaxial compression tests were performed on asphaltic core specimens that were assumed to be representative of typical flexible pavements. These tests were conducted for temperatures ranging from 25 to 60 degrees, Centigrade. As shown in Figures 3 and 4, the shear strength parameter, <i>, increases and the shear strength parameter, c, decreases as the temperature increases. In the analyses of problems involving asphaltic materials, a temperature-depth model (4) is used to estimate the temperature at any depth within a given asphaltic layer. Different surface temperatures and average air temperatures may be used in the analysis. Based on a calculated temperature and the correlations of <i> and c with temperature, the shear strengths at a given depth within an asphaltic pavement may be determined. and <i>-

Hopkins, Hunsucker, Beckham 3
and c-values are assigned to each layer. Total stress parameters, rj> and c, of crushed stone (limestone) bases were assumed to be 43 degrees and zero, respectively (1).
�
45' UU • TRIAXIAL TESTS
AA-HIGHWAY
� 40f Q: f:il e 35f �- -- cp • 13.1 ln(T} - 11.2
30L'----------------------------� 20 30 40 50 60 70 TEMPERATURE, T (DEGREES CENTIGRADE)
Figure 3. Influence of Temperature on Shear Strength Parameter, �
MINlMUM SUBGRADE STRENGTH
�
300r. ----------------------�----, \ .6
r • 250f
200f � � 150f
� "'
(/) 100f Su. 0.17 rcJI 0�------------------------- --J
0 200 400 600 800 1000 1200
50f
Figure 5. TIRE CONTACT STRESS (kPa)
Undrained Shear Strength as a Function of Tire Contact Ground Stress
350,---------- -,---------------, UU - TRIAXIAL TESTS AA-HIGHWAY
0
0 c • 1169 - 270.8 ln(T) //
o �--------------�----�----� 20 30 40 50 60 70 TEMPERATURE. T DEGREES CENTIGRADE.
Figure 4. Influence of Temperature on Shear Strength Parameter, c
In the analyses, each asphaltic pavement was divided into small finite (2.54 em) layersTo avoid bearing capacity failures under construction traffic and to assure the efficient construction of the pavement, the subgrade must possess some minimum strength. The mrmmum strength required to maintain stability is a function of the tire contact ground stress. As the contact stress increases, the required strength increases. This situation, as visualized in Figure 1, was analyzed using the bearing capacity model described above. Dual-wheel tires and a range of tire contact stresses (uniformly distributed) and undrained
shear strengths of the soil sub grade were assumed. The relationships of undrained shear strength and tire contact ground stresses corresponding to factors of safety of 1.0 (incipient failure) and 1.5 (an assumed stable condition) were developed. For s selected tire contact stress and undrained shear strength, the factor of safety was computed. Relationships developed in this manner are shown in Figure 5. Hence, if the anticipated tire contact stress of construction traffic is known, then the required strengths to maintain an incipient failure condition (F=l.O) or an assumed stable condition (F=l.5) may be determined. For example, if the tire contact stress is 552 kPa, then the undrained shear strength for an incipient failure is 94 kPa and about

Hopkins, Hunsucker, Beckham 4
144 kPa for an assumed stable condition.
Relationships between bearing ratios (ASTM D 1883) and tire contact stresses may ----�----------�ruso-oe-aevelop-eauSinif
_a_reiatioiisrup-oetwe-enoeann.g--ra:uo�afict-una:ra:meO:-snear --- --�---
strength developed by Hopkins (1, 5), or
CBR ; 0. 06498�'0" (kPa) . ( 1)
For a tire contact stress, Tc, of 552 kPa, the required bearing ratio for incipient failure <Su = 0.17Tc) is about 6.5 and about 10 (Su = 0.26Tc) for an assumed stable condition.
Required minimum dynamic modulus of elasticity required to maintain incipient failure and a stable condition may be determined using the relationship developed by Heukelom and Foster (6). Re-analyses of those data yields the following expression
E8 ; 17, 914CBR0·874 (kPa). (2)
Inserting the CBR values of 6.5 and 10, which correspond to factors of safety of 1 and 1.5, respectively, into Equation 2, the dynamic modulus of elasticity required to maintain an incipient failure state is about 91,979 kPa and for an assumed stable condition the required modulus is 134,031 kPa.
SELECTION OF UNTREATED SUBGRADE DESIGN STRENGTH
Different philosophies exist concerning the method of selecting the subgrade design bearing ratio (or strength parameters from other types of tests). Some of the approaches include using
• the lowest value, • an average value, • statistical methods of estimating the average values, or • a value based on a least-cost analysis.
When the lowest value of bearing ratio of a data set is selected, the pavement may be over designed. If the average value of the data set is selected, approximately one half of the pavement (of a selected route) may be over designed while one half may be under designed (3). Another approach embraces the normal distribution curve and reliability concepts. This concept involves upper and lower limits for the selected confidence interval.
Another approach, based on a least-cost design, has been proposed by Yoder (3) who presented a series of curves that relate percentile test values to soil variability (measured by the coefficient of variance of the test data set), traffic (EAL), and unit cost of the pavement. Unit cost of maintaining a highway is expressed in terms of a cost ratio (CR), or unit maintenance cost divided by the unit initial construction cost. When detailed information is lacking, Yoder suggests using the bearing ratio

Hopkins, Hunsucker, Beckham
ai 8 il 90th .:::_ PERCENTILE
iiJ 6 il TEST � VALUE • 1.8 � � 411
MINIMUM • 1.3
STATISTICAL VALUES
2.9
AVERAGE • 3.5 DESIGN • 5
5
occurring at the 80th or 90th percentile test value to obtain an optimum design.
Figure 6.
To test and compare the results of the different approaches, an analysis of soaked laboratory CBR values of two adjacent sections of a highway route located in Kentucky was performed. Total length of the two sections was about 12.2 km. The planned pavement structure consisted of 26.7 em of asphaltic pavement and 10.2 em of dense graded aggregate. The design
Soaked Laboratory CBR Values CBR and equivalent single-axle load of Corridor Soils
(ESAL) were, reportedly, 5 and 4 million, respectively. During
construction the partially completed pavements failed at numerous locations along the two highway sections.
Soaked laboratory values of CBR of corridor soil samples obtained prior to construction are shown graphically in Figure 6. The lowest CBR value of the data set (56 tests) is 1.3 and the average value is 3.4. Based on the assumption that the CBR data set is normally distributed, lower and upper-bound CBR values for a 95 percent confidence interval are 2.9 and 4.1, respectively. Percentile test value (as proposed by Yoder, 3) as a function of the soaked laboratory CBR is shown in Figure 7. Cost ratio for the two highway routes was not available. In this case, as suggested by Yoder, the value of CBR occurring at the 90th or 80th percentile test value may be used. At the 95th, 90th, and 80th percentile test values, the CBR values are 1.4, 1.8, and 2.1, respectively.
To compare the different CBR selection approaches, factors of safety of the
�10Q,-�-----AA�-�H"'IG�H�����Y�(���A"N�D'1�4')-, -.1 (56 TESTS) � SOc AVG.CBR • 3.5 %
COEF. OF VARIATION • 48 %
c 40c 20c
c
a��'--------��--� 0 2 4 6 8 10 planned pavement section were computed using the bearing capacity Figure 7.
model described above. Surface and air temperatures at the time of the failures
LABORATORY CBR
Percentile Test Value as a Function of Soaked Laboratory CBR -- AA Route
were, reportedly, 60 and 26.7 degrees Centigrade, respectively. A temperature-depth (4) model (1) was used to estimate the temperatures at each midpoint of each 2.54-cm asphaltic layer. Using these estimated temperatures, �-and c-values for each layer were estimated from the curves shown in Figures 3 and 4. Values of CBR were converted to undrained shear strengths using the relationship given by Equation 1. A uniformly distributed, tire contact stress of

Hopkins. Hunsucker, Beckham
24,-----------------·--------,
FIELD AVG.
6
552 kPa (dual wheels) was assumed in the analysis.
Factors of safety, based on different CBR design assumptions, are compared in Figure 8. When the average CBR value of the data set is assumed to be the correct value, a factor of safety of 1.33 is obtained. If it is assumed that the CBR (equal to 5) used in the original design is correct, then a factor of safety of about 1.59 is obtained. If the CBR values obtained from reliability theory at a confidence interval of 95 percent are used, then factors of safety of 1.22 and 1.43 are obtained. This approach
yields an unsafe design. In each of these three cases, the factor of safety is much greater then one. However, since the pavements failed, the factor of safety should be near one. Based on values of CBR (1.4, 1.8, and 2.1) corresponding to percentile test values of 95, 90, and 85, factors of safety of 0.91, 1.00 and 1.07 are obtained, respectively. The CBR value (1.8) corresponding to the 90th percentile test value, which yields a factor of safety of one, appears to be an appropriate design choice.
The problem of selecting a design CBR value may be illustrated in another manner using model analysis to determine the required thickness for a given design factor of safety. Based on an analyses ( 1) of some 237 asphaltic pavement sections of the AASHO Road Test (7), an approximate relationship, corresponding to a serviceability index of 2.5, between factor of safety and (weighted) equivalent single-axle load (ESAL) was developed, or
F = (0. 095) Ln (ESAL) - 0. 0 05 ( 3)
Inserting the design ESAL of 4 million into Equation 3, the design factor of safety is 1.44. The total pavement thickness corresponding to a selected sub grade CBR value and design factor of safety was obtained from the bearing capacity model by iteration. The thickness of the pavement is varied until the factor of safety is equal to the selected design factor of safety obtained from Equation 3. The thickness of the DGA ( 10.2 em) was held constant so that the various thicknesses (based on different assumed CBR design values) could be compared to the thickness of the pavement sections after overlays were constructed.
Thicknesses obtained from the various analyses, based on different assumed design values of CBR and corresponding to a factor of safety of 1.44, are shown in Figure 9. If the lowest value of CBR ( 1.3) is assumed to be the correct design value, than a total thickness of 53.1 em is required. This thickness is some 16.3 em larger than the planned thickness. If the average value of CBR (3.4) is used, a thickness of 40.1 em is obtained. The average CBR value yields a thickness that is only 3.3 em greater

!fopkins. Hunsucker, Beckham
Flexible Pavement Thicknesses obtained for Diggerent CBR Design Values
.7
than the original planned thickness. A value of 3.4 corresponds to a percentile test value of only about 40 to 50 (Figure
, numerous (spot-to-spot) of the pavement would require future maintenance. Required thicknesses obtained when the upper and lower bound values ofCBR obtained from reliability theory are only 0.25 em to 2 em, respectively, greater than the original design section, which failed. If the CBR value (1.8) occurring at the 90th percentile is assumed to be the correct design value, then a thickness of 50 em is obtained -- a thickness that is some 13.2 em greater than the original planned section. As shown in Figure 6,
values of CBR less than 1.8 occur at only about ten percent of the sampling sites.
Approximately 50 percent of the total length of the highway sections was repaired using an overlay thickness of about 12.7 em. Total thickness of the pavement at those locations after overlaying was about 49.5 em -- a value that is nearly identical to the thickness (50 em) obtained when the value of CBR at the 90th percentile test value is used. The method proposed by Yoder appears to be a reasonable approach to the problem of selecting a design subgrade strength as strongly indicated by this case history analyses. Using the 1981 Kentucky design curves (8), a thickness of 47 em is obtained. Proper selection of a subgrade design value of CBR (or other strength parameters) is vital to avoid construction failures and to insure good pavement performance.
EFFECT OF MOISTURE ON SOIL SUBGRADES
Subgrades built of clayey soils and compacted according to standard compaction specifications generally possess large bearing strengths immediately after compaction. However, there is no assurance that the subgrade soils will retain their original strengths. Bearing strengths of the completed subgrade depend on the long-term density and moisture. The original compactive state of clayey soils is very likely to
change with increasing time and load applications. Clayey soils tend to absorb water
and increase in volume. With an increase in volume, the shear strength available to
resist failure decreases. The differences in bearing strengths of compacted soils in soaked and unsoaked states may readily be illustrated by analyzing the results of some 727 laboratory CBR tests (1). Each specimen of the group of tests was penetrated before soaking and after soaking. Before soaking, and immediately after compaction, bearing ratios of 95 percent of the specimens were greater than 6. Mter soaking, the bearing ratio of only 54 percent of the specimens exceeded 6. As shown
by the theoretical analysis, bearing capacity failures may occur in the sub grade when the CBR is less than about 6.5 and the tire contact stress of construction vehicles is

Hopkins. Hunsucker, Beckham 8
about 552 kPa.
-����--�------------Ei el d observationsalsosh�V1Lthat-00a!;inff-8tl'm:lgths-Gf-ela:y:ey-Subgr-ad..es-may-doorease-�----�-----significantly after construction (1, 9). Field CBR tests were performed on a clayey subgrade, at a highway construction site in Kentucky, i=ediately after compaction. Values of CBR ranged from about 20 to 40. A second series of field CBR tests were performed after the subgrade has been exposed to a winter season. Values ranged from about 1 to 4 -- a dramatic decrease in bearing strengths. Hence, as noted by Yoder and Watczik (10), pavement design analysis should be based on the characteristics of the completed subgrade. In areas where water may infiltrate the subgrade from surface and subsurface waters, the design should be based on the strength of the soaked condition of the completed subgrade. The strength may be very large if field tests are performed on the subgrade i=ediately after compaction. When sufficient time has elapsed between the completion of sub grade compaction and paving, and the subgrade has been exposed to wetting conditions, then using the field strengths of the soaked subgrade may represent a valid approach. However, when the pavement is placed i=ediately after compaction, then the field strengths may be too large to assume for design purposes. Moreover, many projects are scheduled years in advance and it may not be convenient, or the opportunity may not be available, to perform field tests in a soaked condition before the design analysis. Hence, the design analysis should be based on the soaked strengths of laboratory tests. When the design is based on laboratory tests, then a question arises concerning the similarity of field and laboratory strengths.
COMPARISON OF FIELD AND LABORATORY SUBGRADE STRENGTHS
�100>-���A�A�H�W�Y�c=L�A��=E�Y�S�U�B�G�R�AD�E� -J --- -:!!: STUDY PERIOD • 6 YRS. ::>: 80 c
40f 20r
2 Figure 10.
4 6 CBR
8 10 12 Field and Laboratory Percentile Teet Values as a Function of CBR -- AA Route
To determine the similarity of laboratory and long-term field strengths, two highway routes were selected where a number of laboratory (soaked condition) bearing ratios had been performed on the corridor soils. Field bearing ratio tests were performed through core holes on top of the untreated subgrades over a period of 5.5 years. Testing did not commence until the pavement had been placed and at least one winter and spring season had passed. Because it was not certain where particular corridor soils would be placed in the subgrades of each route, curves of percentile test value as a function of laboratory and field bearing
ratios were developed and compared. Soils of the first route (identified as AA route) are residual soils of the Kope Geological Formation (clayey shales). Classification of these soils ranged from A-6 to A-7 and CL to CH. A comparison of percentile test values as a function of laboratory and field values of CBR of this route is presented

Hopkins. Hunsucker, Beckham 9
in Figure 10. Average values of laboratory and field CBR were 3.5 (56 tests) and 4. 1 ___
_______________ _(2j! _ _t�sts)Lr:esp!l_C_tively. At the 90th and 80th percentile test values, the laboratory strength is about 90--percenToftiie-fieid-CBR:-Befween -mnoaoo-utteiCperc-ent;tlie ____
____________ _
laboratory CBR value was about 90 to 70 per cent of the field value. Hence, there was reasonable agreement between the laboratory and field percentile test curves.
Comparison of laboratory and field
�100��-------,�K�Y�R�O�U��=E�t�t-------, .... I CLAYEY SUBGRADE § BOr !SWDY PERIOD • 6 YRS.
40r
2or
QL--2'--------------------� 0 5 10
CBR 15 20
values of CBR of the second highway route (KY Route 11) is shown in Figure 11. Classifications of the soils on this route ranged from A-4 to A-7 and MLCL to CL. From percentile test values of 100 to 90, the field and laboratory values are essentially the same. Between percentile test values of 90 and 10, the field value is some 100 to 75 percent of the laboratory CBR. At the 90th and 80th percentile test values, the field and laboratory values of CBR are nearly identical. Based on these Figure 11. comparisons, laboratory CBR values
Field and Laboratory Percentile Test Values as a Function of CBR •• Ky Route 11
appear to provide a reasonable representation of the field CBR values of the completed subgrade after sufficient time has elapsed for soaking conditions to develop. Consequently, design strength of the untreated subgrade may be based on the soaked laboratory CBR test.
STABU.IZATION REQUIREMENTS
As shown by the theoretical analyses, Figure 5, bearing capacity failures may occur in the subgrade during construction when the CBR value is below about 6.5 and the tire contact stress is 552 kPa. Consequently, to avoid bearing capacity failure of the completed subgrade during construction, to provide a firm platform for paving, and to insure efficient construction, it may be necessary to stabilize the soils using chemical admixtures, such as cement or hydrated lime. Considering that a variety of strengths may exist in the completed subgrade, subgrade stabilization should be considered when the CBR value occurring at about the 80th or 90th percentile test value is below about 6.5-10, although the value of the design CBR may be selected at some percentile test value that is smaller than the 80th or 90th percentile test value if cost ratios are used. By using the CBR value at the 80th or 90th percentile test value, adequate subgrade stability should be available to maintain efficient construction throughout.

Hopkins. Hunsucker. Beckham 10
DESIGN STRENGTHS OF CHEMICALLY STABILIZED SUBGRADES
�--�----------s-ilieciiolioTthecreslgnstrength-oTsi.ibg'racre-s-treatea-mm�cemen.t-ornyararealrm:e----------------will be controlled by the time allowed for curing. At the end of the curing period, sufficient strength must exist to withstand construction traffic loadings and to avoid bearing capacity failures. If the strength existing at the end of a selected curing period can be estimated with some degree of confidence, then that strength may be used in the pavement design analysis. For example, in Kentucky, treated subgrades are allowed to cure for seven days and substantial strength gains occur in the treated layer during the curing period. This specified curing period appears to be acceptable to sponsoring agencies and contractors. Optimum percentages, as determined from testing (1), of cement or hydrated lime are used to treat the subgrades.
General guidelines for selecting the design strengths of hydrated lime- and cementtreated subgrades were developed on the basis of strengths of the treated !:ayers existing at the end of a seven-day curing period. Several highway routes were selected and core specimens of the hydrated lime- or cemented- treated subgrades were obtained at about the end of the seven-day period. Numerous types of soils, ranging from A-4 to A-7, were used to construct the subgrades at the selected routes. Unconfined compression tests were performed on the core specimens. Bag samples of the untreated soil subgrades were obtained at several, equally spaced, locations along each route of the completed sub grade before treatment. Specimens of these soils were remolded to optimum moisture content and 95 percent of maximum dry density (AASHTO T 99). Optimum percentages of chemical admixture were used in remolding the specimens. After aging the sealed specimens for 7 days, unconfined compression tests were performed.
�100.-�--------------; :3 _._
SOIL - HYDRATED LIME SUBGRADE § 80r 7-DAY STRENGTH
Field and laboratory unconfined compressive strengths of the cementand hydrated lime- treated specimens, as a function of percentile test values, are shown in Figures 12 and 13. Unconfined compressive strengths -of the
. "' field, hydrated lime-treated specimens 40r . � were about 85 to 90 percent of the
20h _ . J 0 unconfined compressive strengt�of the
,[3$SkP4j laboratory specimens for percen · e test
o'-1 _ _:_·�--�__:_::!:=<,_-.� _ _j values ranging from 100 to about 10. o soo 1000 1500 2000 2500 This indicated that the hydrated lime
UNCONFINED STRENGTH (kPa and clayey soils were mixed very well in Figure 12. Field andLaboratoryPeroontile the field and also indicated that the
Teet Values as a FunctWn of CBR .. Soil-Hydrated Lime hydrated lime penetrated the clayey Subgrades clods. Unconfined compressive strengths
of the field, cement-soil core specimens ranged from about 75 to 50 percent of laboratory unconfined compressive strengths for percentile test values ranging from 100 to 0, respectively. Assuming that the 90th percentile test value is a reasonable working level, unconfined compressive strengths

Hopkins, Hunsucker, Beckham 11
of about 333 kPa and 707 kPa (undrained shear strengths, Su, of 167
-----------------�------ ito-tone=-=-�-1"--=---=�:oc---�:=-�..::-�=-:�-=-:-:--::=-T---� ---aru:h354-kPa�-respectiveiyt-app-ear-rooe--�-----------::J -- -
SOIL �-g����iJ:�?!JADES reasonable values to assume in the § aor design of hydrated lime- and cement-f-. <:1) ' treated soil subgrades, respectively. � sor ..., Corresponding values of bearing ratio,
� 4or estimated from Equation 1, are about
iij 11.6 and 24.9, respectively. Estimated � 20r $ values of dynamic modulus of elasticity o.: i 707 kPa I (Equation 2) are about 152,590 and 00c:===1=�":'2:__ __ 3 _ _::::::_4 __ _j5 297,489 kPa, respectively.
UNCONFINED STRENGTH THOUSANDS kPa
Figure 13. Field andLaboratoryPercentile Test Values as a Function of CBR -- Soil-Cement Subgrades
APPROXIMATE REQUIRED THICKNESSES OF TREATED SUBGRADES
60) TIRE CONTAC T STRESS • 552 kPa
e; , F • 1.5 0 I SOIL Cl)40f -HYDRAieD £�
C/) ' I!" � ! � ' �20f i!: :
I
o L--�------------�--� 0 2
Figure 14.
4 6 SUBGRADE CBR
8 10 T h i c k n e sses o f T r eated Subgrades as a Function of Untreated Subgrade CBR Values
By using the seven-day strengths, some portion of the total strength gain of the hydrated lime- or cement- treated subgrade may be considered in the pavement design analysis. However, use of these strengths does not, necessarily, assure that bearing capacity failure of the treated layer will not occur. The bearing capacity of the chemically treated layer is a function of the thickness of the treated layer and the bearing strength of the untreated layer located below the treated layer. To estimate thicknesses required to maintain an assumed stable condition (say, Fc1.5), bearing capacity analyses were performed using the model
described above. In the analysis of this two-layered problem, the tire contact stress was assumed to be 552 kPa, the unconfined compressive strengths occurring at the 90th percentile test value (Figure 10) were assumed for the treated layers, and the bearing ratio of the untreated layer was ranged from 1 to 9 (or unconfined strength ranging from 15 kPa to 130 kPa). Thicknesses, as shown in Figure 14, of hydrated lime-treated sub grades required to maintain a factor of safety of 1.5 range from about 40 em to 11 em for values of CBR of the untreated layer ranging from 1 to 9. For cement-treated sub grades and for CBR values ranging from 1 to 7, required thicknesses range from about 21 em to 7.6 em.

Hopkin.s, Hunsucker, Beckham 12
SIGNIFICANCE OF TREATED SUBGRADES TO PAVEMENT STRUCTURE
----------------------Use---o-f-hydl'ated-li.m.e-- o-r--Gmn�-IIllt--�nly-:ina�--tha-sh ear _ _stren gth _llLa_soiL_-----------------subgrade but it also improves the overall bearing capacity of a flexible pavement. The value of stabilizing subgrades with hydrated lime or cement may readily be demonstrated by an example design problem. Assume, for instance, that a flexible pavement is to be designed for an equivalent single-axle load (ESAL) of 18 million and the subgrade soils are the same as those used at the 1960 AASHO Road Test (7). Percentile test values as a function of field CBR values (from the trenching program--Table 2 of Reference 7) for spring and summer seasons were determined. At the 90th percentile test value, bearing ratios, corresponding to spring and summer are 2.5 and 3.0, respectively. Average CBR values are 3.6 and 5.3, respectively. The design is to consist of one-third asphaltic concrete and two-thirds crushed stone. Coefficients, a1 and a2, are 0.44 and 0.14, respectively, terminal serviceability index is 2.5, and tire unit contact stress is 466 kPa. The soil support value is 3.
The structural number, SN, is 5.6. Total pavement thickness is 59.2 em -- 19.8 em of asphaltic concrete and 39.4 em of crushed stone base. Using the CBR of the untreated subgrade occurring at the 90th percentile (2.5 or an undrained shear strength of 36.7 kPa), model analysis yields a factor of safety of 1.29. If the average CBR (3.6) is used, then a factor of safety of 1.55 is obtained. From Equation 3, the estimated ESAL is only 800,000 -- a value that is much lower than the design ESAL of 18 million. If the average CBR of 3.6 is used in the analysis, then the estimated ESAL value is about 16 million, which is near the design value of 18 million. However, the percentile test value, is only about 40. Hence, if the value of 3.6 is used, much maintenance would be required.
Since the CBR value occurring at the 90th percentile test value (as well as the average CBR occurring at the 40th percentile test value) is below a CBR of 6.5, stabilization of the soil subgrades should be considered to avoid bearing capacity failures. Moreover, difficulties may be encountered during placement of the first lift of crushed stone base if treatment was not performed. Bearing capacity analysis of the untreated soil subgrade based on the undrained shear strength occurring at the 90th percentile test value yields a factor of safety of only 0.46. Using the average CBR value of 3.6 (or an undrained shear strength of 49 kPa), the factor of safety is only 0.65. Now if the subgrade soils remained free of water (an unsoaked condition) during construction, then the CBR strength may be greater than 6.5 and construction difficulties would not be encountered during paving. The designer cannot rely on this unlikely condition. Subgrade stabilization should be performed.
In the design analysis, both hydrated lime- and cement-treated subgrade layers were considered. For the hydrated lime-treated subgrade, an undrained shear strength occurring at the 90th percentile test value was used in the analysis. A strength value of 36.7 kPa (CBR=2.5) was used for the underlying untreated layer. For an assumed thickness of 30.5cm, a factor of safety of about 1.36 was obtained. This level of factor of safety should be sufficient to avoid bearing capacity failures and deep rutting during construction. If a 12.7-cm subgrade layer of soil-cement is assumed, then a

Hopkins. Hunsucker. Beckham 13
factor of safety of abut 1.35 is obtained.
----------------MGdel-analyses-we-r-e-"l*�rr.Qrmed-te-determine--the--faGror-*lf�ety-�-the-full-59"'2.-sm.--------------of pavement resting on the 30.5-cm layer of hydrated lime-treated subgrade or the 12.7-cm layer of cement-treated subgrade. In both cases, the values of undrained shear strength for the treated and untreated layers occurring at the 90th percentile test values were used. When the lime-treated layer is included in the design, a factor of safety of 1.85 is obtained. Hence, the factor of safety increases from 1.29 (no treatment) to 1.85, or about 31 percent. Predicted values of ESAL (Equation 3) are much in excess of 18 million. Similarly, when a 12.7-cm layer of cement-treated subgrade is used, a factor of safety of 1.85 is also obtained. Based on Equation 3, a design factor of safety of 1.57 is required. Hence, according to this approach the thicknesses of the asphalt layer and crushed stone could be reduced. Thickness of the asphaltic layers can be reduced from 19.8 em to 12.7 em and the crushed stone thickness could be reduced from 39.4 em to 25.4 em when a 30.5 em layer of hydrated lime-treated sub grade or 12.7 -em layer of soil-cement is used. In both cases, the factor of safety is about 1.57 -- the required value that satisfies equation 3.
LAYER COEFFICIENTS OF HYDRATED LIME- AND CEMENT- SOILS
The coefficient, a3, may be estimated for the hydrated lime-treated subgrade and the soil-cement layer for the example described above.
The structural number, SN, is defined as
where
SN = a1 d,. + a2d, + a3d,, (4)
a1, a2, a3 = layer coefficients representative of surface, base, and subbase (in this case, the treated layer), respectively, and d1, d2, d3 = actual thicknesses, centimeters, of surface, base and subbase courses, respectively.
Since a1 and a2 are equal to 0.44 and 0.14, respectively, the structural number is 5.6, the thickness of the asphalt is 12.7cm (or d1=5 in.), the crushed stone thickness is 25.4 em, and the hydrated-lime layer is 30.5 em (or d3=12 in.), a3 equals 0.17. Similarly, a3 equals 0.34 when the 12.7 em layer of soil-cement is considered.
SUMMARY AND CONCLUSIONS
Guidelines for selection of design strength of untreated soil subgrades and sub grades treated with cement or hydrated lime were proposed. Theoretical bearing capacity analysis showed that a minimum subgrade strength must exist to avoid bearing capacity failures during construction. To maintain an incipient failure state (factor of safety, F, equal 1.0) and an assumed stable state (F = 1.5), the undrained shear strength should be 94 kPa and 144 kPa, respectively. These values correspond to CBR values of about 6.5 and 10, respectively. Corresponding values of dynamic modulus

Hopkins, Hunsucker, Beckham 14
of elasticity were 92 mPa and 134 mPa. Based on a case history involving the failure of a partially completed pavement, the method proposed by Yoder (3) in 1969 appears
___________ ________ tfLruL.a_rea son a ble_approa cb _ for_ .anaLyzing __ stren gtb __ data_ .oLcorridm:_so:ils._.a.n.d_in_ _ _ _____________ _ selecting design strengths on the basis of percentile test values.
It was proposed that if the minimum strength for a selected percentile test value is less than the minimum strength required to avoid bearing capacity failures during construction, then chemical stabilization (or other stabilization methods) of the sub grade should be considered. For example, if the tire contact stress of construction equipment is 552 kPa and the CBR is 2.5 at a selected percentile test value, then sub grade stabilization should be performed since the CBR strength of 2.5 is less than the CBR strength of 6.5 required to maintain an incipient failure condition. However, to avoid bearing capacity problems during construction, the subgrade CBR strengths should generally be greater than about 6.5.
Field CBR values of untreated subgrades obtained at two highway sites over a period of about 5.5 years were compared to soaked laboratory CBR values of corridor soils. Soaked laboratory CBR strengths appeared to represent reasonably well the longterm field CBR strengths of the clayey subgrades of the two routes. Use of soaked laboratory CBR strengths appears to provide a reasonable approach for selecting design CBR strengths of clayey sub grades.
Unconfined compressive strengths of core specimens of several soil subgrades treated with hydrated lime and cement were compared to strengths of laboratory specimens that had been mixed with hydrated lime and cement for percentile test values ranging from 100 to 10. Strengths of core specimens mixed with hydrated lime were about 85 to 90 percent of the laboratory strengths. Strengths of soil-cement cores were about 75 to 50 percent of laboratory strengths for percentile test values ranging from 100 to 0. Based on a 7-day curing period and strengths of core specimens occurring at the 90th percentile test value, unconfined compressive strengths of about 333 kPa and 707 kPa appear to be reasonable values to assume in the design of hydrated lime- and cement-treated soil sub grades, respectively. Corresponding CBR values are 11.6 and 25. Dynamic modulus of elasticity is 152 mPa and 298 mPa, respectively. Bearing capacity model analysis of an example problem showed that treated subgrades, based on these values, increased the overall bearing capacity of flexible pavement substantially.
ACKNOWLEDGEMENTS
This work was a task of a research study (KYHPR 90-132; NCP Code 4E3B0662) funded by the Federal Highway Administration (FHWA) and the Kentucky Transportation Cabinet.
REFERENCES
1. Hopkins, T.C.; "Bearing Capacity Analysis of Pavements", Research Report KTC-91-8, University of Kentucky Transportation Center, College of

Hopkins, Hunsucker, Beckham 15
Engineering, June, 1991.
��--�-�--�-----�--�---z-.�----Ho-pkins-,-'P:fr;;-''A:1Jerreraiized8lope Stabtttcy Computerflogram:TISefsuillae--�----- --
for HOPK-1," Research Report UKTRP-86-2, University of Kentucky Transportation Center, College of Engineering, January, 1986.
3. Yoder, E.J.; "Selection of Soil Strength Values of the Design of Flexible Pavements," Highway Research Record 276, 1969.
4. Southgate, H.F. and Deen, R.C.; "Temperature Distribution within Asphalt Pavements and Its Relationship to Pavement Deflection," Highway Research Record, HRB-291, Washington, D.C., 1969.
5. Thompson, M.R.; "Admixture Stabilization of Subgrades," Proceedings, Nineteenth Annual Ohio River Soils Seminar (OVRSS), Lexington, Kentucky, October 1988.
6. Heukelom, W. and Foster, C.R. ; "Dynamic Testing of Pavements," ASCE Journal of the Structural Division, No. SM1, 86, February 1960.
7. The AASHO Road Test, Proceedings, Special Report 73, Publication No. 1012, National Academy of Sciences - National Research Council, Washington, D.C., May 1962.
8. Havens, J.H.; Deen, R.C.; and Southgate, H.F.; "Development of a Thickness Design Guide for Bitumin us Concrete Pavement Structures," Research Report UKTRP-81-17, University of Kentucky Transportation Center, August 1981.
9. Hopkins, T.C.; Hunsucker, D.; and Sharpe, G.W.; "Highway Field Trials of Chemically Stabilized Soil Subgrades, Proceedings, Nineteenth Annual Ohio River Valley Soils Seminar (ORVSS), Lexington, Kentucky, October 1988.
10. Yoder, E.J. and Witczak, M.W.; "Principles of Pavement Design," Second Edition, John Willey and Sons, New York, N.Y., 1975.