The Use of Administrative Sources for Statistical Purposes Common Problems and Solutions.
64
The Use of Administrative Sources for Statistical Purposes Common Problems and Solutions
-
Upload
dominic-mcdowell -
Category
Documents
-
view
217 -
download
0
Transcript of The Use of Administrative Sources for Statistical Purposes Common Problems and Solutions.

The Use of Administrative Sources for Statistical Purposes
Common Problems and Solutions

Public Opinion
• The level of public concern about government departments sharing data varies from country to country
• There is usually some suspicion of the motives for data sharing
• Sometimes public opinion favours data sharing

• Adopt and publish a code of practice following international standards
• Clearly stated limits and rules may help reduce concerns
• The principle of the “one-way flow” of sensitive data must be understood by all
Solutions

Solutions
• Publish cost-benefit analyses of the use of different sources
• It may be possible to claim that data are more secure– No questionnaires sent by post
– Fewer clerical staff, so fewer people with access to data

Public Profile
• Direct contact with the public via surveys helps raise the profile of the statistical office
• The use of administrative data can reduce contact with the public and awareness of the work of the statistical office

• Effective ‘marketing’ of the statistical office and data outputs
• Greater involvement with education institutions, business groups, and other target customers
Solutions

Units
• Administrative units may be different to statistical units:– Job / person
– Tax unit / enterprise
– Dwelling / household
• They may need to be converted to meet statistical requirements


Group Exercise
Statistical andAdministrative
Units – How Many Enterprises?

Enterprise Definition
“the smallest combination of legal units that is an organisational unit producing goods or services, which benefits from a certain degree of autonomy in decision-making .... An enterprise may be a sole legal unit.”
Source: EU Regulation 696/93 on statistical units

Examples
Taken from “The Impact of Diverging Interpretations of the Enterprise Concept” - a study prepared for Eurostat by Statistics Netherlands with input from Denmark and UK
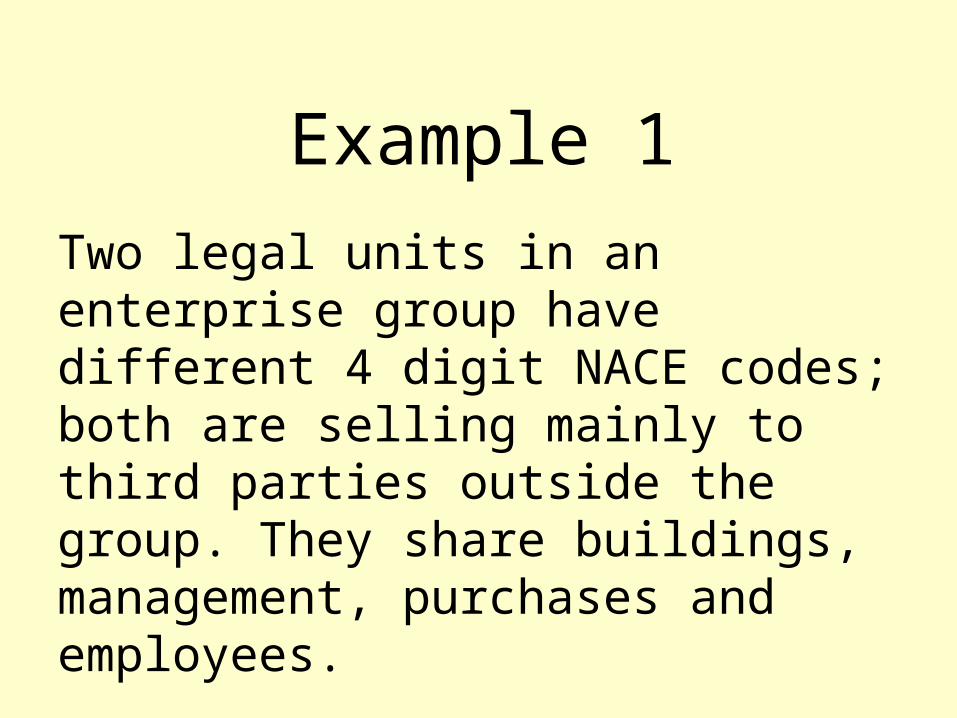
Example 1
Two legal units in an enterprise group have different 4 digit NACE codes; both are selling mainly to third parties outside the group. They share buildings, management, purchases and employees.

Answers
• NL: Combine into one enterprise– Intensity of shared production factors
• UK: Combine into one enterprise– Intensity of shared production factors
• DK: Two separate enterprises– Both sell more than 50% outside the group

Four Legal Units : A and B have different activities, no combined purchases, but share buildings. C and D share buildings, employees, and purchases. All four present themselves as one firm.
Example 2

Answers• NL/DK: A and B are separate
enterprises. Combine C and D into one enterprise– because A and B operate on market
terms, whilst C and D share production factors
• UK: All four in one enterprise– because they present themselves as one
firm

Three legal units: All produce mainly for external customers, they share management and purchases, and represent themselves as one firm. A and B share a building. B and C have the same activity, share employees and capital goods and can not supply separate data.
Example 3

Answers• NL: Combine into one enterprise
– All share management and purchases, and represent themselves as one firm
• UK/DK: Combine B and C into one enterprise, A is a separate enterprise– Because B and C are horizontally
integrated, and data are only available for these two together

Twelve legal units form an enterprise group. Only one is active, the others have no employees.
Example 4

Answers• NL: One enterprise which only consists
of the active unit– Because units which are not active are
not part of an enterprise
• UK: One enterprise which consists of all units– Because there is no point having separate
enterprises for non-active units
• DK: Each unit is a separate enterprise– There are no strong ties between the units

Solutions• Automatic rules for simple cases
– These must be clear and consistent
• Statistical “adjustments”– E.g. the statistical unit is persons. The
administrative unit is jobs. We know from a survey that working people have, on average, 1.15 jobs. This adjustment factor can therefore be used to estimate persons in employment from jobs
• Profiling

Profiling Definition• Profiling is a method to analyse the legal,
operational and accounting structure of an enterprise group at national and world level, in order to establish the statistical units within that group, their links, and the most efficient structures for the collection of statistical data.
Source: Eurostat Business Registers Recommendations Manual, Chapter 19

Profiling
• Gives a better understanding of complex unit structures
• It is expensive and time consuming
• It needs trained staff
• It is a compromise based on a trade- off between quality, quantity and the resources available

Quality
Quantity Resources

Business Profiling in the UK• 14 Staff• Approx. 1500 cases per year
– Including 100 public sector
• Mix of desk and visit profiling– Approx 200 visits per year
• Should profilers also collect data from key businesses?

Definitions of Variables
• Administrative data are collected according to administrative concepts and definitions
• Administrative and statistical priorities are often different, so definitions are often different

Unemployment
• Statistical definition (ILO)
– Out of work
– Available for work
– Actively seeking work
• Administrative definitions are often based on those claiming unemployment benefits

Solutions
• Know and document the differences and their impact
• Use other variables to derive or estimate the impact of the difference
• Statistical adjustments during data processing

Classifications
Two scenarios:
1. Same classification system
2. Different classification systems

Same Classification
• Used for different purposes
• May not be a priority variable for the administrative source
• Different classification rules
• Different emphasis, e.g. specific activity rather than main activity

Solutions
• Understand how classification data are collected and what they are used for
• Provide coding expertise, tools and training to administrative data suppliers

Different Classifications
(or different versions of the same classification)
• Not always a 1 to 1 correlation between codes
• Tools are needed to convert codes from one classification to another

Solutions (1)• Stress the advantages of using a
common classification
• Offer expertise to help re-classify administrative sources
• Give early notice of classification changes and help implement them across government

Solutions (2)• Use text descriptions to re-code
administrative data• Use probabilistic conversion
matrices to convert codes– This results in individual unit
classifications not always being correct, but aggregate data should be OK
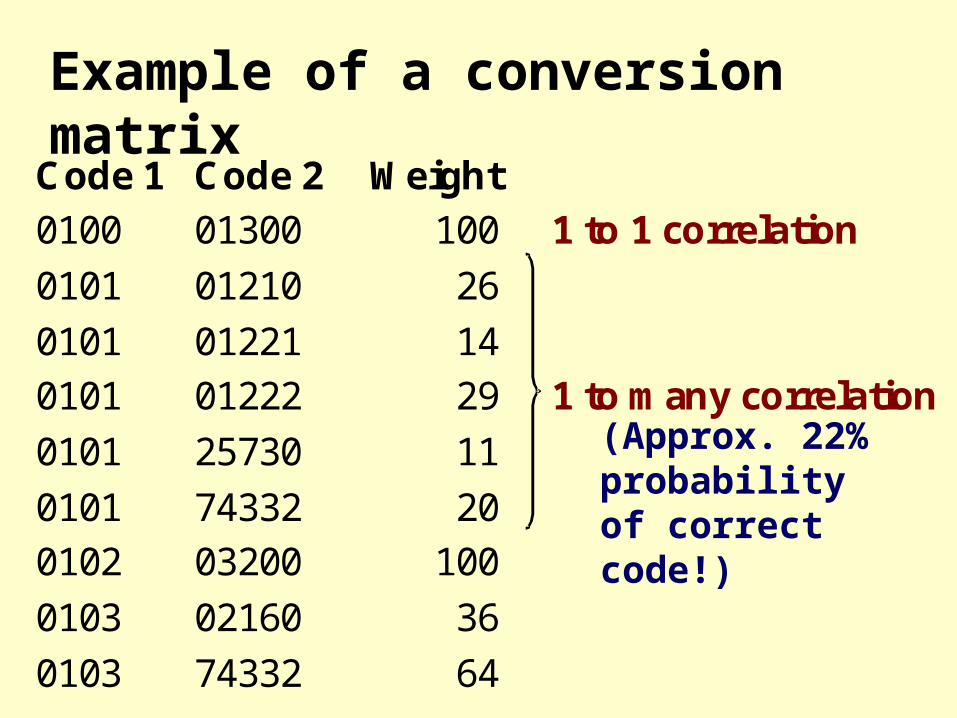
Example of a conversion matrix
Code 1 Code 2 Weight
0100 01300 100 1 to 1 correlation
0101 01210 26
0101 01221 14
0101 01222 29 1 to many correlation
0101 25730 11
0101 74332 20
0102 03200 100
0103 02160 36
0103 74332 64
(Approx. 22% probability of correct code!)

Missing Data
• Impute where possible
• Many different imputation methods are used. Two common methods are:– Deductive Imputation
– Hot-deck Imputation

Case Study
• Eurostat have a project to develop enterprise demography
• They want to estimate the impact of enterprise births
• Employment of new enterprises is used, but this variable is often missing or unreliable for new units
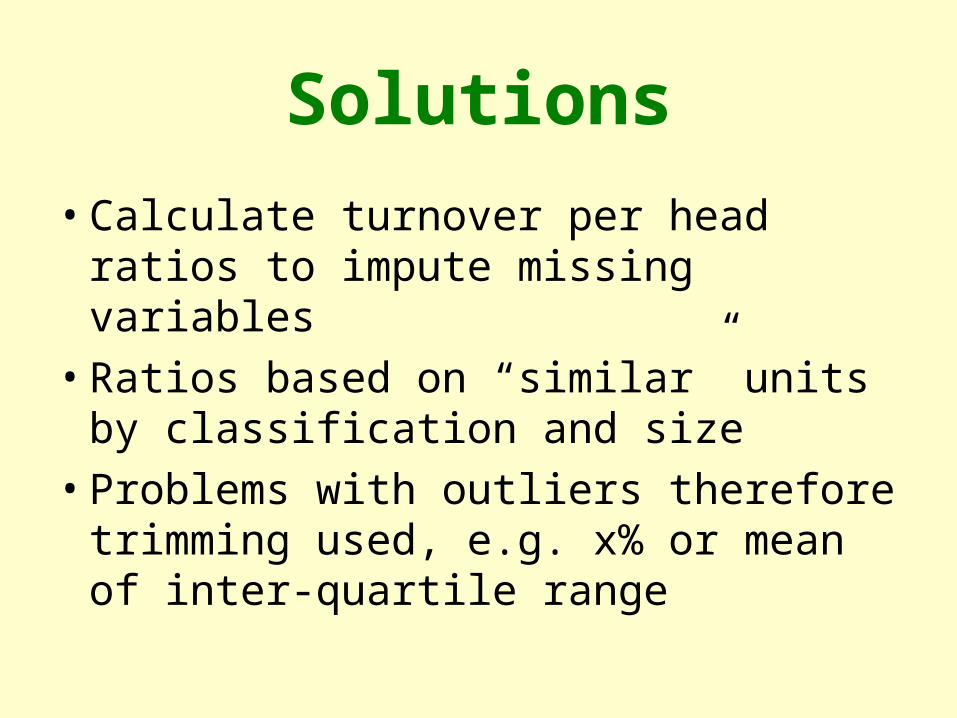
Solutions
• Calculate turnover per head ratios to impute missing variables
• Ratios based on “similar” units by classification and size
• Problems with outliers therefore trimming used, e.g. x% or mean of inter-quartile range

Possible Distributions
TPH Values
Fre
qu
en
cy
TPH Values
Fre
qu
en
cy
TPH Values
Fre
qu
en
cy
TPH Values
Fre
qu
en
cy

Turnover per head ratios in practice
ISIC TPH.....45.11 9545.12 6845.21 149.....
A business has ISIC class 45.12, turnoveris 200, employment is missing. What isthe imputed employment value?

Imputed employment is:
200 / 68 = 2.94 = 3

Ratios such as turnover per head are also very useful
for validating updates, matching and detecting
errors!

Timeliness
Two Issues
• Data arrive too late
• Data relate to a different time period

Data arrive too late
• Data from annual tax returns are often only available several months after the end of the tax year, so they are unsuitable for monthly or quarterly statistics
• Lags in registering “real world” events

UK VAT Birth Lags (1)
0
20
40
60
80
100
120
140
160
180
2000 50 100
150
200
250
300
350
400
450
500
550
600
650
700
750
800
850
900
950
1000
Lag in days
Fre
quen
cy (
thou
sand
s)

UK VAT Birth Lags (2)
• 2/3 of businesses are on the register within 2 months of start-up
• Mean lag = 4 months due to “outliers”
• Median = Approx. 40 days
• Some pre-register - negative lags

Solutions
• Understand the length and impact of lags
• Adjust data accordingly
• Look for ways to reduce lags where possible

Different Time Periods
• Administrative reference period (e.g. Financial/tax year) may not be the same as the statistical reference period
• Monthly average versus point in time (e.g. employment data)

Different Time Periods Statistical / Calendar Year
(0.25 x 146) + (0.75 x 168) = 162.5
(or more complex formulae)
Financial Year 1 Financial Year 2
146
168

Solutions
• Statistical corrections or estimations using data from other reference periods
• Be aware of possible biases when using point in time reference dates
Using data from different sources
• Data from different sources may not agree
• This may be due to:– Different definitions, classifications, time
periods,....
– Errors

Using data from different sources
Group Exercise

Steve Vale Stephen Vale 5 Brynheulog Tce 5 Brynheulog Terrace Machen Machen Newport Caerphilly Gwent South Wales NP1 8QB CF83 8QB 28/11/1966 28/11/1996 Statistician Civil Servant CSO Office for National Statistics NP10 9XX NP10 8XG Honours Degree Married University of Wales 2 Children

Solutions
• Data validation checks
• Benchmarking against other sources
• Priority rules for updating from different sources
• Knowledge of source quality

Benchmarking
The map compares UK business register and “Yellow Pages” coverage for England and WalesKey:
Blue = More businesses on register
Red = More businesses in “Yellow Pages”

Priority Rules• Different sources can be given different
priorities for different variables• To stop a “low priority” source
overwriting a “high priority” one– Use source codes– Use priority / quality markers– Store dates with variables– Load data in reverse priority order

Resistance to Change• Statisticians may resist the use of
administrative data because they:– Do not trust data unless they collect them
themselves;
– Focus on negative quality aspects;
– Have an over-optimistic view of the quality of survey data;
– Assume survey respondents comply with statistical norms.

Solutions• Education (courses like this!)• Take a wider view of all the
dimensions of quality, and focus on the impact on users
• Determine the real relative quality of survey and administrative data
• Identify how cost savings can be used to improve quality and / or increase outputs

Change Management
• Risk of changes in:– Government / administrative policy
– Thresholds
– Definitions
– Coverage
– Systems

High-Risk Times
• Immediately after an election
• Change of minister
• Change of government policy
• Change in EU legislation
and….
• When you least expect it!

Solutions
Manage the Risk by:– Legal provisions
– Contractual agreements
– Regular contact with administrative colleagues
– Anticipating changes
– Contingency plans

Questions:
Do you have contingency plans?
Have you ever needed contingency plans?

Better to be proactive beforehand than
have to react after the event !

Summary
• There are many problems to overcome when using administrative sources
• Most can be reduced by effective planning and management
• The benefits are still often greater than the costs

Group Discussion
What is the main problem with using
administrativesources in your area of
statistics?