THE UNIVERSITY OF THE STATE OF NEW YORK … Three different human cells are shown below. Which...
28
8 THE UNIVERSITY OF THE STATE OF NEW YORK GRADE 8 INTERMEDIATE-LEVEL TEST SCIENCE WRITTEN TEST SPRING 2007 Name School The questions on this test measure your knowledge and understanding of science. The test has two parts. Both parts are contained in this test booklet. Part I consists of 45 multiple-choice questions. Record your answers to these ques- tions on the separate answer sheet. Use only a No. 2 pencil on your answer sheet. Part II consists of 34 open-ended questions. Write your answers to these questions in the spaces provided in this test booklet. You may use a calculator to answer the questions on the test if needed. You will have two hours to answer the questions on this test. DO NOT OPEN THIS TEST BOOKLET UNTIL YOU ARE TOLD TO DO SO. THE UNIVERSITY OF THE STATE OF NEW YORK THE STATE EDUCATION DEPARTMENT ALBANY, NEW YORK 12234
Transcript of THE UNIVERSITY OF THE STATE OF NEW YORK … Three different human cells are shown below. Which...

8THE UNIVERSITY OF THE STATE OF NEW YORK
GRADE 8INTERMEDIATE-LEVEL TEST
SCIENCE
WRITTEN TEST
SPRING 2007
Name
School
The questions on this test measure your knowledge and understanding of science. The test has two parts. Both parts are contained in this test booklet.
Part I consists of 45 multiple-choice questions. Record your answers to these ques-tions on the separate answer sheet. Use only a No. 2 pencil on your answer sheet.
Part II consists of 34 open-ended questions. Write your answers to these questions inthe spaces provided in this test booklet.
You may use a calculator to answer the questions on the test if needed.
You will have two hours to answer the questions on this test.
DO NOT OPEN THIS TEST BOOKLET UNTIL YOU ARE TOLD TO DO SO.
THE UNIVERSITY OF THE STATE OF NEW YORKTHE STATE EDUCATION DEPARTMENT
ALBANY, NEW YORK 12234


Inter.-Level Science — Spring ’07 [3] [OVER]
Part I
DIRECTIONS
There are 45 questions on Part I of the test. Each question is followed by three or fourchoices, numbered 1 through 4. Read each question carefully. Decide which choice is thebest answer. On the separate answer sheet, mark your answer in the row of circles for eachquestion by filling in the circle that has the same number as the answer you have chosen.
Read the sample question below:
Sample Question
Earth gets most of its light from
(1) the stars(2) the Sun(3) the Moon(4) other planets
The correct answer is the Sun, which is choice number 2. On your answer sheet, look atthe box showing the row of answer circles for the sample question. Since choice number2 is the correct answer for the sample question, the circle with the number 2 has beenfilled in.
Answer all of the questions in Part I in the same way. Mark only one answer for each ques-tion. If you want to change an answer, be sure to erase your first mark completely. Thenmark the answer you want.
You will not need scrap paper. You may use the pages of this test booklet to work out youranswers to the questions.
You may use a calculator if needed.
When you are told to start working, turn the page and begin with question 1. Work care-fully and answer all of the questions in Part I.
When you have finished Part I, go right on to Part II. Answer all of the questions in Part II.

1 Three different human cells are shown below.
Which process occurs in all of these cells?(1) metamorphosis (3) reproduction(2) locomotion (4) photosynthesis
2 Which sequence correctly shows the levels oforganization for structure and function in ahuman?(1) cell → tissue → organ → organ system(2) organ system → cell → tissue → organ(3) tissue → organ → organ system → cell(4) cell → organ → tissue → organ system
3 Feathers, wings, and the hollow bones of birdsare examples of(1) adaptations for flight(2) responses to stimuli(3) unnecessary body parts(4) reproductive structures
4 The diagram below shows two different organ-isms, a dog and a cat.
Which phrase best describes the classification ofthese two organisms?(1) same kingdom, same species(2) same kingdom, different species(3) different kingdoms, different species(4) different kingdoms, same species
5 Asexually produced offspring are genetically(1) identical to the parent(2) different from the parent(3) different from each other(4) formed by two parents
6 Compared to the amount of hereditary informa-tion in a human body cell, how much hereditaryinformation is contained in a human sex cell?(1) one-quarter the amount(2) one-half the amount(3) the same amount(4) twice the amount
7 Which group of organisms can show significanttrait changes in the shortest period of time?(1) bacteria (3) fish(2) birds (4) reptiles
8 A plant produces tiny plants around the edges ofits leaves. When these tiny plants fall to theground, they take root and become new plants.This process is an example of(1) sexual reproduction(2) asexual reproduction(3) evolution(4) extinction
9 Which term describes an organism’s ability tomaintain a stable internal environment?(1) reproduction (3) locomotion(2) extinction (4) regulation
10 A research team wanted to produce a smallervariety of German shepherd dogs. They matedthe smallest dogs from different litters for several generations. This is an example of whichconcept?(1) extinction (3) selective breeding(2) mutation (4) natural selection
Dog Cat
Skin cell Bone cell Muscle cell
(Not drawn to scale)
Inter.-Level Science — Spring ’07 [4]
Part I

11 The diagram below shows information about thereproduction and development of a rabbit.
Which letter in the diagram represents fertiliza-tion?(1) A (3) C(2) B (4) D
12 In animal skin tissue, cell division is responsiblefor(1) growth and repair(2) sexual reproduction(3) obtaining energy(4) production of sex cells
13 Which statement describes a method of sexualreproduction that occurs in plants?(1) Stem cuttings are placed in water and grow
roots.(2) Seeds are produced from the flower of the
plant.(3) Underground stems from a plant grow into
new plants.(4) A leaf falls to the soil, develops roots, and
grows.
Base your answers to questions 14 and 15 on thediagram below and on your knowledge of science.The diagram shows the life cycle of the commonhousefly.
14 Which process is shown by this diagram?(1) competition (3) metamorphosis(2) metabolism (4) migration
15 A life cycle is best described as the(1) series of changes in the development of an
organism(2) movement of an organism from place to
place(3) ability of an organism to adapt to its
environment(4) flow of energy through an organism’s
community
Maggot(larva)
Pupa
Egg
Life Cycle of the Common Housefly
Adult fly
(Not drawn to scale)
Male Female
A B
C
D
(Not drawn to scale)
Offspring
Inter.-Level Science — Spring ’07 [5] [OVER]

Inter.-Level Science — Spring ’07 [6]
16 The diagram below shows a deer and greenplants.
Which statement best describes the relationshipbetween the deer and the plants?(1) The deer supplies food and oxygen to the
green plants.(2) The deer supplies food and carbon dioxide
to the green plants.(3) The green plants supply food and carbon
dioxide to the deer.(4) The green plants supply food and oxygen to
the deer.
17 The table below shows the deer population inArizona for a 30-year period.
Deer Population in Arizona
What is the most likely reason that the deerpopulation decreased from 1920 to 1935?(1) There was less air pollution.(2) More water was available.(3) Fewer hunting licenses were issued.(4) There was increased competition for food.
18 Which unit is used to indicate the amount ofenergy in food?(1) ounce (3) calorie(2) degree (4) gram
19 All living organisms are dependent on plantsbecause plants(1) produce carbon dioxide(2) remove oxygen from the air(3) are producers(4) are consumers
20 Which order of succession of natural com-munities would most likely occur in New YorkState?(1) grasses → trees → bushes(2) trees → bushes → grasses(3) bushes → grasses → trees(4) grasses → bushes → trees
21 The structures found in a living cell can be com-pared to the parts of a factory that produces cars.Which part of the factory is most similar to thenucleus of a living cell?(1) a conveyor belt that transports materials(2) a storage bin that holds the pieces needed to
assemble a car(3) the computer room that controls the assem-
bly process(4) the generator that provides energy for the
factory
22 All rocks are composed of(1) fossils (3) metals(2) cells (4) minerals
23 When placed in direct sunlight, which objectwill absorb the most visible light energy?(1) a piece of clear glass(2) a snowball(3) a shiny mirror(4) a black sweater
YearAverage Number of Deer
per 1,000 Acres
1905 5.71915 35.71920 142.91925 85.71935 25.7
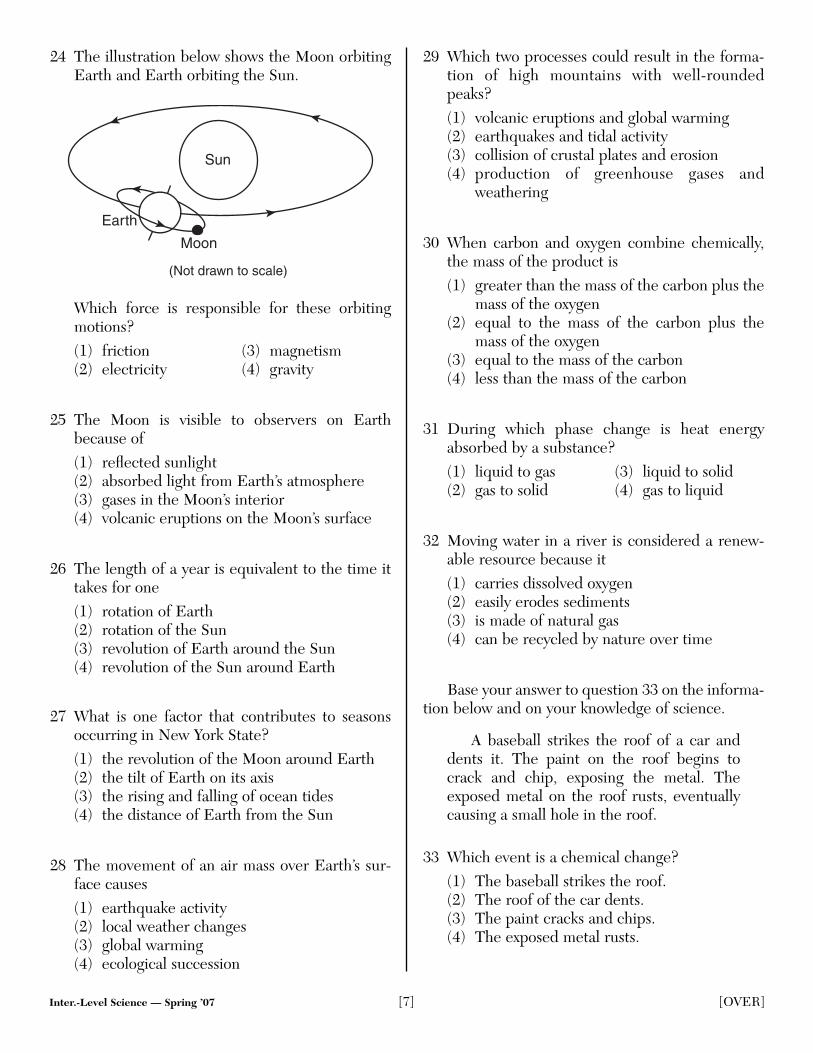
24 The illustration below shows the Moon orbitingEarth and Earth orbiting the Sun.
Which force is responsible for these orbitingmotions?(1) friction (3) magnetism(2) electricity (4) gravity
25 The Moon is visible to observers on Earthbecause of (1) reflected sunlight(2) absorbed light from Earth’s atmosphere(3) gases in the Moon’s interior(4) volcanic eruptions on the Moon’s surface
26 The length of a year is equivalent to the time ittakes for one(1) rotation of Earth(2) rotation of the Sun(3) revolution of Earth around the Sun(4) revolution of the Sun around Earth
27 What is one factor that contributes to seasonsoccurring in New York State?(1) the revolution of the Moon around Earth(2) the tilt of Earth on its axis(3) the rising and falling of ocean tides(4) the distance of Earth from the Sun
28 The movement of an air mass over Earth’s sur-face causes(1) earthquake activity(2) local weather changes(3) global warming(4) ecological succession
29 Which two processes could result in the forma-tion of high mountains with well-roundedpeaks?(1) volcanic eruptions and global warming(2) earthquakes and tidal activity(3) collision of crustal plates and erosion(4) production of greenhouse gases and
weathering
30 When carbon and oxygen combine chemically,the mass of the product is(1) greater than the mass of the carbon plus the
mass of the oxygen(2) equal to the mass of the carbon plus the
mass of the oxygen(3) equal to the mass of the carbon(4) less than the mass of the carbon
31 During which phase change is heat energyabsorbed by a substance?(1) liquid to gas (3) liquid to solid(2) gas to solid (4) gas to liquid
32 Moving water in a river is considered a renew-able resource because it(1) carries dissolved oxygen(2) easily erodes sediments(3) is made of natural gas(4) can be recycled by nature over time
Base your answer to question 33 on the informa-tion below and on your knowledge of science.
A baseball strikes the roof of a car anddents it. The paint on the roof begins tocrack and chip, exposing the metal. Theexposed metal on the roof rusts, eventuallycausing a small hole in the roof.
33 Which event is a chemical change?(1) The baseball strikes the roof.(2) The roof of the car dents.(3) The paint cracks and chips.(4) The exposed metal rusts.
Sun
Moon
Earth
(Not drawn to scale)
Inter.-Level Science — Spring ’07 [7] [OVER]

Inter.-Level Science — Spring ’07 [8]
34 The diagram below shows a student using aspring scale to pull a wooden block up a rampthat is resting on a stack of books.
Which change would require more force to pullthe wooden block up the ramp?(1) Have the student use two hands.(2) Reduce the mass of the wooden block.(3) Restack the books so the thinnest book is on
the bottom.(4) Glue sandpaper to the surface of the ramp.
35 The diagram below shows a bar magnet. PointsA, B, C, and D are locations on the magnet.
Which position on the bar magnet would havethe strongest attraction to the north pole ofanother bar magnet?(1) A (3) C(2) B (4) D
36 Water at 20°C in an uncovered pan is evaporat-ing very slowly. What could be done to the waterto make it evaporate more quickly?(1) Cover it.(2) Heat it.(3) Place it in the dark.(4) Put salt in it.
37 The diagram below shows a Bunsen burnerheating a beaker of water on a beaker stand.The arrows represent the transfer of heat energyin the water.
Which process is primarily responsible for thetransfer of heat indicated by the arrows in thebeaker of water?(1) conduction (3) radiation(2) convection (4) condensation
38 Which object represents a simple machine?
39 The Moon has the greatest effect on Earth’s(1) year (3) ocean tides(2) seasons (4) daylight hours
DryCell
Battery Pliers Match Candle
( 1 ) ( 2 ) ( 3 ) ( 4 )
Bunsenburner
Beaker stand
Beaker of water
A CB D
BooksRamp
Wooden block
Spring scale

Inter.-Level Science — Spring ’07 [9] [OVER]
Base your answers to questions 40 and 41 on the topographic map below, which shows the elevation ofland in feet above sea level. Points A, B, and C are locations on the map.
40 A camper walked from point A to point B by taking a path shown by the dotted line. What is the approximate distance the camper walked?(1) 1.5 miles (3) 3.0 miles(2) 2.5 miles (4) 3.5 miles
41 What is a possible elevation of point C?(1) 75 feet (3) 95 feet(2) 85 feet (4) 105 feet
42 The data table below compares cars and light trucks in regard to gas mileage and the amount of gasesreleased into the environment (emissions).
Data Table
*Light trucks include sport utility vehicles, minivans, and pickup trucks.
Based on the information in the table, which conclusion can be made about light trucks?(1) They get more average miles per gallon than cars.(2) They have become more popular than cars in recent years.(3) They produce less nitrogen oxide and carbon dioxide emissions than cars.(4) They have a greater negative impact on the environment than cars.
Type ofVehicle
Average Gas Mileage(miles per gallon)
Average NitrogenOxide Emissions(grams per mile)
Average CarbonDioxide Emissions(pounds per mile)
Cars 27.5 0.4 0.72
Light trucks* 20.7 0.8 0.95
A
B
C
60
50
4040
Carrion C
reek
4050
60
70
80
NContour interval = 10 feet
0 11/2 3 miles2

Inter.-Level Science — Spring ’07 [10]
Base your answers to questions 43 and 44 on the information and graphs below and on your knowledge ofscience.
Some species of bacteria are harmful. Antibiotics are chemicals that kill bacteria. Some bacteria are resistant to antibiotics and are not killed by these chemicals. Over time, the resistant bacteria can reproduce and create populations that are not affected by antibiotics.
The graphs below show the results of a controlled experiment that measured the population of one species of bacteria that had been grown in four containers under identicalconditions. Different antibiotics were added to three of the four containers.
43 Which conclusion about this species of bacteria is best supported by the information in the graphs?(1) Antibiotic A continuously slowed the growth.(2) Antibiotic B was least effective in controlling the growth.(3) Antibiotic C was most effective in controlling the growth.(4) Antibiotics A and B slowed the growth.
44 The control in this experiment is represented by the container with(1) antibiotic A added (3) antibiotic C added(2) antibiotic B added (4) no antibiotic added
45 The map below shows the four major time zones in the continental United States.
If it is 9 a.m. in the Eastern Time Zone, what time is it in the Pacific Time Zone?(1) 3 a.m. (3) 6 p.m.(2) 6 a.m. (4) 9 p.m.
PacificPacific Mountain Central Eastern
1099
11 12
No Antibiotic AddedAntibiotic A Added Antibiotic B Added Antibiotic C Added
Nu
mb
er o
fB
acte
ria
0Time (days)
Nu
mb
er o
fB
acte
ria
0Time (days)
Nu
mb
er o
fB
acte
ria
0Time (days)
Nu
mb
er o
fB
acte
ria
0Time (days)

Inter.-Level Science — Spring ’07 [11] [OVER]
Directions (46–79): Record your answers in the spaces provided below each question.
Base your answers to questions 46 and 47 on the passage below and on your knowledge of science.
A student adds sugar to a cup of iced tea and a cup of hot tea. She notices that the timeneeded for the sugar to dissolve in each cup is different. She thinks this has something to dowith the temperature of the tea. She wants to design an experiment to see if she is correct.
46 Write a hypothesis based on the student’s observations. [1]
______________________________________________________________________________________
______________________________________________________________________________________
______________________________________________________________________________________
47 Identify two variables that should be held constant in an experiment to test this hypothesis. [2]
(1)____________________________________________________
(2)____________________________________________________
Part II

Inter.-Level Science — Spring ’07 [12]
48 The graph below shows the percentage of five minerals found in a sample of the igneous rock granite.
Determine the percentage of orthoclase feldspar in this sample of granite. [1]
___________ %
Base your answers to questions 49 and 50 on the information and table below and on your knowledge ofscience.
A car traveled a total distance of 240 kilometers between 8:00 a.m. and 11:00 a.m. Thedata table below shows the car’s distance from the starting location at 0.5-hour intervals during the trip.
Distance Traveled vs. Time
TimeTotal Time
(hours)
Distance fromStarting Location
(kilometers)
8:00 0.0 0
8:30 0.5 55
9:00 1.0 90
9:30 1.5 90
10:00 2.0 142
10:30 2.5 200
11:00 3.0 240
Biotitemica
Plagioclasefeldspar
Orthoclasefeldspar
Quartz
1000
510
15
20
25
30
35
40455055
60
65
70
75
80
85
9095
Amphibole(hornblende)
Percentage ofMinerals Found in a Sample of Granite

49 On the grid below, make a graph using the data in the table. Place an X to show the distance from thestarting location of the car for each 0.5-hour interval. Connect the Xs with a line. [2]
50 Give one possible explanation for the car’s distance from the starting location at 9:00 a.m. and at 9:30 a.m.[1]
______________________________________________________________________________________
______________________________________________________________________________________
______________________________________________________________________________________
Distance Traveled vs. Time
0
Dis
tan
ce f
rom
Sta
rtin
g L
oca
tio
n (
km)
Total Time (h)
200
150
100
50
0.5 1.0 1.5 2.0 2.5 3.0
250
0.0 3.5
Inter.-Level Science — Spring ’07 [13] [OVER]

Inter.-Level Science — Spring ’07 [14]
51 The diagram below shows a green plant carrying on photosynthesis.
Identify two things shown in the diagram that the plant needs for photosynthesis to occur. [1]
(1) _________________________________________
(2) _________________________________________
Water vaporreleased by plant
Oxygenreleasedby plant
Carbon dioxideexhaled by mouse
Foodto roots
Waterfrom ground
Lightenergy
(Not drawn to scale)

Inter.-Level Science — Spring ’07 [15] [OVER]
Base your answers to questions 52 and 53 on the information below and on your knowledge of science.
In pea plants, the green-pod gene (G) is dominant over the yellow-pod gene (g).
52 a Two pea plants with green pods, Gg × GG, were crossed. Complete the Punnett square below to showthe results of this cross. [1]
b What percentage of the offspring produced by this cross will most likely have green pods? [1]
__________________ %
53 Show the genetic makeup of two parent pea plants whose offspring would all have yellow pods. [1]
___________ × ___________
54 Humans have several organ systems that allow them to carry on all life activities. Complete the chart below by identifying one organ system that is responsible for each life activity listed. The first row has been completed as an example. [3]
Life Activity Human Organ System
breaking down large food molecules into smallermolecules
digestive system
exchanging gases between the blood and theenvironmentremoving liquid and gaseous wastes from thebodytransporting needed materials to the cells andcarrying wastes away from cells
producing offspring
moving the body
G
G
G g

Inter.-Level Science — Spring ’07 [16]
Base your answers to questions 55 through 57 on the diagrams and key below and on your knowledge ofscience. The diagrams show two cells and some of their structures.
55 List two structures that are found in both plant and animal cells. [1]
(1) _________________________________________
(2) _________________________________________
56 Which structure shown in the plant cell diagram is the site of photosynthesis? [1]
____________________________________________
57 Which cell structure shown in the diagrams contains genetic material? [1]
____________________________________________
Animal Cell Plant Cell
Key
Cell membrane
Cell wall
Chloroplast
Cytoplasm
Nucleus
Vacuole

Base your answers to questions 58 and 59 on the diagram below and on your knowledge of science. Thediagram represents an ecosystem.
58 Identify one producer shown in the diagram. [1]
____________________________________________
59 What is the original source of energy for this ecosystem? [1]
____________________________________________
SunCloud
Air
Pine tree
Hawk
Deer
Rabbit
GrassFrog
Log
Turtle Pond
Algae
Tadpoles Fish
(Not drawn to scale)
Greenplants
Human
Water
Mushrooms
Inter.-Level Science — Spring ’07 [17] [OVER]

60 The four types of organisms listed below obtain their energy from different food sources.carnivoreherbivoreomnivoredecomposer
The chart below lists four specific organisms and describes the diet of each. Complete the chart byplacing the correct term from the list above in the blank spaces. The first row has been completedas an example. [2]
Organism Diet Type of Organism
white-tailed deereats grasses and other plantparts
herbivore
Alaskan brown beareats wild berries, leaves, fish,and small rodents
shelf fungusabsorbs nutrients from thewood of dead trees
African lioneats antelope and othergrazing mammals
Inter.-Level Science — Spring ’07 [18]

61 The data table below shows two physical properties of the minerals quartz and amphibole (hornblende).
Data Table
Select the physical property from the table that can distinguish quartz from amphibole and describe a procedure that can be used to test this property. [1]
Physical property: _________________________________
Procedure: _____________________________________________________________________________
______________________________________________________________________________________
62 A diagram of the rock cycle is shown below.
Identify two processes most directly involved in the formation of an igneous rock. [1]
______________________________ and ______________________________
Rock Cycle in Earth’s Crust
CompactionP
ressureH
eat and/or (Upl
ift)
Burial
Cementation
Meta
morphism
MeltingSolid
ific
atio
n
Wea
ther
ing
and
Ero
sion
Deposition
Melting
Weathering and Erosion
Weathering and Erosion
(Uplift)
(Uplift)
Ero
s ion
MetamorphismHeat and/or Pressure
Melting
IgneousRock
Sediments
Magma
MetamorphicRock
SedimentaryRock
MineralPhysical Property
Streak Luster
quartz colorless shiny
amphibole(hornblende)
greenish black shiny
Inter.-Level Science — Spring ’07 [19] [OVER]
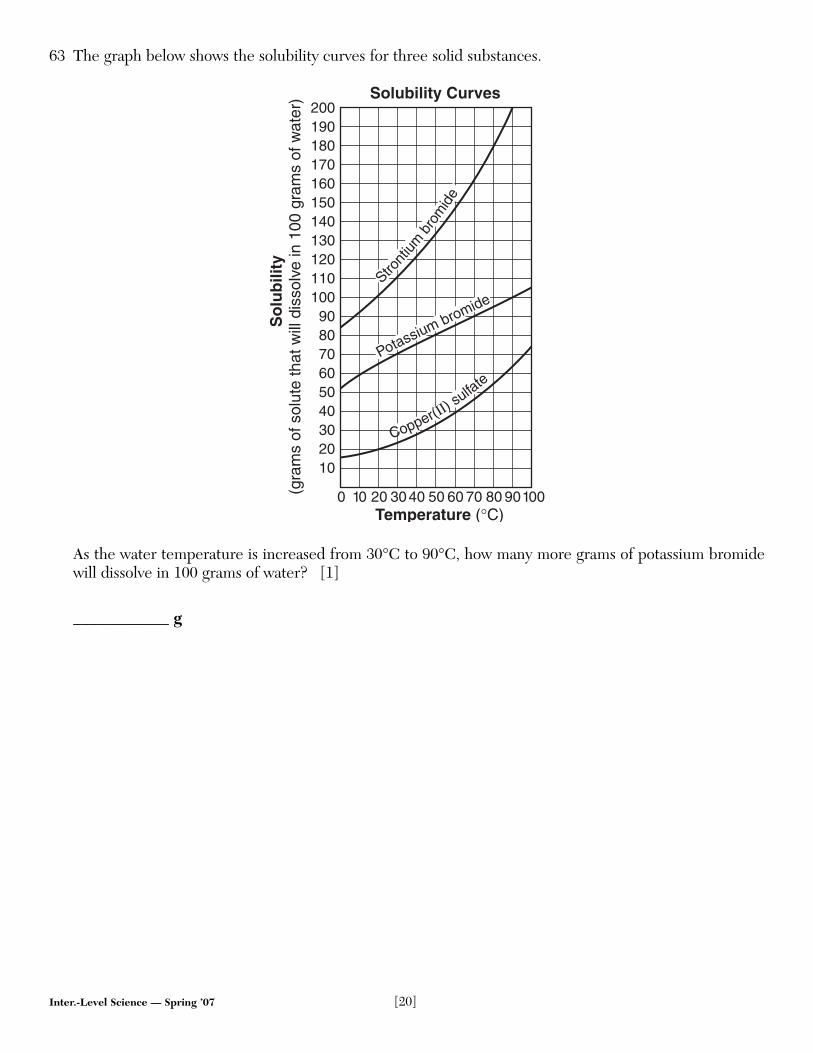
63 The graph below shows the solubility curves for three solid substances.
As the water temperature is increased from 30°C to 90°C, how many more grams of potassium bromidewill dissolve in 100 grams of water? [1]
____________ g
Solubility Curves
Temperature (°C)
So
lub
ility
(gra
ms
of s
olut
e th
at w
ill d
isso
lve
in 1
00 g
ram
s of
wat
er)
200190180170160150140130120110100
908070605040302010
10 20 3040 50 60 70 80 901000
Stront
iumbr
omid
e
Potassium bromide
Copper(II) su
lfate
Inter.-Level Science — Spring ’07 [20]

Base your answers to questions 64 and 65 on the information and diagram below and on your knowledgeof science.
A rock hanging from a spring scale is being lowered into a graduated cylinder containing water. Figure A shows the reading on the spring scale before the rock is low-ered into the water. Figure B shows the reading on the spring scale when the rock is inthe water. The reading on the spring scale in figure A is greater than the reading on thespring scale in figure B.
64 Explain why the spring scale shows a greater reading in figure A than in figure B. [1]
______________________________________________________________________________________
______________________________________________________________________________________
______________________________________________________________________________________
65 Explain why placing the rock in the water causes the water level to rise. [1]
______________________________________________________________________________________
______________________________________________________________________________________
Figure A Figure B
Water Water
g0
100
200
125
100
75
50
25
mL125
100
75
50
25
mL
g0
100
200
Inter.-Level Science — Spring ’07 [21] [OVER]

Base your answers to questions 66 through 68 on the information and diagrams below and on your knowl-edge of science.
Figure A shows a beaker containing water, sand, and salt. The salt is totally dissolvedin the water. Figure B shows the contents of the beaker being poured through filter paperin a funnel over a flask. Figure C shows the same flask after sitting at room temperaturefor 15 days. After 15 days, the flask contains only solid salt particles.
66 Identify the soluble material, the insoluble material, and the solvent in the beaker in figure A. [1]
Soluble material:
Insoluble material:
Solvent:
67 Explain why the contents of the flask in figure B are classified as a mixture. [1]
______________________________________________________________________________________
______________________________________________________________________________________
68 Explain why only solid salt particles remain in the flask in figure C. [1]
______________________________________________________________________________________
______________________________________________________________________________________
Beaker
Sand
Salttotallydissolvedin water
Flask
Flask
Beaker
Filterpaper
Onlysolid saltparticlesremain
Figure A Figure B Figure C15 Days Later
Funnel
Inter.-Level Science — Spring ’07 [22]

Base your answers to questions 69 and 70 on the diagram below and on your knowledge of science. Thediagram shows a glass partially filled with water and ice cubes.
69 Explain why water droplets have formed on the outside of the glass. [1]
______________________________________________________________________________________
______________________________________________________________________________________
______________________________________________________________________________________
70 What evidence in the diagram indicates that ice has a lower density than water? [1]
______________________________________________________________________________________
______________________________________________________________________________________
Ice cubes
Water dropletson the outsideof the glass
Water insidethe glass
Inter.-Level Science — Spring ’07 [23] [OVER]

Base your answers to questions 71 and 72 on the diagram below and on your knowledge of science. Thediagram shows how crushed limestone in a test tube reacts when acid is added.
71 List one observation that shows a chemical change is occurring in the diagram. [1]
______________________________________________________________________________________
72 What environmental problem in New York State makes limestone a poor choice to use on the outside ofa building? [1]
______________________________________________________________________________________
______________________________________________________________________________________
73 A student attached two balloons to equal lengths of string and tied them to the same point. The studentobserved that the balloons repelled each other, as shown in the diagram below.
In terms of electrical charges, explain why the balloons repelled each other. [1]
______________________________________________________________________________________
______________________________________________________________________________________
Repelling
Acid
Crushedlimestone
Bubbles ofcarbon dioxide
(CO2) gas
Inter.-Level Science — Spring ’07 [24]

Inter.-Level Science — Spring ’07 [25] [OVER]
Base your answers to questions 74 and 75 on the diagram of a moving car below and on your knowledgeof science. The diagram shows energy transformations.
74 What is the sequence of the energy transformations represented in the diagram? [1]A mechanical → chemical → solarB solar → electrical → mechanicalC mechanical → electrical → solarD solar → chemical → electrical
Circle one: A B C D
75 State one advantage to the environment of using the car shown in the diagram instead of a car poweredby fossil fuel. [1]
______________________________________________________________________________________
______________________________________________________________________________________
Solar panels
Electricmotor
Electricity
Sun’s rays

Inter.-Level Science — Spring ’07 [26]
Base your answers to questions 76 through 79 on the map below. The shaded portion of the map indicatesareas of night and the unshaded portion indicates areas of daylight at a certain hour on December 21.
76 Why is there more daylight shown on the map south of the equator? [1]
______________________________________________________________________________________
______________________________________________________________________________________
77 Explain how the areas of daylight and night would be different if the map represented June 21 instead ofDecember 21. [1]
______________________________________________________________________________________
______________________________________________________________________________________
ArcticCircle
Equator
AntarcticCircle
N

Inter.-Level Science — Spring ’07 [27]
78 What type of coordinate system is represented by the horizontal and vertical lines shown on the map? [1]
______________________________________________________________________________________
______________________________________________________________________________________
79 What causes the lighted portion on the map to move westward during the day represented? [1]
______________________________________________________________________________________
______________________________________________________________________________________

Inter.-Level Science — Spring ’07
QuestionMaximum Credit
Credit Allowed
46 1
47 2
48 1
49 2
50 1
51 1
52 2
53 1
54 3
55 1
56 1
57 1
58 1
59 1
60 2
61 1
62 1
63 1
64 1
65 1
66 1
67 1
68 1
69 1
70 1
71 1
72 1
73 1
74 1
75 1
76 1
77 1
78 1
79 1
Total 40
For Teacher Use OnlyPart II Credits