The University of Texas at San Antonio FY10 Annual Financial Report Highlights January, 2011.
15
The University of Texas at San Antonio FY10 Annual Financial Report Highlights January, 2011
-
Upload
gregory-blair -
Category
Documents
-
view
215 -
download
0
Transcript of The University of Texas at San Antonio FY10 Annual Financial Report Highlights January, 2011.

The University of Texas at San Antonio
FY10 Annual Financial Report
Highlights
January, 2011

Annual Financial Report Highlights
The Annual Financial Report (AFR) is made up of three primary statements with many supporting schedules.
1. Balance Sheet – Explains what we own, our obligations and what is available.
2. Statement of Revenues, Expenses and Changes in Net Assets (SRECNA) – Shows the results
of operations for the year.3. Statement of Cash Flows – Shows what revenue
came in, what was expended and what is left.
Review pie charts and ratios that help explain ourfinancial condition.
2

UTSA FY10Balance Sheet The Balance Sheet has three sections:
Assets: What we own - Items that are available to meet operating costs of the Institution, plus buildings, land, equipment, etc.
Due from other funds and due to other funds increased by $11.6M due to liability and receivable that was set up for the North Paseo construction project.
Due from System Administration decreased by $16M due to a decrease in debt financed CIP projects.
Investments increased by $39.5M due to increases in fair market value.
Funds held by System Administration increased by $13.6M due to increases in FMV of endowed assets and additional gifts to the endowment fund.
Net Capital / Intangible Assets increased by $6.7M due to the construction of the Combined Science Facility and other renovations offset by increases in accumulated depreciation.
Liabilities: Our obligations -Amounts due and payable within one year or beyond.
Net Assets: What’s available - Capital Assets net of depreciation, endowment funds and other unrestricted funds.
Amount Invested in Capital Assets increased by $6.7M due to construction projects which was offset by increases in accumulated depreciation.
Restricted and Unrestricted Net Assets increased by $17.7M and $16.2M respectively due to increases in FMV of investments. Additional increases were due to funding for North Paseo building.
The University of Texas at San Antonio – Balance Sheet ($ in millions)
ASSETS: 2010 2009 Variance % Change
Current Assets and Deferred Outflows
148.2
157.2
(9.0) (6%)
Noncurrent Assets and Deferred Outflows
271.6
218.5
53.1 24%
Other Noncurrent Assets
5.8
5.8
0 0%
Capital / Intangible Assets, net
660.9
654.2
6.7 1%
Total Assets and Deferred Outflows
1,086.5
1,035.7
50.8 5% LIABILITIES:
Current Liabilities and Deferred Inflows
159.7
149.5
10.2 7%
Noncurrent Liabilities and Deferred Inflows
2.5
2.5 0 0%
Total Liabilities and Deferred Inflows
162.2
152.0 10.2 7% NET ASSETS: Invested in Capital Assets, Net of Related Debt
660.9 654.2 6.7 1%
Restricted106.7
89.0 17.7 20%
Unrestricted
156.7
140.516.2 12%
Net Assets 924.3
883.7 40.6 5%

UTSA Operating Revenues ($ in millions)
2007 2006
Student Tuition and Fees
- Net of Discounts
143.57
118.7Sponsored
Programs72.8 73.
2Sales and Services of Educational Activities
6.7 6.0Auxiliary
Enterprises15.1 14.
2Other
2.5
3.2Total Operating
Revenues240.6
215.3Total Operating
Expenses315.6
293.8Operating
Loss(75.0)Nonoperating Revenues
(Expenses):State Appropriations
98.1
97.1Gift
Contributions3.8
3.5Net Investment Income
(Loss)10.9 6.
1Net Inc. (Dec.) in Fair Value of Investments
12.4 4.1Gain/(Loss) on State of Capital
Assets(0.1)Othe
r Nonoperating
Revenues/Expenses
0.0
0.0Income (Loss) Before Other Revenues, Expenses,
Gains or Losses
50.1
32.2Gifts and Sponsored
Programs0.0
0.6Additions to Permanent
Endowments4.0
4.9Reclass From (To) Other
Institutions(48.7)
19.8
Mandatory Transfers
- Comp & Sys Admin
-Debt Svc
(19.7)
(16.6)Nonmandator
yTransfers
- Comp & Sys Admin
141.9
28.6Transfers From (To) Other State
entities(1.4)Change in Net
Assets126.2
68.7Net Assets, Beginning of the
Year635.1
566.4
Net Assets, End of the Year
761.3
635.1
UTSA Operating Revenues ($ in millions)
2010 2009
Student Tuition and Fees
Net of Discounts
170.5 161.5
Sponsored Programs
64.7 64.9
Sales and Services of Educational Activities
8.9 9.6Auxiliary
Enterprises24.0 21.7
Other
2.6
2.0Total Operating
Revenues270.7
259.7Total Operating
Expenses428.0
388.8Operating
Loss(157.3) (129.1
)Non-Operating Revenues (Expenses):
State Appropriations
121.4 115.5
Gift Contributions
8.8
6.5
Net Investment Income (Loss)
8.7 4.4
Net Inc. (Dec.) in Fair Value of Investments
17.7 (28.2)
Income (Loss) Before Other Revenues, Expenses, Gains or Losses
49.7 (2.2)
Gifts and Sponsored Programs
.3 .3Additions to Permanent
Endowments10.2 1.
5Re-Class From (To) Institutions 13.0 38.9Mandatory
Transfers (31.5)
(31.8)
Non-Mandatory Transfers 1.2
8.5
Transfers From (To) Other State entities
(2.3)
(2.2)
Change in Net Assets
40.6 13.0
Net Assets, Beginning of the Year
883.7 870.7Net Assets, End of the
Year924.3 883.
7
The Statement of Revenue, Expenses, and Changes in Net Assets (SRECNA) . This statement is called the “Operating Statement” as it reports the results of operations for the year.
Tuition and Fees increased by $9M (6%).
Auxiliary Enterprises increased by $2.3M (11%) due to increases in housing, food service and parking revenue.
Operating Loss does not include State Appropriations and Pell revenue. Operating expenses outpaced operating revenues causing an increase of $28.2M (22%).
State Appropriations increased by $5.9M (5%) due to additional funds appropriated.
Federal Non-Exchange Sponsored Programs and Non-Exchange Pass Throughs increased due to increase in Pell Awards of $15.2M, ARRA funds of $5.1M and TRIP funds of $1.4M.
Net Inc. (Dec.) in Fair Value of Investments increased by $45.9M due to a more positive market.
Income (Loss) Before Other Revenues increased $51.9M (2,359%) due to increases in FMV of investments and investment income.
Additions to Permanent Endowments increased by $8.7M predominately due to McKinney Scholarship gift.
Mandatory Transfers represent amounts transferred to System to pay debt service and Non-Mandatory Transfers represent anticipated bond proceeds transferred to UTSA to fund construction projects.
As on the previous exhibit, Change in Net Assets was $40.6M. This is predominately due to increases in FMV of investments and construction projects.
Federal Non-Exchange Sponsored Programs and Non-Exchange Pass Through
28.7 50.4

($ in millions) Cash Flows
2010
2009
Cash received from operations 288.8 281.1
Cash expended for operations (409.4) (366.6)
Net cash used by operating activities (120.6) (85.5)
Net cash provided by noncapital financing activities 171.8 156.8
Net cash used by capital and related financing activities (49.7) (49.3)
Net cash used by investing activities (26.5) (10.8)
Net increase (decrease) in cash and cash equivalents (25.0) 11.2
Cash and cash equivalents, beginning of the year 75.8 64.6
Cash and cash equivalents, end of year 50.8 75.8
The University of Texas at San AntonioFY10 – Statement of Cash Flows
Cash from operations includes tuition and fees and sponsored programs. Payments for operations includes salaries, scholarship/fellowship and supplies.
Noncapital financing activities include state appropriations and gifts.
Capital and related financing activities include purchase of equipment and construction of buildings.
Investing Activities include the purchase/sale of investments, interest and investment income and endowment income distribution.
Cash & Cash Equivalents decreased by $25M due to cash expended for operations offset by cash provided by state appropriations and gifts.
5
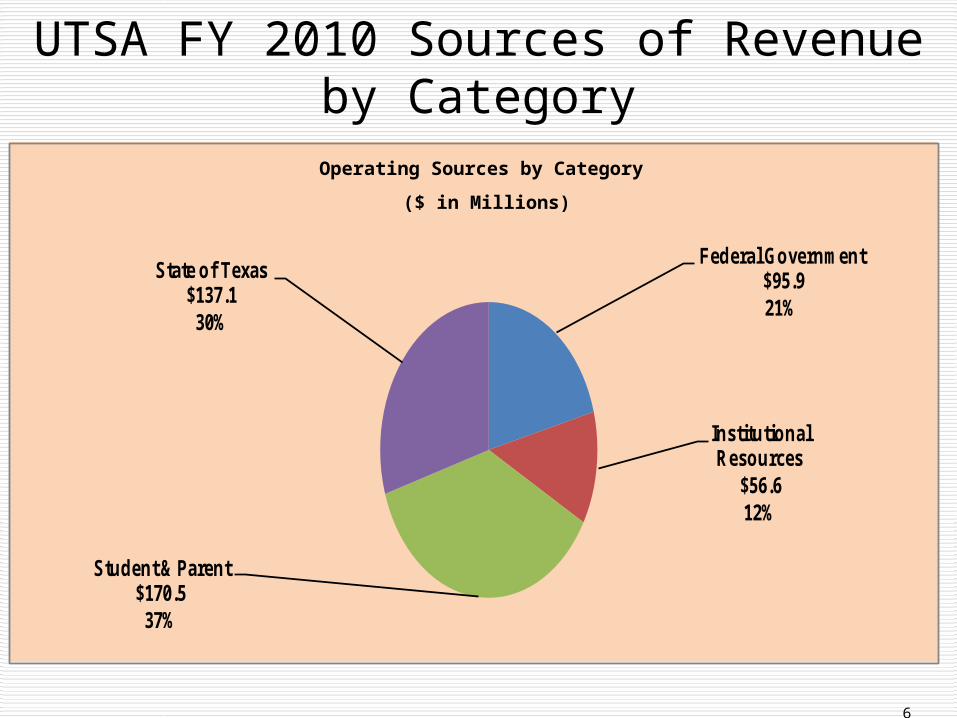
UTSA FY 2010 Sources of Revenue by Category
6
Federal Government$95.9 21%
Institutional Resources
$56.6 12%
Student & Parent $170.5
37%
State of Texas $137.1
30%
Operating Sources by Category
($ in Millions)

UTSA FY10 Sources of Revenue
7
Net Auxilary$24.05%
Other Income$2.40%
State Appropriations$118.026%
State Grants & Contracts$15.73%
Research Development$3.41%
Tuition & Fees$170.537%
Federal Grants & Contracts
$95.921%
Endowment & Interest Income
$9.12%
Local Government Grants$.60%
Private Gifts & Grants$11.73%
Sales & Services$8.82%
Operating Sources($ in Millions)

UTSA FY10 Uses of Funds
8
Instruction$115.7 29%
Research$38.5 10%
Public Service$17.4 4%
Academic Support$41.4 10%
Student Services$23.0 6%
Institutional Support$42.8 11%
Operations and Maintenance of Plant
$42.2 10%
Scholarships and Fellowships
$38.8 10%
Auxiliary Enterprises$30.8 8%
Capital Outlay $8.0 2%
Operating Uses($ in Millions)

Reconciliation of Research Expenditures to AFR Operating Expenses - Research
Reconciliation: FY 10 FY09
Statement of Revenues, Expenses and 38,492,053 35,929,725Changes in Net Assets- Research Expenses
Facilities and Administration (F&A) 6,870,352 6,356,539
Capital Outlay 3,289,557 4,235,223 48,651,962
46,521,487*Total Research Expenditures
* As Reported on THECB Research Expenditure Report
9
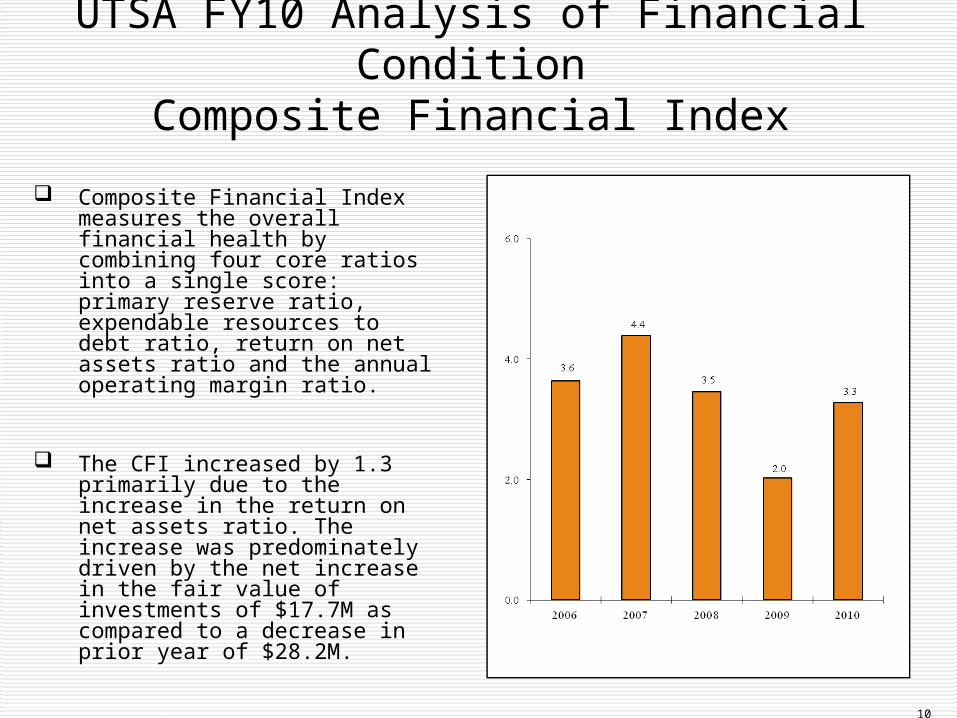
UTSA FY10 Analysis of Financial ConditionComposite Financial Index
Composite Financial Index measures the overall financial health by combining four core ratios into a single score: primary reserve ratio, expendable resources to debt ratio, return on net assets ratio and the annual operating margin ratio.
The CFI increased by 1.3 primarily due to the increase in the return on net assets ratio. The increase was predominately driven by the net increase in the fair value of investments of $17.7M as compared to a decrease in prior year of $28.2M.
10

UTSA FY10 Analysis of Financial ConditionOperating Expense Coverage Ratio
Measures an institution’s ability to cover future operating expenses with available year-end balances. Ratio is expressed in number of months coverage.
UTSA’s ratio remained unchanged at 4.2 months due to increase in unrestricted net assets as a result of increases in FMV of investments. In addition, operating expenses have increased by $42M.
UT System satisfactory rating is at two months or above and should be stable or improve.
11
2.0

UTSA FY10 Analysis of Financial ConditionDebt Service Coverage Ratio
This ratio measures the actual margin of protection provided to investors by annual operations. Calculation is used by Moody’s Investment Services, system-wide to determine bond rating. This is watched very closely so UT System can maintain AAA bond rating.
Trend helps to determine if an institution has assumed more debt than it can afford to service.
The debt service coverage increased from 2.1 in 2009 to 2.4 and exceeds UT System’s benchmark of greater than 1.8. This means that our net resources are 2.4 times what we are currently expending for debt payments. The ratio increased as a result of an increase in operating revenue and a decrease in debt service payments.
12

UTSA FY10 Analysis of Financial ConditionExpendable Resources to Debt Ratio
This ratio measures an institution’s ability to fund outstanding debt with existing net asset balances should an emergency occur.
UTSA’s debt ratio increased slightly due to an increase in restricted expendable net assets associated with North Paseo building and increase in unrestricted net assets attributable to the net increase in fair value of investments.
This ratio shows that more of our resources are going towards paying off debt. UT System’s Satisfactory benchmark is 0.8x or greater.
13
.8

UTSA FY10 Analysis of Financial ConditionDebt Burden Ratio
This ratio examines the institution’s dependence on borrowed funds and cost of borrowing relative to overall expenses.
UTSA’s debt burden ratio decreased by .8% as a result of increases in total operating expenses and a small decrease in debt service payments of $.3M. The institution remains heavily reliant on debt to fund cost.
UT System’s Satisfactory benchmark is less than 5.0%.
14
5.0%

UTSA FY10 AFR Summary
UTSA continues to receive a “Satisfactory” rating from UT System as a result of a healthy financial condition.
UTSA’s operating margin ratio decreased slightly from 4.0% for FY 2009 to 3.7% for 2010. The relatively stable operating margin is attributable to consistent growth in both total operating revenues of $42.1M and total operating expenses of $42.0M.
15