The United States and the Global Ethanol Market · Sources: US Data: US Bureau of Census; Brazil...
14
Daniel Whitley Associate Administrator Office of the Administrator Foreign Agriculture Service, USDA Washington, D.C. The United States and the Global Ethanol Market “Policy With a Role for Trade and Collaboration” 2018 Seoul Bioethanol Conference 26 June 2018 Seoul Korea
-
Upload
nguyendieu -
Category
Documents
-
view
214 -
download
0
Transcript of The United States and the Global Ethanol Market · Sources: US Data: US Bureau of Census; Brazil...
Daniel Whitley Associate Administrator
Office of the Administrator Foreign Agriculture Service, USDA
Washington, D.C.
The United States and the Global Ethanol Market “Policy With a Role for Trade and Collaboration”
2018 Seoul Bioethanol Conference
26 June 2018 Seoul Korea
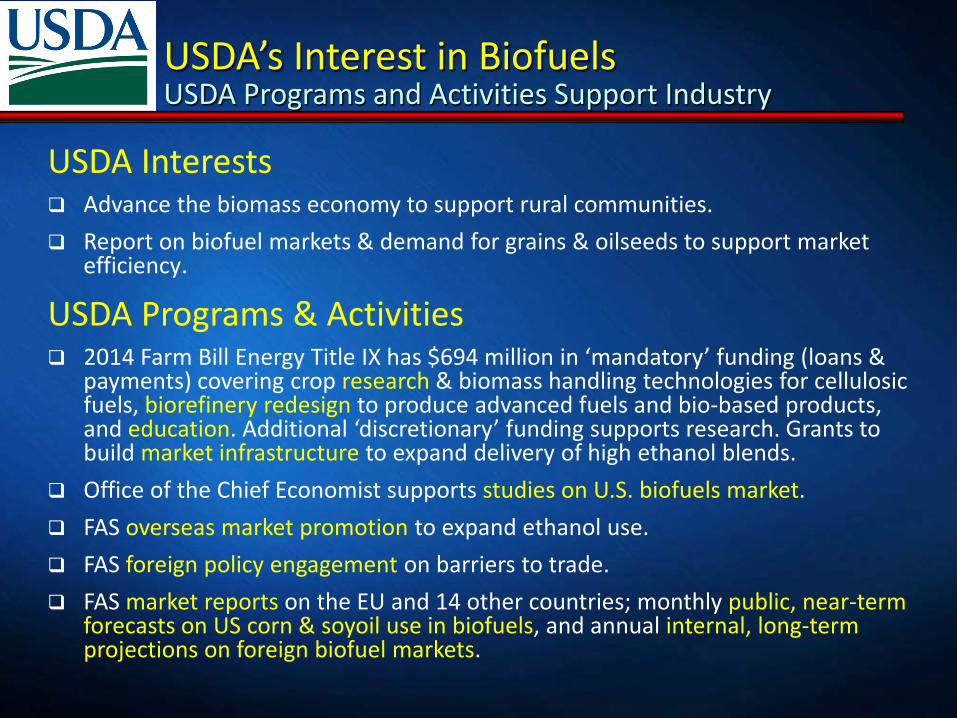
USDA’s Interest in Biofuels USDA Programs and Activities Support Industry
USDA Interests Advance the biomass economy to support rural communities. Report on biofuel markets & demand for grains & oilseeds to support market
efficiency.
USDA Programs & Activities 2014 Farm Bill Energy Title IX has $694 million in ‘mandatory’ funding (loans &
payments) covering crop research & biomass handling technologies for cellulosic fuels, biorefinery redesign to produce advanced fuels and bio-based products, and education. Additional ‘discretionary’ funding supports research. Grants to build market infrastructure to expand delivery of high ethanol blends.
Office of the Chief Economist supports studies on U.S. biofuels market. FAS overseas market promotion to expand ethanol use. FAS foreign policy engagement on barriers to trade. FAS market reports on the EU and 14 other countries; monthly public, near-term
forecasts on US corn & soyoil use in biofuels, and annual internal, long-term projections on foreign biofuel markets.
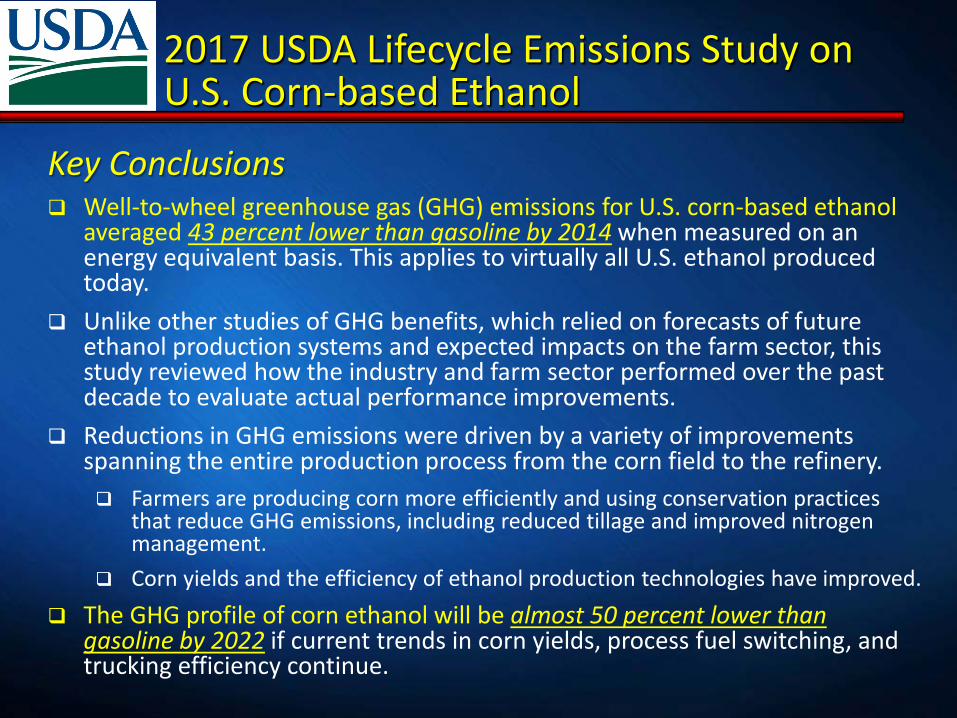
2017 USDA Lifecycle Emissions Study on U.S. Corn-based Ethanol
Key Conclusions Well-to-wheel greenhouse gas (GHG) emissions for U.S. corn-based ethanol
averaged 43 percent lower than gasoline by 2014 when measured on an energy equivalent basis. This applies to virtually all U.S. ethanol produced today.
Unlike other studies of GHG benefits, which relied on forecasts of future ethanol production systems and expected impacts on the farm sector, this study reviewed how the industry and farm sector performed over the past decade to evaluate actual performance improvements.
Reductions in GHG emissions were driven by a variety of improvements spanning the entire production process from the corn field to the refinery. Farmers are producing corn more efficiently and using conservation practices
that reduce GHG emissions, including reduced tillage and improved nitrogen management.
Corn yields and the efficiency of ethanol production technologies have improved. The GHG profile of corn ethanol will be almost 50 percent lower than
gasoline by 2022 if current trends in corn yields, process fuel switching, and trucking efficiency continue.
Strength of U.S. Ethanol Exports
-
1,000
2,000
3,000
4,000
5,000
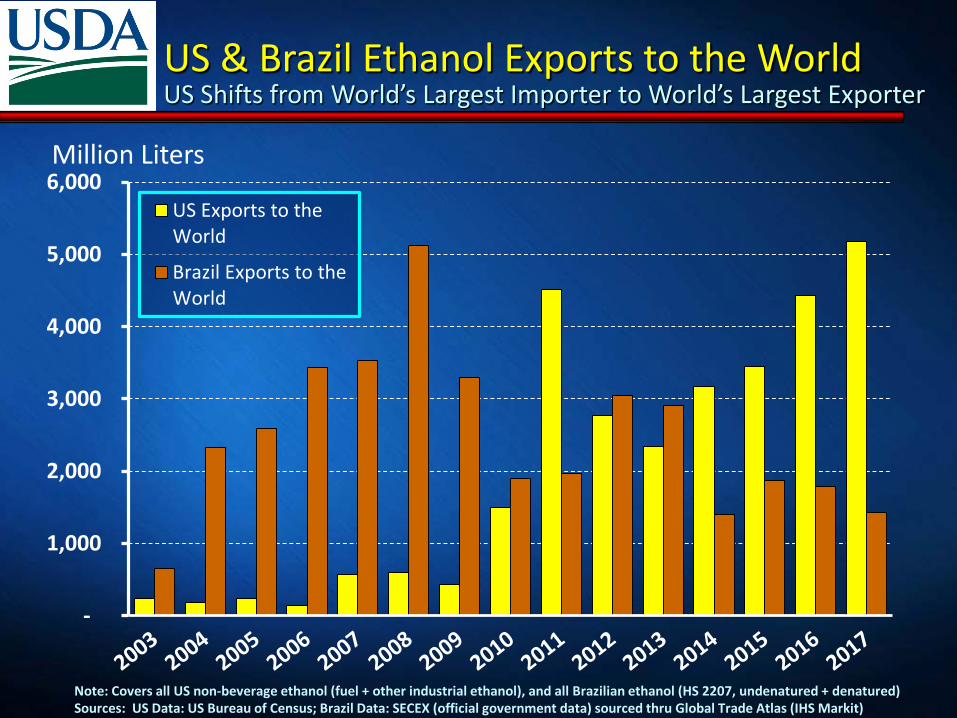
6,000US Exports to theWorld
Brazil Exports to theWorld
Note: Covers all US non-beverage ethanol (fuel + other industrial ethanol), and all Brazilian ethanol (HS 2207, undenatured + denatured) Sources: US Data: US Bureau of Census; Brazil Data: SECEX (official government data) sourced thru Global Trade Atlas (IHS Markit)
US & Brazil Ethanol Exports to the World US Shifts from World’s Largest Importer to World’s Largest Exporter
Million Liters
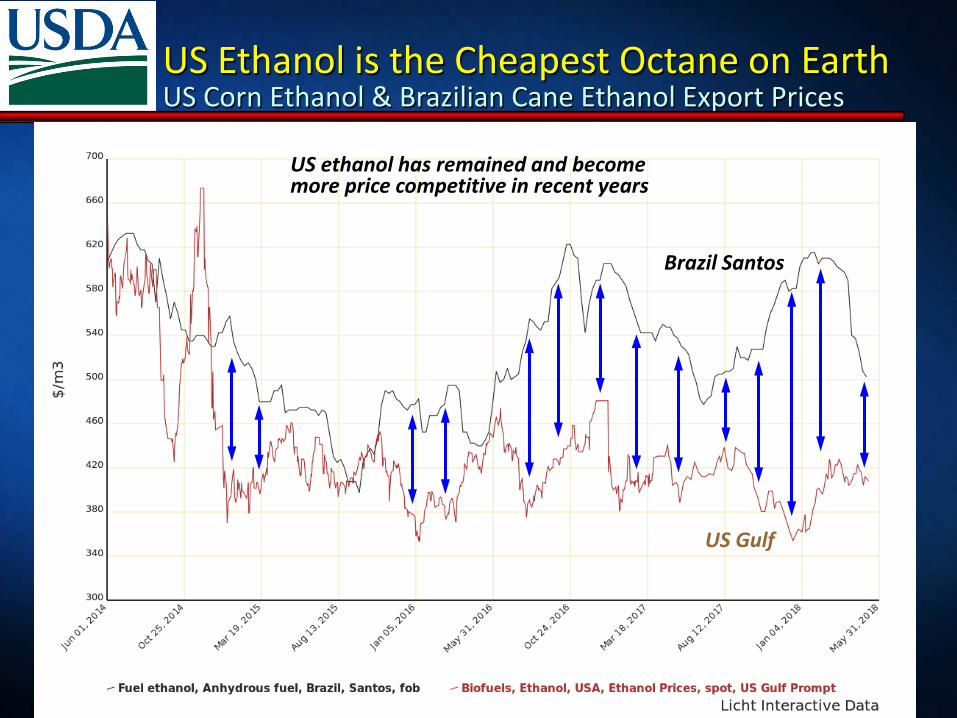
US Ethanol is the Cheapest Octane on Earth US Corn Ethanol & Brazilian Cane Ethanol Export Prices
US ethanol has remained and become more price competitive in recent years
US Gulf
Brazil Santos
0
1,000
2,000
3,000
4,000
5,000
6,000
All Other
Mexico
Peru
EU-28
South Korea
Philippines
China
India
Brazil
Canada
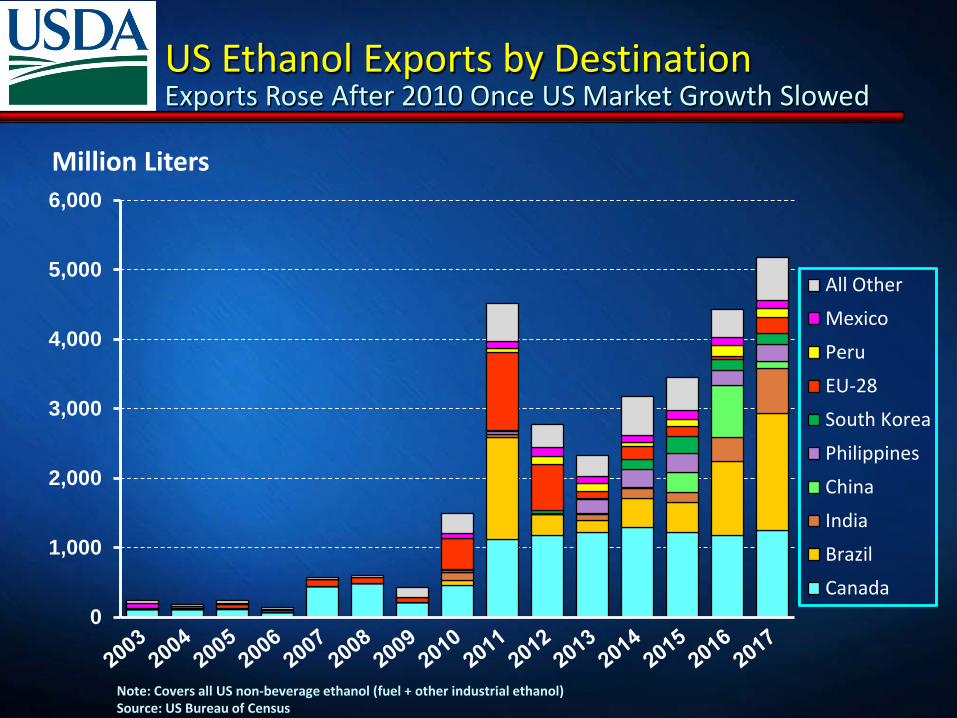
US Ethanol Exports by Destination Exports Rose After 2010 Once US Market Growth Slowed
Million Liters
Note: Covers all US non-beverage ethanol (fuel + other industrial ethanol) Source: US Bureau of Census

The Global Market Offers Opportunity
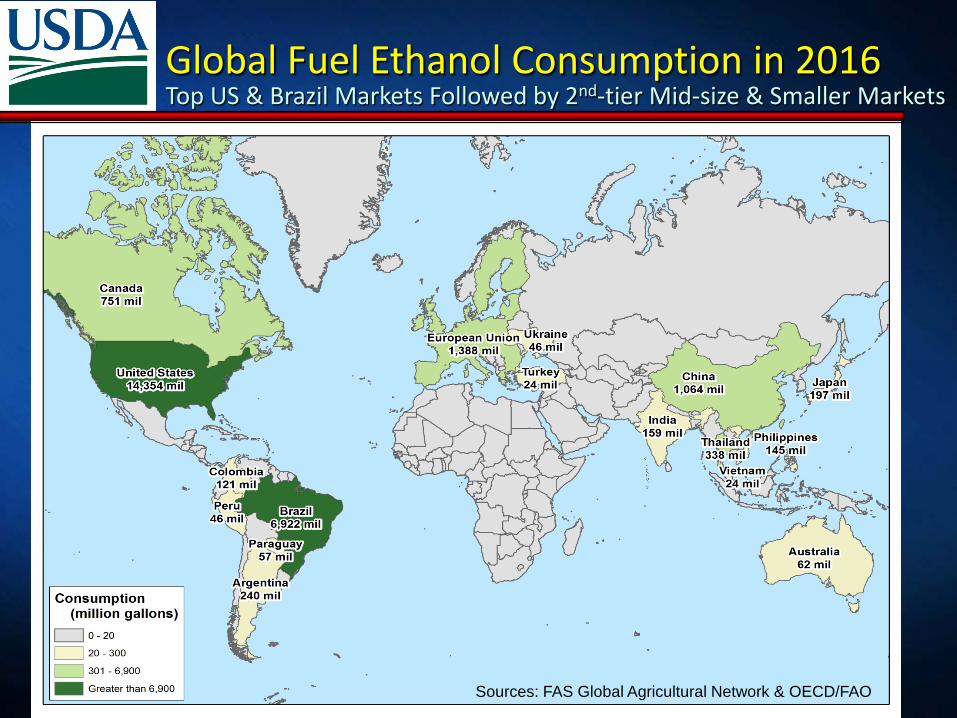
Global Fuel Ethanol Consumption in 2016 Top US & Brazil Markets Followed by 2nd-tier Mid-size & Smaller Markets
Sources: FAS Global Agricultural Network & OECD/FAO
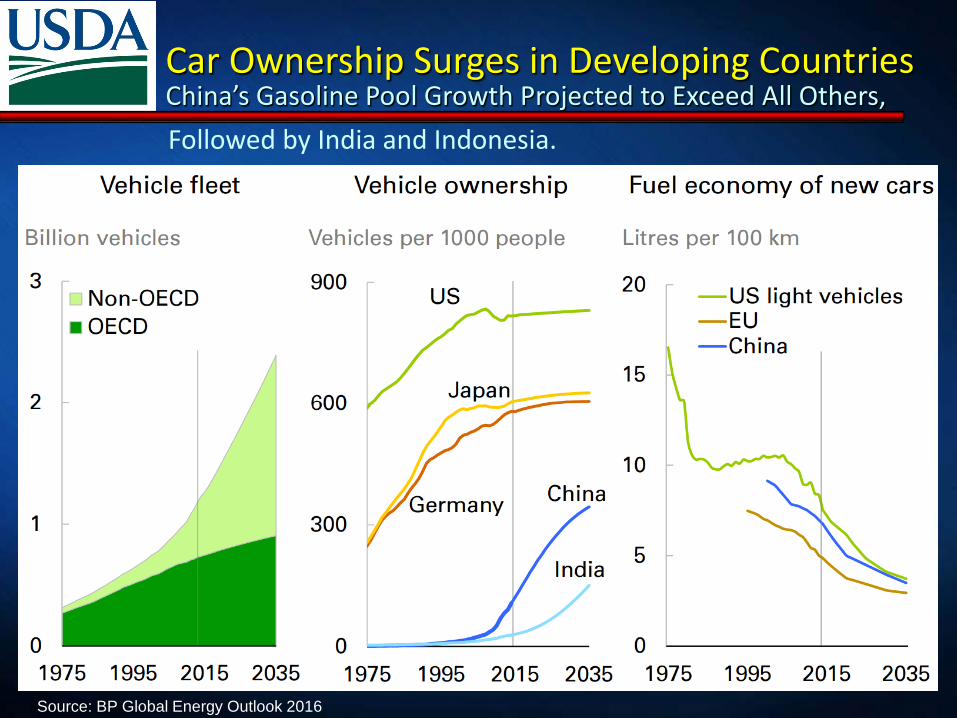
Car Ownership Surges in Developing Countries China’s Gasoline Pool Growth Projected to Exceed All Others,
Source: BP Global Energy Outlook 2016
Followed by India and Indonesia.
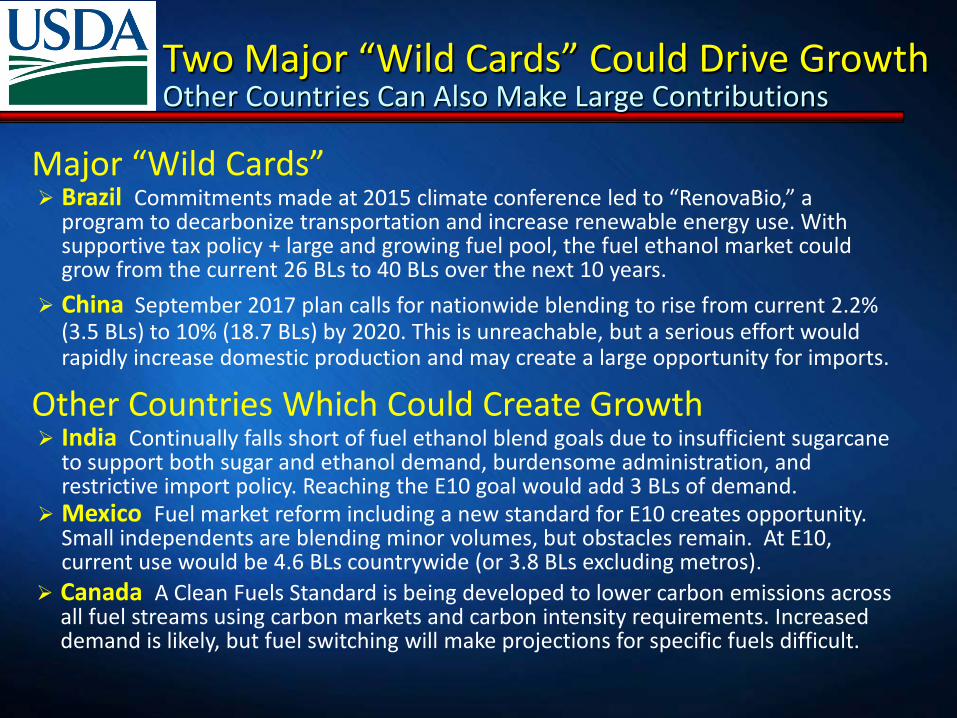
Canada A Clean Fuels Standard is being developed to lower carbon emissions across all fuel streams using carbon markets and carbon intensity requirements. Increased demand is likely, but fuel switching will make projections for specific fuels difficult.
Two Major “Wild Cards” Could Drive Growth Other Countries Can Also Make Large Contributions
Major “Wild Cards” Brazil Commitments made at 2015 climate conference led to “RenovaBio,” a
program to decarbonize transportation and increase renewable energy use. With supportive tax policy + large and growing fuel pool, the fuel ethanol market could grow from the current 26 BLs to 40 BLs over the next 10 years.
China September 2017 plan calls for nationwide blending to rise from current 2.2% (3.5 BLs) to 10% (18.7 BLs) by 2020. This is unreachable, but a serious effort would rapidly increase domestic production and may create a large opportunity for imports.
Mexico Fuel market reform including a new standard for E10 creates opportunity. Small independents are blending minor volumes, but obstacles remain. At E10, current use would be 4.6 BLs countrywide (or 3.8 BLs excluding metros).
Other Countries Which Could Create Growth India Continually falls short of fuel ethanol blend goals due to insufficient sugarcane
to support both sugar and ethanol demand, burdensome administration, and restrictive import policy. Reaching the E10 goal would add 3 BLs of demand.
0
400
800
1,200
1,600
2,000
2,400US Importsfrom BrazilUS Exports toBrazil
Mil Liters
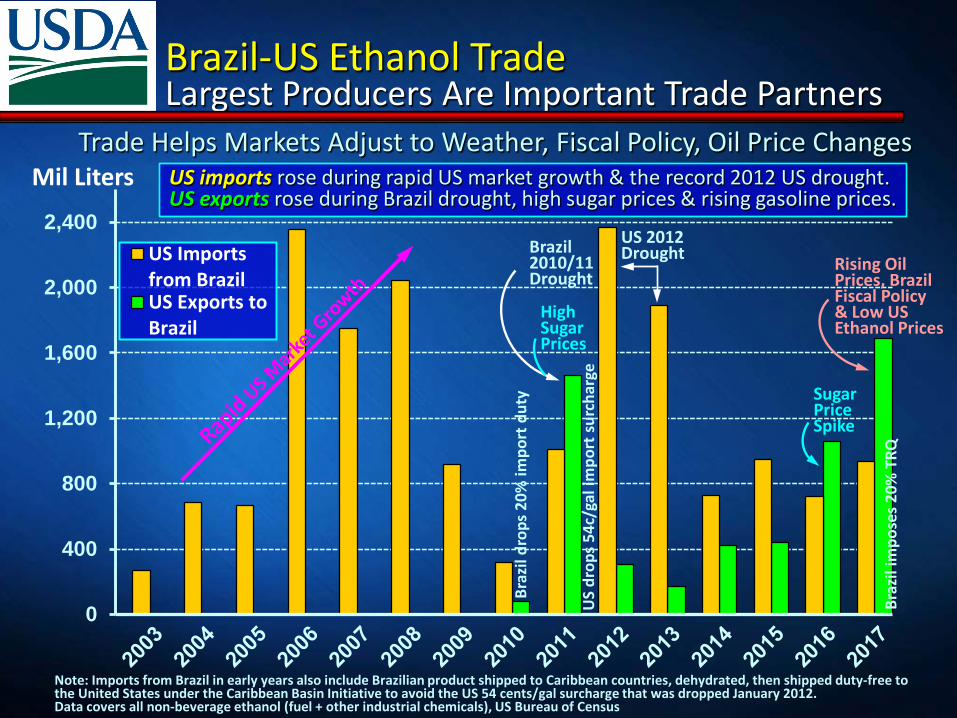
Note: Imports from Brazil in early years also include Brazilian product shipped to Caribbean countries, dehydrated, then shipped duty-free to the United States under the Caribbean Basin Initiative to avoid the US 54 cents/gal surcharge that was dropped January 2012. Data covers all non-beverage ethanol (fuel + other industrial chemicals), US Bureau of Census
Largest Producers Are Important Trade Partners Trade Helps Markets Adjust to Weather, Fiscal Policy, Oil Price Changes
Brazil 2010/11 Drought
Sugar Price Spike
US 2012 Drought
US
drop
s 54
c/ga
l im
port
sur
char
ge
Braz
il dr
ops
20%
impo
rt d
uty
High Sugar Prices
Braz
il im
pose
s 20%
TRQ
Brazil-US Ethanol Trade
Rising Oil Prices, Brazil Fiscal Policy & Low US Ethanol Prices
US imports rose during rapid US market growth & the record 2012 US drought. US exports rose during Brazil drought, high sugar prices & rising gasoline prices.
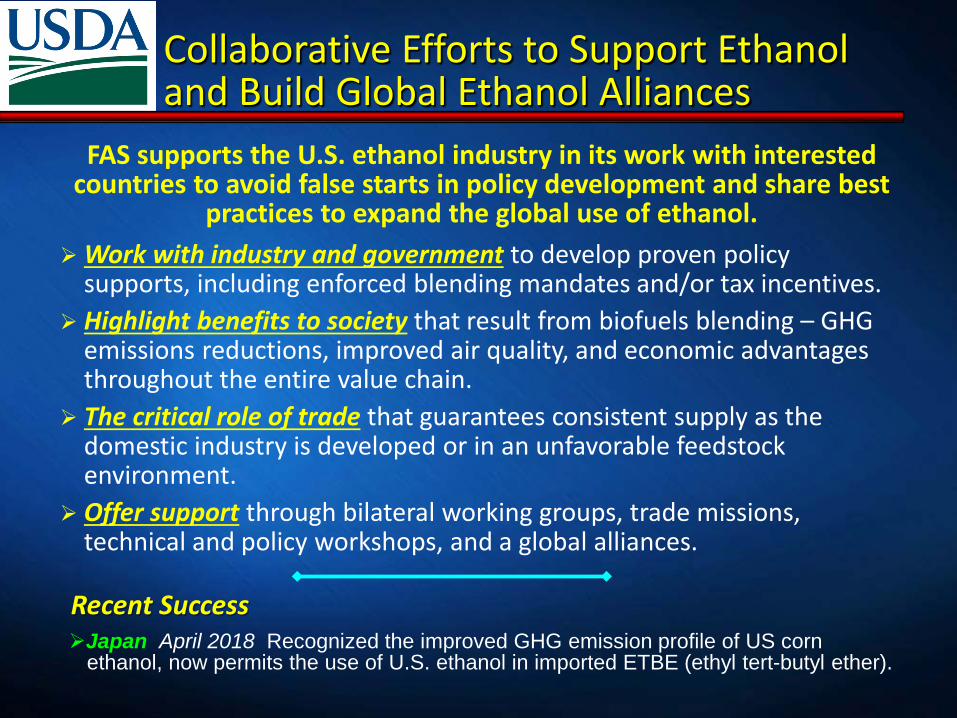
FAS supports the U.S. ethanol industry in its work with interested countries to avoid false starts in policy development and share best
practices to expand the global use of ethanol. Work with industry and government to develop proven policy
supports, including enforced blending mandates and/or tax incentives. Highlight benefits to society that result from biofuels blending – GHG
emissions reductions, improved air quality, and economic advantages throughout the entire value chain.
The critical role of trade that guarantees consistent supply as the domestic industry is developed or in an unfavorable feedstock environment.
Offer support through bilateral working groups, trade missions, technical and policy workshops, and a global alliances.
Collaborative Efforts to Support Ethanol and Build Global Ethanol Alliances
Japan April 2018 Recognized the improved GHG emission profile of US corn ethanol, now permits the use of U.S. ethanol in imported ETBE (ethyl tert-butyl ether).
Recent Success

Thank You …
Any Questions?