Cisco Unified Contact Center Enterprise Solution Reference ...

NBER WORKING PAPER SERIES
THE UNIFIED ENTERPRISE TAX AND SOES IN CHINA
John WhalleyLi Wang
Working Paper 12899http://www.nber.org/papers/w12899
NATIONAL BUREAU OF ECONOMIC RESEARCH1050 Massachusetts Avenue
Cambridge, MA 02138February 2007
Financial support from SSHRC and a CIGI Post-doctoral Fellowship held by the second author makesthis paper possible and is greatly appreciated. The views expressed herein are those of the author(s) anddo not necessarily reflect the views of the National Bureau of Economic Research.
© 2007 by John Whalley and Li Wang. All rights reserved. Short sections of text, not to exceed twoparagraphs, may be quoted without explicit permission provided that full credit, including © notice,is given to the source.

The Unified Enterprise Tax and SOEs in ChinaJohn Whalley and Li WangNBER Working Paper No. 12899February 2007JEL No. H2,P3,P35
ABSTRACT
Currently proposals are actively circulating in China to move to a unified enterprise tax structure withsimilar tax treatment of state-owned enterprises (SOEs), other private enterprises (OPE) and foreigninvestment enterprises (FIEs). FIEs presently receive significant tax preferences through a sharplylower tax rate, tax holidays and other provisions. Here we use analytical representations of SOE behavior,which differ from that of the competitive firm, to argue that a unified tax structure may not be a desirabletax change and that typically a higher tax rate on SOEs is called for on efficiency grounds. Using aworker control model with endogenously determined shirking, taxes on SOEs reduce shirking anda reduced SOE tax rate under a unified tax relaxes discipline on SOEs and losses result. Our resultsindicate a 0.26% of GDP welfare loss using 2004 data from a unified tax, and larger loss relative toan optimal tax scheme. Alternatively, if we use a managerial control model variant, we find a 0.19%welfare loss from a unified tax, and larger losses relative to initial higher SOE tax rates.
John WhalleyDepartment of EconomicsSocial Science CentreUniversity of Western OntarioLondon, Ontario N6A 5C2 CANADAand [email protected]
Li WangDepartment of EconomicsUniversity of Western OntarioLondon, ONCanadaN6A [email protected]

The Unified Enterprise Tax and SOEs in China
1. Introduction
A central element in China’s recent strong growth performance has been large inflows of
foreign direct investment (FDI)2, and a key factor in attracting foreign investment has been
substantial tax preferences. The tax preferences currently given to FIEs are complex. If they
are in special economic zones, national hi-tech industrial zones and national grade economic
and technical development zones, they pay a reduced enterprise tax rate of 15% compared to
the general rate of 30%. FIEs in coastal regions and all provincial capitals pay 24%. FIEs
also receive extensive tax holidays with a full exemption for 2 years, a 50% exemption for
the next 3 years and (if in particular geographical zones) a tax reduction of 15-30% for a
further 3-5 years. In addition, local governments frequently exempt them from local
surcharges applied to other enterprise of 3% of taxable income, and taxable income can
again be reduced if income is reinvested. There is also differential tax treatment of wages
paid to employees between FIEs and other enterprises. There are no formal estimates of
effective tax rates on Chinese enterprises comparable to those for OECD economies, but
instead indications that widely circulate that FIEs on average may face tax rates in the
10-15% range, while non FIEs face tax rates of between 22% and 28%3. The proposal is for
a unified and single equal yield tax rate to apply to all enterprises and for tax preferences
towards FIEs to be removed.
The feature of China’s economy we focus on here in the design of a unified tax is
state-owned enterprises (SOEs) whose behavior departs from that of competitive firms due
2 Xin and Whalley (2006) report in a recent growth accounting study on China that Foreign Investment Enterprises (FIEs), a special legal form that embodies most FDI, now account for over 20% of GDP, nearly 50% of manufacturing output, and over 50% of exports. Simultaneously, however, they only account for 3% of employment and have labor productivity nearly eight times that of the rest of the economy (admittedly including agriculture). 3 See footnote 5 in page 7.
2

to either worker or managerial control. SOEs dominated the Chinese economy before
China’s economic reform process began in the late 1970s. From the early 1980s on a
management contract system was implemented for SOEs to improve their efficiency within
the state ownership structure. But in 2004, SOEs and collective enterprises still accounted
for 42.4 % of value added of all enterprises in the industrial sector and 46.2 % of
employment. They also had lower productivity than other types of firms in the Chinese
economy.
Here we argue that while in tax policy models used in OECD countries a change to a unified
tax may appear desirable since all firms are similar, things are for less clear in a tax model
of China which incorporates analytical representations of SOE behavior. We consider two
simplified treatments of SOE behavioral response which build on models used in Whalley
and Zhang (2006). In one, which we term a worker control model, enterprises are assumed
to receive capital allocated through the banking system via credit rationing with any losses
incurred subsequently recapitalized. In essence, capital is freely allocated to SOEs through
this mechanism. Workers are guaranteed jobs at a fixed wages, and the enterprise must meet
a budget constraint which implies that the value of output must cover the wage bill plus any
surplus required by the state. Shirking is thus endogenously determined as workers
collectively engage in satisfycing behavior. Hence, a tax on enterprise income (on the
surplus) acts to reduce shirking and raise output.
In the other, which we term a managerial control model, enterprises are controlled instead
by managers, who again receive credit allocated recapitalizable loans (effectively capital at
zero cost). With political appointed managers, we assume managers act so as to maximize
their own political and business connections and maximize the size of enterprises rather than
profit. This implies average product pricing of labor, and enterprises which are too large
relative to Pareto efficiency. Taxes on any required surplus in this case reduce the enterprise
size, and a higher tax rate on SOEs compared to other enterprises is again preferred.
3

We explore the influence of these effects on tax design using calibrated general equilibrium
models of the Chinese economy capturing four sectors with each assumed to produce
heterogeneous outputs using capital and labor as inputs. The four sectors are an agriculture
producing sector, a sector with SOEs, one with FIEs and one with other private enterprises.
We use the two different formulations of SOE behavior described above in alternative
model variants. We use data for 2004 from the Chinese Statistics Yearbook for calibration,
and assume values for key unobservables in the base year (such as the level of shirking in
SOEs in the worker control model).
We conduct a series of counterfactual experiments with these models. We then investigate
model outcomes when moving to a uniform tax treatment across all four sectors (relative to
the current tax treatment of preference to FIEs) which preserves government tax yield. In
both worker and managerial control models losses occur. We then evaluate losses relative to
higher initial tax rates on SOEs and find that the losses involved are even larger.
The theme that emerges from our analysis is that tax changes that do not take account of the
special role and behavior of SOEs in China can potentially mislead. Uniform tax treatment
across all non-SOE sector enterprises may be desirable, but not across all enterprises.
Lowered tax rates on SOEs effectively relax discipline on them, moving resource allocation
further away from a Pareto efficient allocation.
2. The unified tax reform proposal in China
Two decades ago, the main source of tax revenue for the national government in China was
taxes collected from enterprises, which were almost entirely owned by the national
government (see Brean (1998) for a discussion of the evolution of Chinese tax policy). This
heavy revenue dependence of the government on the state-owned sector distorted
government decision-making and caused the government to favor this heavily taxed sector
through prioritized bank loans and preferential regulation. In the beginning of the 1990s,
4

however, the Chinese Government set out a long-term tax reform plan, which included
“unification of taxation management, equity of tax burden, simplification of tax system,
reasonalization of revenue distribution relations and guarantee of the financial revenue”.
The aim was to improve economic efficiency, as well as to promote social fairness. This
plan remained, however, as a long term goal and was not implemented in concrete form.
As Table 1 shows, after the tax reforms of 1990s, the structure of Chinese government
revenue structure changed substantially. Not only was there growth in tax revenues as a
fraction of GDP, but also a shift away from enterprise taxes towards other tax sources
( especially the VAT). To attract FDI during this period, tax preferences were given to
almost all foreign enterprises resulting in a dual-track enterprise income tax system. First in
1991 and later in 1994, laws for separate corporate income taxes for foreign and domestic
enterprises were enacted4. Under this system, most FIEs paid taxes at a rate of 15% , while
other types of enterprises paid tax at a 30% rate. To qualify FIEs had to be in special
economic zones, hi-tech industrial zones and national grade economic and technical
development zones. FIEs in coastal regions and in all provincial capitals paid taxes at a 24%
rate. FIEs additionally received complete tax holidays for the first two years, a 50%
exemption for the next three years, and an exemption from a 3% local surcharge collected
by municipalities, and retained earnings were more lightly taxed. Also, FIEs could fully
deduct wage costs while other enterprises could only deduct 40% of wage costs. Converting
these tax preferences into effective tax rates by enterprise type is treacherous, as the
effective tax rate varies with the time profile of returns to investment (most FIEs make no
profit in their first two years, for instance), their location, their financing, and labor costs.
There are no estimates of effective tax rates for Chinese enterprises comparable to those of
OECD economies (such as in Fullerton and King (1984) and the studies which have
4 The two laws are “ Income Tax Law of the People's Republic of China for Enterprises with Foreign Investment and Foreign Enterprises” which was enacted in 1991 and “Income Tax Law of the People's Republic of China for Enterprises” which was enacted in 1994.
5

Table 1 National Government Revenue and Enterprise Tax Revenues in China
Total national government revenue (billion RMB)
Total tax revenue (billion RMB)
Enterprise tax revenue from SOEs5
(billion RMB)
Enterprise income tax from all enterprises (billion RMB)
Share of enterprise tax revenue from SOEs and OPEs6
(%)
Share of enterprise tax revenue from FIEs (%)
1985 200.5 134.5 69.6
1986 212.2 139.8 69.2
1987 219.9 147.6 66.5
1988 235.7 171.4 67.6
1989 266.5 202.7 70.0
1990 293.7 210.6 71.6
1991 314.9 225.9 73.1
1992 348.3 257.6 72.1
1993 434.9 357.7 67.9
1994 521.8 441.9 70.8
1995 624.2 515.9 87.8
1996 740.8 594.1 96.8
1997 865.1 823.4 96.3
1998 987.6 926.3 92.6
1999 1144.4 1068.6 81.1 122.7 82.3 17.7
2000 1339.5 1258.2 99.9 177.1 81.6 18.4
2001 1638.6 1530.1 263.1 80.5 19.5
2002 1890.4 1763.6 308.3 76.2 23.8
2003 2171.5 2001.7 291.9 76.9 23.1
5 Prior to 2001 data is only separately available for tax revenues from SOEs, and after 2001 only available for all enterprises and FIEs according to Chinese Statistical Yearbook. Tax revenue data for SOEs and FIEs in 1999 and 2000 are taken from Ministry of Finance,PRC and can be accessed at www.mof.gov.cn. 6 Shares in this column and last column in this table are calculated by the authors using data published by Ministry of Finance, PRC. http://www.chinatax.gov.cn/data99-04.jsp.
6

Source: 1. Chinese Statistical Yearbook 2005 and 1996.
2. State Administration of Taxation, PRC
followed), but various Chinese sources put the capital tax rates faced by FIEs in the range of
10%-14%, while for the non-FIEs a range of 22-28%7 is widely used.
In the modeling work report below, we use a tax rate FIEs of 14% and on other sectors of
24%, which we then replace by a single rate unified tax across all enterprises. In 2004, 23%
of total enterprise taxes were paid by FIEs, and 77% were paid by the other types of
enterprises (See Table 1), even though FIEs accounted for a significantly larger part of the
total return to capital.
With more than 2 decades of reform completed and accession to the WTO accomplished,
under China’s so-called “Gradual Therapy” the government position now is that FDI
inflows are mainly attracted by non tax factors. These include China’s economic
environment, a growing domestic market, low wage rates, well trained and hard working
labor, a market system and a stronger judicial system. With tax preferences seen as less
7 Different sources provide different estimates which lie in these ranges. Effective tax rates will differ by the life of assets,
location of investments and finance. See the articles from (1) Embassy of the People’s Republic of China in the United
States of America: in the article: “China to Unify Corporate Income Tax Systems”, which says: “The actual income tax
rate has remained at 14 percent for overseas-funded businesses, much lower than the 24 percent rate for domestic firms,
since China formulated the preferential policy for overseas-funded enterprises in mid-1980s in a bid to lure foreign
investment”. The article can be accessed at http://www.china-embassy.org/eng/gyzg/t231590.htm; (2) Hong Kong
Trade Development Council: in “Drafting of Unified Enterprise Income Tax Completed” says: “At present, domestic
enterprises in China are subject to a nominal income tax rate of 33% while the actual rates applied to FIEs and foreign
enterprises range from 15% to 24%”. The article can be accessed at http://www.tdctrade.com/alert/cba-e0304a-2.htm;(3)
Development Research Center of State Council, PRC (2006, in Chinese). In the article: “When Can We Unify Enterprise
Income Tax?”, it says: “ In 2004, domestic enterprises in China are subject to an actual income tax rate of 26.29% the
actual rates applied to FIEs and foreign enterprises is just around 13.87”%” This article can be accessed at:
http://www.drcnet.com.cn/temp/20061114/gylt_7.html; (4) Peoples Daily (in Chinese): in the article “ Why Is It So
Difficult in Unifying Enterprise Income Tax” says “According to experts’ evaluation, while domestic enterprises in
China are subject to an actual income tax rate of 23% the actual rates applied to FIEs and foreign enterprises is just around
10%”. This article can be accessed at http://finance.people.com.cn/GB/1045/3860233.html
7

important, the government proposal is thus to unify enterprise tax rates and to remove what
are seen as distortions associated with the various incentive schemes for FIEs.
The most recent proposal on unified tax reform has been discussed by members of the
Standing Committee of the National People's Congress in the end of December, 2006, they
deliberated a draft of a new corporate income tax law which includes following.8 (1) The
draft bill suggests a unified tax rate of 25-percent for both domestic and foreign-funded
businesses. (2) For small business enterprises, according to the draft law, the income tax for
small businesses will be 20 percent. Depending on what region and what industry they are
active in, small businesses now pay either 18 percent or 27 percent. (3) The bill allows
domestic companies to deduct employees' full salaries from taxable income as foreign
companies now do. (4) There will be transitional measures for FIEs under which the current
two-year full tax exemption and three-year partial tax exemption for foreign manufacturers
will be removed and export-oriented foreign-funded businesses will no longer enjoy an
additional 50-percent tax reduction. But existing FIEs will continue to receive tax
preferences for five years after the new law is implemented and will only gradually face
increased income taxes. The bill also extends some existing tax preferences. For instance,
all hi-tech companies will enjoy a 15-percent tax rate to stimulate innovation, while at
present only those in state hi-tech zones enjoy this privilege. Investments in equipment for
environmental protection and water conservancy purposes and for production safety will
be able to be used to offset taxes payable. The new enterprise tax structure is expected to
take effect in 2008 if the bill is adopted by the NPC plenary session in March 2007.
3. General Equilibrium Models of China Incorporating SOE behavior
An immediate reaction to any proposal to analyze the efficiency and distributional impacts
of the unified tax proposal is to use competitive equilibrium models of tax policy changes
that are well documented in the literature; beginning with Harberger (1962) and further 8 The draft can be accessed at China Daily: http://www.chinadaily.com.cn/china/2006-12/25/content_766418.htm and Ministry of Finance, PRC, at www.mof.gov.cn.
8

developing in Shoven and Whalley (1972,1984)9. Some representation of the applied tax
rates before and after the change would be used, and transitional arrangements would be
ignored. Typically, constant returns to scale goods and factor production functions are
assumed in these for competitive firms, with demands generated from utility maximization.
Tax revenues, for simplicity, we redistributed to consumers in lump sum form. Market
clearing in goods and factors then characterizes equilibrium. For a closed economy, this
occurs in both goods and factor markets, with both goods and factor prices being
endogenously determined. For a small open economy which is a taker of goods prices, only
factor prices are endogenously determined with factor market cleaning. Taxes on both goods
and factors along with income taxes in multi-consumer variants change equilibrium
behavior, and distorting taxes impose welfare costs usually captured in Hicksian measures
such as the equivalent or compensating variation. The sum of Hicksian measures across
consumers is usually taken as the aggregate welfare measure of impact. The presumption in
a standard competitive model is that unified and common tax treatment across all sectors is
welfare preferred.
However, if there is different behavior by type of enterprise, and SOEs behave differently
from competitive firms, things are less clear. To explore how this applies to the unified tax
proposal we can thus consider similar models, but with the added element of explicit
representation of the SOE sector in alternative form. To do this, we consider agriculture and
manufacturing sectors to represent the Chinese economy, but we subdivide manufacturing
into 3 different subsectors: foreign invested enterprises, other private enterprises; and
state-owned enterprises10, each producing a distinct output.
9 See Lockwood, Ben and E. Ahmad, R.Singh (2005) for the use of such a model to analyze Chinese VAT reforms which would combine what is effectively now a manufacturing level VAT at 17% and a turnover tax on services at 3%. 10 In the Chinese Statistical Yearbook, value-added data for manufacturing is given for 10 different types of enterprises: Manufacturing 1 = State-Owned Industry, Manufacturing 2 = Collective-Owned Industry, Manufacturing 3 = Co-operative
Enterprises, Manufacturing 4 = Joint Ownership Enterprises, Manufacturing 5 = Limited Liability Co-operations,
Manufacturing 6 = Share Holding Enterprises, Manufacturing 7 = Private Enterprises, Manufacturing 8 = Other Enterprises,
Manufacturing 9 = Enterprises with Funds from Hong Kong, Macao, and Taiwan, and Manufacturing 10 = Foreign Funded
Enterprises. We treat the first 2 as the SOE manufacturing subsector, 3 to 8 are aggregated as other private enterprise
subsector (OPEs), and the latter 2 as the foreign investment subsector (FIEs).
9

For the first 3 subsectors, we consider a sectoral production function of the form.
),( iiii LKFY = i=AGR, FIE, OPE (1)
where Yi refers to output, Ki and Li are capital and labor inputs.
We assume CES forms, but we can alternatively use Cobb-Douglas or some other variant.
Both capital and labor in these sectors are treated as intersectorally mobile among the three
sectors, but internationally immobile with factors hired up to the point that their marginal
value product equals the corresponding factor price (the wage or rental rate).
We then consider 2 alternative variants of submodels for the SOE sector, even though in
reality the Chinese SOE sector is highly complex with a variety of arrangements, and any
simplification is inevitably an abstraction from a more diverse and complex reality. Each
variant assumes different forms of control and optimizing behavior. It is difficult to consider
these two forms simultaneously in a single model since different optimizing behavior is
assumed in each, and so we separately consider two different model variants each of which
point in the same direction for tax policy implications.
3.1 Worker control SOE submodel
The first of these we designate as a worker control SOE submodel, and this can be thought
of as reflective of traditional SOEs in the 1970s. In this formulation of SOE behavior we
assume workers have both job and wage guarantees with the membership of the enterprise
fixed. We model the sector in the form of a single representative enterprise.
We assume that capital is allocated to the SOE sector by credit rationing through a state
controlled banking system, and that any losses incurred by banks on loans through non
repayment of interest and principal are recapitalized by the central bank. We assume that
SOEs behave as if loans need not be repaid, and as such, capital is freely allocated to
enterprises once rationed credit is assigned. Members of the enterprise collectively decide
10

on enterprise output, but must meet an enterprise budget constraint which covers wages plus
any surplus to be returned to the state. After meeting the enterprise budget constraint,
workers can either shirk (enjoy the leisure) or pursue second jobs by moonlighting.
This is a strong simplification since from the 1990’s on there has been progressive
discipline applied to state owned enterprises and major efforts to reduce the size of SOE
non performing loans in the banking system. Today in China many of the large SOEs in
banking, telecoms, petrochemicals and other sectors are highly profitable, but the simplicity
of the formulation serves our end of demonstrating the need to differentiate tax policy
toward SOEs.
We consider a single representative SOE and write the SOE production function as:
αλ −= 1)( LAYsoe (2)
where Ysoe is output, L is the enterprise membership, and λ denotes the degree of
effort extended by workers (λ =0 implies complete shirking; λ =1 implies full effort). α
(α <1) is an exponent giving decreasing returns to labor input, and A is an efficiency
parameter.
The collective budget constraint for enterprise members is:
soesoesoe SLwYP += (3)
where Ssoe represents the surplus to be returned to the state.
From the production function, λ (the degree of effort) increases as Ysoe increases. Simple
substitution of (2) into (3) implies that a tax imposed on Ssoe as an enterprise income tax will
increase Ysoe and hence λ .
We complete the model in the following way. We consider households to have preferences
defined over both the 4 goods in the model and leisure but differently treat workers in SOEs
and other enterprises. SOE workers collectively decide on their level of shirking so as meet
11

the enterprise budget constraint and so do not make labor supply decision based on utility
maximizing behavior. For SOE members, leisure enters preferences but leisure consumption
is implied by the satisfying behavior of them collectively meeting their enterprise budget
constraint which is necessary for workers to retain their job. SOE member thus optimize
over the consumption of goods, but satisfice in their leisure and labor supply behavior.
Because of this behavior in the SOE sector we partition consumers into those working in
SOEs and elsewhere. For the former (SOE workers) utility maximization takes the form:
))1(,,.......(max 41 LXXU λ− (4)
st. soei
ii RLXP +=∑=
ω)(4
1
where L)1( λ− is shirked labor and defines the amount of leisure entering preferences. In
this structure, since workers satisfice in their shirking behavior in order to retain their SOE
jobs, leisure is not derived from conventional first order conditions. Rsoe. is government
revenues redistributed to workers in the SOE sector.
For the non-SOE workers utility maximization takes the more conventional form:
),,.......(max 41 LeXXU (5)
st. soenonii
i RKrLeLXP −=
++−=∑ )(4
1ω
where L represents their labor endowment, Le is leisure consumption, K is the economy
wide endowment of capital used in the 3 non SOE sectors and Rnon-soe. is government
revenues redistributed to workers in the non-SOE sector.
Equilibrium in this model version implies clearing in all goods markets, factor market
clearing in capital and labor across the 3 non-SOE sectors and government budget balance
with tax collection equaling revenue distributed. Taxes can be applied to either or both of
goods and factors. Because of the differential treatment of the SOE sector, taxes on capital
12
income applied to SOEs as a tax on their surplus to be transferred to the state will increase
output and lower shirking. However, because of the presence of leisure in preferences it will
not to be optimal to tax Ssoe so as to force λ to 1. An optimal tax scheme will typically
involve a tax rate on the SOE sector different from that on the non SOE sector, and
depending on the configuration of initial tax rates a move to a unified tax may no longer be
desirable.
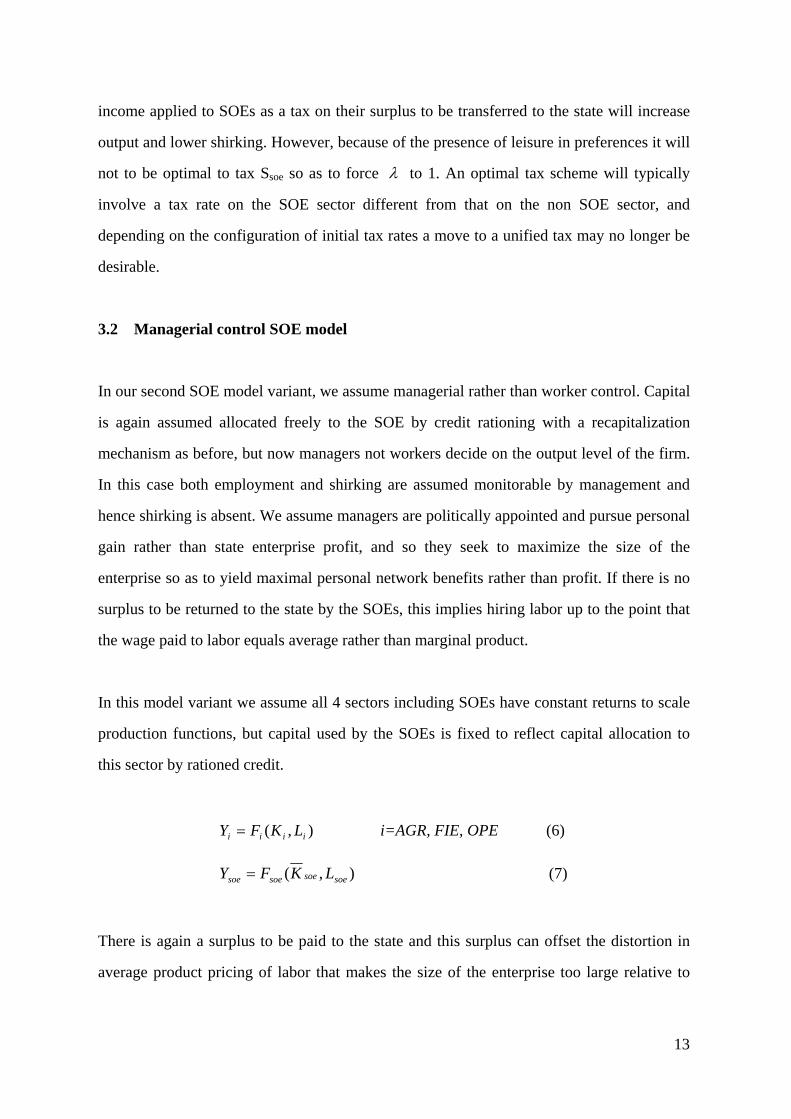
3.2 Managerial control SOE model
In our second SOE model variant, we assume managerial rather than worker control. Capital
is again assumed allocated freely to the SOE by credit rationing with a recapitalization
mechanism as before, but now managers not workers decide on the output level of the firm.
In this case both employment and shirking are assumed monitorable by management and
hence shirking is absent. We assume managers are politically appointed and pursue personal
gain rather than state enterprise profit, and so they seek to maximize the size of the
enterprise so as to yield maximal personal network benefits rather than profit. If there is no
surplus to be returned to the state by the SOEs, this implies hiring labor up to the point that
the wage paid to labor equals average rather than marginal product.
In this model variant we assume all 4 sectors including SOEs have constant returns to scale
production functions, but capital used by the SOEs is fixed to reflect capital allocation to
this sector by rationed credit.
),( iiii LKFY = i=AGR, FIE, OPE (6)
),( soesoesoesoe LKFY = (7)
There is again a surplus to be paid to the state and this surplus can offset the distortion in
average product pricing of labor that makes the size of the enterprise too large relative to
13

Pareto efficiency. If the size of the surplus is below that which fully offsets this distortion, a
higher enterprise tax on the SOEs will be desirable.
For the 3 non-SOE sectors.
i
iii L
YPw∂∂
= i
iii K
YPr∂∂
= i=AGR, FIE, OPE (8)
but for the SOE sector, given size maximizing behavior by managers:
soe
soesoesoesoe L
SYPw
−= (9)
where Ssoe is the surplus returned to the state, and Pi and Psoe are output prices. Equilibrium
is given by clearing in goods market and the capital market across the 3 non SOE subsectors
and for labor across all 4 sectors. Here a tax on Ssoe will reduce Ysoe and Lsoe and hence can
help correct a distortion in labor markets associated with average rather than marginal
product pricing of labor if the original value of Ssoe is below what is required.
In this model variant, as in the worker controlled model, taxes on SOE will optimally be set
in ways which are different from those of other enterprises. A move to a unified tax may or
may not improve things.
4. Model Calibration and Results
We have calibrated the two model variants set out above to a benchmark data set for China
for 2004 which separately identifies SOEs, FIEs and OPEs in manufacturing. We assume
CES functions for the 3 non-SOE subsectors, AGRI, FIE and OPE . For the SOE sector in
the worker controlled case we have the decreasing returns function (2), and in the
managerial control variation case we use a CD function, implies a similar treatment to that
of worker control model. We use the resulting model parameterizations in counterfactual
equilibrium analyses of moves both to a unified tax scheme across all enterprises and also of
an optimal tax structure with a separate tax rate on SOEs.
14

The elements of the benchmark equilibrium data set we have constructed are set out in
Table 2. This data set is in value form, and we use the units convention set out in both
Harberger (1962) and Shoven and Whalley (1972, 1974,1992) of defining units for output
and factors, as the amount selling for 1 billion RMB in the base case for the output of the
agriculture, FIE and the other private enterprise sectors. The parameter for leisure in each
household is assumed to be 0.2 as we have no direct observation on leisure consumption.
We later change this value in sensitivity analysis.
For the SOE sector, a different calibration treatment is needed. In the worker control case,
we assume a value of the SOE wage Wsoe equal to 0.75 as this is unrelated to the market
clearing wage in the rest of the economy. We also again assume a share parameter on leisure
in preferences of 0.2. Setting a value using the share of labor input to total value-added for
α then implies a value for A. In the managerial control case, the use of labor inputs do not
correspond to first order conditions for profit maximization and these are replaced in
calibration by the average product condition. The share parameter on labor in the CD
production function for the SOE sector in this model variant is set using the share of labor
input to total value-added and A is calculated using the production function. For non-SOE
sectors, we use a conventional calibration in generating parameters for the CES functions.
Demand side parameters are also generated by conventional calibration, with the exception
of leisure parameters as noted above. We draw on the GTAP data base (see Betina (2005))
for elasticity parameter estimates. The resulting model parameterizations are reported in
Table 3.
15

Table 2 2004 Benchmark equilibrium data set for China incorporating SOEs Value
added11
(billion RMB)
Value of labor
input12
(billion RMB)
Value of
capital input13
(billion RMB)
Surplus return to the state
Worker control Manager control
(Billion RMB)
Tax rate on capital
(%)
AGRI 2076.8 1336.5 740.3 24%
FIEs 1524.1 189.0 1335.1 14%
OPEs 1635.2 920.7 714.5 24%
SOEs 2321.3 1210.6 1110.7 1110.7 1110.7 24%
Source: Chinese Statistics Yearbook 2005
Table 3 Model parameterizations generated by calibration to the 2004 benchmark dataset
Worker control Managerial control
production A14 α σ A α σ
Agriculture 1.739 0.922 0.2415 1.739 0.922 0.24
FIE 1.525 0.175 1.26 1.525 0.175 1.26
OPE 1.987 0.550 1.26 1.987 0.550 1.26
SOE 57.476 0.521 57.476 0.521
Worker control Managerial control
Preferences SOEs Non-SOEs SOEs Non-SOEs
Agriculture 0.166 0.166 0.166 0.166
FIE 0.213 0.213 0.213 0.213
OPE 0.179 0.179 0.179 0.179
SOE 0.242 0.242 0.242 0.242
Leisure 0.200 0.200 0.200 0.200
11 Data in this column are from NBS “Chinese Statistics Yearbook 2005”. 12 Wage and employment data are from NBS “Chinese Statistics Yearbook 2005”.The value of labor input is calculated by the authors using wage times employment. 13 This is calculated by residual and is gross of tax. 14 The CES production function used in the Agri, FIE and OPE sectors is [ ] )1/(/)1(/)1( *)1(**
−−− −+=σσσσσσ αα KLAY
15 These elasticity parameters are taken from GTAP database for China. See Betina etc. (2006).
16

5. Some results
We have used the resulting model parameterizations in two different types of counterfactual
equilibrium analyses. In one we assess the impacts of moving to a unified enterprise tax
scheme. In the other we iteratively vary the SOE tax rate to compute an optimal tax scheme
with a separate tax rate on SOEs and equal yield but common tax rates on all other
enterprises. Results are set out in Tables 4 and 5, and in Figures 1 and 2.
In both cases in Table 4 moving to a unified enterprise producers a welfare loss of 0.256%
of GDP in the worker control model and 0.192% of GDP in the managerial control case.
These indicate that the current uneven tax structure is welfare preferred to a unified tax
structure in a model where SOE behavior is differently modeled from that of competitive
firms elsewhere in the economy. The equal yield tax rates also differ in the two cases
because of the differences in SOE output response. An equal yield tax rate of 19.0% applies
for the worker control model, but 18.7% for the managerial control model. These tax rates
also differ sharply from the 25% rate proposed in the recent draft law. This difference in
equal yield tax rate reflects the different output response for SOE in the two model variants.
In the case of the worker control model, a lowered tax rate applies to the surplus paid to the
state which relaxes the budget constraint on SOEs. This increases shirking which in turn
reduces output. In the case of the managerial control model, the smaller tax on the surplus
paid to the state implies that the average product of labor can now fall which in turn implies
an increase in output.
These output changes have corresponding changes in factor use by sector, which are also
reported in Table 4. The FIE use of capital falls in both models, reflecting the higher tax rate
on capital in this sector under a unified tax. Labor input in this sector falls too, but less than
in the case of capital. The output fall in FIEs is intermediate to the two, being a weighted
average of the change in the use of the two inputs.
17

In the agriculture and other private enterprise sectors capital use expands in both cases
reflecting the lowered tax rate on capital in these two sectors. However, different results
between models apply for labor use. In the worker control case labor use expands in the two
non-FIE sectors since it is in fixed supply for the three non SOE sectors, and FIE labor use
falls. In the managerial control case it contracts given the significant increase in labor use in
the SOE sector.
Table 4 Model results from moving to a unified enterprise tax in China
Worker control Managerial Control
Equal yield unified tax rate (%) 19.000 18.7
Aggregate welfare
(EV as % of GDP)
-0.256 -0.192
Impact on output (% change)
Agriculture 0.940 0.042
FIE -2.372 -2.467
OPE 1.947 1.401
SOE -2.061 1.115
Impact on capital (% change)
Agriculture 4.568 5.053
FIE -2.639 -2.633
OPE 3.117 3.027
SOE 0.000 0.000
Impact on labor (% change)
Agriculture 0.565 -0.471
FIE -1.925 -2.198
OPE 0.744 -0.241
SOE 0.000 2.152
λ (degree of effort) -3.918
18

Note: all data are reported as % changes compared to the benchmark data except for the
equal yield unified tax rate.
In Table 5 we parametrically vary both the setting of leisure share parameters in the utility
functions both for SOE workers and for non SOE workers, and the size of SOE surplus in
the benchmark data. When we vary leisure parameters between 0.05 and 0.5, in each case
we recompute the welfare gain for the worker control and managerial control cases. Results
show that varying shares of leisure in utility functions does not change the sign of welfare
measures in a unified scheme. This finding supports the results reported in the Table 4 and
show that the sign of the model’s results regarding a move to a unified tax are robust with
respect to these parametric changes. In the worker control case, the size of the welfare loss
under a unified tax scheme is a “reverse U shape” in the change in the leisure parameters. In
the managerial model case, the welfare loss under a unified tax scheme falls continuously as
the share increases.
We have also modified the size of the SOE surplus relative to base case data in sensitivity
analysis by both reducing and increasing its size. The results here for the two models
indicate again that varying the surplus does not change the sign of the welfare effect under a
unified scheme. The welfare loss under a unified tax scheme has a maximum value at 0.75
times benchmark surplus in the worker control model and modifying the surplus shows a
“reverse-U” impact on welfare. The relationship between the two variables has a “U-shape”
in Managerial Control variant, with a minimum welfare gain when surplus is 1.25 times
benchmark. This implies that the surplus can offset the distortion in average product pricing
of labor in this model as we have discussed above.
In Figures 1 and 2 we set out results of computations designed to show how the welfare
impacts of tax changes vary if the value of the SOE tax rate is set separately from that for all
other sectors. In these computations, uniform tax rates apply only to the three non-SOE
sectors, and a separate tax rate is used for the SOE sector. Figure 1 implies that any SOE tax
rate set above 0.23 implies a welfare gain, with a maximum welfare gain at a tax rate of 0.40.
19

This maximum occurs since a higher SOE tax rate in the worker control model will
disciplines shirking and increase output, but the progressively smaller value implied for
leisure when entered into preferences lowers utility. The common unified tax rate of 19% as
in table 4 implies a welfare loss as shown in the diagram. Similarly, results in Figure 2
shows that any SOE tax rate set above 0.227 implies a welfare gain, with a maximum
welfare gain at a tax rate of 1.107 on the SOE surplus. This sharply higher rate implies
negative capital taxes on the three non SOE sectors, which is extreme.
20

Table 5 Impacts of varying leisure shares and the size of surplus of SOEs in benchmark
data on the welfare impact of unified tax schemes
Hicksian Equivalent Variation as % of base case income
Move to unified tax scheme
Leisure Share Worker Control Managerial Control
0.05 -0.524 -0.061
0.10 -0.414 -0.104 0.15 -0.322 -0.148 0.20 -0.256 -0.192 0.25 -0.216 -0.235 0.30 -0.209 -0.279 0.40 -0.296 -0.366 0.50 -0.508 -0.453
Modifed size of the SOE surplus relative to base
case data
0.25 -0.326 -0.012
0.50 -0.258 -0.072 0.75 -0.234 -0.155 1.00 -0.256 -0.192 1.25 -0.289 -0.213 1.50 -0.335 -0.155 1.75 -0.390 -0.089 2.00 -0.436 -0.031
21

Figure 1
welfare gain or loss in worker controlmodel as a function of SOE tax rate
-2.00
-1.50
-1.00
-0.50
0.00
0.50
1.00
0.04
0.07
0.10
0.13
0.16
0.19
0.22
0.25
0.28
0.31
0.34
0.37
0.40
0.43
0.46
0.49
SOE tax rate
welfare gain or loss as %of base case income
Figure 2
welfare gain or loss in managerial controlmodel as a function of SOE tax rate
-1.00
-0.50
0.00
0.50
1.00
1.50
2.00
0.047
0.137
0.237
0.337
0.437
0.537
0.637
0.737
0.837
0.937
1.037
1.137
1.237
1.337
1.437
SOE tax rate
welfare gain or lossas % of base case income
22
6. Concluding Remarks
In this paper we consider the potential impacts of a move to a unified enterprise tax in China
in a model in which the behavior of state owned enterprises (SOEs) is differently modeled
for that of other enterprises in both manufacturing and non-manufacturing. The unified tax
has been debated for some years as a way of removing large tax preferences to Foreign
Invested Enterprises (FIEs), and currently draft implementing legislation is under review.
The point of out paper is to argue that while moving to unified treatment across all
enterprises in a simple competitive world seems to be sound policy, once different
enterprise behavior by subsector enters things are less clear. We use two different submodel
variants of SOE behavior embodied in a general equilibrium model of China; one we term
worker control and the other managerial control. In the former, workers satisfy in meeting
an enterprise budget constraint and otherwise shirk. In the latter, managers seek to maximize
the size of the enterprise rather than profits to gain maximal personal networking benefits.
In both model variants capital is assumed allocated by rationed credit, with any losses on
loans recapitalized by the central banks to state banks.
In both of these model forms, a move to a unified tax which removes tax preferences to
foreign invested enterprises (FIEs) and raises FIE tax rates while lowering others is a
welfare losing change. This is because a lowered tax rate on SOEs departs further from what
in the model is an optimal tax rate on SOEs given their assumed behavior. There is also a
difference in the value of the equal yield tax rate between the models due to different SOE
output responses in two model variant.
In reality a move to a unified tax would involve other behavioral response, which would
further modify impacts. One is the impact of higher FIE tax rates on inward FDI. Another is
the impact of these tax rate changes on capital accumulation and investment. But our theme,
that different and separate modeling of SOE behavior can modify the policy prescription for
tax reform in China is striking and likely robust to more complicated formulations.
23

References Betina V. Dimaranan, Robert A. McDougall, and Thomas W. Hertel (2006), “GTAP
Version6 Documentation: Chapter 20 ‘Behavioral Parameters’ ” accessed at https://www.gtap.agecon.purdue.edu/resources/download/2906.pdf
Brean, Donald J.S. (1998), Taxation in Modern China, Routledge, New York. Harberger, Arnold. (1962). “The Incidence of the Corporation Income Tax.” Journal of
Political Economy, vol. 70 (June): pp. 215-240. Lockwood, Ben and E. Ahmad, R.Singh (2005), “Financial Consequences of The Chinese
VAT reform,” International VAT Monitor, 16, 181-187,2005. National Bureau of Statistics, PRC, “Chinese Statistics Yearbook” series, Chinese Statistics
Publishing House Shoven, J.B., and J. Whalley (1972), “A General Equilibrium Calculation of the Effects of
Differential Taxation of Income from Capital in the U.S”, Journal of Public Economics, 1, November, 281-321.
Shoven, J.B., and J. Whalley (1984), “Applied General Equilibrium Models of Taxation and
International Trade: An Introduction and Survey”, Journal of Economic Literature, 22, 10007-51.
Whalley, John and S. Zhang (2006), “State-Owned Enterprise Behaviour Responses to
Trade Reforms: Some Analytics and Numerical Simulation Results Using Chinese Data” NBER working paper No. 12780
King M.A and D. Fullerton (ed,1984), “The Taxation of Income From Capital: A
Comparative Study of the United States, the United Kingdom, Sweden, and West Germany”, University of Chicago press for NBER.
24