The Transportation of Petroleum and Derived Products in the
135
The Transportation of Petroleum The Transportation of Petroleum and Derived Products in the and Derived Products in the American Market American Market Transpetro Transpetro Company Company 16 de 16 de Agosto Agosto . 2007 . 2007 Thomas L. Freese Thomas L. Freese Freese & Associates, Inc. Freese & Associates, Inc.
Transcript of The Transportation of Petroleum and Derived Products in the
The Transportation of Petroleum The Transportation of Petroleum and Derived Products in the and Derived Products in the
American MarketAmerican Market
TranspetroTranspetro CompanyCompany16 de 16 de AgostoAgosto. 2007. 2007
Thomas L. FreeseThomas L. FreeseFreese & Associates, Inc.Freese & Associates, Inc.
InstructorInstructorHis experience spans the product line spectrum from hydraulic His experience spans the product line spectrum from hydraulic components and bulk chemicals, fresh poultry and frozen foods tocomponents and bulk chemicals, fresh poultry and frozen foods toconsumer goods. His projects encompass work with manufacturers, consumer goods. His projects encompass work with manufacturers, wholesalers, government, retailers and wholesalers, government, retailers and ee--tailerstailers and have been conducted and have been conducted throughout North America, Europe (both Western and Eastern) and throughout North America, Europe (both Western and Eastern) and Asia. Asia.
Tom serves on the editorial review board of the Tom serves on the editorial review board of the Journal of Business Journal of Business LogisticLogistic and the CSCMP Technology Review Committee, is the 1and the CSCMP Technology Review Committee, is the 1stst Vice Vice President of the NE Ohio President of the NE Ohio WERCouncilWERCouncil and a member of the WERC and a member of the WERC Knowledge Committee. A well recognized expert in supply chain Knowledge Committee. A well recognized expert in supply chain management and logistics he has written numerous articles and demanagement and logistics he has written numerous articles and delivered livered over 200 professional presentations in China, Dubai, Europe, Koover 200 professional presentations in China, Dubai, Europe, Korea, rea, Malaysia, Russia, Brazil, and the United States.Malaysia, Russia, Brazil, and the United States.
InstructorInstructor
Tom is an active member in the Association of Transportation LawTom is an active member in the Association of Transportation Law, , Logistics and Policy (Logistics and Policy (ATLLPATLLP), Council of Supply Chain Management ), Council of Supply Chain Management Professionals (Professionals (CSCMPCSCMP), International Customer Service Association ), International Customer Service Association ((ICSAICSA), and Warehousing Education and Research Council (), and Warehousing Education and Research Council (WERCWERC). ).
EducationEducationM.B.A., with a depth of field in Business Logistics, The OhioM.B.A., with a depth of field in Business Logistics, The Ohio State State
University University B.S.B.A., with a major in Marketing, The Ohio State UniversitB.S.B.A., with a major in Marketing, The Ohio State Universityy
InstructorInstructorMr. Thomas L. Freese in his roles at UNOCAL (Union Oil Company oMr. Thomas L. Freese in his roles at UNOCAL (Union Oil Company of f California) held numerous line and staff petroleum distribution California) held numerous line and staff petroleum distribution positions overseeing company operated light oil and lubricant mipositions overseeing company operated light oil and lubricant mixing xing terminals, bulk storage facilities, pipeline terminals, tank farterminals, bulk storage facilities, pipeline terminals, tank farms and ms and truck transportation fleets. His responsibilities included:truck transportation fleets. His responsibilities included:•• Managing the region's forecasting inventory control and product Managing the region's forecasting inventory control and product
supply operationsupply operation•• All transportation functions (private fleet, contract and commonAll transportation functions (private fleet, contract and common
carrier dry and bulk commodities, truck, rail, water and pipelincarrier dry and bulk commodities, truck, rail, water and pipeline e operations) for the regionoperations) for the region
His experience spans His experience spans pipeline, barge, ocean, rail and truck pipeline, barge, ocean, rail and truck transportation, terminal and lube blending operations. transportation, terminal and lube blending operations.

AgendaAgendaIntroductionIntroductionUS Petroleum NetworkUS Petroleum NetworkForecastingForecastingTransportationTransportationLiquefied Natural GasLiquefied Natural GasEthanol and Bio dieselEthanol and Bio dieselCompetition and IntegrationCompetition and IntegrationManagement IssuesManagement IssuesSummary & Conclusion Summary & Conclusion
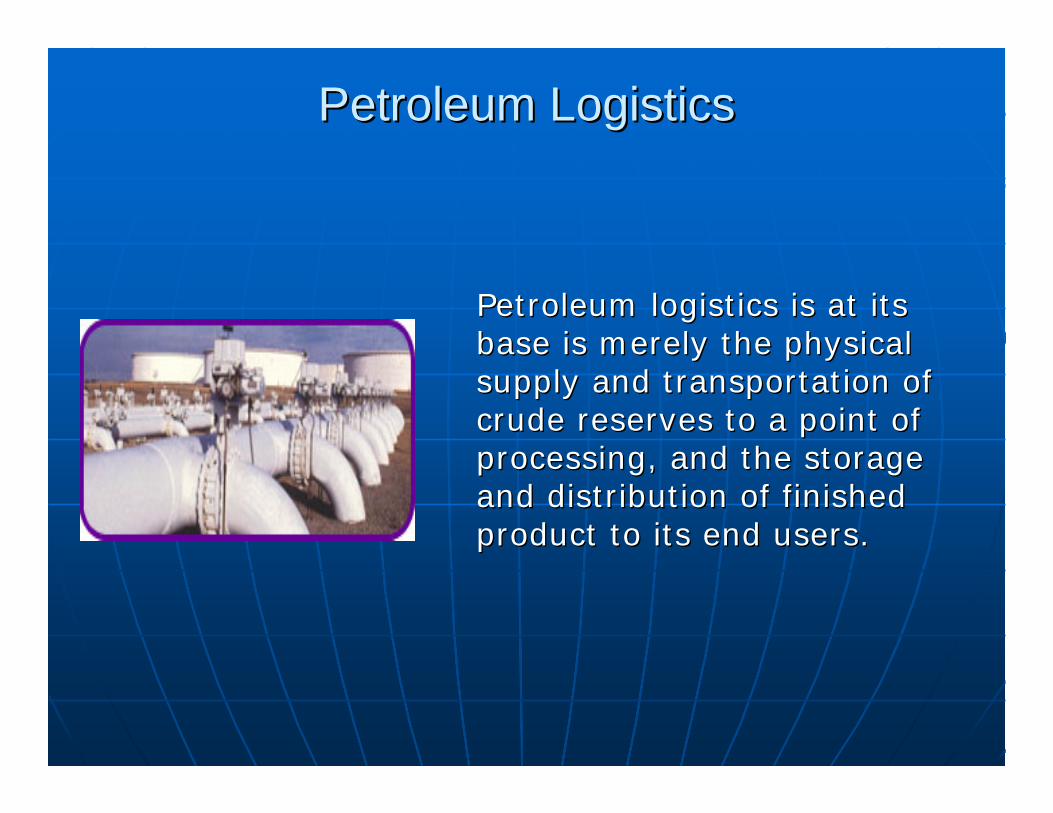
Petroleum LogisticsPetroleum Logistics
Petroleum logistics is at its Petroleum logistics is at its base is merely the physical base is merely the physical supply and transportation of supply and transportation of crude reserves to a point of crude reserves to a point of processing, and the storage processing, and the storage and distribution of finished and distribution of finished product to its end users.product to its end users.
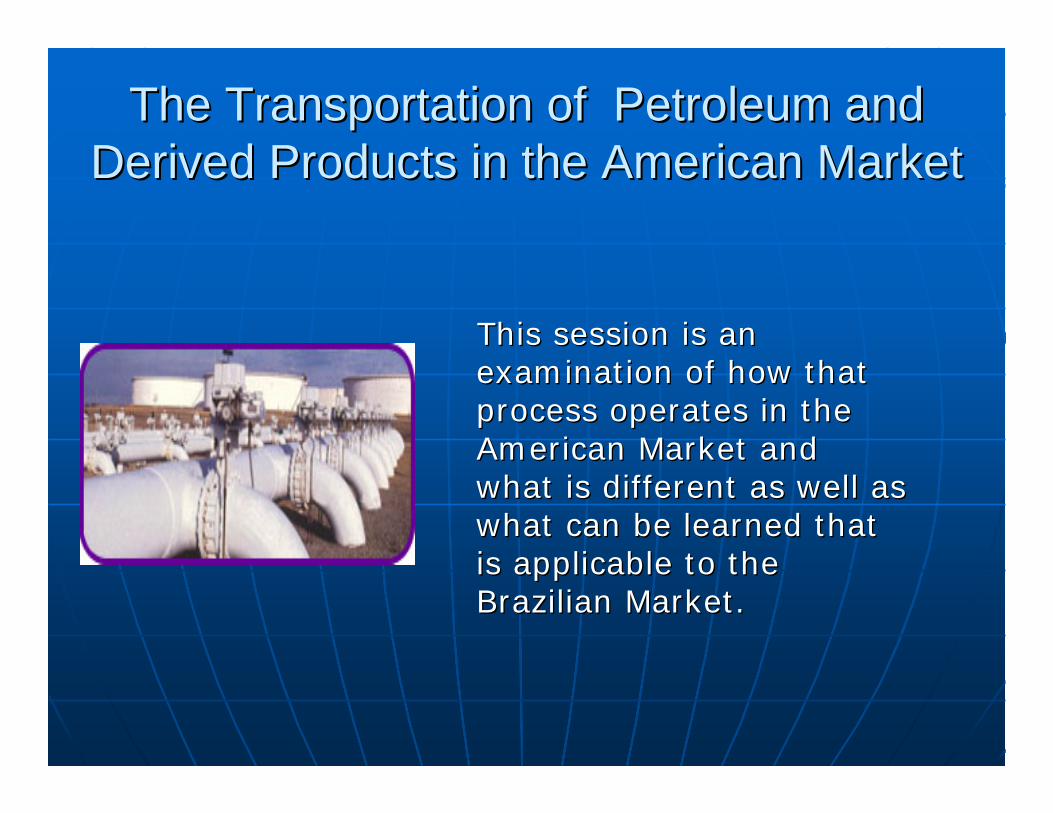
The Transportation of Petroleum and The Transportation of Petroleum and Derived Products in the American MarketDerived Products in the American Market
This session is an This session is an examination of how that examination of how that process operates in the process operates in the American Market and American Market and what is different as well as what is different as well as what can be learned that what can be learned that is applicable to the is applicable to the Brazilian Market.Brazilian Market.
Key topics that will be addressed:Key topics that will be addressed:
ForecastingForecastingTransportationTransportationIntegrationIntegrationManagement IssuesManagement IssuesCompetitionCompetitionEthanol & Bio dieselEthanol & Bio dieselLiquefied Natural GasLiquefied Natural Gas
This session will examine;This session will examine;
competitive influence on the US competitive influence on the US petroleum industry, petroleum industry, governmental influence on the US governmental influence on the US petroleum industry, petroleum industry, the various types of transportation, the various types of transportation, the impacts and influence of the impacts and influence of alternative fuels, alternative fuels, integration of various energy integration of various energy organizations, organizations, the future and how it will changethe future and how it will changetoday's infrastructure. today's infrastructure.
Specifics to be covered: Specifics to be covered: 1)1) What is the forecasting regarding the balance between supply andWhat is the forecasting regarding the balance between supply and
demand of petroleum products for next ten years?demand of petroleum products for next ten years?2)2) What is the transportation infrastructure for the movement of What is the transportation infrastructure for the movement of
petroleum and derived products?petroleum and derived products?3)3) What are the major modes of transportation for petroleum and What are the major modes of transportation for petroleum and
derived products as well as ethanol and bio diesel? What are thederived products as well as ethanol and bio diesel? What are themajor advantage and disadvantage of each mode? What are the costmajor advantage and disadvantage of each mode? What are the costs s of transportation for each mode?of transportation for each mode?
4)4) Who are the top companies that offer this service? Are the produWho are the top companies that offer this service? Are the producers cers also responsible for the transportation or there are specifics also responsible for the transportation or there are specifics companies focused in the movement of petroleum and derived companies focused in the movement of petroleum and derived product?product?
5)5) How is the integration among the pipeline mode of transportationHow is the integration among the pipeline mode of transportation and and the others modes. Particularly between pipeline and railroad; pithe others modes. Particularly between pipeline and railroad; pipeline peline and river boats; pipeline and maritime transportation.and river boats; pipeline and maritime transportation.
Specifics to be covered:Specifics to be covered:6)6) How structured are the commercial relationships among the severaHow structured are the commercial relationships among the several l
players involved in the process of transportation of petroleum aplayers involved in the process of transportation of petroleum and nd derived product? For instance, the relationship among producers,derived product? For instance, the relationship among producers,logistics providers and distributors logistics providers and distributors
7)7) What are the principle management issues faced by a transportatiWhat are the principle management issues faced by a transportation on company in the movement of petroleum and derived product?company in the movement of petroleum and derived product?
8)8) What is the competition among the companies in the market of What is the competition among the companies in the market of transportation of petroleum and derived products?transportation of petroleum and derived products?
9)9) What is the American government planning in terms of adding What is the American government planning in terms of adding ethanol and bio diesel to the portfolio of fuels available to thethanol and bio diesel to the portfolio of fuels available to the final e final consumer? What are the targets for the next ten years?consumer? What are the targets for the next ten years?
10)10) What are the plans for adding ethanol to gasoline and offering tWhat are the plans for adding ethanol to gasoline and offering the he blend to the final consumer? What is the size of this market, tablend to the final consumer? What is the size of this market, taking king into consideration the amount already being produced by the into consideration the amount already being produced by the domestic producers?domestic producers?
Specifics to be covered: Specifics to be covered:
11)11) How is Liquefied Natural Gas transported? How many companies How is Liquefied Natural Gas transported? How many companies are in this business? What are the requirements for the are in this business? What are the requirements for the transportation? What are the cost of transportation of this transportation? What are the cost of transportation of this product?product?
12) What is the bio fuel energy policy in America?12) What is the bio fuel energy policy in America?13) What are the incentives to the production and use of bio fue13) What are the incentives to the production and use of bio fuel, l,
specially bio diesel and bio ethanol storage? specially bio diesel and bio ethanol storage? 14) How is bio fuel transported and distributed of in America? 14) How is bio fuel transported and distributed of in America?

US Petroleum NetworkUS Petroleum Network
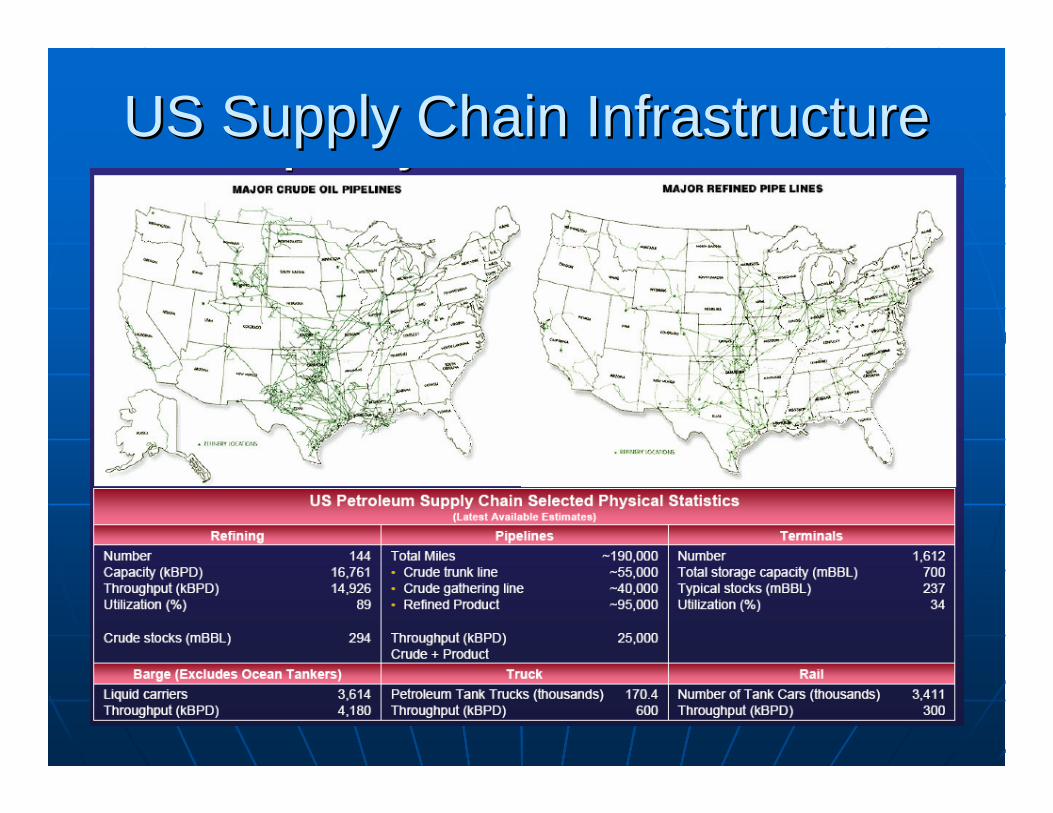
US Supply Chain InfrastructureUS Supply Chain Infrastructure
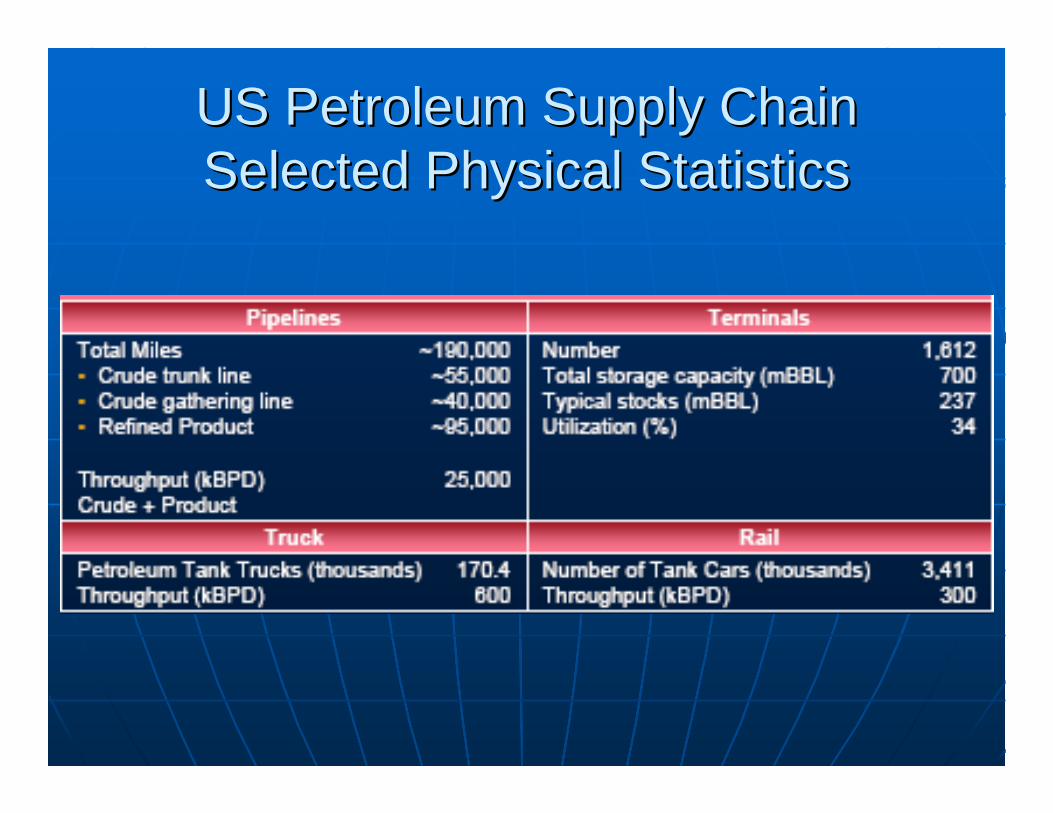
US Petroleum Supply Chain US Petroleum Supply Chain Selected Physical Statistics Selected Physical Statistics
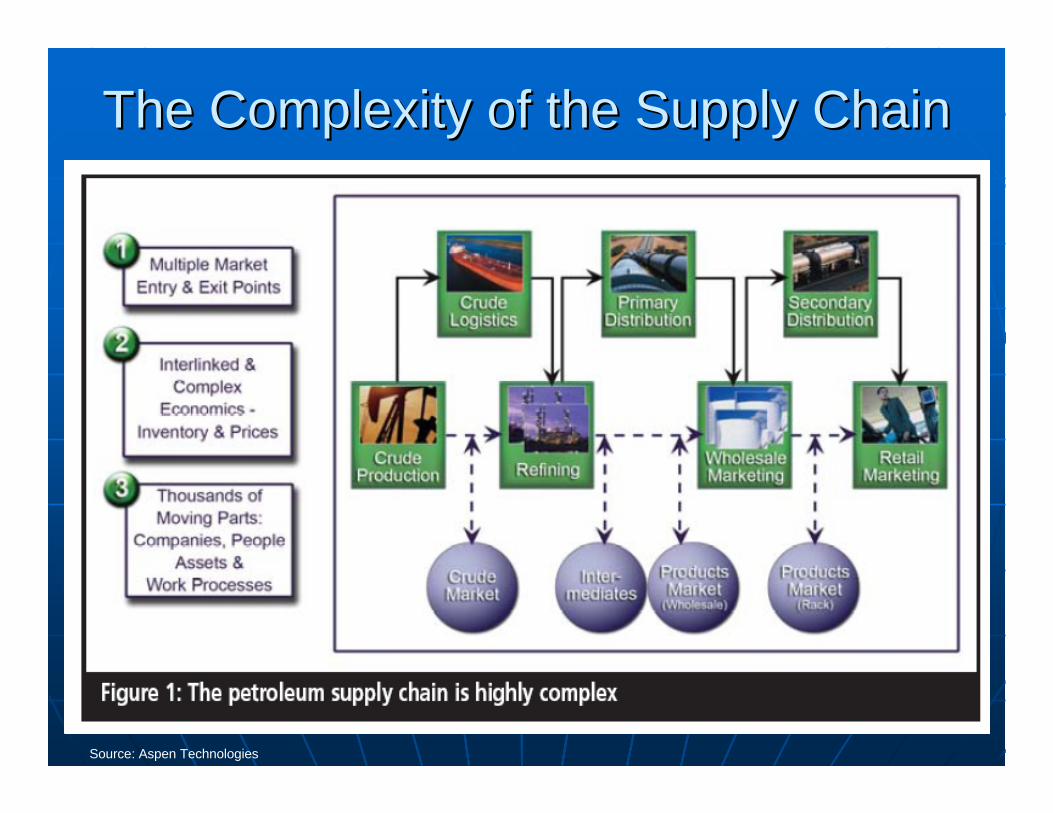
The Complexity of the Supply ChainThe Complexity of the Supply Chain
Source: Aspen Technologies
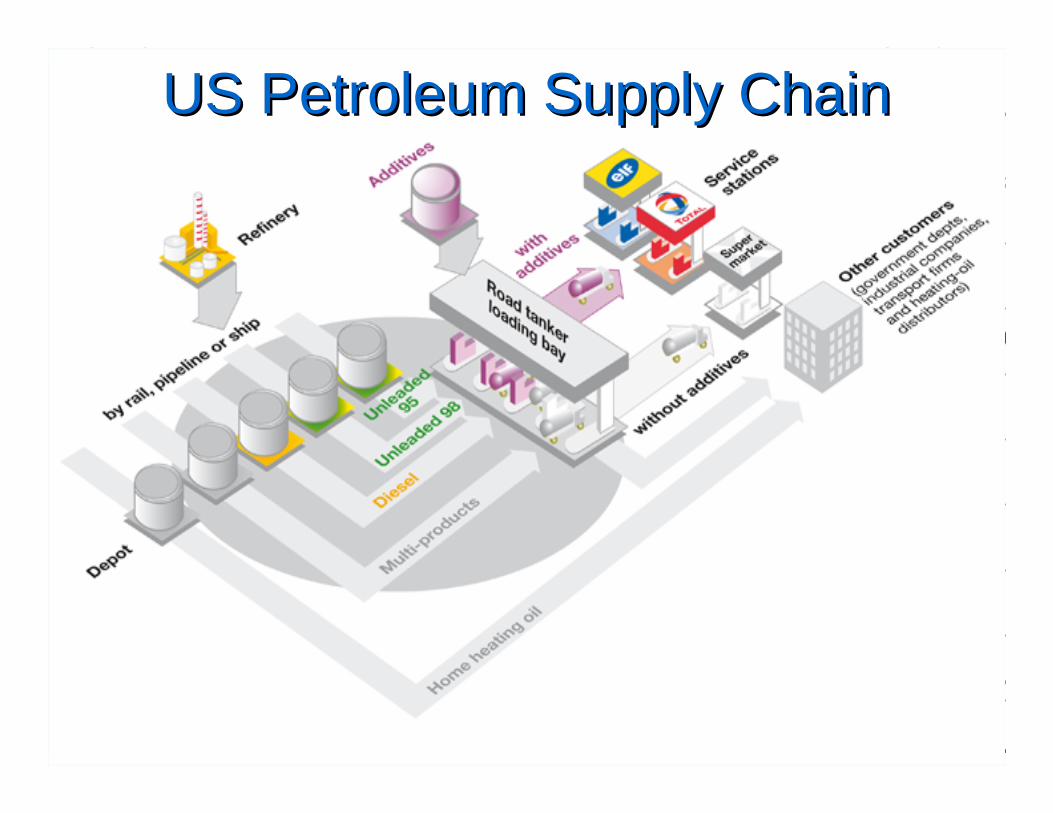
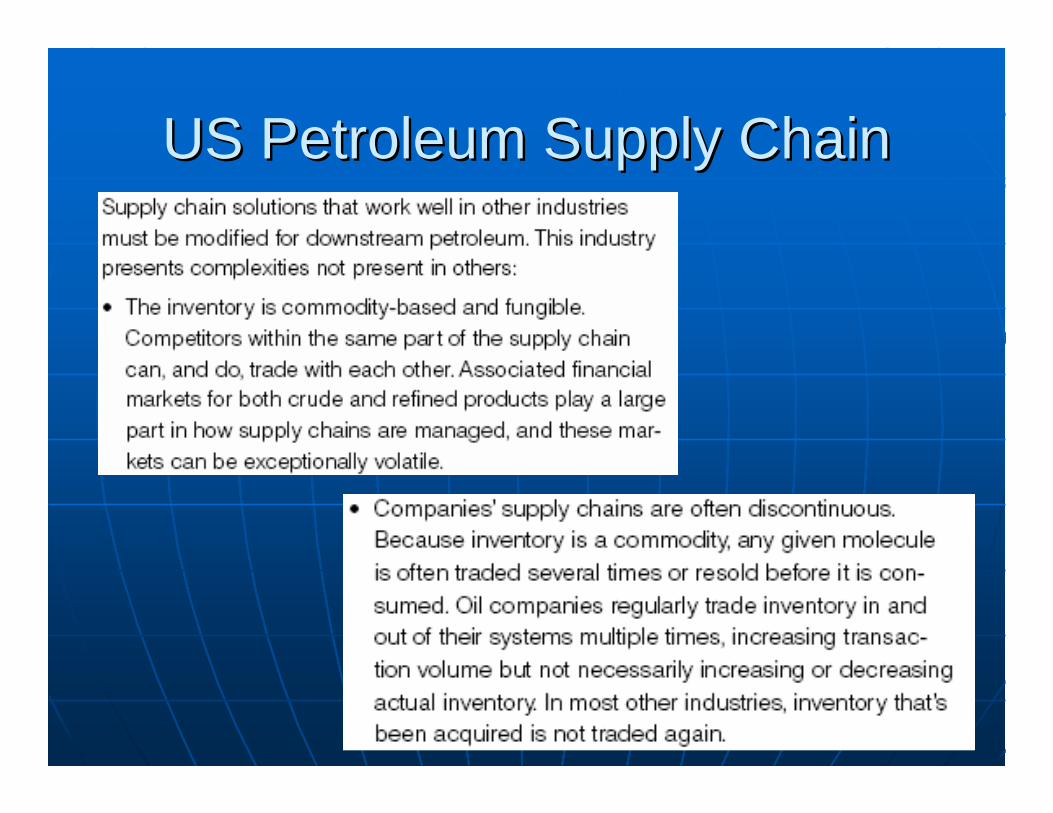
US Petroleum Supply ChainUS Petroleum Supply Chain
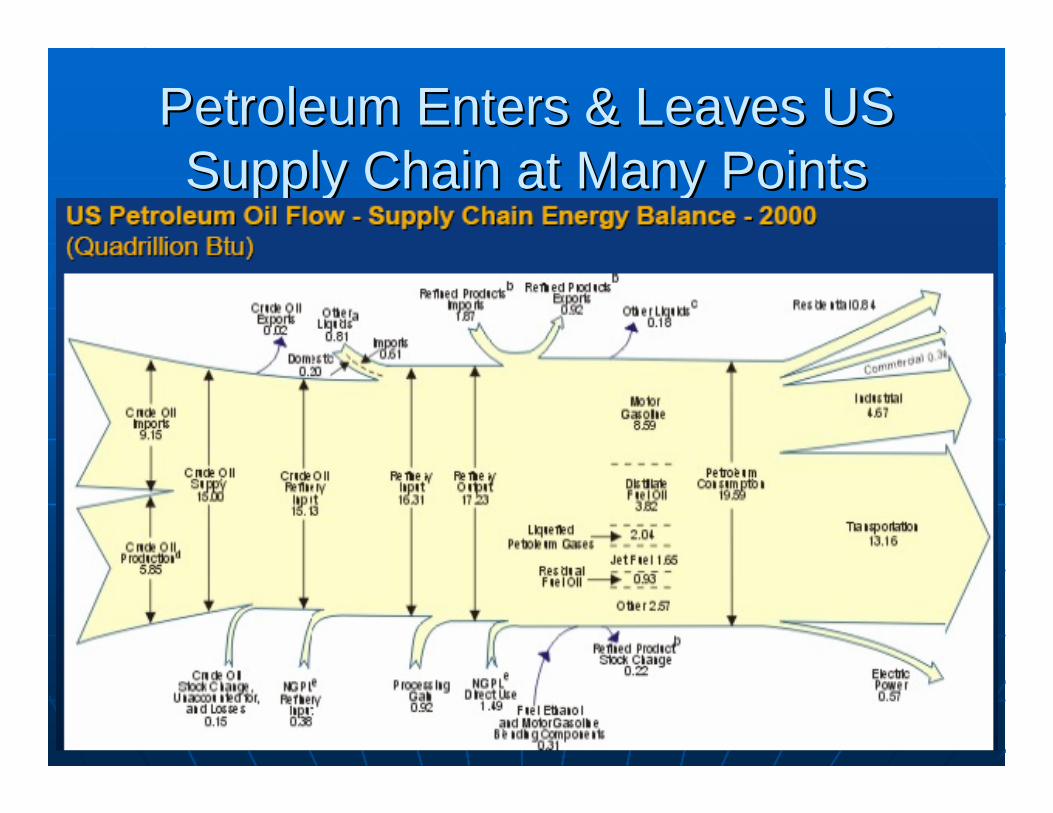
Petroleum Enters & Leaves US Petroleum Enters & Leaves US Supply Chain at Many PointsSupply Chain at Many Points
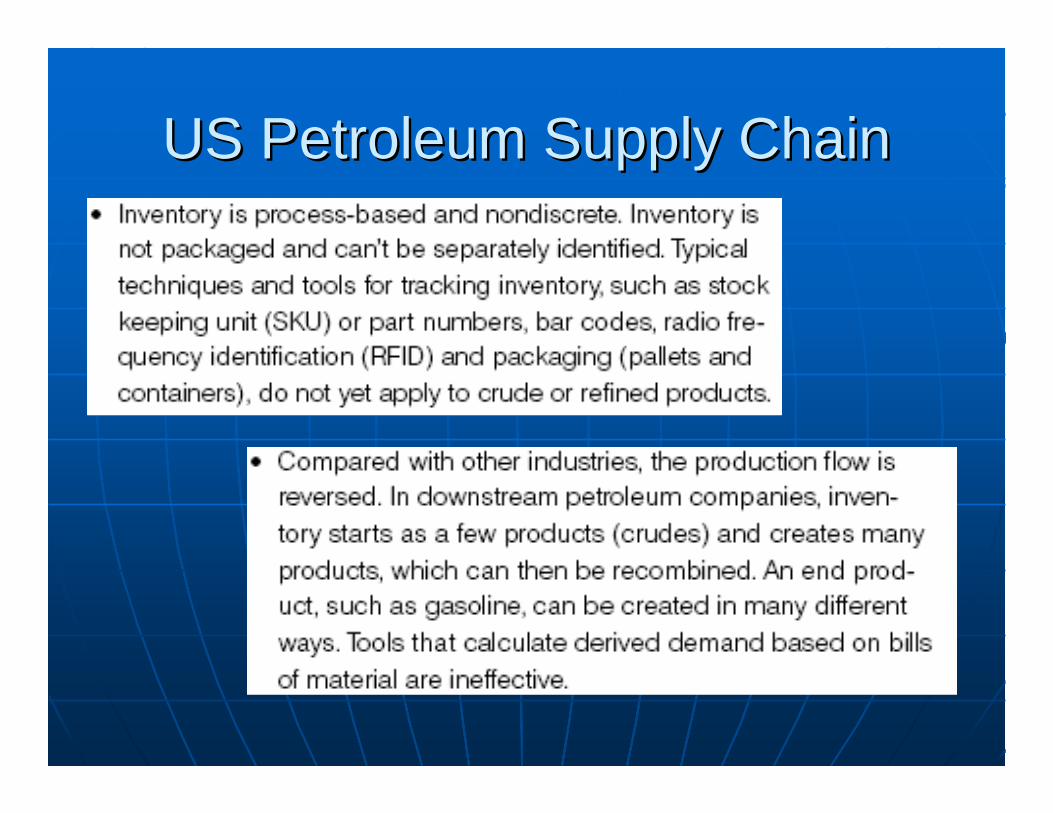
US Petroleum Supply ChainUS Petroleum Supply Chain
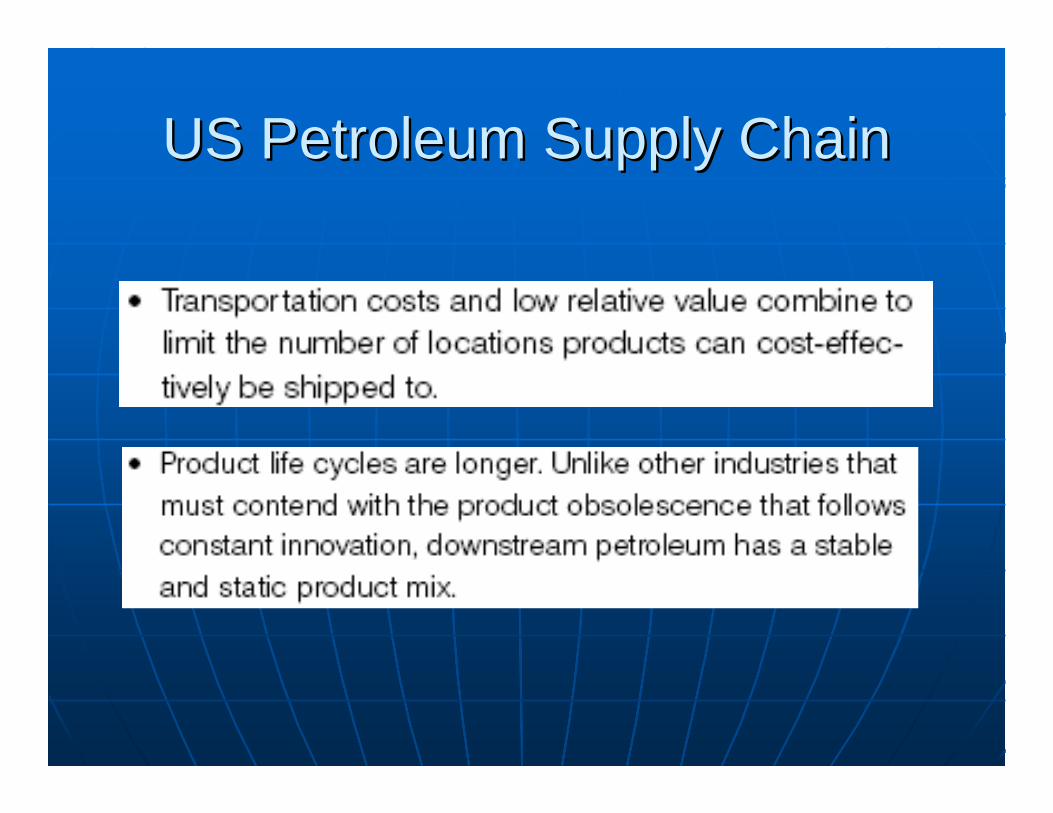
US Petroleum Supply ChainUS Petroleum Supply Chain
US Petroleum Supply ChainUS Petroleum Supply Chain
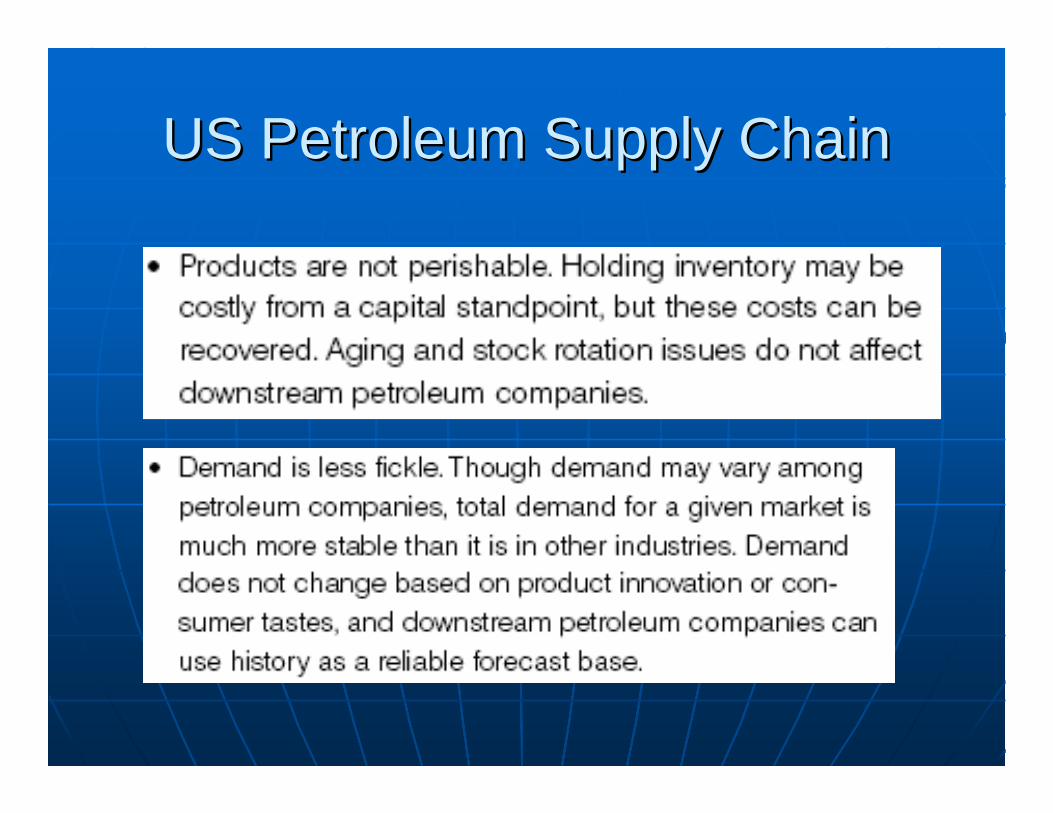
US Petroleum Supply ChainUS Petroleum Supply Chain
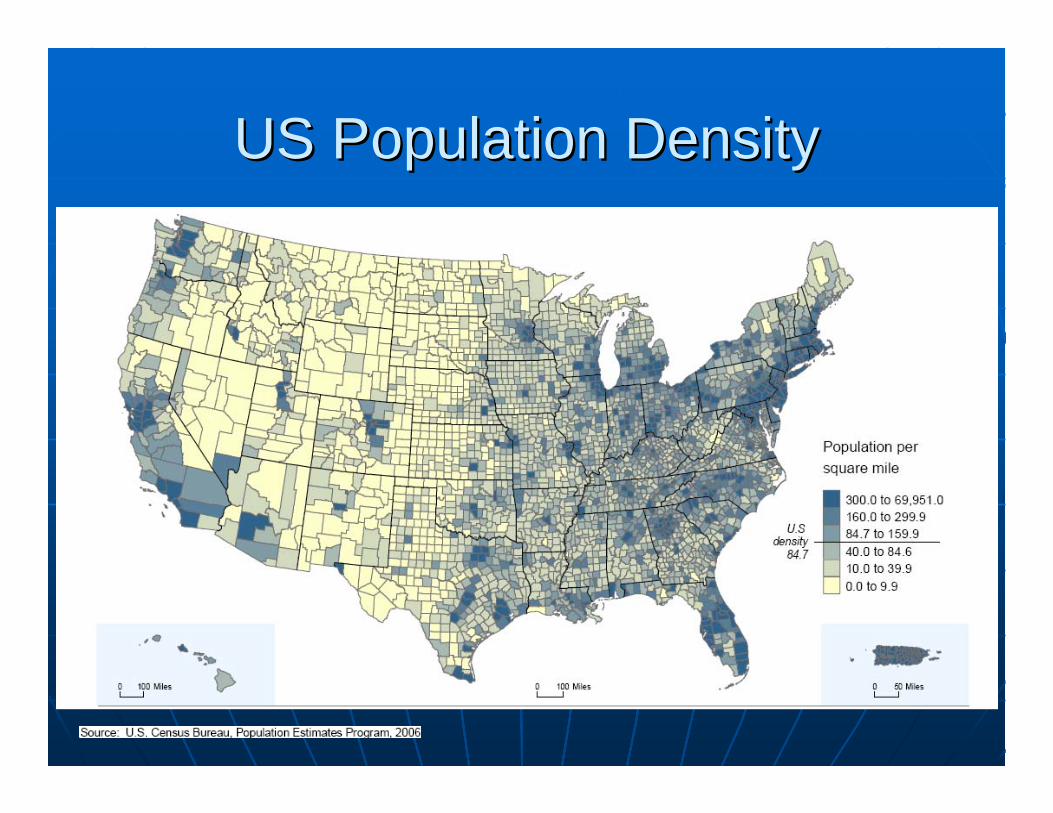
US Population DensityUS Population Density
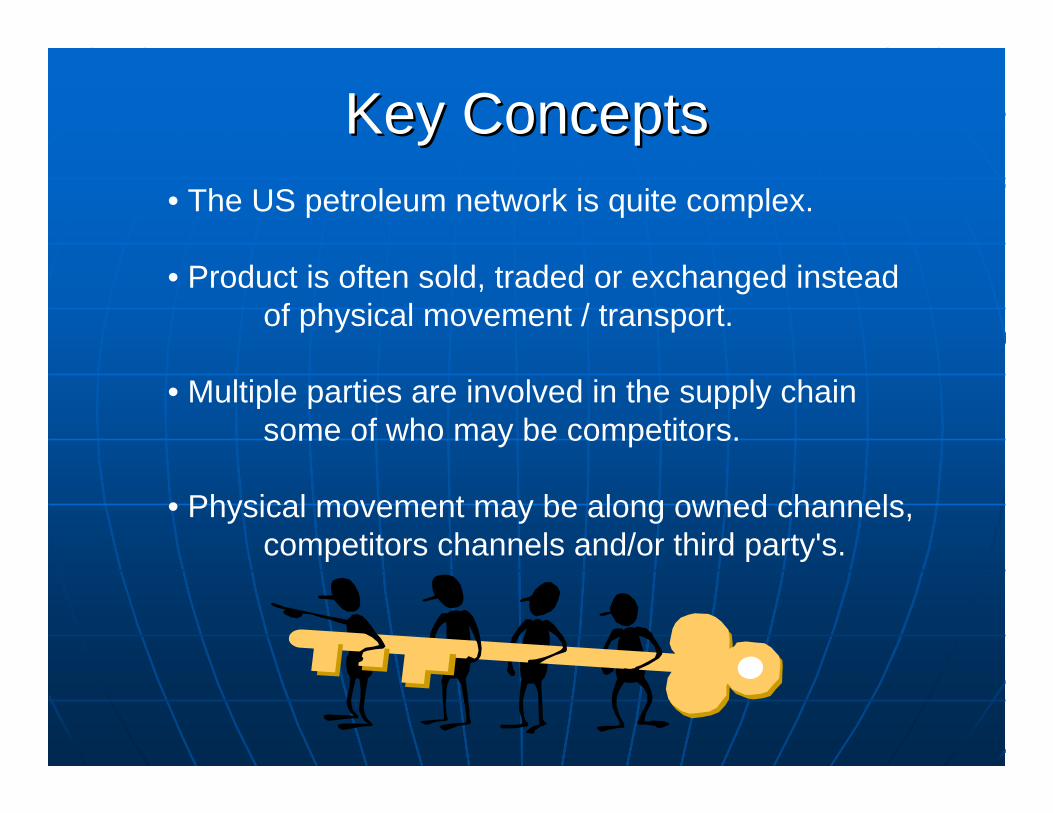
Key ConceptsKey Concepts• The US petroleum network is quite complex.
• Product is often sold, traded or exchanged instead of physical movement / transport.
• Multiple parties are involved in the supply chainsome of who may be competitors.
• Physical movement may be along owned channels,competitors channels and/or third party's.
US Petroleum NetworkUS Petroleum Network’’ssChallengesChallenges
Logistics Infrastructure Logistics Infrastructure ChallengesChallenges
The US logistics infrastructure supporting petroleum imports is already near capacity and permitting and funding these types of facilities, such as wharf’s terminals, pipelines, etc.) will take a minimum of several years.
Future import growth does not necessarily match up to where spare capacity exists in the system.
The future need to import more refined products and rude oil into the U.S. West Coast is causing the petroleum industry and the government to scramble to find supply-chain solutions that will alleviate the upcoming bottlenecks of the current infrastructure.
U.S. RefineriesU.S. RefineriesIn 1981 there were over 300 refineries in the U.S. In 1981 there were over 300 refineries in the U.S. while today there are less than 150.while today there are less than 150.Refineries have kept pace with demand during the Refineries have kept pace with demand during the last 20 years by expanding capacity and running at last 20 years by expanding capacity and running at higher utilization. In the future refineries cannot higher utilization. In the future refineries cannot look towards improved utilization as a means to look towards improved utilization as a means to satisfy increasing demand. satisfy increasing demand. In 2004 refineries operated at around 95% In 2004 refineries operated at around 95% utilization, which experts believe to be the utilization, which experts believe to be the maximummaximumA series of costly upgrades have been imposed on A series of costly upgrades have been imposed on the refining industry in order to produce cleaner the refining industry in order to produce cleaner burning fuels as mandated by the federal burning fuels as mandated by the federal government.government.
U.S. Refining CapacityU.S. Refining CapacityU.S. refining capacity, as measured by daily processing capacity of crude oil, has appeared relatively stable in recent years, at about 16 million barrels per day of operable capacity.While the level is a reduction from the capacity of twenty yearsago, the refineries that were shut down as demand fell in the early 1980's were those that were limited to simple distillation, small facilities were not economically viable.When Federal price control system subsidies ended in 1981, additional refineries were shut down. At the same time, refinersimproved the efficiency of the crude oil distillation units thatremained by improving the flow and matching capacity among units and turning more to computer control of the processing.
U.S. Refining UtilizationU.S. Refining UtilizationFollowing government mandates for environmentally more benign products as well as commercial economics, refiners enhanced their upgrading (downstream processing) capacity. As a result, the capacity of the downstream units ceased to be the constraining factor on the amount of crude oil processed (or "run") through the crude oil distillation system. Thus crude oil inputs to refineries ("runs") have continued to rise, and along with them -- given the stability of crude oil distillation capacity -- capacity "utilization" rose throughout much of the 1990's. Utilization -- the share of capacity filled with crude oil -- reached truly record levels in the last half of the decade, nominally exceeding 100 percent for brief periods.
As with most aspects of the U.S. oil industry, the Gulf Coast is by far the leader in refinery capacity, with more than twice the crude oil distillation capacity as any other United States region. (The difference is even greater for downstream processing capacity, because the Gulf Coast has the highest concentration of sophisticated facilities in the world.)
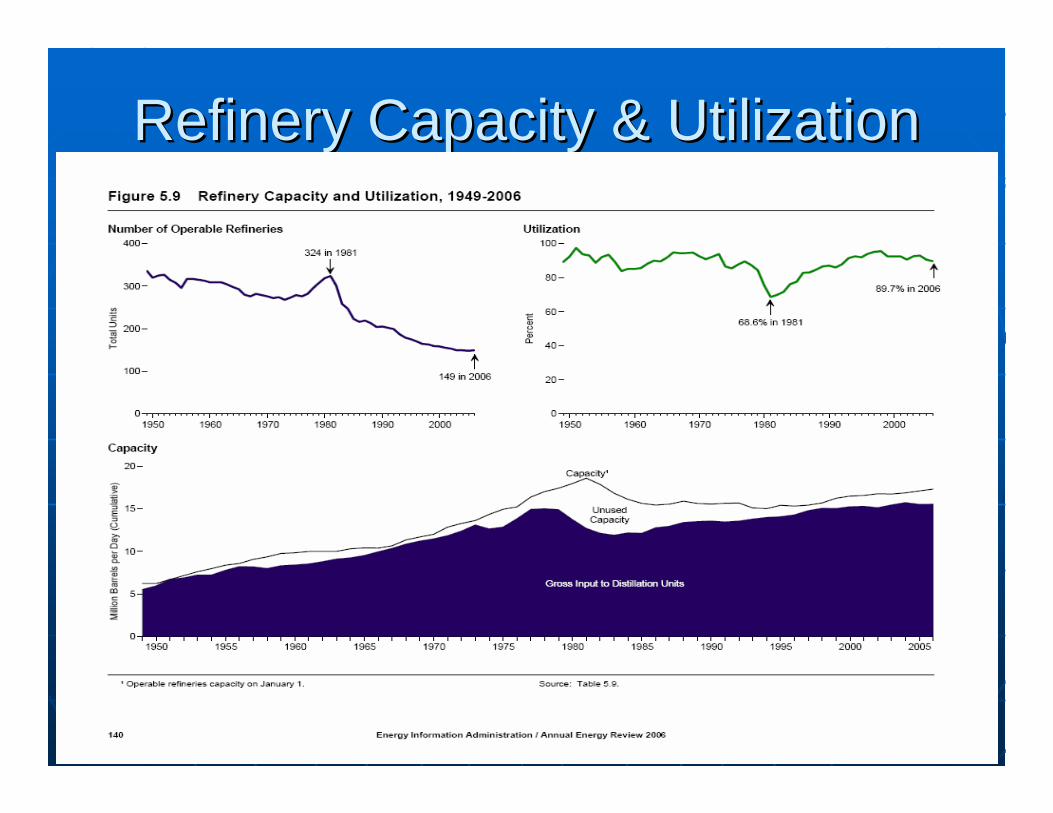
Refinery Capacity & UtilizationRefinery Capacity & Utilization
Domestic Petroleum IndustryDomestic Petroleum Industry
The domestic petroleum is having difficulty meeting The domestic petroleum is having difficulty meeting consumer demands for refined products like consumer demands for refined products like gasoline, diesel and jet fuel.gasoline, diesel and jet fuel.With the economic recovery that has taken place in With the economic recovery that has taken place in the U.S. since 2003, demand for energy and the U.S. since 2003, demand for energy and particularly petroleum products has resumed the particularly petroleum products has resumed the growth that had been temporarily stalled since growth that had been temporarily stalled since 9/11/2001.9/11/2001.
Domestic Petroleum IndustryDomestic Petroleum IndustryAugust year over year demand growth of August year over year demand growth of approximately 2% for gasoline, 10% for diesel approximately 2% for gasoline, 10% for diesel and 14% for jet fuel is exceeding the historical and 14% for jet fuel is exceeding the historical growth rates for these products.growth rates for these products.The West Coast anticipates that for the next 5 The West Coast anticipates that for the next 5 years gasoline demand will continue to grow at years gasoline demand will continue to grow at 2.2% per year while diesel fuel will grow at 2.6% 2.2% per year while diesel fuel will grow at 2.6% and jet fuel will grow at 1.7% per year. This and jet fuel will grow at 1.7% per year. This continued growth will add stress to a refining continued growth will add stress to a refining system that is already running at maximum system that is already running at maximum output.output.
Domestic vs. Foreign RefiningDomestic vs. Foreign Refining
While cleaner burning fuels are being supported, While cleaner burning fuels are being supported, the upgrades required to produce them are the upgrades required to produce them are consuming resources that a refining company may consuming resources that a refining company may have used to expand capacity.have used to expand capacity.There will not be enough refinery expansion to There will not be enough refinery expansion to address growth in demand and focus resources on address growth in demand and focus resources on upgrading plants to produce cleaner burning fuels.upgrading plants to produce cleaner burning fuels.Refiners on the U.S. West Coast market will have Refiners on the U.S. West Coast market will have to rely more on foreign imports of refined products to rely more on foreign imports of refined products like gasoline, diesel and jet fuel in order to meet like gasoline, diesel and jet fuel in order to meet future demand for these products.future demand for these products.
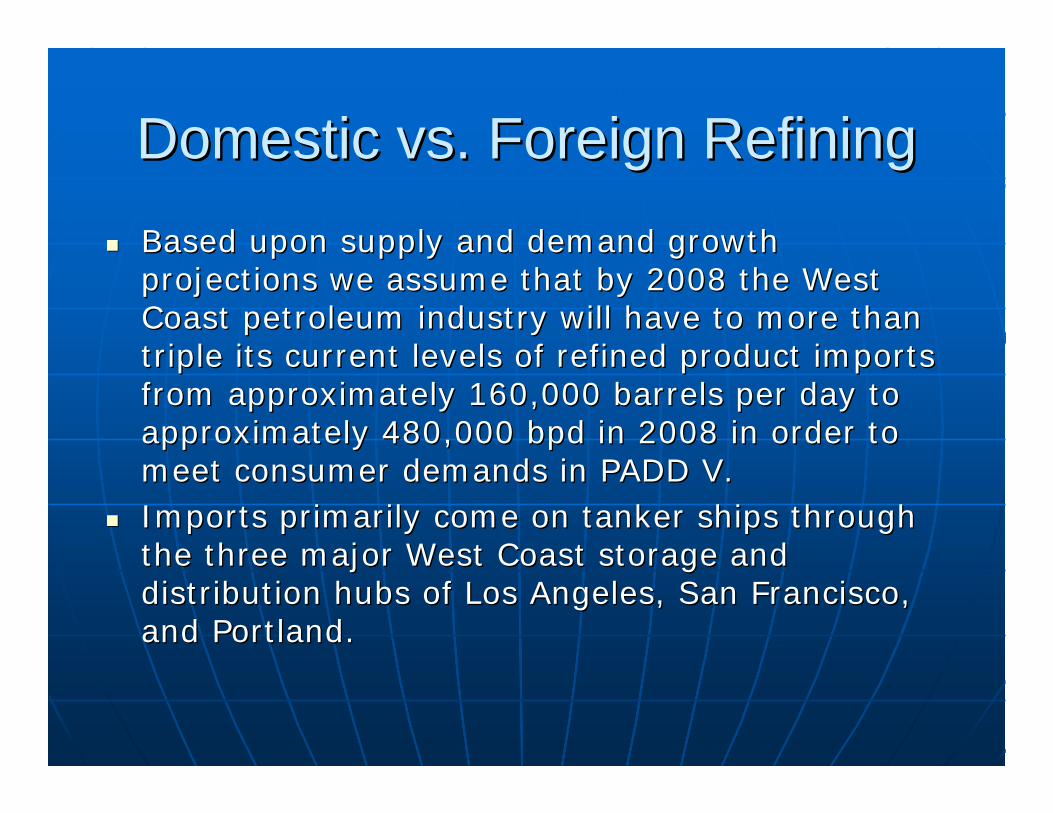
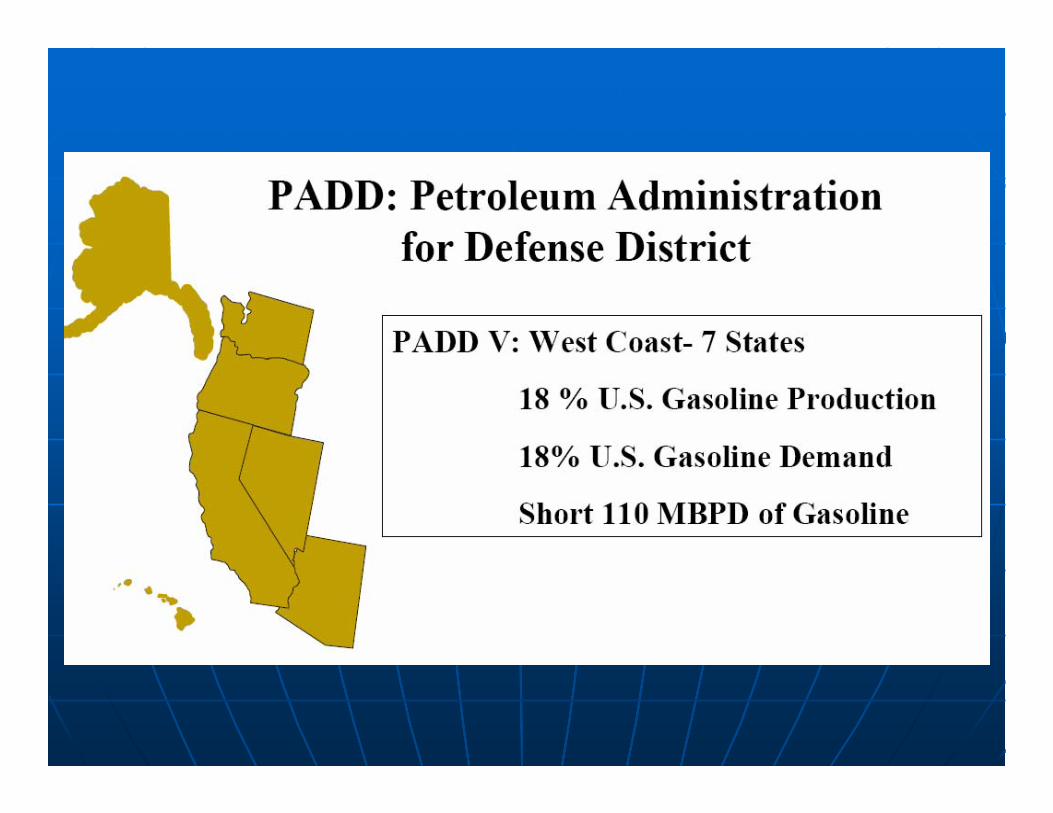
Domestic vs. Foreign RefiningDomestic vs. Foreign RefiningBased upon supply and demand growth Based upon supply and demand growth projections we assume that by 2008 the West projections we assume that by 2008 the West Coast petroleum industry will have to more than Coast petroleum industry will have to more than triple its current levels of refined product imports triple its current levels of refined product imports from approximately 160,000 barrels per day to from approximately 160,000 barrels per day to approximately 480,000 bpd in 2008 in order to approximately 480,000 bpd in 2008 in order to meet consumer demands in PADD V.meet consumer demands in PADD V.Imports primarily come on tanker ships through Imports primarily come on tanker ships through the three major West Coast storage and the three major West Coast storage and distribution hubs of Los Angeles, San Francisco, distribution hubs of Los Angeles, San Francisco, and Portland.and Portland.
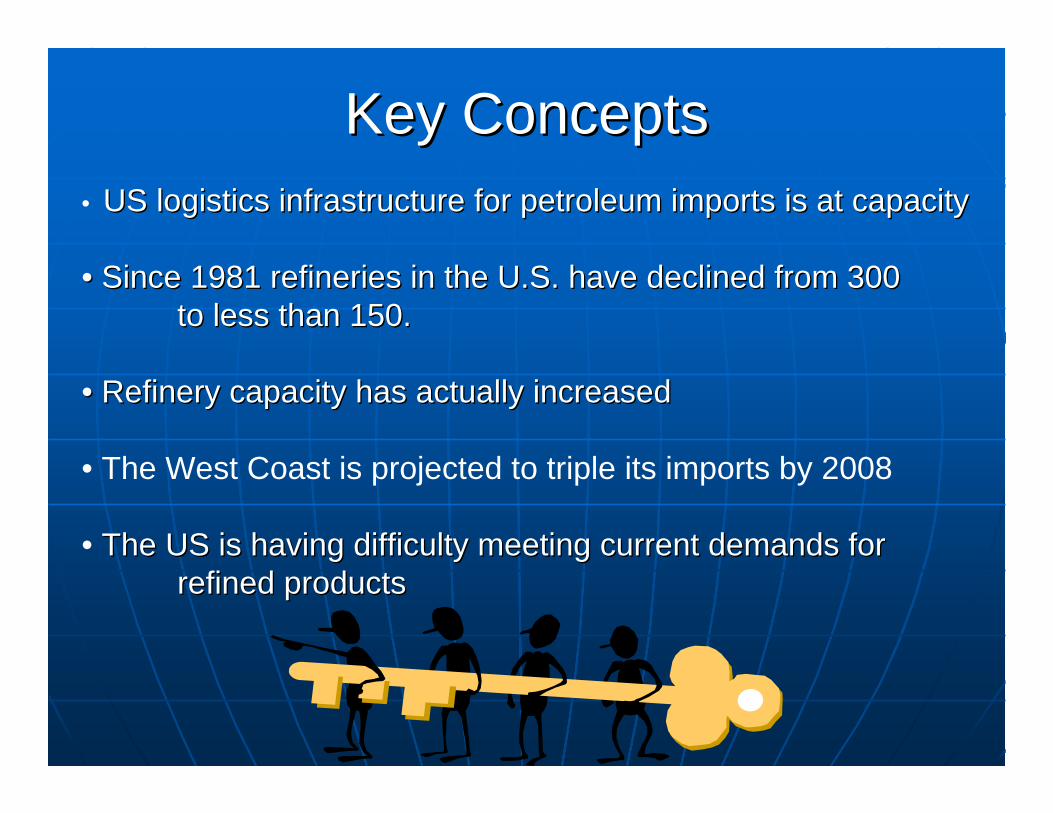
Key ConceptsKey Concepts• US logistics infrastructure for petroleum imports is at capacityUS logistics infrastructure for petroleum imports is at capacity
•• Since 1981 refineries in the U.S. have declined from 300Since 1981 refineries in the U.S. have declined from 300to less than 150.to less than 150.
•• Refinery capacity has actually increasedRefinery capacity has actually increased
• The West Coast is projected to triple its imports by 2008
• The US is having difficulty meeting current demands for The US is having difficulty meeting current demands for refined productsrefined products

ForecastingForecasting
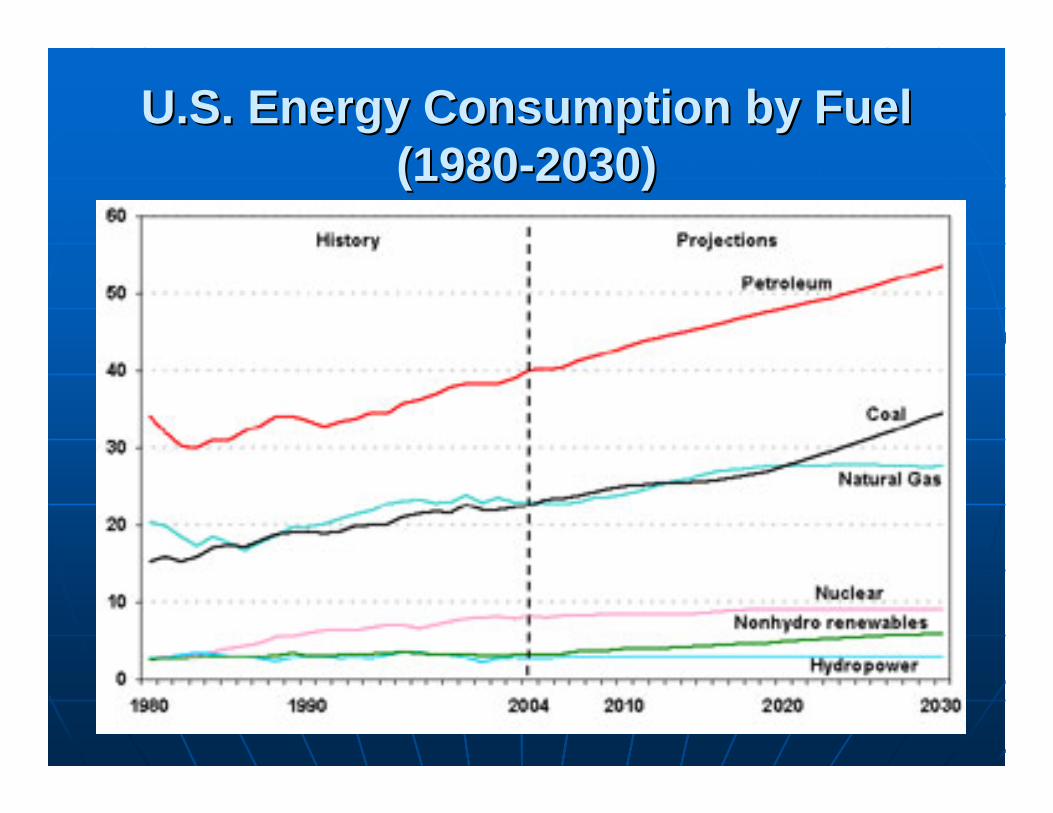
U.S. Energy Consumption by Fuel U.S. Energy Consumption by Fuel (1980(1980--2030)2030)
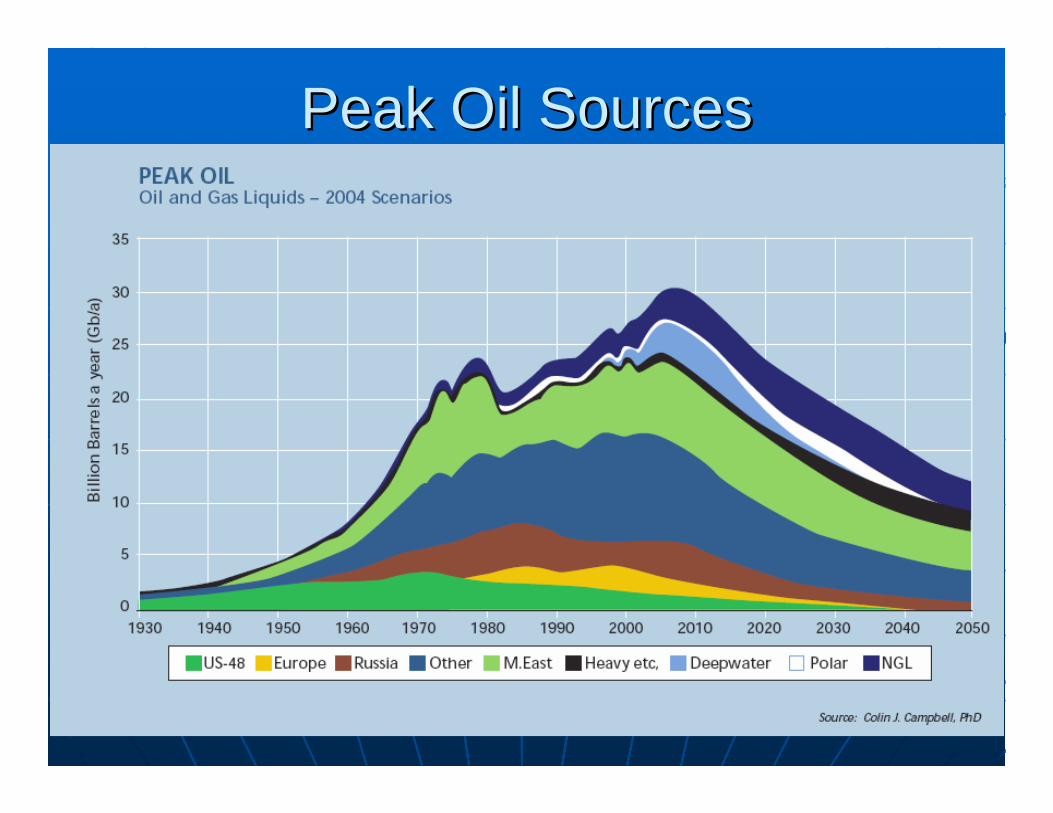
Peak Oil SourcesPeak Oil Sources
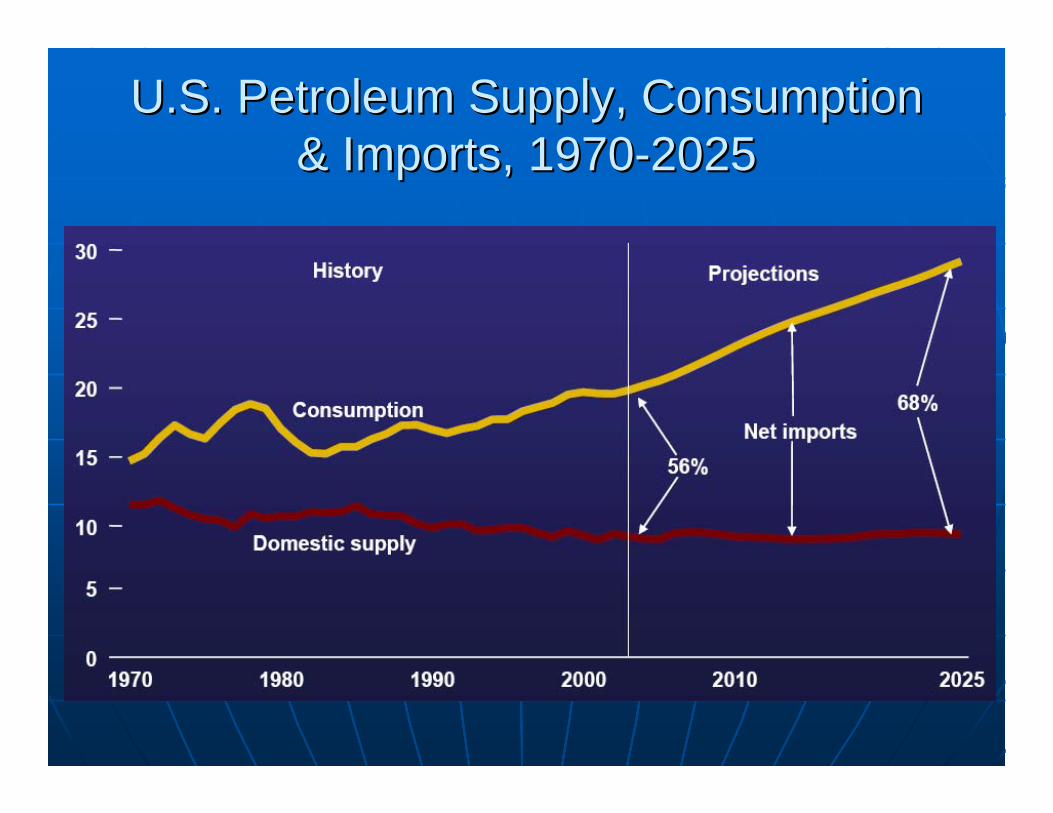
U.S. Petroleum Supply, Consumption U.S. Petroleum Supply, Consumption & Imports, 1970& Imports, 1970--20252025
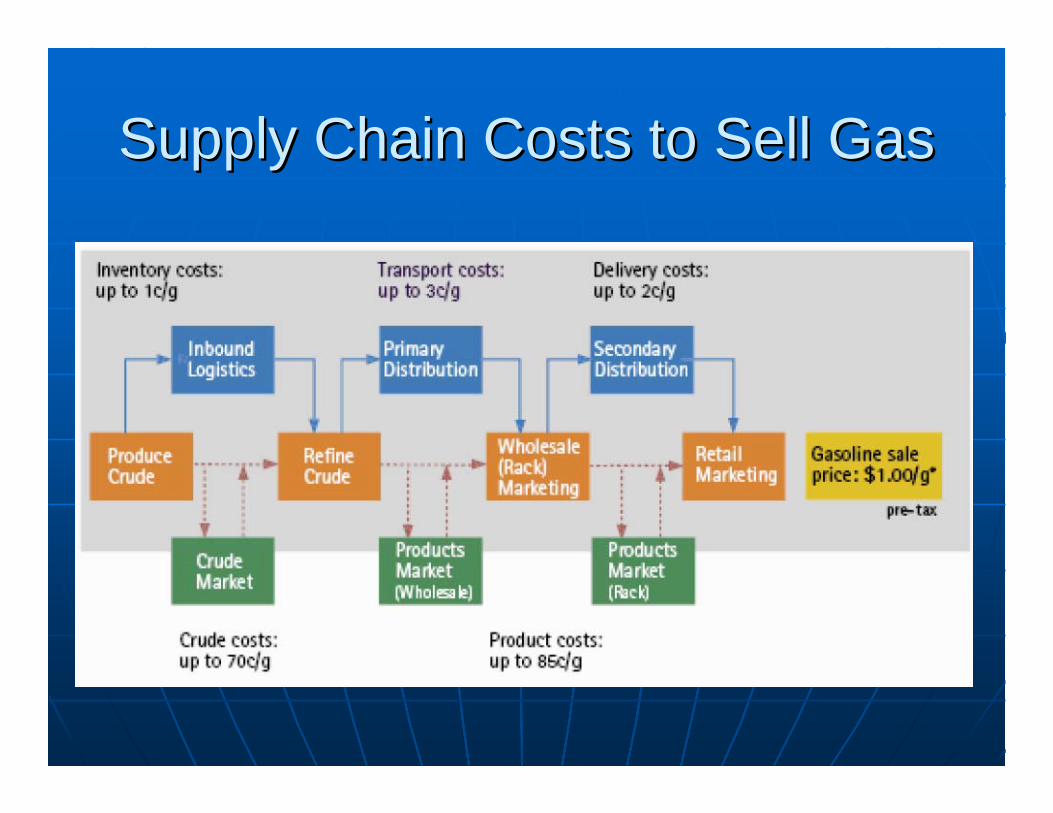
Supply Chain Costs to Sell GasSupply Chain Costs to Sell Gas
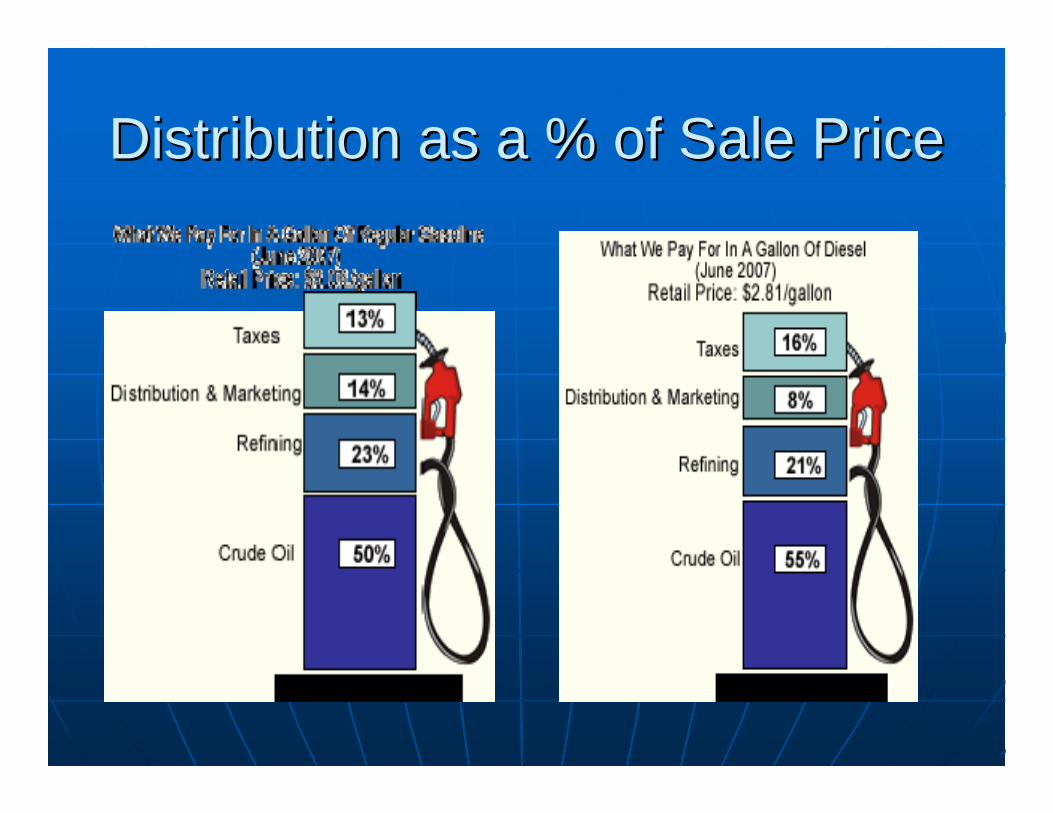
Distribution as a % of Sale PriceDistribution as a % of Sale Price
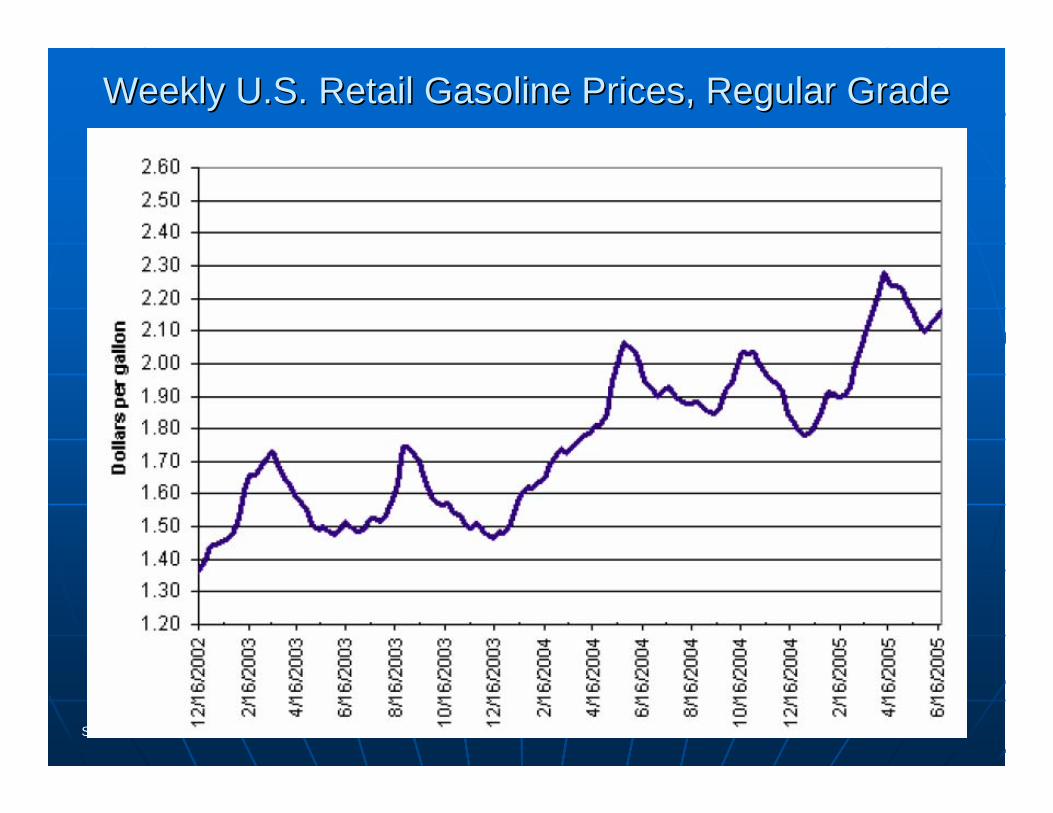
Weekly U.S. Retail Gasoline Prices, Regular GradeWeekly U.S. Retail Gasoline Prices, Regular Grade
Source: EIA
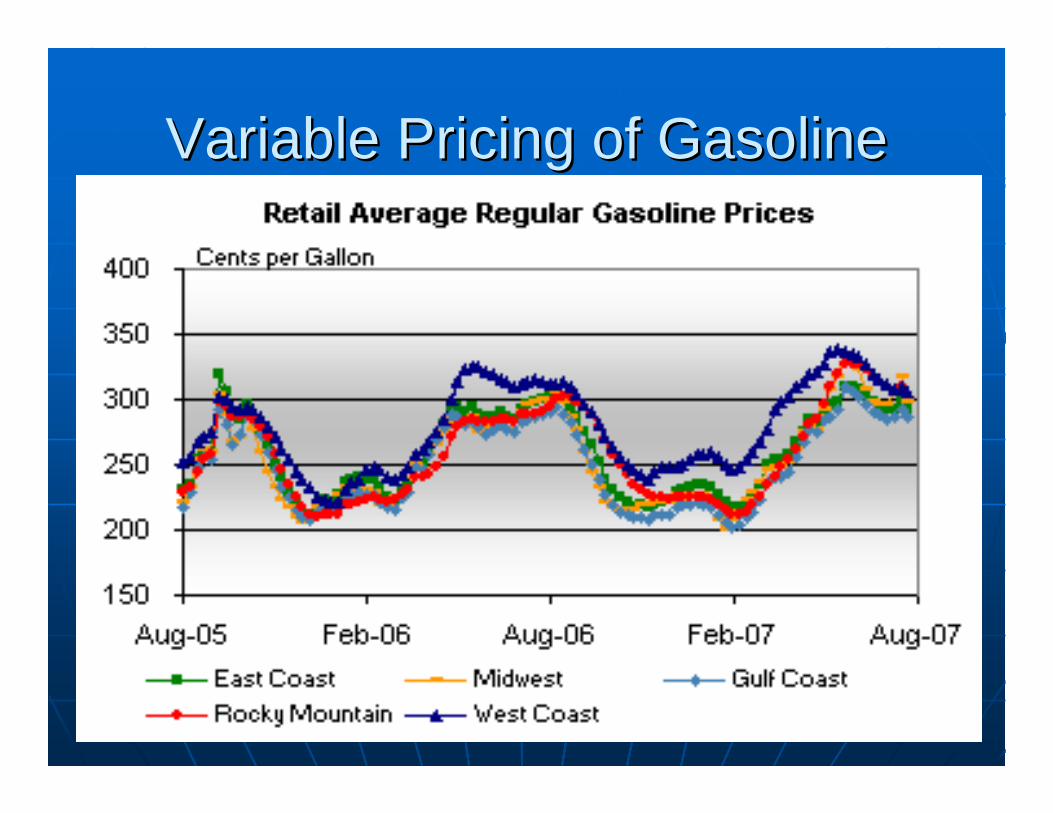
Variable Pricing of GasolineVariable Pricing of Gasoline
Key ConceptsKey Concepts• Energy consumption particularly petroleum is projected
to continue its rise for the foreseeable future
• Distribution and marketing costs represent 8-14% averaging <10% with a < 50/50 split
• Prices will continue to increase based upon this supply and demand
• Pricing is seriously impacted by regionalization of supply formulas
TransportationTransportation
PipelineRail
BargeMarineTruck
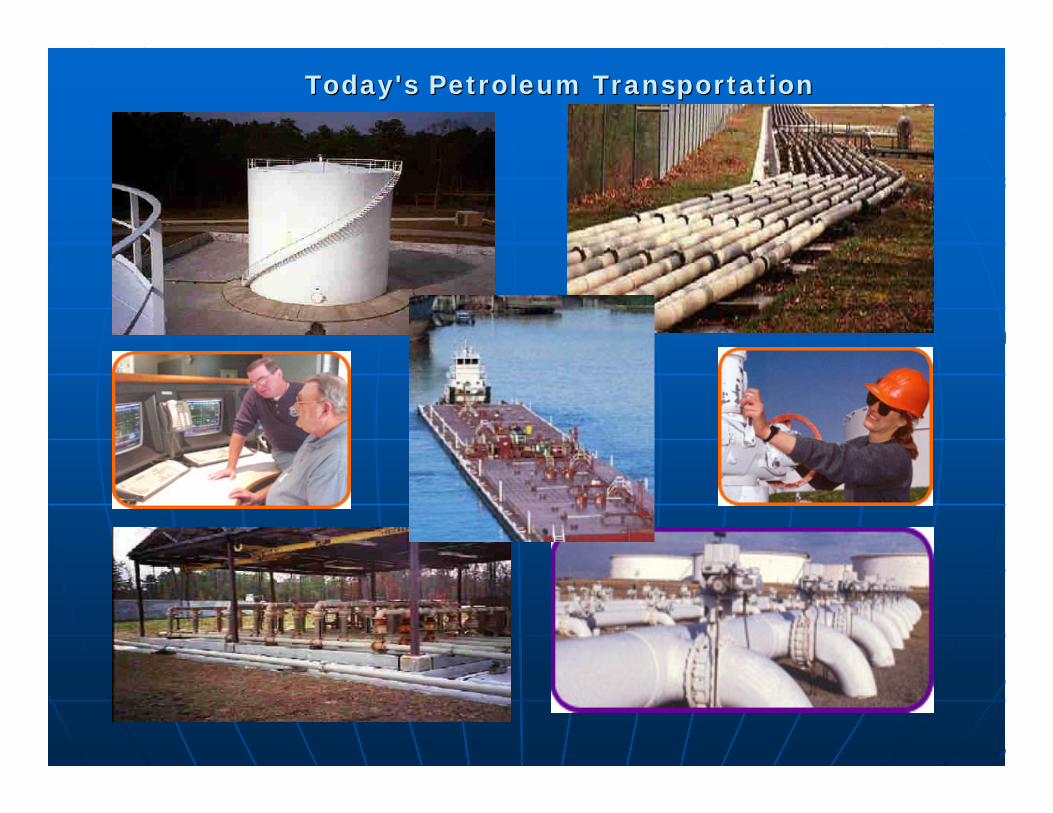
Today's Petroleum TransportationToday's Petroleum Transportation
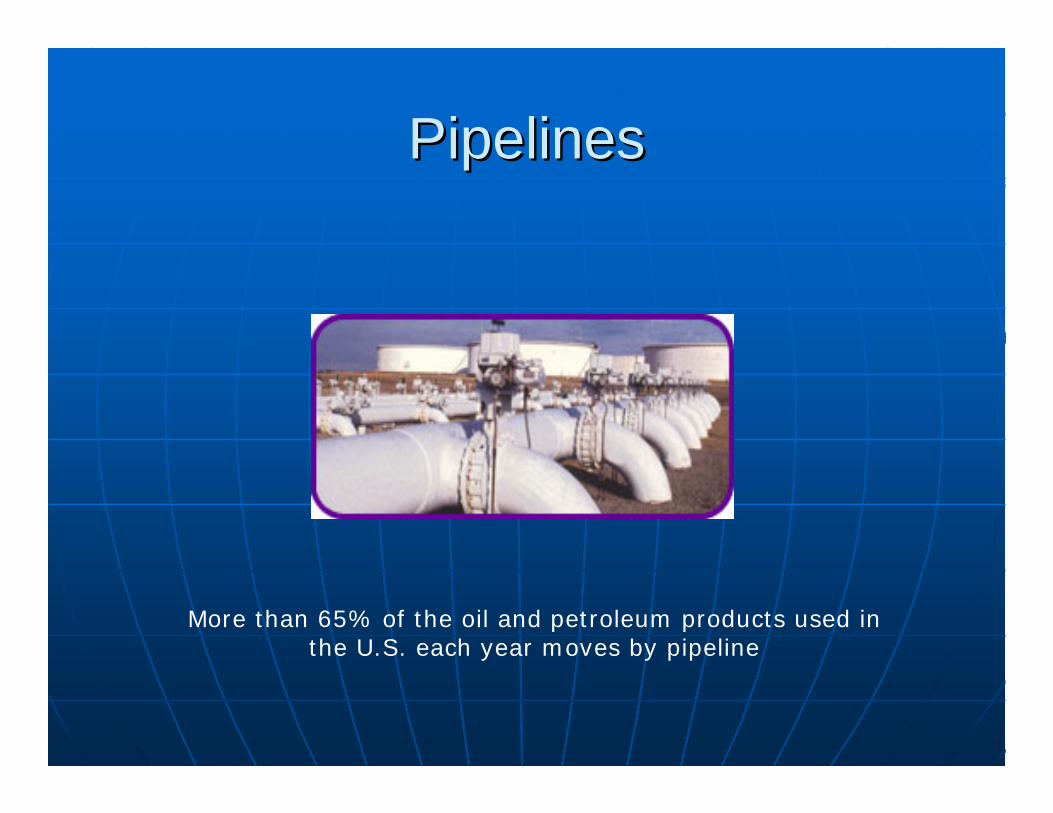
PipelinesPipelines
More than 65% of the oil and petroleum products used in the U.S. each year moves by pipeline
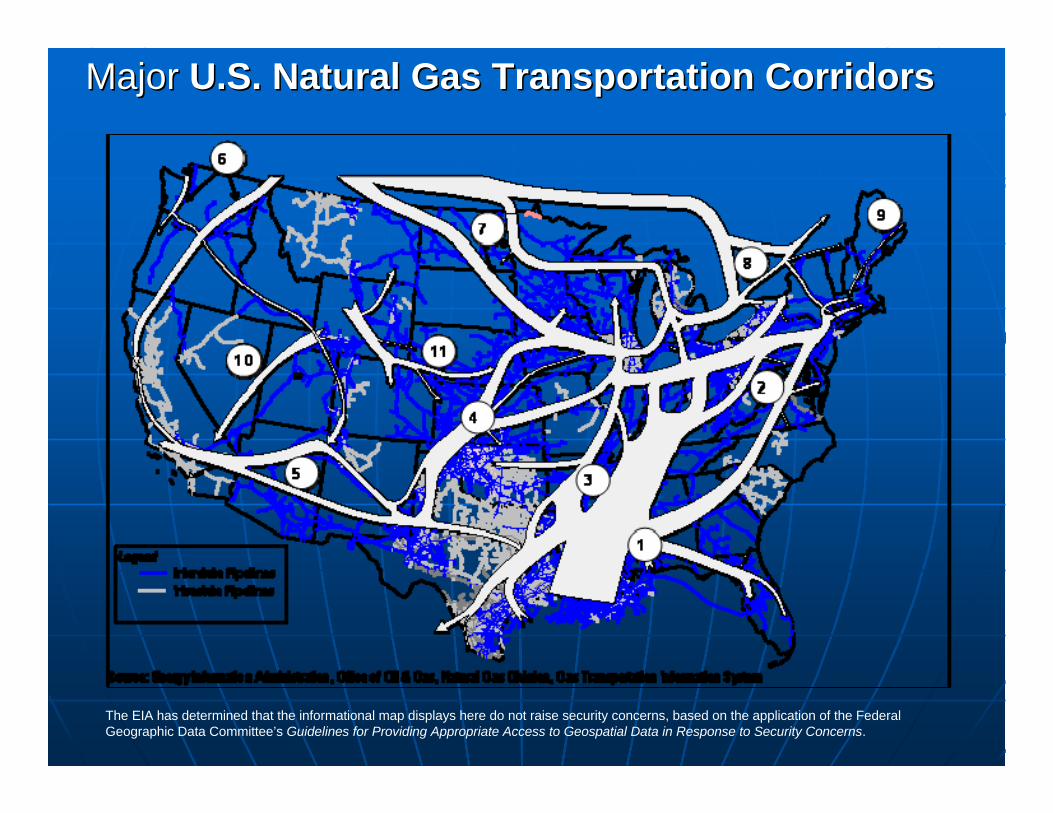
MajorMajor U.S. Natural Gas Transportation Corridors U.S. Natural Gas Transportation Corridors
The EIA has determined that the informational map displays here do not raise security concerns, based on the application of the Federal Geographic Data Committee’s Guidelines for Providing Appropriate Access to Geospatial Data in Response to Security Concerns.
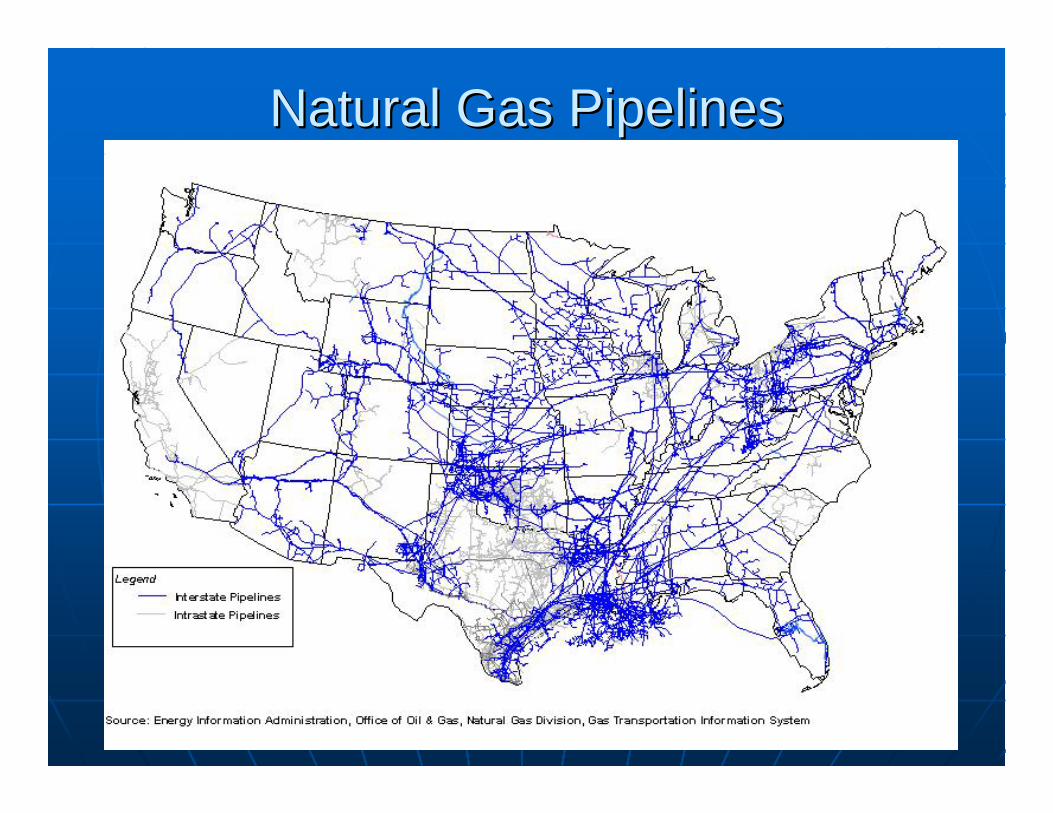
Natural Gas Pipelines Natural Gas Pipelines
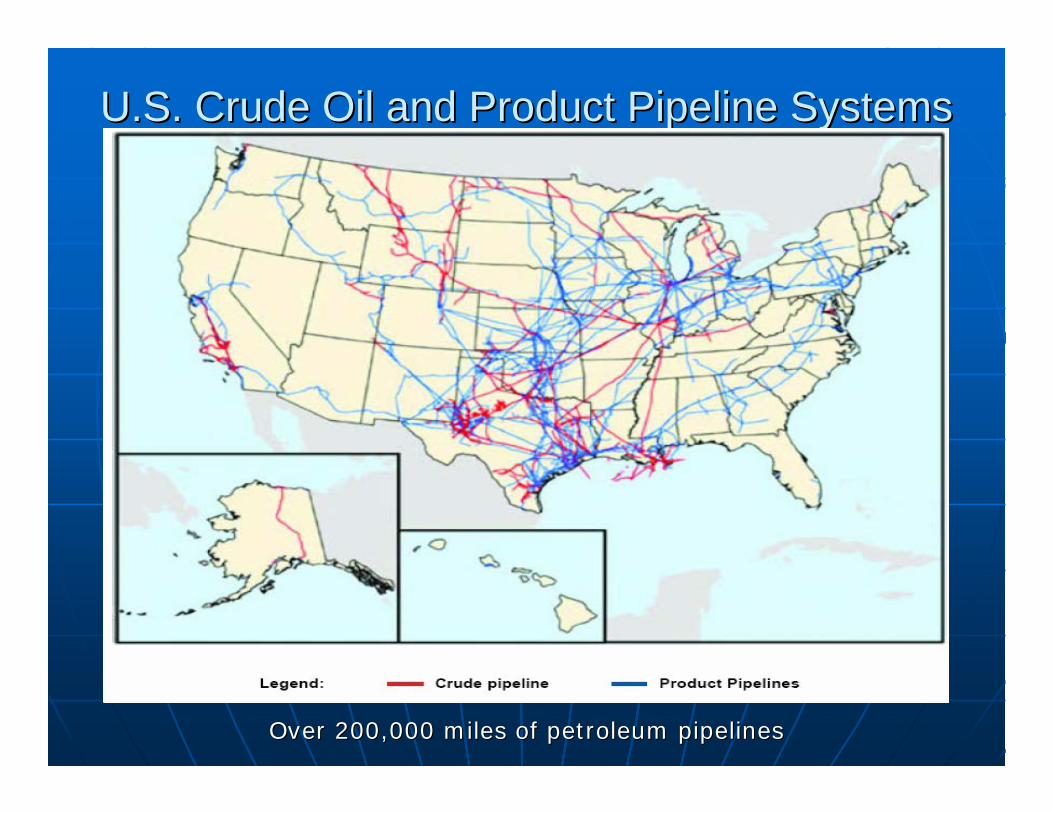
U.S. Crude Oil and Product Pipeline SystemsU.S. Crude Oil and Product Pipeline Systems
Over 200,000 miles of petroleum pipelinesOver 200,000 miles of petroleum pipelines
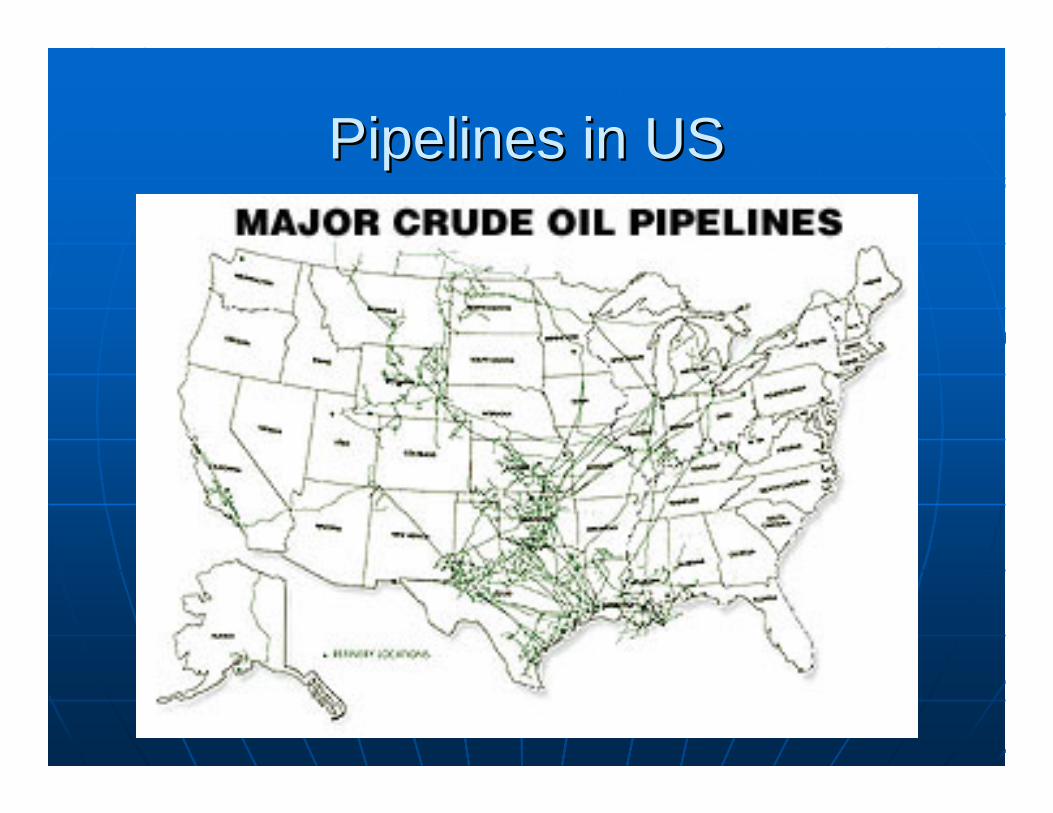
Pipelines in USPipelines in US

Pipelines in USPipelines in US
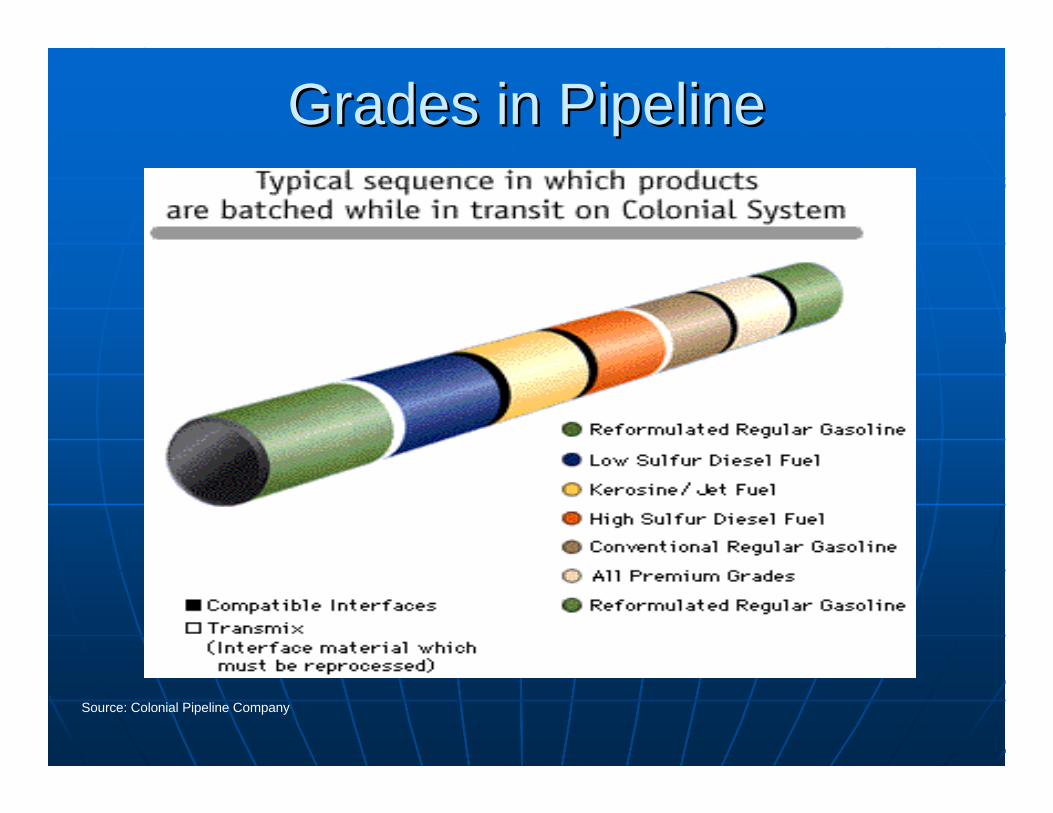
Grades in PipelineGrades in Pipeline
Source: Colonial Pipeline Company
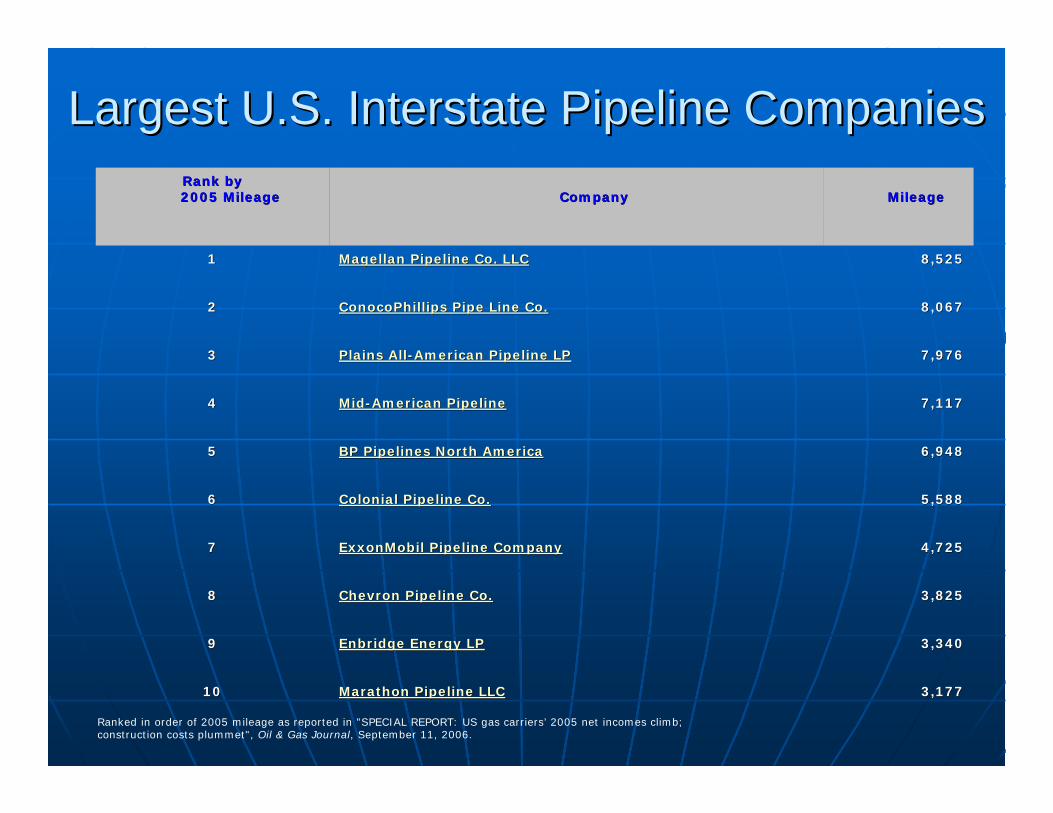
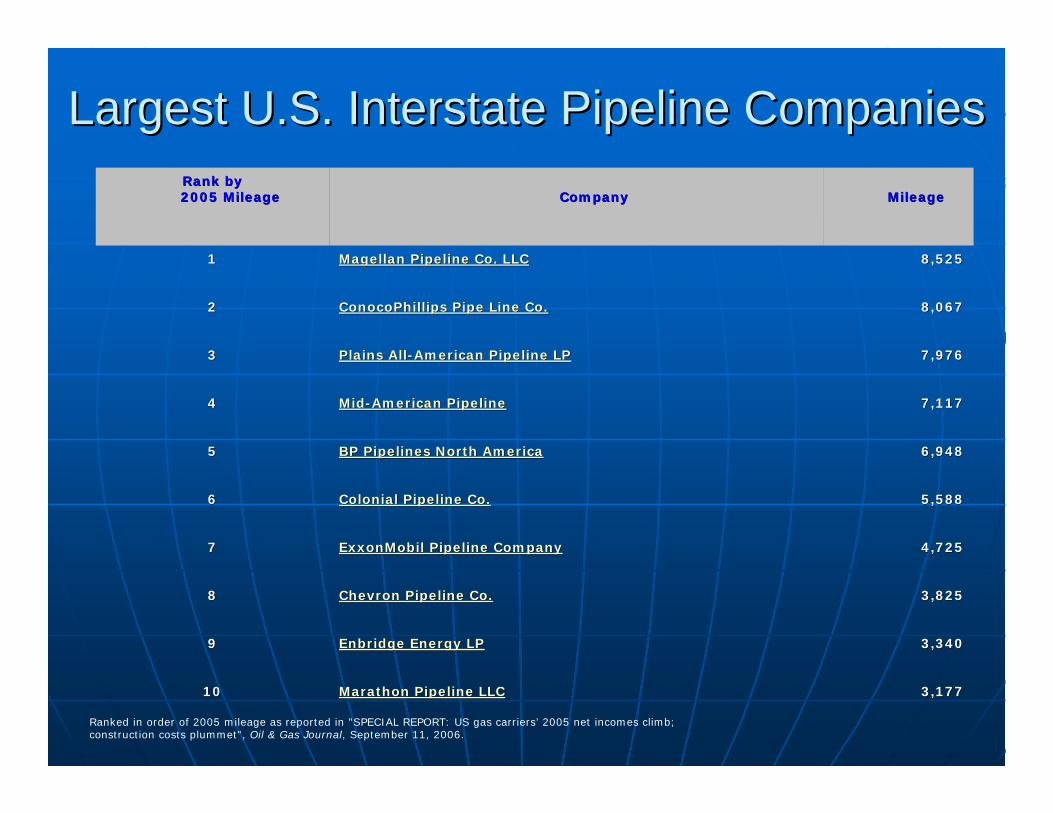
Largest U.S. Interstate Pipeline CompaniesLargest U.S. Interstate Pipeline Companies
3,1773,177Marathon Pipeline LLCMarathon Pipeline LLC1010
3,3403,340Enbridge Energy LPEnbridge Energy LP99
3,8253,825Chevron Pipeline Co.Chevron Pipeline Co.88
4,7254,725ExxonMobil Pipeline CompanyExxonMobil Pipeline Company77
5,5885,588Colonial Pipeline Co.Colonial Pipeline Co.66
6,9486,948BP Pipelines North AmericaBP Pipelines North America55
7,1177,117MidMid--American PipelineAmerican Pipeline44
7,9767,976Plains AllPlains All--American Pipeline LPAmerican Pipeline LP33
8,0678,067ConocoPhillips Pipe Line Co.ConocoPhillips Pipe Line Co.22
8,5258,525Magellan Pipeline Co. LLCMagellan Pipeline Co. LLC11
MileageMileageCompanyCompanyRank by Rank by 2005 Mileage2005 Mileage
Ranked in order of 2005 mileage as reported in "SPECIAL REPORT: US gas carriers’ 2005 net incomes climb; construction costs plummet", Oil & Gas Journal, September 11, 2006.
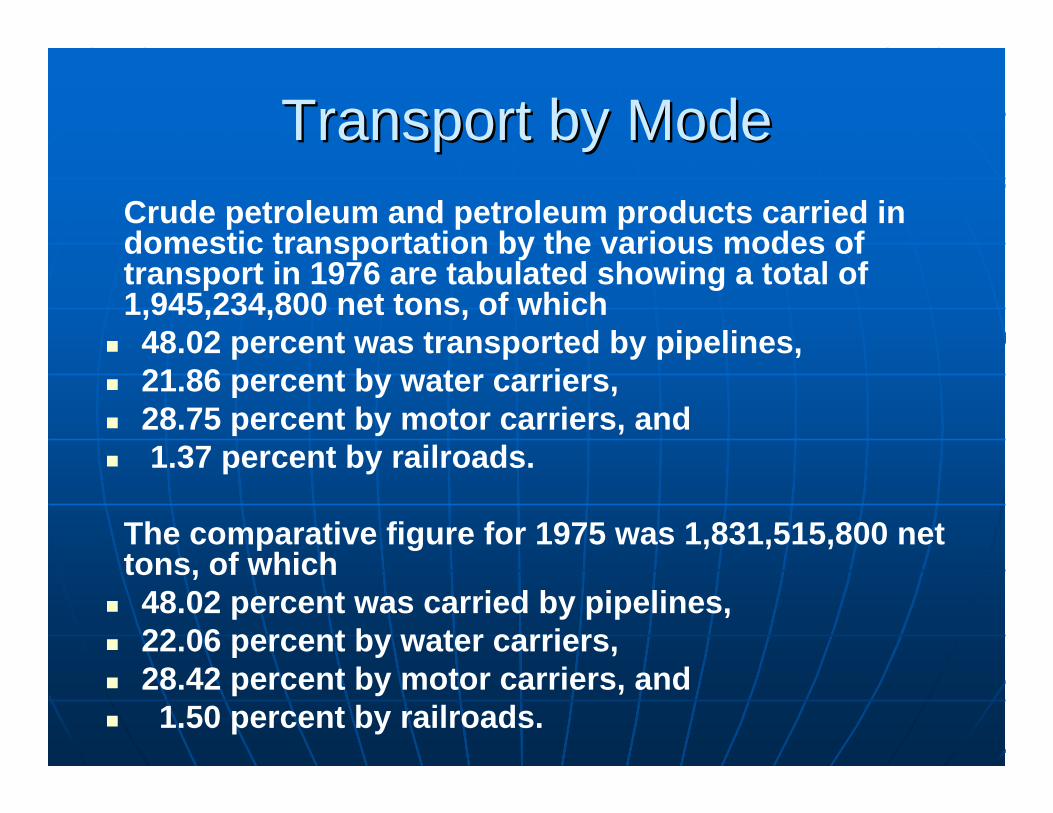
Transport by ModeTransport by ModeCrude petroleum and petroleum products carried in domestic transportation by the various modes of transport in 1976 are tabulated showing a total of 1,945,234,800 net tons, of which 48.02 percent was transported by pipelines, 21.86 percent by water carriers, 28.75 percent by motor carriers, and 1.37 percent by railroads.
The comparative figure for 1975 was 1,831,515,800 net tons, of which 48.02 percent was carried by pipelines, 22.06 percent by water carriers, 28.42 percent by motor carriers, and 1.50 percent by railroads.
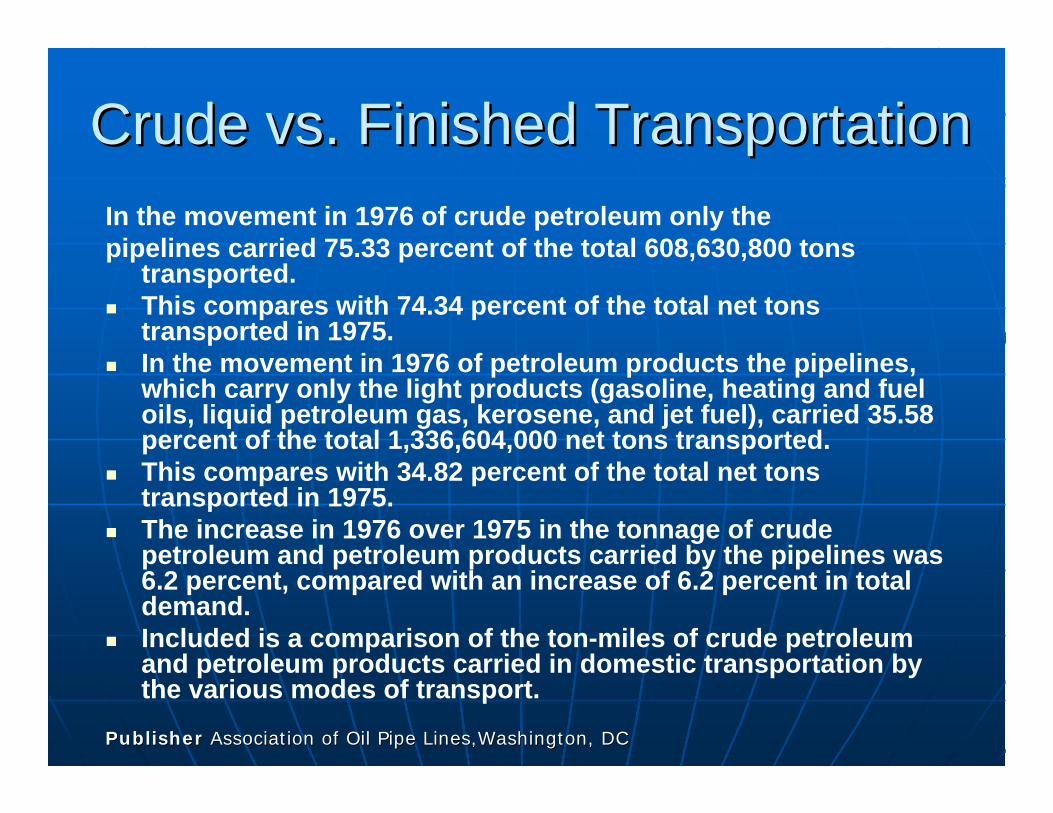
Crude vs. Finished TransportationCrude vs. Finished TransportationIn the movement in 1976 of crude petroleum only the pipelines carried 75.33 percent of the total 608,630,800 tons
transported.This compares with 74.34 percent of the total net tons transported in 1975.In the movement in 1976 of petroleum products the pipelines, which carry only the light products (gasoline, heating and fuel oils, liquid petroleum gas, kerosene, and jet fuel), carried 35.58 percent of the total 1,336,604,000 net tons transported.This compares with 34.82 percent of the total net tons transported in 1975.The increase in 1976 over 1975 in the tonnage of crude petroleum and petroleum products carried by the pipelines was 6.2 percent, compared with an increase of 6.2 percent in total demand.Included is a comparison of the ton-miles of crude petroleum and petroleum products carried in domestic transportation by the various modes of transport.
Publisher Publisher Association of Oil Pipe Association of Oil Pipe Lines,WashingtonLines,Washington, DC, DC
Key ConceptsKey Concepts• The US has a well defined pipeline network
• Crude pipelines distribute Gulf Coast crude to Midwestern refineries
• Finished goods pipelines distribute refined product to Midwest and East Coast markets
• Natural gas pipelines distribute Gulf Coast & Canadian gas to demand markets
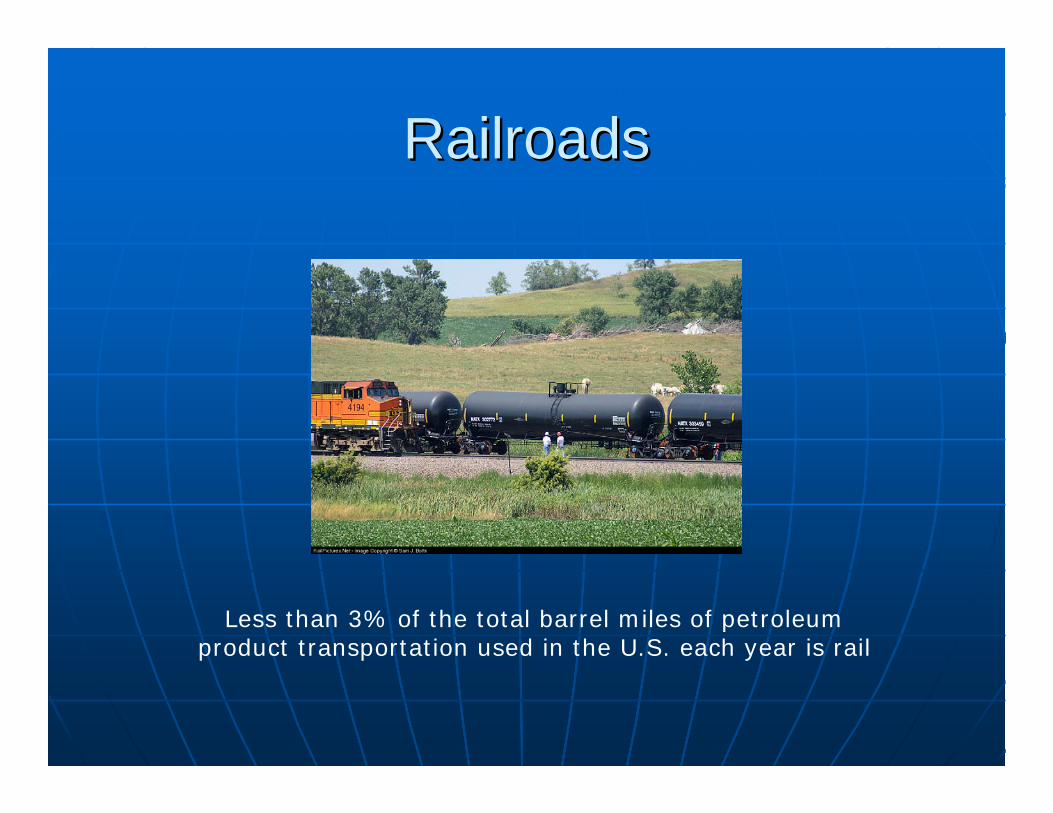
RailroadsRailroads
Less than 3% of the total barrel miles of petroleum product transportation used in the U.S. each year is rail
Railroad CompaniesRailroad Companies
• Burlington Northern-Santa Fe• Conrail
• CSX Transportation• IC&E Railroad• Illinois Central
• Kansas City Southern• Montana Rail Link• Norfolk Southern
• Pacific Harbor Line• Union Pacific
• Wisconsin Central
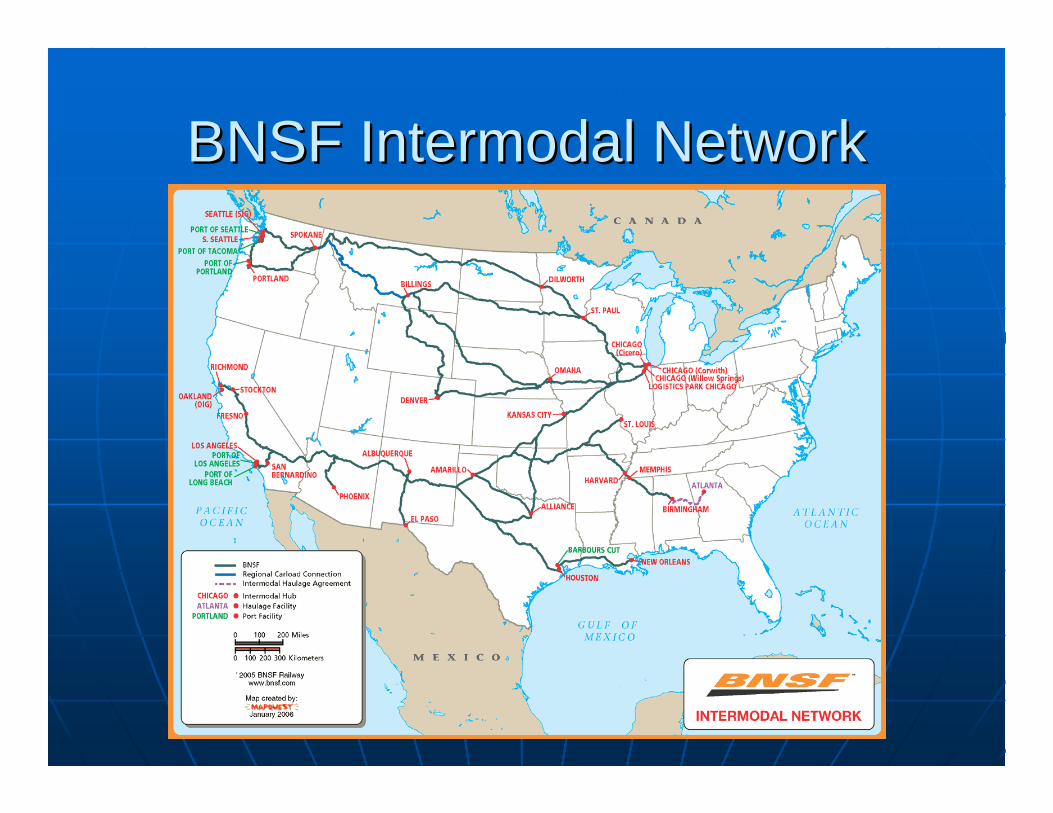
BNSF Intermodal NetworkBNSF Intermodal Network
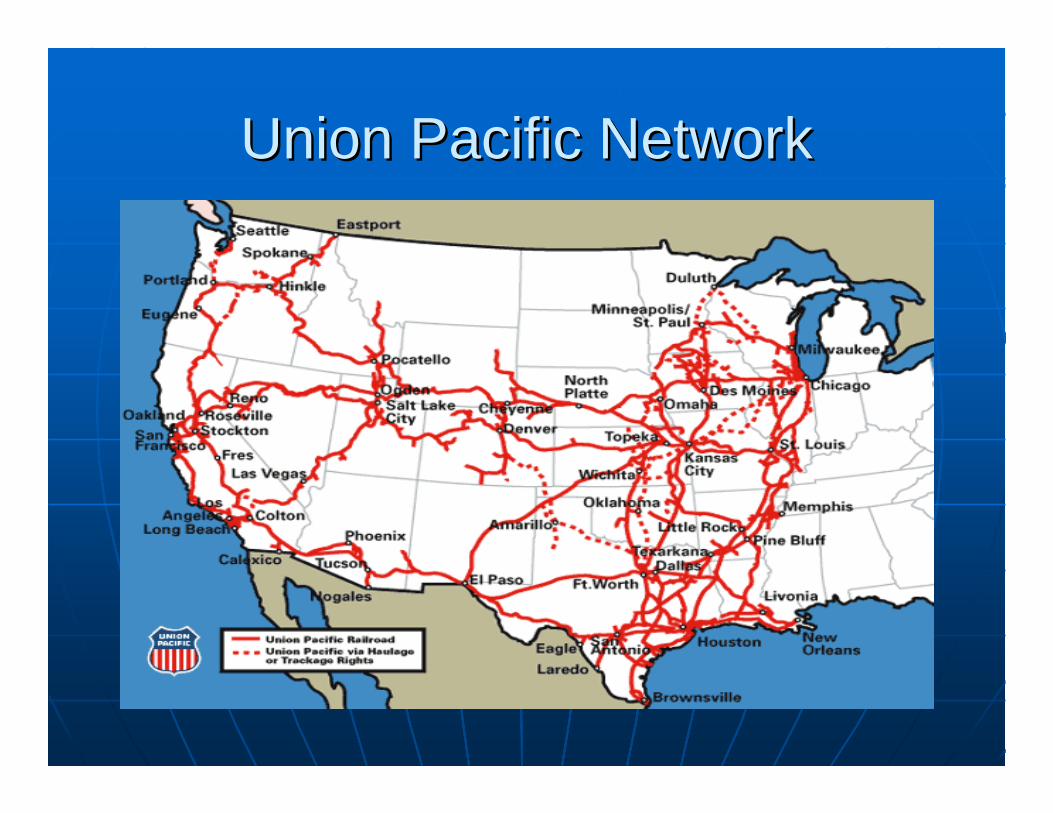
Union Pacific NetworkUnion Pacific Network
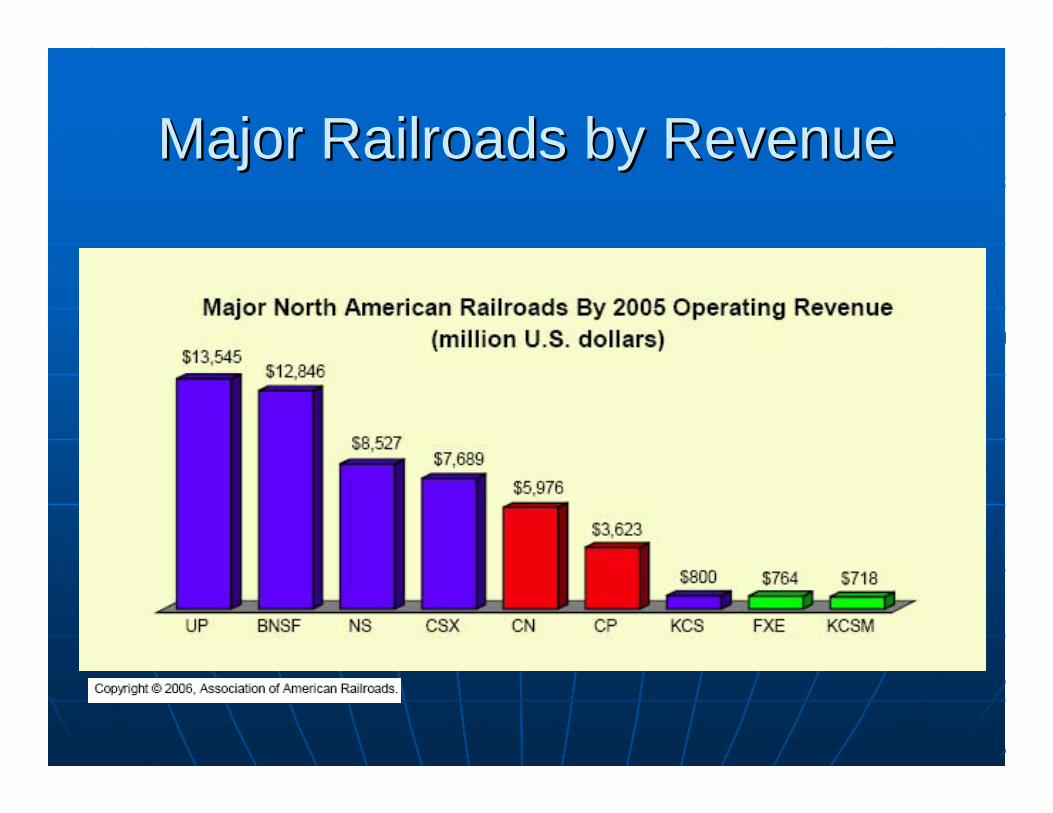
Major Railroads by RevenueMajor Railroads by Revenue
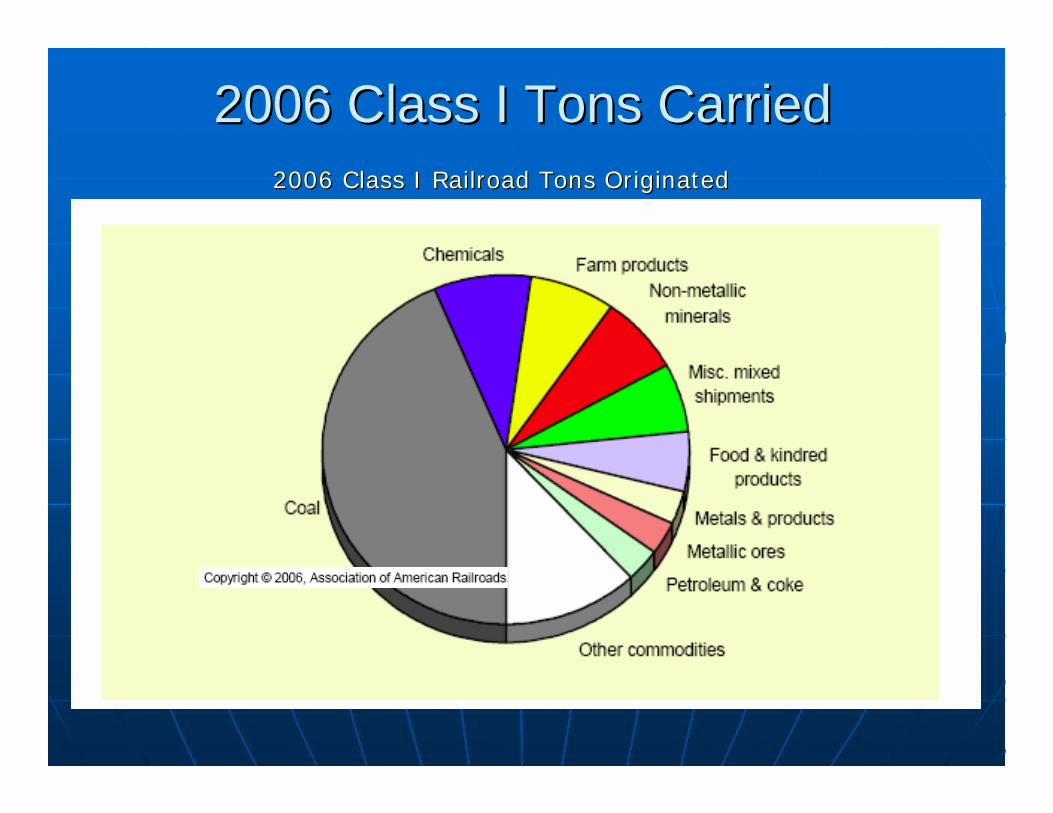
2006 Class I Tons Carried2006 Class I Tons Carried2006 Class I Railroad Tons Originated2006 Class I Railroad Tons Originated
Key ConceptsKey Concepts
• US freight railroads are dominated by four carriers
• Petroleum products are a small segment of total rail tonnage
• Railroads represent less than 3% of the total barrel miles of petroleum transportation
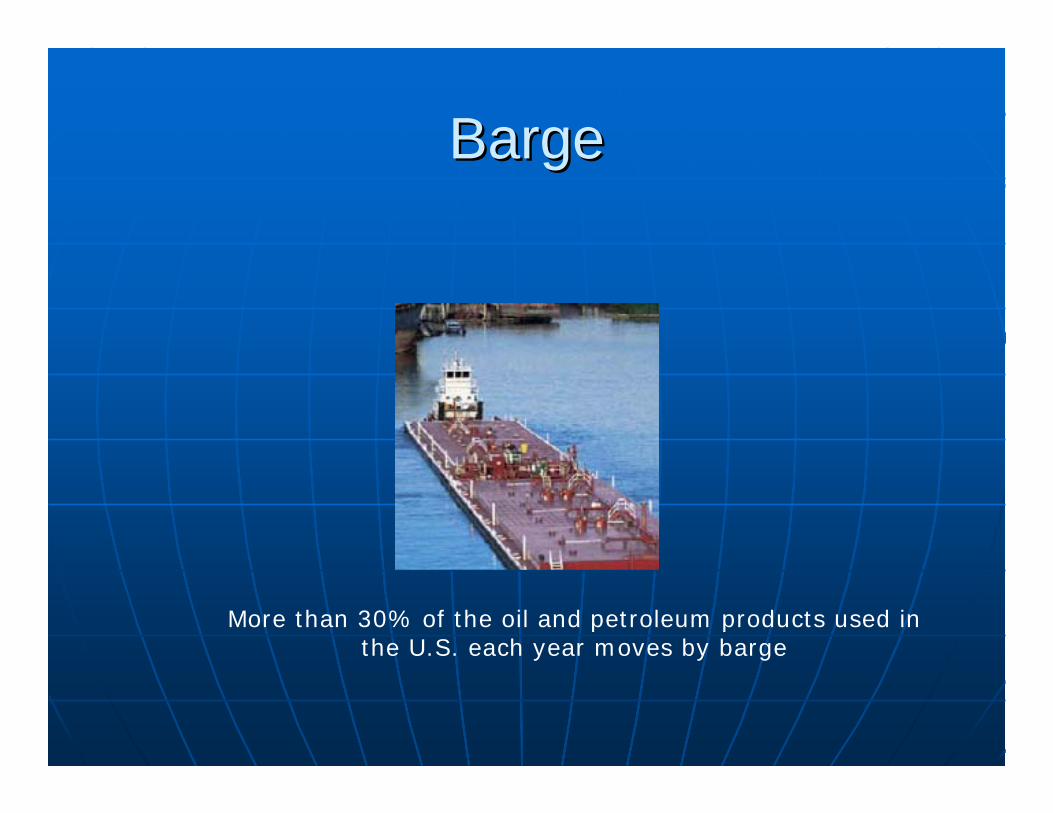
BargeBarge
More than 30% of the oil and petroleum products used in the U.S. each year moves by barge
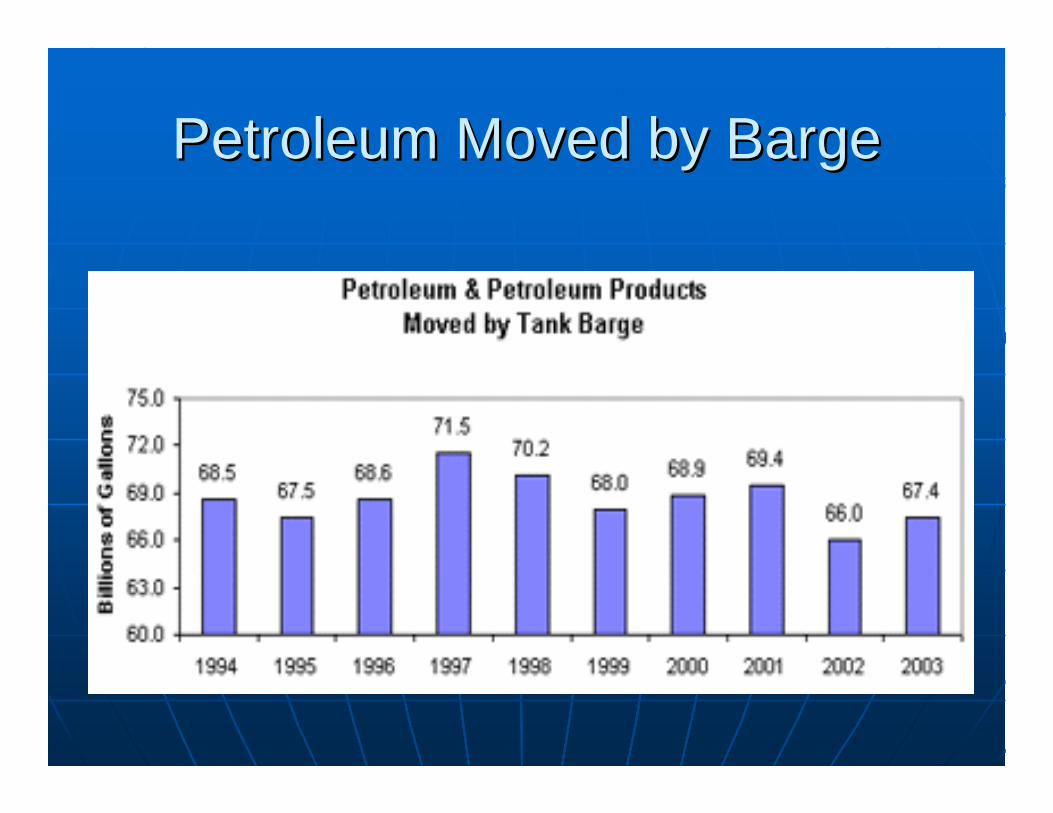
Petroleum Moved by BargePetroleum Moved by Barge
Key ConceptsKey Concepts
• More than 30% of the oil and petroleum products used in the U.S. each year moves by barge
• Barge transportation is more expensive than pipeline but cheaper then rail
• Barge transport is limited in the Midwest upper Mississippi due to frozen conditions during winter months
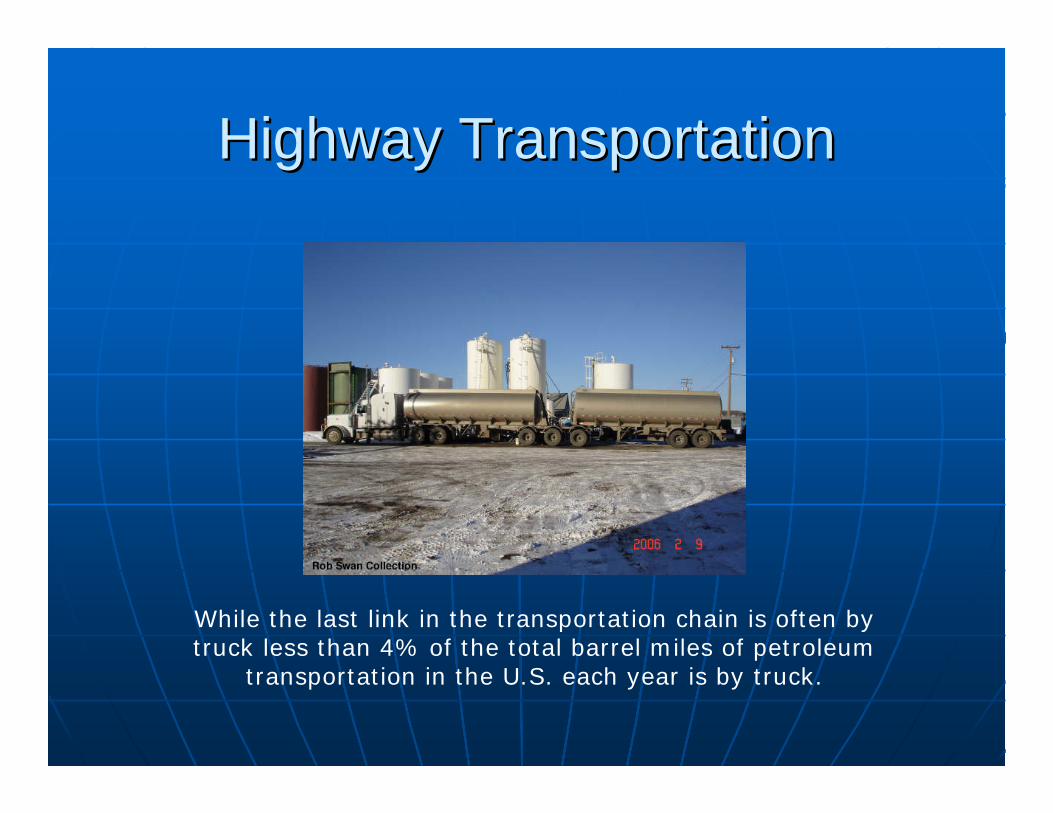
Highway TransportationHighway Transportation
While the last link in the transportation chain is often by truck less than 4% of the total barrel miles of petroleum
transportation in the U.S. each year is by truck.
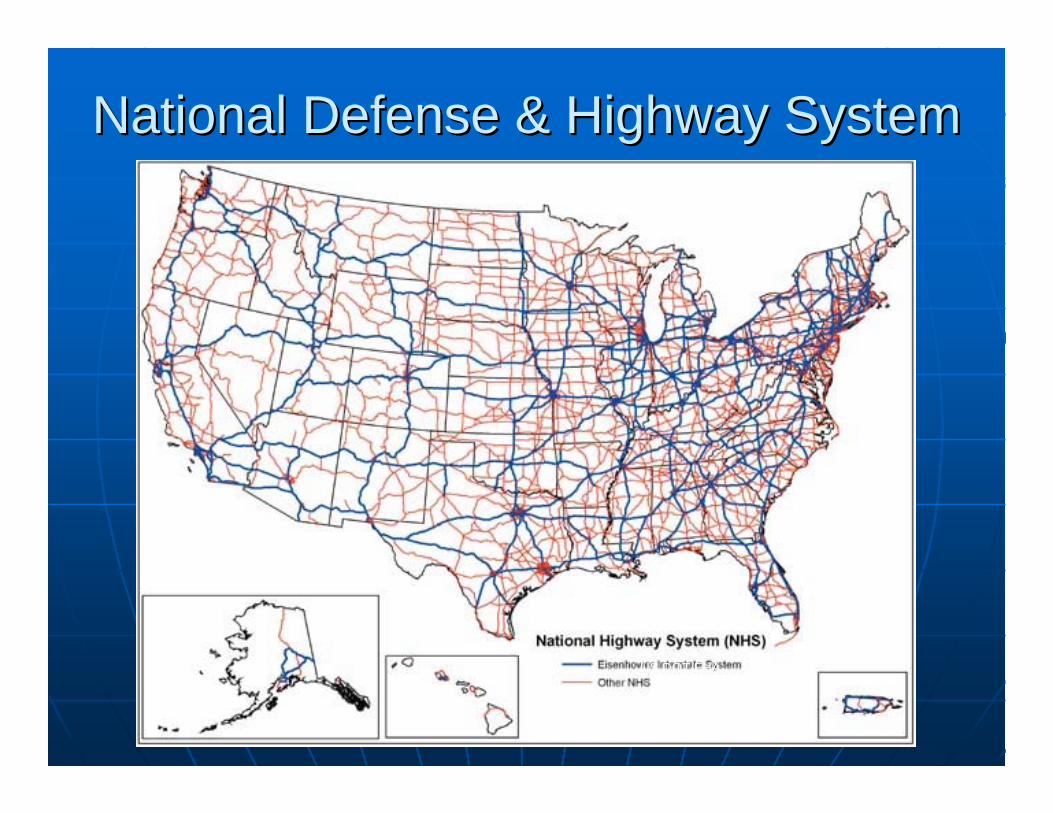
National Defense & Highway SystemNational Defense & Highway System
US DOT/FHA
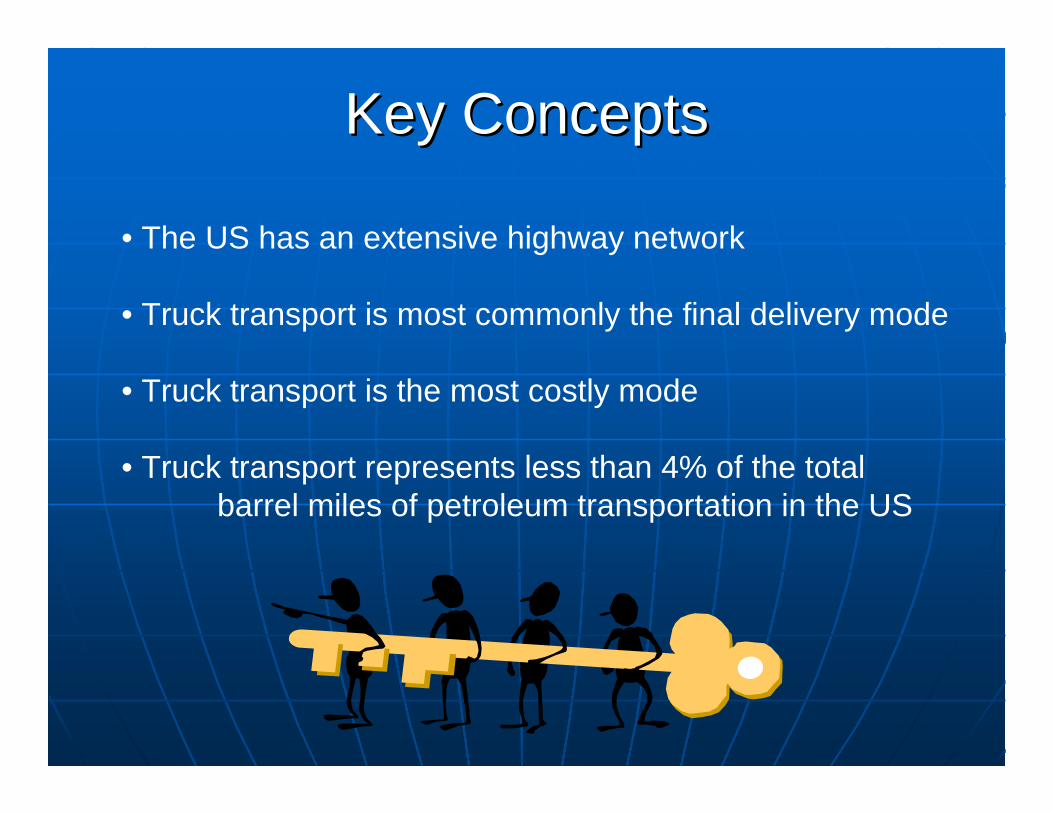
Key ConceptsKey Concepts
• The US has an extensive highway network
• Truck transport is most commonly the final delivery mode
• Truck transport is the most costly mode
• Truck transport represents less than 4% of the total barrel miles of petroleum transportation in the US
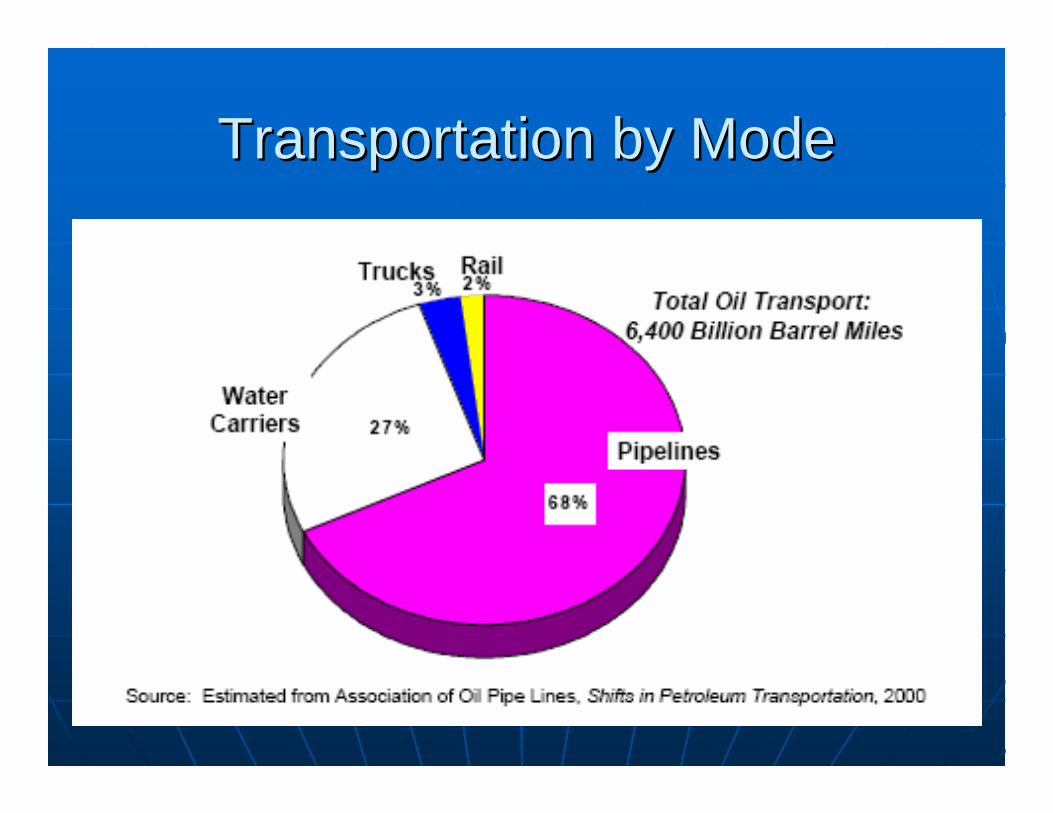
Transportation by ModeTransportation by Mode
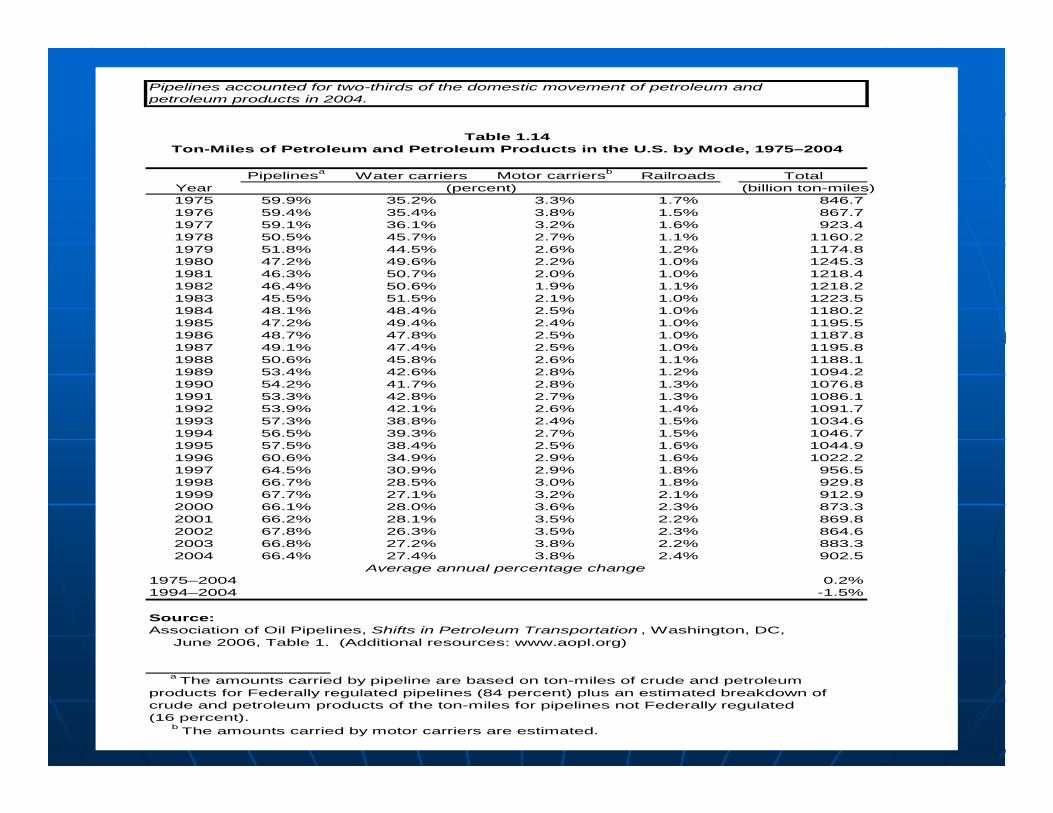
Pipelines accounted for two-thirds of the domestic movement of petroleum and petroleum products in 2004.
Pipelinesa Water carriers Motor carriersb Railroads TotalYear (billion ton-miles)1975 59.9% 35.2% 3.3% 1.7% 846.71976 59.4% 35.4% 3.8% 1.5% 867.71977 59.1% 36.1% 3.2% 1.6% 923.41978 50.5% 45.7% 2.7% 1.1% 1160.21979 51.8% 44.5% 2.6% 1.2% 1174.81980 47.2% 49.6% 2.2% 1.0% 1245.31981 46.3% 50.7% 2.0% 1.0% 1218.41982 46.4% 50.6% 1.9% 1.1% 1218.21983 45.5% 51.5% 2.1% 1.0% 1223.51984 48.1% 48.4% 2.5% 1.0% 1180.21985 47.2% 49.4% 2.4% 1.0% 1195.51986 48.7% 47.8% 2.5% 1.0% 1187.81987 49.1% 47.4% 2.5% 1.0% 1195.81988 50.6% 45.8% 2.6% 1.1% 1188.11989 53.4% 42.6% 2.8% 1.2% 1094.21990 54.2% 41.7% 2.8% 1.3% 1076.81991 53.3% 42.8% 2.7% 1.3% 1086.11992 53.9% 42.1% 2.6% 1.4% 1091.71993 57.3% 38.8% 2.4% 1.5% 1034.61994 56.5% 39.3% 2.7% 1.5% 1046.71995 57.5% 38.4% 2.5% 1.6% 1044.91996 60.6% 34.9% 2.9% 1.6% 1022.21997 64.5% 30.9% 2.9% 1.8% 956.51998 66.7% 28.5% 3.0% 1.8% 929.81999 67.7% 27.1% 3.2% 2.1% 912.92000 66.1% 28.0% 3.6% 2.3% 873.32001 66.2% 28.1% 3.5% 2.2% 869.82002 67.8% 26.3% 3.5% 2.3% 864.62003 66.8% 27.2% 3.8% 2.2% 883.32004 66.4% 27.4% 3.8% 2.4% 902.5
1975–2004 0.2%1994–2004 -1.5%
Source:Association of Oil Pipelines, Shifts in Petroleum Transportation , Washington, DC, June 2006, Table 1. (Additional resources: www.aopl.org)
a The amounts carried by pipeline are based on ton-miles of crude and petroleum products for Federally regulated pipelines (84 percent) plus an estimated breakdown of crude and petroleum products of the ton-miles for pipelines not Federally regulated (16 percent). b The amounts carried by motor carriers are estimated.
(percent)
Average annual percentage change
Ton-Miles of Petroleum and Petroleum Products in the U.S. by Mode, 1975–2004Table 1.14
Key ConceptsKey Concepts• US petroleum transportation is dominated by pipelines
• Water inland waterway barges are the second mode
• While rail and truck are minor carriers they are the primary final deliver mode
• While not indicated as a mode of transportation exchanges are a primary means to of repositioning product
Management IssuesManagement Issues
GovernmentRegulations
EnvironmentalRequirements
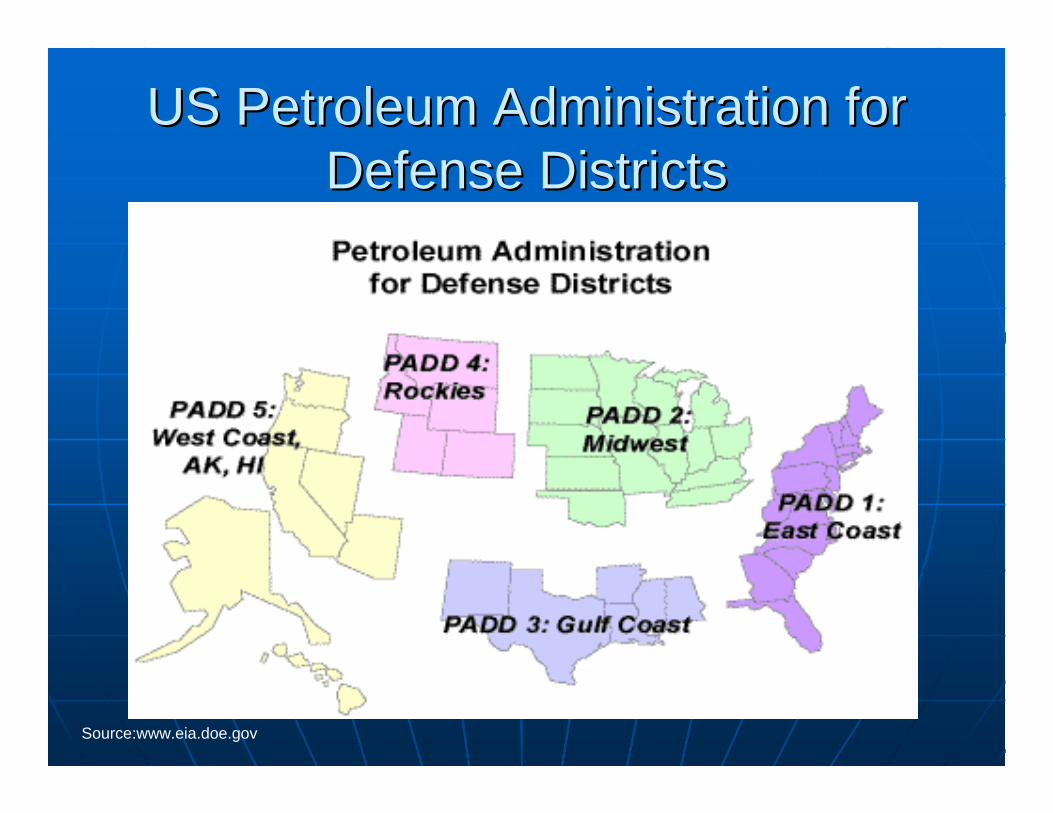
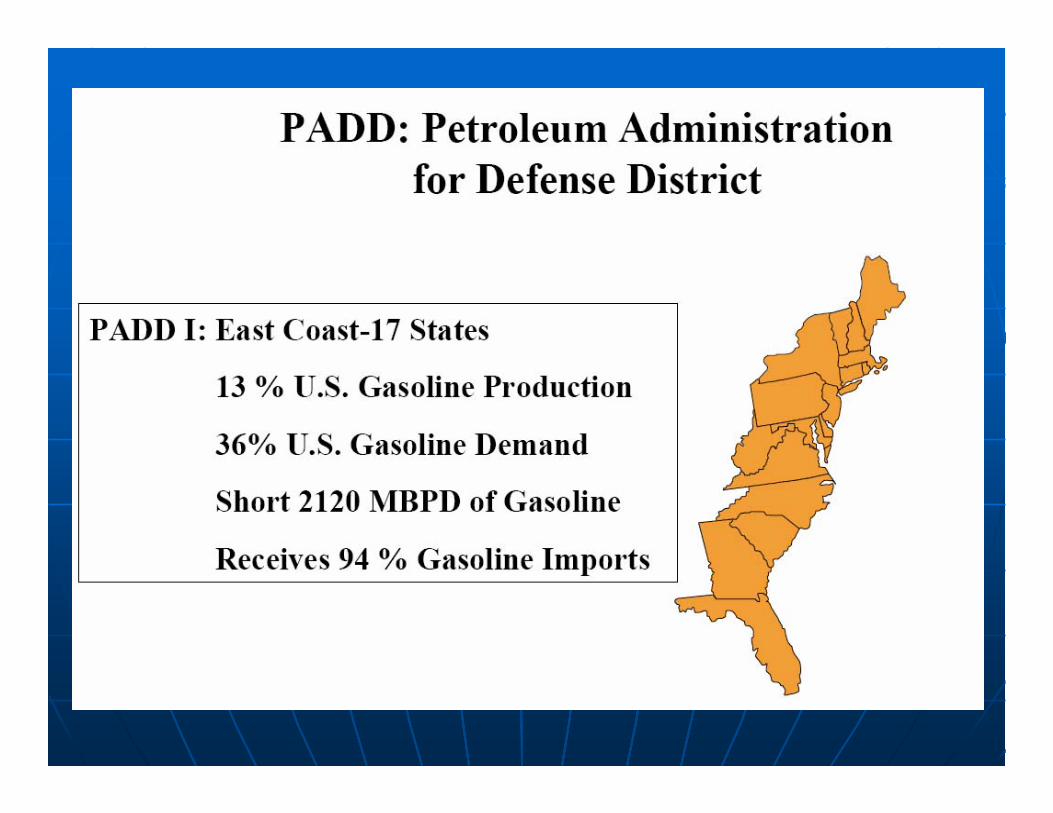
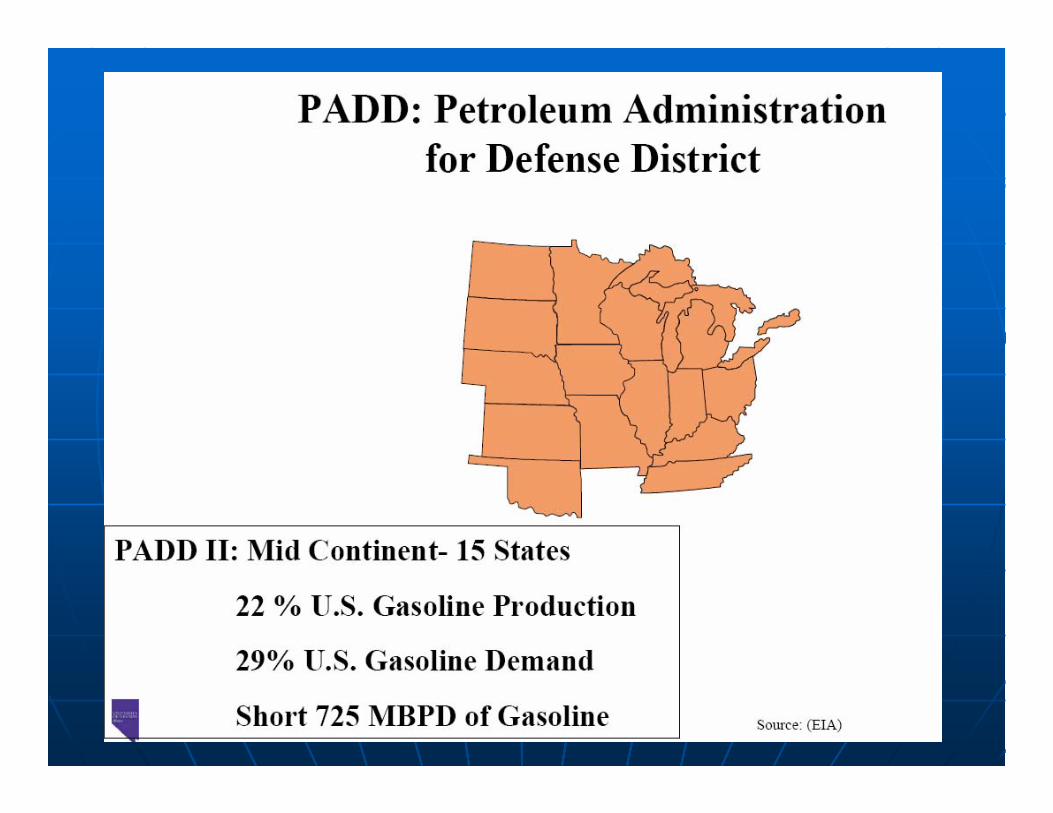
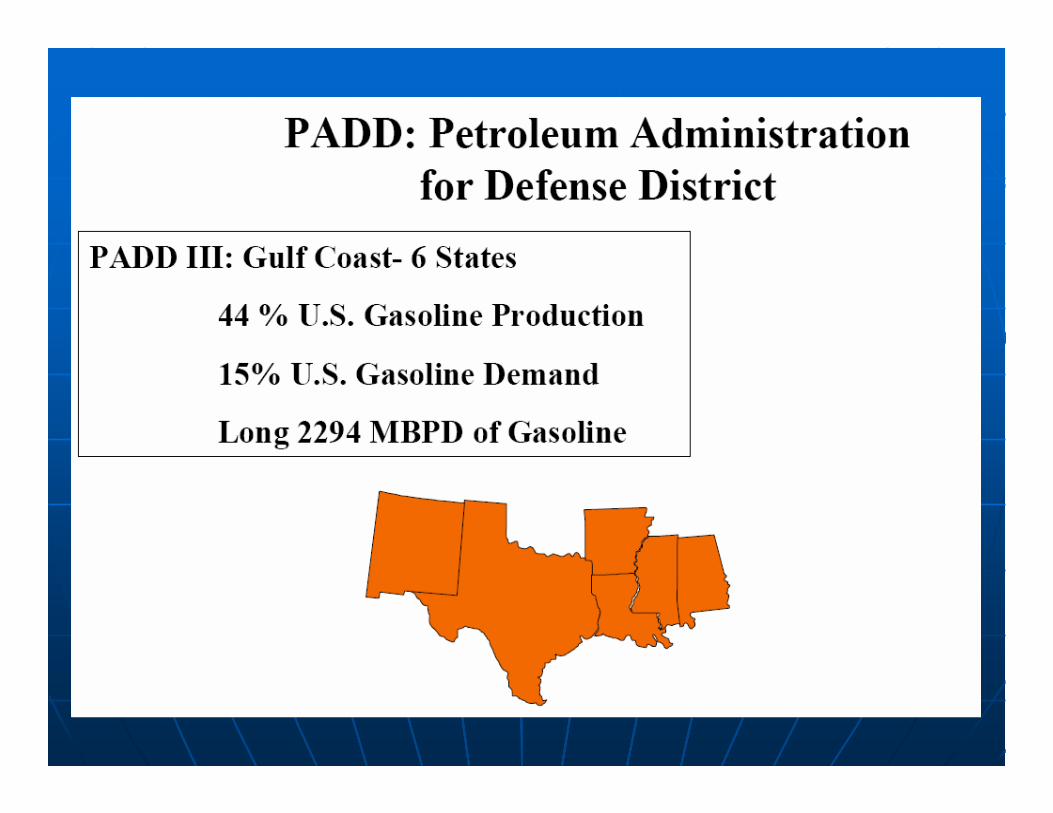
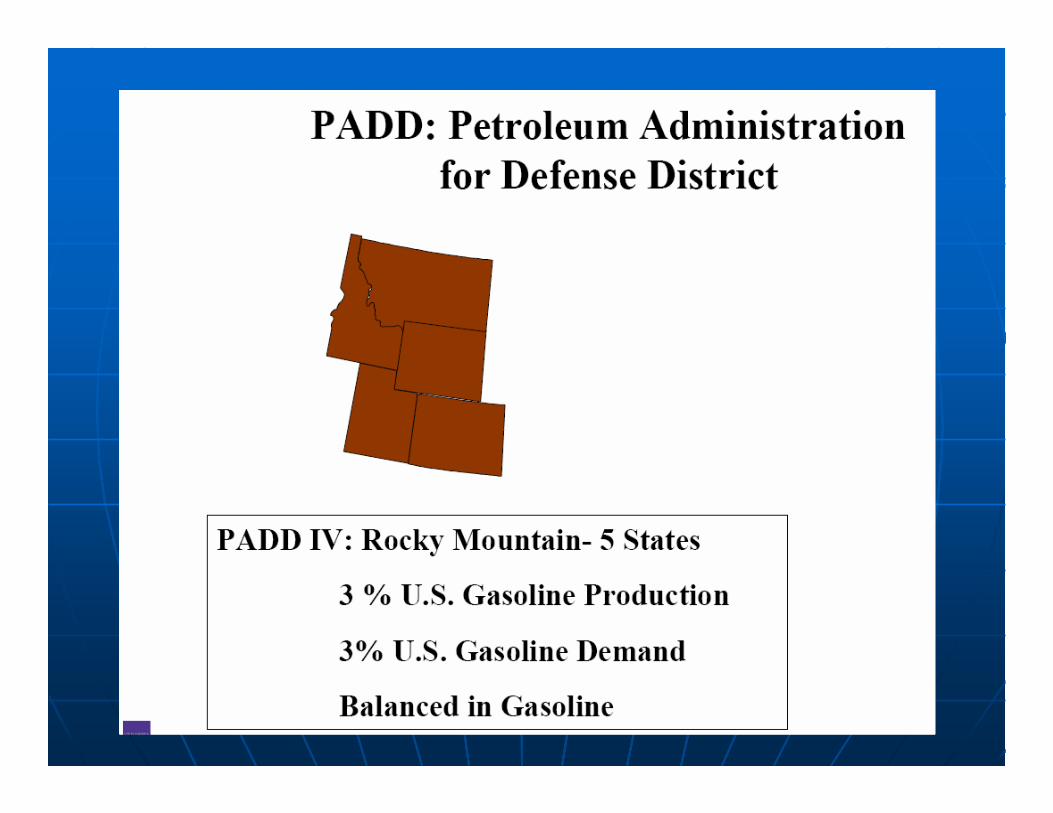
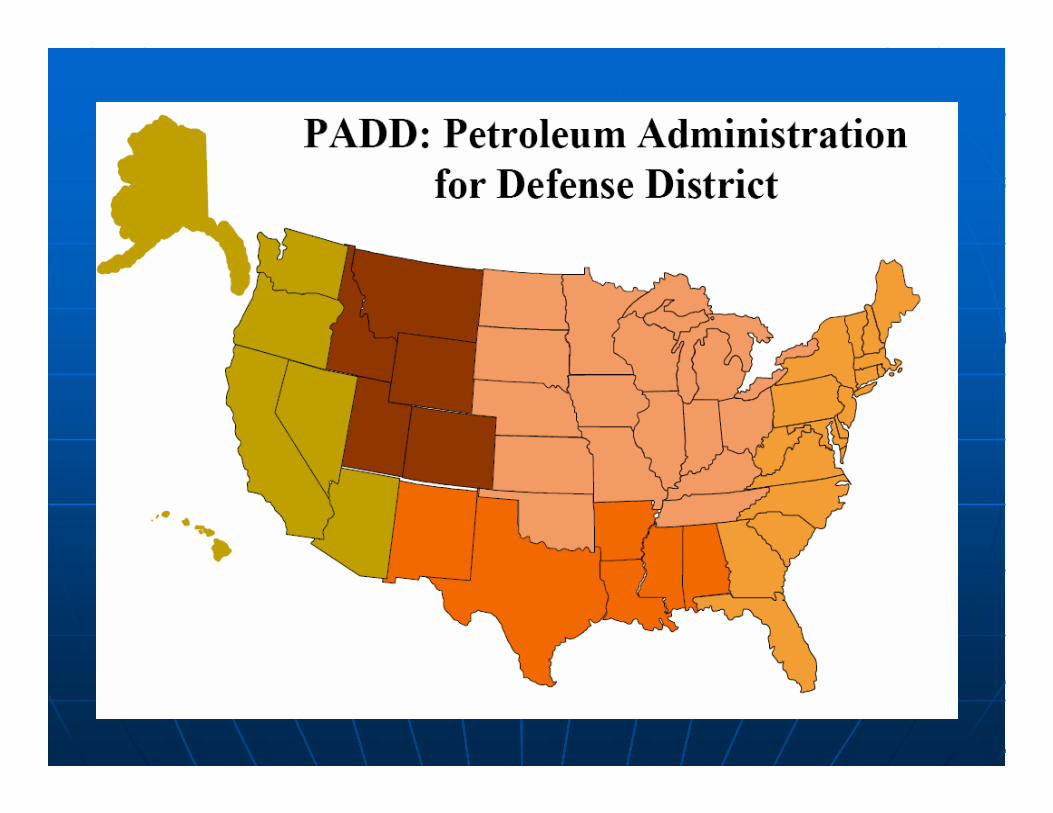
US Petroleum Administration for US Petroleum Administration for Defense DistrictsDefense Districts
Source:www.eia.doe.gov
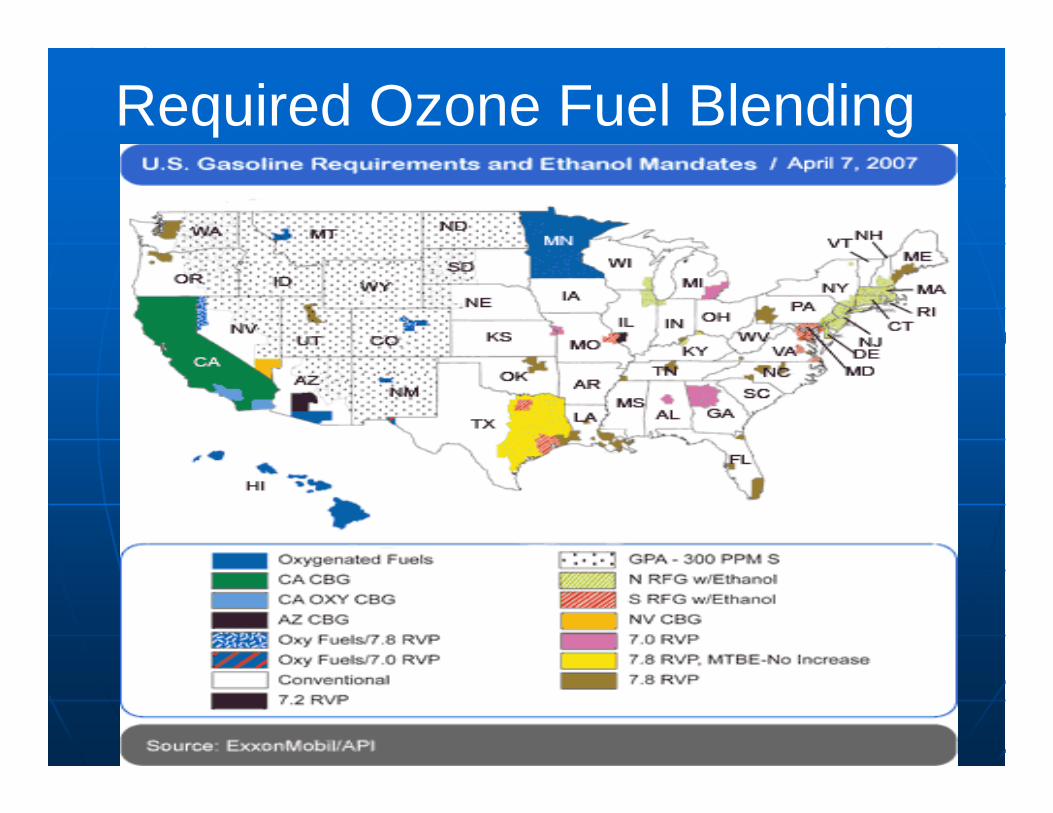
Required Ozone Fuel Blending
Key ConceptsKey Concepts
• The PADD system splits the US into 5 districts
• These districts along with the smog emission controls disrupts the normal flow of supply and demand
• This disruption artificially impacts supply creating shortages and influencing pump prices

Competition & IntegrationCompetition & Integration
Largest U.S. Interstate Pipeline CompaniesLargest U.S. Interstate Pipeline Companies
3,1773,177Marathon Pipeline LLCMarathon Pipeline LLC1010
3,3403,340Enbridge Energy LPEnbridge Energy LP99
3,8253,825Chevron Pipeline Co.Chevron Pipeline Co.88
4,7254,725ExxonMobil Pipeline CompanyExxonMobil Pipeline Company77
5,5885,588Colonial Pipeline Co.Colonial Pipeline Co.66
6,9486,948BP Pipelines North AmericaBP Pipelines North America55
7,1177,117MidMid--American PipelineAmerican Pipeline44
7,9767,976Plains AllPlains All--American Pipeline LPAmerican Pipeline LP33
8,0678,067ConocoPhillips Pipe Line Co.ConocoPhillips Pipe Line Co.22
8,5258,525Magellan Pipeline Co. LLCMagellan Pipeline Co. LLC11
MileageMileageCompanyCompanyRank by Rank by 2005 Mileage2005 Mileage
Ranked in order of 2005 mileage as reported in "SPECIAL REPORT: US gas carriers’ 2005 net incomes climb; construction costs plummet", Oil & Gas Journal, September 11, 2006.
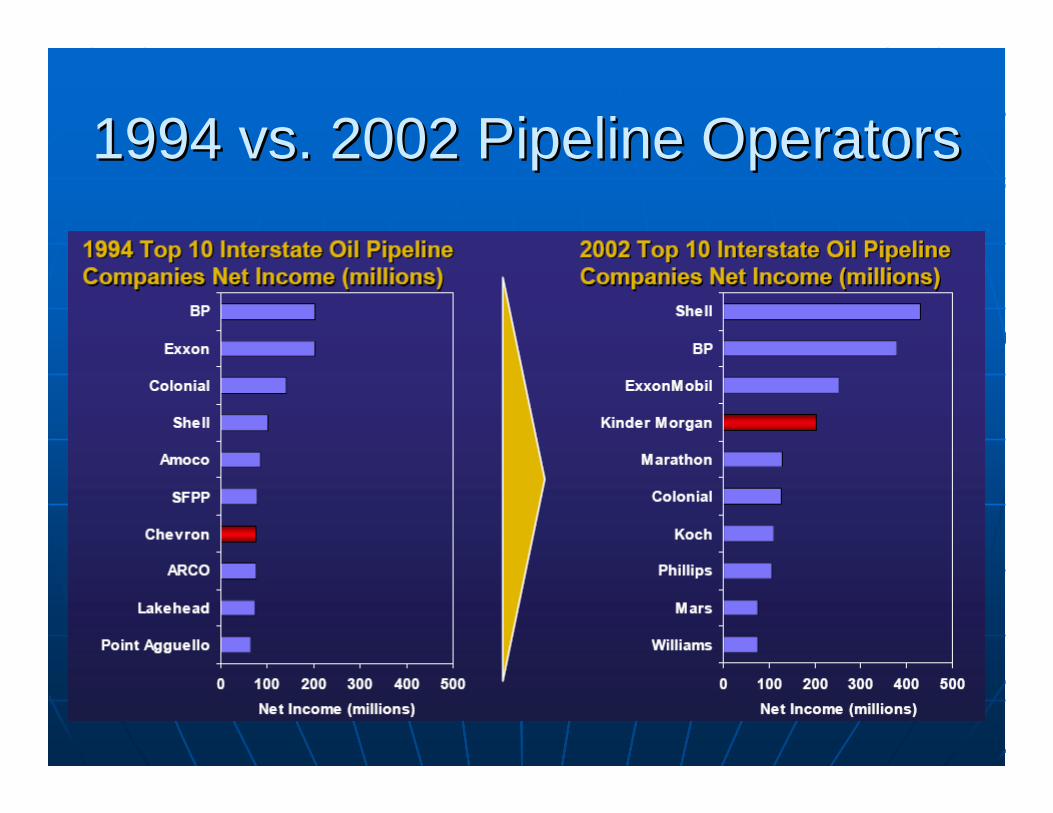
1994 vs. 2002 Pipeline Operators1994 vs. 2002 Pipeline Operators
5,6435,6432,9792,9792,1782,178AR, IN, KY, LA, MS, OH, TN AR, IN, KY, LA, MS, OH, TN SouthwestSouthwestMidwest Midwest Texas Gas Transmission Texas Gas Transmission Corp. Corp.
2,1152,1152,8592,859958958MI, MN, WI MI, MN, WI Canada Canada Midwest Midwest Great Lakes Gas Great Lakes Gas Transmission Co. Transmission Co.
System System MileageMileage
System System Capacity Capacity ((MMcf/dMMcf/d) )
11
Transported Transported (billion cubic (billion cubic dekathermsdekatherms))
States in Which Pipeline Operates States in Which Pipeline Operates Primary Supply Primary Supply RegionsRegions
Market Market Regions Regions ServedServed
Pipeline NamePipeline Name
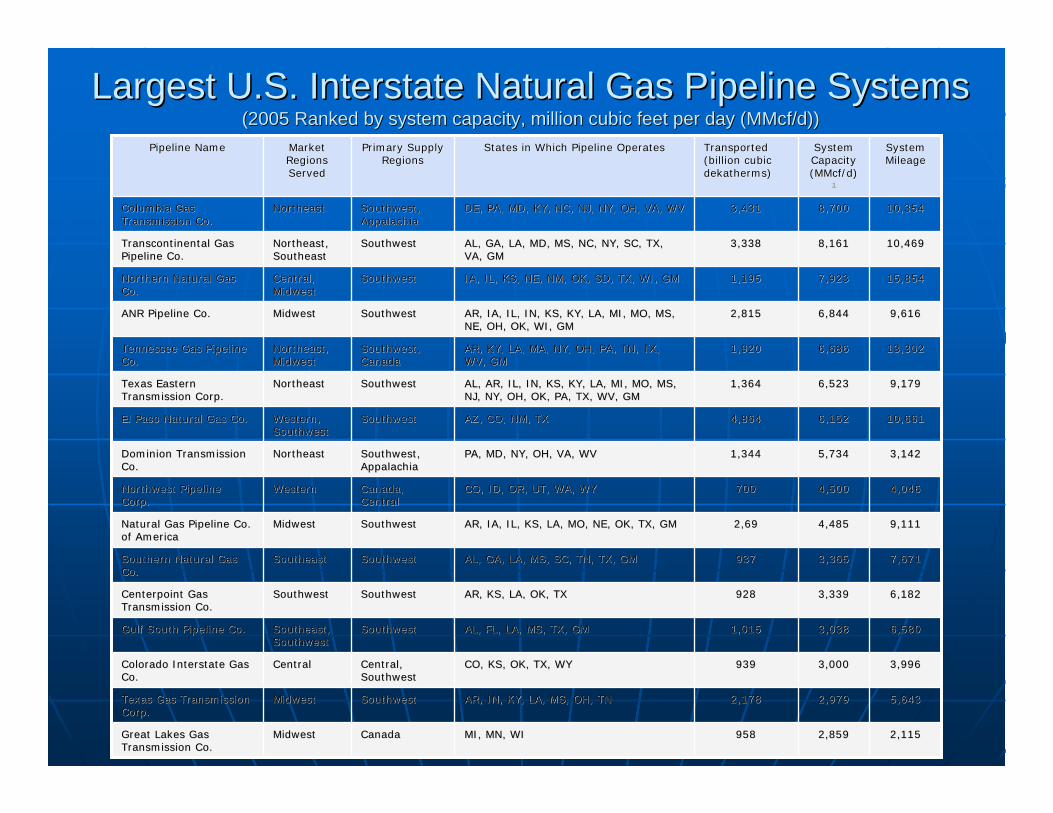
10,35410,3548,7008,7003,4313,431DE, PA, MD, KY, NC, NJ, NY, OH, VA, WV DE, PA, MD, KY, NC, NJ, NY, OH, VA, WV Southwest, Southwest, Appalachia Appalachia
NortheastNortheastColumbia Gas Columbia Gas Transmission Co. Transmission Co.
10,46910,4698,1618,1613,3383,338AL, GA, LA, MD, MS, NC, NY, SC, TX, AL, GA, LA, MD, MS, NC, NY, SC, TX, VA, GM VA, GM
SouthwestSouthwestNortheast, Northeast, SoutheastSoutheast
Transcontinental Gas Transcontinental Gas Pipeline Co.Pipeline Co.
15,85415,8547,9237,9231,1951,195IA, IL, KS, NE, NM, OK, SD, TX, WI, GM IA, IL, KS, NE, NM, OK, SD, TX, WI, GM SouthwestSouthwestCentral, Central, Midwest Midwest
Northern Natural Gas Northern Natural Gas Co. Co.
9,6169,6166,8446,8442,8152,815AR, IA, IL, IN, KS, KY, LA, MI, MO, MS, AR, IA, IL, IN, KS, KY, LA, MI, MO, MS, NE, OH, OK, WI, GM NE, OH, OK, WI, GM
SouthwestSouthwestMidwest Midwest ANR Pipeline Co. ANR Pipeline Co.
13,30213,3026,6866,6861,9201,920AR, KY, LA, MA, NY, OH, PA, TN, TX, AR, KY, LA, MA, NY, OH, PA, TN, TX, WV, GMWV, GM
Southwest,Southwest,Canada Canada
Northeast, Northeast, Midwest Midwest
Tennessee Gas Pipeline Tennessee Gas Pipeline Co. Co.
9,1799,1796,5236,5231,3641,364AL, AR, IL, IN, KS, KY, LA, MI, MO, MS, AL, AR, IL, IN, KS, KY, LA, MI, MO, MS, NJ, NY, OH, OK, PA, TX, WV, GM NJ, NY, OH, OK, PA, TX, WV, GM
SouthwestSouthwestNortheastNortheastTexas Eastern Texas Eastern Transmission Corp. Transmission Corp.
10,66110,6616,1526,1524,8644,864AZ, CO, NM, TXAZ, CO, NM, TXSouthwestSouthwestWestern, Western, SouthwestSouthwest
El Paso Natural Gas Co. El Paso Natural Gas Co.
3,1423,1425,7345,7341,3441,344PA, MD, NY, OH, VA, WV PA, MD, NY, OH, VA, WV Southwest, Southwest, Appalachia Appalachia
NortheastNortheastDominion Transmission Dominion Transmission Co. Co.
4,0464,0464,5004,500700700CO, ID, OR, UT, WA, WY CO, ID, OR, UT, WA, WY Canada, Canada, CentralCentral
WesternWesternNorthwest Pipeline Northwest Pipeline Corp. Corp.
9,1119,1114,4854,4852,692,69AR, IA, IL, KS, LA, MO, NE, OK, TX, GM AR, IA, IL, KS, LA, MO, NE, OK, TX, GM SouthwestSouthwestMidwest Midwest Natural Gas Pipeline Co. Natural Gas Pipeline Co. of America of America
7,6717,6713,3653,365937937AL, GA, LA, MS, SC, TN, TX, GMAL, GA, LA, MS, SC, TN, TX, GMSouthwestSouthwestSoutheastSoutheastSouthern Natural Gas Southern Natural Gas Co.Co.
6,1826,1823,3393,339928928AR, KS, LA, OK, TXAR, KS, LA, OK, TXSouthwestSouthwestSouthwestSouthwestCenterpointCenterpoint Gas Gas Transmission Co. Transmission Co.
6,5806,5803,0383,0381,0151,015AL, FL, LA, MS, TX, GMAL, FL, LA, MS, TX, GMSouthwestSouthwestSoutheast, Southeast, SouthwestSouthwest
Gulf South Pipeline Co. Gulf South Pipeline Co.
3,9963,9963,0003,000939939CO, KS, OK, TX, WYCO, KS, OK, TX, WYCentral, Central, SouthwestSouthwest
CentralCentralColorado Interstate Gas Colorado Interstate Gas Co.Co.
Largest U.S. Interstate Natural Gas Pipeline SystemsLargest U.S. Interstate Natural Gas Pipeline Systems(2005 Ranked by system capacity, million cubic feet per day ((2005 Ranked by system capacity, million cubic feet per day (MMcf/dMMcf/d))))
System System MileageMileage
System System Capacity Capacity
((MMcf/dMMcf/d) ) 11
Transported Transported (billion (billion cubic cubic dekathermsdekatherms))
States in Which States in Which Pipeline Operates Pipeline Operates
Primary Primary Supply Supply RegionsRegions
Market Market Regions Regions ServedServed
Pipeline NamePipeline Name
TotalTotal
Other Interstate Systems Other Interstate Systems (79)(79)
SubSub--totaltotal
TrunklineTrunkline Gas Co.Gas Co.
High Island Offshore High Island Offshore SystemSystem
Kern River Gas Kern River Gas Transmission Co.Transmission Co.
Wyoming Interstate Gas Wyoming Interstate Gas Co.Co.
Alliance Pipeline Co. (US)Alliance Pipeline Co. (US)
Columbia Gulf Columbia Gulf Transmission Co.Transmission Co.
Algonquin Gas Algonquin Gas Transmission Co.Transmission Co.
Florida Gas Transmission Florida Gas Transmission Co.Co.
QuestarQuestar Pipeline Co.Pipeline Co.
National Fuel Gas Supply National Fuel Gas Supply Co.Co.
Southern Star Central Southern Star Central Pipeline Co.Pipeline Co.
Northern Border Pipeline Northern Border Pipeline Co.Co.
Gas Transmission Gas Transmission Northwest Corp.Northwest Corp.
Panhandle Eastern Pipeline Panhandle Eastern Pipeline Co. Co.
-- --
Midwest Midwest
SouthwestSouthwest
WesternWestern
CentralCentral
Midwest Midwest
Southeast, Southeast, NortheastNortheast
NortheastNortheast
SoutheastSoutheast
CentralCentral
NortheastNortheast
CentralCentral
Midwest, Midwest, CentralCentral
WesternWestern
Midwest Midwest
-- --
SouthwestSouthwest
Gulf of Mexico Gulf of Mexico
CentralCentral
CentralCentral
Canada Canada
SouthwestSouthwest
SouthwestSouthwest
SouthwestSouthwest
CentralCentral
Canada, Canada, Appalachia Appalachia
CentralCentral
Canada Canada
Canada Canada
SouthwestSouthwest
-- --
AR, IL, IN, KY, LA, MS, AR, IL, IN, KY, LA, MS, OH, TN, TX OH, TN, TX
LA, GMLA, GM
CA, NV, UT, WYCA, NV, UT, WY
CO, WYCO, WY
ND, MN, IA, ILND, MN, IA, IL
KY, LA, MS, TN, GMKY, LA, MS, TN, GM
CT, MA, NJ, NY, RI CT, MA, NJ, NY, RI
AL, FL, LA, MS, TX, GMAL, FL, LA, MS, TX, GM
CO, UT, WYCO, UT, WY
NY, PANY, PA
CO, KS, MO, NE, OK, CO, KS, MO, NE, OK, TX, WYTX, WY
IA, IL, IN, MN, MT, ND, IA, IL, IN, MN, MT, ND, SDSD
ID, OR, WAID, OR, WA
IL, IN, KS, MI, MO, OH, IL, IN, KS, MI, MO, OH, OK, TXOK, TX
47,64047,640
10,24210,242
37,39837,398
606606
234234
718718
594594
652652
2,0412,041
346346
757757
379379
417417
354354
898898
767767
709709
148,333148,333
33,23533,235
115,098115,098
1,6801,680
1,8001,800
1,8331,833
1,9971,997
2,0532,053
2,1562,156
2,1742,174
2,1902,190
2,1922,192
2,3122,312
2,4512,451
2,4962,496
2,6362,636
2,8402,840
212,687212,687
49,53149,531
163,156163,156
3,5583,558
212212
1,6801,680
585585
888888
4,1054,105
1,1031,103
4,8674,867
1,7451,745
1,5041,504
5,7885,788
1,3991,399
1,3561,356
6,4456,445
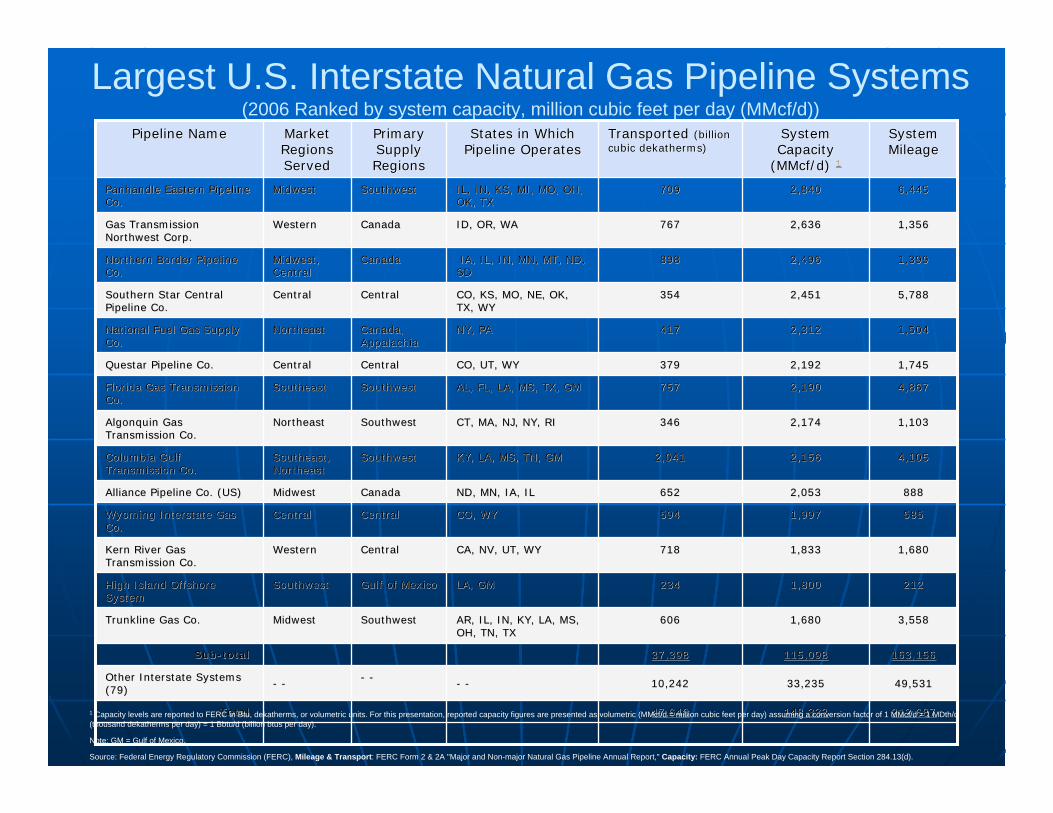
Largest U.S. Interstate Natural Gas Pipeline Systems(2006 Ranked by system capacity, million cubic feet per day (MMcf/d))
1 Capacity levels are reported to FERC in Btu, dekatherms, or volumetric units. For this presentation, reported capacity figures are presented as volumetric (MMcf/d = million cubic feet per day) assuming a conversion factor of 1 MMcf/d = 1 MDth/d(thousand dekatherms per day) = 1 Bbtu/d (billion btus per day).
Note: GM = Gulf of Mexico.
Source: Federal Energy Regulatory Commission (FERC), Mileage & Transport: FERC Form 2 & 2A "Major and Non-major Natural Gas Pipeline Annual Report," Capacity: FERC Annual Peak Day Capacity Report Section 284.13(d).
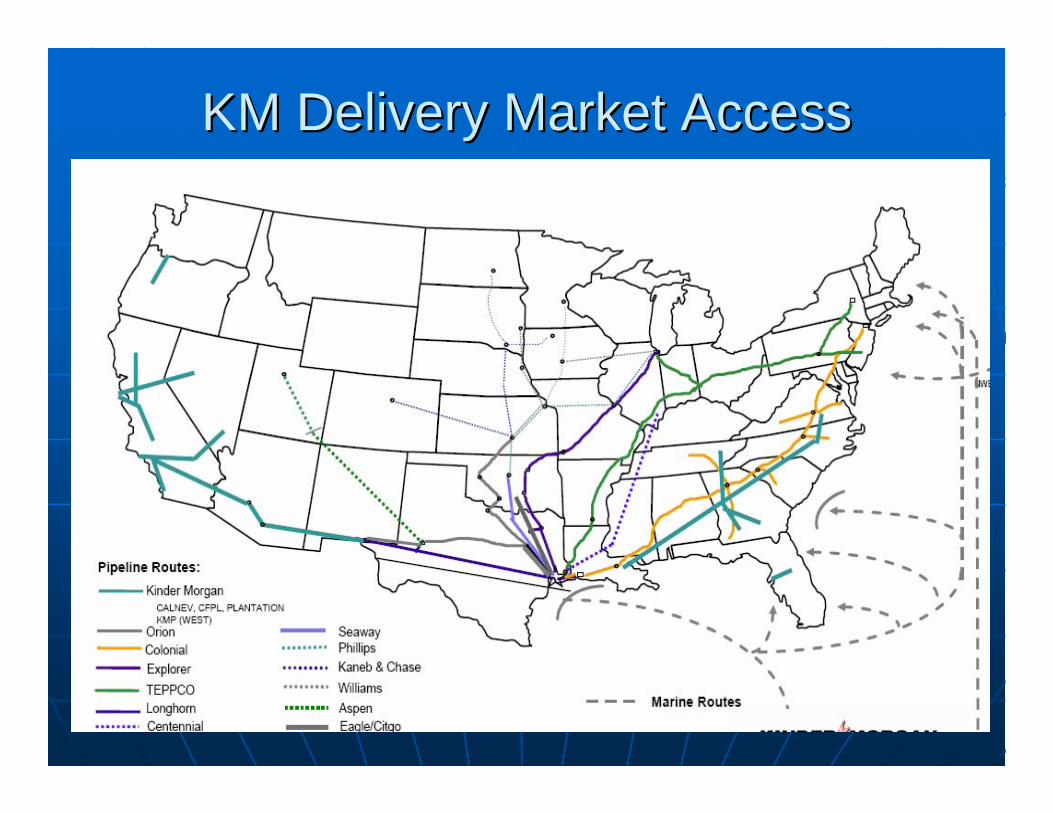
KM Delivery Market AccessKM Delivery Market Access
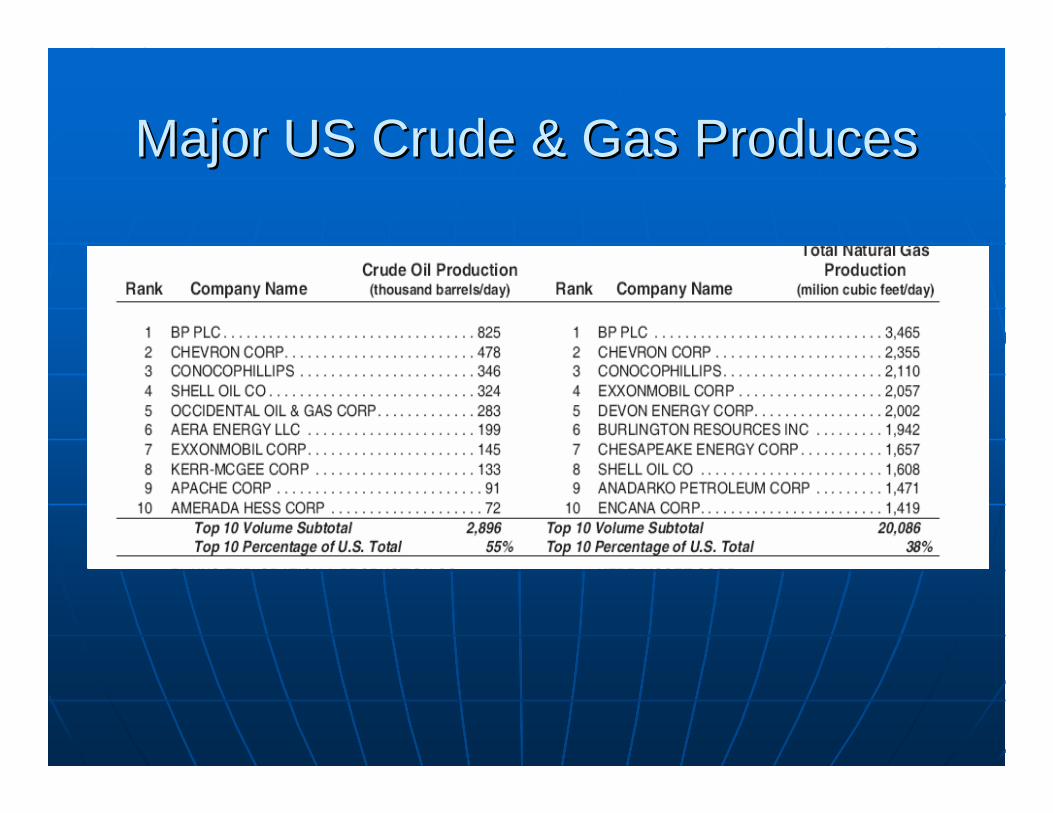
Major US Crude & Gas ProducesMajor US Crude & Gas Produces
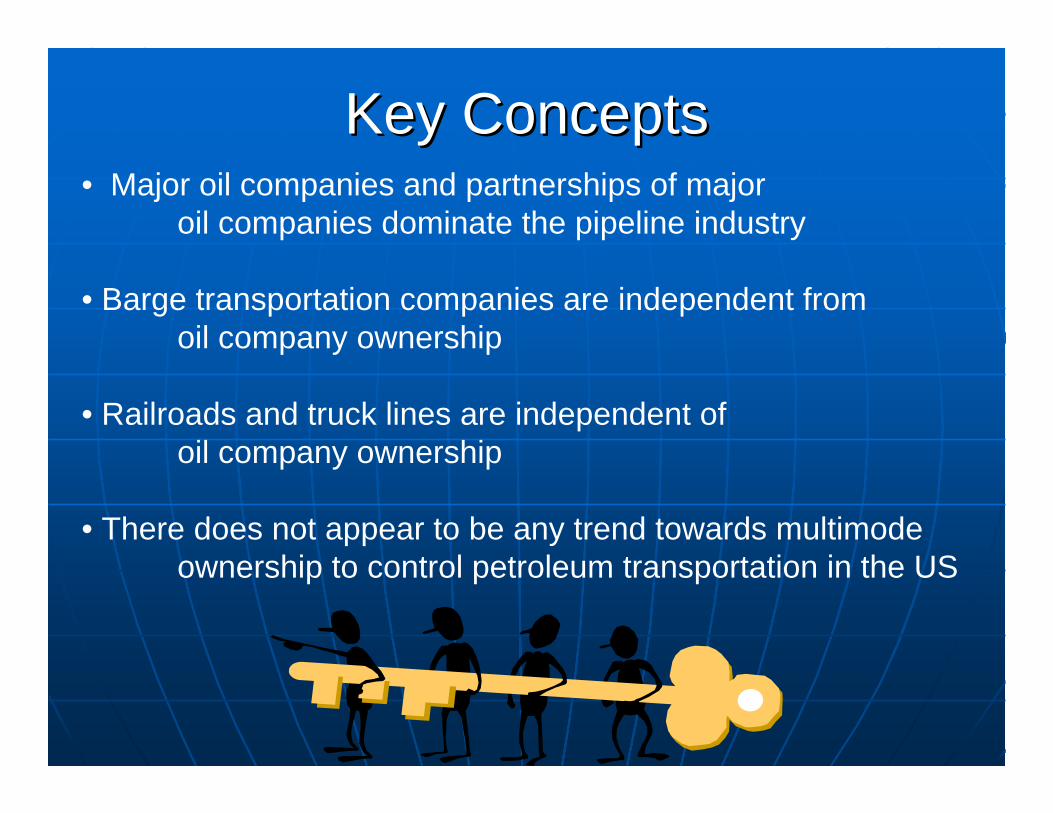
Key ConceptsKey Concepts• Major oil companies and partnerships of major
oil companies dominate the pipeline industry
• Barge transportation companies are independent from oil company ownership
• Railroads and truck lines are independent of oil company ownership
• There does not appear to be any trend towards multimode ownership to control petroleum transportation in the US
Ethanol and Bio dieselEthanol and Bio diesel
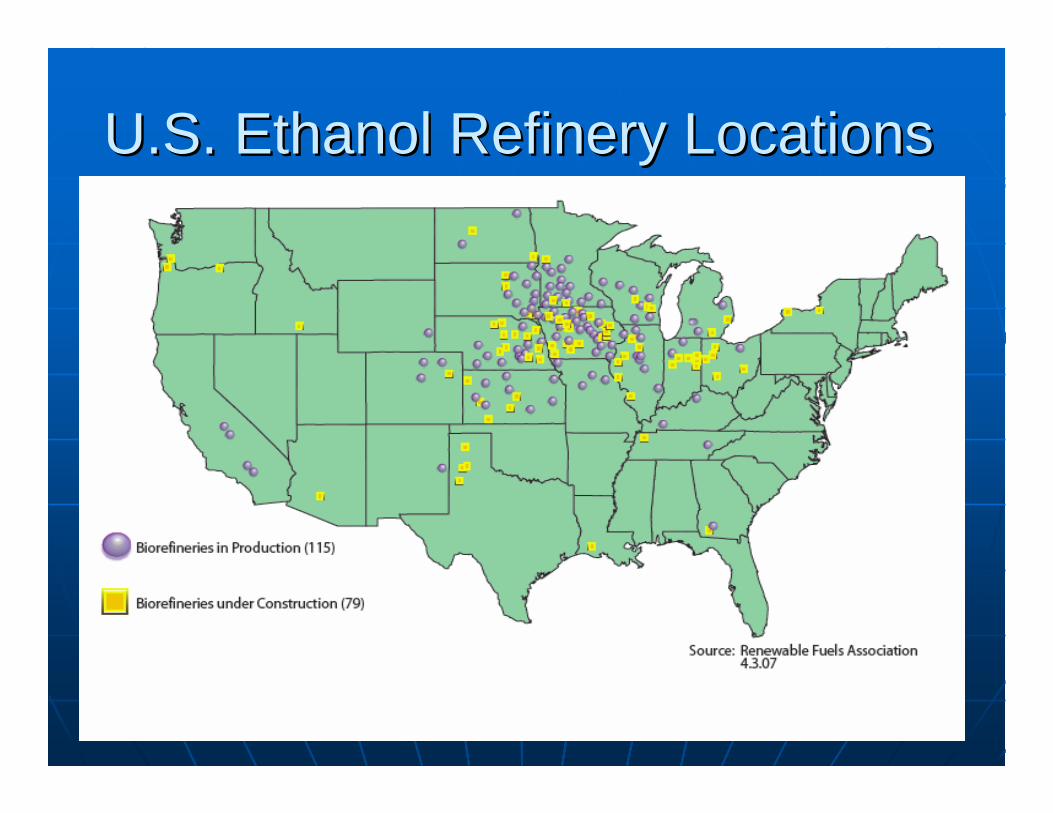
U.S. Ethanol Refinery LocationsU.S. Ethanol Refinery Locations
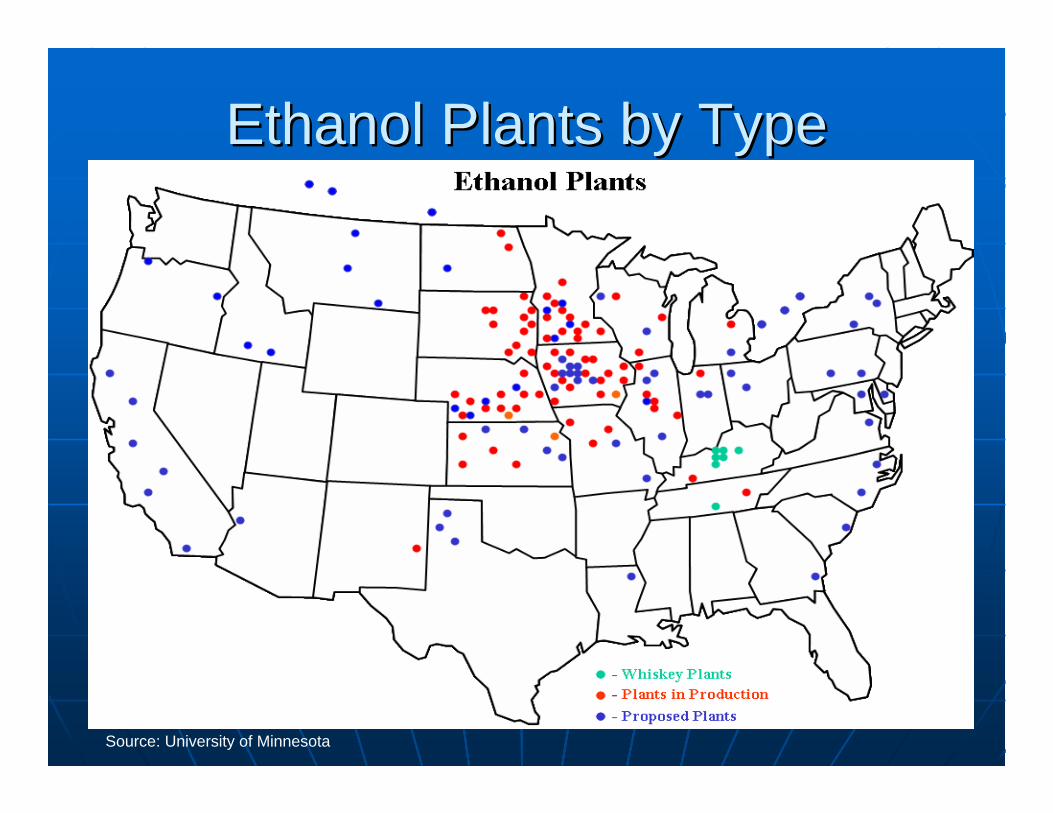
Ethanol Plants by TypeEthanol Plants by Type
Source: University of Minnesota
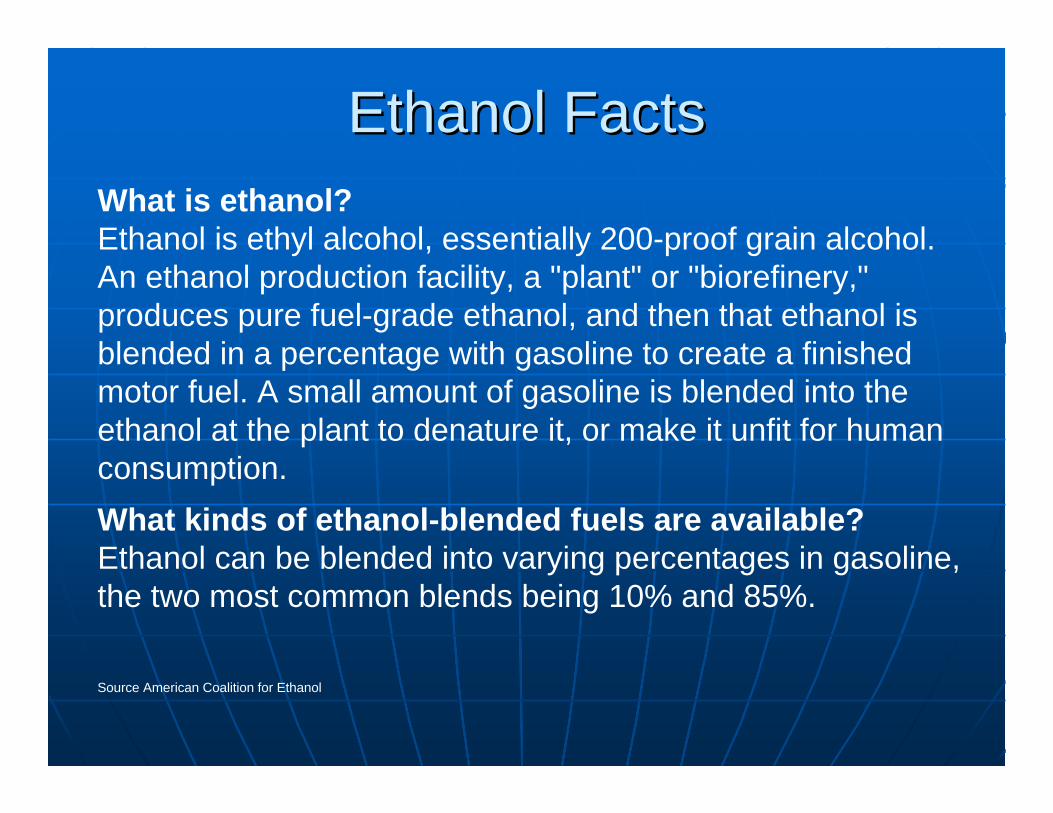
Ethanol FactsEthanol FactsWhat is ethanol?Ethanol is ethyl alcohol, essentially 200-proof grain alcohol. An ethanol production facility, a "plant" or "biorefinery," produces pure fuel-grade ethanol, and then that ethanol is blended in a percentage with gasoline to create a finished motor fuel. A small amount of gasoline is blended into the ethanol at the plant to denature it, or make it unfit for human consumption. What kinds of ethanol-blended fuels are available?Ethanol can be blended into varying percentages in gasoline, the two most common blends being 10% and 85%.
Source American Coalition for Ethanol
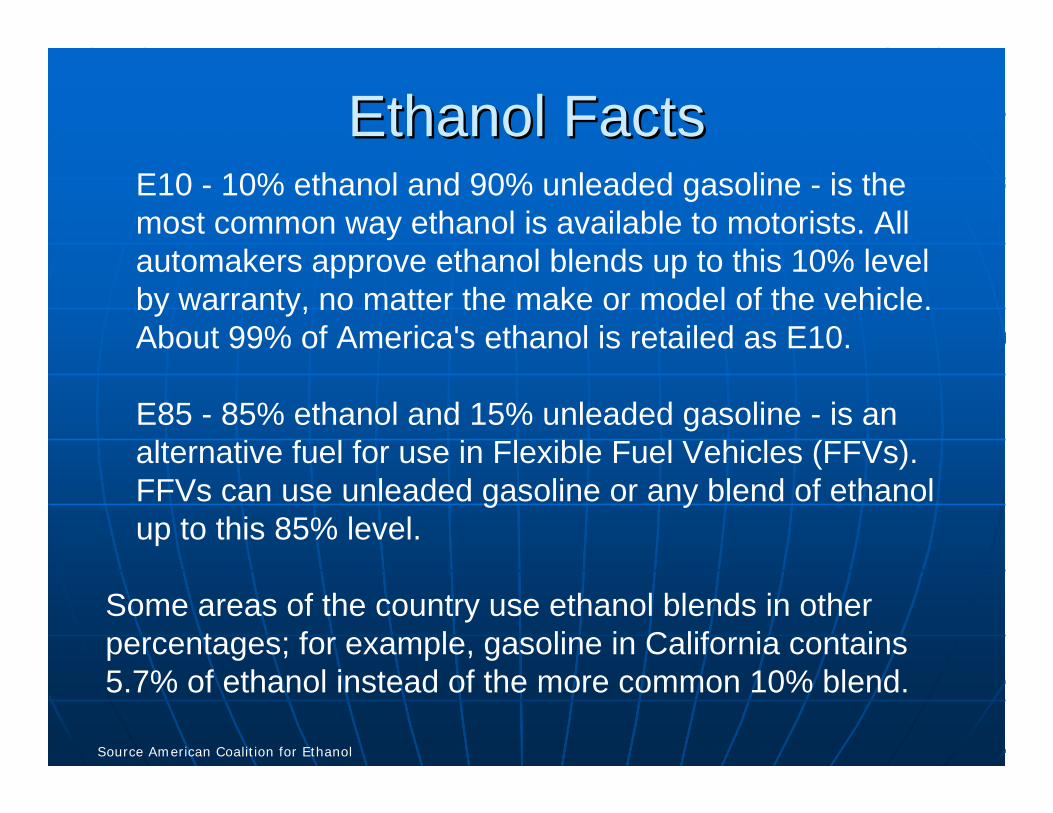
Ethanol FactsEthanol FactsE10 - 10% ethanol and 90% unleaded gasoline - is the most common way ethanol is available to motorists. All automakers approve ethanol blends up to this 10% level by warranty, no matter the make or model of the vehicle. About 99% of America's ethanol is retailed as E10.
E85 - 85% ethanol and 15% unleaded gasoline - is an alternative fuel for use in Flexible Fuel Vehicles (FFVs). FFVs can use unleaded gasoline or any blend of ethanol up to this 85% level.
Some areas of the country use ethanol blends in other percentages; for example, gasoline in California contains 5.7% of ethanol instead of the more common 10% blend.
Source American Coalition for Ethanol
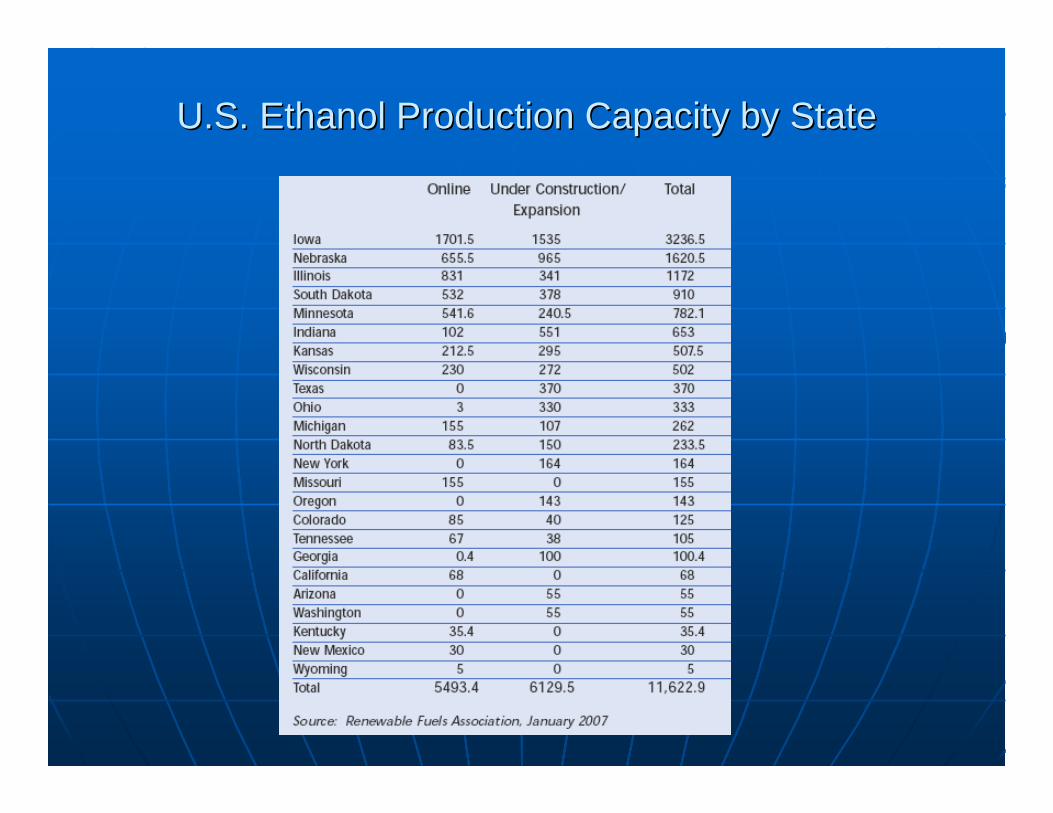
U.S. Ethanol Production Capacity by StateU.S. Ethanol Production Capacity by State
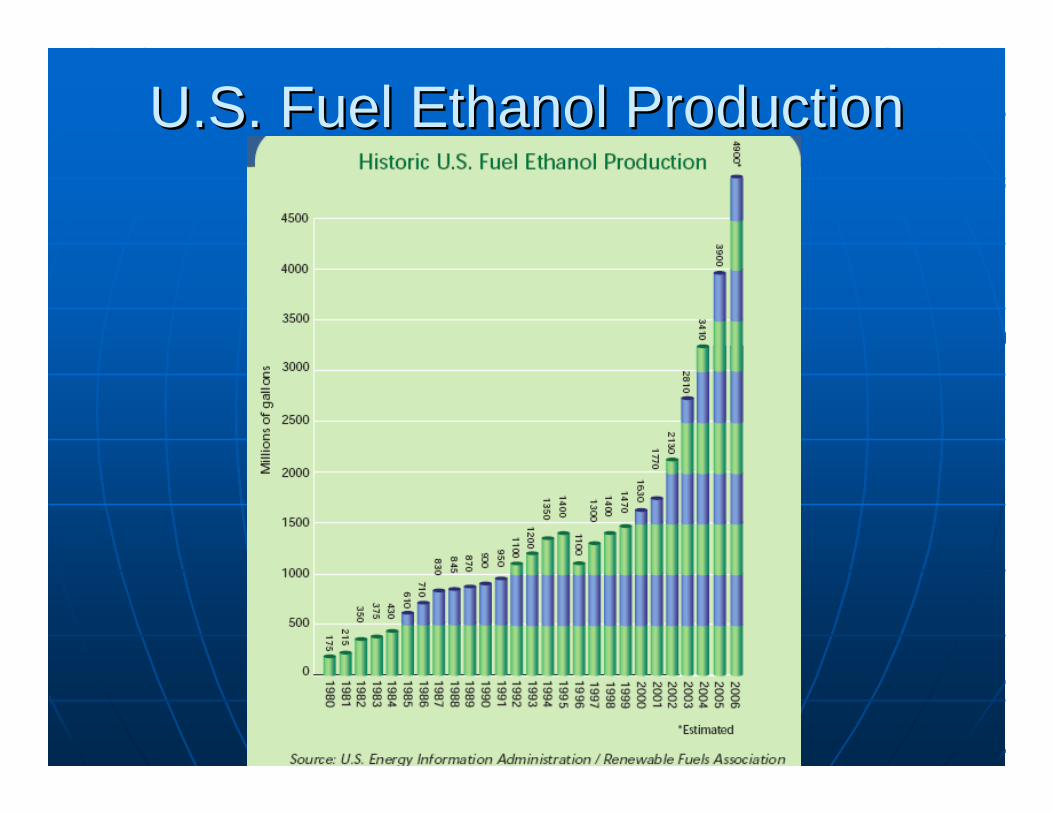
U.S. Fuel Ethanol ProductionU.S. Fuel Ethanol Production
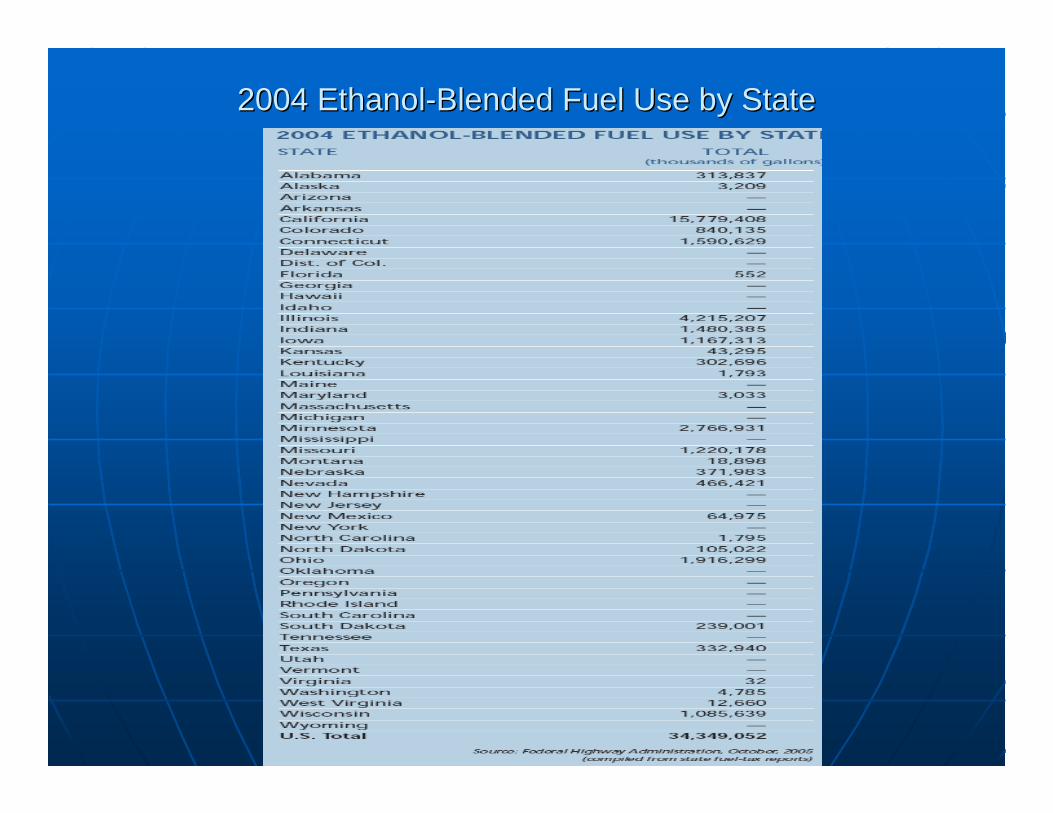
2004 Ethanol2004 Ethanol--Blended Fuel Use by StateBlended Fuel Use by State
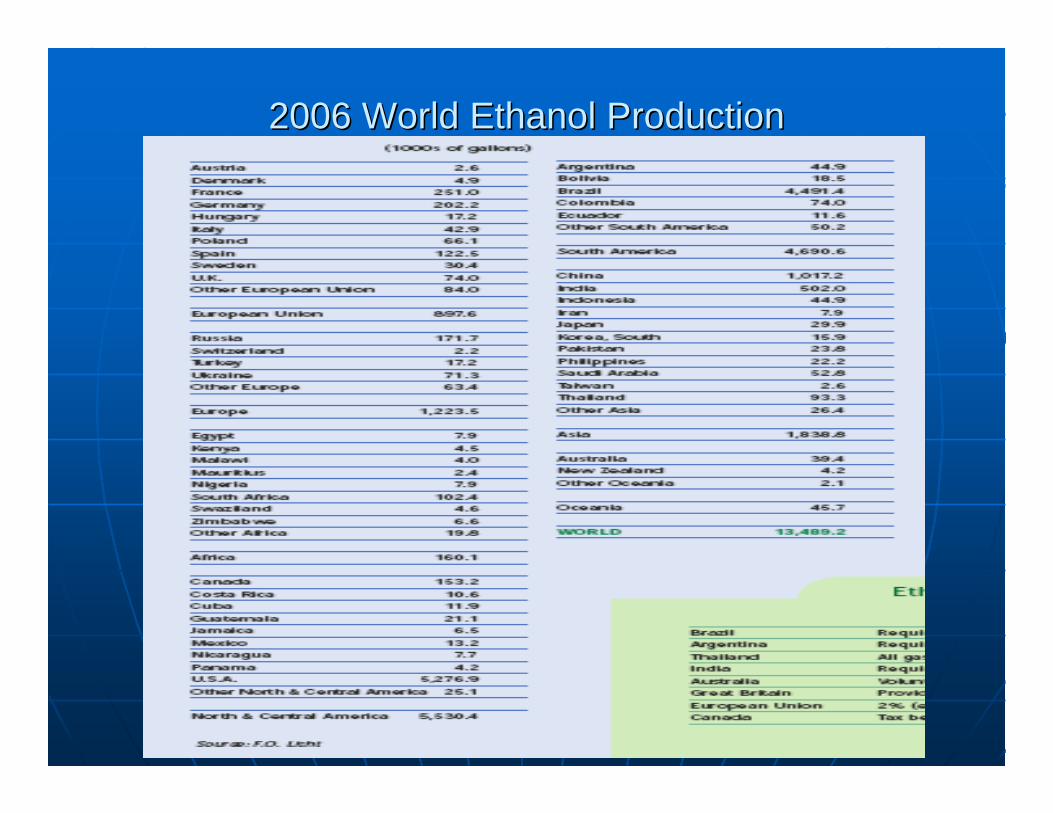
2006 World Ethanol Production2006 World Ethanol Production
Ethanol Industry OverviewEthanol Industry OverviewIn 2006, 110 ethanol plants in 21 states produced a record 5.2 billion gallons of ethanol—nearly double the amount produced in 2000.
Source: ethanolfacts.com; ethanol.org
In 2006, the U.S. produced about 5.2 billion gallons of ethanol. The nations' annual consumption of gasoline is approximately 140 billion gallons.
In 2005, 14 percent of the U.S. corn crop went for ethanol production, and for the '06 crop that figure is expected to rise to 20 percent.
Ethanol ProjectionsEthanol Projections
The US Congress passed a bill requiring that by 2012 5.1 billion gallons (BGY) of ethanol will be available as useable fuels in the US.
Source: ethanolfacts.com; ethanol.org
Pipeline and truck shipments are not considered to be an economically means of transport due to special handling regulations.
U S ethanol is produced from corn that is transported to Ethanol plants by truck not rail.
Demand and PlanningDemand and PlanningThe majority of the logistic obstacles to ethanol distributions can be overcome given adequate planning and sufficient capital investments. The question becomes one of the potential of return on such an investment.
Source: ethanolfacts.com; ethanol.org
Significant investments are required in that the source of the input materials corn are predominantly in the Midwest while the demand markets are on the east and west coasts .
One of the major demand areas is California that has been mandated to replace MTBE (an imported product exempt from the Jones Act) with ethanol.
Water TransportWater Transport
Source: eia Energy Information Administration
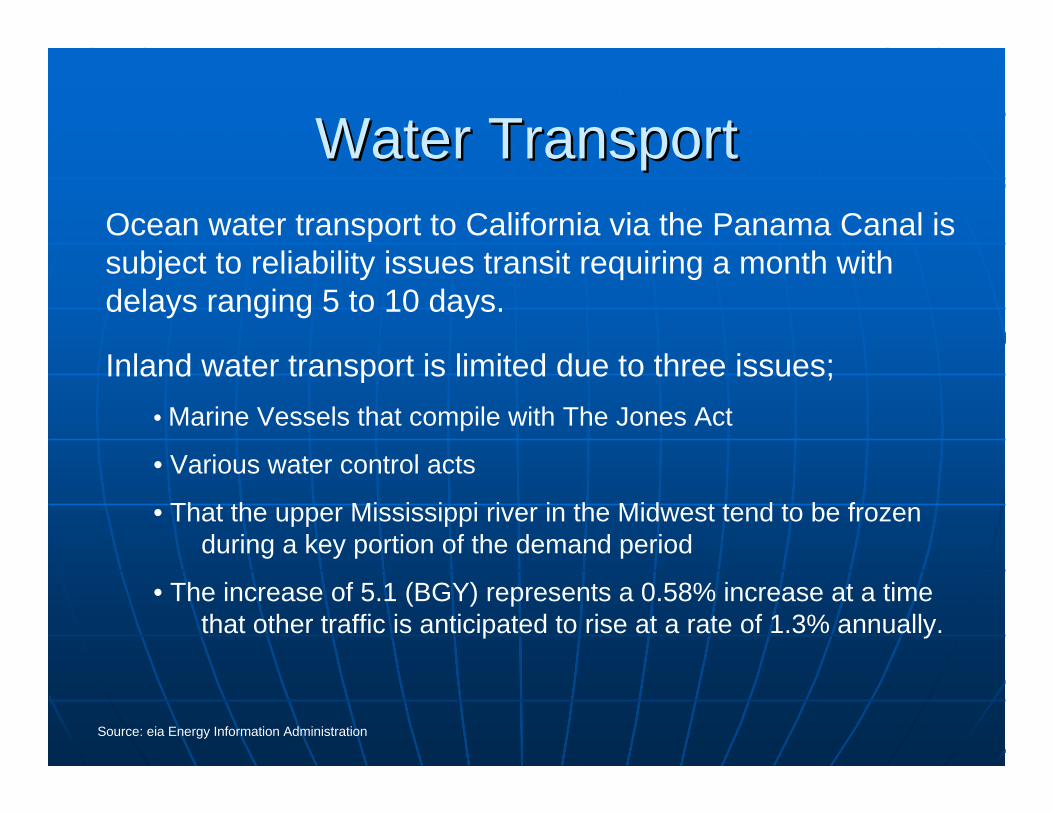
Ocean water transport to California via the Panama Canal is subject to reliability issues transit requiring a month with delays ranging 5 to 10 days.
Inland water transport is limited due to three issues;• Marine Vessels that compile with The Jones Act
• Various water control acts
• That the upper Mississippi river in the Midwest tend to be frozen during a key portion of the demand period
• The increase of 5.1 (BGY) represents a 0.58% increase at a timethat other traffic is anticipated to rise at a rate of 1.3% annually.
Rail TransportRail Transport
Source: eia Energy Information Administration
AAR Association of American Railroads
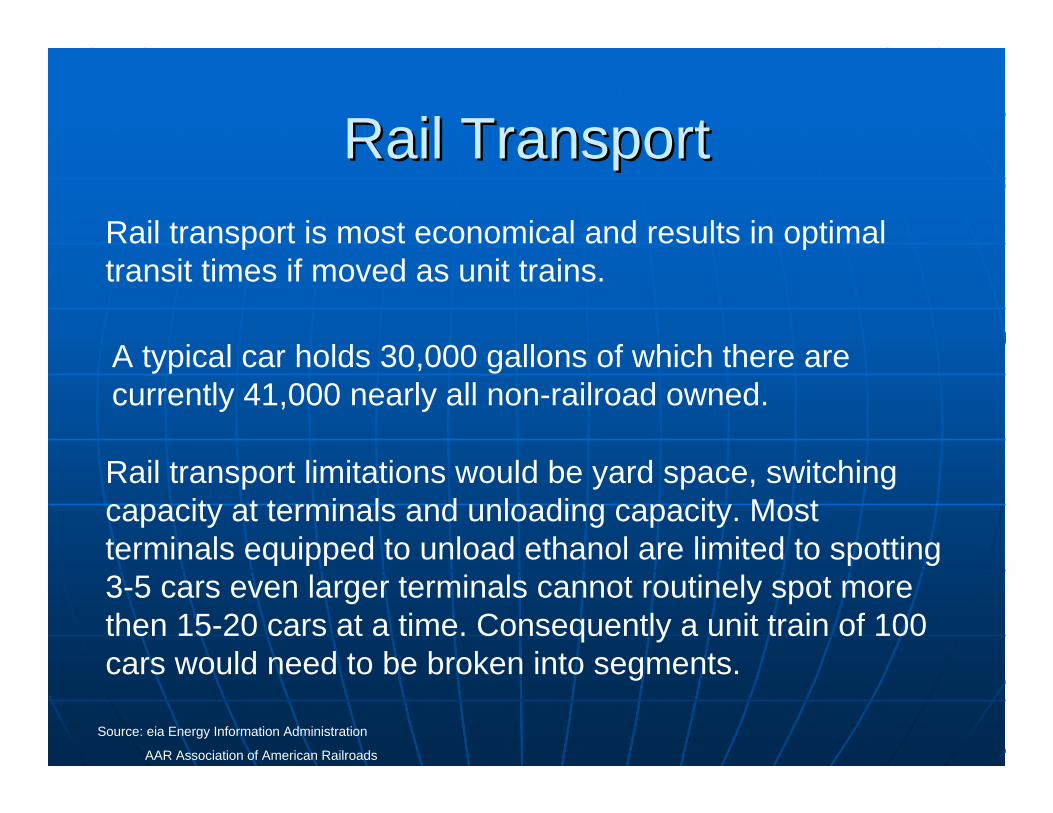
Rail transport limitations would be yard space, switching capacity at terminals and unloading capacity. Most terminals equipped to unload ethanol are limited to spotting 3-5 cars even larger terminals cannot routinely spot more then 15-20 cars at a time. Consequently a unit train of 100 cars would need to be broken into segments.
Rail transport is most economical and results in optimal transit times if moved as unit trains.
A typical car holds 30,000 gallons of which there are currently 41,000 nearly all non-railroad owned.
Rail TransportRail Transport
Source: eia Energy Information Administration
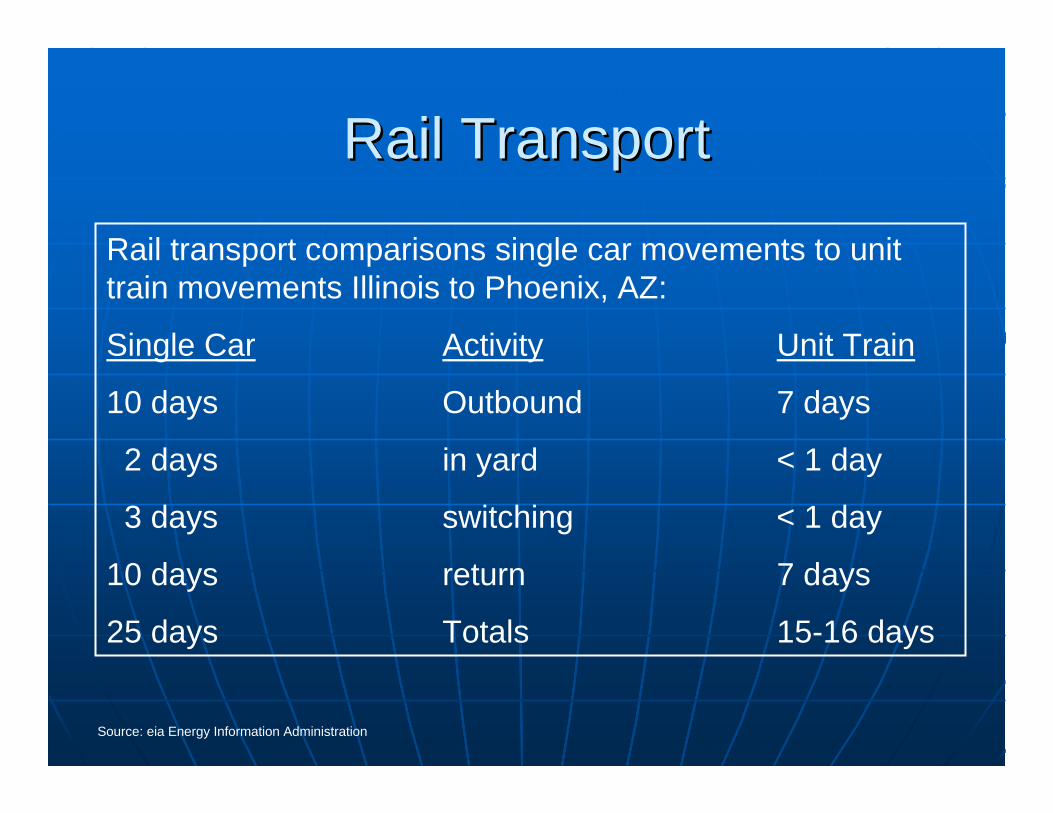
Rail transport comparisons single car movements to unit train movements Illinois to Phoenix, AZ:
Single Car Activity Unit Train
10 days Outbound 7 days
2 days in yard < 1 day
3 days switching < 1 day
10 days return 7 days
25 days Totals 15-16 days
Ethanol Transportation CostsEthanol Transportation Costs
Source: eia Energy Information Administration
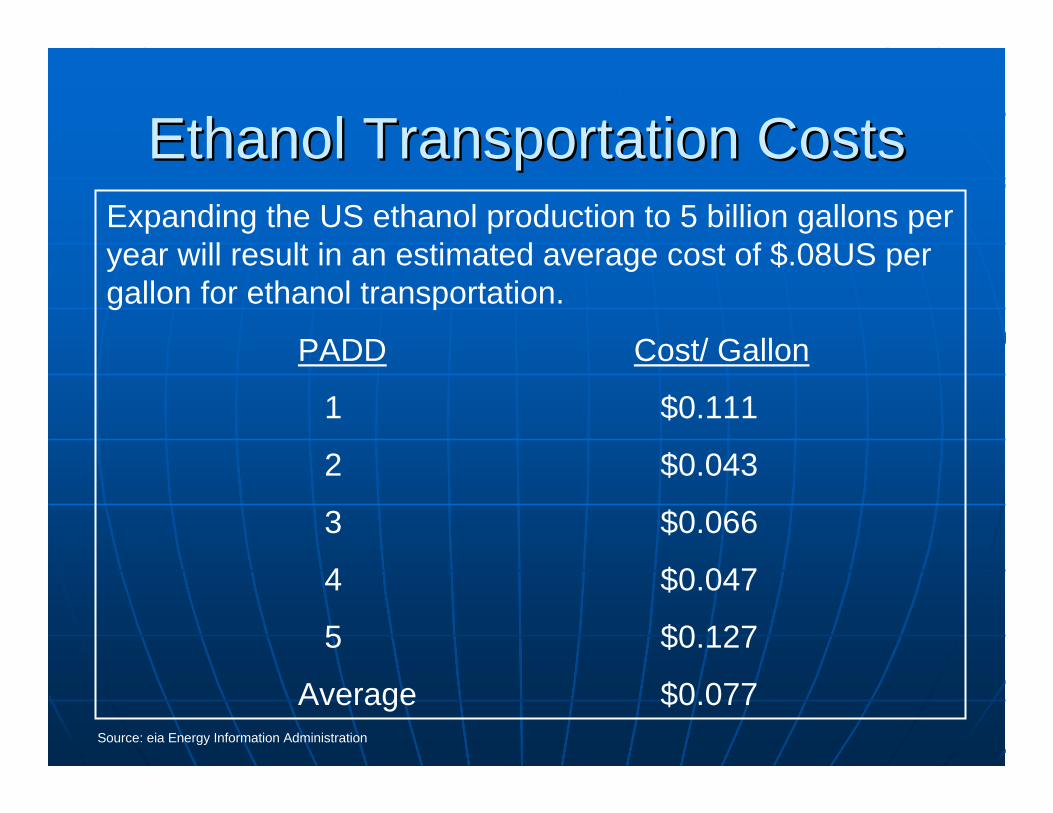
Expanding the US ethanol production to 5 billion gallons per year will result in an estimated average cost of $.08US per gallon for ethanol transportation.
PADD Cost/ Gallon
1 $0.111
2 $0.043
3 $0.066
4 $0.047
5 $0.127
Average $0.077
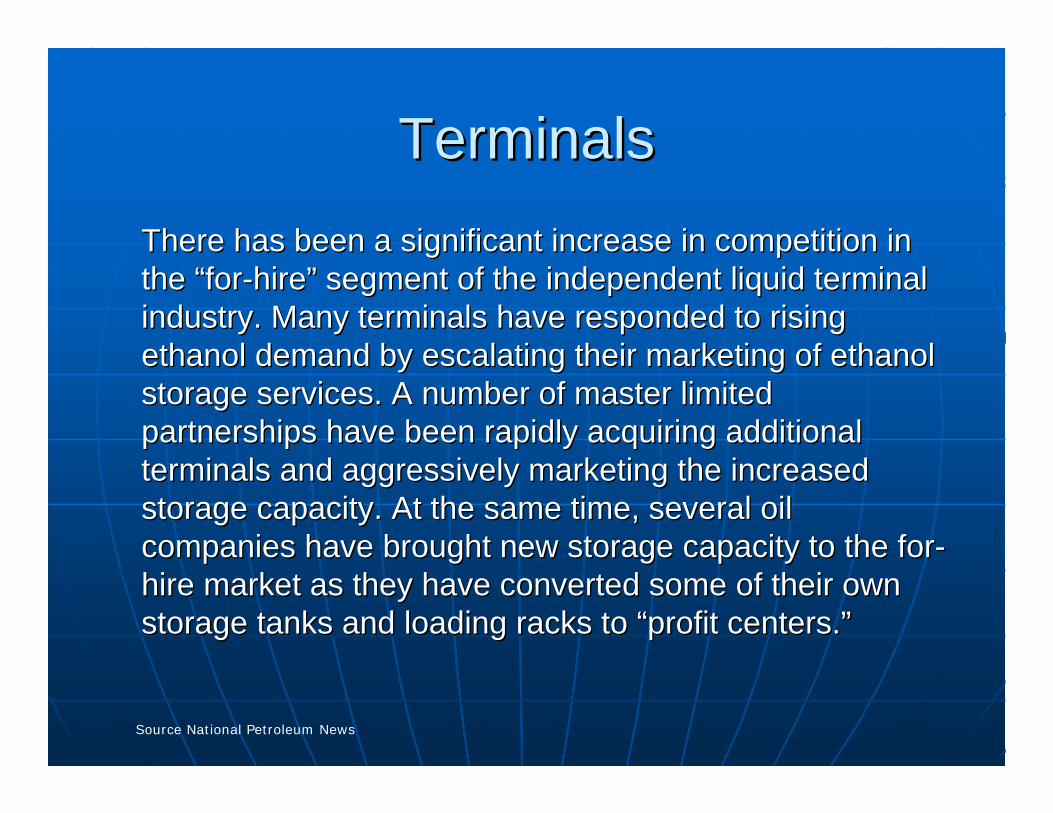
TerminalsTerminalsThere has been a significant increase in competition in There has been a significant increase in competition in the the ““forfor--hirehire”” segment of the independent liquid terminal segment of the independent liquid terminal industry. Many terminals have responded to rising industry. Many terminals have responded to rising ethanol demand by escalating their marketing of ethanol ethanol demand by escalating their marketing of ethanol storage services. A number of master limited storage services. A number of master limited partnerships have been rapidly acquiring additional partnerships have been rapidly acquiring additional terminals and aggressively marketing the increased terminals and aggressively marketing the increased storage capacity. At the same time, several oil storage capacity. At the same time, several oil companies have brought new storage capacity to the forcompanies have brought new storage capacity to the for--hire market as they have converted some of their own hire market as they have converted some of their own storage tanks and loading racks to storage tanks and loading racks to ““profit centers.profit centers.””
Source National Petroleum News
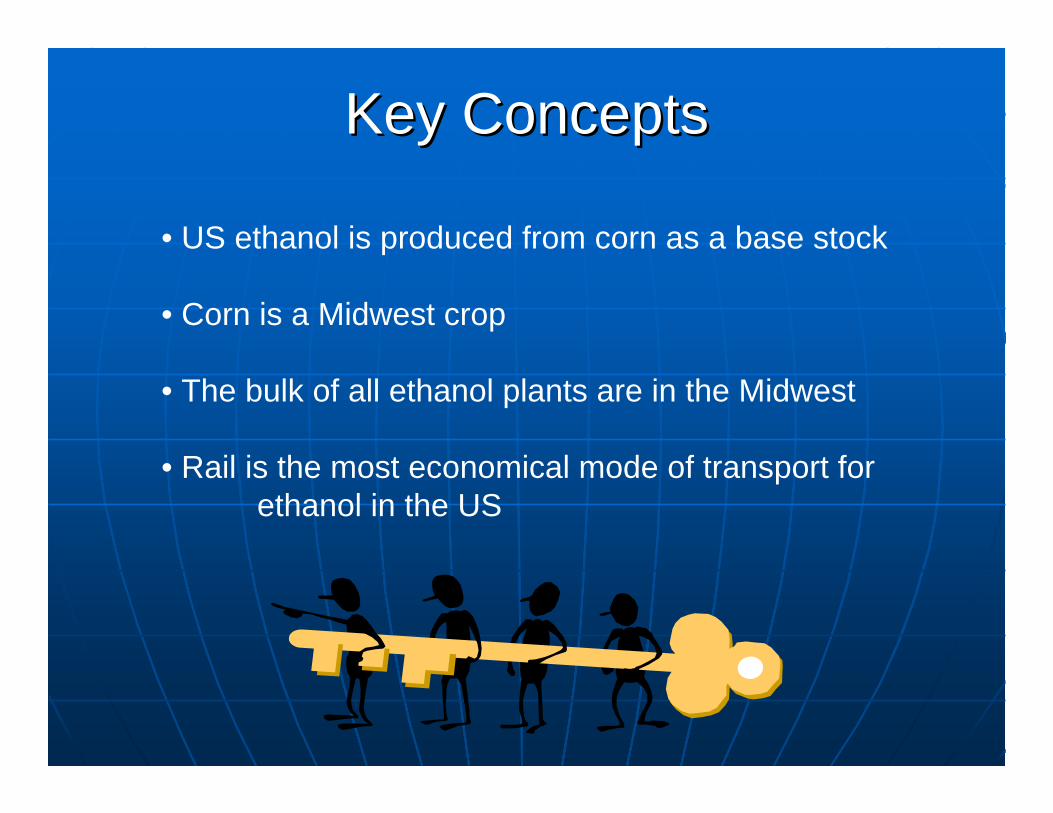
Key ConceptsKey Concepts
• US ethanol is produced from corn as a base stock
• Corn is a Midwest crop
• The bulk of all ethanol plants are in the Midwest
• Rail is the most economical mode of transport for ethanol in the US
Liquefied Natural GasLiquefied Natural Gas
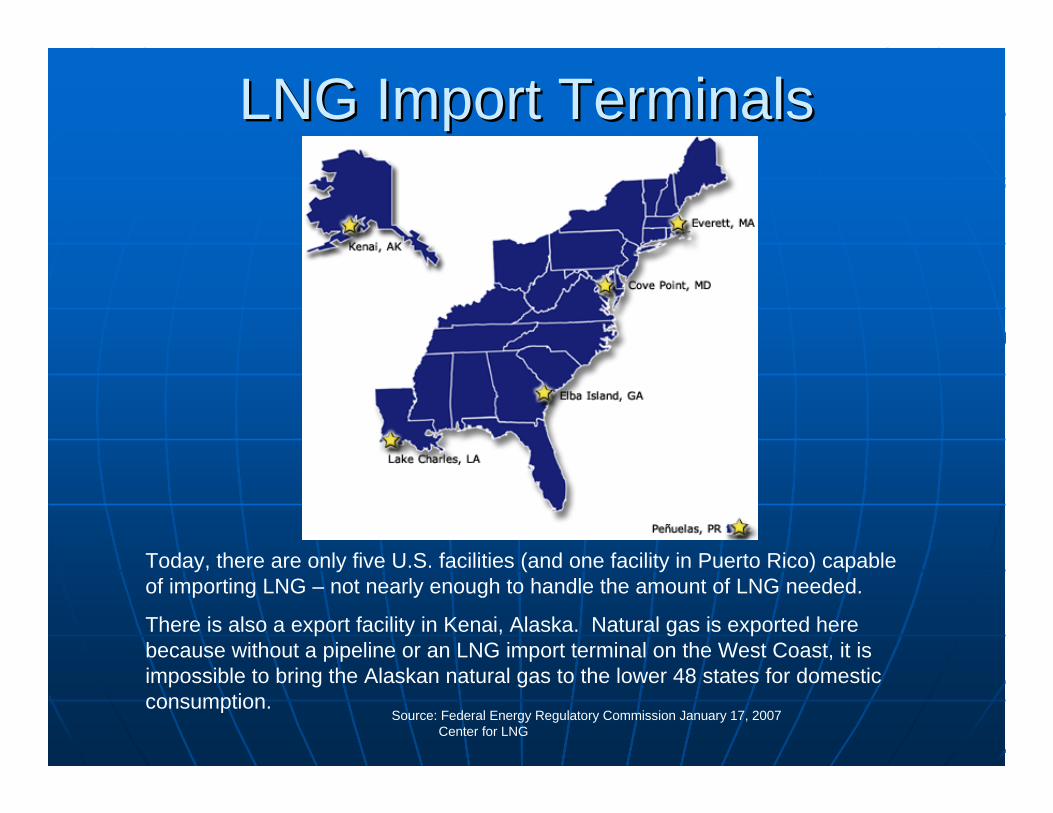
LNG Import TerminalsLNG Import Terminals
Source: Federal Energy Regulatory Commission January 17, 2007 Center for LNG
Today, there are only five U.S. facilities (and one facility in Puerto Rico) capable of importing LNG – not nearly enough to handle the amount of LNG needed.
There is also a export facility in Kenai, Alaska. Natural gas is exported here because without a pipeline or an LNG import terminal on the West Coast, it is impossible to bring the Alaskan natural gas to the lower 48 states for domestic consumption.
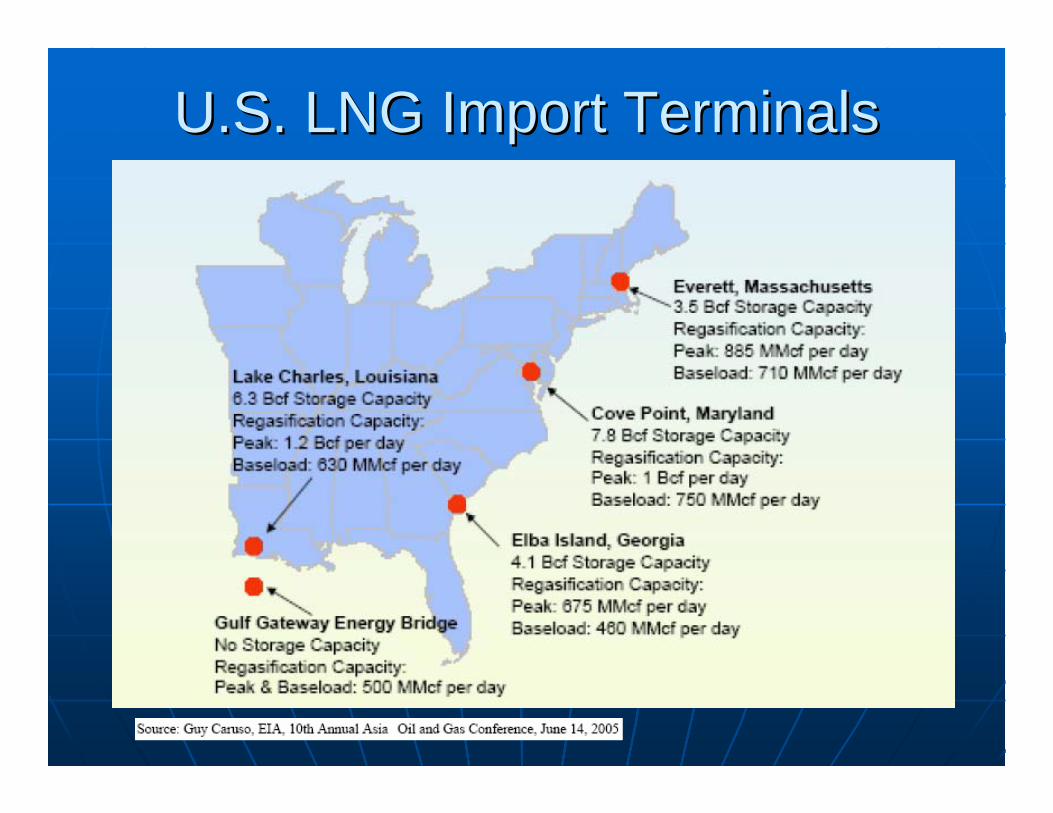
U.S. LNG Import TerminalsU.S. LNG Import Terminals
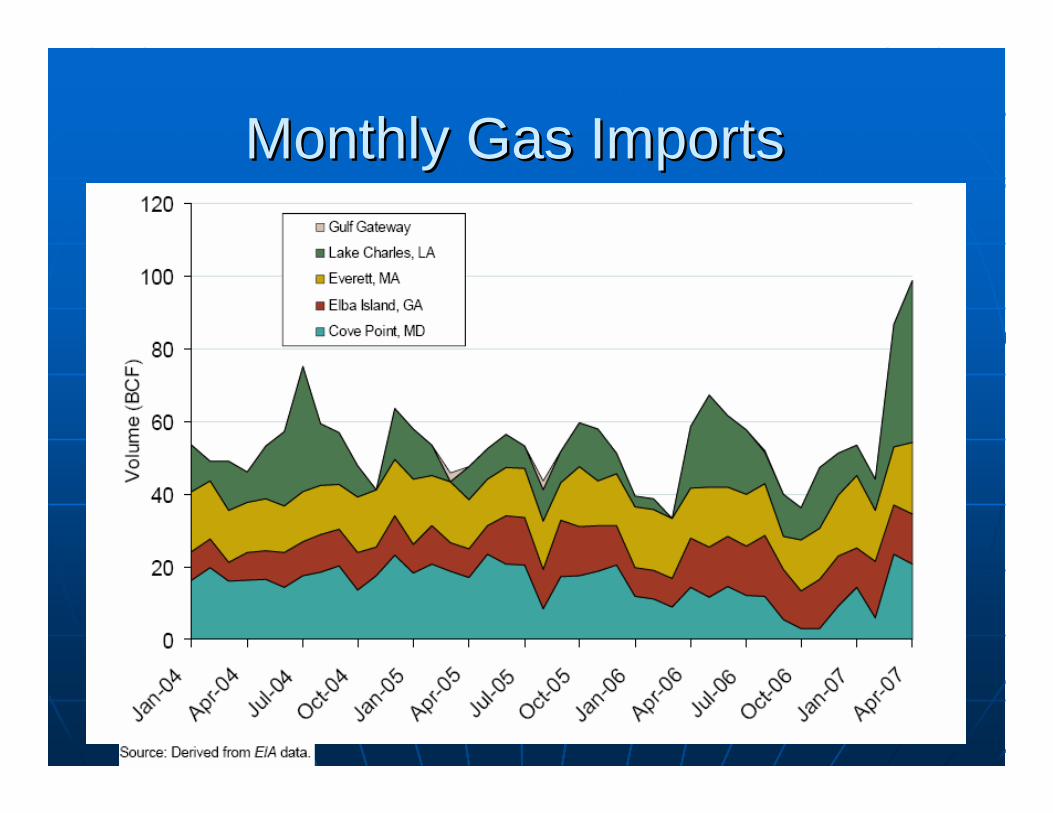
Monthly Gas ImportsMonthly Gas Imports
Liquefied Natural GasLiquefied Natural GasNatural gas cannot be efficiently transported very long Natural gas cannot be efficiently transported very long distances (e.g. across oceans) in its gaseous state.distances (e.g. across oceans) in its gaseous state.
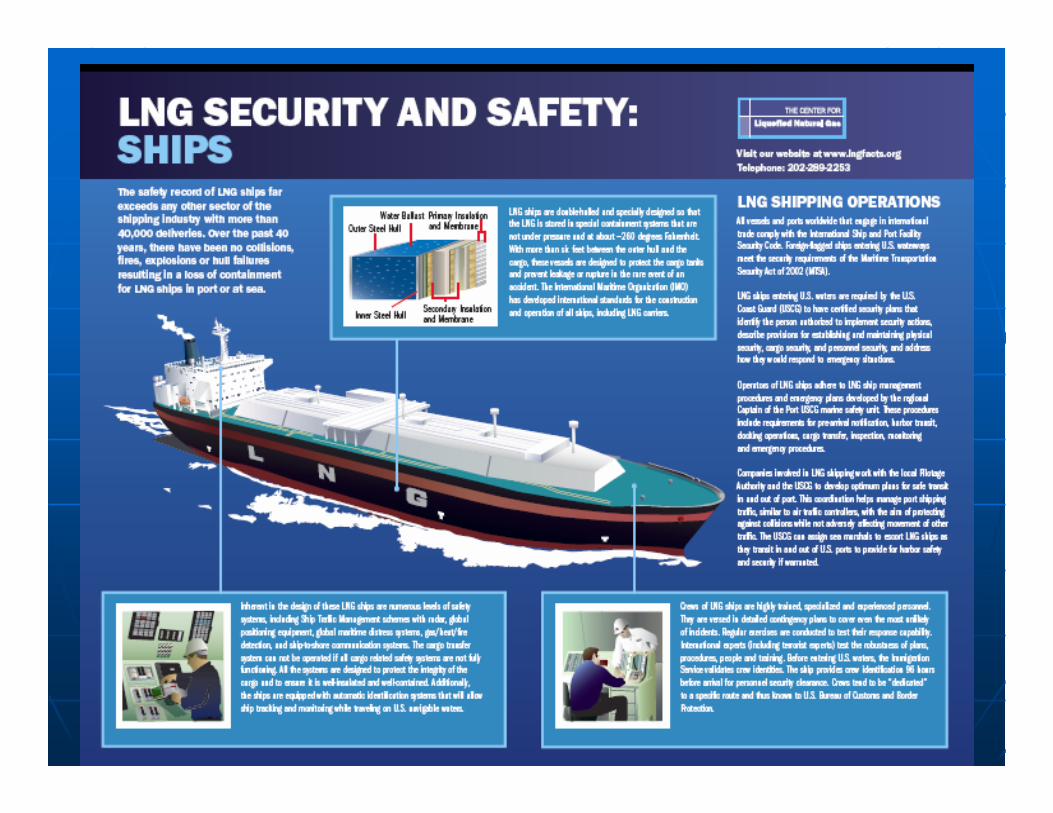
LNG is shipped on secure and specially designed ships with LNG is shipped on secure and specially designed ships with more than six feet of space between the outer hull and inner more than six feet of space between the outer hull and inner hulls.hulls.
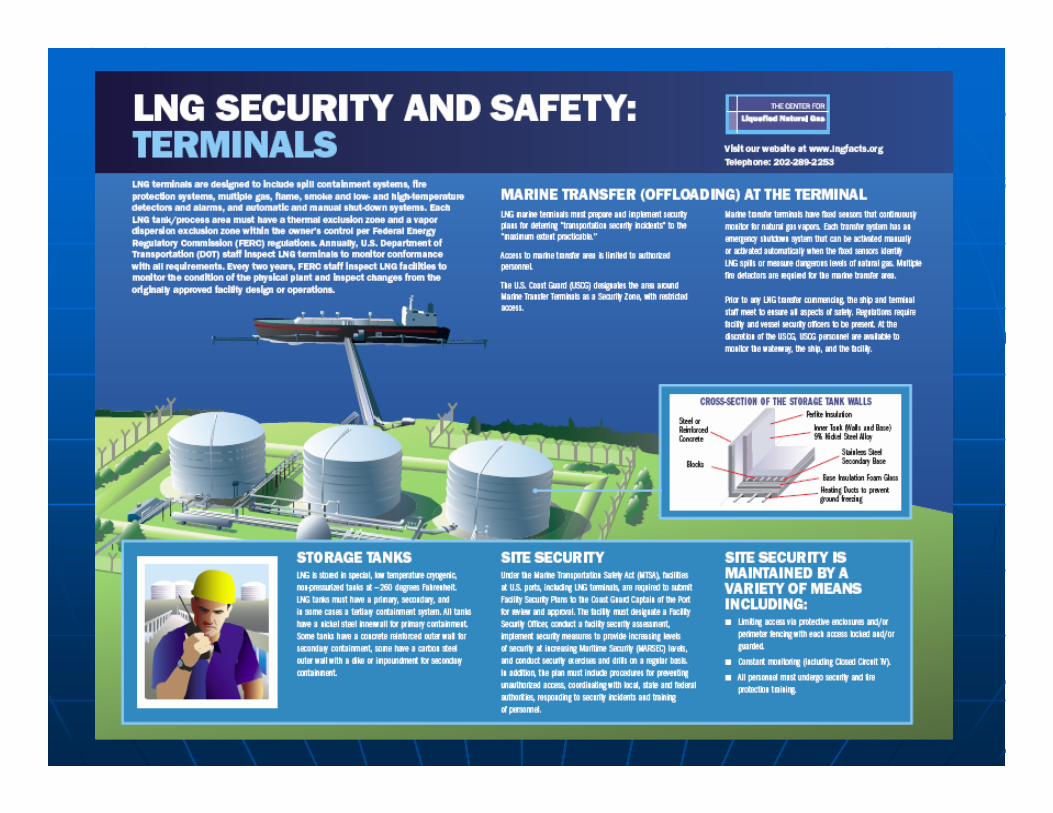
Upon arrival at its destination, LNG is generally transferred Upon arrival at its destination, LNG is generally transferred to specially designed and secured storage tanks and then to specially designed and secured storage tanks and then warmed to its gaseous state warmed to its gaseous state –– a process called a process called regasification.regasification. It is transported via pipelines to consumers, It is transported via pipelines to consumers, industries and power generators who rely on natural gas. industries and power generators who rely on natural gas.
Once LNG returns to its gaseous state, it is distributed as Once LNG returns to its gaseous state, it is distributed as natural gas through pipelines to consumers.natural gas through pipelines to consumers.
LNG Industry Costs DecliningLNG projects are among the most expensive energy projects.
According to an independent LNG consultant, there are four main price components of an LNG project, from the gas field to the receiving terminal:
— Gas production: from the reservoir to the LNG plant, including gas processing and associated pipelines (15 to 20 percent of costs); — LNG plant: gas treating, liquefaction, LPG and condensate recovery, LNG loading and storage (30 to 45 percentof costs); — LNG shipping (10 to 30 percent of costs); and Receiving terminal: unloading, storage, regasification and distribution (15 to 25 percent of costs).Source: EIA/DOE
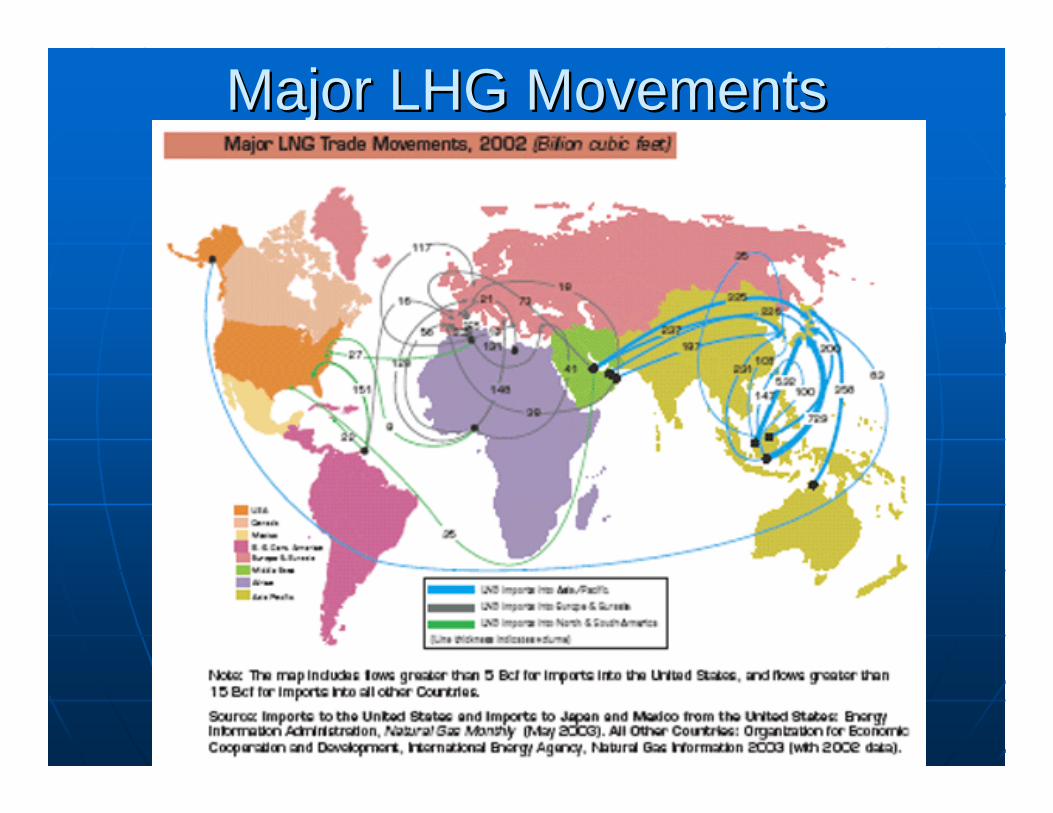
Major LHG MovementsMajor LHG Movements
Key ConceptsKey Concepts
• There are currently only five LNG import terminals in the US
• Natural gas consumption is projected to continue to rise
• LNG is not widely distributed in the US rather it is converted back to gas and is transported along the natural gas pipeline network

SummarySummary
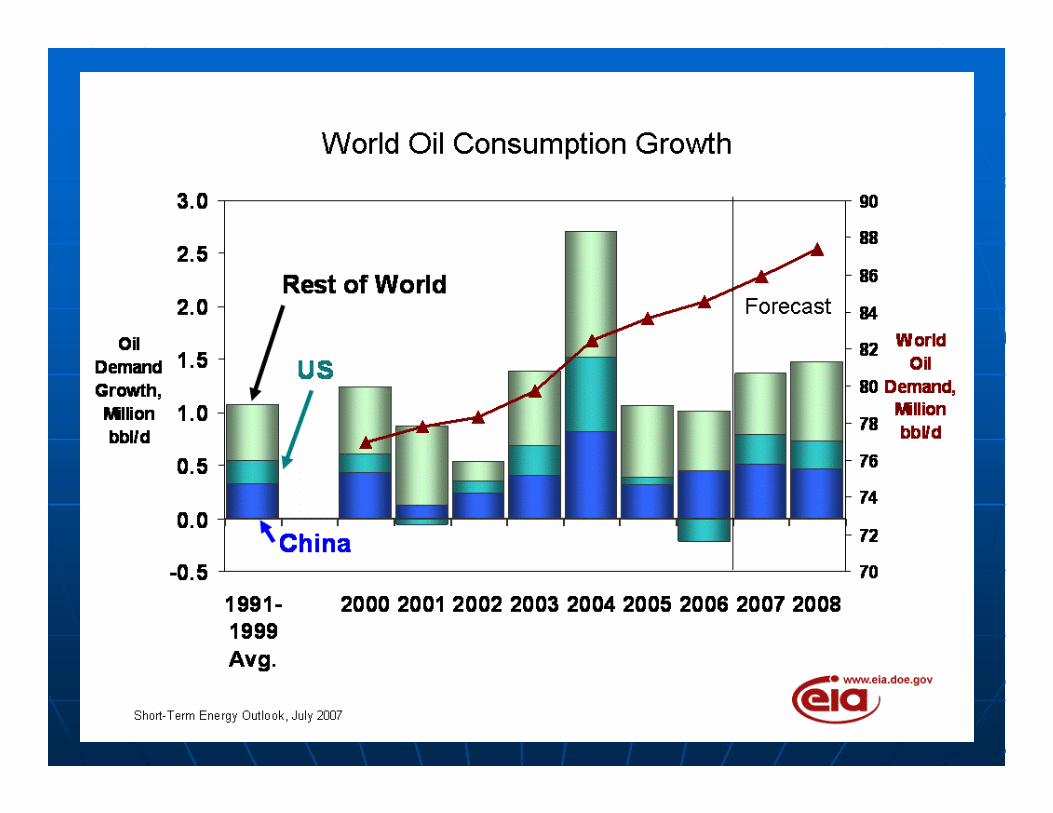
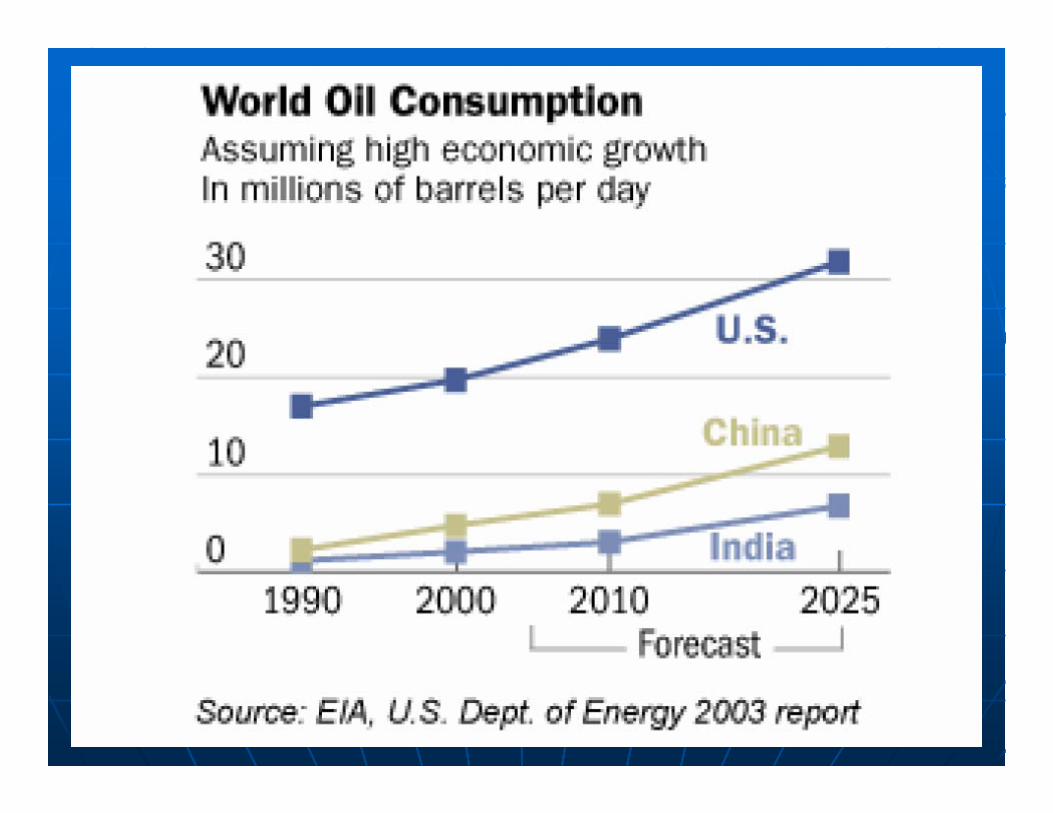
Consumption is Consumption is projected to increase projected to increase at the rate of 1.4 at the rate of 1.4 million barrels per day million barrels per day (US .2 & China .5)(US .2 & China .5)Non OPEC supply is Non OPEC supply is projected to rise at a projected to rise at a rate of .6 million rate of .6 million barrels per daybarrels per dayOPEC supply is OPEC supply is projected to remain flatprojected to remain flat
Worldwide Direction of TrendsWorldwide Direction of Trends
Consumption is estimated Consumption is estimated to grow at the rate of 1.4 % to grow at the rate of 1.4 % to an average of 20.9 to an average of 20.9 million barrels per day million barrels per day Crude oil production is Crude oil production is estimated to increase at a estimated to increase at a rate of .6% to an average rate of .6% to an average of 5.2 million barrels per of 5.2 million barrels per daydayInventories are projected Inventories are projected to decrease by 8 million to decrease by 8 million barrels to 205 million or barrels to 205 million or below a 10 day supply below a 10 day supply based upon the past 5 based upon the past 5 year historyyear history
Domestic US TrendsDomestic US Trends
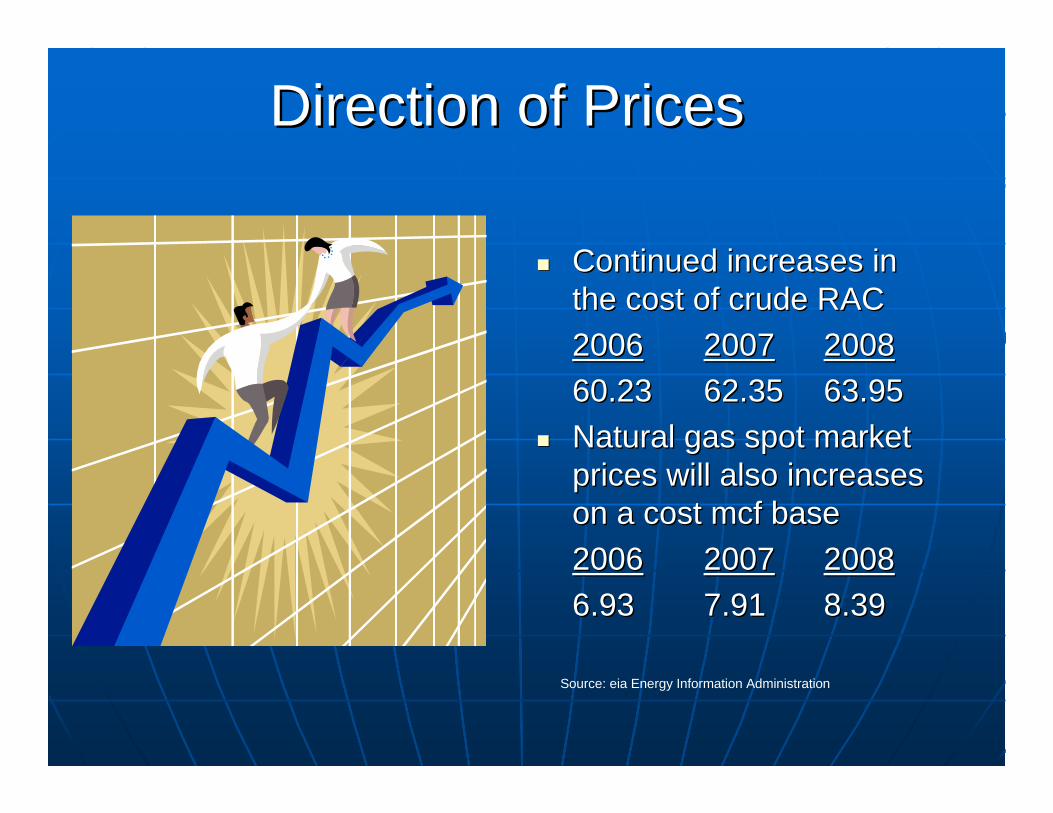
Continued increases in Continued increases in the cost of crude RACthe cost of crude RAC20062006 20072007 2008200860.2360.23 62.3562.35 63.9563.95Natural gas spot market Natural gas spot market prices will also increases prices will also increases on a cost on a cost mcfmcf basebase20062006 20072007 200820086.936.93 7.917.91 8.398.39
Direction of PricesDirection of Prices
Source: eia Energy Information Administration
Key ConceptsKey Concepts
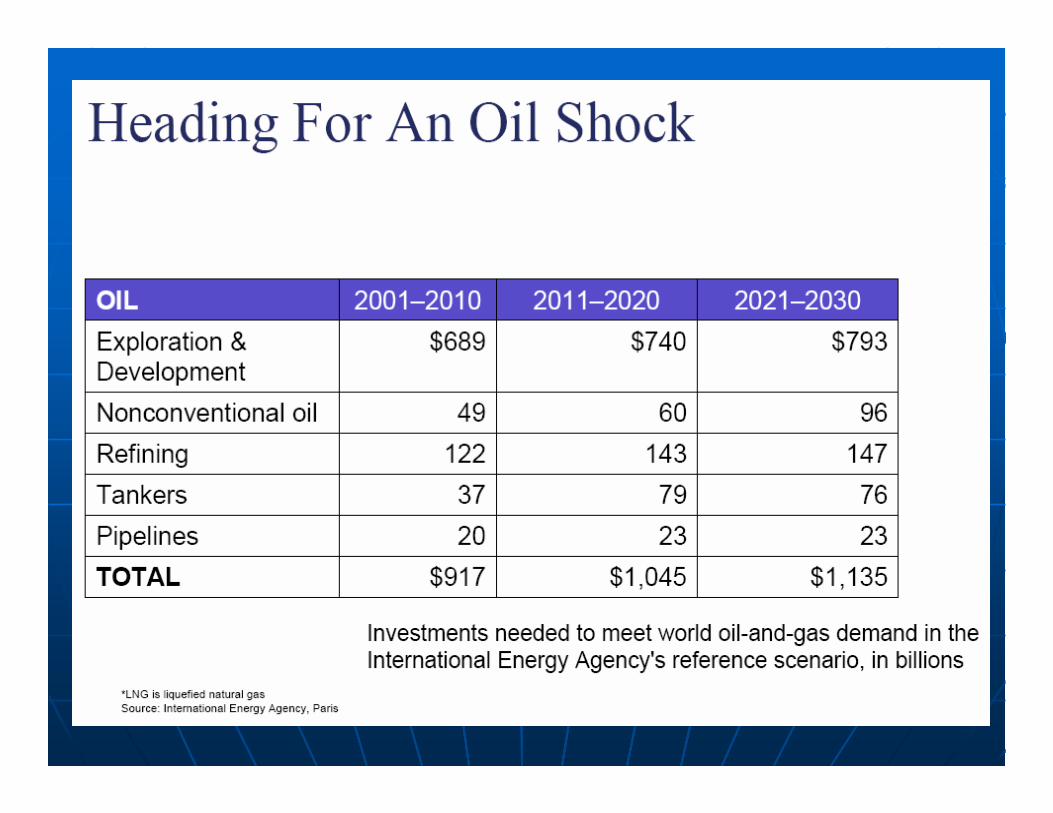
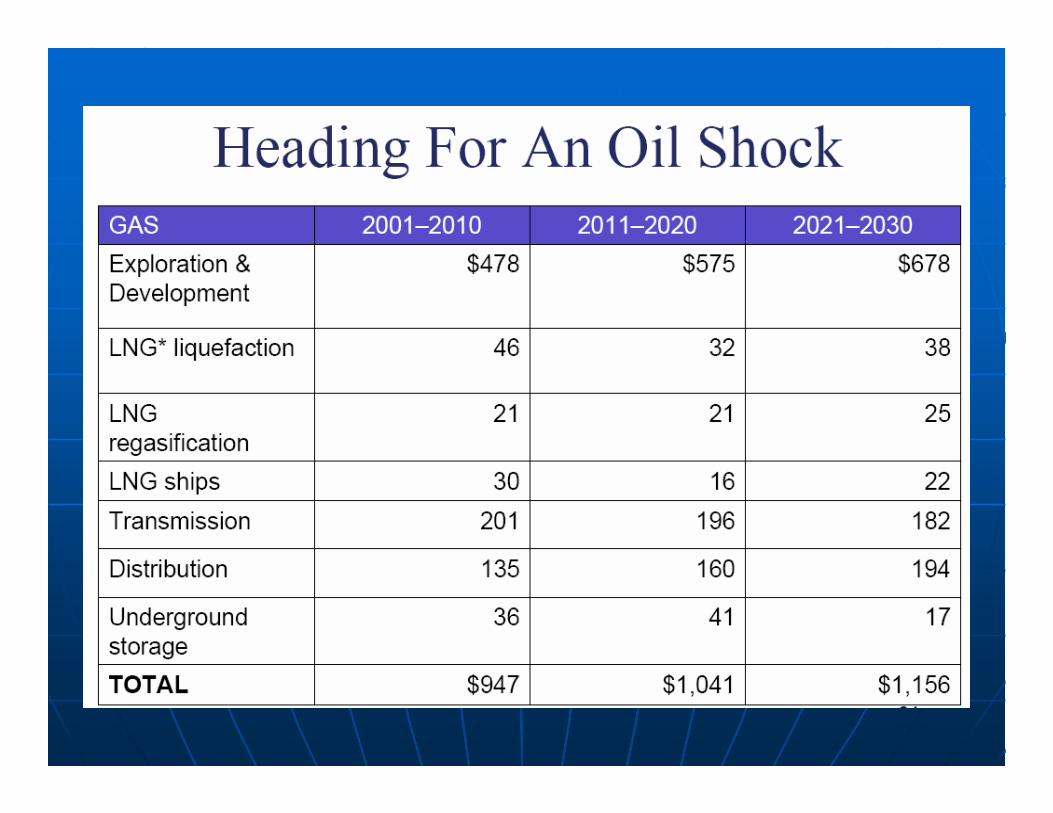
• Significant infrastructure investments are needed to the current petroleum network
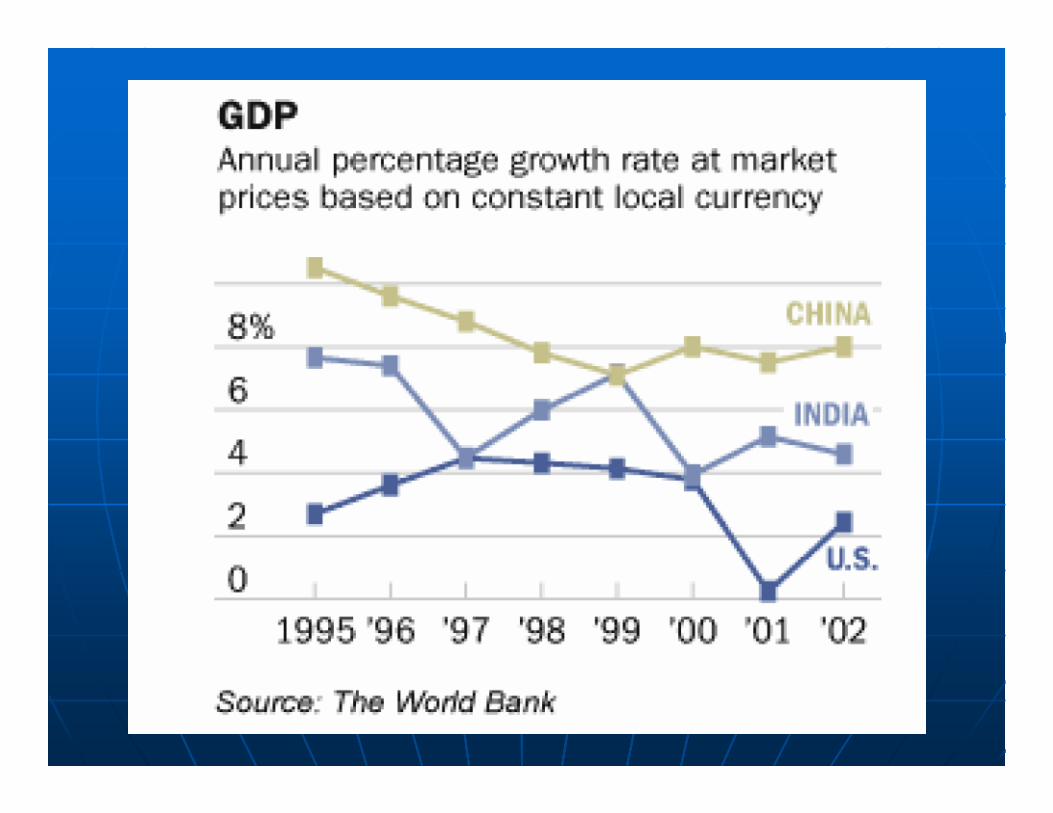
• Strong competition for imported crude oil are anticipated from China and India
• The US’s rising oil and gas consumption and needed infrastructure investments will continue price increases

ConclusionConclusion
US vs. BrazilUS vs. BrazilThe USThe US’’s petroleum networks s petroleum networks infrastructure is more highly developedinfrastructure is more highly developedThe US demand markets are more evenly The US demand markets are more evenly distributeddistributedThe US petroleum S&D system The US petroleum S&D system encourages product swaps, transfers and encourages product swaps, transfers and in transit salesin transit salesThe competitive petroleum transportation The competitive petroleum transportation network is not dominated by any single network is not dominated by any single playerplayer
Key Take AlwaysKey Take Always• The Transpetro network is marine and pipeline
• The US transportation network is heavily pipeline orientated
• The US network is dependent upon trades, transfers andexchanges
• US ethanol transportation is primarily rail and truck based
•

Freese & Associates, Inc.Freese & Associates, Inc. www.FreeseInc.comwww.FreeseInc.com