The Transition From Event Reports to Measurable ... Measurable Organizational Impact: Workshop...
38
The Transition From Event Reports to Measurable Organizational Impact: Workshop Proceedings Report Katrina E. Avers 1 William B. Johnson 2 Joy O. Banks 1 Brenda Wenzel 1 1 Civil Aerospace Medical Institute Federal Aviation Administration Oklahoma City, OK 73125 2 Chief Scientist Program Federal Aviation Administration Washington, DC 20591 March 2014 Final Report DOT/FAA/AM-14/5 Office of Aerospace Medicine Washington, DC 20591 Federal Aviation Administration
Transcript of The Transition From Event Reports to Measurable ... Measurable Organizational Impact: Workshop...
The Transition From Event Reports to Measurable Organizational Impact: Workshop Proceedings Report
Katrina E. Avers1
William B. Johnson2
Joy O. Banks1
Brenda Wenzel1
1Civil Aerospace Medical InstituteFederal Aviation AdministrationOklahoma City, OK 731252Chief Scientist ProgramFederal Aviation AdministrationWashington, DC 20591
March 2014
Final Report
DOT/FAA/AM-14/5Office of Aerospace MedicineWashington, DC 20591
Federal AviationAdministration
NOTICE
This document is disseminated under the sponsorship of the U.S. Department of Transportation in the interest
of information exchange. The United States Government assumes no liability for the contents thereof.
___________
This publication and all Office of Aerospace Medicine technical reports are available in full-text from the
Civil Aerospace Medical Institute’s website: www.faa.gov/go/oamtechreports
i
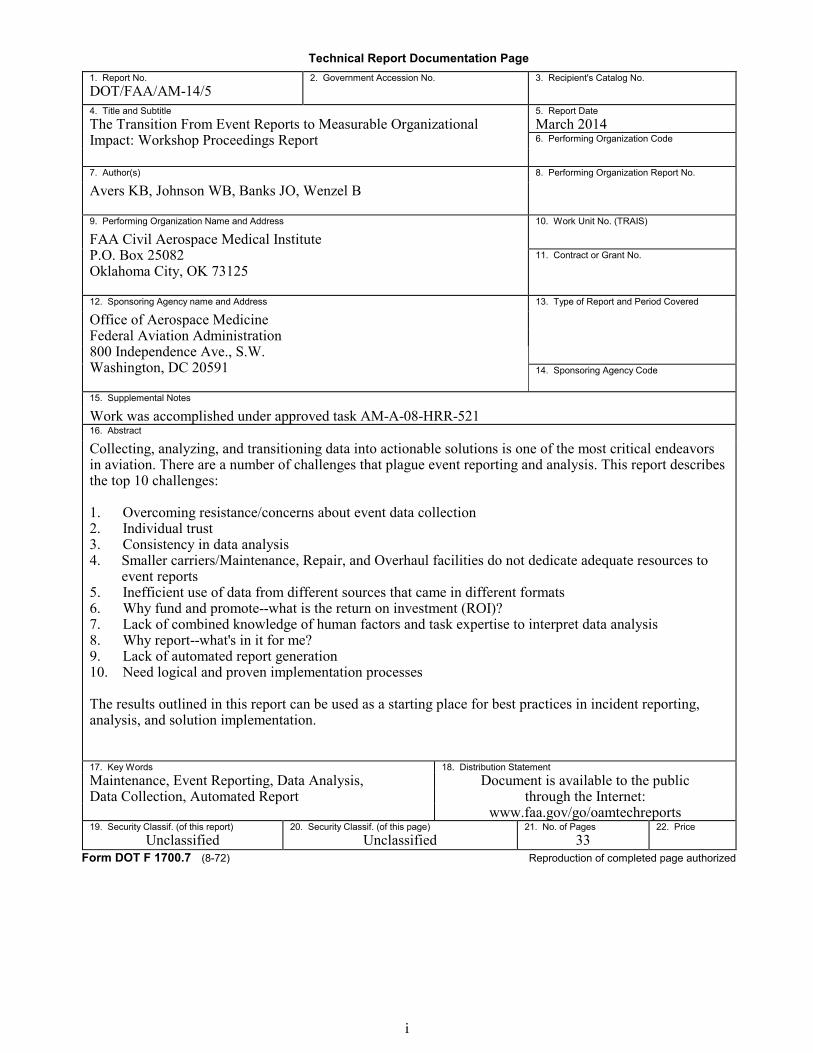
Technical Report Documentation Page1. Report No. 2. Government Accession No. 3. Recipient's Catalog No.DOT/FAA/AM-14/5 4. Title and Subtitle 5. Report DateThe Transition From Event Reports to Measurable Organizational Impact: Workshop Proceedings Report
March 20146. Performing Organization Code
7. Author(s) 8. Performing Organization Report No.
Avers KB, Johnson WB, Banks JO, Wenzel B
9. Performing Organization Name and Address 10. Work Unit No. (TRAIS)
FAA Civil Aerospace Medical InstituteP.O. Box 25082Oklahoma City, OK 73125
11. Contract or Grant No.
12. Sponsoring Agency name and Address 13. Type of Report and Period Covered
Office of Aerospace MedicineFederal Aviation Administration800 Independence Ave., S.W.Washington, DC 20591
14. Sponsoring Agency Code
15. Supplemental Notes
Work was accomplished under approved task AM-A-08-HRR-52116. Abstract
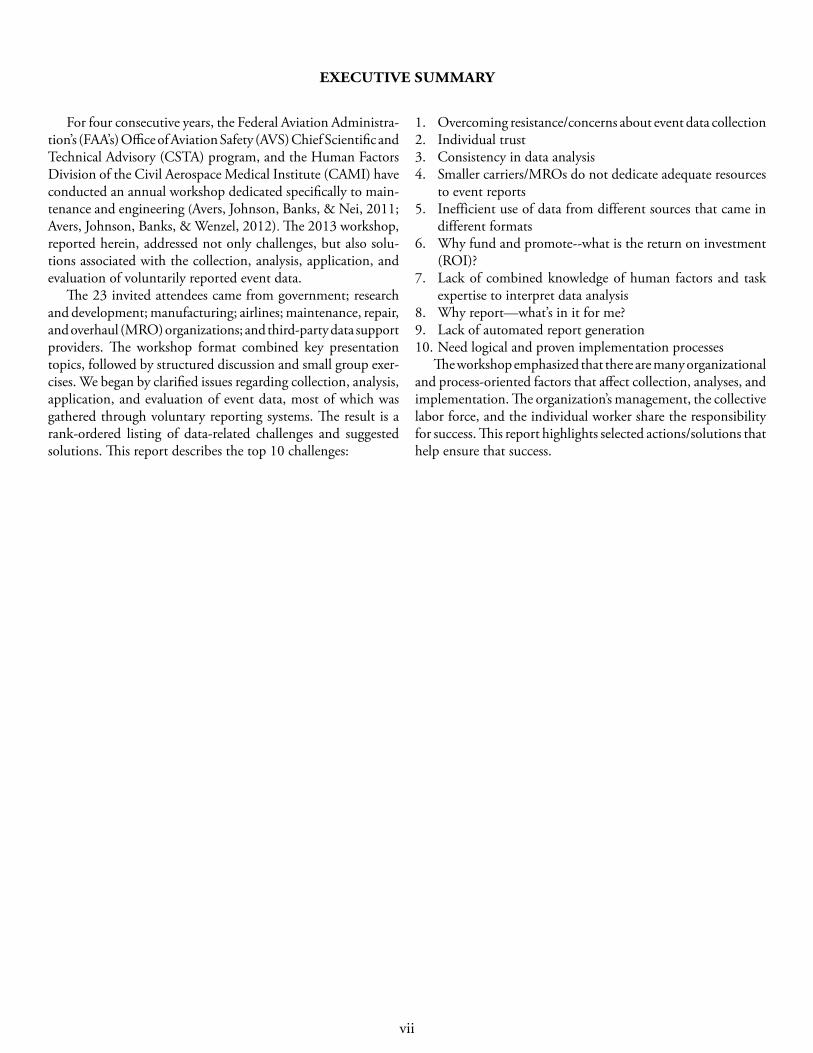
Collecting, analyzing, and transitioning data into actionable solutions is one of the most critical endeavorsin aviation. There are a number of challenges that plague event reporting and analysis. This report describes the top 10 challenges:
1. Overcoming resistance/concerns about event data collection 2. Individual trust 3. Consistency in data analysis 4. Smaller carriers/Maintenance, Repair, and Overhaul facilities do not dedicate adequate resources to
event reports 5. Inefficient use of data from different sources that came in different formats 6. Why fund and promote--what is the return on investment (ROI)? 7. Lack of combined knowledge of human factors and task expertise to interpret data analysis 8. Why report--what's in it for me? 9. Lack of automated report generation 10. Need logical and proven implementation processes
The results outlined in this report can be used as a starting place for best practices in incident reporting, analysis, and solution implementation.
17. Key Words 18. Distribution StatementMaintenance, Event Reporting, Data Analysis, Data Collection, Automated Report
Document is available to the public through the Internet:
www.faa.gov/go/oamtechreports19. Security Classif. (of this report) 20. Security Classif. (of this page) 21. No. of Pages 22. Price
Unclassified Unclassified 33Form DOT F 1700.7 (8-72) Reproduction of completed page authorized

iii
ACKNOWLEDGMENTS
This workshop was conducted under funding from the FAA Office of Aviation Safety’s Chief Scientific and Technical Advisor Program and supported by the Human Factors Research Division of the FAA Civil Aerospace Medical Institute and the Air Traffic Organization Human Factors Research and Engineering Group.
Dr. Bill Johnson and Dr. Katrina Avers co-chaired the workshop for international attendees, including key official Aviation Safety (AVS) personnel, industry leaders (Maintenance, Repair, and Overhaul organizations, airlines, and manufacturers), sci-entists, and data management providers. Dr. Brenda Wenzel and Joy Banks provided administrative and logistical support in coordination with the Chief Scientific and Technical Advisor Program, the Aircraft Certification Workshop Program, the Atlanta Flight Standards District Office, the Human Factors Research and Engineering Group (ANG), and the Human Factors Research Division of the Civil Aerospace Medical Institute.
High-value workshops are much more than an agenda and a technical report. Behind the scene are hours of concept develop-ment; proposal preparation, submission, and approval; selection of attendees; invitations to speakers; and logistics. The workshop’s success relied upon excellent speakers and active participation from attendees. We thank the workshop speakers, small group leaders, and attendees for their engagement in the topic issues and being responsive to coordination requests. Their contributions in the aviation maintenance industry help to ensure efficient and effective event data collection, analyses, and application.
Special thanks to Tamara Harper and Liesa Johnson for facility coordination; Shannon Wilkerson and Shirley Turner for travel and purchasing support; and Janine King for assistance in developing, final proofing, and formatting of the workshop report.
WORKSHOP ATTENDEES
Attendee AffiliationNicky Armour - - - - - - - - - - - - - - - - UTRS-WBATKatrina Avers - - - - - - - - - - - - - - - - FAA AAM-510Joy Banks - - - - - - - - - - - - - - - - - - FAA AAM-510Edward Berluchaux - - - - - - - - - - - - FAA ASO-27Nusret Bülent TOPCU - - - - - - - - - - MNG TechnicRob Burner - - - - - - - - - - - - - - - Southwest AirlinesDarren Cook - - - - - - - - - - - - - - - - Qantas AirlinesColin Drury - - - - - - - - - - - - - Applied Ergonomics Douglas Farrow - - - - - - - - - - - - - - - FAA AFS-280Terry Gober - - - - - - - - - - - - - - - - Delta Air LinesBill Huntley - - - - - - - - - - - - - - AAR CorporationBill Johnson - - - - - - - - - - - - - - - - - FAA AIR-100Joe Karnich - - - - - - - - - - - - - - - - - - FAA ASO-27Keith Lardie - - - - - - - - - - - - - - - - - FAA AIR-110 Maggie J. Ma- - - - - - - - - - - - - - - - - - - - - - BoeingDurwin Mitchell - - - - - - - - - - - - - Delta Air LinesBill Rankin - - - - - - - - - - - - - - - - - - - - - - - BoeingSimon Roberts - - - - - - - - - - - - - - - - - - - CAA-UKDavid Slavik - - - - - - - - - - - - - - - - United Airlines Hollins Smith - - - - - - - - - - - - - American AirlinesPennie Thompson - - - - - - - - - - - - - FAA AFS-620 Brenda Wenzel - - - - - - - - - - - - - - - FAA AAM-510David Wichner - - - - - - - - - - - - - - - - NASA ASRS

v
CONTENTSThe Transition From Event Reports to Measurable Organizational Impact:
Workshop Proceedings Report
Background on Data Issues in Maintenance --------------------------------------------------------------------------------------------1 Workshop Attendees ------------------------------------------------------------------------------------------------------------------------2 Workshop Format ---------------------------------------------------------------------------------------------------------------------------2Workshop Presentations – Day 1 ----------------------------------------------------------------------------------------------------------3 Welcome, Logistics, and Workshop Format ---------------------------------------------------------------------------------------------3 Extended Introductions and Review of the #1 Challenge and Solutions ------------------------------------------------------------3 Data Gathering…Why Bother? -----------------------------------------------------------------------------------------------------------3 MRO Challenges with Technical Documentation—From Safety Event Reports to Organizational Impact -------------------5 The Historical View of US and International Use of Event Data ---------------------------------------------------------------------6 The Delta Data and Organizational Experience -----------------------------------------------------------------------------------------6 The Southwest Airlines Maintenance Data Experience --------------------------------------------------------------------------------7 The Dirt on Data From Down Under – Reporting Leads to Predictive Error Management -------------------------------------8 Just Culture and Event Data Reporting/Analysis at American Airlines --------------------------------------------------------------8 Using Event Data to Affect Maintenance Training and Safety ------------------------------------------------------------------------9 Standardizing Event Reporting and Safety Culture Across Multiple MRO Locations ------------------------------------------- 10 Using Qualitative Data from NASA’s Aviation Safety Reporting System (ASRS) ------------------------------------------------ 11 Show Me the Money – Show Me the Safety ------------------------------------------------------------------------------------------- 11Workshop Presentations – Day 2 -------------------------------------------------------------------------------------------------------- 13 Maintenance and Ramp Line Operations Safety Assessment ----------------------------------------------------------------------- 13 Web-Based Data Collection and Analysis With the Web-Based Application Tool ---------------------------------------------- 14 Aviation Data Exchange for Real Time Maintenance Data Reporting/Analysis ------------------------------------------------- 14 Small Group Work Session – Day 2 ---------------------------------------------------------------------------------------------------- 16 Identifying and Prioritizing Challenges of Event Report Data ---------------------------------------------------------------------- 16 The Overall Priority of Challenges ------------------------------------------------------------------------------------------------------ 17 Solutions to the Challenges -------------------------------------------------------------------------------------------------------------- 18Recommendations ---------------------------------------------------------------------------------------------------------------------------- 20 Overcoming Resistance/Concerns About Event Data Collection (Data Collection #3) ---------------------------------------- 20 Organizational Response to Resistance About Event Data Collection ------------------------------------------------------------- 20 FAA Response to Resistance About Event Data Collection ------------------------------------------------------------------------- 21 Individual Response to Resistance About Event Data Collection ------------------------------------------------------------------ 21 Individual Trust (Organizational Culture #1) ----------------------------------------------------------------------------------------- 21 Organizational Response to Individual Trust ------------------------------------------------------------------------------------------ 21 FAA Response to Individual Trust ------------------------------------------------------------------------------------------------------- 21 Individual Response to Individual Trust ------------------------------------------------------------------------------------------------ 21 Consistency in Data Analysis (Data Analysis #1) ------------------------------------------------------------------------------------- 21 Organizational Response to Consistency in Data Analysis -------------------------------------------------------------------------- 21 FAA Response to Consistency in Data Analysis --------------------------------------------------------------------------------------- 21 Individual Response to Consistency in Data Analysis -------------------------------------------------------------------------------- 21 Small Carriers/MROs Do Not Dedicate Adequate Resources to Event Reports (Data Collection #1) ----------------------- 21 Organizational Response to Small Carrier Resources for Event Reports ----------------------------------------------------------- 22 FAA Response to Small Carrier Resources for Event Reports ----------------------------------------------------------------------- 22 Individual Response to Small Carrier Resources for Event Reports ---------------------------------------------------------------- 22 Inefficient Use of Data from Different Sources in Different Formats (Data Analysis #4) --------------------------------------- 22 Organizational Response to Inefficient Data Use ------------------------------------------------------------------------------------- 22 FAA Response to Data Use --------------------------------------------------------------------------------------------------------------- 22 Individual Response to Data Use -------------------------------------------------------------------------------------------------------- 22Summary ----------------------------------------------------------------------------------------------------------------------------------------- 22Workshop Evaluation and Comments --------------------------------------------------------------------------------------------------- 22 Evaluations of Workshop Content ------------------------------------------------------------------------------------------------------ 23 Participant Benefits ------------------------------------------------------------------------------------------------------------------------ 24 Value of Workshop Recommendations ------------------------------------------------------------------------------------------------- 24 Evaluations of Overall Quality ----------------------------------------------------------------------------------------------------------- 24 Suggestions for Improvement and General Comments ------------------------------------------------------------------------------ 24References -------------------------------------------------------------------------------------------------------------------------------------- 24
vi
LIST OF FIGURES
Figure 1: A Collage of Aviation History From DaVinci to Supersonic -----------------------------------------------------------------1Figure 2: Distribution of Attendee Affiliation ----------------------------------------------------------------------------------------------2Figure 3: AVS Workshop Day 1 --------------------------------------------------------------------------------------------------------------3Figure 4: Factors Contributing to Maintenance Errors -----------------------------------------------------------------------------------4Figure 5: Distribution of MEDA Contributing Factors ----------------------------------------------------------------------------------4Figure 6: Event Reporting Processes ---------------------------------------------------------------------------------------------------------5Figure 7: “Work as Done” Versus “Work as Documented” ------------------------------------------------------------------------------6Figure 8: The Closed-Loop Continuing Analysis and Surveillance System (CASS) --------------------------------------------------7Figure 9: Number of Hours Worked and Corresponding Personnel Injury Rates ----------------------------------------------------7Figure 10: The “Just Culture” Model ---------------------------------------------------------------------------------------------------------9Figure 11: Critical Issues Needing Attention ------------------------------------------------------------------------------------------------9Figure 12: The Airworthiness Performance Bridge --------------------------------------------------------------------------------------- 10Figure 13: ASRS Report Flow Process ------------------------------------------------------------------------------------------------------ 11Figure 14: Monthly Intake for ASRS Reports From January 1981 Through December 2012 ------------------------------------- 11Figure 15: Return on Investment (ROI) for Safety --------------------------------------------------------------------------------------- 12Figure 16: AVS Workshop Day 2 ----------------------------------------------------------------------------------------------------------- 13Figure 17: Threat and Error Management ------------------------------------------------------------------------------------------------- 13Figure 18: WBAT Guidance on Analyzing Data Inputs --------------------------------------------------------------------------------- 14Figure 19: AVDEX Utilization of Multiple Technology Tools -------------------------------------------------------------------------- 15Figure 20: Aggregate Results by Workgroup Area ---------------------------------------------------------------------------------------- 18Figure 21: Attendee Perception of Workshop Content ---------------------------------------------------------------------------------- 23Figure 22: Attendee Perception of Participant Benefits ---------------------------------------------------------------------------------- 23Figure 23: Attendee Perception of Workshop Benefits ----------------------------------------------------------------------------------- 23
LIST OF TABLES
Table 1: Challenges by Workgroup Area ------------------------------------------------------------------------------------------------- 16Table 2: Overall Ranking of Prioritized Challenges------------------------------------------------------------------------------------- 17Table 3: Workgroup Solutions to Challenges -------------------------------------------------------------------------------------------- 19Table 3: Workgroup Solutions to Challenges (continued) ----------------------------------------------------------------------------- 20
vii
EXECUTIVE SUMMARY
For four consecutive years, the Federal Aviation Administra-tion’s (FAA’s) Office of Aviation Safety (AVS) Chief Scientific and Technical Advisory (CSTA) program, and the Human Factors Division of the Civil Aerospace Medical Institute (CAMI) have conducted an annual workshop dedicated specifically to main-tenance and engineering (Avers, Johnson, Banks, & Nei, 2011; Avers, Johnson, Banks, & Wenzel, 2012). The 2013 workshop, reported herein, addressed not only challenges, but also solu-tions associated with the collection, analysis, application, and evaluation of voluntarily reported event data.
The 23 invited attendees came from government; research and development; manufacturing; airlines; maintenance, repair, and overhaul (MRO) organizations; and third-party data support providers. The workshop format combined key presentation topics, followed by structured discussion and small group exer-cises. We began by clarified issues regarding collection, analysis, application, and evaluation of event data, most of which was gathered through voluntary reporting systems. The result is a rank-ordered listing of data-related challenges and suggested solutions. This report describes the top 10 challenges:
1. Overcoming resistance/concerns about event data collection 2. Individual trust 3. Consistency in data analysis 4. Smaller carriers/MROs do not dedicate adequate resources
to event reports 5. Inefficient use of data from different sources that came in
different formats 6. Why fund and promote--what is the return on investment
(ROI)? 7. Lack of combined knowledge of human factors and task
expertise to interpret data analysis 8. Why report—what’s in it for me? 9. Lack of automated report generation 10. Need logical and proven implementation processes
The workshop emphasized that there are many organizational and process-oriented factors that affect collection, analyses, and implementation. The organization’s management, the collective labor force, and the individual worker share the responsibility for success. This report highlights selected actions/solutions that help ensure that success.

ix
ACRONYMS
A4A - - - - - - - - - - - Airlines for America (formerly Air Transport Association of America; ATA)APRISE - - - - - - - - AAR Performance Reporting Information SystemAQP - - - - - - - - - - - Advanced Qualification ProgramASAP - - - - - - - - - - Aviation Safety Action Program ASI - - - - - - - - - - - - Aviation Safety InspectorsASIAS - - - - - - - - - - Aviation Safety Information Analysis and SharingASRS - - - - - - - - - - Aviation Safety Reporting SystemAVDEX - - - - - - - - Aviation Data ExchangeAVS - - - - - - - - - - - Office of Aviation SafetyCAA - - - - - - - - - - - Civil Aviation AuthorityCAMI - - - - - - - - - - Civil Aerospace Medical InstituteCASS - - - - - - - - - - Continuing Analysis and Surveillance SystemCSTA - - - - - - - - - - Chief Scientific and Technical AdvisoryDBOL - - - - - - - - - ASRS Online DatabaseFAA - - - - - - - - - - - Federal Aviation AdministrationFOQA - - - - - - - - - Flight Operations Quality AssuranceHF - - - - - - - - - - - - Human FactorsICAO - - - - - - - - - - International Civil Aviation OrganizationJAA - - - - - - - - - - - Joint Aviation AuthorityMR-LOSA - - - - - - FAA Maintenance and Ramp Line Operations Safety AssessmentMEDA - - - - - - - - - Maintenance Error Decision AidMRO - - - - - - - - - - Maintenance, Repair, and OverhaulMX - - - - - - - - - - - MaintenanceNAA - - - - - - - - - - - National Aviation AuthorityNASA - - - - - - - - - - National Aeronautics and Space AdministrationOEM - - - - - - - - - - Original Equipment ManufacturersR&D - - - - - - - - - - Research and DevelopmentREDA - - - - - - - - - Ramp Error Decision AidROI - - - - - - - - - - - Return on InvestmentSBT - - - - - - - - - - - Scenario-Based TrainingSDR - - - - - - - - - - - Service Difficulty ReportingSIPOC - - - - - - - - - Supplier, Input, Process, Output, Customers Data ProcessSMS - - - - - - - - - - - Safety Management SystemWBAT - - - - - - - - - Web-based Application Tool

1
The TransiTion From evenT reporTs To measurable organizaTional impacT: Workshop proceedings reporT
Background on Data Issues in MaintenanceData collection and analysis is hardly new to aviation. Since
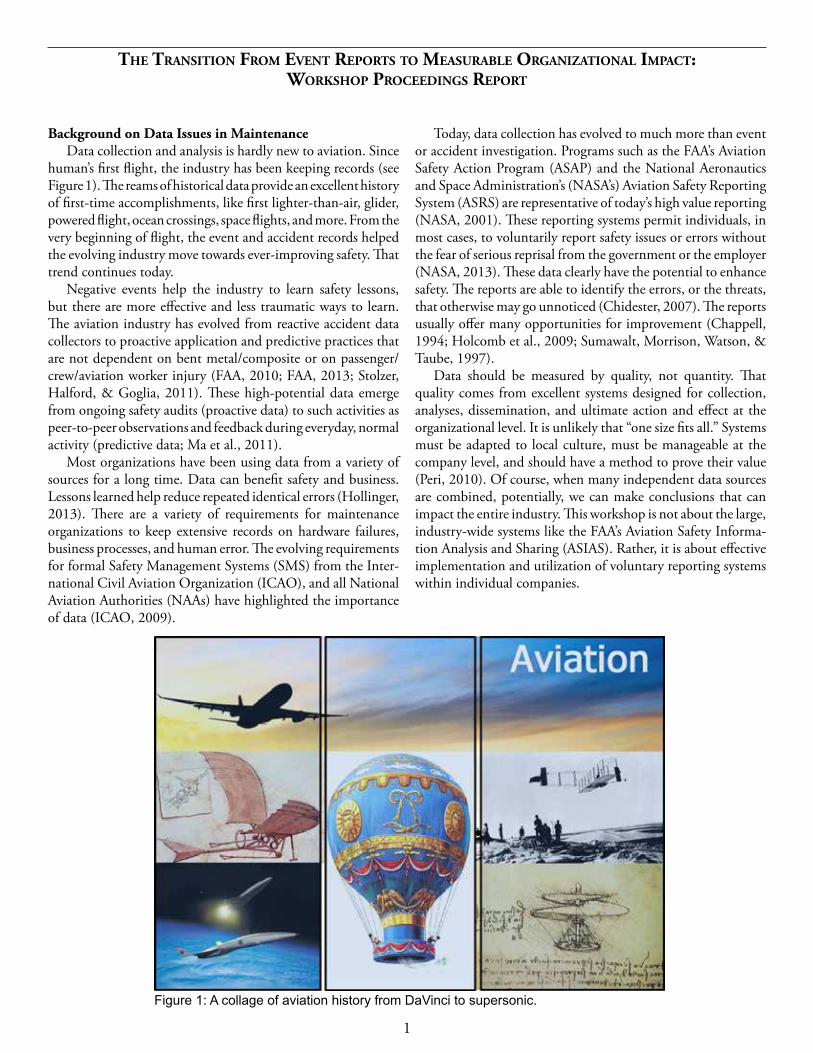
human’s first flight, the industry has been keeping records (see Figure 1). The reams of historical data provide an excellent history of first-time accomplishments, like first lighter-than-air, glider, powered flight, ocean crossings, space flights, and more. From the very beginning of flight, the event and accident records helped the evolving industry move towards ever-improving safety. That trend continues today.
Negative events help the industry to learn safety lessons, but there are more effective and less traumatic ways to learn. The aviation industry has evolved from reactive accident data collectors to proactive application and predictive practices that are not dependent on bent metal/composite or on passenger/crew/aviation worker injury (FAA, 2010; FAA, 2013; Stolzer, Halford, & Goglia, 2011). These high-potential data emerge from ongoing safety audits (proactive data) to such activities as peer-to-peer observations and feedback during everyday, normal activity (predictive data; Ma et al., 2011).
Most organizations have been using data from a variety of sources for a long time. Data can benefit safety and business. Lessons learned help reduce repeated identical errors (Hollinger, 2013). There are a variety of requirements for maintenance organizations to keep extensive records on hardware failures, business processes, and human error. The evolving requirements for formal Safety Management Systems (SMS) from the Inter-national Civil Aviation Organization (ICAO), and all National Aviation Authorities (NAAs) have highlighted the importance of data (ICAO, 2009).
Today, data collection has evolved to much more than event or accident investigation. Programs such as the FAA’s Aviation Safety Action Program (ASAP) and the National Aeronautics and Space Administration’s (NASA’s) Aviation Safety Reporting System (ASRS) are representative of today’s high value reporting (NASA, 2001). These reporting systems permit individuals, in most cases, to voluntarily report safety issues or errors without the fear of serious reprisal from the government or the employer (NASA, 2013). These data clearly have the potential to enhance safety. The reports are able to identify the errors, or the threats, that otherwise may go unnoticed (Chidester, 2007). The reports usually offer many opportunities for improvement (Chappell, 1994; Holcomb et al., 2009; Sumawalt, Morrison, Watson, & Taube, 1997).
Data should be measured by quality, not quantity. That quality comes from excellent systems designed for collection, analyses, dissemination, and ultimate action and effect at the organizational level. It is unlikely that “one size fits all.” Systems must be adapted to local culture, must be manageable at the company level, and should have a method to prove their value (Peri, 2010). Of course, when many independent data sources are combined, potentially, we can make conclusions that can impact the entire industry. This workshop is not about the large, industry-wide systems like the FAA’s Aviation Safety Informa-tion Analysis and Sharing (ASIAS). Rather, it is about effective implementation and utilization of voluntary reporting systems within individual companies.
Figure 1: A collage of aviation history from DaVinci to supersonic.
2
Workshop AttendeesThe workshop planners invited participants involved in the
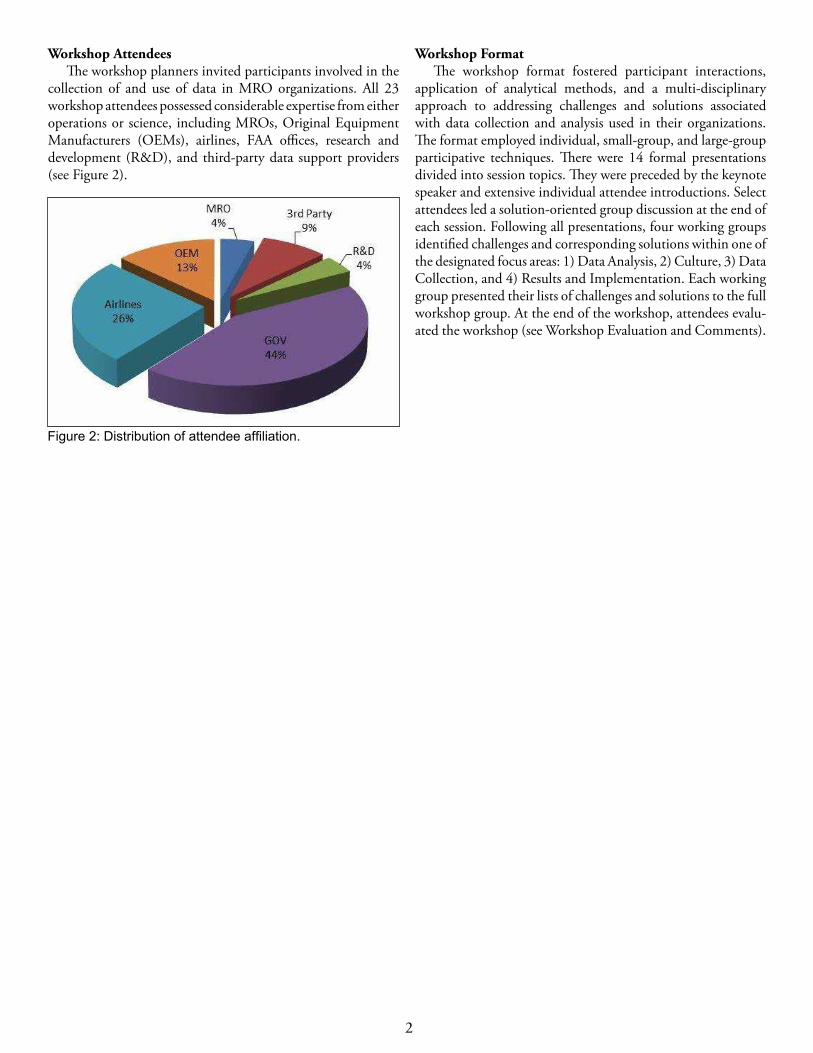
collection of and use of data in MRO organizations. All 23 workshop attendees possessed considerable expertise from either operations or science, including MROs, Original Equipment Manufacturers (OEMs), airlines, FAA offices, research and development (R&D), and third-party data support providers (see Figure 2).
Workshop FormatThe workshop format fostered participant interactions,
application of analytical methods, and a multi-disciplinary approach to addressing challenges and solutions associated with data collection and analysis used in their organizations. The format employed individual, small-group, and large-group participative techniques. There were 14 formal presentations divided into session topics. They were preceded by the keynote speaker and extensive individual attendee introductions. Select attendees led a solution-oriented group discussion at the end of each session. Following all presentations, four working groups identified challenges and corresponding solutions within one of the designated focus areas: 1) Data Analysis, 2) Culture, 3) Data Collection, and 4) Results and Implementation. Each working group presented their lists of challenges and solutions to the full workshop group. At the end of the workshop, attendees evalu-ated the workshop (see Workshop Evaluation and Comments).
Figure 2: Distribution of attendee affiliation.
3
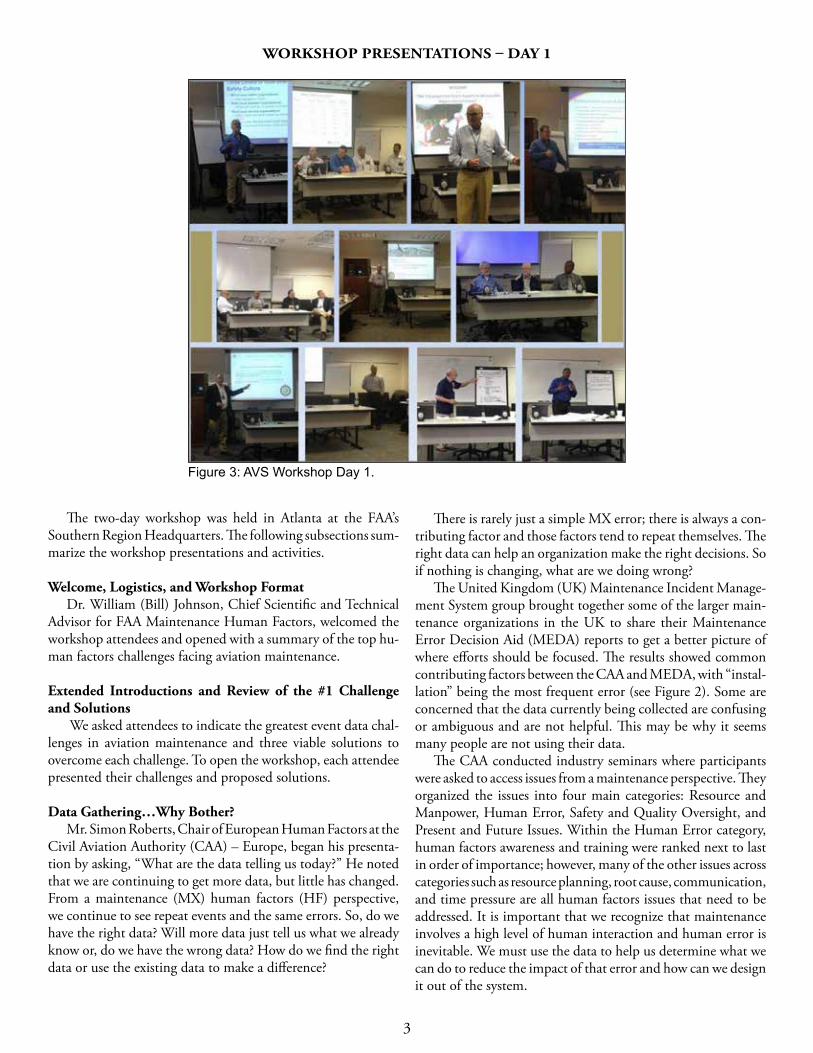
WORKSHOP PRESENTATIONS – DAY 1
The two-day workshop was held in Atlanta at the FAA’s Southern Region Headquarters. The following subsections sum-marize the workshop presentations and activities.
Welcome, Logistics, and Workshop FormatDr. William (Bill) Johnson, Chief Scientific and Technical
Advisor for FAA Maintenance Human Factors, welcomed the workshop attendees and opened with a summary of the top hu-man factors challenges facing aviation maintenance.
Extended Introductions and Review of the #1 Challenge and Solutions
We asked attendees to indicate the greatest event data chal-lenges in aviation maintenance and three viable solutions to overcome each challenge. To open the workshop, each attendee presented their challenges and proposed solutions.
Data Gathering…Why Bother? Mr. Simon Roberts, Chair of European Human Factors at the
Civil Aviation Authority (CAA) – Europe, began his presenta-tion by asking, “What are the data telling us today?” He noted that we are continuing to get more data, but little has changed. From a maintenance (MX) human factors (HF) perspective, we continue to see repeat events and the same errors. So, do we have the right data? Will more data just tell us what we already know or, do we have the wrong data? How do we find the right data or use the existing data to make a difference?
Figure 3: AVS Workshop Day 1.
There is rarely just a simple MX error; there is always a con-tributing factor and those factors tend to repeat themselves. The right data can help an organization make the right decisions. So if nothing is changing, what are we doing wrong?
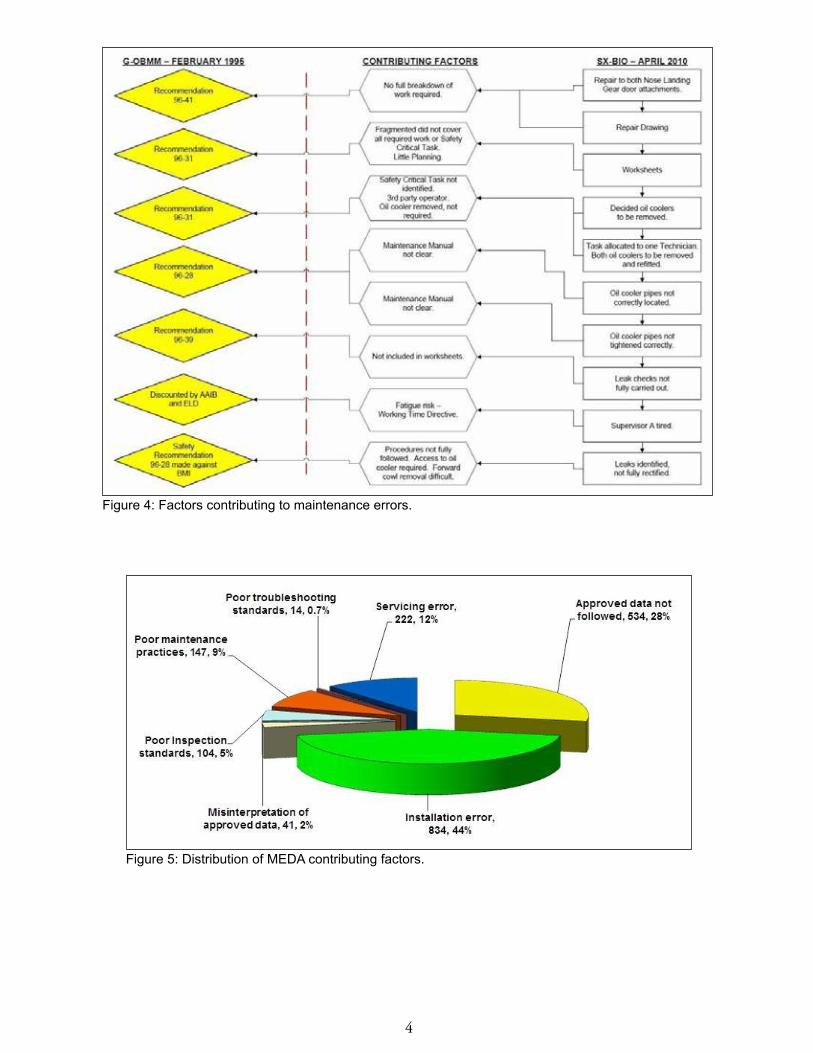
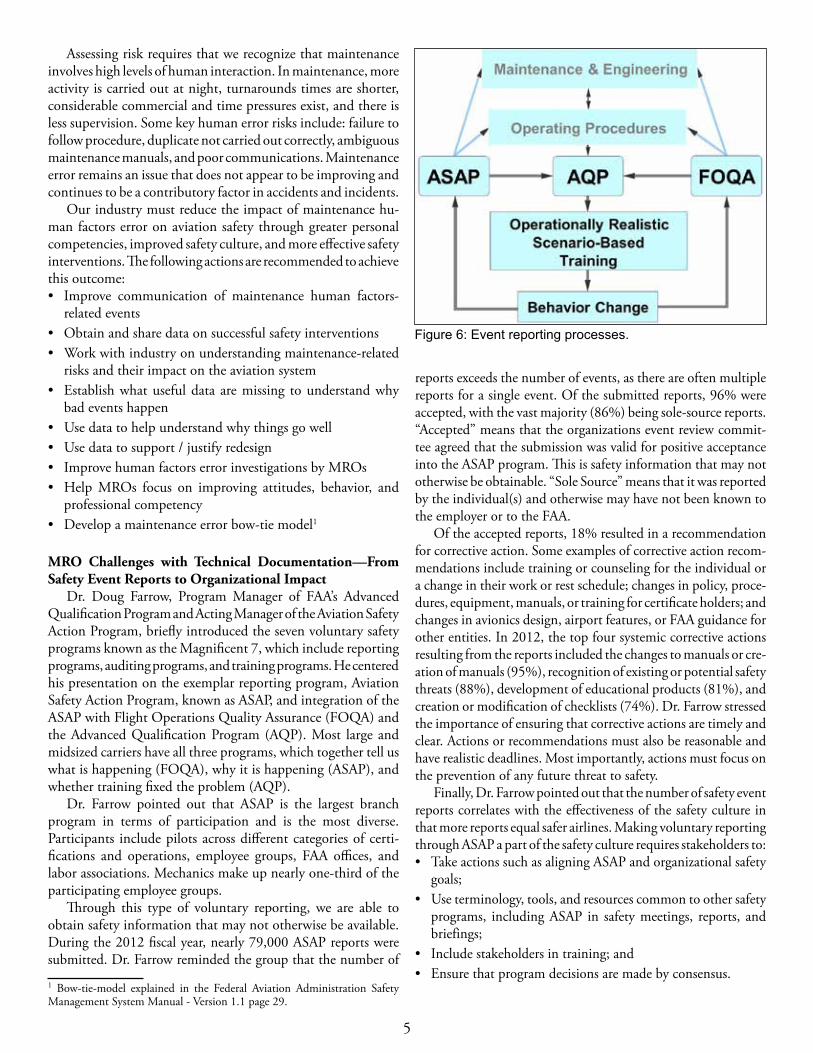
The United Kingdom (UK) Maintenance Incident Manage-ment System group brought together some of the larger main-tenance organizations in the UK to share their Maintenance Error Decision Aid (MEDA) reports to get a better picture of where efforts should be focused. The results showed common contributing factors between the CAA and MEDA, with “instal-lation” being the most frequent error (see Figure 2). Some are concerned that the data currently being collected are confusing or ambiguous and are not helpful. This may be why it seems many people are not using their data.
The CAA conducted industry seminars where participants were asked to access issues from a maintenance perspective. They organized the issues into four main categories: Resource and Manpower, Human Error, Safety and Quality Oversight, and Present and Future Issues. Within the Human Error category, human factors awareness and training were ranked next to last in order of importance; however, many of the other issues across categories such as resource planning, root cause, communication, and time pressure are all human factors issues that need to be addressed. It is important that we recognize that maintenance involves a high level of human interaction and human error is inevitable. We must use the data to help us determine what we can do to reduce the impact of that error and how can we design it out of the system.
4
Figure 4: Factors contributing to maintenance errors.
Figure 5: Distribution of MEDA contributing factors.
5
Assessing risk requires that we recognize that maintenance involves high levels of human interaction. In maintenance, more activity is carried out at night, turnarounds times are shorter, considerable commercial and time pressures exist, and there is less supervision. Some key human error risks include: failure to follow procedure, duplicate not carried out correctly, ambiguous maintenance manuals, and poor communications. Maintenance error remains an issue that does not appear to be improving and continues to be a contributory factor in accidents and incidents.
Our industry must reduce the impact of maintenance hu-man factors error on aviation safety through greater personal competencies, improved safety culture, and more effective safety interventions. The following actions are recommended to achieve this outcome:• Improve communication of maintenance human factors-
related events• Obtain and share data on successful safety interventions• Work with industry on understanding maintenance-related
risks and their impact on the aviation system• Establish what useful data are missing to understand why
bad events happen• Use data to help understand why things go well• Use data to support / justify redesign• Improve human factors error investigations by MROs • Help MROs focus on improving attitudes, behavior, and
professional competency• Develop a maintenance error bow-tie model1
MRO Challenges with Technical Documentation—From Safety Event Reports to Organizational Impact
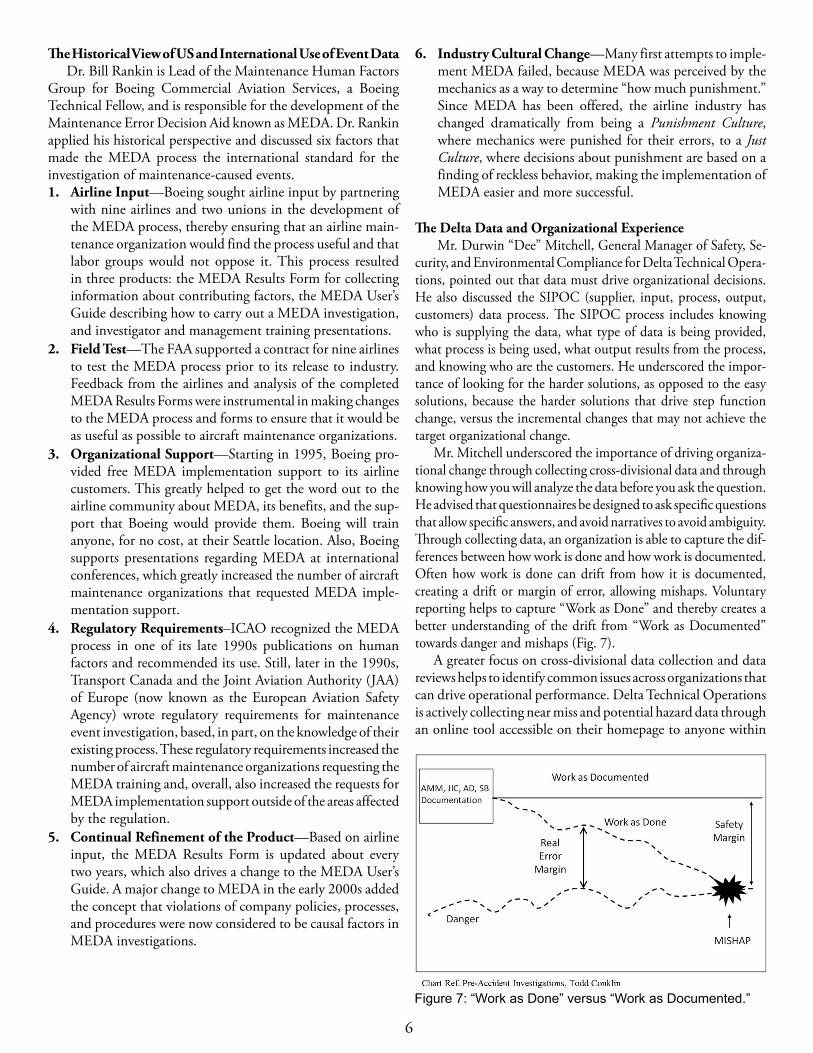
Dr. Doug Farrow, Program Manager of FAA’s Advanced Qualification Program and Acting Manager of the Aviation Safety Action Program, briefly introduced the seven voluntary safety programs known as the Magnificent 7, which include reporting programs, auditing programs, and training programs. He centered his presentation on the exemplar reporting program, Aviation Safety Action Program, known as ASAP, and integration of the ASAP with Flight Operations Quality Assurance (FOQA) and the Advanced Qualification Program (AQP). Most large and midsized carriers have all three programs, which together tell us what is happening (FOQA), why it is happening (ASAP), and whether training fixed the problem (AQP).
Dr. Farrow pointed out that ASAP is the largest branch program in terms of participation and is the most diverse. Participants include pilots across different categories of certi-fications and operations, employee groups, FAA offices, and labor associations. Mechanics make up nearly one-third of the participating employee groups.
Through this type of voluntary reporting, we are able to obtain safety information that may not otherwise be available. During the 2012 fiscal year, nearly 79,000 ASAP reports were submitted. Dr. Farrow reminded the group that the number of
1 Bow-tie-model explained in the Federal Aviation Administration Safety Management System Manual - Version 1.1 page 29.
reports exceeds the number of events, as there are often multiple reports for a single event. Of the submitted reports, 96% were accepted, with the vast majority (86%) being sole-source reports. “Accepted” means that the organizations event review commit-tee agreed that the submission was valid for positive acceptance into the ASAP program. This is safety information that may not otherwise be obtainable. “Sole Source” means that it was reported by the individual(s) and otherwise may have not been known to the employer or to the FAA.
Of the accepted reports, 18% resulted in a recommendation for corrective action. Some examples of corrective action recom-mendations include training or counseling for the individual or a change in their work or rest schedule; changes in policy, proce-dures, equipment, manuals, or training for certificate holders; and changes in avionics design, airport features, or FAA guidance for other entities. In 2012, the top four systemic corrective actions resulting from the reports included the changes to manuals or cre-ation of manuals (95%), recognition of existing or potential safety threats (88%), development of educational products (81%), and creation or modification of checklists (74%). Dr. Farrow stressed the importance of ensuring that corrective actions are timely and clear. Actions or recommendations must also be reasonable and have realistic deadlines. Most importantly, actions must focus on the prevention of any future threat to safety.
Finally, Dr. Farrow pointed out that the number of safety event reports correlates with the effectiveness of the safety culture in that more reports equal safer airlines. Making voluntary reporting through ASAP a part of the safety culture requires stakeholders to:• Take actions such as aligning ASAP and organizational safety
goals; • Use terminology, tools, and resources common to other safety
programs, including ASAP in safety meetings, reports, and briefings;
• Include stakeholders in training; and • Ensure that program decisions are made by consensus.
Figure 6: Event reporting processes.
6
The Historical View of US and International Use of Event DataDr. Bill Rankin is Lead of the Maintenance Human Factors
Group for Boeing Commercial Aviation Services, a Boeing Technical Fellow, and is responsible for the development of the Maintenance Error Decision Aid known as MEDA. Dr. Rankin applied his historical perspective and discussed six factors that made the MEDA process the international standard for the investigation of maintenance-caused events.1. Airline Input—Boeing sought airline input by partnering
with nine airlines and two unions in the development of the MEDA process, thereby ensuring that an airline main-tenance organization would find the process useful and that labor groups would not oppose it. This process resulted in three products: the MEDA Results Form for collecting information about contributing factors, the MEDA User’s Guide describing how to carry out a MEDA investigation, and investigator and management training presentations.
2. Field Test—The FAA supported a contract for nine airlines to test the MEDA process prior to its release to industry. Feedback from the airlines and analysis of the completed MEDA Results Forms were instrumental in making changes to the MEDA process and forms to ensure that it would be as useful as possible to aircraft maintenance organizations.
3. Organizational Support—Starting in 1995, Boeing pro-vided free MEDA implementation support to its airline customers. This greatly helped to get the word out to the airline community about MEDA, its benefits, and the sup-port that Boeing would provide them. Boeing will train anyone, for no cost, at their Seattle location. Also, Boeing supports presentations regarding MEDA at international conferences, which greatly increased the number of aircraft maintenance organizations that requested MEDA imple-mentation support.
4. Regulatory Requirements–ICAO recognized the MEDA process in one of its late 1990s publications on human factors and recommended its use. Still, later in the 1990s, Transport Canada and the Joint Aviation Authority (JAA) of Europe (now known as the European Aviation Safety Agency) wrote regulatory requirements for maintenance event investigation, based, in part, on the knowledge of their existing process. These regulatory requirements increased the number of aircraft maintenance organizations requesting the MEDA training and, overall, also increased the requests for MEDA implementation support outside of the areas affected by the regulation.
5. Continual Refinement of the Product—Based on airline input, the MEDA Results Form is updated about every two years, which also drives a change to the MEDA User’s Guide. A major change to MEDA in the early 2000s added the concept that violations of company policies, processes, and procedures were now considered to be causal factors in MEDA investigations.
6. Industry Cultural Change—Many first attempts to imple-ment MEDA failed, because MEDA was perceived by the mechanics as a way to determine “how much punishment.” Since MEDA has been offered, the airline industry has changed dramatically from being a Punishment Culture, where mechanics were punished for their errors, to a Just Culture, where decisions about punishment are based on a finding of reckless behavior, making the implementation of MEDA easier and more successful.
The Delta Data and Organizational Experience Mr. Durwin “Dee” Mitchell, General Manager of Safety, Se-
curity, and Environmental Compliance for Delta Technical Opera-tions, pointed out that data must drive organizational decisions. He also discussed the SIPOC (supplier, input, process, output, customers) data process. The SIPOC process includes knowing who is supplying the data, what type of data is being provided, what process is being used, what output results from the process, and knowing who are the customers. He underscored the impor-tance of looking for the harder solutions, as opposed to the easy solutions, because the harder solutions that drive step function change, versus the incremental changes that may not achieve the target organizational change.
Mr. Mitchell underscored the importance of driving organiza-tional change through collecting cross-divisional data and through knowing how you will analyze the data before you ask the question. He advised that questionnaires be designed to ask specific questions that allow specific answers, and avoid narratives to avoid ambiguity. Through collecting data, an organization is able to capture the dif-ferences between how work is done and how work is documented. Often how work is done can drift from how it is documented, creating a drift or margin of error, allowing mishaps. Voluntary reporting helps to capture “Work as Done” and thereby creates a better understanding of the drift from “Work as Documented” towards danger and mishaps (Fig. 7).
A greater focus on cross-divisional data collection and data reviews helps to identify common issues across organizations that can drive operational performance. Delta Technical Operations is actively collecting near miss and potential hazard data through an online tool accessible on their homepage to anyone within
Figure 7: “Work as Done” versus “Work as Documented.”
7
their organization. When a report is submitted online, an email is sent in real time to the Safety, Security, and Environmental Compliance staff for review and action. Additionally, the man-ager of the section where the report was made is also notified for review and action. Currently most reports are facility and equipment hazard reports. What the organization would like to see is more aircraft reports to help them examine potential process problems.
Delta conducted an internal survey of employees, which showed that 50% of people responding to the survey could not correlate report submission with how it potentially impacts or reduces employee injuries or aircraft accidents. Employees are not connected to the proactive approach and cannot connect the report and the outcome or are not sure how to understand the actions being taken. Delta is trying to bridge this disconnect using a system that allows employees to submit a report, see who is assigned to take action, the steps taken as a result of the report, and then whether or not there is closure. Finally, senior management must participate through monthly performance reviews designed to review and measure the data collected. These reviews ensure that management uses measureable results to drive organizational performance. It also helps management fully understand the data and trends so that decisions can be made in real time.
The Southwest Airlines Maintenance Data ExperienceMr. Rob Burner, Manager of the Continuing Analysis and Sur-
veillance System (CASS) Audit and Analysis team for Southwest Airlines -Dallas Love Field, described CASS’s responsibilities as providing a structured process for monitoring the performance and effectiveness of an airline’s inspection, preventative mainte-nance, and alterations programs. The primary goal is to reduce or eliminate the likelihood of an aircraft returning to service when it is not airworthy.
CASS uses a closed-loop process to identify deficiencies through data collection, analysis, corrective action, and follow-up (Fig. 8). The closed loop system provides follow-up or verifica-tion that corrective actions are being followed and are effective and reliable (FAA, 2003).
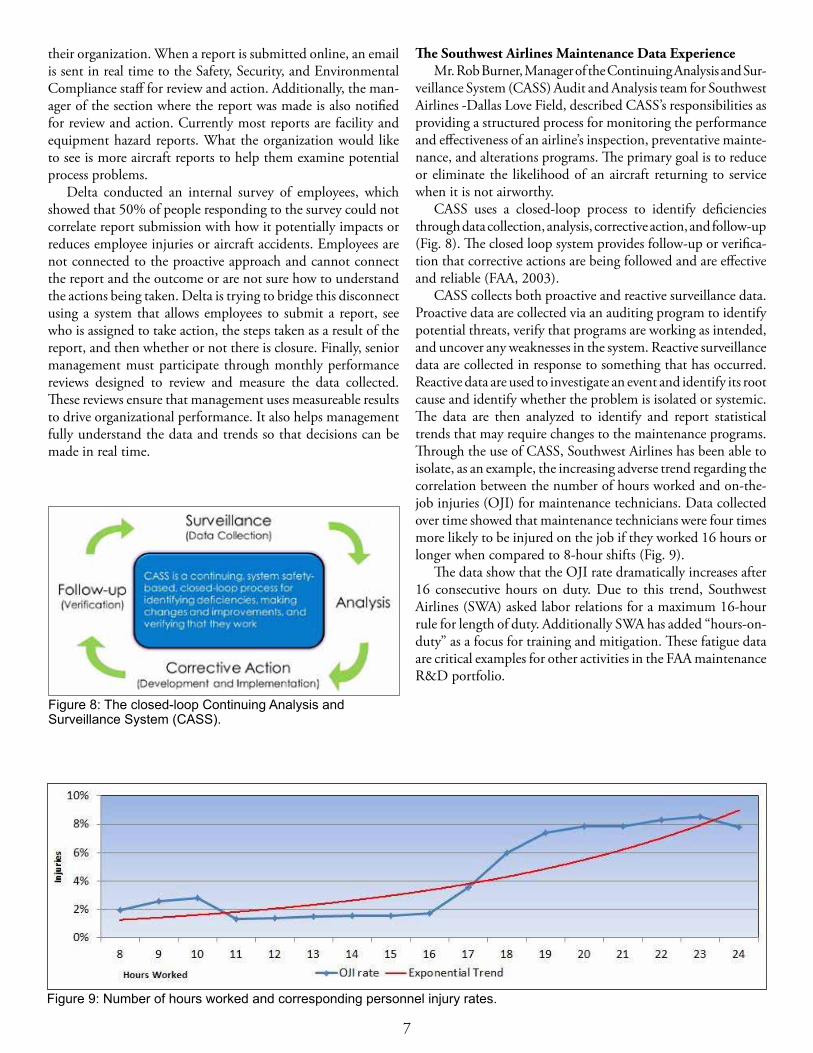
CASS collects both proactive and reactive surveillance data. Proactive data are collected via an auditing program to identify potential threats, verify that programs are working as intended, and uncover any weaknesses in the system. Reactive surveillance data are collected in response to something that has occurred. Reactive data are used to investigate an event and identify its root cause and identify whether the problem is isolated or systemic. The data are then analyzed to identify and report statistical trends that may require changes to the maintenance programs. Through the use of CASS, Southwest Airlines has been able to isolate, as an example, the increasing adverse trend regarding the correlation between the number of hours worked and on-the-job injuries (OJI) for maintenance technicians. Data collected over time showed that maintenance technicians were four times more likely to be injured on the job if they worked 16 hours or longer when compared to 8-hour shifts (Fig. 9).
The data show that the OJI rate dramatically increases after 16 consecutive hours on duty. Due to this trend, Southwest Airlines (SWA) asked labor relations for a maximum 16-hour rule for length of duty. Additionally SWA has added “hours-on-duty” as a focus for training and mitigation. These fatigue data are critical examples for other activities in the FAA maintenance R&D portfolio.
Figure 8: The closed-loop Continuing Analysis and Surveillance System (CASS).
Figure 9: Number of hours worked and corresponding personnel injury rates.
8
The Dirt on Data From Down Under – Reporting Leads to Predictive Error Management
Mr. Darren Cook, Manager of Air Safe program for Qantas Engineering, began his presentation by discussing what Qantas did wrong in implementing their error management model. Their goal is to help other organizations avoid some of the same pitfalls. The historical approach to maintenance safety is reactive, but the aviation industry must move to a more proactive and predictive error management model to identify the underlying causal factors before a safety event occurs.
Following a maintenance event, the historical approach was to identify the event that caused the error, who made the error, and then take punitive action. This reactive model provided no specialized investigative training, assessment of risk, application of a Just Policy, reporting system, and most importantly, it did not address bias within the process. These shortcomings led to investigations being based on event outcomes, recommenda-tions based on the last error, rather than a root cause, and a poor understanding of the MEDA process by employees and management, leading to mistrust and data not being collected on events.
What does it look like when it’s wrong, when an organization does not have a Just Policy? When policy is not used consistently, not applied across all activity, not used across the company, or when the focus is the event outcome rather than the root cause, the culture shows a lack of trust, loss of morale, and inconsistent reporting of events. Likewise, a workforce can become disengaged when event reporting is not easy to use or not encouraged. An ineffective system for prioritizing reports or poor feedback on reports or low-level reporting shows a lack of commitment by leaders and managers. Some of the early lessons learned were:• Event investigation must begin with good data and careful
analysis, followed by sound and thoughtful recommendations to prevent reoccurring events and discourage poor morale, rather than punitive action.
• A lack of management commitment sets a poor standard and negatively impacts the work culture.
• Management is responsible for setting and following policy and procedures and maintaining a consistent approach to people and maintenance error. The organization leadership must have a clear vision of directional goals and the work culture.
A successful approach to a true safety culture involves human factors and error management training that includes management; a Just Policy and accountability, an effective reporting system that includes confidential reporting, and error investigation training. The major reasons for increased reporting are:• Increased belief that Just Culture Principles will be followed.• Changing belief that reporting can and does make a difference.• Better understanding of reporting via Human Factors train-
ing program.• No Punitive actions outside of Just Policy.• An easy and accessible electronic reporting system.
• Providing people the time to make reports.• Good MEDA investigations and results.
To move from a reactive model to a proactive and predictive model, organizations must strategically analyse error reporting to identify the most error-prone tasks and error-prone systems. Moreover, we must provide the mitigations necessary for im-mediate action when they are needed. Ultimately, human error is unintentional and is both universal and inevitable. The challenge is to find the root causes and to deal with them in a proactive and predictive manner.
Just Culture and Event Data Reporting/Analysis at American Airlines
According to Mr. Hollins Smith, Compliance Manager for American Airlines at LAX, no system is 100% reliable. He said that systems should be designed for both system and human reliability – knowing that systems and humans will never be perfect. He noted that the following human performance factors should be considered for effective risk management:• Processes/procedures. • Equipment/tools. • Qualifications/skills. • Manpower.• Perception of risk.• Environment/facilities. • Organizational environment. • Supervision.• Communication.
Human error is defined as an inadvertent action; inadvertently doing other than what should have been done; a slip, lapse, or mistake. Managing behavioral choices and taking into account human error includes supporting the employee by having a learning conversation about why an error occurred and what can be done to prevent recurrence. Management must make human error less likely to occur and give employees the best chance to get the work done right and safely the first time.
At-risk behavior is a behavioral choice that increases risk where risk is not recognized or is mistakenly believed to be justified. Employees with at-risk behavior should be coached through a supportive discussion reinforcing safe behavioral choices. We must examine why individual(s) engage in at-risk behavior and frame solutions around the balance of incentives. However, when an employee exhibits reckless behavior (a choice to consciously disregard a substantial and unjustifiable risk), it is appropriate to take some level of corrective action. It is important to clearly communicate where the line for acceptable behavior is drawn.
The Just Culture AlgorithmTM (used by trained individuals) is the tool designed to assess the quality of the choices made (Marx, 2008). Using the tool enables fairness and consistency that can be replicated many times. It is focused on managing the quality of choices, regardless of the outcome and enables managers to move away from the severity bias.
9
Mr. Hollins said one of the keys to developing a Just Cul-ture is to take action now, do not wait for an adverse outcome to occur. We must focus on the quality of the choices, not the severity of the outcome.
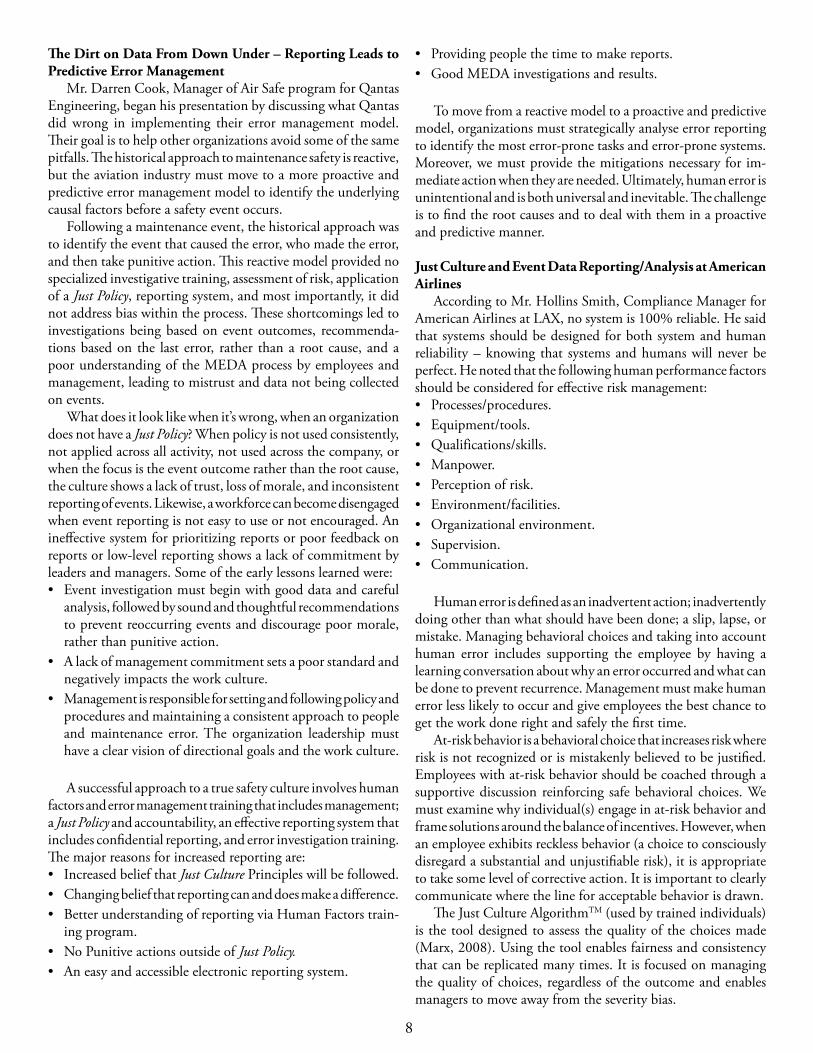
In 2011, the Just Culture model was applied to American Airlines policy and continuous training initiatives, and campaigns were conducted on human error, at-risk behavior, and reckless behavior. MEDA/Human factors training were incorporated into the American Airlines system and, in 2013, American Airlines began using an investigative tool tailored to encompass the Just Policy process and the determination of behavioral choices (Fig. 10). Within this program, the objectives of American Airlines are to:• Further the safety culture by expanding the Just Culture processes
beyond the confines of the ASAP.• Pull together disjointed error investigation processes (includ-
ing Supervisor/Quality investigation, Root Cause Investigation (MEDA), and ASAP Investigation).
• Develop the right level of accountability that is viewed as fair and just.
• Ensure organizational and individual learning produce a better performance organization.
Using Event Data to Affect Maintenance Training and Safety Mr. Nusret Bülent TOPCU, Maintenance Training Manager
for MNG Technic, discussed MNG’s goals of establishing a safe operating culture, creating awareness for safety, and improving efficiency, as well as the implications of the lack of safety aware-ness. Overall, the objectives are to reduce customer complaints and reduce the number of errors. MNG Technic believes this change will be driven by an organizational culture change, which is the root cause of almost all documented errors.
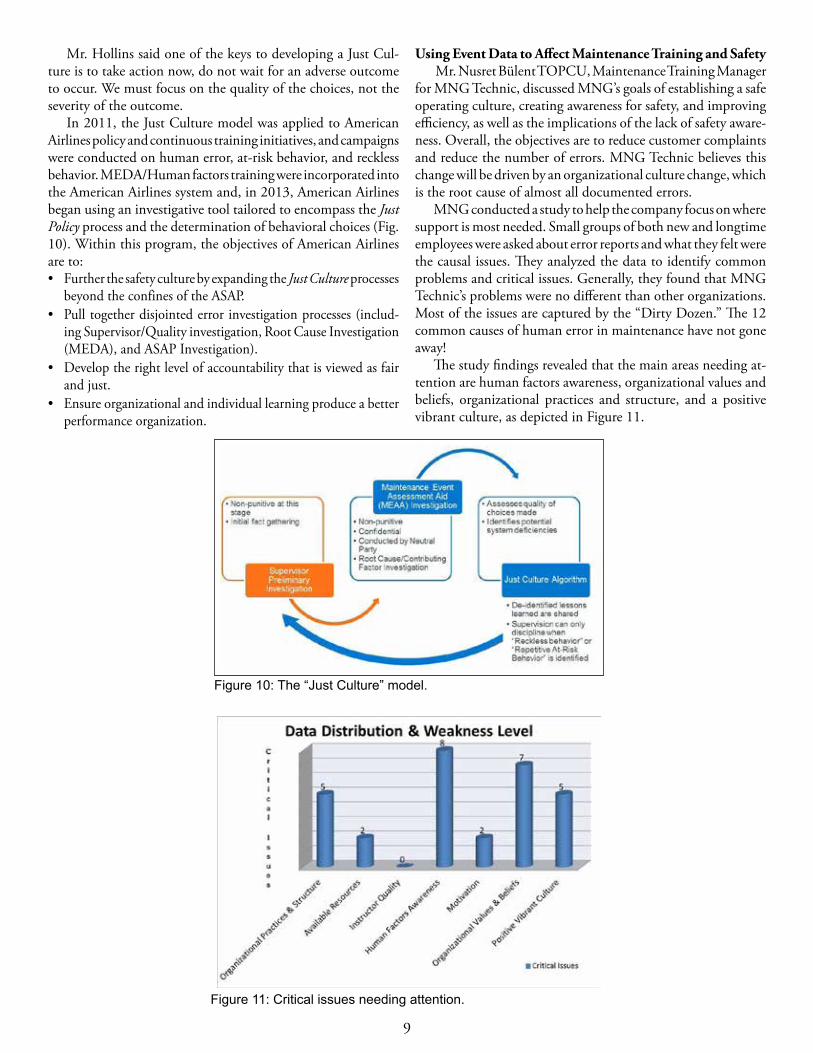
MNG conducted a study to help the company focus on where support is most needed. Small groups of both new and longtime employees were asked about error reports and what they felt were the causal issues. They analyzed the data to identify common problems and critical issues. Generally, they found that MNG Technic’s problems were no different than other organizations. Most of the issues are captured by the “Dirty Dozen.” The 12 common causes of human error in maintenance have not gone away!
The study findings revealed that the main areas needing at-tention are human factors awareness, organizational values and beliefs, organizational practices and structure, and a positive vibrant culture, as depicted in Figure 11.
Figure 10: The “Just Culture” model.
Figure 11: Critical issues needing attention.
10
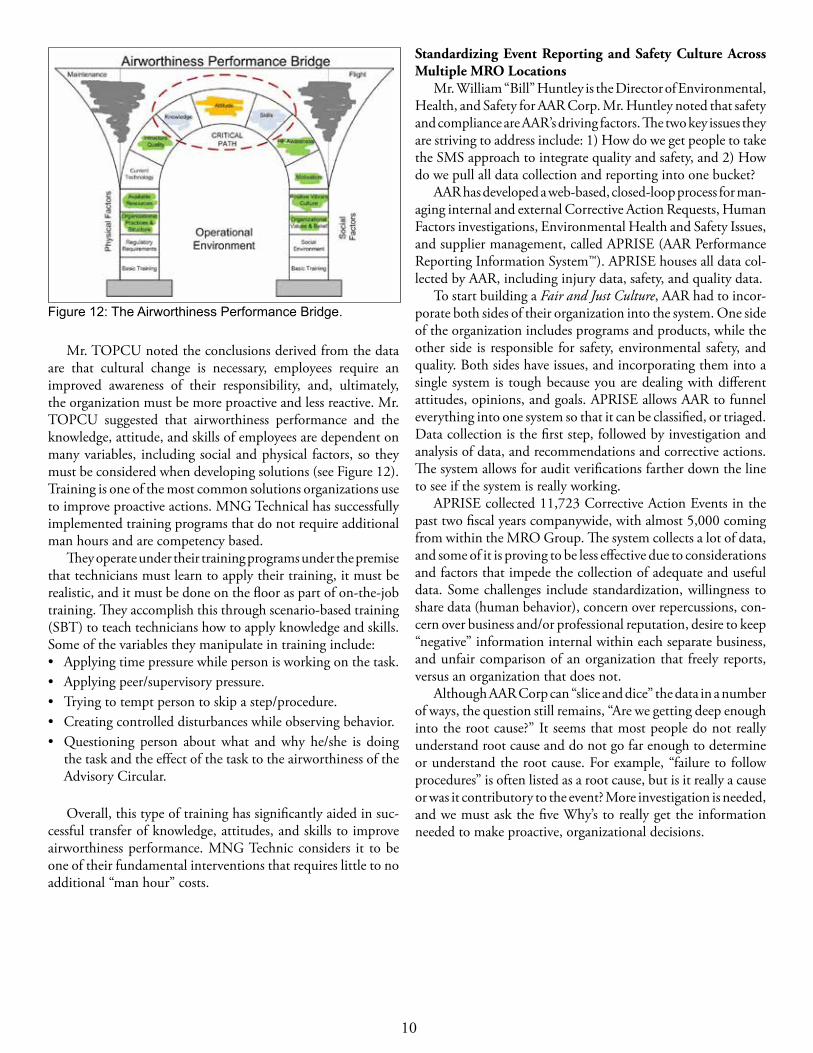
Mr. TOPCU noted the conclusions derived from the data are that cultural change is necessary, employees require an improved awareness of their responsibility, and, ultimately, the organization must be more proactive and less reactive. Mr. TOPCU suggested that airworthiness performance and the knowledge, attitude, and skills of employees are dependent on many variables, including social and physical factors, so they must be considered when developing solutions (see Figure 12). Training is one of the most common solutions organizations use to improve proactive actions. MNG Technical has successfully implemented training programs that do not require additional man hours and are competency based.
They operate under their training programs under the premise that technicians must learn to apply their training, it must be realistic, and it must be done on the floor as part of on-the-job training. They accomplish this through scenario-based training (SBT) to teach technicians how to apply knowledge and skills. Some of the variables they manipulate in training include:• Applying time pressure while person is working on the task.• Applying peer/supervisory pressure.• Trying to tempt person to skip a step/procedure.• Creating controlled disturbances while observing behavior.• Questioning person about what and why he/she is doing
the task and the effect of the task to the airworthiness of the Advisory Circular.
Overall, this type of training has significantly aided in suc-cessful transfer of knowledge, attitudes, and skills to improve airworthiness performance. MNG Technic considers it to be one of their fundamental interventions that requires little to no additional “man hour” costs.
Standardizing Event Reporting and Safety Culture Across Multiple MRO Locations
Mr. William “Bill” Huntley is the Director of Environmental, Health, and Safety for AAR Corp. Mr. Huntley noted that safety and compliance are AAR’s driving factors. The two key issues they are striving to address include: 1) How do we get people to take the SMS approach to integrate quality and safety, and 2) How do we pull all data collection and reporting into one bucket?
AAR has developed a web-based, closed-loop process for man-aging internal and external Corrective Action Requests, Human Factors investigations, Environmental Health and Safety Issues, and supplier management, called APRISE (AAR Performance Reporting Information System™). APRISE houses all data col-lected by AAR, including injury data, safety, and quality data.
To start building a Fair and Just Culture, AAR had to incor-porate both sides of their organization into the system. One side of the organization includes programs and products, while the other side is responsible for safety, environmental safety, and quality. Both sides have issues, and incorporating them into a single system is tough because you are dealing with different attitudes, opinions, and goals. APRISE allows AAR to funnel everything into one system so that it can be classified, or triaged. Data collection is the first step, followed by investigation and analysis of data, and recommendations and corrective actions. The system allows for audit verifications farther down the line to see if the system is really working.
APRISE collected 11,723 Corrective Action Events in the past two fiscal years companywide, with almost 5,000 coming from within the MRO Group. The system collects a lot of data, and some of it is proving to be less effective due to considerations and factors that impede the collection of adequate and useful data. Some challenges include standardization, willingness to share data (human behavior), concern over repercussions, con-cern over business and/or professional reputation, desire to keep “negative” information internal within each separate business, and unfair comparison of an organization that freely reports, versus an organization that does not.
Although AAR Corp can “slice and dice” the data in a number of ways, the question still remains, “Are we getting deep enough into the root cause?” It seems that most people do not really understand root cause and do not go far enough to determine or understand the root cause. For example, “failure to follow procedures” is often listed as a root cause, but is it really a cause or was it contributory to the event? More investigation is needed, and we must ask the five Why’s to really get the information needed to make proactive, organizational decisions.
Figure 12: The Airworthiness Performance Bridge.
11
Using Qualitative Data from NASA’s Aviation Safety Reporting System (ASRS)
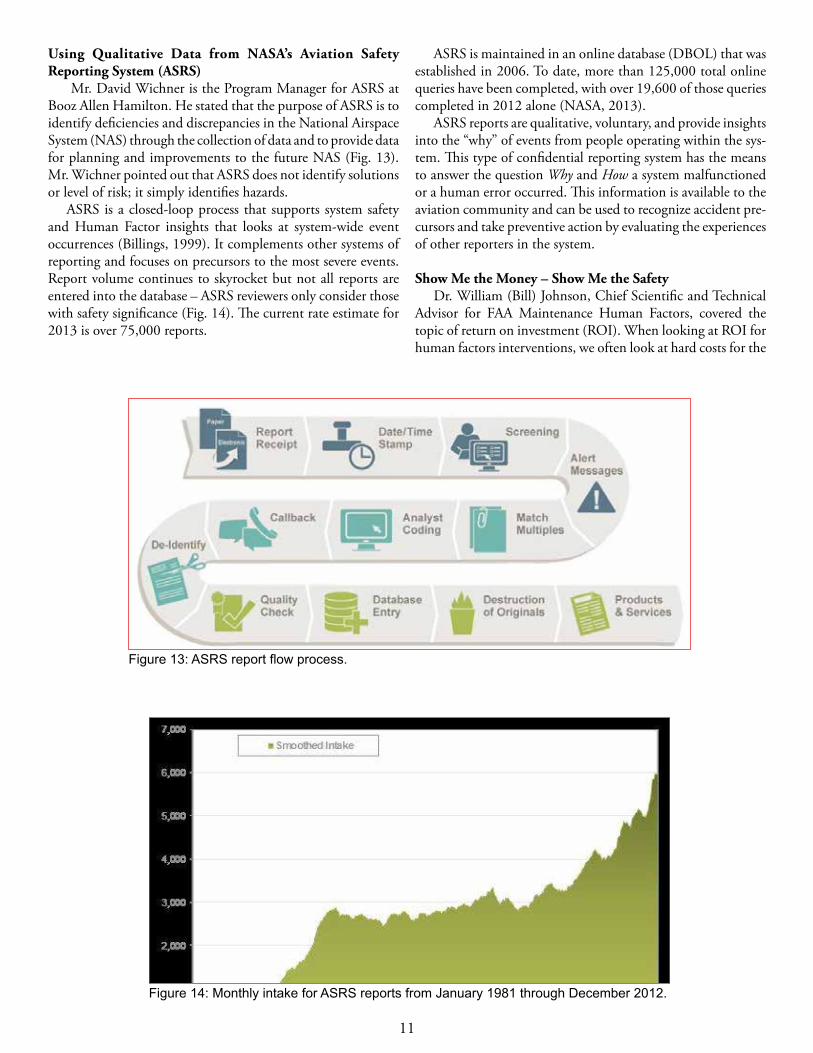
Mr. David Wichner is the Program Manager for ASRS at Booz Allen Hamilton. He stated that the purpose of ASRS is to identify deficiencies and discrepancies in the National Airspace System (NAS) through the collection of data and to provide data for planning and improvements to the future NAS (Fig. 13). Mr. Wichner pointed out that ASRS does not identify solutions or level of risk; it simply identifies hazards.
ASRS is a closed-loop process that supports system safety and Human Factor insights that looks at system-wide event occurrences (Billings, 1999). It complements other systems of reporting and focuses on precursors to the most severe events. Report volume continues to skyrocket but not all reports are entered into the database – ASRS reviewers only consider those with safety significance (Fig. 14). The current rate estimate for 2013 is over 75,000 reports.
ASRS is maintained in an online database (DBOL) that was established in 2006. To date, more than 125,000 total online queries have been completed, with over 19,600 of those queries completed in 2012 alone (NASA, 2013).
ASRS reports are qualitative, voluntary, and provide insights into the “why” of events from people operating within the sys-tem. This type of confidential reporting system has the means to answer the question Why and How a system malfunctioned or a human error occurred. This information is available to the aviation community and can be used to recognize accident pre-cursors and take preventive action by evaluating the experiences of other reporters in the system.
Show Me the Money – Show Me the SafetyDr. William (Bill) Johnson, Chief Scientific and Technical
Advisor for FAA Maintenance Human Factors, covered the topic of return on investment (ROI). When looking at ROI for human factors interventions, we often look at hard costs for the
Figure 13: ASRS report flow process.
Figure 14: Monthly intake for ASRS reports from January 1981 through December 2012.
12
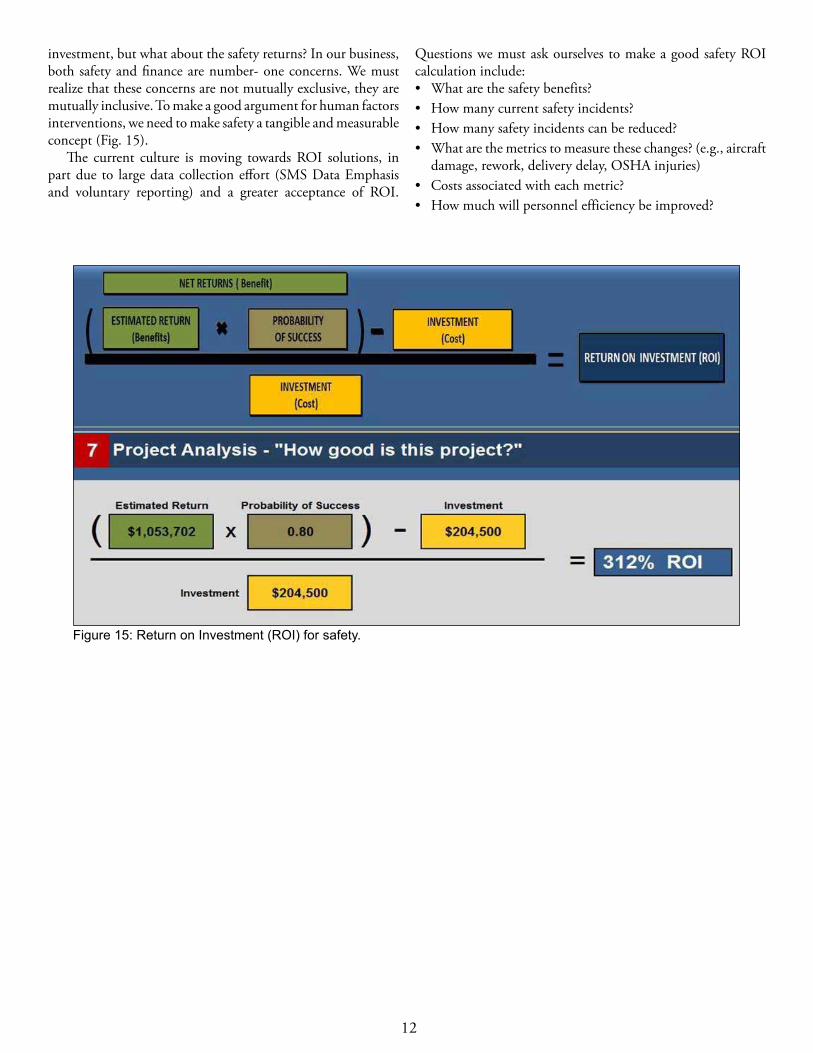
investment, but what about the safety returns? In our business, both safety and finance are number- one concerns. We must realize that these concerns are not mutually exclusive, they are mutually inclusive. To make a good argument for human factors interventions, we need to make safety a tangible and measurable concept (Fig. 15).
The current culture is moving towards ROI solutions, in part due to large data collection effort (SMS Data Emphasis and voluntary reporting) and a greater acceptance of ROI.
Questions we must ask ourselves to make a good safety ROI calculation include: • What are the safety benefits? • How many current safety incidents?• How many safety incidents can be reduced?• What are the metrics to measure these changes? (e.g., aircraft
damage, rework, delivery delay, OSHA injuries)• Costs associated with each metric?• How much will personnel efficiency be improved?
Figure 15: Return on Investment (ROI) for safety.
13
WORKSHOP PRESENTATIONS – DAY 2
Maintenance and Ramp Line Operations Safety Assessment (M-LOSA/R-LOSA)
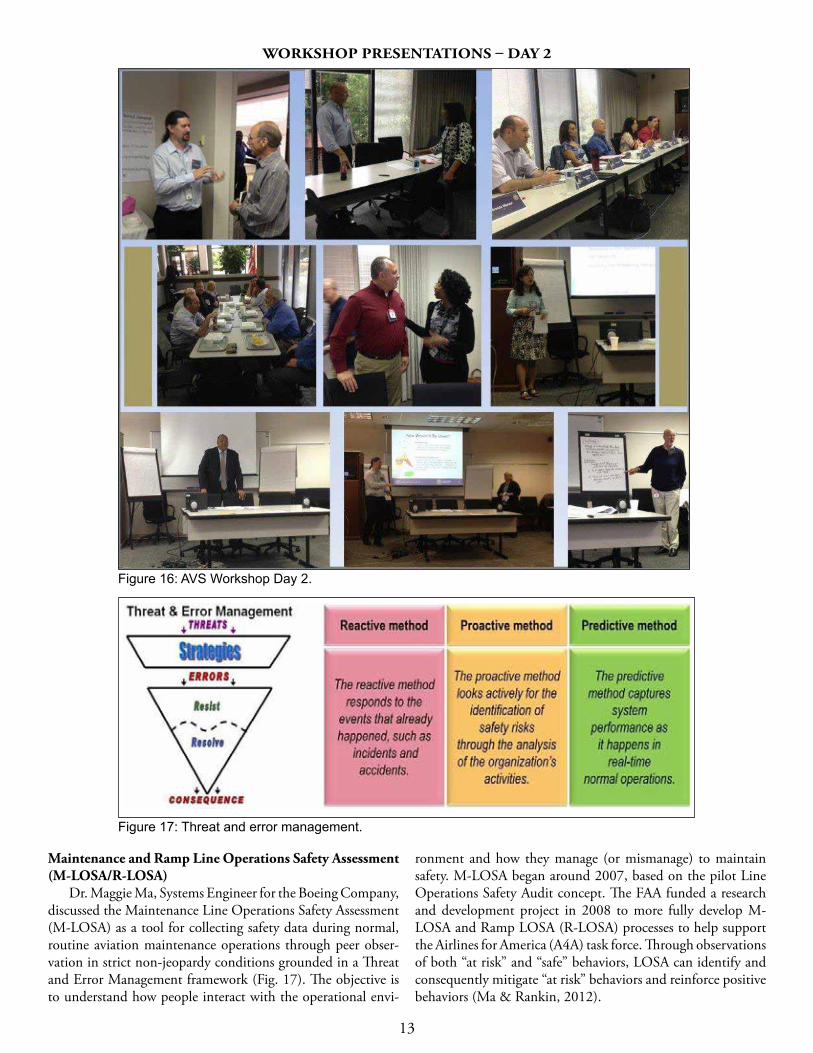
Dr. Maggie Ma, Systems Engineer for the Boeing Company, discussed the Maintenance Line Operations Safety Assessment (M-LOSA) as a tool for collecting safety data during normal, routine aviation maintenance operations through peer obser-vation in strict non-jeopardy conditions grounded in a Threat and Error Management framework (Fig. 17). The objective is to understand how people interact with the operational envi-
ronment and how they manage (or mismanage) to maintain safety. M-LOSA began around 2007, based on the pilot Line Operations Safety Audit concept. The FAA funded a research and development project in 2008 to more fully develop M-LOSA and Ramp LOSA (R-LOSA) processes to help support the Airlines for America (A4A) task force. Through observations of both “at risk” and “safe” behaviors, LOSA can identify and consequently mitigate “at risk” behaviors and reinforce positive behaviors (Ma & Rankin, 2012).
Figure 16: AVS Workshop Day 2.
Figure 17: Threat and error management.

14
Boeing provides training and support in reactive identifica-tion processes such as MEDA (Maintenance Error Decision Aid) and Ramp Error Decision Aid (REDA). MEDA has become the industry’s standard for maintenance event investigation due to the continuous and consistent support (free training and guidance) by The Boeing Company. It is well supported and endorsed by labor unions and groups. Dr. Ma suggested applying best prac-tices learned from MEDA to M-LOSA/R-LOSA (a predictive identification process) for a fully successful program. Some of the most critical items for success include:• Continuous and consistent support through observation
training, • Alignment with ICAO recommendations and other national
requirements, • Demonstration of ROI, • Guidance on how to integrate M-LOSA/R-LOSA data with
other safety data, • Options for data sharing, • Facilitated customization and information of data sharing
among M-LOSA/R-LOSA users, • Integration of user feedback, • Regular updates of the suite of tools, • Understanding of safety culture, • Establishment of a good safety culture, and • Centralized website for M-LOSA/R-LOSA materials.
Web-Based Data Collection and Analysis With the Web-Based Application Tool (WBAT)
Ms. Nicky Armour, ASAP/SMS WBAT Manager for UTRS Corporation noted that WBAT is used by over 90% of all ASAP programs. It is an online data collection, management, and analysis tool integrated into many of the industry safety programs including: 121 Maintenance ASAP, MRO ASAP, 135, 121 Incident reporting, and Maintenance Fatigue Reporting. The initial data collection by first responders (i.e., mechanics, MOC, supervisors, contract mechanics) to an event, incident or potential hazard is key to good data management, which results in accurate data analysis, which in return results in “change”’ by applying corrective actions from the learned data. The submission forms should be customizable to represent the employee’s work environment, be intuitive, simple, yet robust enough to collect meaningful data. WBAT has identified some lessons learned in data collection efforts. For example, some operators fail to review and customize the initial submission form and update it to capture a change in operation. This can lead to mistaken and inaccurate representation of the intent of the report. Other problems that can prevent a person from reporting or increase the possibly of reporting inaccurate information include: • Form is too long or too short to analyze and trend.• No training or guidance on how and when to submit.• Form is misunderstood.• Lack of computers where data can be privately submitted.• Unsure of what is ASAP reportable or incident reportable.
Data management consists of reviewing the submitted data for accuracy, validation, and further definition. A copy of the original submission is created, then analyzed after the collected information has been reviewed, investigated and validated. Review and further “coding” of the submission is necessary to ensure that the data are understood correctly for trending, by a third party and for applying the right corrective measures (Fig. 18). It is important to have an individual of the same discipline (maintenance background) to process and analyzing the data. WBAT provides software solutions and best tips and practices to operators for managing their safety programs. Because there is no defined skill set for the position within an organization, is often time spent explaining why the maintenance form should have certain fields, the difference between ASAP and Incident, or encouraging fatigue reports be enabled.
Ms. Armour suggested that collecting data just for the sake of getting a lot of information does not mean that you are able to analyze the piles of data that have been accumulated. Good analysis of the data consist of collecting quality data for a period of time that is uniform, managed, and validated, easy to access, and all in one system. Analysis should be done at a high enough level to give the organization a “big picture” to provide execu-tive summaries and custom analysis. Additionally, comparative analysis assesses the effectiveness of the corrective action and provides a side by side look at the trends by determining if your corrective action was successful.
Aviation Data Exchange for Real Time Maintenance Data Reporting/Analysis
Mr. Keith Lardie is an aerospace engineer in the FAA’s En-gineering Procedures Office and Ms. Pennie Thompson is the Program Manager of the Service Difficulty Reporting Program. They discussed the Aviation Data Exchange (AVDEX), a real-time maintenance data exchange that will dramatically improve the way safety information is shared. The FAA will expand AVDEX by absorbing the functions of the Service Difficulty Reporting (SDR) system. During initial rollout, participation by regulated entities will be optional. One of the initiatives of the AVDEX
Figure 18: WBAT guidance on analyzing data inputs.

15
is to better facilitate communication methods with the public community and the aviation industry to identify potential safety issues and spot trends by improving the way people with aircraft questions find people with answers to those questions. As a result, the FAA believes that it can speed up the process of reducing the risk in aviation. The service will be moderated by the FAA to purge incorrect information, derogatory (flame wars) or otherwise inappropriate information, and self-serving information (product advertisements). AVDEX will potentially enhance reporting by engaging the general aviation community, promote end-user adoption of an aviation safety tool for pilots/aircraft owners (Part 91), Independent Maintenance Providers (Parts 43, 65), and will be expanded to include regulated report-ing (e.g., Parts 121, 135, 145).
The current SDR system, geared toward desktop/workstation computing, is a tedious process, requiring the user to fill out and submit a form that must be manually entered into the SDR database. Multiple systems may be involved addressing similar information and if a report is unavailable online to users for weeks or months. The future is AVDEX, by capturing data in an easy-to-use, “one-stop-shop” tool that is not tied to a desktop computer but engages the public through mobile technology (Fig. 19). The information will be submitted directly into the system with the data immediately available to users anytime, anywhere. Users will receive instant feedback and direction to
additional information. Improved search capability creates an online community capable of instantly sharing knowledge and learning tools. Information generated will be more than indi-vidual reports but also solutions and best practices, bringing an educational aspect. Other benefits include better ability to spot trends in real time, before an accident occurs, and “data” will be available to AVDEX not just as reports, but also the conversa-tions regarding these reports. AVDEX will improve the access to data to support International Civil Aviation Organization (ICAO) SMS as well as the FAA’s internal SMS, which, in turn, supports numerous other mandates and programs, including ICAO SMS/SSP, NexGen and Destination 2025. Information sharing along with feedback on solutions is now possible with new networking strategies.
AVDEX will offer both security and expanded features. Personal and identifying information will be protected. You will have the option to select your preferences and customize how you interface with the networks. The idea is that anyone who has a device connected to the Internet should be able to access information and contribute. But keep in mind that this is an early look into what the service might look like, and that the final structure, including how to comment and rank the problems and solutions, will change based on aviation community input, among other things.
Figure 19: AVDEX utilization of multiple technology tools.
16
SMALL GROUP WORK SESSION – DAY 2
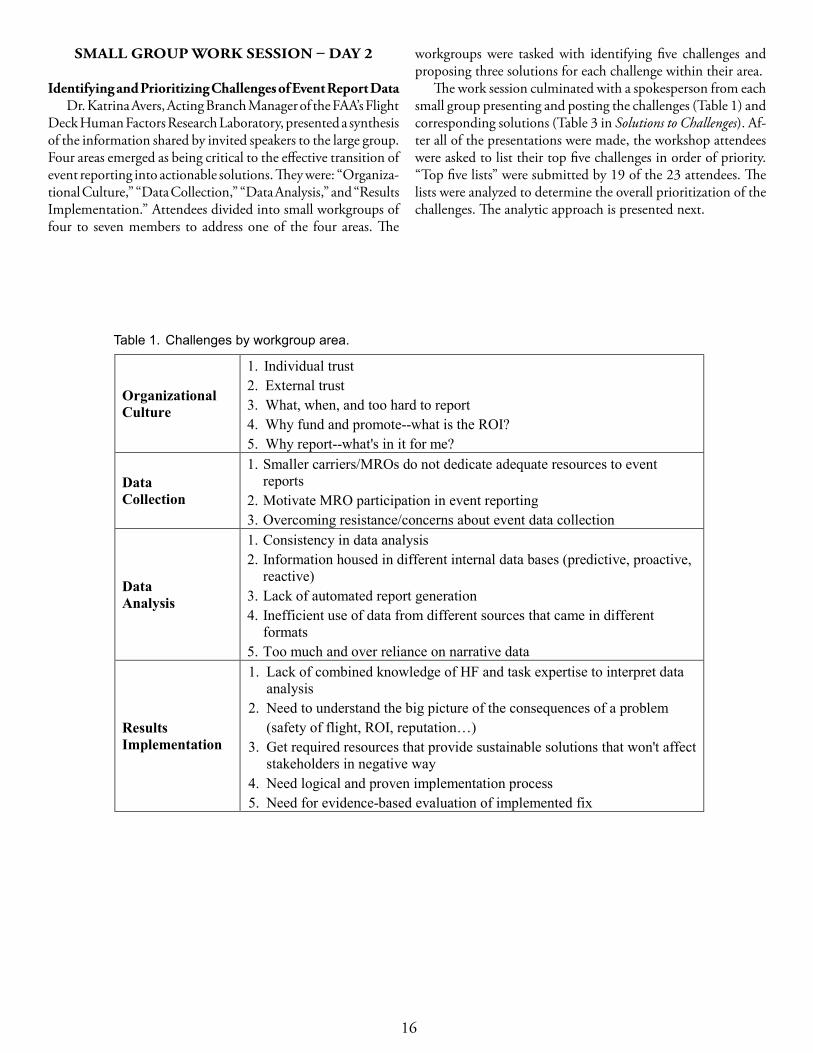
Identifying and Prioritizing Challenges of Event Report DataDr. Katrina Avers, Acting Branch Manager of the FAA’s Flight
Deck Human Factors Research Laboratory, presented a synthesis of the information shared by invited speakers to the large group. Four areas emerged as being critical to the effective transition of event reporting into actionable solutions. They were: “Organiza-tional Culture,” “Data Collection,” “Data Analysis,” and “Results Implementation.” Attendees divided into small workgroups of four to seven members to address one of the four areas. The
workgroups were tasked with identifying five challenges and proposing three solutions for each challenge within their area.
The work session culminated with a spokesperson from each small group presenting and posting the challenges (Table 1) and corresponding solutions (Table 3 in Solutions to Challenges). Af-ter all of the presentations were made, the workshop attendees were asked to list their top five challenges in order of priority. “Top five lists” were submitted by 19 of the 23 attendees. The lists were analyzed to determine the overall prioritization of the challenges. The analytic approach is presented next.
Table 1. Challenges by workgroup area
Organizational Culture
1. Individual trust2. External trust3. What, when, and too hard to report4. Why fund and promote--what is the ROI?5. Why report--what's in it for me?
Data Collection
1. Smaller carriers/MROs do not dedicate adequate resources to event reports
2. Motivate MRO participation in event reporting3. Overcoming resistance/concerns about event data collection
Data Analysis
1. Consistency in data analysis2. Information housed in different internal data bases (predictive, proactive,
reactive)3. Lack of automated report generation4. Inefficient use of data from different sources that came in different
formats5. Too much and over reliance on narrative data
ResultsImplementation
1. Lack of combined knowledge of HF and task expertise to interpret data analysis
2. Need to understand the big picture of the consequences of a problem (safety of flight, ROI, reputation…)
3. Get required resources that provide sustainable solutions that won't affect stakeholders in negative way
4. Need logical and proven implementation process5. Need for evidence-based evaluation of implemented fix
Table 1. Challenges by workgroup area.
17
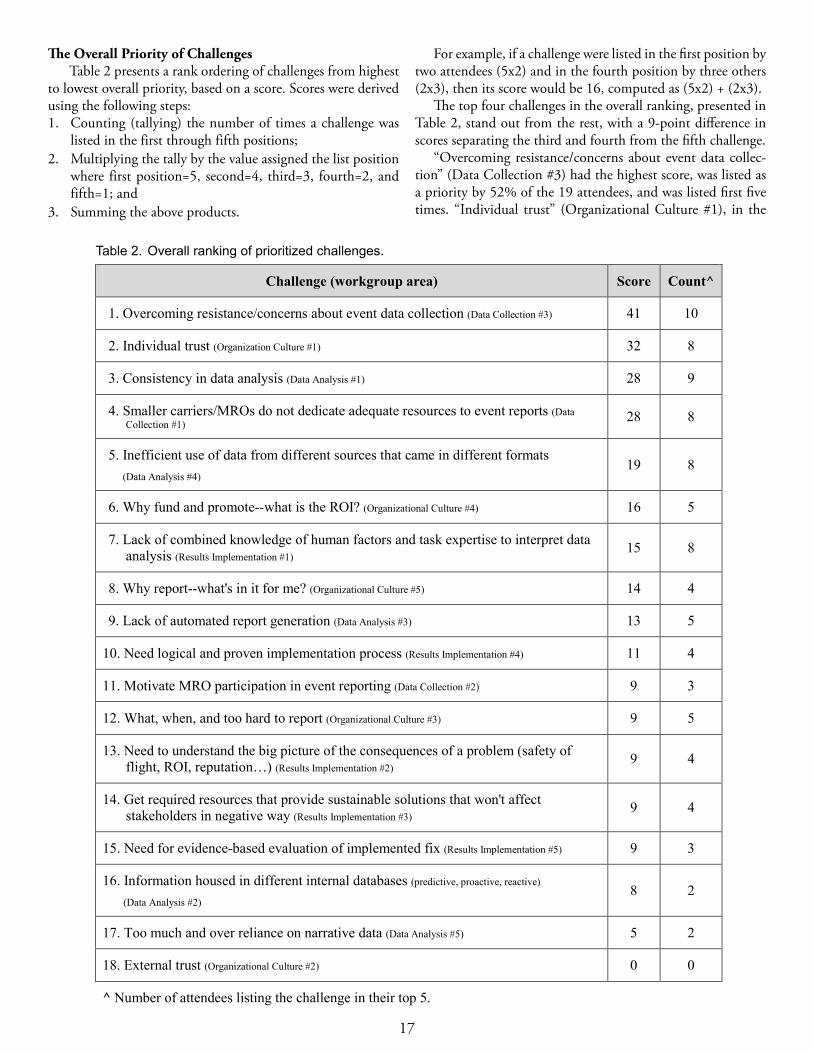
The Overall Priority of Challenges Table 2 presents a rank ordering of challenges from highest
to lowest overall priority, based on a score. Scores were derived using the following steps:1. Counting (tallying) the number of times a challenge was
listed in the first through fifth positions; 2. Multiplying the tally by the value assigned the list position
where first position=5, second=4, third=3, fourth=2, and fifth=1; and
3. Summing the above products.
For example, if a challenge were listed in the first position by two attendees (5x2) and in the fourth position by three others (2x3), then its score would be 16, computed as (5x2) + (2x3).
The top four challenges in the overall ranking, presented in Table 2, stand out from the rest, with a 9-point difference in scores separating the third and fourth from the fifth challenge.
“Overcoming resistance/concerns about event data collec-tion” (Data Collection #3) had the highest score, was listed as a priority by 52% of the 19 attendees, and was listed first five times. “Individual trust” (Organizational Culture #1), in the
Table 2. Overall ranking of prioritized challenges
Challenge (workgroup area) Score Count^
1. Overcoming resistance/concerns about event data collection (Data Collection #3) 41 10
2. Individual trust (Organization Culture #1) 32 8
3. Consistency in data analysis (Data Analysis #1) 28 9
4. Smaller carriers/MROs do not dedicate adequate resources to event reports (Data Collection #1) 28 8
5. Inefficient use of data from different sources that came in different formats(Data Analysis #4)
19 8
6. Why fund and promote--what is the ROI? (Organizational Culture #4) 16 5
7. Lack of combined knowledge of human factors and task expertise to interpret data analysis (Results Implementation #1)
15 8
8. Why report--what's in it for me? (Organizational Culture #5) 14 4
9. Lack of automated report generation (Data Analysis #3) 13 5
10. Need logical and proven implementation process (Results Implementation #4) 11 4
11. Motivate MRO participation in event reporting (Data Collection #2) 9 3
12. What, when, and too hard to report (Organizational Culture #3) 9 5
13. Need to understand the big picture of the consequences of a problem (safety of flight, ROI, reputation…) (Results Implementation #2)
9 4
14. Get required resources that provide sustainable solutions that won't affect stakeholders in negative way (Results Implementation #3)
9 4
15. Need for evidence-based evaluation of implemented fix (Results Implementation #5) 9 3
16. Information housed in different internal databases (predictive, proactive, reactive)
(Data Analysis #2)8 2
17. Too much and over reliance on narrative data (Data Analysis #5) 5 2
18. External trust (Organizational Culture #2) 0 0
^ Number of attendees listing the challenge in their top 5.
Table 2. Overall ranking of prioritized challenges.
18
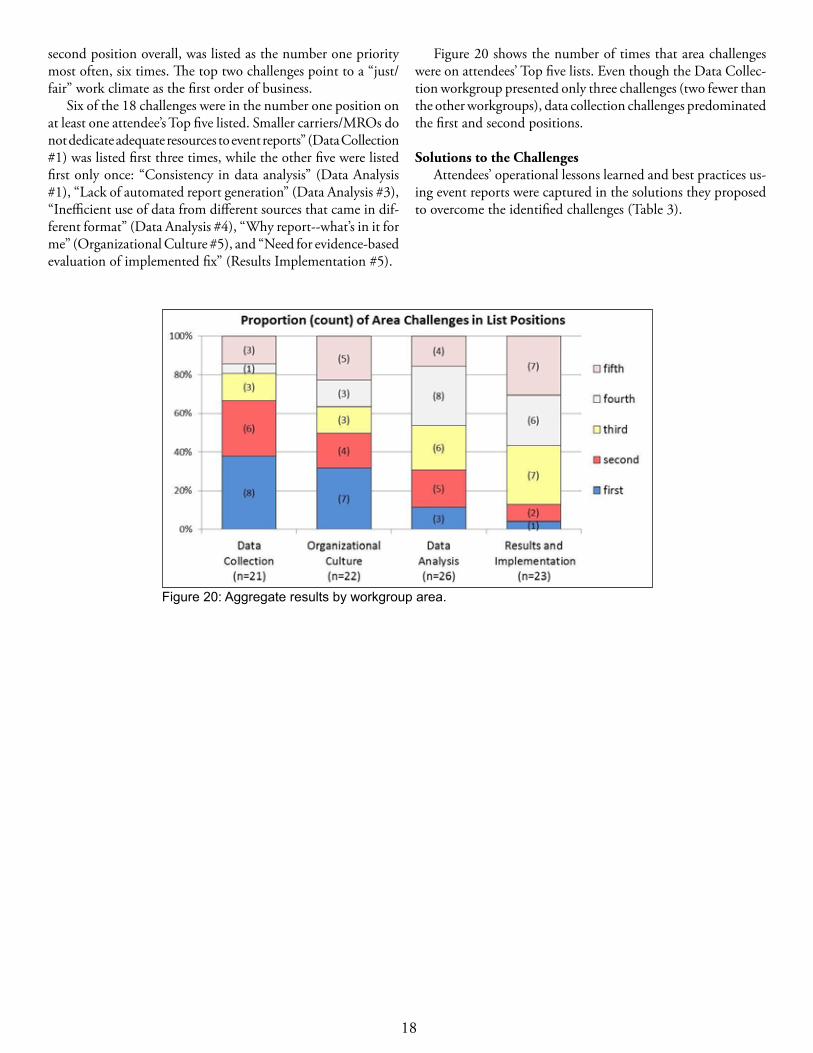
second position overall, was listed as the number one priority most often, six times. The top two challenges point to a “just/fair” work climate as the first order of business.
Six of the 18 challenges were in the number one position on at least one attendee’s Top five listed. Smaller carriers/MROs do not dedicate adequate resources to event reports” (Data Collection #1) was listed first three times, while the other five were listed first only once: “Consistency in data analysis” (Data Analysis #1), “Lack of automated report generation” (Data Analysis #3), “Inefficient use of data from different sources that came in dif-ferent format” (Data Analysis #4), “Why report--what’s in it for me” (Organizational Culture #5), and “Need for evidence-based evaluation of implemented fix” (Results Implementation #5).
Figure 20 shows the number of times that area challenges were on attendees’ Top five lists. Even though the Data Collec-tion workgroup presented only three challenges (two fewer than the other workgroups), data collection challenges predominated the first and second positions.
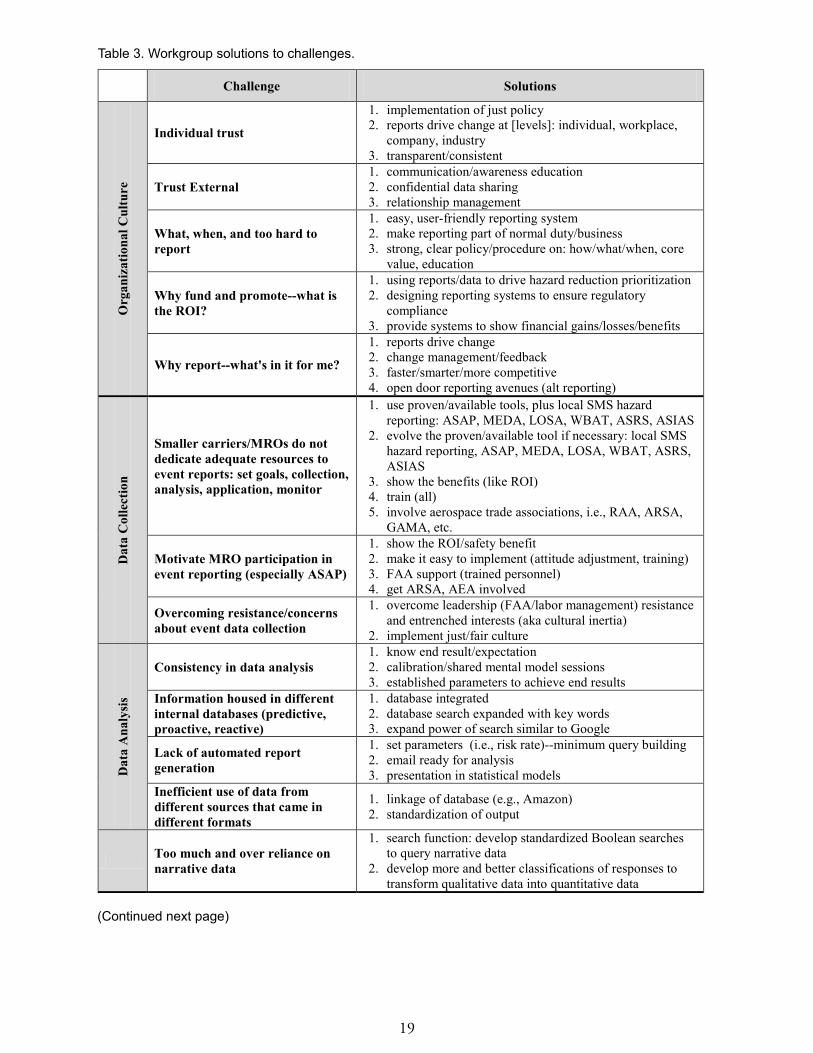
Solutions to the ChallengesAttendees’ operational lessons learned and best practices us-
ing event reports were captured in the solutions they proposed to overcome the identified challenges (Table 3).
Figure 20: Aggregate results by workgroup area.
19
Table 3. Workgroup solutions to challenges
Challenge Solutions
Org
aniz
atio
nal C
ultu
reIndividual trust
1. implementation of just policy2. reports drive change at [levels]: individual, workplace,
company, industry3. transparent/consistent
Trust External1. communication/awareness education 2. confidential data sharing 3. relationship management
What, when, and too hard to report
1. easy, user-friendly reporting system 2. make reporting part of normal duty/business 3. strong, clear policy/procedure on: how/what/when, core
value, education
Why fund and promote--what is the ROI?
1. using reports/data to drive hazard reduction prioritization 2. designing reporting systems to ensure regulatory
compliance 3. provide systems to show financial gains/losses/benefits
Why report--what's in it for me?
1. reports drive change 2. change management/feedback 3. faster/smarter/more competitive 4. open door reporting avenues (alt reporting)
Dat
a C
olle
ctio
n
Smaller carriers/MROs do not dedicate adequate resources to event reports: set goals, collection, analysis, application, monitor
1. use proven/available tools, plus local SMS hazard reporting: ASAP, MEDA, LOSA, WBAT, ASRS, ASIAS
2. evolve the proven/available tool if necessary: local SMS hazard reporting, ASAP, MEDA, LOSA, WBAT, ASRS,ASIAS
3. show the benefits (like ROI) 4. train (all) 5. involve aerospace trade associations, i.e., RAA, ARSA,
GAMA, etc.
Motivate MRO participation in event reporting (especially ASAP)
1. show the ROI/safety benefit 2. make it easy to implement (attitude adjustment, training) 3. FAA support (trained personnel) 4. get ARSA, AEA involved
Overcoming resistance/concerns about event data collection
1. overcome leadership (FAA/labor management) resistance and entrenched interests (aka cultural inertia)
2. implement just/fair culture
Dat
a A
naly
sis
Consistency in data analysis1. know end result/expectation 2. calibration/shared mental model sessions 3. established parameters to achieve end results
Information housed in different internal databases (predictive, proactive, reactive)
1. database integrated 2. database search expanded with key words 3. expand power of search similar to Google
Lack of automated report generation
1. set parameters (i.e., risk rate)--minimum query building2. email ready for analysis 3. presentation in statistical models
Inefficient use of data from different sources that came in different formats
1. linkage of database (e.g., Amazon)2. standardization of output
Too much and over reliance on narrative data
1. search function: develop standardized Boolean searches to query narrative data
2. develop more and better classifications of responses to transform qualitative data into quantitative data
Table 3. Workgroup solutions to challenges.
(Continued next page)
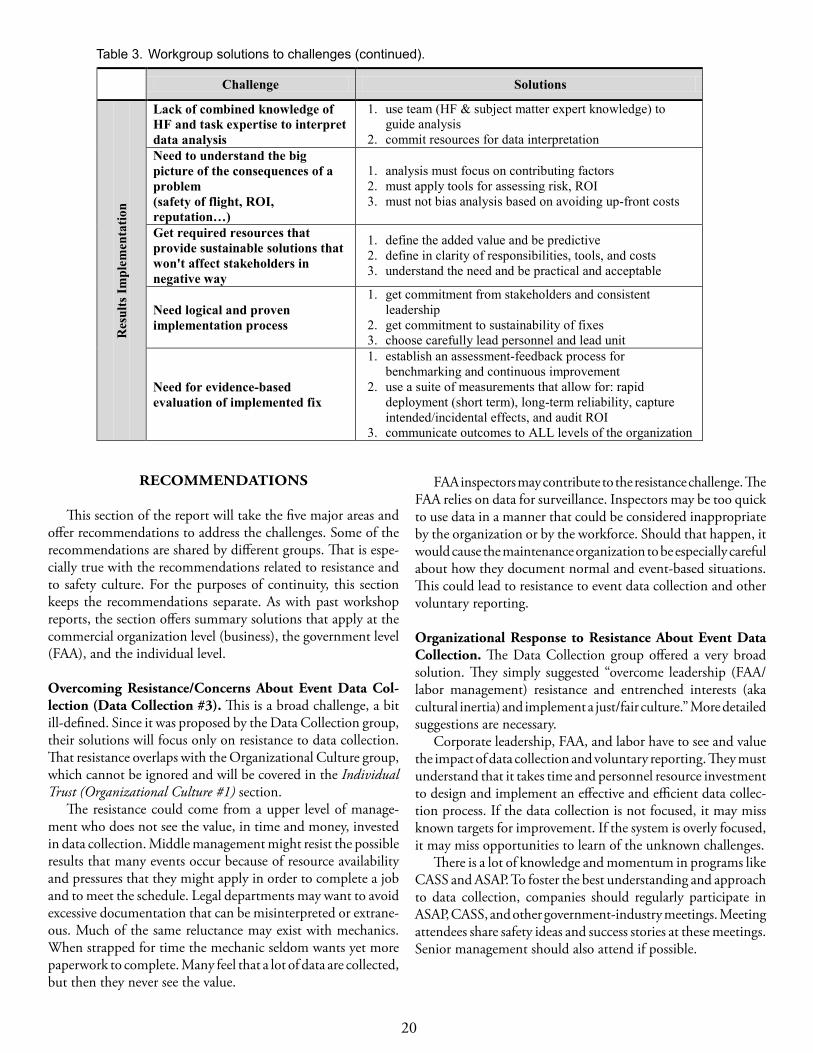
20
Table 3. Workgroup solutions to challenges (continued).
Challenge Solutions
Res
ults
Impl
emen
tatio
nLack of combined knowledge of HF and task expertise to interpret data analysis
1. use team (HF & subject matter expert knowledge) to guide analysis
2. commit resources for data interpretationNeed to understand the big picture of the consequences of a problem (safety of flight, ROI, reputation…)
1. analysis must focus on contributing factors 2. must apply tools for assessing risk, ROI3. must not bias analysis based on avoiding up-front costs
Get required resources that provide sustainable solutions that won't affect stakeholders in negative way
1. define the added value and be predictive 2. define in clarity of responsibilities, tools, and costs 3. understand the need and be practical and acceptable
Need logical and proven implementation process
1. get commitment from stakeholders and consistent leadership
2. get commitment to sustainability of fixes 3. choose carefully lead personnel and lead unit
Need for evidence-based evaluation of implemented fix
1. establish an assessment-feedback process for benchmarking and continuous improvement
2. use a suite of measurements that allow for: rapid deployment (short term), long-term reliability, capture intended/incidental effects, and audit ROI
3. communicate outcomes to ALL levels of the organization
RECOMMENDATIONS
This section of the report will take the five major areas and offer recommendations to address the challenges. Some of the recommendations are shared by different groups. That is espe-cially true with the recommendations related to resistance and to safety culture. For the purposes of continuity, this section keeps the recommendations separate. As with past workshop reports, the section offers summary solutions that apply at the commercial organization level (business), the government level (FAA), and the individual level.
Overcoming Resistance/Concerns About Event Data Col-lection (Data Collection #3). This is a broad challenge, a bit ill-defined. Since it was proposed by the Data Collection group, their solutions will focus only on resistance to data collection. That resistance overlaps with the Organizational Culture group, which cannot be ignored and will be covered in the Individual Trust (Organizational Culture #1) section.
The resistance could come from a upper level of manage-ment who does not see the value, in time and money, invested in data collection. Middle management might resist the possible results that many events occur because of resource availability and pressures that they might apply in order to complete a job and to meet the schedule. Legal departments may want to avoid excessive documentation that can be misinterpreted or extrane-ous. Much of the same reluctance may exist with mechanics. When strapped for time the mechanic seldom wants yet more paperwork to complete. Many feel that a lot of data are collected, but then they never see the value.
FAA inspectors may contribute to the resistance challenge. The FAA relies on data for surveillance. Inspectors may be too quick to use data in a manner that could be considered inappropriate by the organization or by the workforce. Should that happen, it would cause the maintenance organization to be especially careful about how they document normal and event-based situations. This could lead to resistance to event data collection and other voluntary reporting.
Organizational Response to Resistance About Event Data Collection. The Data Collection group offered a very broad solution. They simply suggested “overcome leadership (FAA/labor management) resistance and entrenched interests (aka cultural inertia) and implement a just/fair culture.” More detailed suggestions are necessary.
Corporate leadership, FAA, and labor have to see and value the impact of data collection and voluntary reporting. They must understand that it takes time and personnel resource investment to design and implement an effective and efficient data collec-tion process. If the data collection is not focused, it may miss known targets for improvement. If the system is overly focused, it may miss opportunities to learn of the unknown challenges.
There is a lot of knowledge and momentum in programs like CASS and ASAP. To foster the best understanding and approach to data collection, companies should regularly participate in ASAP, CASS, and other government-industry meetings. Meeting attendees share safety ideas and success stories at these meetings. Senior management should also attend if possible.
21
FAA Response to Resistance About Event Data Collection. FAA management and especially Aviation Safety Inspectors (ASIs) should also participate in the government-industry meeting. The idea-sharing among FAA and industry groups is invaluable. FAA must also continue to operate in the spirit and provide formal written guidance on how voluntary data should be used. As the industry needs to improve their safety culture, so does the FAA. The FAA must foster the safety culture at all levels of the organization.
Individual Response to Resistance About Event Data Collection. Individuals must continue to cooperate with their co-workers, managers, FAA ASIs, and all who strive to value the importance of voluntary reporting. These actions not only fulfill the requirements of Safety Management but also contribute to the overall quality of the safety culture. Individuals affect safety culture by the manner in which they adopt the shared corporate belief that safety is the most important goal in their company. They can also accept that it is difficult to separate the mutually inclusive combination of safety and profit. A company cannot be sustained without both. Each worker should be able to define how their daily activities affect safety.
Individual Trust (Organizational Culture #1 Individual trust is a critical attribute of a safe organization culture. It takes a long time to build individual trust and a very short time to destroy it. It can be harmed by inadvertent actions, misinterpretation of actions, inactions, or deceitful actions. Trust must exist among workers and between the workforce and management. FAA must be diligent in their words and actions in order to maintain trust in their relationships.
Organizational Response to Individual Trust. The workshop attendees articulated a list of organizational attributes to help ensure trust. That includes:• Organizational transparency,• Promotion of respectable trustworthy managers,• Establishment and use of a written just culture policy,• Consider using a consistent just culture algorithm for vol-
untary reports,• Open two-way communication,• Accountability for management actions, and more.
FAA Response to Individual Trust. Some of the same elements of trust are critical for regulator relationships. FAA trustworthi-ness should include:• Trustworthiness within the FAA organizations,• Accountability for management and for individual inspector
actions,• Consistent decision making,• Adherence to memorandums of understanding, and • Organizational transparency.
Individual Response to Individual Trust. Individuals are often a product of their working environment. Demonstrations of trustworthiness from the organization and from the FAA will foster trustworthiness from the workforce.
Consistency in Data Analysis (Data Analysis #1)There was a lot of discussion about the existence of many di-vergent databases. In many cases the databases are controlled by different entities within maintenance organizations. The challenges are also complicated because some analysts do not fully understand maintenance terminology and tasks, yet they have the responsibility to make sense of the data. The result of the above situation makes it challenging for organizations to collect, analyze, and apply data in a useful and meaningful way.
Organizational Response to Consistency in Data Analysis. The organizational response may be the most critical when compared to FAA and individual response. The group offered three categories of solution to include:• know the end result and expectations for analyses before the
data are collected;• be sure to communicate expectations so there is a shared
expectation (mental model) of how the data will be used; and • establish parameters that can determine if the data are count-
ing the right things and providing the kind of information that can be used and evaluated.
FAA Response to Consistency in Data Analysis. The FAA should work with companies to suggest ideal and proven success-ful parameters for data collection. While the ultimate decision belongs to the organization, the FAA can assist with identifying and publicizing industry best practices. The FAA should continue to accept the data for use in ASIAS, which can analyze the data to determine industry trends.
Individual Response to Consistency in Data Analysis. Indi-viduals are driven by the organizational data reporting policy. However, individuals should speak up when data reporting or use policies are unduly cumbersome or complicated to the individual. Individuals should up speak when they do not understand the process of data collection or its application.
Small Carriers/MROs Do Not Dedicate Adequate Resources to Event Reports (Data Collection #1)During the workshop it became obvious that we “invited the choir to the church.” That is, most of the attendees represented organizations with very good data collection programs. They were likely the best representatives of practices on designing, collect-ing, using, and evaluating data from events. Unfortunately, the organizations that needed the most help were not present. This best practices report should be of high value to smaller carriers/MROs. The attendees recalled the difficulty and lessons learned in establishing their programs. They were able to offer advice
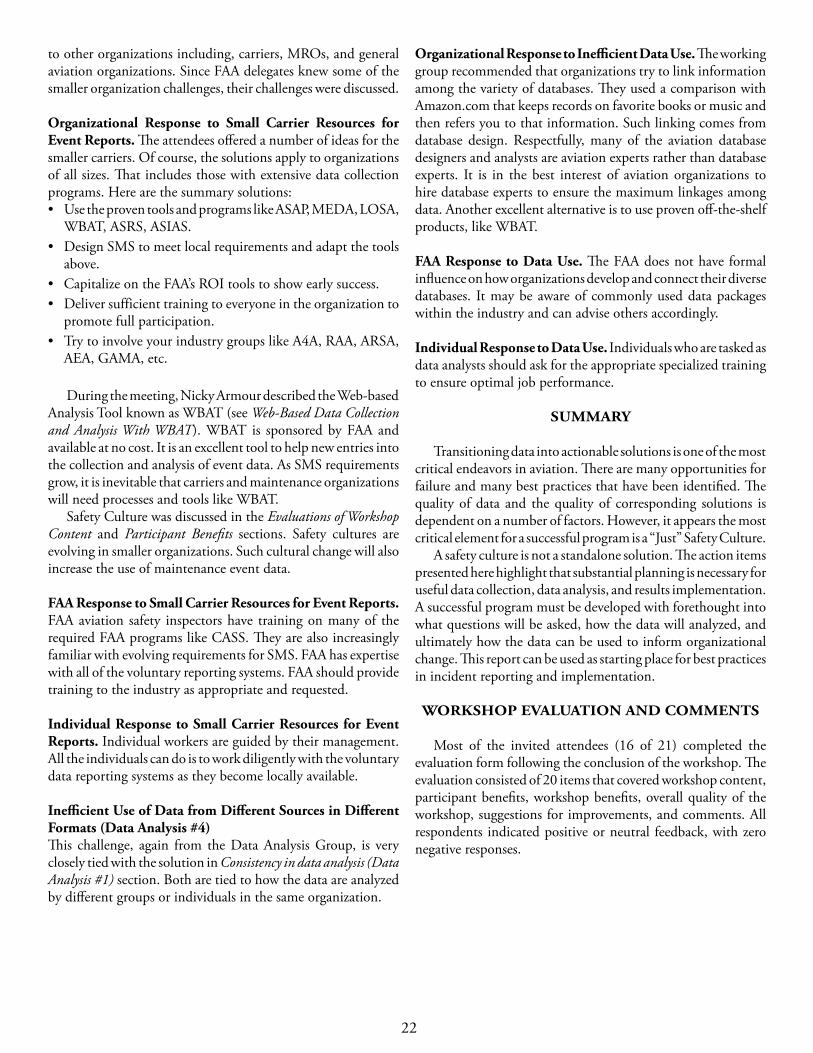
22
to other organizations including, carriers, MROs, and general aviation organizations. Since FAA delegates knew some of the smaller organization challenges, their challenges were discussed.
Organizational Response to Small Carrier Resources for Event Reports. The attendees offered a number of ideas for the smaller carriers. Of course, the solutions apply to organizations of all sizes. That includes those with extensive data collection programs. Here are the summary solutions:• Use the proven tools and programs like ASAP, MEDA, LOSA,
WBAT, ASRS, ASIAS.• Design SMS to meet local requirements and adapt the tools
above.• Capitalize on the FAA’s ROI tools to show early success.• Deliver sufficient training to everyone in the organization to
promote full participation.• Try to involve your industry groups like A4A, RAA, ARSA,
AEA, GAMA, etc.
During the meeting, Nicky Armour described the Web-based Analysis Tool known as WBAT (see Web-Based Data Collection and Analysis With WBAT). WBAT is sponsored by FAA and available at no cost. It is an excellent tool to help new entries into the collection and analysis of event data. As SMS requirements grow, it is inevitable that carriers and maintenance organizations will need processes and tools like WBAT.
Safety Culture was discussed in the Evaluations of Workshop Content and Participant Benefits sections. Safety cultures are evolving in smaller organizations. Such cultural change will also increase the use of maintenance event data.
FAA Response to Small Carrier Resources for Event Reports.FAA aviation safety inspectors have training on many of the required FAA programs like CASS. They are also increasingly familiar with evolving requirements for SMS. FAA has expertise with all of the voluntary reporting systems. FAA should provide training to the industry as appropriate and requested.
Individual Response to Small Carrier Resources for Event Reports. Individual workers are guided by their management. All the individuals can do is to work diligently with the voluntary data reporting systems as they become locally available.
Inefficient Use of Data from Different Sources in Different Formats (Data Analysis #4)This challenge, again from the Data Analysis Group, is very closely tied with the solution in Consistency in data analysis (Data Analysis #1) section. Both are tied to how the data are analyzed by different groups or individuals in the same organization.
Organizational Response to Inefficient Data Use. The working group recommended that organizations try to link information among the variety of databases. They used a comparison with Amazon.com that keeps records on favorite books or music and then refers you to that information. Such linking comes from database design. Respectfully, many of the aviation database designers and analysts are aviation experts rather than database experts. It is in the best interest of aviation organizations to hire database experts to ensure the maximum linkages among data. Another excellent alternative is to use proven off-the-shelf products, like WBAT.
FAA Response to Data Use. The FAA does not have formal influence on how organizations develop and connect their diverse databases. It may be aware of commonly used data packages within the industry and can advise others accordingly.
Individual Response to Data Use. Individuals who are tasked as data analysts should ask for the appropriate specialized training to ensure optimal job performance.
SUMMARY
Transitioning data into actionable solutions is one of the most critical endeavors in aviation. There are many opportunities for failure and many best practices that have been identified. The quality of data and the quality of corresponding solutions is dependent on a number of factors. However, it appears the most critical element for a successful program is a “Just” Safety Culture.
A safety culture is not a standalone solution. The action items presented here highlight that substantial planning is necessary for useful data collection, data analysis, and results implementation. A successful program must be developed with forethought into what questions will be asked, how the data will analyzed, and ultimately how the data can be used to inform organizational change. This report can be used as starting place for best practices in incident reporting and implementation.
WORKSHOP EVALUATION AND COMMENTS
Most of the invited attendees (16 of 21) completed the evaluation form following the conclusion of the workshop. The evaluation consisted of 20 items that covered workshop content, participant benefits, workshop benefits, overall quality of the workshop, suggestions for improvements, and comments. All respondents indicated positive or neutral feedback, with zero negative responses.
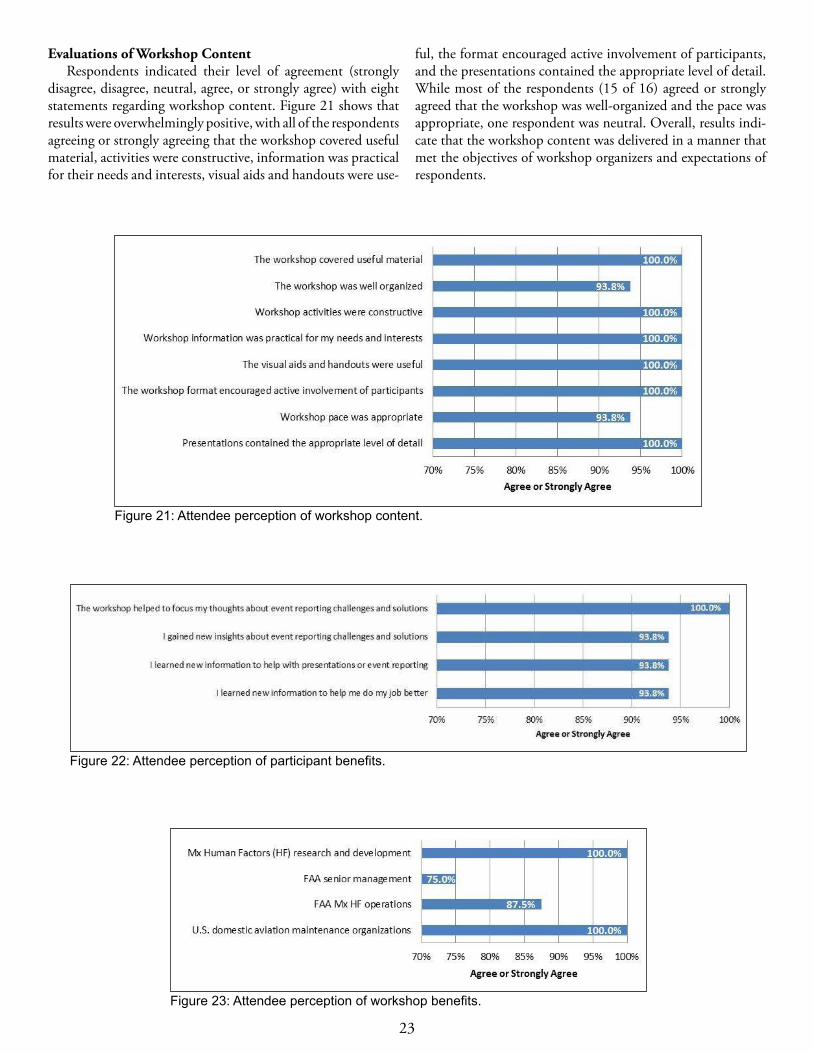
23
Evaluations of Workshop ContentRespondents indicated their level of agreement (strongly
disagree, disagree, neutral, agree, or strongly agree) with eight statements regarding workshop content. Figure 21 shows that results were overwhelmingly positive, with all of the respondents agreeing or strongly agreeing that the workshop covered useful material, activities were constructive, information was practical for their needs and interests, visual aids and handouts were use-
ful, the format encouraged active involvement of participants, and the presentations contained the appropriate level of detail. While most of the respondents (15 of 16) agreed or strongly agreed that the workshop was well-organized and the pace was appropriate, one respondent was neutral. Overall, results indi-cate that the workshop content was delivered in a manner that met the objectives of workshop organizers and expectations of respondents.
Figure 21: Attendee perception of workshop content.
Figure 22: Attendee perception of participant benefits.
Figure 23: Attendee perception of workshop benefits.
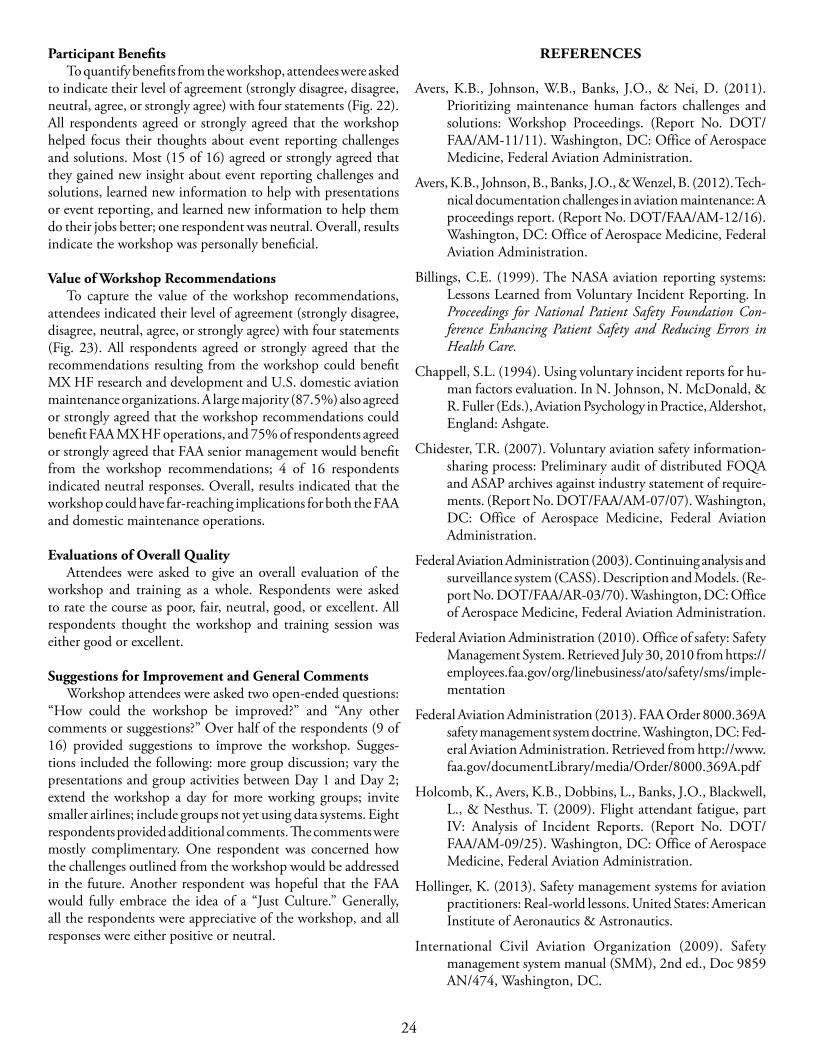
24
Participant BenefitsTo quantify benefits from the workshop, attendees were asked
to indicate their level of agreement (strongly disagree, disagree, neutral, agree, or strongly agree) with four statements (Fig. 22). All respondents agreed or strongly agreed that the workshop helped focus their thoughts about event reporting challenges and solutions. Most (15 of 16) agreed or strongly agreed that they gained new insight about event reporting challenges and solutions, learned new information to help with presentations or event reporting, and learned new information to help them do their jobs better; one respondent was neutral. Overall, results indicate the workshop was personally beneficial.
Value of Workshop RecommendationsTo capture the value of the workshop recommendations,
attendees indicated their level of agreement (strongly disagree, disagree, neutral, agree, or strongly agree) with four statements (Fig. 23). All respondents agreed or strongly agreed that the recommendations resulting from the workshop could benefit MX HF research and development and U.S. domestic aviation maintenance organizations. A large majority (87.5%) also agreed or strongly agreed that the workshop recommendations could benefit FAA MX HF operations, and 75% of respondents agreed or strongly agreed that FAA senior management would benefit from the workshop recommendations; 4 of 16 respondents indicated neutral responses. Overall, results indicated that the workshop could have far-reaching implications for both the FAA and domestic maintenance operations.
Evaluations of Overall QualityAttendees were asked to give an overall evaluation of the
workshop and training as a whole. Respondents were asked to rate the course as poor, fair, neutral, good, or excellent. All respondents thought the workshop and training session was either good or excellent.
Suggestions for Improvement and General CommentsWorkshop attendees were asked two open-ended questions:
“How could the workshop be improved?” and “Any other comments or suggestions?” Over half of the respondents (9 of 16) provided suggestions to improve the workshop. Sugges-tions included the following: more group discussion; vary the presentations and group activities between Day 1 and Day 2; extend the workshop a day for more working groups; invite smaller airlines; include groups not yet using data systems. Eight respondents provided additional comments. The comments were mostly complimentary. One respondent was concerned how the challenges outlined from the workshop would be addressed in the future. Another respondent was hopeful that the FAA would fully embrace the idea of a “Just Culture.” Generally, all the respondents were appreciative of the workshop, and all responses were either positive or neutral.
REFERENCES
Avers, K.B., Johnson, W.B., Banks, J.O., & Nei, D. (2011). Prioritizing maintenance human factors challenges and solutions: Workshop Proceedings. (Report No. DOT/FAA/AM-11/11). Washington, DC: Office of Aerospace Medicine, Federal Aviation Administration.
Avers, K.B., Johnson, B., Banks, J.O., & Wenzel, B. (2012). Tech-nical documentation challenges in aviation maintenance: A proceedings report. (Report No. DOT/FAA/AM-12/16). Washington, DC: Office of Aerospace Medicine, Federal Aviation Administration.
Billings, C.E. (1999). The NASA aviation reporting systems: Lessons Learned from Voluntary Incident Reporting. In Proceedings for National Patient Safety Foundation Con-ference Enhancing Patient Safety and Reducing Errors in Health Care.
Chappell, S.L. (1994). Using voluntary incident reports for hu-man factors evaluation. In N. Johnson, N. McDonald, & R. Fuller (Eds.), Aviation Psychology in Practice, Aldershot, England: Ashgate.
Chidester, T.R. (2007). Voluntary aviation safety information-sharing process: Preliminary audit of distributed FOQA and ASAP archives against industry statement of require-ments. (Report No. DOT/FAA/AM-07/07). Washington, DC: Office of Aerospace Medicine, Federal Aviation Administration.
Federal Aviation Administration (2003). Continuing analysis and surveillance system (CASS). Description and Models. (Re-port No. DOT/FAA/AR-03/70). Washington, DC: Office of Aerospace Medicine, Federal Aviation Administration.
Federal Aviation Administration (2010). Office of safety: Safety Management System. Retrieved July 30, 2010 from https://employees.faa.gov/org/linebusiness/ato/safety/sms/imple-mentation
Federal Aviation Administration (2013). FAA Order 8000.369A safety management system doctrine. Washington, DC: Fed-eral Aviation Administration. Retrieved from http://www.faa.gov/documentLibrary/media/Order/8000.369A.pdf
Holcomb, K., Avers, K.B., Dobbins, L., Banks, J.O., Blackwell, L., & Nesthus. T. (2009). Flight attendant fatigue, part IV: Analysis of Incident Reports. (Report No. DOT/FAA/AM-09/25). Washington, DC: Office of Aerospace Medicine, Federal Aviation Administration.
Hollinger, K. (2013). Safety management systems for aviation practitioners: Real-world lessons. United States: American Institute of Aeronautics & Astronautics.
International Civil Aviation Organization (2009). Safety management system manual (SMM), 2nd ed., Doc 9859 AN/474, Washington, DC.
25
Ma, M.J., Pedigo, M., Blackwell, L., Gildea, K., Holcomb, K., Hackworth, C., & Hiles, J. (2011). The line operations safety audit program: Transitioning from flight operations to maintenance and ramp operations. (Report No. DOT/FAA/AM-11/15). Washington, DC: Office of Aerospace Medicine, Federal Aviation Administration.
Ma, M.J. & Rankin, W.L. (2012). Implementation guideline for maintenance line operations safety assessment (M-LOSA) and ramp LOSA (R-LOSA) programs. (Report No. DOT/FAA/AM-12/09). Washington, DC: Office of Aerospace Medicine, Federal Aviation Administration.
Marx, D. (2008). The just culture algorithm. Outcome Engi-neering, LLC.
NASA (2001). ASRS research papers: The case for confidential incident reporting systems. NASA ASRS Research Paper No. 60. Retrieved from http://asrs.arc.nasa.gov/publications/research.html
NASA (2013). ASRS database online. Retrieved from http://asrs.arc.nasa.gov/search/database.html
Peri, (2010). SMS: One size fits all. Avionics News. October, pp.16-17. Retrieved from http://www.aea.net/governmen-taffairs/pdf/ViewFromWashingtonOct10.pdf
Stolzer, A.J., Halford, C.D., & Goglia, J.J. (2011). Implementing safety management systems in aviation. Ashgate Studies in Human Factors for Flight Operations. Burlington, VT: Ashgate.
Sumawalt, R.L., Morrison, R., Watson, A., & Taube, E. (1997). What ASRS data tell about inadequate flight crew moni-toring. NASA ASRS Research Paper No. 56. Retrieved from http://asrs.arc.nasa.gov/publications/research.html
ADDITIONAL ONLINE RESOURCES
FAA public SMS website: http://www.faa.gov/about/initiatives/sms/
AFS SMS pilot project & voluntary implementation website: https://avssharepoint.faa.gov/afs/900/SMS/pilot/Forms/default.aspx
Safety management systems (SMS) for Airports website: http://www.faa.gov/airports/airport_safety/safety_manage-ment_systems/
ICAO publications and resources website: http://www.icao.int/anb/safetymanagement/Documents.html
National air transport association (NATA) SMS website: http://www.natasafety1st.org/sms.htm
Transport Canada SMS website: http://www.tc.gc.ca/civilavia-tion/sms/menu.htm
MITRE SMS website: http://www.mitrecaasd.org/SMS/
National business aviation association SMS website: http://web.nbaa.org/admin/sms/