Future Dating By Paul Nethercott Creation Ministries International April 2013
Upload
tashya-hamptonCategory
view
29download
0description

The Thorium/Lead Dating Method
By Paul Nethercott
Creation Ministries International
April 2013
www.creation.com
Introduction
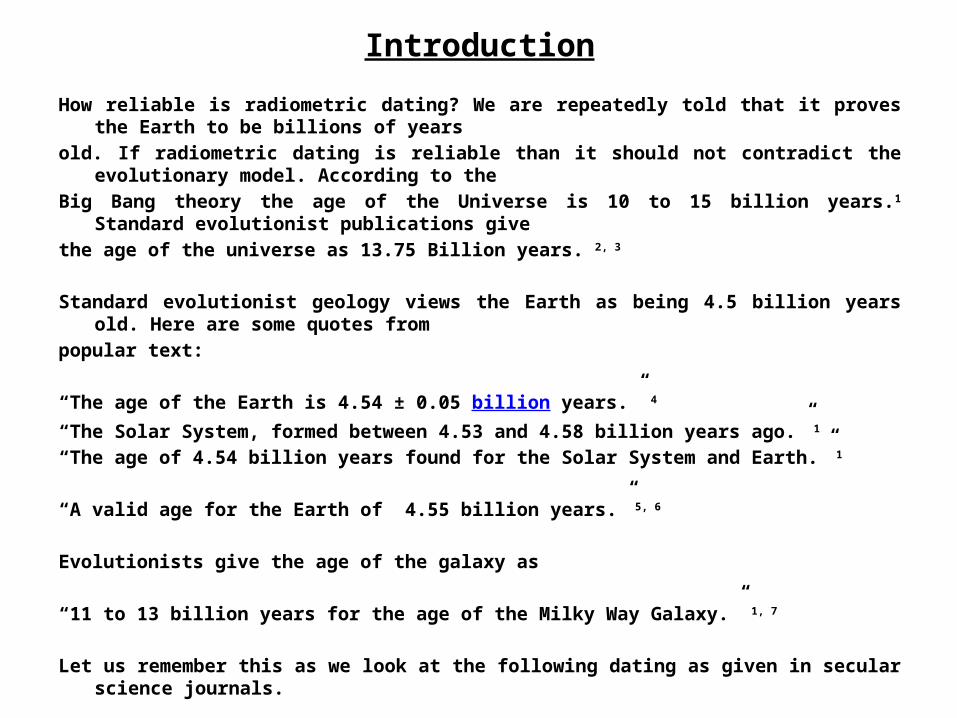
How reliable is radiometric dating? We are repeatedly told that it proves the Earth to be billions of years
old. If radiometric dating is reliable than it should not contradict the evolutionary model. According to the
Big Bang theory the age of the Universe is 10 to 15 billion years.1 Standard evolutionist publications give
the age of the universe as 13.75 Billion years. 2, 3
Standard evolutionist geology views the Earth as being 4.5 billion years old. Here are some quotes from
popular text:
“The age of the Earth is 4.54 ± 0.05 billion years.” 4
“The Solar System, formed between 4.53 and 4.58 billion years ago.” 1
“The age of 4.54 billion years found for the Solar System and Earth.” 1
“A valid age for the Earth of 4.55 billion years.” 5, 6
Evolutionists give the age of the galaxy as
“11 to 13 billion years for the age of the Milky Way Galaxy.” 1, 7
Let us remember this as we look at the following dating as given in secular science journals.

Creationist PredictionsIsotopic ratios give random spread of meaningless dates
Impossibly old dates.
Older than the evolutionist age of the Earth
Older than the evolutionist age of the Solar System
Older than the evolutionist age of the Galaxy
Older than the evolutionist age of the Universe
Older than the evolutionist age of the Big Bang
Negative or Future ages
Rocks that exist in the present formed in the future
Different dating methods disagree with each other
Evolutionist PredictionsIsotopic ratios give uniform meaningful dates
Dates are not impossibly old.
Younger than the evolutionist age of the Earth
Younger than the evolutionist age of the Solar System
Younger than the evolutionist age of the Galaxy
Younger than the evolutionist age of the Universe
Younger than the Big Bang
No Negative or Future ages
Rocks that exist in the present formed in the past
Different dating methods agree with each other

http://en.wikipedia.org/wiki/Geological_time
The Geological Time Scale
The Age Of The Earth4,500 Million Years
Old
The Origin Of Life3,500 Million Years Ago

http://en.wikipedia.org/wiki/Geological_time
The Evolution Of Life Time Scale

http://en.wikipedia.org/wiki/Solar_system_formation
Solar System Formation
Began 4,500 Million Years Ago

http://en.wikipedia.org/wiki/Big_Bang
The Big Bang Theory
13,700 Million Year Age For The Universe

1. Tracing the Indian Ocean Mantle
These samples were dated in 1998 by scientists from the School Of Ocean And Earth Science And Technology, University Of Hawaii, Honolulu. According to this article the samples were taken from volcanic material that is only 100 million years old.8 If we put isotopic ratios 9 into Microsoft Excel and run the through Isoplot we find the average age is almost 17 billion years old. In Table 2 we see some fantastic dates.
Maximum Ages
Average 16,890Maximum 82,561Minimum 1,139Difference 81,422
Million Years Million Years Million Years Million Years82,561 27,364 17,662 10,72852,909 27,241 15,723 9,98651,126 25,102 15,132 9,57039,277 24,925 15,032 9,35437,502 23,860 14,950 9,33135,301 23,310 14,699 9,29031,541 21,943 14,232 9,14130,608 20,266 13,778 6,92928,811 20,144 13,276 6,66328,284 19,005 12,140 6,59027,460 18,674 11,754 6,505
Dating Summary

2. Petrogenesis of the Flood Basalts
These samples were dated in 1998 by scientists from the Department Of Earth, Atmospheric And Planetary Sciences, Massachusetts Institute Of Technology. According to this article the samples were taken from the volcanic crust of the Kerguelen Archipelago that is only 30 million years old.10 If we put isotopic ratios 11 into Microsoft Excel and run the through Isoplot we find the average age of Mount Bureau is over 5 billion years old. In Table 3 we see some fantastic dates for both mountains.
Maximum Ages Mount Bureau Mount Rabouillere44,378 7,7889,092 7,5188,651 7,4168,624 6,5608,144 6,4228,142 6,3288,023 6,2167,507 5,9667,245 4,4067,046 2,7996,961 6,548 5,787 5,773 5,639 5,613 5,107

3. Nature of the Source Regions
These samples were dated in 2004 by scientists from the Department Of Earth Sciences, The Open University, England. According to the article:
“Most samples are Miocene in age, ranging from 10 to 25Ma in the south and 19Ma to the present day in northern Tibet.”12, 13
If we run the 87Rb/86Sr ratios 14 in the essay through Isoplot we get dates between 1 and 24 million years. If we run the Uranium/Lead ratios 15 in the essay through Isoplot we get unbelievable dates as listed below in Table 4.
Maximum Ages North Tibet South TibetAge Age
88,294 33,19181,614 25,01513,475 11,10211,504 9,26511,420 8,20511,350 6,092
4,826

4. Generation of Palaeocene Adakitic Andesites
These samples were dated in 2007 by scientists from the Chinese Academy Of Sciences, Wushan, Guangzhou. According to the article:
“The initial Sr, Nd and Pb isotopic ratios were corrected using the Ar/Ar age of 55Ma.”16, 17
If we run the Uranium/Lead ratios 18 in the essay through Isoplot we get unbelievable dates as listed below in Table 5.
Maximum Ages Sample 208Pb/232Th04YJ-6 10,51804YJ-5 10,27704YJ-9 8,52904YJ-7 8,36004YJ-1 8,16504YJ-2 7,800

5. Evidence for a Widespread Tethyan Upper Mantle
In 2005 scientists from the School of Ocean and Earth Science and Technology, University of Hawaii, Honolulu dated these rocks. According to the article:
“Isotopic data for such sites show that mantle similar to that beneath the modern Indian Ocean was present, at least in places, as long ago as 140 Ma, the age of the oldest true Indian Ocean crust yet sampled.” 19, 20
If we run the Rb/Sr ratios 21 through Isoplot we see that the average age is 168 million years. [Table 6]
Rb/Sr Ages Average 168Maximum 1,739Minimum 0Difference 1,739
If we run the Pb/Th ratios 22 through Isoplot we see that the average age is 22,675 million years. [Table 7]
Maximum Minimum Difference Average58,795 4,869 53,926 22,675

6. Evidence for a Widespread Tethyan Upper Mantle
Thorium/Lead – Maximum Ages Age Age Age Age58,796 29,705 18,607 11,42754,206 27,710 18,121 11,37748,252 27,422 17,797 11,36647,976 26,674 17,787 11,24146,117 26,369 17,591 10,71842,203 25,972 17,536 10,69942,192 25,590 17,054 10,69941,604 25,096 16,053 10,30041,343 24,010 15,299 9,35741,231 22,718 14,340 8,63239,637 22,307 13,845 8,48638,125 22,228 13,772 8,05737,115 21,827 13,652 6,49735,012 21,560 13,404 5,57333,584 19,910 13,403 5,42531,556 19,594 13,006 4,86931,286 19,148 12,171 30,740 18,765 11,540

7. Post-Collisional Potassic and Ultrapotassic According to the article:
“Major and trace element, Sr–Nd–Pb–O isotope and mineral chemical data are presented for post-collisional ultrapotassic, silicic and high-K calc-alkaline volcanic rocks from SW Tibet, with 40Ar/39Ar ages in the range 17–25 Ma.” 23, 24
If we run the Rb/Sr ratios 25 through Isoplot we see that the average age is 43 million years. [Table 9]
Rb/Sr Ages Average 43Maximum 1,258Minimum -1,439Difference 2,697
If we run the Pb/Th ratios 26 through Isoplot we see that the average age is 78,808 million years. [Table 10]
Maximum Minimum Difference Average99,275 67,704 31,570 78,808

7. Post-Collisional Potassic and Ultrapotassic
In Table 11 we see a comparison between the model age [“True Age”] and the isotopic age derived from atomic ratios.
We can see how far in error the Thorium dating system is.
Age Model Age68,343 4367,704 4370,277 4371,706 4395,541 4399,275 43

8. Continental Lithospheric Contribution to Alkaline
According to the article:
"These two genetically related alkaline complexes were emplaced at the east Atlantic continent-ocean boundary during the Upper Cretaceous, i.e. 66-72 m. y. ago" 27
If we run the Rb/Sr ratios 28 through Isoplot we see that the average age is 65 million years. [Table 9]
Average 65Maximum 74Minimum 4Difference 78
Rb/Sr Ages
If we run the Pb/Th ratios 28 through Isoplot we see that the average age is 6,126 million years. [Table 13]
Maximum Minimum Difference Average10,084 2,616 7,467 6,126

8. Continental Lithospheric Contribution to Alkaline
Age Model Age208Pb/232Th Million Years
10,084 669,320 668,101 667,502 667,080 666,891 666,655 666,313 665,830 665,755 665,029 66

9. Pin Pricking The Elephant
According to tables 29 in the article, the rock formation is only 120 million years old. If we run the 207Pb/206Pb ratios 30 through Isoplot we get an average age of 5,000 million years. If we run the Pb/Th ratios 31 through Isoplot we see in Table 15 that the age is between 12 billion and 14 billion years old.
Pb/Pb Age 5,379 5,385 5,000Pb/Th Age 12,090 12,845 14,459Pb/U Age 4,579 5,498 6,936

10. Chronology And Geochemistry Of Lavas
According to the article:
“New 40Ar/39Ar incremental heating age determinations for dredged rocks from volcanoes east of Salas y Gomez Island show that, with very few exceptions, ages increase steadily to the east from 1.4 to 30 Ma” 32
Tables 33 in the article affirms this as the true age of the geological formation. 33 If we run the Pb/Th ratios 34 through Isoplot we see that the average age is 8,325 million years. [Table 16] In Table 17 we see some of the incredible dates all the way from 5 billion to almost 24 billion years old.
Chronology 207Pb/206Pb 206Pb/238U 208Pb/232ThSummary Age Age AgeAverage 4,919 3,694 8,325
Maximum 4,971 9,645 23,850Minimum 4,881 1,166 4,129Difference 90 8,479 19,720
Age Age23,850 6,49816,942 6,42115,364 6,39613,004 6,2989,061 6,2458,393 5,8967,654 5,8487,599 5,7547,101 5,4537,054 5,4466,607
Thorium/Lead – Maximum AgesPb/Th Ages Summary

11. Ion Microprobe U-Th-Pb Dating
According to the article:
“The formation age of this meteorite is 1.53 ± 0.46 Ga. On the other hand, the data of nine apatite grains from Lafayette are well represented by planar regression rather than linear regression, indicating that its formation age is 1.15 ± 0.34 Ga” 35
If we run the Pb/Th ratios 36 through Isoplot we see that the average age is 20,409 million years. [Table 18] In Table 19 we see some of the incredible dates all the way from 7 billion to over 40 billion years old.
Thorium/Lead – Maximum AgesPb/Th Ages Summary
Chronological 238U/206Pb Th232/Pb208 Pb207/Pb206Summary Age Age AgeAverage 4,416 20,409 4,768
Maximum 8,975 40,271 5,348Minimum 1,245 7,426 3,897
Standard Dev 2,023 9,101 337
Age Age40,271 17,06238,926 16,51629,016 15,34928,642 13,92926,241 13,15324,801 12,38023,510 11,68921,169 11,33418,374 7,42617,980

12. U–Th–Pb Dating Of Secondary Minerals
This dating was done in 2008 on minerals from Yucca Mountain, Nevada. It was done by scientists from the U.S. Geological Survey, Denver, Colorado, the Geological Survey of Canada, Ottawa, Ontario and the Research School of Earth Sciences and Planetary Science Institute, The Australian National University. According to the article:
“Most 206Pb/238U ages determined for the calcite subsamples are much older than the 12.8-Ma age of the host tuff (Table 3 and Fig. 5) and thus unreasonable.” 37
If we run the Pb/Th ratios 38 through Isoplot we see that the average age is 10,000 million years [Table 19]. The Rb/Sr ratios 39 gave a uniform result of 11 to 13 million years old [Table 19].
Thorium/Lead – Maximum Ages
Pb/Th Ages Versus Rb/Sr Ages
Chronological 207Pb/206Pb 206Pb/238U 208Pb/232Th 87Rb/86SrSummary Age Age Age Age
Average 3,459 4,891 9,984 12Maximum 8,126 31,193 352,962 13Minimum -445 1 2 11Difference 8,571 31,192 352,960 2
Summary 206Pb/238U 207Pb/235U 208Pb/232Th
Average 1,540 46 7,687Maximum 20,209 486 82,030Minimum 1 0 3Difference 20,208 486 82,027

13. The Influence of High U-Th Inclusions
This dating was done in 1998 by scientists from Zurich, Switzerland. According to the article:
“The U-Th-Pb data from the bulk dissolutions are highly complex and yield apparent ages ranging from 1000 Ma to 30 Ma.” 41
If we run the Pb/Th ratios 42 through Isoplot we see that the dates vary from 300 to over 14,000 million years old [Table 21].
If we run another set of Pb/Th ratios 43 through Isoplot we see that the dates vary from 160 to over 37,000 million years old [Table 22].
Dating 206Pb/238U 208Pb/232Th Pb207/Pb206Summary Age Age Ages
Average 5,342 3,579 4,709Maximum 29,040 14,316 5,000Minimum 270 288 3,924
Std Deviation 9,042 5,192 368
Dating 206Pb/238U 208Pb/232Th Pb207/Pb206Summary Age Age Ages
Average 1,621 4,084 4,180Maximum 14,008 37,154 5,042Minimum 177 161 1,325
Std Deviation 3,931 11,000 1,386

14. U, Th And Pb Isotope Compositions
These samples were dated in 2009 by scientists from the Arthur Holmes Isotope Geology Laboratory, Department of Earth Sciences, Durham University. 44 According to the article:
“Detailed petrographic and geochemical descriptions of the samples presented here can be found elsewhere” 45
If we examine what these other people 46-49 have said about the same rock formation the consensus is that it is three million years old. If we run the Pb/Th ratios 50 through Isoplot we see that the dates vary from 2,000 to over 92,000 million years old [Table 23].
Maximum Ages
Dating 232Th/208Pb 238U/206Pb 207Pb/206PbSummary Age Age AgeAverage 8,097 4,271 4,915
Maximum 92,495 18,639 5,008Minimum 1,939 1,437 4,871Difference 90,556 17,202 137
232Th/208Pb 238U/206Pb 207Pb/206PbAge Age Age
92,495 18,639 5,00873,503 15,307 5,00142,038 10,772 5,00029,253 10,312 4,99613,018 9,291 4,98410,956 5,625 4,96410,621 4,508 4,95910,022 3,767 4,949
Uranium/Thorium/Lead - Ages Summary

15. U–Th–Pb Isotope Data
According to the article:
“In contrast to the apparent 207Pb–206Pb ages, the minimum depositional age of the Warrawoona Group is 3,426Ma based on a U–Pb zircon age from the Panorama Formation.” 51
If we run the Pb/Th ratios 52 through Isoplot we see that the dates vary from 25,000 to over 100,000 million years old [Table 25]. In Table 26 we can see the maximum ages for each dating method.
Maximum AgesUranium/Thorium/Lead - Ages Summary
Dating 207Pb/206Pb 206/Pb/238U 208Pb/232ThSummary Age Age AgeAverage 5,325 15,192 56,976
Maximum 5,403 31,005 100,601Minimum 5,222 7,138 24,980
Std Deviation 52 6,421 22,417
207Pb/206Pb 206Pb/238U 208Pb/232Th5403 31,005 100,6015395 20,343 84,4575390 19,584 73,9685351 17,306 67,4235339 17,088 58,3535332 13,410 57,1165328 13,022 55,3115315 11,479 51,6075298 11,353 44,4395296 10,652 39,0905289 9,926 26,3615269 7,138 24,980
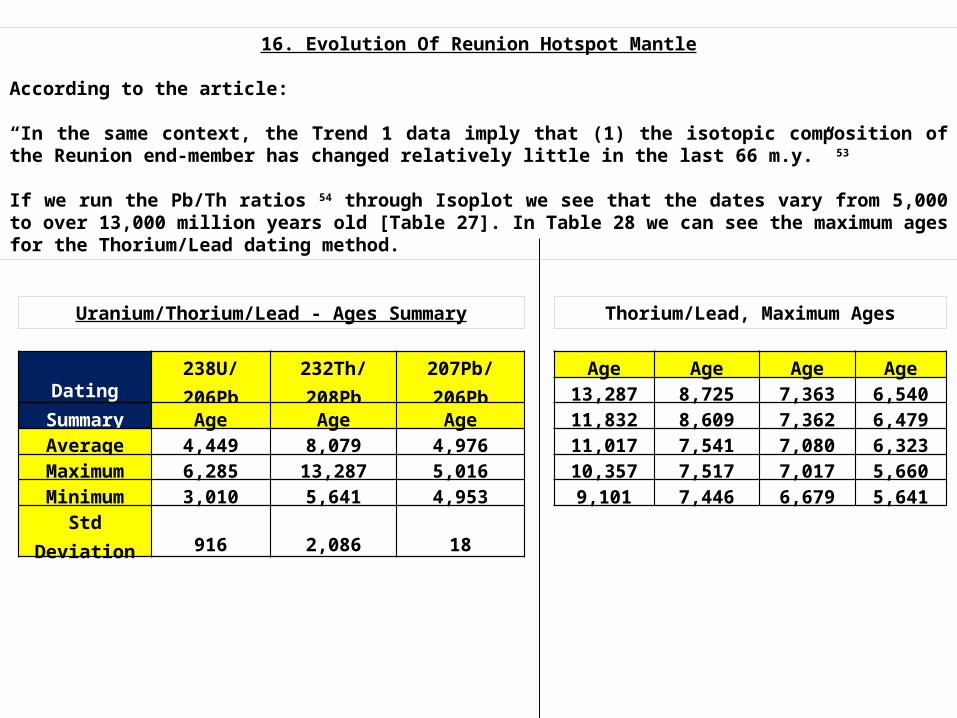
16. Evolution Of Reunion Hotspot Mantle
According to the article:
“In the same context, the Trend 1 data imply that (1) the isotopic composition of the Reunion end-member has changed relatively little in the last 66 m.y.” 53
If we run the Pb/Th ratios 54 through Isoplot we see that the dates vary from 5,000 to over 13,000 million years old [Table 27]. In Table 28 we can see the maximum ages for the Thorium/Lead dating method.
Thorium/Lead, Maximum AgesUranium/Thorium/Lead - Ages Summary
Dating 238U/206Pb 232Th/208Pb 207Pb/206PbSummary Age Age AgeAverage 4,449 8,079 4,976
Maximum 6,285 13,287 5,016Minimum 3,010 5,641 4,953
Std Deviation 916 2,086 18
Age Age Age Age13,287 8,725 7,363 6,54011,832 8,609 7,362 6,47911,017 7,541 7,080 6,32310,357 7,517 7,017 5,6609,101 7,446 6,679 5,641
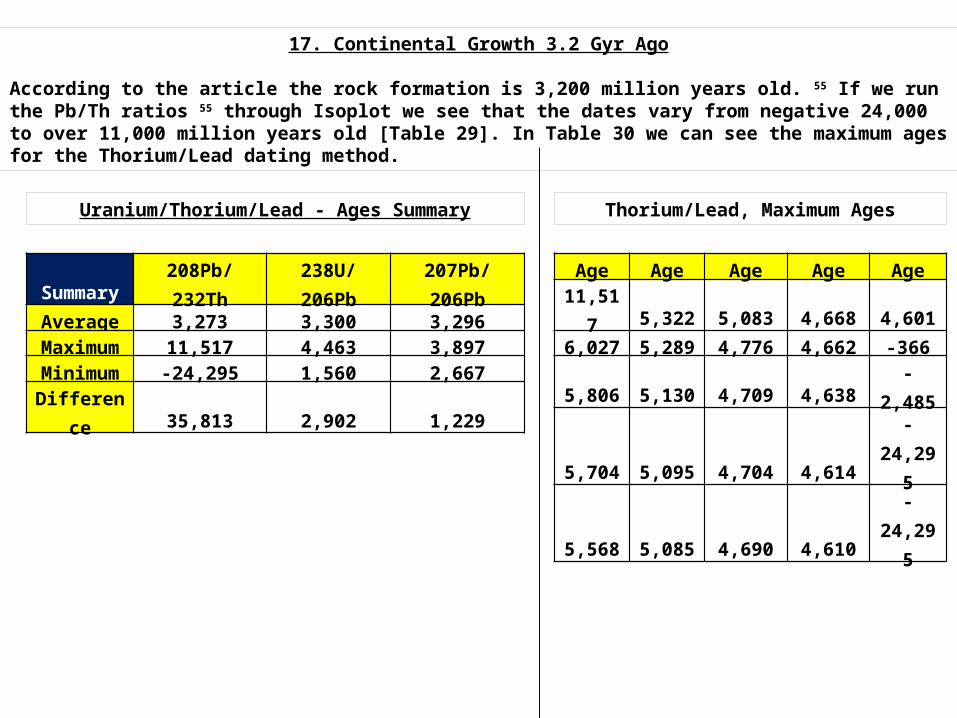
17. Continental Growth 3.2 Gyr Ago
According to the article the rock formation is 3,200 million years old. 55 If we run the Pb/Th ratios 55 through Isoplot we see that the dates vary from negative 24,000 to over 11,000 million years old [Table 29]. In Table 30 we can see the maximum ages for the Thorium/Lead dating method.
Thorium/Lead, Maximum AgesUranium/Thorium/Lead - Ages Summary
Summary 208Pb/232Th 238U/206Pb 207Pb/206PbAverage 3,273 3,300 3,296
Maximum 11,517 4,463 3,897Minimum -24,295 1,560 2,667Difference 35,813 2,902 1,229
Age Age Age Age Age
11,517 5,322 5,083 4,668 4,6016,027 5,289 4,776 4,662 -3665,806 5,130 4,709 4,638 -2,4855,704 5,095 4,704 4,614 -24,2955,568 5,085 4,690 4,610 -24,295

18. Uranium-Lead Zircon Ages
If we run the Pb/Th ratios 56 through Isoplot we see that the dates vary from 6,000 to over 55,000 million years old [Table 31]. In Table 32 we can see the maximum ages for each dating method.
Uranium/Thorium/Lead, Maximum AgesUranium/Thorium/Lead - Ages Summary
Dating 206Pb/238U 208Pb/232Th 207Pb/206PbSummary Age Age AgeAverage 11,159 17,193 4,933
Maximum 23,421 55,110 4,997Minimum 3,108 6,130 4,799
Std Deviation 6,223 13,524 59
206Pb/238U 208Pb/232Th 207Pb/206Pb23,421 55,110 4,99720,387 29,742 4,99118,909 27,889 4,98117,143 27,051 4,97616,784 21,318 4,97215,320 19,224 4,96912,851 18,091 4,96512,012 17,944 4,95710,579 16,474 4,9539,677 15,059 4,9499,424 14,779 4,9479,099 13,374 4,9459,044 11,951 4,9258,094 10,783 4,9216,776 9,336 4,9155,719 8,644 4,9105,500 8,058 4,892
Age Age Age Age55,110 19,224 14,779 8,64429,742 18,091 13,374 8,05827,889 17,944 11,951 6,72127,051 16,474 10,783 6,18521,318 15,059 9,336 6,130
Thorium/Lead, Maximum Ages

19. The Pilbara Craton in Western Australia
According to the article the rock formation is 3,200 million years old. 57 If we run the Pb/Th ratios 58 through Isoplot we see that the dates vary from 2,000 to over 8,000 million years old [Table 34]. In Table 35 we can see the maximum ages for the Thorium/Lead dating method.
Uranium/Thorium/Lead, Maximum AgesThorium/Lead - Ages Summary
Average 4,853Maximum 8,728Minimum 2,792
Std Deviation 1,040 Age Age Age Age Age8,728 6,241 5,721 5,430 5,0588,296 6,191 5,643 5,417 5,0427,017 6,076 5,578 5,288 5,0326,433 5,786 5,533 5,171 5,0276,431 5,759 5,522 5,138 4,999

19. The Pilbara Craton in Western Australia
If we run another set of Pb/Th ratios 59 through Isoplot we see that the dates vary from 500 to over 17,000 million years old [Table 36]. In Table 37 we can see the maximum ages for the Thorium/Lead dating method.
Uranium/Thorium/Lead, Maximum AgesThorium/Lead - Ages Summary
Dating 207Pb/235U 206Pb/238U 208Pb/232ThSummary Age Age AgeAverage 2,955 2,956 6,286
Maximum 4,220 8,073 17,500Minimum 1,921 1,074 535
Std Deviation 392 1,019 3,196
Age Age Age Age17,500 8,891 7,493 5,74313,259 8,768 7,443 5,59413,100 8,689 7,368 5,51212,821 8,343 7,343 5,51212,662 8,320 7,240 5,45512,212 8,247 7,192 5,43211,163 8,232 7,148 5,25510,959 8,197 7,047 5,25310,783 8,064 6,478 5,22910,668 8,013 6,270 5,15410,384 7,949 6,199 5,1489,945 7,947 6,152 5,1359,580 7,861 6,083 5,1159,124 7,702 6,052 5,0478,908 7,692 5,885 5,0338,905 7,612 5,803 4,889

20. Timing of Sedimentation, Metamorphism, and Plutonism
According to the article the rock formation is 478 million years old. 60 If we run the Pb/Th ratios 61 through Isoplot we see that the dates vary from 500 to over 80,000 million years old [Table 38]. In Table 39 we can see the maximum ages for the Thorium/Lead dating method.
Thorium/Lead, Maximum AgesThorium/Lead - Ages Summary
Average 19,539Maximum 80,532Minimum 489
Std Deviation 27,260
Age Age Age Age80,532 66,448 51,879 24,60474,016 65,076 51,751 16,80970,713 65,000 51,545 15,74869,057 61,342 34,766 15,36568,831 60,335 31,045 13,38468,503 58,364 28,397 11,94567,672 56,792 24,733 9,477

21. U–Th and U–Pb Systematics in Zircons
According to the article:
“At Taupo, the zircon model ages range from <20 ka to >500 Ma.” 62
If we run the Pb/Th ratios 63 through Isoplot we see that the dates vary from 11,000 to over 41,000 million years old [Table 40]. In Table 41 we can see the maximum ages for the Thorium/Lead dating method.
Thorium/Lead, Maximum AgesThorium/Lead - Ages Summary
Average 22,847Maximum 41,460Minimum 11,390
Std Deviation 6,191
Age Age Age Age Age41,460 26,447 23,441 21,348 18,53434,824 25,988 23,025 20,730 18,14033,392 25,525 22,704 19,977 17,70129,182 24,858 22,560 19,950 17,35729,126 24,325 22,493 19,738 16,45528,671 24,160 22,138 19,422 16,22127,733 23,992 21,885 19,360 15,72627,587 23,665 21,877 19,307 15,30126,533 23,448 21,390 19,024 11,390

22. Hydrothermal Zebra Dolomite
According to the article the rock formation is 416 million years old. 64 If we run the Pb/Th ratios 65 through Isoplot we see that the dates vary from 6,000 to over 55,000 million years old [Table 42]. In Table 43 we can see the maximum ages for the Thorium/Lead dating method.
Thorium/Lead, Maximum AgesThorium/Lead - Ages Summary
Dating Pb206/U238 Pb208/Th232 Pb207/Pb206Summary Age Age AgeAverage 11,353 17,193 4,933
Maximum 23,421 55,110 4,997Minimum 1,715 6,130 4,799
Std Deviation 5,055 11,459 53
Age Age55,110 14,77929,742 13,37427,889 11,95127,051 10,78321,318 9,33619,224 8,64418,091 8,05817,944 6,72116,474 6,18515,059 6,130

22. Hydrothermal Zebra Dolomite
If we run the Pb/Th ratios 65 in the second spreadsheet table through Isoplot we see that the dates vary from 6,000 to over 270,000 million years old [Table 44]. In Table 45 we can see the maximum ages for the Thorium/Lead dating method.
Thorium/Lead, Maximum AgesThorium/Lead - Ages Summary
Average 90,690Maximum 277,727Minimum 6,643
Std Deviation 47,209
Billion Years Quantity Billion Years Quantity0 To 20 2 130 To 140 6
20 To 30 1 140 To 150 630 To 40 22 150 To 160 240 To 50 19 160 To 170 650 To 60 33 170 To 180 160 To 70 17 180 To 190 570 To 80 23 190 To 200 180 To 90 18 200 To 210 3
90 To 100 14 210 To 220 1100 To 110 18 220 To 230 2110 To 120 21 240 To 250 1120 To 130 13 270 To 280 2

23. Origin of Indian Ocean Seamount Province
According to the article the rock formation is 6 million years old. 66 If we run the Pb/Th ratios 67 through Isoplot we see that the dates vary from 2,000 to over 28,000 million years old [Table 46]. In Table 47 we can see the maximum ages for the Thorium/Lead dating method.
Thorium/Lead, Maximum Ages
Thorium/Lead - Ages Summary Dating 207Pb/206Pb 206Pb/238U 208Pb/232Th
Summary Age Age Age
Average 5,015 5,191 7,740Maximum 5,087 18,210 28,677Minimum 4,921 890 1,943
Std Deviation 48 3,634 4,590
Age Age Age Age Age
28,677 10,719 9,515 7,923 6,51212,829 10,626 9,506 7,669 6,33312,028 10,425 9,146 7,407 6,19911,798 10,378 9,073 7,380 6,19811,552 10,240 9,019 7,380 6,08511,317 10,201 8,916 7,367 6,05111,113 10,082 8,298 7,030 5,99910,773 10,055 8,111 6,910 5,49310,725 9,678 8,001 6,651 5,418

24. Geochemistry Geophysics Geosystems
According to the article the rock formation is 100 million years old. 68 If we run the Pb/Th ratios 68 through Isoplot we see that the dates vary from 5,000 to over 82,000 million years old [Table 48]. In Table 49 we can see the maximum ages for the Thorium/Lead dating method.
Thorium/Lead, Maximum Ages
Thorium/Lead - Ages Summary
Dating 206Pb/238U 207Pb/235U 207Pb/206Pb 208Pb/232ThSummary Age Age Age AgeAverage 15,345 7,019 4,936 39,068
Maximum 38,340 10,872 5,043 82,865Minimum 3,125 4,385 4,760 5,577
Std Deviation 9,657 1,750 63 27,390
Age Age Age82,865 51,821 16,41781,065 45,608 7,51275,644 45,035 6,84072,833 42,233 6,62664,393 39,019 6,32258,240 27,562 5,57957,334 23,571 5,57756,640 19,834

25. Continental Lithospheric Contribution
According to the article the rock formation is 72 million years old. 69 If we run the Pb/Th ratios 69 through Isoplot we see that the dates vary from 5,000 to over 82,000 million years old [Table 50]. In Table 51 we can see the maximum ages for the Thorium/Lead dating method.
Thorium/Lead, Maximum Ages
Thorium/Lead - Ages Summary
Dating 207Pb/206Pb 208Pb/232Th 206Pb/238U 87Rb/86Sr
Summaries Age Age Age AgeAverage 4,920 6,126 4,539 -47
Maximum 4,949 10,084 7,723 0Minimum 4,894 2,616 2,306 -75Difference 55 7,467 5,417 75
Age Age 10,084 6,6559,320 6,3138,101 5,8307,502 5,7557,080 5,0296,891

26. Cenozoic Volcanic Rocks of Eastern China
According to the article the rock formation is Quaternary in age. 70 If we run the Pb/Th ratios 71 through Isoplot we see that the dates vary from 4,000 to over 17,000 million years old [Table 52]. In Table 53 we can see the maximum ages for the Thorium/Lead dating method.
Thorium/Lead, Maximum Ages
Thorium/Lead - Ages Summary
Table 207Pb/206Pb 206Pb/238U 208Pb/232Th 87Rb/86Sr
Summaries Age Age Age AgeAverage 5,057 5,296 10,589 -1,502
Maximum 5,120 8,584 17,171 0Minimum 5,002 1,136 4,042 -3,593Difference 118 7,448 13,129 3,593
Age Age Age Age17,171 13,322 9,737 7,96815,343 13,202 9,707 7,83015,299 13,001 9,049 7,25015,136 11,119 8,420 6,97215,054 10,873 8,419 6,62813,476 10,758 8,368 6,577

27. Sr, Nd, and Pb isotopes
According to the article the rock formation is 2,900 million years. 72 If we run the Pb/Th ratios 73 through Isoplot we see that the dates vary from 79 to over 94,000 million years old [Table 54]. In Table 55 we can see the maximum ages for the Thorium/Lead dating method.
Thorium/Lead, Maximum Ages
Thorium/Lead - Ages Summary
Dating 232Th/208Pb 206Pb/238U 207Pb/206PbSummaries Age Age Age
Average 14,198 7,366 5,014Maximum 94,396 22,201 5,077Minimum 79 1,117 4,945Difference 94,317 21,083 131
Age Age Age Age94,396 39,267 10,595 8,17190,683 26,266 10,284 7,78974,639 18,334 9,328 7,63858,153 16,357 8,821 7,37555,324 14,250 8,771 7,31745,242 11,215 8,403 5,759

28. An Extremely low U/Pb Source
According to the article: “The Rb-Sr data yield an internal isochron age of 3,840 ± 32 Ma.” 74 If we run the Pb/Th ratios 75 through Isoplot we see that the dates vary from 5,000 to over 13,000 million years old [Table 56]. In Table 57 we can see the maximum ages for the Thorium/Lead dating method.
Thorium/Lead, Maximum Ages
Thorium/Lead - Ages Summary
Table
207Pb/206Pb
206Pb/238U 208Pb/232Th 207Pb/235U87Rb/86Sr
Summaries Age Age Age Age Age
Average 4,673 8,035 10,148 4,546 3,619Maximum 5,018 56,923 65,286 8,128 5,385Minimum 3,961 1,477 2,542 2,784 721Difference 1,057 55,445 62,744 5,344 4,664
Age Age Age Age
65,286 14,430 9,094 5,40133,898 14,410 6,520 5,39625,013 13,107 6,166 5,36522,178 12,738 6,121 5,09821,204 11,641 5,671 5,03517,611 11,174 5,408 4,678
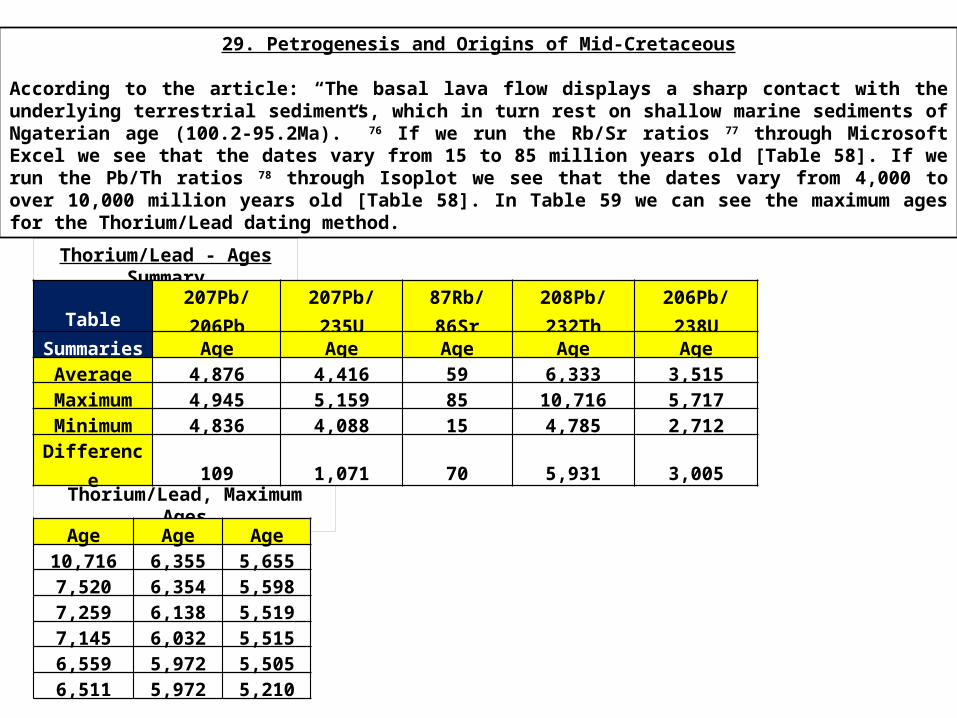
29. Petrogenesis and Origins of Mid-Cretaceous
According to the article: “The basal lava flow displays a sharp contact with the underlying terrestrial sediments, which in turn rest on shallow marine sediments of Ngaterian age (100.2-95.2Ma).” 76 If we run the Rb/Sr ratios 77 through Microsoft Excel we see that the dates vary from 15 to 85 million years old [Table 58]. If we run the Pb/Th ratios 78 through Isoplot we see that the dates vary from 4,000 to over 10,000 million years old [Table 58]. In Table 59 we can see the maximum ages for the Thorium/Lead dating method.
Thorium/Lead, Maximum Ages
Thorium/Lead - Ages Summary
Table 207Pb/206Pb 207Pb/235U 87Rb/86Sr 208Pb/232Th 206Pb/238USummaries Age Age Age Age Age
Average 4,876 4,416 59 6,333 3,515Maximum 4,945 5,159 85 10,716 5,717Minimum 4,836 4,088 15 4,785 2,712Difference 109 1,071 70 5,931 3,005
Age Age Age10,716 6,355 5,6557,520 6,354 5,5987,259 6,138 5,5197,145 6,032 5,5156,559 5,972 5,5056,511 5,972 5,210

Conclusion
If we use the standard formula 79 for calculating Rb/Sr ages we find on many occasions that the Uranium/Thorium/Lead dates are all wrong! Evolutionist Brent Dalrymple states: “Several events in the formation of the Solar System can be dated with considerable precision.” 80
Looking at some of the dating it is obvious that precision is much lacking. He then goes on: “Biblical chronologies are historically important, but their credibility began to erode in the eighteenth and nineteenth centuries when it became apparent to some that it would be more profitable to seek a realistic age for the Earth through observation of nature than through a literal interpretation of parables.” 81
I his book he gives a table 82 with radiometric dates of twenty meteorites. If you run the figures through Microsoft Excel, you will find that they are 98.7% in agreement. There is only a seven percent difference between the ratio of the smallest and oldest dates. As we have seen in this essay, such a perfect fit is attained by selecting data and ignoring other data. A careful study of the latest research shows that such perfection is illusionary at best. Much of the data in Dalrymple’s book is selectively taken to suit and ignores data to the contrary. The Bible believer who accepts the creation account literally has no problem with such unreliable dating methods. Much of the data in Dalrymple’s book is selectively taken to suit and ignores data to the contrary.

References 1 http://web.archive.org/web/20051223072700/http://pubs.usgs.gov/gip/geotime/age.html
The age of 10 to 15 billion years for the age of the Universe. 2 http://en.wikipedia.org/wiki/Age_of_the_universe 3 http://arxiv.org/pdf/1001.4744v1.pdf
Microwave Anisotropy Probe Observations, Page 39, By N. Jarosik 4 http://en.wikipedia.org/wiki/Age_of_the_Earth 5 http://sp.lyellcollection.org/content/190/1/205
The age of the Earth, G. Brent DalrympleGeological Society, London, Special Publications, January 1, 2001, Volume 190, Pages 205-221
6 The age of the earth, Gérard Manhes
Earth and Planetary Science Letters, Volume 47, Issue 3, May 1980, Pages 370–382 7 http://www.bgc.org/isoplot_etc/isoplot.html 8 Tracing the Indian Ocean Mantle, Journal Of Petrology, 1998, Volume 39, Number 7, Pages 1288 9 Reference 8, Page 1292-1294
10 Petrogenesis of the Flood Basalts, Journal Of Petrology, 1998, Volume 39, Number 4, Pages 711 11 Reference 10, Page 729-730 12 Nature of the Source Regions, Journal Of Petrology, 2004, Volume 45, Number 3, Pages 556 14 Reference 12, Table 1, Page 558
14 Reference 12, Page 566 15 Reference 12, Page 575-576 16 Generation of Palaeocene Adakitic Andesites, Journal Of Petrology, 2007, Volume 48, Number 4, Pages 667
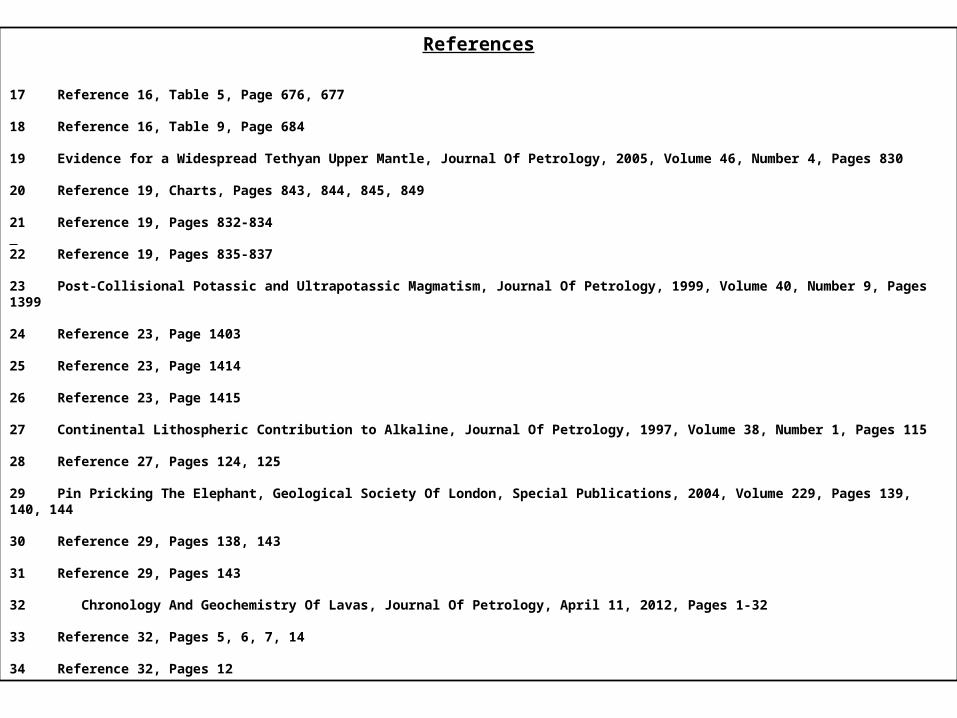
References 17 Reference 16, Table 5, Page 676, 677 18 Reference 16, Table 9, Page 684 19 Evidence for a Widespread Tethyan Upper Mantle, Journal Of Petrology, 2005, Volume 46, Number 4, Pages 830 20 Reference 19, Charts, Pages 843, 844, 845, 849 21 Reference 19, Pages 832-834 22 Reference 19, Pages 835-837 23 Post-Collisional Potassic and Ultrapotassic Magmatism, Journal Of Petrology, 1999, Volume 40, Number 9, Pages 1399 24 Reference 23, Page 1403 25 Reference 23, Page 1414 26 Reference 23, Page 1415 27 Continental Lithospheric Contribution to Alkaline, Journal Of Petrology, 1997, Volume 38, Number 1, Pages 115 28 Reference 27, Pages 124, 125 29 Pin Pricking The Elephant, Geological Society Of London, Special Publications, 2004, Volume 229, Pages 139, 140, 144 30 Reference 29, Pages 138, 143 31 Reference 29, Pages 143 32 Chronology And Geochemistry Of Lavas, Journal Of Petrology, April 11, 2012, Pages 1-32
33 Reference 32, Pages 5, 6, 7, 14 34 Reference 32, Pages 12

References 35 Ion microprobe U-Th-Pb dating, Meteoritics & Planetary Science, 2004, Volume 39, Number 12, Pages 2033 36 Reference 35, Pages 2036 37 U–Th–Pb Dating Of Secondary Minerals, Geochimica et Cosmochimica Acta, 2008, Volume 72, Pages 2078 38 Reference 37, Pages 2072, 2073 39 Reference 37, Pages 2074 40 Reference 37, Pages 2080, 2081 41 The Influence of High U-Th, Geochimica et Cosmochimica Acta, 1998, Volume 62, Numbers 21/22, Pages 3527 42 Reference 41, Pages 3529 43 Reference 41, Pages 3531 44 U, Th And Pb Isotope Compositions, Geochimica et Cosmochimica Acta, 2009, Volume 73, Pages 469 45 Reference 44, Pages 471 46 Earth Planetary Science Letters, 1987, Volume 82, Pages 121–135. 47 Chemical Geology, 2003, Volume 200, Pages 71–87. 48 Journal Petrology, 1993, Volume 34, Pages 125–172. 49 Geochimica et Cosmochimica Acta, 2007, Volume 71, Pages 1290–1311 50 Reference 44, Pages 475, 476 51 U–Th–Pb Isotope Data, Earth and Planetary Science Letters, 2012, Volume 319-320, Pages 200

References 52 Reference 51, Pages 199 53 Evolution Of Reunion Hotspot Mantle, Earth and Planetary Science Letters, 1995, Volume 134, Pages 169 54 Reference 53, Page 174 55 Continental Growth 3.2 Gyr Ago, Nature, 2012, Volume 485, Pages 627–630,
http://www.nature.com/nature/journal/v485/n7400/extref/nature11140-s3.xls 56 Uranium-Lead Zircon Ages, http://pubs.usgs.gov/of/2008/1142/tables/table04.xls 57 Pilbara Craton in Western Australia, http://www.geo.uu.nl/~kikeb/thesis/thesis/thesis_frame.html 58 http://www.geo.uu.nl/~kikeb/thesis/database/upb/KB746.xls 59 www.geo.uu.nl/~kikeb/thesis/database/upb/KB770.xls 60 Timing of sedimentation, metamorphism, and plutonism, http://geosphere.gsapubs.org/content/3/6/683.abstract 61 http://geosphere.gsapubs.org/content/suppl/2009/02/18/3.6.683.DC1/00138_App3.xls 62 U–Th and U–Pb Systematics in Zircons, Journal Petrology, January 1, 2005, volume 46, Number 1, Pages 27
63 http://petrology.oxfordjournals.org/content/suppl/2004/09/24/egh060.DC1/Table_3.xls 64 Hydrothermal Zebra Dolomite, Geosphere, October 2010, Volume 6, Number 5, Pages 663-690, 65 http://geosphere.gsapubs.org/content/suppl/2010/09/29/6.5.663.DC1/530_supp1.xls 66 Origin of Indian Ocean Seamount Province, Nature Geoscience, 2011, Volume 4, Pages 883-887 67 www.nature.com/ngeo/journal/v4/n12/extref/ngeo1331-s2.xls

References 68 Geochemistry Geophysics Geosystems, 2003, Volume 4, Page 1089, http://earthref.org/ERDA/download:147/ 69 Continental Lithospheric Contribution, Journal Of Petrology, 1997, Volume 38, Number 1, Pages 124 70 Cenozoic Volcanic Rocks of Eastern China, Earth and Planetary Science Letters, Volume 105 (1991), Pages 154 71 Reference 70, Pages 156, 157 72 Sr, Nd, and Pb isotopes, Earth and Planetary Science Letters, Volume 113 (1992), Pages 107 73 Reference 72, Page 110 74 An extremely low U/Pb source, Geochimica et Cosmochimica Acta, 1993, Volume 57, Pages 4687 75 Reference 74, Pages 4690, 4691 76 Petrogenesis and Origins of Mid-Cretaceous, Journal Of Petrology, 2010, Volume 51, Number 10, Pages 2005 77 Reference 76, Page 2024 78 Reference 76, Page 2025 79 Isotopes in the Earth Sciences, Edited By Robert Brown, 1988, Elsevier, 1994, Chapman and Hall Publishers, Page 167http://books.google.de/books?id=k90iAnFereYC&pg=PA162#v=onepage&q&f=false 80 The Age Of The Earth, By G. Brent Dalrymple, 1991, Stanford University Press, Stanford, California, Page 10. 81 Reference 81, Page 23 82 Reference 81, Page 287
www.creation.com