The Swedish banking system
96
The Swedish banking system
Transcript of The Swedish banking system

The Swedish banking system

The banks’ assets in relation to GDP December 2011, per cent
Sources: ECB, the European Commission, the Swiss National Bank and the Riksbank Chart 1

Lending of the major Swedish banks per borrower category March 2013
Households 48%
Property companies
20%
Companies, excluding property
companies32%
Sources: Bank reports and the Riksbank Chart 2

The major banks' market funding via Swedish parent companies and subsidiaries SEK billions
0
500
1000
1500
2000
2500
3000
3500
4000
02 03 04 05 06 07 08 09 10 11 12 13
SEK Foreign currency
Sources: Statistics Sweden and the Riksbank Chart 3

Chapter 1 Stability assessment
and recommendations
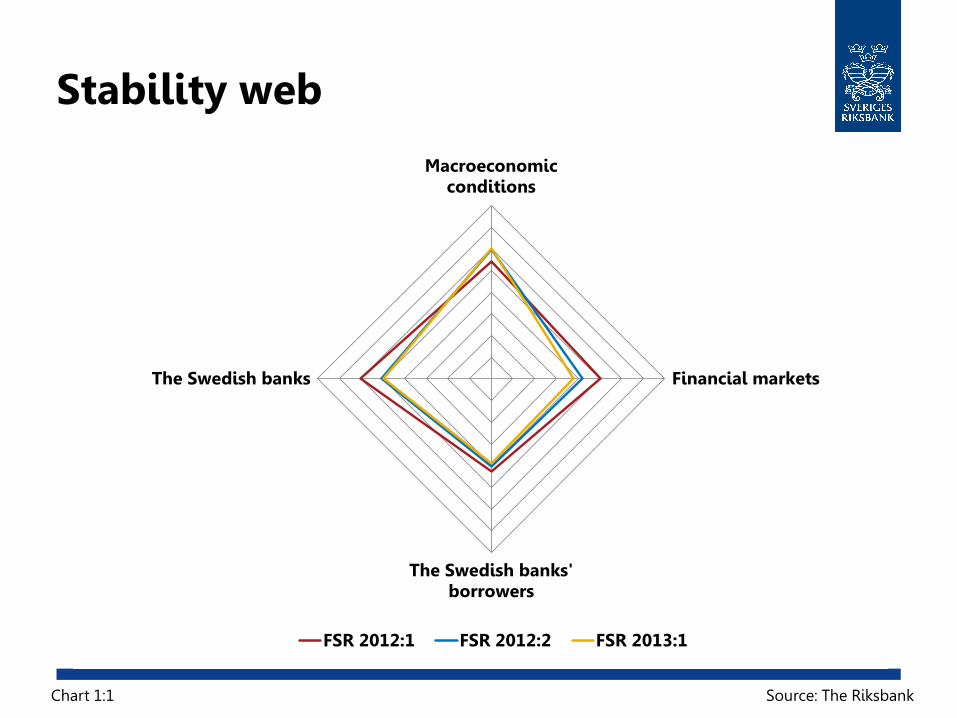
Stability web
Macroeconomicconditions
Financial markets
The Swedish banks'borrowers
The Swedish banks
FSR 2012:1 FSR 2012:2 FSR 2013:1
Source: The Riksbank Chart 1:1

European stress index Ranking
0.0
0.1
0.2
0.3
0.4
0.5
0.6
0.7
0.8
0.9
1.0
07 08 09 10 11 12 13
Money market Bond market Stock market
Financial intermediaries Foreign exchange market Stress index
Source: ECB Chart 1:2

Systemic risk indicator for the Swedish financial system Probability, per cent
0.000
0.005
0.010
0.015
0.020
0.025
0.030
06 07 08 09 10 11 12 13 14
Source: The Riksbank Chart 1:3

Transparency index for liquidity reporting, European banks March 2013
0 10 20 30 40 50 60 70 80 90 100
HandelsbankenNordea
SEBSwedbank
Source: Liquidatum Chart 1:4

The four Basel III measures June 2012, per cent
EBA, Finansinspektionen and the Riksbank Chart 1:5

Core tier 1 capital ratio according to Basel II December 2012, per cent
0 2 4 6 8 10 12 14 16 18 20
Crédit AgricoleRBS
Banco SantanderRaiffeisen
Société GénéraleBarclays
BBVAUniCredit
Intesa SanpaoloDNB
Deutsche BankBNP Paribas
LloydsCommerzbank
HSBCNordea
Danske BankSEB
Credit SuisseSwedbank
HandelsbankenUBS
Sources: SNL Financial and the Riksbank Chart 1:6

Equity in relation to total assets December 2012, per cent
0 2 4 6 8 10 12
Handelsbanken
SEBNordea
Swedbank
Source: Liquidatum Chart 1:7
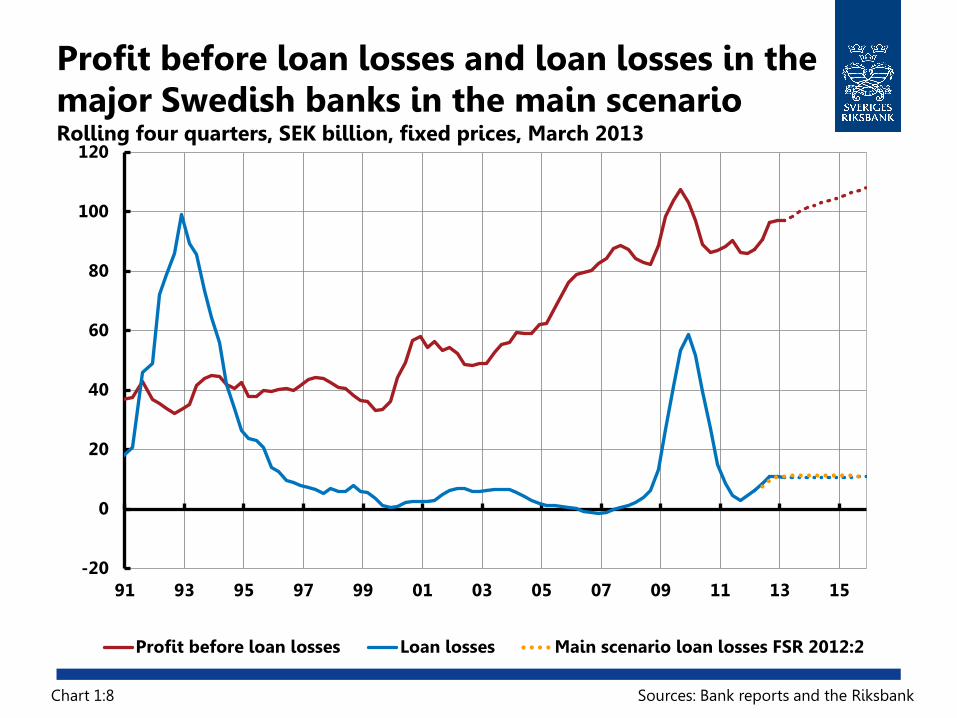
Profit before loan losses and loan losses in the major Swedish banks in the main scenario Rolling four quarters, SEK billion, fixed prices, March 2013
-20
0
20
40
60
80
100
120
91 93 95 97 99 01 03 05 07 09 11 13 15
Profit before loan losses Loan losses Main scenario loan losses FSR 2012:2
Sources: Bank reports and the Riksbank Chart 1:8

The credit gap for Sweden Per cent of GDP
-40
-30
-20
-10
0
10
20
30
81 85 89 93 97 01 05 09
Non financial corporates Households Other Total
Sources: Statistics Sweden and the Riksbank Chart 1:9
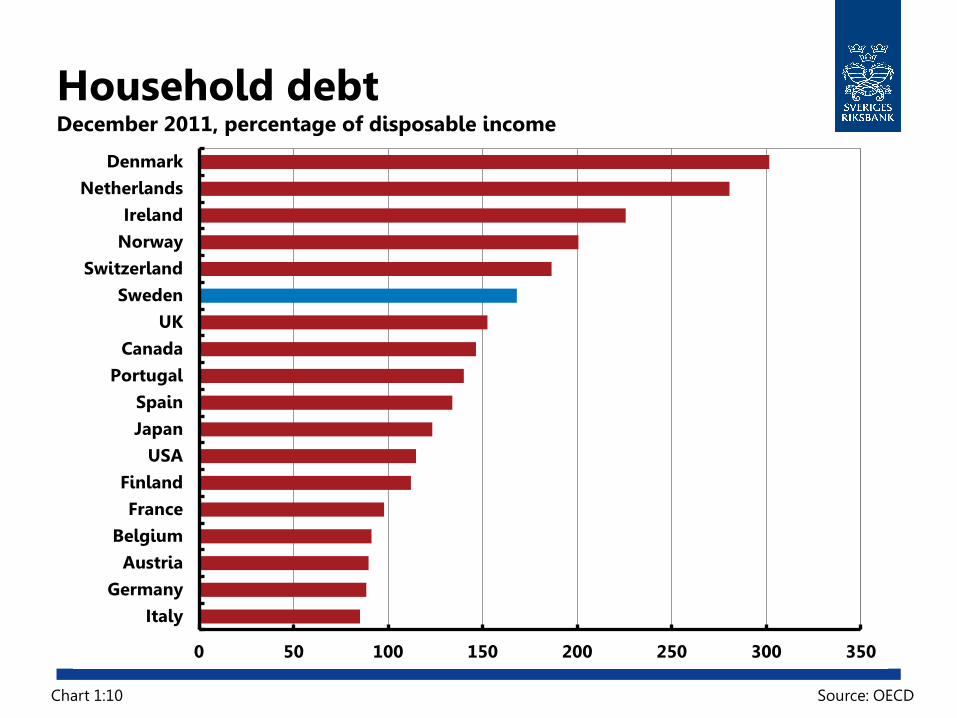
Household debt December 2011, percentage of disposable income
0 50 100 150 200 250 300 350
Italy
Germany
Austria
Belgium
France
Finland
USA
Japan
Spain
Portugal
Canada
UK
Sweden
Switzerland
Norway
Ireland
Netherlands
Denmark
Source: OECD Chart 1:10

Swedish banks' wholesale funding in foreign currency Percentage of GDP
0
10
20
30
40
50
60
0
10
20
30
40
50
60
98 99 00 01 02 03 04 05 06 07 08 09 10 11 12 13
Sources: Statistics Sweden and the Riksbank Chart 1:11

CET 1 ratios according to Basel III Per cent
0
2
4
6
8
10
12
14
16
18
20
Handels-banken
Nordea SEB Swedbank
March 2012 June 2012 September 2012 December 2012 March 2013
Sources: Bank reports and the Riksbank Chart 1:12

The Riksbank's structural liquidity measure Per cent
0
20
40
60
80
100
120
Handels-banken
Nordea SEB Swedbank
December 2010 December 2011 December 2012
Sources: Liquidatum and the Riksbank Chart 1:13

The major Swedish banks’ risk-weighted assets March 2013, SEK billion
0
1000
2000
3000
4000
5000
6000
Basel III Basel II excl.transition rules
Basel II incl.transition rules
Basel I
Sources: Bank reports and the Riksbank
Chart B1:1

The major Swedish banks’ Tier 1 capital ratio March 2013, per cent
0
2
4
6
8
10
12
14
16
18
Basel II incl.transition rules
Basel II excl.transition rules
Sources: Bank reports and the Riksbank Chart B1:2

CET 1 ratios and leverage ratios June 2012, per cent
0
2
4
6
8
10
12
14
CET 1 ratio Basel III Leverage ratio
Major Swedish banks Other European banks
Sources: Bank reports, EBA and the Riksbank Chart B1:3

Chapter 2 Financial markets

Stock market developments Index, 1 june 2011=100
40
50
60
70
80
90
100
110
120
130
Jun-11 Sep-11 Dec-11 Mar-12 Jun-12 Sep-12 Dec-12 Mar-13 Jun-13
United States - S&P500 Europe - STOXX600Sweden - OMXS30 Emerging markets - MSCI
Source: Bloomberg Chart 2:1

Swedish stress index Ranking
Sources: Reuters EcoWin, Bloomberg and the Riksbank Chart 2:2

Issuance volumes and funding costs for European corporates EUR billion and basis points
Sources: Barclays Research, Dealogic and the Riksbanken Chart 2:3

Balances in Target2 EUR billion
Source: Bloomberg Chart 2:4

Yields on two-year government bonds Per cent
0
1
2
3
4
5
6
7
8
9
10
Ireland Italy Portugal Spain Germany France
Source: Reuters EcoWin Chart 2:5

Yields on ten-year government bonds Per cent
0
0.5
1
1.5
2
2.5
3
3.5
4
4.5
Jun-09 Dec-09 Jun-10 Dec-10 Jun-11 Dec-11 Jun-12 Dec-12 Jun-13
United States Germany United Kingdom Sweden
Source: Reuters EcoWin Chart 2:6

Public debt in relation to GDP Per cent
0
25
50
75
100
125
150
175
200
00 02 04 06 08 10 12
Sweden Spain Portugal Italy Ireland Greece France Germany
Source: Reuters EcoWin Chart 2:7

Ownership structure for Italy's government debt EUR billion
0
500
1000
1500
2000
2500
Dec 2010 Jan 2013
Foreign investors Domestic banks
Domestic finance companies Bank of Italy
Other domestic investors
Sources: Bank of Italy and the Riksbank Chart 2:8

Bank deposits in Cyprus EUR billion
0
10
20
30
40
50
60
70
80
06 07 08 09 10 11 12 13
Domestic Other euro area countries Other countries
Sources: Reuters EcoWin and the Riksbank Chart 2:9

ECB-lending to the banks and banks' lending to the public ECB-lending in per cent of bank assets. Bank lending: Index, 1 January 2010=0 2010
-10
-8
-6
-4
-2
0
2
4
6
8
10
Jan-10 Jul-10 Jan-11 Jul-11 Jan-12 Jul-12 Jan-13 Jul-13
Bank lending core countries Bank lending heavily indebted countries
ECB-lending core countries ECB-lending heavily indebted countries
Sources: ECB, Bloomberg and the Riksbank Chart 2:10

Interest rates on corporate loans in selected euro area countries Per cent
Source: ECB Chart 2:11

Yields on covered bonds Basis points
Source: Barclays Research Chart 2:12

Five-year CDS-premiums for banks Basis points
Sources: Bloomberg and the Riksbank Chart 2:13

Yields on Swedish banks' covered bonds Basis points
-20
0
20
40
60
80
100
120
05 06 07 08 09 10 11 12 13 14
Two-year maturity Five-year maturity
Sources: Reuters EcoWin and the Riksbank Chart 2:14

The risk premium on the interbank market Basis points
0
20
40
60
80
100
120
Jan-11 Apr-11 Jul-11 Oct-11 Jan-12 Apr-12 Jul-12 Oct-12 Jan-13 Apr-13 Jul-13
United States Euro area United Kingdom Sweden
Sources: Bloomberg and the Riksbank Chart 2:15

US money market fund exposures USD billion
0
100
200
300
400
500
600
700
800
900
Sweden Euro area Other Europe
Sources: Crane Data, ICI and the Riksbank Chart 2:16

Interbank and central bank loans Per cent of total bank assets
0
1
2
3
4
5
6
7
8
9
Jan-11 Apr-11 Jul-11 Oct-11 Jan-12 Apr-12 Jul-12 Oct-12 Jan-13 Apr-13
Interbank loans, heavily indebted countries Interbank loans, core countries
Centralbank loans, heavily indebted countries Centralbank loans, core countries
Sources: Bloomberg, Reuters EcoWin and the Riksbank Chart 2:17
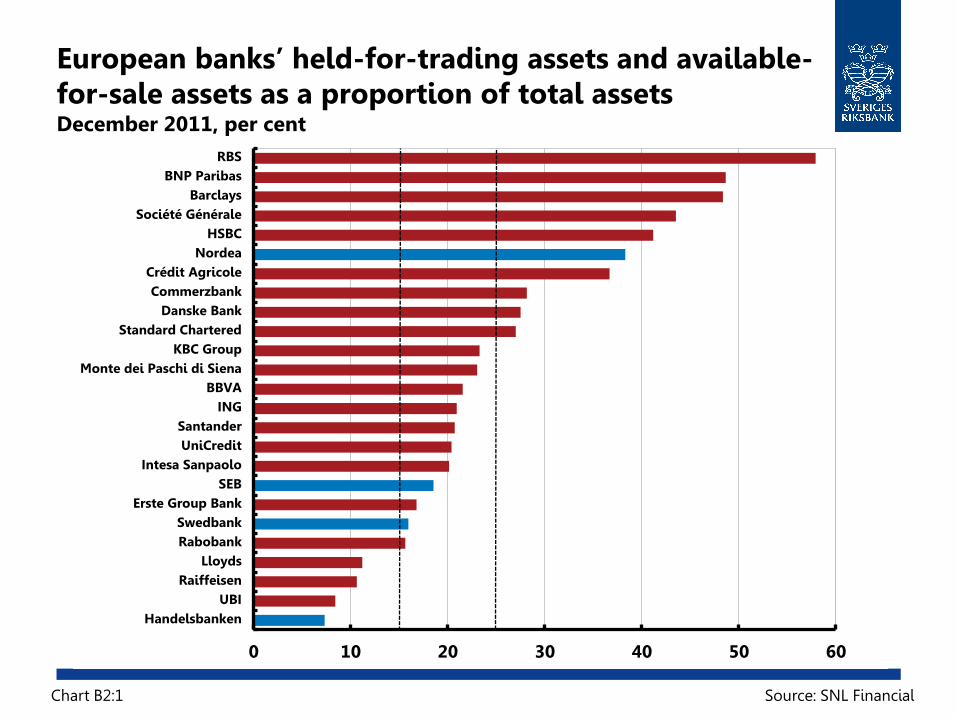
European banks’ held-for-trading assets and available-for-sale assets as a proportion of total assets December 2011, per cent
0 10 20 30 40 50 60
Handelsbanken
UBI
Raiffeisen
Lloyds
Rabobank
Swedbank
Erste Group Bank
SEB
Intesa Sanpaolo
UniCredit
Santander
ING
BBVA
Monte dei Paschi di Siena
KBC Group
Standard Chartered
Danske Bank
Commerzbank
Crédit Agricole
Nordea
HSBC
Société Générale
Barclays
BNP Paribas
RBS
Source: SNL Financial Chart B2:1

Chapter 3 The Swedish banking
groups´ borrowers

Real housing prices Index, January 2005=100
100
110
120
130
140
150
160
170
180
05 06 07 08 09 10 11 12 13 14
Composite index Tenant-owned apartments Single-family houses
Sources: Valueguard and the Riksbank Chart 3:1
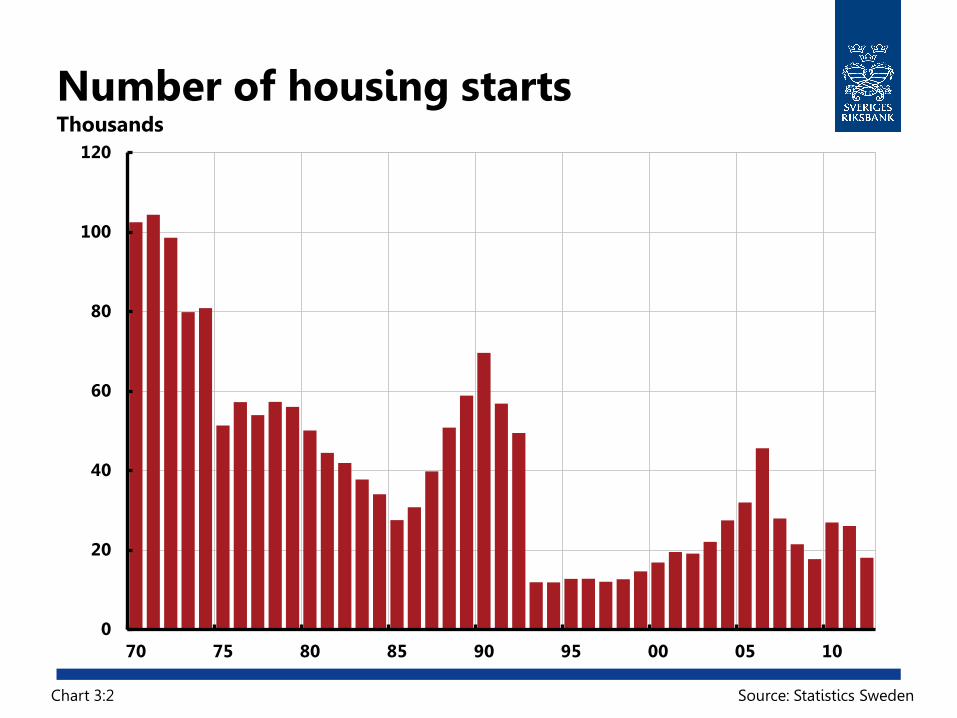
Number of housing starts Thousands
0
20
40
60
80
100
120
70 75 80 85 90 95 00 05 10
Source: Statistics Sweden Chart 3:2

Housing stock by type and tenure Index, 1990=100
Sources: Statistics Sweden and the Riksbank Chart 3:3

0
2
4
6
8
10
12
14
16
18
20
02 03 04 05 06 07 08 09 10 11 12 13
Monthly percentage changes restated as an annual rate
Annual percentage change
Household debt Per cent
Sources: Statistics Sweden and the Riksbank Chart 3:4

Household debt and post-tax interest expenditure Percentage of disposable income
0
2
4
6
8
10
12
14
16
18
20
0
20
40
60
80
100
120
140
160
180
200
72 76 80 84 88 92 96 00 04 08 12 16
Debt ratio (left scale) Interest ratio (right scale)
Sources: Statistics Sweden and the Riksbank Chart 3:5

Distribution of debt ratios of new mortgage borrowers, 2012 Percentage of borrowers
Sources: Finansinspektionen and the Riksbank Chart 3:6

Household savings Percentage of disposable income
Source: The Riksbank Chart 3:7

Household assets and debt Percentage of disposable income
0
100
200
300
400
500
600
71 74 77 80 83 86 89 92 95 98 01 04 07 10 13
Total wealth, excluding collective insurance Real wealth Liquid wealth Debt
Sources: Statistics Sweden and the Riksbank Chart 3:8
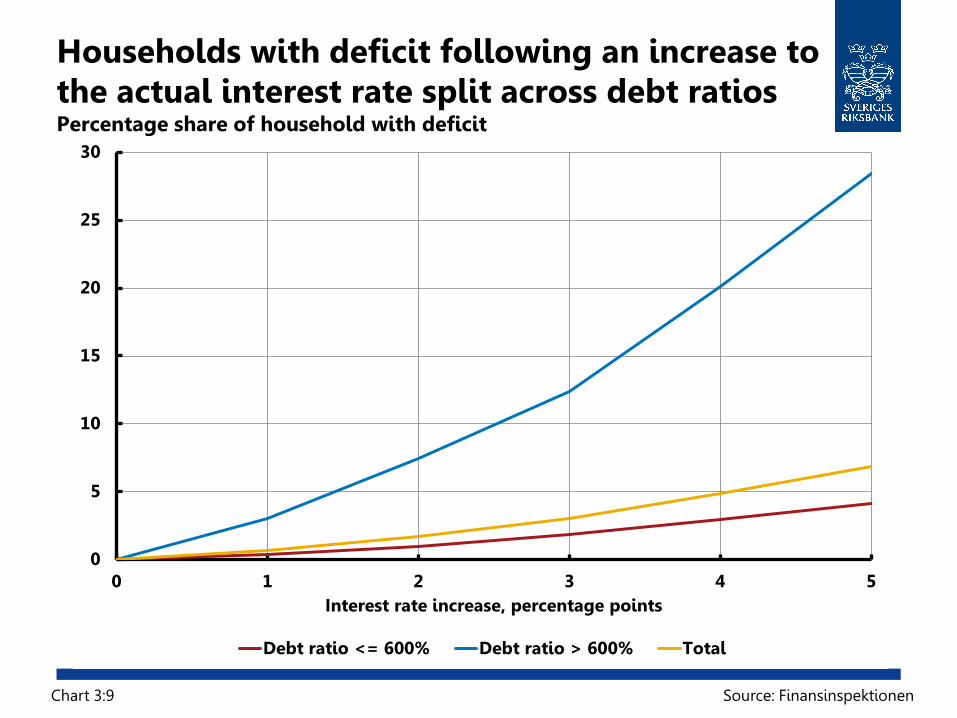
Households with deficit following an increase to the actual interest rate split across debt ratios Percentage share of household with deficit
0
5
10
15
20
25
30
0 1 2 3 4 5
Interest rate increase, percentage points
Debt ratio <= 600% Debt ratio > 600% Total
Source: Finansinspektionen Chart 3:9

Households with deficit following an increase to the actual interest rate given different living expenses Share of households with deficit, per cent
0
2
4
6
8
10
12
14
16
18
20
0 1 2 3 4 5
Interest rate increase, percentage points
Average of banks' standard values HBS 2009 (adjusted for consumption)
Sources: Finansinspektionen, Statistics Sweden and the Riksbank Chart 3:10
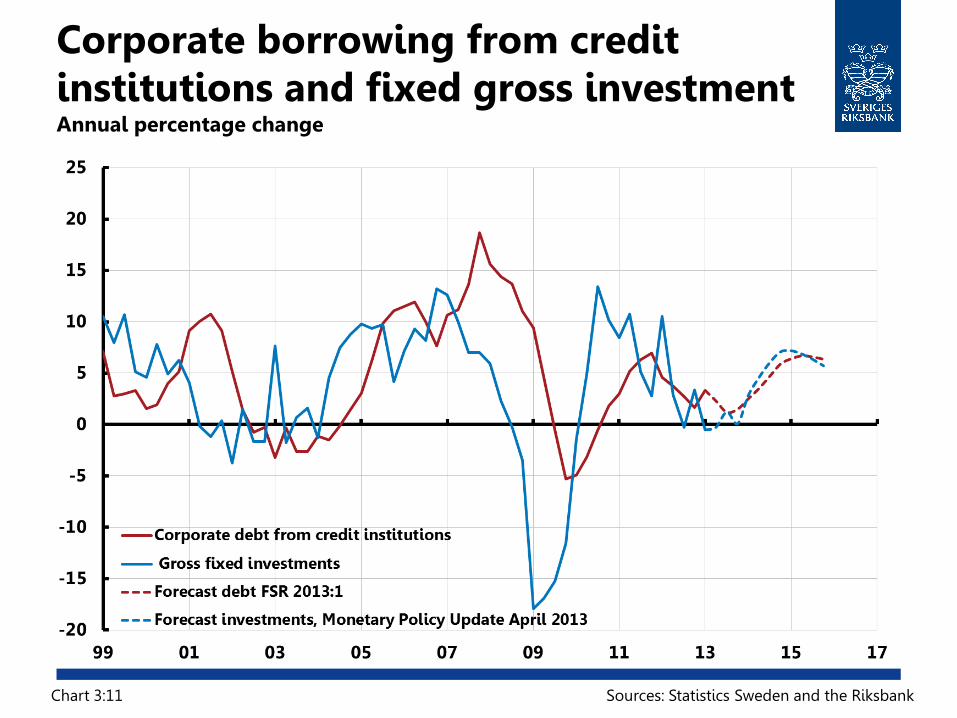
Corporate borrowing from credit institutions and fixed gross investment Annual percentage change
Sources: Statistics Sweden and the Riksbank Chart 3:11

Default rate for Swedish companies Per cent
0
0.5
1
1.5
2
2.5
3
85 87 89 91 93 95 97 99 01 03 05 07 09 11 13 15
Bankruptcy rate Forecast FSR 2013:1
Source: The Riksbank Chart 3:12

Corporate defaults Twelve-month moving average, index, average 2007=100
0
100
200
300
400
500
600
700
800
900
1000
07 08 09 10 11 12 13 14
Sweden Denmark Finland Norway Spain UK Germany
Sources: Reuters EcoWin, Destatis Statistches Bundesamt, and the Riksbank Chart 3:13

Corporate borrowing Annual percentage change
-10
-5
0
5
10
15
20
25
04 05 06 07 08 09 10 11 12 13 14
Sweden Denmark Finland Norway
Sources: Reuters EcoWin, Bank of Finland and the Riksbank Chart 3:14

Real house prices Index, Q1 1995 = 100
0
50
100
150
200
250
300
350
80 82 84 86 88 90 92 94 96 98 00 02 04 06 08 10 12 14
Sweden Denmark Finland Norway
Sources: Reuters EcoWin and the Riksbank Chart 3:15

Late payments Per cent of outstanding loans
0
5
10
15
20
25
05 06 07 08 09 10 11 12 13 14
Estonia (more than 60 days) Latvia (more than 90 days)
Lithuania (more than 60 days)
Sources: Eesti Pank, Financial and Capital Market Commission and Lietuvos Bankas Chart 3:16

Loan to deposit ratio Per cent
0
50
100
150
200
250
300
350
05 06 07 08 09 10 11 12 13 14
Estonia Latvia Lithuania
Sources: Eesti Pank, Latvijas Banka, Lietuvos Bankas and The Riksbank Chart 3:17

Resident and Non-resident deposits in Latvia LVL Million
Source: Latvijas Banka Chart 3:18

Chapter 4 Developments in the
Swedish banking groups

The major Swedish banks' income and costs, and forecast according to the Riksbank’s main scenario Rolling four quarters, SEK billion
-150
-100
-50
0
50
100
150
200
250
10 11 12 13 14 15
Costs Other income Net commission income Net interest income
Sources: Bank reports and the Riksbank Chart 4:1

Breakdown of interest rates on new mortgages with fixed-interest periods of three months Per cent
0
1
2
3
4
5
6
7
8
08 09 10 11 12 13
Repo rate Funding costs in excess of the reop rate Gross margin
Sources: Bank reports, Reuters EcoWin and the Riksbank Chart 4:2

Return on equity Rolling four quarters, per cent
Sources: SNL Financial and the Riksbank Chart 4:3

Price-to-book ratio Per cent
Sources: SNL Financial and the Riksbank Chart 4:4

The major Swedish banks' return on equity, 2007 and 2012 Per cent
0
2
4
6
8
10
12
14
16
18
ROEDecember 2007
Change fromlower ROA
Change fromlower debt toequity level
ROEDecember 2012
Sources: Bank reports and the Riksbank Chart 4:5

Annual change in the major Swedish banks' lending and forecast according to the Riksbanks' main scenario Per cent
Sources: Bank reports and the Riksbank Chart 4:6

Change in the major Swedish banks' lending volumes between 2009 and 2012 Per cent
-30
-25
-20
-15
-10
-5
0
5
10
15
20
Sweden Other Nordiccountries
The Balticcountries
Other counties Totalt
Sources: Bank reports and the Riksbank Chart 4:7

The major Swedish banks’ loan losses, geographical distribution SEK billion per quarter
-4
-2
0
2
4
6
8
10
12
14
16
08 09 10 11 12 13
Sweden Denmark Other Nordic countries The Baltic countries Othercountries
Sources: Bank reports and the Riksbank Chart 4:8

Distribution of the major Swedish banks' loan losses in the main scenario SEK billion
0
2
4
6
8
10
12
Sweden Norway Denmark Finland Estonia Latvia Lithuania Othercountries
Source: The Riksbank Chart 4:9 Note. Refers to the period 2013-2015.

The lowest Tier 1 capital ratio for one of the major Swedish banks after another major bank has defaulted on payments Per cent
0
1
2
3
4
5
6
7
8
9
00 01 02 03 04 05 06 07 08 09 10 11 12 13
Source: The Riksbank Chart 4:10

Change in core Tier 1 ratio for the major Swedish banks Per cent
Sources: Bank reports and the Riksbank Chart 4:11

The major Swedish banks’ lending and risk weighted assets SEK billion
Sources: Bank reports and the Riksbank Chart 4:12

Core Tier 1 ratio and leverage ratio December 2012, per cent
Sources: Liquidatum, SNL Financial and the Riksbank Chart 4:13

The major Swedish banks’ outstanding issued debt March 2013, SEK billion and percentage of total outstanding debt
26%
3%
23%
22% 25%
0
500
1000
1500
2000
2500
Covered bonds Senior unsecured bonds Certificates
Swedish krona Foreign currency
Sources: Bank reports and the Riksbank Chart 4:14

The major Swedish banks' liquidity buffers SEK billion
Sources: Bank reports and the Riksbank Chart 4:15

The major Swedish banks' liquidity coverage ratio (LCR) March 2013, per cent
0
20
40
60
80
100
120
140
160
Handels-banken
Nordea SEB Swedbank
Sources: Bank reports and the Riksbank Chart 4:16

The Riksbank's structural liquidity measure Per cent
0
20
40
60
80
100
120
Handels-banken
Nordea SEB Swedbank
December 2010 December 2011 December 2012
Sources: Liquidatum and the Riksbank Chart 4:17

Maturity distribution on the major Swedish banks' issued debt Per cent
0
10
20
30
40
50
60
70
80
90
100
07 08 09 10 11 12
0-3 months 3-12 months 1-5 years Over 5 years
Sources: Liquidatum and the Riksbank Chart 4:18

The Riksbank's short-term and structural liquidity measures December 2012
Nordea
SEB
Handelsbanken
Swedbank
0
20
40
60
80
100
120
140
160
180
70 80 90 100 110 120 130 140
Sh
ort
-term
liq
uid
ity m
easu
re (
days)
Structural liquidity measure (per cent)
Sources: Liquidatum and the Riksbank Chart 4:19

The major Swedish banks' liabilities in US dollar December 2012, SEK billion
Issued debt:SEK bn 1,040
Deposit: SEK bn 350
Interbank net and other: SEK bn 220
Under 1 year: SEK bn 860, 83%
Over 1 year: SEK bn 180, 17%
0
200
400
600
800
1000
1200
1400
1600
1800
Liabilities Maturity distribution,issued debt
Sources: Bank reports and the Riksbank Chart B4:1

The major Swedish banks' liquid assets in US dollar December 2012, SEK billion
0
50
100
150
200
250
Handels-banken
Nordea SEB Swedbank
Sources: Bank reports and the Riksbank Chart B4:2

Maturity for the major Swedish banks' issued bank certificates in US dollar December 2012, per cent
Sources: Bank reports and the Riksbank Chart B4:3

The major Swedish banks' illiquid assets in US dollar December 2012, SEK billion
0
50
100
150
200
250
Handels-banken
Nordea SEB Swedbank
Sources: Bank reports and the Riksbank Chart B4:4

Hypothetical balance sheets of banks, pension and insurance companies after a currency swap
Source: The Riksbank Chart B4:5
Investment/lending SEK
Claims/lending In USD in swaps
Securities issued USD
Liabilities/borrowing In SEK in swaps
Assets Liabilities
Balance sheet items
Off-balance sheet items
Investment/holdings Of securities in USD
Claims/lending In SEK in swaps
Liabilities in SEK to policyholders
Liabilities/borrowing in USD in swaps
Balance sheet items
Off-balance sheet items
Ban
ks
Pen
sio
n f
un
ds
an
d
insu
ran
ce c
om
pan
ies

The major Swedish banks' assets and liabilities in US dollar December 2012, SEK billion
Sources: Bank reports and the Riksbank Chart B4:6

Cost for SEK funding Per cent
Sources: Bloomberg and the Riksbank Chart B4:7

Flows in connection with the issue of securities in dollars and currency swaps
Figure B4:1
Bank Investment/ Lending SEK
Investors in USD certificates
Pension/Insurance companies
USD flow today
Future USD flow
SEK flow today
Future SEK flow

Appendix Stress test of the banks’
capital ratios
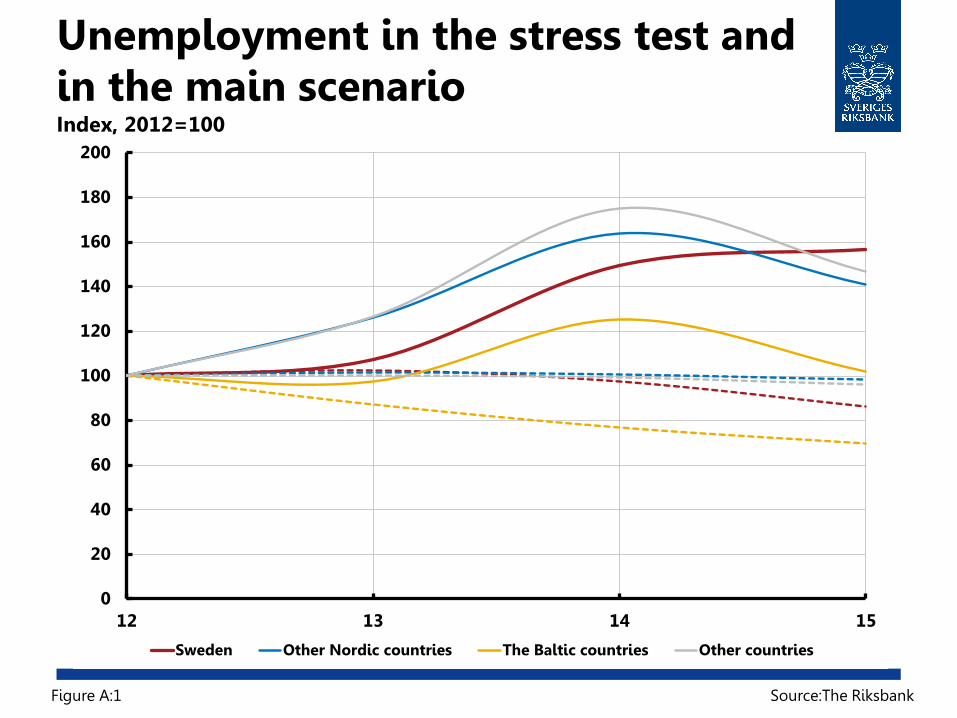
Unemployment in the stress test and in the main scenario Index, 2012=100
0
20
40
60
80
100
120
140
160
180
200
12 13 14 15
Sweden Other Nordic countries The Baltic countries Other countries
Source:The Riksbank Figure A:1
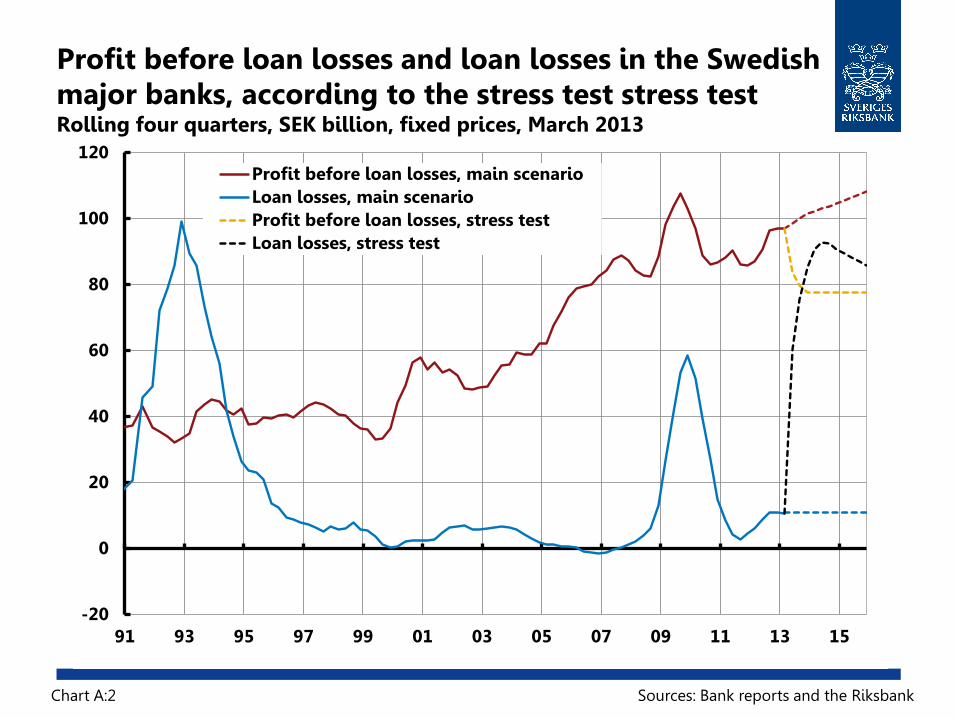
Profit before loan losses and loan losses in the Swedish major banks, according to the stress test stress test Rolling four quarters, SEK billion, fixed prices, March 2013
-20
0
20
40
60
80
100
120
91 93 95 97 99 01 03 05 07 09 11 13 15
Profit before loan losses, main scenario
Loan losses, main scenario
Profit before loan losses, stress test
Loan losses, stress test
Sources: Bank reports and the Riksbank Chart A:2
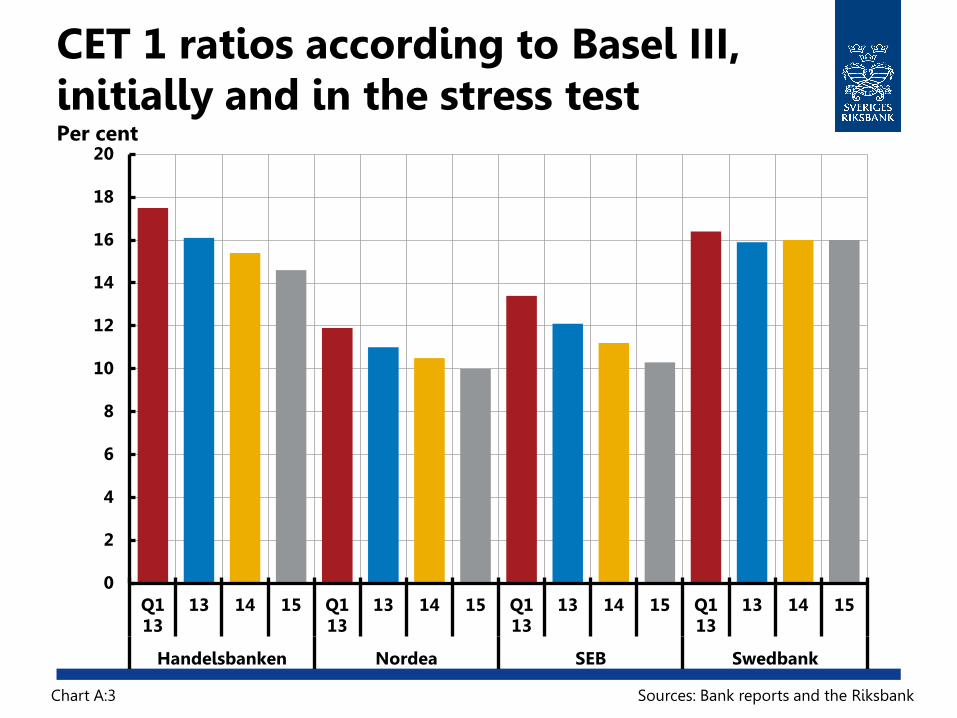
CET 1 ratios according to Basel III, initially and in the stress test Per cent
0
2
4
6
8
10
12
14
16
18
20
Q113
13 14 15 Q113
13 14 15 Q113
13 14 15 Q113
13 14 15
Handelsbanken Nordea SEB Swedbank
Sources: Bank reports and the Riksbank Chart A:3

Changes in the major Swedish banks’ CET 1 ratios in the stress test Per cent
13,8 -8,5
-0,9
+7,4 11,7
0
2
4
6
8
10
12
14
16
CET 1 ratioQ1 2013
Loan losses Change inrisk-weighted assets
Profit before loan losses
CET 1 ratio 2015
Sources: Bank reports and the Riksbank Chart A:4

Weighted mean values for the major Swedish banks’ CET 1 ratios , initially and in the stress test, given different assumptions about a fall in profit before loan losses Per cent
0
2
4
6
8
10
12
14
16
10% 20% 30%
Start 2013 2014 2015
Sources: Bank reports and the Riksbank Chart A:5

The major Swedish banks' loan-loss levels in the stress test Percentage of total lending
-1
0
1
2
3
4
5
6
90 92 94 96 98 00 02 04 06 08 10 12 14
Loan-loss level Stress test
Sources: Bank reports and the Riksbank Chart A:6

The effect of a house price fall of 20 per cent on the banks credit losses Rolling four quarters, SEK billion
-20
0
20
40
60
80
100
120
02 04 06 08 10 12 14 16
Loan losses Stress test Stress test without a fall in house prices
Sources: Bank reports and the Riksbank Chart A:7

The major banks’ loan losses in the stress test with an calculated uncertainty band Rolling four quarters, SEK billion, fixed prices, March 2013
Sources: Bank reports and the Riksbank Chart A:8