THE STUDY OF FACTORS THAT AFFECTING CONSUMER BUYING...
127
THE STUDY OF FACTORS THAT AFFECTING CONSUMER BUYING PREFERENCE TOWARDS TOP THREE LUXURY FASHION BRANDS INCLUDING CHANEL, LOUIS VUITTON AND PRADA IN BANGKOK, THAILAND
Transcript of THE STUDY OF FACTORS THAT AFFECTING CONSUMER BUYING...

THE STUDY OF FACTORS THAT AFFECTING CONSUMER BUYING
PREFERENCE TOWARDS TOP THREE LUXURY FASHION BRANDS
INCLUDING CHANEL, LOUIS VUITTON AND PRADA
IN BANGKOK, THAILAND

THE STUDY OF FACTORS THAT AFFECTING CONSUMER BUYING
PREFERENCE TOWARDS TOP THREE LUXURY FASHION BRANDS
INCLUDING CHANEL, LOUIS VUITTON AND PRADA
IN BANGKOK, THAILAND
Atip Thepsongkroh
This Independent Study Manuscript Presented to
The Graduate School of Bangkok University
in Partial Fulfillment
of the Requirements for the Degree
Master of Business Administration
2017

© 2017
Atip Thepsongkroh
All Rights Reserved�


Thepsongkroh, A. M.B.A., March 2017, Graduate School, Bangkok University.
The Study of Factors that Affecting Consumer Buying Preference towards Top Three
Luxury Fashion Brands Including Chanel, Louis Vuitton and Prada in Bangkok,
Thailand (111 pp.)
Advisor: Sumas Wongsunopparat, Ph.D.
ABSTRACT
Nowadays the world’s changed, Brand name products are increasingly
important for people in the society. As the luxury brand name stores has been
expanded around Bangkok, which it’s approved that people likely to use brand name
products over non-brand products. Luxury goods use to group people in society;
group who belongs and not belongs in the group, using them for an acceptance and
represent the social faces. Question is what are the factors that influence people in
making a decision to buy luxury brand name products. This paper proposes a
framework of factors that affecting consumer brand preference towards top three
luxury fashion brands including Chanel, Louis Vuitton and Prada. This research is
conducted to show the relationship between influential factors and consumer buying
decision.
The research analysis based on 400 questionnaires, which collected since
October 2016 until January 2017. The attendants are random population who
experienced among these three brands and lived in Bangkok, Thailand.

According to the objective of this research, the researcher focuses on the
result of the factors that affecting people to make a buying decision. The result has
been gathered from the questionnaires done by people who know or experienced one
of these three luxury fashion brands by study the relationship between brand equity,
marketing mix (7Ps), social factors, consumer behavior and consumer brand
preferences towards top three fashion luxury brands.
Lastly, marketers, business people, firms, developer, and Thai enterprises can
understand more about consumer buying behavior, and to improve or adjust company
marketing strategies to gain more competitors advantage and fulfill consumer’s need.
Keywords: Brand Preferences, Luxury Products, Brand Name, Chanel, Louis Vuitton,
Prada, Bangkok

vi
ACKNOWLEDGEMENT
To finish this independent study, there are many people involved in the
process as well as motivated the author to make this academic work more fruitful.
First of all, I have to thank you my kindly advisor Dr.Sumas
Wongsunopparat, who has guided and helped me through all the process. I will not be
possible to finish this academic work on my own; I am really grateful and thankful for
all the good experiences and valuable discussion I had.
Thank you my family, friends, and M.B.A Classmates for all the supported.
The motivations and good energies I got from you guys during this time are very
valuable and I very appreciate it. Thank you for being with me through the good and
bad times. Thank you so much.
Lastly, I would like to thank you all of the respondents who spent their
valuable time answering the questionnaire. Without your help this research could not
be completed.
Atip Thepsongkroh

vii
TABLE OF CONTENTS
Page
ABSTRACT……………………………………………………………………………...iv
ACKNOWLEDGEMENT……………………………………………………………….vi
LIST OF TABLES……………………………………………………………………….xii
LIST OF FIGURES……………………………………………………………………..xiii
CHAPTER 1 INTRODUCTION………………………………………………………… 1
1.1 Background…………………………………………………………………..1
1.2 Problem Statement………………………………………………………….. 3
1.3 Aims of the Study……………………………………………………………4
1.4 Research Objectives………………………………………………………….4
1.5 Research Questions…………………………………………………………..5
1.6 Research Scopes…………………………………………………………….. 5
1.6.1 Scope of Content………………………………………………………5
1.6.2 Scope of Demographics, Samples and Location …………………….. 5
1.6.3 Scope of Related Variables……………………………………………6
1.7 Limitations of Research…………………………………………………….. 8
1.8 Assumptions………………………………………………………………….9
1.9 Benefits of Research…………………………………………………………9
CHAPTER 2 LITERATURE REVIEW…………………………………………………10
2.1 Introduction………………………………………………………………... 10
2.2 Luxury Fashion Brand…………………………………………………….. 10
2.2.1 Chanel……………………………………………………………….. 11
2.2.2 Louis Vuitton…………………………………………………………11

viii
TABLE OF CONTENTS (Continued)
Page
CHAPTER 2 LITERATURE REVIEW (Continued)………………………………….. 12
2.2.3 Prada………………………………………………………………….12
2.3 Consumer Preference……………………………………………………….13
2.4 The Theory of Purchasing Behavior………………………………………..13
2.4.1 Problem Recognition…………………………………………………14
2.4.2 Information Search……………………………………………………15
2.4.3 Evaluation Alternatives……………………………………………….15
2.4.4 Purchase Decision…………………………………………………….15
2.4.5 Post–purchase Behavior………………………………………………16
2.5 Maslow’s Hierarchy of Needs………………………………………………16
2.6 Choice Theory………………………………………………………………18
2.7 Brand Choice Theory……………………………………………………… 20
2.8 Brand Equity Theory………………………………………………………. 20
2.8.1 Brand Logo……………………………………………………………21
2.8.2 Brand Awareness……………………………………………………. 22
2.8.3 Brand Association…………………………………………………… 22
2.8.4 Brand Identity……………………………………………………….. 24
2.8.5 Brand Image…………………………………………………………. 24
2.8.6 Brand Loyalty…………………………………………………………25
2.8.7 Perceived Quality……………………………………………………. 25
2.8.8 Value………………………………………………………………… 26
2.9 Marketing Mix Theory (7Ps)……………………………………………… 27

ix
TABLE OF CONTENTS (Continued)
Page
CHAPTER 2 LITERATURE REVIEW (Continued)………………………………….. 28
2.9.1 Product………………………………………………………………..28
2.9.2 Price………………………………………………………………….. 29
2.9.3 Place…………………………………………………………………. 29
2.9.4 Promotion……………………………………………………………. 29
2.9.5 People…………………………………………………………………30
2.9.6 Physical Evidence…………………………………………………….30
2.9.7 Process……………………………………………………………….. 30
2.10 Social Factors…………………………………………………………….. 31
2.10.1 Social Status…………………………………………………………31
2.10.2 Celebrities Influence……………………………………………….. 31
2.10.3 Social Media Influence…………………………………………….. 31
2.11 Utility Theory……………………………………………………………..32
2.12 Research Framework…………………………………………………….. 33
CHAPTER 3 METHODOLOGY……………………………………………………… 37
3.1 Research Strategy…………………………………………………………. 37
3.2 Populations and Samples………………………………………………….. 37
3.3 Variables and Hypothesis…………………………………………………. 38
3.4 Survey Instruments…………………………………………………………40
3.5 Validity and Reliability Assessment………………………………………. 47
3.5.1 Content Validity………………………………………………………47
3.5.2 Reliability……………………………………………………………. 47

x
TABLE OF CONTENTS (Continued)
Page
CHAPTER 3 METHODOLOGY (Continued) ………………………………………… 37
3.6 Data Collection…………………………………………………………….. 49
3.7 Statistic for Data Analysis…………………………………………………. 50
CHAPTER 4 RESEARCH FINDINGS AND DATA ANALYSIS……………………. 52
4.1 The Analysis of Multinomial Logistic Regression Method to Explain
the Significant of Key Independent Variables for Hypothesis Testing
(7 Likert Scale)…………………………………………………………...... 52
4.2 The Analysis of Multinomial Logistic Regression Method to Figure out
Significance of Element Mix of each Independent Variables Including
Brand Equity, Marketing Mix (7Ps), Social Factors, and Consumer
Lifestyle. (5 Likert Scale)…………………………………………………...56
4.2.1 Brand Equity………………………………………………………… 56
4.2.2 Social Factors………………………………………………………... 58
4.2.3 Product………………………………………………………………..59
4.2.4 Price………………………………………………………………….. 61
4.2.5 Place…………………………………………………………………. 62
4.2.6 Promotion……………………………………………………………. 63
4.2.7 People………………………………………………………………... 64
4.2.8 Physical Evidence…………………………………………………… 65
4.2.9 Process………………………………………………………………. 66
4.2.10 Lifestyle……………………………………………………………. 67

xi
TABLE OF CONTENTS (Continued)
Page
CHAPTER 4 RESEARCH FINDINGS AND DATA ANALYSIS (Continued)………. 68
4.3 The analysis of descriptive statistics between consumer brand
selection and demographics to figure out customer profiling of each
brand for segmentation purpose…………………………………………… 68
4.3.1 Gender of Respondents……………………………………………… 69
4.3.2 Age of Respondents…………………………………………………. 70
4.3.3 Marital Status of Respondents………………………………………. 73
4.3.4 Occupation of Respondents…………………………………………..74
4.3.5 Personal Income of Respondents……………………………………. 77
CHAPTER 5 DISCUSSION AND CONCLUSION…………………………………… 80
5.1 Conclusions and Discussion………………………………………………...84
5.2 Managerial Implications…………………………………………………… 88
5.3 Recommendation for Future Research…………………………………….. 89
BIBLIOGRAPHY……………………………………………………………………… 91
APPENDIXES…………………………………………………………………………..99
APPENDIX A Questionnaire………………………………………………….100
APPENDIX B Content Validity……………………………………………….107
BIODATA………………………………………………………………………………111
LICENSE AGREEMENT OF DISSERTATION/THESIS REPORT OF SENIOR
PROJECT

xii
LIST OF TABLES
Page
Table 3.1: Level of Information Measurement and Criteria……………………………. 41
Table 3.2: Level of Information Measurement and Criteria……………………………. 42
Table 3.3: Level of Information Measurement and Criteria……………………………. 45
Table 3.4: Level of Information Measurement and Criteria……………………………. 45
Table 3.5: Reliability Statistics…………………………………………………………. 48
Table 4.1: Hypothesis test: Likelihood Ratio Test……………………………………… 53
Table 4.2: Brand Equity Analysis: Likelihood Ratio Tests……………………………...56
Table 4.3: Social Factors Analysis: Likelihood Ratio Tests……………………………. 58
Table 4.4: Product Analysis: Likelihood Ratio Tests……………………………………59
Table 4.5: Price Analysis: Likelihood Ratio Tests……………………………………... 61
Table 4.6: Place Analysis: Likelihood Ratio Tests…………………………………….. 62
Table 4.7: Promotion Analysis: Likelihood Ratio Tests……………………………….. 63
Table 4.8: People Analysis: Likelihood Ratio Tests…………………………………… 64
Table 4.9: Physical Evidence Analysis: Likelihood Ratio Tests………………………. 65
Table 4.10: Process Analysis: Likelihood Ratio Tests………………………………… 66
Table 4.11: Lifestyle Analysis: Likelihood Ratio Tests……………………………….. 67
Table 4.12: Gender of Respondents: Descriptive Statistics Analysis………………….. 69
Table 4.13: Age of Respondents: Descriptive Statistics Analysis……………………… 70
Table 4.14: Marital Status of Respondents: Descriptive Statistics Analysis…………… 73
Table 4.15: Occupation of Respondents: Descriptive Statistics Analysis……………….74
Table 4.16: Personal Income of Respondents: Descriptive Statistics Analysis………….77

xiii
LIST OF FIGURES
Page
Figure 2.1: Five Stages of Buying Decision Process……………………………………14
Figure 2.2: The Five Stages Model of Maslow’s Hierarchy of Needs………………….17
Figure 2.3: Brand Equity Model……………………………………………………….. 21
Figure 2.4: The Value of Brand Associations………………………………………….. 23
Figure 2.5: The Marketing Mix (7Ps)………………………………………………….. 28
Figure 2.6: Theoretical Framework……………………………………………………. 33
Figure 3.1: Cronbach’s Alpha Formula…………………………………………………48

CHAPTER 1
INTRODUCTION
1.1 Background
Nowadays, with the developing society and the raising of living standard
people’s value has been changed. Social status become one of the determinants that
shape what people are in the society. What you wear represents who you are and who
you want to be. Beside representing who you are and your position, humans like to
think about themselves as special and different from another. Some people think of
themselves not only as special and different but also better than others. As a change
of people’s value, people almost always used “things” to measure and identify
themselves and others (Tunstall, 2013).
Fundamentally, branding is a demonstration of the human condition.
Branding process involved to creating an uniqueness product image in consumer’s
perception, branding also aims to establish what people can expect from the products
and services and used to differentiate product itself from others in the market to
attracts and retains loyal customers (“Digitizing #luxury brands”, 2016). Branding
demonstrates the sense of belonging; it’s separated people who are in the same group
and people who are not belong to. In conclusion, branding and design are contrasted.
The reason people choose to buy a brand name, most likely, because of its design and
the emotional differences they get. For example, the different between a no-name
purse and Louis Vuitton purse, the function of two both purses are the same but how
people feel to the purse is different. According to the market research of Deloitte
over the 2012–2014, the annual growth rate in luxury goods sales was stronger. The

2
total sales of the top 100 largest Luxury goods companies in 2014 are 222 billion
USD, which giving averages sales of 2.2 billion USD per company. The profit
margins of the top 10 companies were higher than in 2013 and the net profit margin
increased by 1.5 percent to 13.2 percent (Arienti, 2016). Bag and accessories sales
growth doubles in 2014 and it’s almost doubling to 9.3 percent, which is the highest
growth rate among all the luxury goods product sectors (Arienti, 2016). LVMH Moët
Hennessy–Louis Vuitton SA accounts over 10 percent of the total luxury goods sales,
and they are ranked on the first place in luxury goods sales revenues, luxury goods
sales growth rate, and net profit margin.
As the long-term economic problems and small population growth rate in
Europe have forced many European luxury brands to expand their business to Asian
(Nueno & Quelch, 1998). Asian people mostly think that the Western luxury brands
are a symbol of good taste and using it to define their identity and social position
(Chadha & Husband, 2006). Southeast Asia including Thailand, Malaysia, Indonesia,
Philippines, and Singapore are the countries that luxury fashion brands should not be
underestimated and todays these countries become a niche market as the rising of
people’s living standard. (Chadha & Husband, 2006) The growth of upper and middle
class has contributed to the increase in consumption rate of luxury fashion brands.
Moreover, Thailand has promoted Bangkok as a regional fashion hub and a city of
luxury goods.
In addition, there are a lot of luxury department stores in Bangkok such as
Siam Paragon, The EM district, Central World, Gaysorn Plaza, The Erawan Boutique
Mall, and more. Those shopping malls are completed with luxurious environment and
facilities. Fashion and shopping become a major role in Thai people lifestyle. This can

3
be proved that Thai people are adapted more on Western culture and changed in social
perception, and economy. Thai people in the present days are more concerning about
their status and got influences by social media. Luxury fashion products are purchase
to representing people’s social face, social position and social status reasons.
Therefore, the topic “The study of factors that affecting consumer buying
preference towards top three luxury fashion brands including Chanel, Louis Vuitton
and Prada in Bangkok, Thailand” is very important and necessary.
1.2 Problem Statement
According to the world todays, people lifestyle has changed from the affects
of globalization and the improvement of living standard. In Bangkok, people are more
influence by western culture that’s why luxury goods become necessary and used to
represent people’s position and status. As Thai government pushed the country to be
a luxurious shopping destination, the luxury goods market in Thailand continues to
grow.
Continuing to the benefit from the government support and the recovered
economic situation, luxury goods markets in Thailand are continue expanding.
Thai consumers are focusing more on fashion business. As new brands entered the
marketplace along with the increasing of competition in the market, it forces
consumer to do their research before making any decision. Consumer seeking and
comparing products and prices, they are searching for the best deal before making any
purchase. Besides the research, Thai consumers are influencing by social media and
become more sophisticated in their requirements among luxury goods (“Luxury goods
in Thailand”, 2016). People can see more products, special products and limited

4
collection via online; those things can draw people’s attention and create a demand in
the marketplace. As the trend, consumer gives more weight to exclusivity,
differentiation and uniqueness in their product selection process.
In order to finding new solutions for Thai enterprises on the luxurious fashion
market the author will conduct dissertation research “The study of factors that
affecting consumer buying preference towards top three luxury fashion brands
including Chanel, Louis Vuitton and Prada in Bangkok, Thailand” to understand
the factors that influence Thai consumers’ preference and their buying behavior.
1.3 Aims of the Study
In this research, the researcher’s purpose is to identify the factors that
influence consumer preference in buying decision towards top three luxury brands
including Chanel, Louis Vuitton and Prada in Bangkok, Thailand. Other reason are
the researcher is interested in the process of branding, marketing mix strategies,
how to remains consumer loyalty and want to understand about consumer–purchasing
decision in Thailand.
1.4 Research Objectives
To study the marketing factors that affecting consumer buying preference
towards top three luxury fashion brands including Chanel, Louis Vuitton
and Prada.
To study the consumer behavior that affecting consumer buying
preference towards top three luxury fashion brands including Chanel,
Louis Vuitton and Prada.

5
1.5 Research Questions
To achieve these objectives, the research questions are as follows:
What factors that influence consumer preference towards top three luxury
fashion brands including Chanel, Louis Vuitton and Prada in Bangkok,
Thailand?
The degree of impact based on factors that influence consumer preference
towards top three luxury fashion brands including Chanel, Louis Vuitton
and Prada in Bangkok, Thailand.
1.6 Research Scopes
This study surveys the factors that influence consumer preference and
consumer purchasing decision towards top three luxury fashion brands in Bangkok,
Thailand including Chanel, Louis Vuitton and Prada. The questionnaires are focusing
on the possible factors such as brand equity, marketing mix (7Ps), social factors,
consumer behavior, and demographics that will be used in this independent study.
1.6.1 Scope of Content
Researcher investigated and examined the relation of the key independent
variables, consumer preferences, and consumer purchasing decision of choosing
luxury goods. This study is a quantitative research based on the factors affecting
consumer preference towards top three luxury brands including Chanel, Louis Vuitton
and Prada in Bangkok, Thailand.
1.6.2 Scope of Demographics, Samples and Location
In this survey, the sample size is 400 respondents. Researcher identifies
population based on random people who experienced luxury goods among three

6
brands including Chanel, Louis Vuitton and Prada and living in Bangkok, Thailand.
1.6.3 Scope of Related Variables
In this study, variables are presented accordingly to proposed hypothesis as
follow:
Dependent Variable
Consumer buying preference towards top three luxury fashion brands in Bangkok,
Thailand
Independent Variables
H1 Brand Equity
H2 Social Factors
H3 Product
H4 Price
H5 Place
H6 Promotion
H7 People
H8 Physical Evidence
H9 Process
H10 Lifestyle
Hypothesis
Hypothesis can be explained as below:
H1o: βBrand Logo, Brand Awareness, Brand Association, Brand Identity,
Brand Image, Brand Loyalty, Perceived Quality, Value = 0

7
H1a: At least one of βBrand Logo, Brand Awareness, Brand Association,
Brand Identity, Brand Image, Brand Loyalty, Perceived Quality, Value ≠
0
H2o: βAdvertisement, Celebrities Influence, Family Social Image, Self-
identity, Social Acceptance, Social Media Influence, Social Status = 0
H2a: At least one of βAdvertisement, Celebrities Influence, Family Social
Image, Self-identity, Social Acceptance, Social Media Influence, Social
Status ≠ 0
H3o: βDesign and Feature, Differentiation, Durability, Exclusivity,
Function, Materials, Quality = 0
H3a: At least one of βDesign and Feature, Differentiation, Durability,
Exclusivity, Function, Materials, Quality ≠ 0
H4o: βRange of Price, Reasonable Price, Resale Value = 0
H4a: At least one of βRange of Price, Reasonable Price, Resale Value ≠ 0
H5o: βLocation, Convenience, Number of Store = 0
H5a: At least one of βLocation, Convenience, Number of Store ≠ 0
H6o: βSale Promotion Offer, Membership Rewards, Special gift = 0
H6a: At least one of βSale Promotion Offer, Membership Rewards,
Special gift ≠ 0
H7o: βService-Minded Employee, Communication, Customer
Relationship, Skill and Creditability = 0
H7a: At least one of βService-Minded Employee, Communication,
Customer Relationship, Skill and Creditability ≠ 0
H8o: βLuxurious Environments, Store Design and Decorations = 0

8
H8a: At least one of βLuxurious Environments, Store Design and
Decorations ≠ 0
H9o: βHi-end Experience, Services, After Services and Warranty, Online
Shopping = 0
H9a: At least one of βHi-end Experience, Services, After Services and
Warranty, Online Shopping ≠ 0
H10o: βLuxury Lifestyle, Hard-working, Materialism, Modernity, Party
Animal, Socialize = 0
H10a: At least one of βLuxury Lifestyle, Hard-working, Materialism,
Modernity, Party Animal, Socialize ≠ 0
This research has been conducted between October 2016–February 2017 and
based in Bangkok, Thailand.
1.7 Limitations of Research
To Study the topic of “The study of factors that affecting consumer buying
preference towards top three luxury fashion brands including Chanel, Louis Vuitton
and Prada in Bangkok, Thailand” researcher has to be understand and focus on the
limitations of independent variables that can positively or negatively affects on
dependent variable. As to keep the research within the specific research structure, this
study will limit by focusing on only top three luxury fashion brands including Chanel,
Louis Vuitton and Prada based in Bangkok, Thailand.
In Bangkok, mostly middle to high-income people knows luxury fashion
brands but not all people experienced in purchasing process, this can cause a problem
in finding respondents of this survey.

9
1.8 Assumptions
The key factors are including Brand Equity, Social Factors, Product, Price,
Place, Promotion, People, Physical Evidence, Process and Lifestyle could affects on
consumer brand decision towards top three luxury fashion brands: Chanel, Louis
Vuitton and Prada in Bangkok, Thailand.
1.9 Benefits of Research
To have a better understanding about consumer buying preference and the
relationship between key factors including Brand Equity, Social Factors,
Product, Price, Place, Promotion, People, Physical Evidence, Process and
Lifestyle towards consumer preference among top three luxury fashion
brands in Bangkok, Thailand.
To provide research information to Thai enterprises or marketers who need
to develop their business in luxury fashion market, to decrease or solve the
problem that may affects the business.
To study and analyze the consumer preference towards three luxury
fashion brands among Chanel, Louis Vuitton and Prada.
The result of the research could be useful for the marketing experts who
interesting in luxurious market and want to understand the Thai’s consumer buying
behavior.

CHAPTER 2
LITERATURE REVIEW
2.1 Introduction
This paper is focusing on the factors that influencing consumer buying
preference towards top three luxury fashion brands. Researcher starts the chapter by
studying on the definition of the word “Luxury”, which is related to the topic of this
research. In luxury fashion brand topic, Chanel, Louis Vuitton and Prada will be
defined along with a study of consumer behavior, marketing mix (7Ps), and brand
equity. Lastly, conceptual framework will be conducted and make a clear overview of
this research.
2.2 Luxury Fashion Brand
The definition of the word “Luxury”, luxury is a state of great comfort or
elegance, especially when involving great expense. In singular luxury means a
pleasure obtained only rarely (Oxford Dictionary). But in reality luxury can mean
many things depend on whose perspective. According to Ashley (Lovell, 2015)
“Luxury is personal. It represents a level of quality that is not accessible to
everybody.” From this quotation, people are able to interpret an amount of spend
based on the premium value in their own perception.
When talking about luxury fashion brand its means to having a back–story,
so people can emphasize where a brand began (Lovell, 2015). The history three
luxury fashion brands are as following:

11
2.2.1 Chanel
The iconic Double C logo brand was started more than a hundred years ago
in the name called Chanel. Chanel knows as one of the world’s most luxury and
classic brand. The fashion designer Coco Chanel was born on August 19th 1883 in
Saumur, France. Chanel becomes known from her timeless design and her little black
dress (“Coco Chanel”, 2016). Besides the apparel, Chanel classic flap bag is one of
the most important accessories in the fashion history. The first Chanel bag designed
in 1929, but like other bags during the era it was hand–carried. Until February 1955,
Coco Chanel debuted the shoulder-carried bag version and it’s changed the world’s
handbag history (Mull, 2016).
There are three Chanel boutiques in Bangkok, which are located in Siam
Paragon, Central Embassy and the latest boutique in The EmQuartier shopping centre.
2.2.2 Louis Vuitton
Louis Vuitton was a French box-maker who established the luxury brand of
the same name over 150 years ago. He started his career as a personal box–maker and
a packer of the Empress of France, Eugenie de Montijo–the wife of Napoleon
Bonaparte in 1852 (“Louis Vuitton”, 2014). This opportunity provided Vuitton to a
class of elite and royal clients. In 1854 Vuitton opened his first shop and four years
later he debuted his trademark trunk. The trunk made of canvas instead of leather,
which is proved to be more durable and water resistance than other products in the
market (Holborow, 2012). Louis Vuitton expanded by offering many product
including bags, clothing, shoes, accessories, jewelry and more. The Louis Vuitton
monogram is one of the most recognizable fashion brand logo in the world. The

12
unique design composed of flowers and the entwined Louis Vuitton initials. Today’s
Louis Vuitton becomes one of the most powerful and valuable brands in the world.
Louis Vuitton business seems to be going well in Bangkok. 28 years after
opened the first store Louis Vuitton launched the Bangkok’s latest store in Siam
Paragon on the 6th July 2012 (Phataranawik, 2012). Like the final, Louis Vuitton
completed Siam Paragon’s the missing piece to becoming a world-class shopping
destination (Jitpleecheep, 2012). The Louis Vuitton stores in Bangkok are located
in Siam Paragon, Gaysorn Plaza and The Emporium shopping center.
2.2.3 Prada
Prada started by Mario Prada in 1913 until now to his granddaughter,
Miuccia Prada (Senft, 2011). Prada first opened boutique in Milan and began selling
shoes, leather handbags, leather accessories, beauty cases, and travelling trunks. After
Prada taken over by Miuccia Prada, the brand become the face of modern and luxury.
The nylon Prada backpack was completely changed the image of Prada from the old-
fashioned brand into a label that was young and vibrant (Greathouse, 2015). For over
a hundred years, Prada still so in-demand in the world of high fashion.
Prada Group has recently opened in Bangkok, Thailand. The Prada store
carries ready–to–wear, bags and accessories collection for both women and men.
There are three Prada boutiques in Bangkok, which are located in Siam Paragon,
Central Embassy and the latest store in the EmQuartier shopping center (“Prada
Japan flourishes”, 2015)

13
2.3 Consumer Preference
Consumer preference is defined as the individual tastes, which measured by
utility. Preference is not about prices or financial; each of individual has a set of
preferences and values based on their background, culture, education and other factors
(Blanchflower & Oswald, 2000). An ability to purchase cannot used to measure
people like or dislike. For example, one can have a preference using Louis Vuitton
over H&M, but in the reality his or her financial means to use only H&M. Preferences
are about consumer satisfaction derives from products or services, which are the main
factors that influence customer demand. Marketers study consumer preference to
understand and perceive the demand for each goods and used to predict the future
marketing strategy.
2.4 The Theory of Purchasing Behavior
There are a multitude of theories on the consumer purchasing behavior that
marketer analyzing them to find how to influence consumers to purchase their
products and services (Penn, 2007). Normally, when people feel a need to purchase
they will go through some steps before making a decision. A different consumer will
go through different buying decision depends on the factors like culture, social and
environment influences. The understanding of consumers buying process is not only
important for salesperson, but may help marketers to align their sales strategy
(Johnson, 2016).
A consumer buying decision-making process uses to describe the journey of
consumer along the way before they purchase any product. In fact, before consumer
makes a purchase they must go through five stages of consumer buying process

including p
purchase de
Th
the diagram
Figure 2.1:
Source: Ril
process
buyer-b
Th
decision an
than focus o
2.4
Pro
In this stage
problem or n
ecision, and
he five stage
m below:
Five Stage
ley, J. (201
s. Retrieve
behaviour-t
his model is
nd this mode
only on a pu
4.1 Problem
oblem or ne
e people wi
need recogn
d post-purch
es framewor
s of Buying
6). Market
d from http
the-decision
important f
el forced ma
urchase dec
m Recogniti
eed recognit
ill identify a
nition, inform
hase behavio
rk use to ev
g Decision P
ting & buyer
://www.tuto
n-making-pr
for markete
arketer to co
cision.
ion
tion is the fi
a need or a p
mation sear
or (Johnston
valuate the c
Process
r behaviour
or2u.net/bu
rocess.
rs or anyon
onsider a w
first stage of
problem, fo
rch, evaluati
n, 2016).
consumer’s
r–the decisi
siness/refer
ne who maki
whole buying
f buying dec
or example,
ion of altern
buying dec
ion–marketi
rence/marke
ing a marke
g process ra
cision proce
“I’m hungr
14
natives,
ision as
ing
eting-
eting
ather
ess.
ry” or

15
“I need a new bag.” The need can be stimulated by internal stimuli and external
stimuli. In this case, advertising can be external stimulus that influences people to
the next steps of buying process (Umar, 2011). The marketers must examine and
recognize the needs of consumer as long as finding the way to satisfy them.
2.4.2 Information Search
The second stage in buying decision process is information search. In this
stage, consumer will search the product information from family, friends,
advertisements, Internet, salesperson or personal experience. Consumer start to find
out what products are in the market and they start to work out which product is the
best to solving their problem or satisfying them (Jiang & Jones, 2014).
The most resource that people using to find information about their problems
and needs is the Internet (“Marketing 101”, 2015). People use the Internet to research,
read and see some reviews.
2.4.3 Evaluation Alternatives
Once the research is done, consumer starts evaluate the option. Consumer
uses that information to find a set of final brand choices. Among selecting the best
alternative, consumers are influences by their own feeling, the seriousness of the
problem, prices, quality and features (“Marketing 101”, 2015).
2.4.4 Purchase Decision
The fourth stage of buying making-decision process is purchase decision. In
this stage, after consumer evaluated the option they will buy the most suitable
product. Consumer changes their money to solve his or her problem. There are two
factors that might influence the people intension and decision. First is attitude of
others and second are unexpected situational factors (Farooq, 2011)

16
2.4.5 Post–purchase Behavior
After the product has bought but the marketer’s job does not finished.
Consumer may satisfy or dissatisfied with the product, so the next is post-purchase
behavior process. Consumer, who is satisfied or dissatisfied, will speak to their
family, friends, and others. Marketer has a duty to satisfy them and turn a one-time
purchase into repeating purchase. According to Townsend’s theory (2015), marketers
can mitigate the problem of dissatisfies consumer by:
Ensuring that consumer purchase the right product that can solving their
needs. Salesperson has to providing the correct information during the
sale.
Providing the top-notch consumer service during the sale.
Offering the after services to support and answer post-sale questions.
Keep staying in touch with a consumer after the sale.
Either the consumer satisfied or dissatisfied, they will respond their positive
or negative feedback about the product and services somehow. This may be through
reviews on website, on social media or word of mouth. Companies should be very
careful to create a positive relationship and a positive communication, in order to
engage customer and retain consumer loyalty (Johnston, 2016).
2.5 Maslow’s Hierarchy of Needs (Maslow, 1943)
Maslow’s Hierarchy of Needs is a motivational theory. Maslow wanted to
understand what factors motivated people. Maslow theory has separated our need
into five basic stages, which once the level was fulfilled the next level up is what

motivates u
below:
Figure 2.2:
Source: Ma
Review
Th
us (McLeod
The Five S
aslow, A.H.
w, 50, 370-3
he five stage
Self–actual
on.
Esteem: inc
on.
Belongingn
Safety: incl
property an
Physiologic
toward hom
d, 2007). Th
Stages Mode
(1943). A
96.
es model can
lization: inc
cluding con
ness: includ
luding secur
nd so on.
cal: includin
meostasis an
he five stage
el of Maslow
A theory of h
n be explain
cluding mor
nfidence, sel
ding love fri
rity of envir
ng air, food
nd so on.
es model can
w’s Hierarc
human moti
n as
rality, proble
lf-esteem, a
endship, int
ronment, em
d, water, sex
n be divided
chy of Need
ivation. Psy
em solving,
achievement
timacy, fam
mployment,
x, sleep, and
d as the figu
ds
ychological
, creativity a
t, respect an
mily and so o
, resources,
d other facto
17
ure
l
and so
nd so
on.
health,
ors

18
Once the basic needs are fulfilled the safety needs show up. Safety needs are
less demanding than physiological needs but when people lose it, they are likely to
feel insecure and unprotected. When people fulfilled by safety the next step is to
having a wider social connections and relationships. Love can help people through
the difficult times (Hoffman, 1999). Maslow felt that there are clear distinction
between love and esteem. As an individual, people wish to be exceptional and
wanted others to be notice about their unique capabilities. Finally the top pier
of Maslow’s Hierarchy is Self-actualization. Maslow stated that people with
self–actualized are people who tend to experience a steadier, grounded sense of
well–being and satisfaction with their life (Maslow, 1943).
2.6 Choice Theory (Glasser, 1998)
According to Dr.William Glasser choice theory, choice theory psychology
is a new explanation of human behavior, it is mentioned that people are motivated
by a never-ending quest to satisfy the five basic needs: to love and belong, to be
powerful, to be free, to have fun, and to survive (Glasser, 1998).
The way to fulfill psychological basic needs can be summarized as follow:
People fulfill the need of love and belong by loving and sharing.
People fulfill the need of power by being recognized and respected.
People fulfill the need of freedom by making choices.
People fulfill the need of fun by playing and laughing.
People fulfill the need of survive by eating, drinking, and so on.
Choice theory shows that people are motivate by what they want at that
moment rather than motivate by rewards and punishment (Sullo, 2011). People have

19
control over the doing component of behavior including acting, thinking, feeling,
and physiology. If the any component has changed the other components will change
as well. A greater control over the doing component behavior, people will get a better
feeling, more pleasant thought, and a greater physical comfort. (Crawford, Boding
& Hoglund, 1993).
The Ten Axioms of “Choice Theory” by Dr.William Glasser:
1) The only person whose behavior we can control is our own.
2) All we can give another person is information.
3) All long–lasting psychological problems are relationship problems.
4) The problem relationship is always part of our present life.
5) What happened in the past has everything to do with what we are today,
but we can only satisfy our basic needs right now and plan to continue satisfying them
in the future.
6) We can only satisfy our needs by satisfying the pictures in our Quality
world.
7) All we do is behave.
8) All behavior is Total Behavior and is made up of four components: acting,
thinking, feeling, and physiology.
9) All Total Behavior is chosen, but we only have direct control over the
acting and thinking components. We can only control our feeling and physiology
indirectly through how we choose to act and think.
10) All Total Behavior is designated by verbs and named by the part that is
the most recognizable.

20
2.7 Brand Choice Theory
The influence factors of consumer brand choice behavior can separated into
two aspects, which is internal factors and external factors. The Internal factors are
such as personality, education level, income level, and the external factors are brand
attributes and network environment factors. The research shows that consumer mostly
tend to choose their preference brand meaning that consumer are set their preference
before doing any purchase and even the purchase is unplanned consumer still
influence by consumer tastes and preferences (Mei–lian, Haibo & Qiong, 2012).
The mainly factor that influence people’s decision is environment factors or
what they are see in everyday (Berger, 2008). The environment influences product
evaluation and choice including product’s title, slogan, advertisement, color, and
more. Marketers always think that if they want to get consumer attention they have to
create a catchy slogan or tons of advertisement, but in reality Berger (2008) suggested
that the best way for company to influence people is to create a link between their
product and something in the environment.
2.8 Brand Equity Theory
In late 1980s, brand equity was become an important idea (Aaker, 2016).
Brand equity identify as the assets and liabilities linked to the brand, in terms of name
and symbols that added the value to the product. Companies create brand equity on
their products by making them memorable, recognizable, high quality, and reliable
(Investopedia).

Figure 2.3:
Source: Aa
brand n
Ac
component
association
in detail ab
image, bran
2.8
A l
uses to gen
service (Inv
hold value
Brand Equ
aker, D. (19
name. Lon
ccording to
ts, which are
and other p
out brand lo
nd loyalty, p
8.1 Brand L
logo is the s
erate aware
vestopedia)
and a comp
uity Model
991). Mana
don: WPP G
David Aake
e brand loya
proprietary
ogo, brand a
perceived qu
Logo
symbol that
eness of the
. Logo is al
pany’s ident
aging brand
Group.
er theory (A
alty, brand a
assets. In th
awareness,
uality, and v
t represents
company’s
so an intang
tity. Logos a
d equity: Cap
Aaker, 1991
awareness,
his research
brand assoc
value towar
a person, c
s association
gible assests
are used in t
pitalizing o
), there are
perceived q
, the author
ciation, bran
rd David Aa
ompany or
n with a par
s of the com
the marketi
n the value
five brand e
quality, bran
r will discus
nd identity,
aker’s mode
organizatio
rticular prod
mpany becau
ing of produ
21
of a
equity
nd
ssed
brand
el.
on. Logo
duct or
use it’s
ucts and

22
services. A well–recognized logo can increase a company’s goodwill. A good logo
should be:
Logo should be simple.
Logo should be distinguished or unique.
Logo should be functional.
Logo should be effective and memorable.
Logo should be a perfect reflection of the organization.
Logo should portray company’s values, mission and objectives.
2.8.2 Brand Awareness
Brand awareness is the level of consumer consciousness to the brand. It is
used to measure consumer ability, how they recognize and associate with the brand.
Marketers create brand awareness in order to promote a product especially when want
to launching new products or services (Investopedia). Brand awareness also use to
differentiate company’s product from other similar products in the market. Company
with a high level of brand awareness will get higher sales compared to the
competitors. According to David Aaker’s brand equity model (Aaker, 1991),
brand awareness can be measured by using the following:
Anchor to which association can be attached.
Familiarity and linking (people with a positive attitude towards a brand
will speak more, and extend the brand awareness to others).
Signal of substance and commitment to the brand.
Brand to be considered during the purchasing process.

2.8
Br
itself from
value into t
brand, the b
Figure 2.4:
Source: Ma
http://w
Ac
brand assoc
8.3 Brand A
and associa
the competi
the brand. If
brand has eq
The Value
athapati, A.
www.slidesh
ccording in
ciation can:
Help consu
Positioning
Provide a r
Association
ation is a gro
ition (Smith
f consumers
quity with c
of Brand A
(2014). Br
hare.net/aka
to the value
umer to rem
g and differ
reason to bu
n
oup of reme
h, 2016). Br
s have a stro
consumers.
Associations
rand associ
ashcm/bran
e of brand a
member the
rentiates the
uy the comp
embered qua
rand associa
ong and pos
s
iations. Ret
d-associatio
association d
uniqueness
e brand from
pany’s prod
alities that d
ation helps c
sitive associ
trieved from
ons-313786
diagram (M
qualities of
m other com
ducts.
differentiate
company to
iation with
m
66.
Mathapati, 20
f the brand.
mpetitors.
23
e brand
o add a
the
014)

24
Create positive attitudes and feelings towards the brand and its product.
Brand extensions, where new products use the livery of the old brand.
2.8.4 Brand Identity
Brand identity is the noticeable elements of brand including colors, logo,
name, design, or symbol that togerther identify and differentiate the brand in the
consumers’ mind (Business Dictionary). Brand identity is also a promise that
organization makes to consumers and it is all what an organization wants the brand to
be considered as. Brand identity leads to brand loyalty, brand preference, high
credibility, good prices, and good financial returns because it helps an organization to
express to the consumer and the target market. Brand identity establishs a connection
between the organization and consumers (“Brand identity”, 2010).
2.8.5 Brand Image
Brand image is a unique set of associations in consumers’ mind that tells
what is a brand stands for and the implied promises the brand makes and it uses to
represent the internal and external charateristics of the brand (Vineeth, 2007). The
perception if brand image is what the mechanisms of advertising, marketing and
public relations that try to influence by molding, managing, creating, supporting and
ultimate manufacturing the brand assets to which consumer relate (Coffin, 2014)
Six ways to create a postitive brand image are (Shane, 2014):
Invest in your own professional branding
Qualify your relationships and connections
Increase your dedicated meeting and conversations
Commit more time to purposeful social media marketing

25
Join and volunteer
2.8.6 Brand Loyalty
Brand loyalty is a kind of consumer behavior, where consumers committed
to the brand and repurchases the same product over the time. This buying decision
process can be conscious or unconscious but it’s always based on the consumer
perception that the brand can fulfill their needs and expectations (Gunelius, 2013).
A brand with powerful loyal consumers equates to a long-term and sustainable
success of the company. Brand needs to maintain the engagement with the consumer
in order to identify their needs and expectations. Once the value identified, brand will
get a higher consumer engagement and higher number of repeat consumers. The more
repurchasing the product the more brand earning higher profits.
2.8.7 Perceived Quality
Perceived quality can defined as the consumer’s opinion about the brand
image, or overall quality of the product. Perceived quality can be view in both terms
of consumer expectation and a comparison between products and it’s competitive
(Somma, 2014).
According to Aaker (1991), perceived quality is intangible and it’s different
in each consumer. Perceived quality depends on different individual personalities,
needs, perception and preference. For the product, Aaker said that consumer would
evaluate based on seven features:
Performance
Features
Conformity with specifications
Reliability

26
Durability
Serviceability
Fit and Finish
In fact, people buy the products only when they believe in the value of what
they will get.
2.8.8 Value
Brand value is referred to brand equity, which is the premium that accrues to
a brand from consumers who are willing to pay (Business Dictionary). Values stand at
the value core of your brand, which are including brand design, message and
consumer relationship. Brand values help company to capture the proposition,
personality and purpose of the brand. To create a brand value, Company should create
deep and meaningful relationships with your consumers, repeat business and raising
the value of the brand. The clear brand value connects consumer with the brand and
made them become brand loyalty (Melymbrose, 2016).
As brand equity is designed to reflect the real value that a brand holds for
its products and services. Measuring brand equity is consider as important because
brands are believed to be strong influencers of critical business outcomes, such as
sales and market share (“Brand equity”, 2016). The seven benefits of brand equity are
(Keller, 2016):
Be perceived differently and produce different interpretations of product
performance
Enjoy greater loyalty and be less vulnerable to competitive marketing
actions

27
Command larger margins and have more inelastic response to price
increases and elastic responses to prices decrease
Receive greater trade cooperation and support
Increase marketing communication effectiveness
Yield licensing opportunities
Support brand extensions
In contrast, marketing researchers seek to measure and understand brand
equity for strategic positioning and planning.
2.9 Marketing Mix Theory (7Ps)
A marketing mix is a combination of marketing activities. To meet the
consumer needs, business must develop the right set of strategies to satisfy them in
terms of the right product, right place, and using right promotion (Vliet, 2013). The
service marketing mix formed of 7P’s that are expanded from the 4P’s of product
marketing mix. Assume that the service marketing mix sees the service as a product,
the 3 further P’s including people, process, and physical evidence (Bhasin, 2016).

Figure 2.5:
Source: Ac
from h
2.9
Pro
of people. P
2015). A su
expectation
following q
The Marke
cutt, M. (20
ttp://market
9.1 Product
oduct is an i
Product can
uccessful pr
n. To develo
questions (T
What does
How will t
Where wil
eting Mix (7
015). The m
tingmix.co.u
t
item that is
n be intangib
roduct shoul
oping the rig
Tracy, 2004)
s the consum
the consum
ll the consum
7Ps)
marketing m
uk.
created to s
ble or tangib
ld answer c
ght product
):
mer want fro
er use it?
mer use it?
ix 4P’s and
satisfy cons
ble refers to
consumer’s w
, company s
om the prod
d 7P’s expla
sumer needs
o service or
want and m
should have
duct and ser
ained. Retri
s in certain g
goods (Acu
meet the con
e to answer
rvice?
28
ieved
group
utt,
nsumer
the

29
What features must the product have to meet the consumer’s need, and
what necessary features are missing?
What is the name of the product, and does it recognizable?
What are the sizes and colors of the product available?
How does the product different from the competitor’s product in the
market?
What does the product looks like?
2.9.2 Price
Price is a very important component of the marketing plan. Price uses to
determine the company’s profit and survival. Price does not necessarily to be the
cheapest in the market but it has to representing the good value for money. According
to Solomon et al (2009), “Price is the amount the consumer must change to receive
the offering.”
2.9.3 Place
Place is where the product or service actually sold. The product can be sold in
many different places such as direct selling, telemarketing, sending catalogs or mail
order, trade shows, or retail establishments. Company must select the right choice,
choose the best location and place the product that is approachable to the potential
buyers.
2.9.4 Promotion
Promotion is including sales organization, public relations, advertising, and
sales promotion. Social media become a communication tools for the company and
these tools should be use to put across the correct the target audiences. Promotion is

30
the way companies used to promotes and sells their products, with small changes in
promotion can lead company to higher sales.
2.9.5 People
People are the most important factor of all service business. The company’s
employees are important in marketing because these people are the ones who face the
consumer and deliver the services. Company should select the right person to the right
position. Therefore, customer service training has become a top priority for many
organizations todays.
2.9.6 Physical Evidence
According to Zeithaml & Bitner (2007) words, “The environment in which
the service is delivered, and where the firm and customer interact, and any tangible
components that facilitate performance or communication of the service”. Physical
evidence representing a brand conception, for example, when you think about fast
food you may think about McDonalds (Acutt, 2015). Physical evidence are including
buildings, equipments, signs and logos, brochures, website, and business cards.
2.9.7 Process
Process is the process of the service delivery. The company has to be ensured
that the same standard of service are repeatedly delivered to the consumers. Company
should remember that services are what the consumer is paying for it.

31
2.10 Social Factors
2.10.1 Social Status
According to the marketing consumer behavior theories research, people may
compromise basic needs to be perceived as someone whom they think they are
belonging to in the society. Social class refers to a group of people with a similar level
of economic, influences, and status. Sociologists use three methods to determine
social class including the objective method, the subjective method, and the reputation
method. The result of the research can define social class in to three segmentations:
lower class, middle or working class, and upper class.
2.10.2 Celebrities Influence
Celebrities are people who appear in the public and enjoy public recognition.
They are people who have attractiveness, extraordinary lifestyle, or special skills
(Anjum, Dhanda & Nagra, 2012). Furthermore, celebrities are appear everywhere in
news, fashion shows, magazines, and advertisement. Marketers using famous person
image to sell their products and services by allow celebrities to displaying the product,
using them, or wearing them. Based on a Newsweek poll, 77% of Americans believe
that celebrities have too much influence on young girls (Radnor, 2010). This kind of
influences brings reliability, trust, association, and aspiration to the brand.
2.10.3 Social Media Influence
Nowadays, social media is everywhere such as Facebook, YouTube, Twitter,
Instagram, Pinterest, and they are getting bigger and becoming important everyday.
People spend a lot of time on the Internet and it’s become people’s second nature and
habits (Bennett, 2013). Social media helps company to communicate and engaged
with their consumers. According to Bughin (2015), European consumers across 30

32
product areas and more than 100 brands in 2013 and 2014 shows that social media
significantly influenced people buying decision, its growing very faster across the
product categories 10 to 15 percent over the estimation.
2.11 Utility Theory
Utility theory is an assumption based upon individual preferences. It used to
explain individual’s behavior on the premise they can consistency rank their choices.
The utility functions are valuable tools to representing individual’s preference. Each
individual has different economics and preferences, so the utility maximization theory
uses the law of diminishing marginal utility to explain how individual allocate their
incomes. The utility maximization model is based on the following assumptions
(Chans, 2015):
Consumers are assumed to be rational. They trying to get the most value
for their money.
Consumers face a budget constraint. They have limited income and
resources.
Consumers have clear preferences for goods and services.
Consumer must choose the goods among with their limited incomes.
Whenever the four assumptions are satisfied, then the individual’s
preferences can represent by a well-behaved utility function. Therefore, if one product
provides more utility than another then consumers will buy more of that product.

2.12 Resea
Af
preference,
Figure 2.6:
Th
(7Ps), socia
of top three
arch Frame
fter author d
the author
Theoretica
his research
al factors, li
e luxury fash
ework
does some m
suggested t
l Framewor
studies the
ifestyle, and
hion brand
model resear
the theoretic
rk
relationship
d demograph
including C
rch based o
cal framewo
p between b
hics toward
Chanel, Lou
n consumer
ork as follow
brand equity
ds consumer
uis Vuitton,
r buying
w:
y, marketing
r buying pre
and Prada i
33
g mix
eference
in

34
Bangkok, Thailand. The questionnaire will be made to be specific and conformity
with conceptual framework.
Dependent variable
Consumer buying preference towards top three luxury fashion brands in
Bangkok, Thailand
Independent variable
H1 Brand Equity
H2 Social Factors
H3 Product
H4 Price
H5 Place
H6 Promotion
H7 People
H8 Physical Evidence
H9 Process
H10 Lifestyle
Hypothesis
According to the previous framework, there are four sets of independent
variables, which are brand equity, social factors, marketing mix (7Ps), and lifestyle.
Dependent variable is consumer’s buying preference and the demographics will be
kept as general information of survey attendants.
Hypothesis can be explained as below:
H1o: βBrand Logo, Brand Awareness, Brand Association, Brand Identity,
Brand Image, Brand Loyalty, Perceived Quality, Value = 0

35
H1a: At least one of βBrand Logo, Brand Awareness, Brand Association,
Brand Identity, Brand Image, Brand Loyalty, Perceived Quality, Value ≠ 0
H2o: βAdvertisement, Celebrities Influence, Family Social Image, Self-
identity, Social Acceptance, Social Media Influence, Social Status = 0
H2a: At least one of βAdvertisement, Celebrities Influence, Family Social
Image, Self-identity, Social Acceptance, Social Media Influence, Social
Status ≠ 0
H3o: βDesign and Feature, Differentiation, Durability, Exclusivity,
Function, Materials, Quality = 0
H3a: At least one of βDesign and Feature, Differentiation, Durability,
Exclusivity, Function, Materials, Quality ≠ 0
H4o: βRange of Price, Reasonable Price, Resale Value = 0
H4a: At least one of βRange of Price, Reasonable Price, Resale Value ≠ 0
H5o: βLocation, Convenience, Number of Store = 0
H5a: At least one of βLocation, Convenience, Number of Store ≠ 0
H6o: βSale Promotion Offer, Membership Rewards, Special gift = 0
H6a: At least one of βSale Promotion Offer, Membership Rewards, Special
gift ≠ 0
H7o: βService-Minded Employee, Communication, Customer
Relationship, Skill and Creditability = 0
H7a: At least one of βService-Minded Employee, Communication,
Customer Relationship, Skill and Creditability ≠ 0
H8o: βLuxurious Environments, Store Design and Decorations = 0

36
H8a: At least one of βLuxurious Environments, Store Design and
Decorations ≠ 0
H9o: βHi-end Experience, Services, After Services and Warranty, Online
Shopping = 0
H9a: At least one of βHi-end Experience, Services, After Services and
Warranty, Online Shopping ≠ 0
H10o: βLuxury Lifestyle, Hard-working, Materialism, Modernity, Party
Animal, Socialize = 0
H10a: At least one of βLuxury Lifestyle, Hard-working, Materialism,
Modernity, Party Animal, Socialize ≠ 0
CHAPTER 3
METHODOLOGY
In this chapter, researcher presents the discussion and the methodology that
be used in a research. It also discusses about research strategy, populations and
samples, variable, survey instruments, research reliability, data collection and statistic
for data analysis.
3.1 Research Strategy
This research is a quantitative research, researcher uses questionnaire as a
tool to collecting a research data. According to quantitative methods definition from
Babbie & Benaquisto (2010), qualitative methods emphasize the statistical,
mathematical, or numerical analysis data through polls, questionnaires, and surveys,
by manipulating data using computational techniques. The main purpose of the study
is to identify and examine the main factor influences consumer buying preference
towards to three luxury fashion brands including Chanel, Louis Vuitton, and Prada in
Bangkok, Thailand.
3.2 Populations and Samples
Populations: Target attendant of this study identified as the people who
experienced these three luxury fashion brands including Chanel, Louis Vuitton and
Prada in Bangkok, Thailand.
Samples: A sample from this study is random people who experienced in
luxury goods among three brands including Chanel, Louis Vuitton and Prada.

38
According to the research bunker, the survey has a margin of error of +5% or lower at
the 95% confidence level (Niles, 2010). So researcher aims to collect 400 samples of
target attendant in Bangkok, which it is the magic number of market research.
Simple size: Simplified formula for proportion (Yamane, 1973)
𝑛 𝑁
𝑁 𝑒
Where (Saxena, 2015):
n = corrected sample size
N = population size
e = Margin of error (e = 0.05 based on the research condition)
3.3 Variables and Hypothesis
In this research, researcher presents variable accordingly to the proposed
variable and hypothesis as below:
Dependent Variable
Consumer buying preference towards top three luxury fashion brands in
Bangkok, Thailand
Independent Variable
H1 Brand Equity
H2 Social Factors
H3 Product
H4 Price

39
H5 Place
H6 Promotion
H7 People
H8 Physical Evidence
H9 Process
H10 Lifestyle
Hypothesis
H1o: βBrand Logo, Brand Awareness, Brand Association, Brand Identity,
Brand Image, Brand Loyalty, Perceived Quality, Value = 0
H1a: At least one of βBrand Logo, Brand Awareness, Brand Association,
Brand Identity, Brand Image, Brand Loyalty, Perceived Quality, Value ≠ 0
H2o: βAdvertisement, Celebrities Influence, Family Social Image, Self-
identity, Social Acceptance, Social Media Influence, Social Status = 0
H2a: At least one of βAdvertisement, Celebrities Influence, Family Social
Image, Self-identity, Social Acceptance, Social Media Influence, Social
Status ≠ 0
H3o: βDesign and Feature, Differentiation, Durability, Exclusivity,
Function, Materials, Quality = 0
H3a: At least one of βDesign and Feature, Differentiation, Durability,
Exclusivity, Function, Materials, Quality ≠ 0
H4o: βRange of Price, Reasonable Price, Resale Value = 0
H4a: At least one of βRange of Price, Reasonable Price, Resale Value ≠ 0
H5o: βLocation, Convenience, Number of Store = 0
H5a: At least one of βLocation, Convenience, Number of Store ≠ 0

40
H6o: βSale Promotion Offer, Membership Rewards, Special gift = 0
H6a: At least one of βSale Promotion Offer, Membership Rewards, Special
gift ≠ 0
H7o: βService-Minded Employee, Communication, Customer
Relationship, Skill and Creditability = 0
H7a: At least one of βService-Minded Employee, Communication,
Customer Relationship, Skill and Creditability ≠ 0
H8o: βLuxurious Environments, Store Design and Decorations = 0
H8a: At least one of βLuxurious Environments, Store Design and
Decorations ≠ 0
H9o: βHi-end Experience, Services, After Services and Warranty, Online
Shopping = 0
H9a: At least one of βHi-end Experience, Services, After Services and
Warranty, Online Shopping ≠ 0
H10o: βLuxury Lifestyle, Hard-working, Materialism, Modernity, Party
Animal, Socialize = 0
H10a: At least one of βLuxury Lifestyle, Hard-working, Materialism,
Modernity, Party Animal, Socialize ≠ 0
3.4 Survey Instruments
The research selected questionnaire as the instrument to collect data to
examine and identify the factors that affecting consumer buying preference towards
top three luxury brands including Chanel, Louis Vuitton, and Prada in Bangkok,

41
Thailand. The question will be short, clear and easy to understand as possible as it can
be. The questionnaire divided into four parts:
Part1: Question asked respondents to select the best brand choice
Please select your most preferred brand?
Table 3.1: Level of Information Measurement and Criteria
Question No. Level Of Measurement Criteria Classification
1 Nominal 1 = Chanel
2 = Louis Vuitton
3 = Prada
Part2: Question asked about the key independent variables for hypothesis testing
that influence consumer-buying preference
Please rate the factors that affect your buying preference in question 1?
2.1 Brand Equity
2.2 Social Factor
2.3 Product
2.4 Price
2.5 Place
2.6 Promotion
2.7 People
2.8 Physical Evidence
2.9 Process

42
2.10 Lifestyle
Table 3.2: Level of Information Measurement and Criteria
Question No. Level Of Measurement Criteria Classification
2.1–2.10 Nominal 0 = no effect
1 = most mild effects
2 = very mild effects
3 = mild effects
4 = neutral effects
5 = strong effects
6 = very strong effects
7 = most strong effects
Part3: Question asked about the element mix of each independent variable that
influence consumer-buying preference
Please rate the factors that affect your buying preference in question 1?
3.1 Brand Equity (8 questions)
Brand logo
Brand awareness
Brand association
Brand identity
Brand image

43
Brand loyalty
Perceived Quality
Value
3.2 Social Factors (7 questions)
Advertisement
Celebrities influence
Family social image
Self-identity
Social acceptance
Social media influence
Social status
3.3 Product (7 questions)
Design and Features
Differentiation
Durability
Exclusivity
Function
Material
Quality
3.4 Price (3 questions)
Range of price
Reasonable price
Resale value

44
3.5 Place (3 questions)
Location
Convenience
Number of store
3.6 Promotion (3 questions)
Sale promotion offer
Membership Rewards
Special gift
3.7 People (4 questions)
Service-minded employee
Communication
Customer relationship
Skill and creditability
3.8 Physical Evidence (2 questions)
Luxurious environment
Store design and decorations
3.9 Process (4 questions)
High-end experience
Services
After services and warranty
Online Shopping
3.10 Lifestyle (6 questions)
Luxury lifestyle

45
Hard–working
Materialism
Modernity
Party animal
Socialize
Table 3.3: Level of Information Measurement and Criteria
Question No. Level Of Measurement Criteria Classification
3.1–3.10 Nominal 1 = disagree
2 = somewhat disagree
3 = neutral
4 = somewhat agree
5 = strongly agree
Part 4: Demographics, the attendants are required to give personal information
as the table below:
Table 3.4: Level of Information Measurement and Criteria
Question No. Variable Level Of Measurement Criteria Classification
4.1 Gender Nominal 1 = Male
2 = Female
(Continued)

46
Table 3.4: Level of Information Measurement and Criteria (Continued)
Question no. Variable Level Of Measurement Criteria Classification
4.2 Age Ordinal 1 = Less than 18
2 = 18–24
3 = 25–34
4 = 35–44
5 = More than 45
4.3 Marital Status Nominal 1 = Single
2 = Married
3 = Others
4.4 Occupation Nominal 1 = Student
2 = Working
3 = Self–employed
4 = Unemployed
5 = Others
4.5 Personal Income Ordinal 1 = Less Than 15000 Baht
2 = 15000–30000 Baht
3 = 30000–40000 Baht
4 = 45000–50000 Baht
5 = More than 60000 Baht

47
3.5 Validity and Reliability Assessment
The questionnaire examines two important aspects. First, validity used to
ensure that the respondents understand the same common meaning of questionnaire.
Second after finished the validity process, respondents can answer based on fact,
feeling, and experience as statistical reliability of the questionnaire.
3.5.1 Content Validity
To prove the consistency of the question, the researcher using Index of Item
Objective Congruence method (IOC) to calculate the consistency between questions
and objective. The consistency index value will be accepted the value at 0.5 or above.
The equation as below:
IOC = ∑𝑅
𝑁
IOC = consistency between the objective and questions.
ΣR = total assessment points given from all qualified experts.
N = number of qualified experts.
After doing the IOC analysis, the question under the value of 0.5 has to be
cut off or adapted. The overall IOC score is 0.828, and one question has been cut off
because the score is lower 0.5.
3.5.2 Reliability
The researcher first collected 30 sets of questionnaire as a pilot test to
examine the reliability of the questionnaire. The reliability test is calculated by using
IBM SPSS Statistic software by using Cronbach’s alpha coefficient.
48
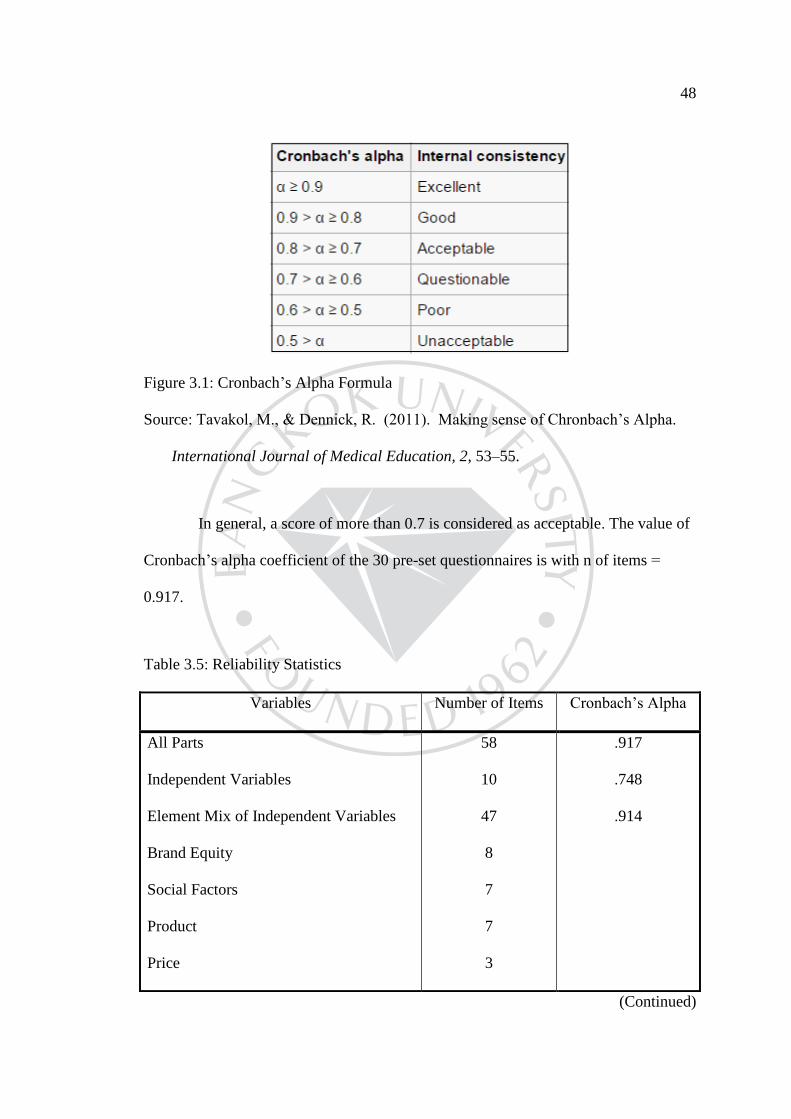
Figure 3.1: Cronbach’s Alpha Formula
Source: Tavakol, M., & Dennick, R. (2011). Making sense of Chronbach’s Alpha.
International Journal of Medical Education, 2, 53–55.
In general, a score of more than 0.7 is considered as acceptable. The value of
Cronbach’s alpha coefficient of the 30 pre-set questionnaires is with n of items =
0.917.
Table 3.5: Reliability Statistics
Variables Number of Items Cronbach’s Alpha
All Parts
Independent Variables
Element Mix of Independent Variables
Brand Equity
Social Factors
Product
Price
58
10
47
8
7
7
3
.917
.748
.914
(Continued)

49
Table 3.5: Reliability Statistics (Continued)
Variables Number of Items Cronbach’s Alpha
Place
Promotion
People
Physical Evidence
Process
Lifestyles
3
3
4
2
4
6
3.6 Data Collection
In this study using two types of data, which can categorize into primary and
secondary data. Primary data is the data that has been collected from questionnaires
and secondary data is the data which researcher has analyze and studied the
information from articles, online articles, journal, and research.
Data collection has been done during October 2016 to January 2017 by
distributing the questionnaires to sample group who experienced these three luxury
fashion brands including Chanel, Louis Vuitton and Prada in Bangkok, Thailand. The
researcher divided the questionnaire in to four parts, which are brand choice selection,
the key independent variables for hypothesis testing, the element mix of each
independent variables and demographics.

50
3.7 Statistic for Data Analysis
Data analysis process for this research conducted on a computer program and
presented on a format of table of content along with the descriptions. The statistic for
data analysis, the researcher uses multinomial logistic regression and descriptive
statistic analysis to analyze all the data. Multinomial logistic regression used to
analyze between consumers’ brand selection, brand equity, social factor, marketing
mix (7Ps), consumer lifestyle, and Descriptive statistic analysis used to analyze
between consumers’ brand selection and demographics.
Why using Multinomial Logistic Regression?
Statistics Solutions stated that like other liner regressions, the multinomial
regression is used to describe data and used to explain the relationship between one
dependent nominal variable and one or more continuous-level independent variables
such as interval, or ratio scale. Multinomial logistic regression is considered as an
extension of binomial logistic regression, which allows a dependent variable given
one or more than two categories (Lund Research, 2013). Logistic regression using
dependent variable to describe the outcome of the stochastic event with a function of
cumulated probabilities ranging from 0 to 1. The statisticians stated that one event
happens if the probability is lower than 0.5 and the opposite event happens when
probability is higher than 0.5.
The multinomial linear regression function can define as below:
𝑙𝑜𝑔𝑖𝑡𝑦 𝑦 (𝑝 𝑦
𝑝 ) 𝛽 𝛽 𝑥𝑖 𝛽 𝑥𝑖𝑛𝑓𝑜𝑟 𝑖 𝑛
𝑙𝑜𝑔𝑖𝑡𝑦 𝑦 (𝑝 𝑦
𝑝 ) 𝛽 𝛽 𝑥𝑖 𝛽 𝑥𝑖𝑛𝑓𝑜𝑟 𝑖 𝑛

51
When using the multinomial logistic regression, part of the process is to
ensure that the data can actually be analyzed. There are six assumptions that are
required for multinomial logistic regression, if the data passes all the assumptions the
result will be validity. The six assumptions are (Lund Research, 2013):
Dependent variable, which should be measured at the nominal level.
One or more independent variables, which should be continuous, ordinal,
or nominal.
Independence of observations and the dependent variable should have
mutually exclusive and exhaustive categories.
No multicollinearity.
A linear relationship between continuous independent variables and the
logit transformation of the dependent variable.
No outliers, high leverage values or highly influential points.
Why using Descriptive Statistic Analysis?
Descriptive statistics used to explain the basic features of the data, which
provide the summaries about the sample and the measured (Trochim, 2006).
Descriptive statistics are useful to describing the scale variables and measures the data
with large scale. The researcher used a cross-tabulation to summarize the relationship
between two categorical variables, which are consumer brand selection and
demographics including gender, age, marital status, occupation and personal income.

CHAPTER 4
RESEARCH FINDINGS AND DATA ANALYSIS
In this chapter, the researcher presents a complete result and analysis of this
study. The result of 400 questionnaires received from surveys and online surveys,
which are conducted by conceptual framework and methodology in the previous
chapter. The result of factors that affecting consumer buying preference towards top
three luxury fashion brands including Chanel, Louis Vuitton and Prada in Bangkok,
Thailand will be separated in to three part:
4.1 The analysis of multinomial logistic regression method to explain the
significant of key independent variables for hypothesis testing (7 Likert scale)
4.2 The analysis of multinomial logistic regression method to figure out
significance of element mix of each independent variables including Brand Equity,
Marketing mix (7Ps), Social factors, and consumer lifestyle. (5 Likert scale)
4.3 The analysis of descriptive statistics between consumer brand selection
and demographics to figure out customer profiling of each brand for segmentation
purpose
4.1 The Analysis of Multinomial Logistic Regression Method to Explain the
Significant of Key Independent Variables for Hypothesis Testing (7 Likert Scale)
In this part, the researcher will apply multinomial logistic regression to
analyze data. As the researcher mentioned before on previous chapter, Multinomial
logistic regression is used to predict a nominal dependent variable with one or more
independent variables.

53
Table 4.1: Hypothesis test: Likelihood Ratio Test
Effect
Model Fitting Criteria Likelihood Ratio Tests
–2 Log Likelihood of Reduced Model Chi–Square df Sig.
Brand Equity 595.406b 28.536 14 .012
Social Factors 581.856b 14.987 14 .379
Product 577.583 10.713 12 .554
Price 579.468b 12.599 14 .558
Place 576.185b 9.315 14 .810
Promotion 598.151b 31.282 14 .005
People 580.762b 13.893 14 .458
Physical Evidence 587.396b 20.527 14 .114
Process 589.707b 22.838 14 .063
Lifestyle 602.394 35.525 14 .001
From table 4.1, there are ten factors analyzed in this part:
Dependent variable:
Consumer buying preference towards top three luxury fashion brands in
Bangkok, Thailand
Independent variable:
H1 Brand Equity
H2 Social Factors
H3 Product
H4 Price
H5 Place

54
H6 Promotion
H7 People
H8 Physical Evidence
H9 Process
H10 Lifestyle
The hypothesis testing results are shown in Table 4.1 as following:
H1a: Brand Equity significantly influences consumer’s buying preference
towards top three luxury fashion brands including Chanel, Louis Vuitton
and Prada in Bangkok, Thailand (0.012 < 0.05).
H2o: Social Factors does not significantly influence consumer’s buying
preference towards top three luxury fashion brands including Chanel,
Louis Vuitton and Prada in Bangkok, Thailand (0.379 > 0.05).
H3o: Product does not significantly influence consumer’s buying
preference towards top three luxury fashion brands including Chanel,
Louis Vuitton, and Prada in Bangkok, Thailand (0.554 > 0.05).
H4o: Price does not significantly influence consumer’s buying preference
towards top three luxury fashion brands including Chanel, Louis Vuitton
and Prada in Bangkok, Thailand (0.558 > 0.05).
H5o: Place does not significantly influence consumer’s buying preference
towards top three luxury fashion brands including Chanel, Louis Vuitton
and Prada in Bangkok, Thailand (0.810 > 0.05).

55
H6a: Promotion significantly influences consumer’s buying preference
towards top three luxury fashion brands including Chanel, Louis Vuitton
and Prada in Bangkok, Thailand (0.005 < 0.05).
H7o: People does not significantly influence consumer’s buying preference
towards top three luxury fashion brands including Chanel, Louis Vuitton
and Prada in Bangkok, Thailand (0.458 > 0.05).
H8o: Physical Evidence does not significantly influence consumer’s
buying preference towards top three luxury fashion brands including
Chanel, Louis Vuitton and Prada in Bangkok, Thailand (0.114 > 0.05).
H9o: Process does not significantly influence consumer’s buying
preference towards top three luxury fashion brands including Chanel,
Louis Vuitton and Prada in Bangkok, Thailand (0.063 > 0.05).
H10a: Lifestyle significantly influences consumer’s buying preference
towards top three luxury fashion brands including Chanel, Louis Vuitton
and Prada in Bangkok, Thailand (0.001 < 0.05).
The SPSS output of multinomial logistic regression shows that p-values of
brand equity, promotion, and lifestyle are less than .05. Therefore, we can reject H0
that brand equity, promotion, and lifestyle do not influence luxurious brand choice
selection and accept Ha that all these variables significantly influence luxurious brand
choice selection.

56
4.2 The Analysis of Multinomial Logistic Regression Method to Figure out
Significance of Element Mix of each Independent Variables Including Brand
Equity, Marketing Mix (7Ps), Social Factors, and Consumer Lifestyle. (5 Likert
Scale)
In this part, the researcher will apply multinomial logistic regression to
analyze the data. Multinomial logistic regression is used to predict a nominal
dependent variable with one or more independent variables. In this part, researcher
analyzes data between consumers’ brand selection, brand equity, social factors,
product, price, place, promotion, people, psychical evidence, process and lifestyle.
4.2.1 Brand Equity
Table 4.2: Brand Equity Analysis: Likelihood Ratio Tests
Effect
Model Fitting Criteria Likelihood Ratio Tests
–2 Log Likelihood of Reduced Model Chi–Square df Sig.
Brand Logo 2690.840b 2588.056 8 .000
Brand Awareness 128.734c 25.950 6 .000
Brand Association 222.022b 119.238 6 .000
Brand Identity 258.324d 155.540 6 .000
Brand Image 29053.314b 28950.530 6 .000
Brand Loyalty 434.396d 331.612 8 .000
Perceived Quality 593.979b 491.195 6 .000
Value 162.960b 60.176 6 .000

57
According to Brand Equity results: we can reject H0 that brand logo, brand
awareness, brand association, brand identity, brand image, brand loyalty, perceived
quality and value do not influence luxurious brand choice selection and accept Ha
that all these variables significantly influence brand choice selection.
H1.1a: Brand Logo significantly influences luxurious brand choice
selection in Bangkok, Thailand (0.000 < 0.05).
H1.2a: Brand Awareness significantly influences luxurious brand choice
selection in Bangkok, Thailand (0.000 < 0.05).
H1.3a: Brand Association significantly influences luxurious brand choice
selection in Bangkok, Thailand (0.000 < 0.05).
H1.4a: Brand Identity significantly influences luxurious brand choice
selection in Bangkok, Thailand (0.000 < 0.05).
H1.5a: Brand Image significantly influences luxurious brand choice
selection in Bangkok, Thailand (0.000 < 0.05).
H1.6a: Brand Loyalty significantly influences luxurious brand choice
selection in Bangkok, Thailand (0.000 < 0.05).
H1.7a: Perceived Quality significantly luxurious consumer’s brand choice
selection in Bangkok, Thailand (0.000 < 0.05).
H1.8a: Value significantly influences luxurious brand choice selection in
Bangkok, Thailand (0.000 < 0.05).

58
4.2.2 Social Factors
Table 4.3: Social Factors Analysis: Likelihood Ratio Tests
Effect
Model Fitting Criteria Likelihood Ratio Tests
–2 Log Likelihood of Reduced Model Chi–Square df Sig.
Advertisement 127.525b 24.741 8 .002
Celebrities Influence 152.967b 50.183 8 .000
Family Social Image 137.330b 34.546 8 .000
Self–Identity 1630.741b 1527.957 8 .000
Social Acceptance 1162.586b 1059.802 8 .000
Social Media Influence 1818.499b 1715.715 8 .000
Social Status 42051.652b 41948.868 8 .000
According to Social Factors results: we can reject H0 that Advertisement,
Celebrities Influence, Self-Identity, Social Acceptance, Social Media Influence, and
Social Status do not influence luxurious brand choice selection and accept Ha that all
these variables significantly influence brand choice selection.
H2.1a: Advertisement significantly influences luxurious brand choice
selection in Bangkok, Thailand (0.002 < 0.05).
H2.2a: Celebrities Influence significantly influences luxurious brand
choice selection in Bangkok, Thailand (0.000 < 0.05).
H2.3a: Self-Identity significantly influences luxurious brand choice
selection in Bangkok, Thailand (0.000 < 0.05).

59
H2.4a: Social Acceptance significantly influences luxurious brand choice
selection in Bangkok, Thailand (0.000 < 0.05).
H2.5a: Social Media Influence significantly influences luxurious brand
choice selection in Bangkok, Thailand (0.000 < 0.05).
H2.6a: Social Status significantly influences luxurious brand choice
selection in Bangkok, Thailand (0.000 < 0.05).
4.2.3 Product
Table 4.4: Product Analysis: Likelihood Ratio Tests
Effect
Model Fitting Criteria Likelihood Ratio Tests
–2 Log Likelihood of Reduced Model Chi–Square df Sig.
Design and Feature 415.718b 312.934 6 .000
Differentiation 121.275c 18.491 8 .018
Durability 115.230c 12.446 8 .132
Exclusivity 17027.727b 16924.944 6 .000
Function 610274.214b 610171.430 8 .000
Material 143.607b 40.823 8 .000
Quality 479.721b 376.937 6 .000
According to Product results: we can reject H0 that Design and Feature,
Differentiation, Durability, Exclusivity, Function, Material, and Quality do not
influence luxurious brand choice selection and accept Ha that all these variables

60
significantly influence brand choice selection.
H3.1a: Design and Feature significantly influences luxurious brand choice
selection in Bangkok, Thailand (0.000 < 0.05).
H3.2a: Differentiation significantly influences luxurious brand choice
selection in Bangkok, Thailand (0.018 < 0.05).
H3.3o: Durability does not significantly influence luxurious brand choice
selection in Bangkok, Thailand (0.132 > 0.05).
H3.4a: Exclusivity significantly influences luxurious brand choice
selection in Bangkok, Thailand (0.000 < 0.05).
H3.5a: Function significantly influences luxurious brand choice selection
in Bangkok, Thailand (0.000 < 0.05).
H3.6a: Material significantly influences luxurious brand choice selection in
Bangkok, Thailand (0.000 < 0.05).
H3.7a: Quality significantly influences luxurious brand choice selection in
Bangkok, Thailand (0.000 < 0.05).

61
4.2.4 Price
Table 4.5: Price Analysis: Likelihood Ratio Tests
Effect
Model Fitting Criteria Likelihood Ratio Tests
–2 Log Likelihood of Reduced Model Chi–Square df Sig.
Range of Price 126.212b 23.429 8 .003
Reasonable Price 157.834b 55.050 8 .000
Resale Value 437490.353b 437387.569 8 .000
According to Price results, we can reject H0 that Range of Price, Reasonable
Price, and Resale Value do not influence luxurious brand choice selection and accept
Ha that all these variables significantly influence brand choice selection.
H4.1a: Range of Price significantly influences luxurious brand choice
selection in Bangkok, Thailand (0.003 < 0.05).
H4.2a: Reasonable Price significantly influences luxurious brand choice
selection in Bangkok, Thailand (0.000 < 0.05).
H4.3a: Resale Value significantly influences luxurious brand choice
selection in Bangkok, Thailand (0.000 < 0.05).

62
4.2.5 Place
Table 4.6: Place Analysis: Likelihood Ratio Tests
Effect
Model Fitting Criteria Likelihood Ratio Tests
–2 Log Likelihood of Reduced Model Chi–Square df Sig.
Location 118.403c 15.619 8 .048
Convenience 109.025c 6.242 8 .620
Number of Store 280.879d 178.096 8 .000
According to Place results: we can reject H0 that Location and Number of
Store do not influence luxurious brand choice selection and accept Ha that all these
variables significantly influence brand choice selection. However we cannot reject H0
that Convenience does not influence luxurious brand choice selection. Thus for place,
only Location and Number of Stores are being used in consumer’s luxurious brand
choice decision.
H5.1a: Location significantly influences luxurious brand choice selection
in Bangkok, Thailand (0.048 < 0.05).
H5.2o: Convenience does not significantly influence luxurious brand
choice selection in Bangkok, Thailand (0.620 > 0.05).
H5.3a: Number of Store significantly influences luxurious brand choice
selection in Bangkok, Thailand (0.000 < 0.05).

63
4.2.6 Promotion
Table 4.7: Promotion Analysis: Likelihood Ratio Tests
Effect
Model Fitting Criteria Likelihood Ratio Tests
–2 Log Likelihood of Reduced Model Chi–Square df Sig.
Sale Promotion Offer 3009.817b 2907.033 8 .000
Membership Rewards 7861.377b 7758.593 8 .000
Special Gifts 145.317b 42.533 8 .000
According to Promotion results: we can reject H0 that Sale Promotion Offer,
Membership Rewards, and Special Gifts do not influence luxurious brand choice
selection and accept Ha that all these variables significantly influence brand choice
selection.
H6.1a: Sale Promotion Offer significantly influences luxurious brand
choice selection in Bangkok, Thailand (0.000 < 0.05).
H6.2a: Membership Rewards significantly influences luxurious brand
choice selection in Bangkok, Thailand (0.000 < 0.05).
H6.3a: Special Gifts significantly influences luxurious brand choice
selection in Bangkok, Thailand (0.000 < 0.05).
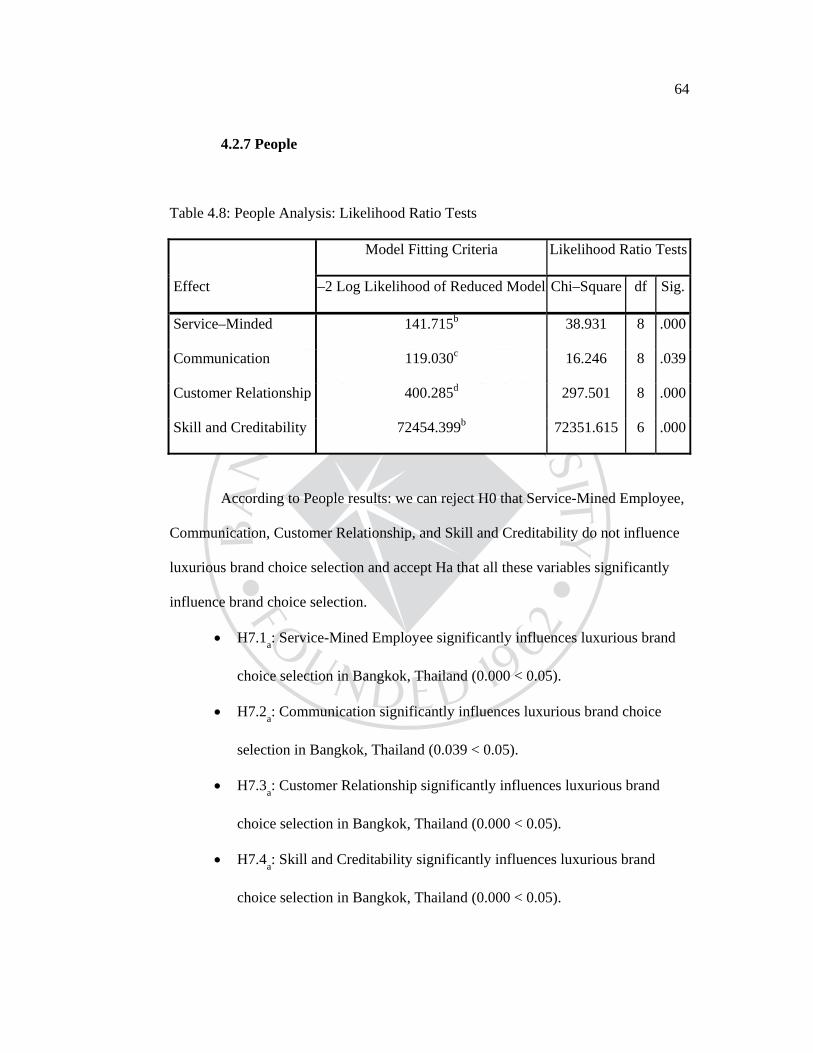
64
4.2.7 People
Table 4.8: People Analysis: Likelihood Ratio Tests
Effect
Model Fitting Criteria Likelihood Ratio Tests
–2 Log Likelihood of Reduced Model Chi–Square df Sig.
Service–Minded 141.715b 38.931 8 .000
Communication 119.030c 16.246 8 .039
Customer Relationship 400.285d 297.501 8 .000
Skill and Creditability 72454.399b 72351.615 6 .000
According to People results: we can reject H0 that Service-Mined Employee,
Communication, Customer Relationship, and Skill and Creditability do not influence
luxurious brand choice selection and accept Ha that all these variables significantly
influence brand choice selection.
H7.1a: Service-Mined Employee significantly influences luxurious brand
choice selection in Bangkok, Thailand (0.000 < 0.05).
H7.2a: Communication significantly influences luxurious brand choice
selection in Bangkok, Thailand (0.039 < 0.05).
H7.3a: Customer Relationship significantly influences luxurious brand
choice selection in Bangkok, Thailand (0.000 < 0.05).
H7.4a: Skill and Creditability significantly influences luxurious brand
choice selection in Bangkok, Thailand (0.000 < 0.05).

65
4.2.8 Physical Evidence
Table 4.9: Physical Evidence Analysis: Likelihood Ratio Tests
Effect
Model Fitting Criteria Likelihood Ratio Tests
–2 Log Likelihood of Reduced Model Chi–Square df Sig.
Luxurious
Environment 111.646c 8.863 6 .181
Store Design and
Decorations 206.924d 104.140 6 .000
According to Physical Evidence results: we can reject H0 that Luxurious
Environment, and Store Design and Decorations do not influence luxurious brand
choice selection and accept Ha that all these variables significantly influence brand
choice selection. The results are:
H8.1o: Luxurious Environment does not significantly influence luxurious
brand choice selection in Bangkok, Thailand (0.181 > 0.05).
H8.2a: Store Design and Decorations significantly influences luxurious
brand choice selection in Bangkok, Thailand (0.000 < 0.05).

66
4.2.9 Process
Table 4.10: Process Analysis: Likelihood Ratio Tests
Effect
Model Fitting Criteria Likelihood Ratio Tests
–2 Log Likelihood of Reduced Model Chi–Square df Sig.
High–end Experience 121.375c 18.591 6 .005
Services 118.017b 15.233 8 .055
After Services and
Warranty 174.596d 71.812 6 .000
Online Shopping 165.478d 62.694 8 0.00
According to Process results: we can reject H0 that Services, After Services
and Warranty, and Online Shopping do not influence luxurious brand choice selection
and accept Ha that all these variables significantly influence brand choice selection.
H9.1a: High–end Experience significantly influences luxurious brand
choice selection in Bangkok, Thailand (0.005 < 0.05).
H9.2o: Services does not significantly influence luxurious brand choice
selection in Bangkok, Thailand (0.055 > 0.05).
H9.3a: After Services and Warranty significantly influences luxurious
brand choice selection in Bangkok, Thailand (0.000 < 0.05).
H9.4a: Online Shopping significantly influences luxurious brand choice
selection in Bangkok, Thailand (0.000 < 0.05).

67
4.2.10 Lifestyle
Table 4.11: Lifestyle Analysis: Likelihood Ratio Tests
Effect
Model Fitting Criteria Likelihood Ratio Tests
–2 Log Likelihood of Reduced Model Chi–Square df Sig.
Luxury Lifestyle
Hard–Working
Materialism
Modernity
Party Animal
239.253b
3582.170b
287.142d
136.470
3479.387
184.359
3.808
8295.521
34.039
8
8
8
.000
.000
.000
.874 106.592c 8
8398.305b 8 .000
Socialize 136.823b 8 .000
According to Lifestyle results: we can reject H0 that Luxury Lifestyle,
Hard–Working, Materialism, Party Animal, and Socialize do not influence luxurious
brand choice selection and accept Ha that all these variables significantly influence
brand choice selection. However we cannot reject H0 that Modernity does not
influence luxurious brand choice selection. Thus for place, only Luxury Lifestyle,
Hard–Working, Materialism, Party Animal, and Socialize are being used in
consumer’s luxurious brand choice decision.
H10.1a: Luxury Lifestyle significantly influences luxurious brand choice
selection in Bangkok, Thailand (0.000 < 0.05).
H10.2a: Hard–Working significantly influences luxurious brand choice
selection in Bangkok, Thailand (0.000 < 0.05).

68
H10.3a: Materialism significantly influences luxurious brand choice
selection in Bangkok, Thailand (0.000 < 0.05).
H10.4o: Modernity does not significantly influence luxurious brand choice
selection in Bangkok, Thailand (0.874 > 0.05).
H10.5a: Party Animal significantly influences luxurious brand choice
selection in Bangkok, Thailand (0.000 < 0.05).
H10.6a: Socialize significantly influences luxurious brand choice selection
in Bangkok, Thailand (0.015 < 0.05).
4.3 The analysis of descriptive statistics between consumer brand selection and
demographics to figure out customer profiling of each brand for segmentation
purpose
In this part, the researcher will apply descriptive statistic analysis to analyze
data. The descriptive statistics analysis used to analyze a relationship between
consumers’ brand selection and demographics including gender, age, marital status,
occupation and personal income.

69
4.3.1 Gender of Respondents
Table 4.12: Gender of Respondents: Descriptive Statistics Analysis
Gender
Preferred Brand
Total Chanel Louis Vuitton Prada
Male Count 87 69 20 176
% within Gender 49.4% 39.2% 11.4% 100%
% within Preferred Brand 41.0% 56.1% 30.8% 44.0%
% of Total 21.8% 17.3% 5.0% 44.0%
Female Count 125 54 45 224
% within Gender 55.8% 24.1% 20.1% 100%
% within Preferred Brand 59.0% 43.9% 69.2% 56.0%
% of Total 31.3% 13.5% 11.3% 56.0%
Total Count 212 123 65 400
% within Gender 53.0% 30.8% 16.3% 100%
% within Preferred Brand 100% 100% 100% 100%
% of Total 53.0% 30.8% 16.3% 100%
According to the result of 400 respondents:
212 respondents (53%) selected Chanel, which can separate into 87 male
and 125 female.
123 respondents (30.8%) selected Louis Vuitton, which can separate into
69 male and 54 female.

70
65 respondents (16.3%) selected Prada, which can separate into 20 male
and 45 female.
The most consumers’ preferred brand based on this research is Chanel and
the brand that male selected over female is Louis Vuitton, which is 69 male (39.2%)
and 54 female (24.1%).
4.3.2 Age of Respondents
Table 4.13: Age of Respondents: Descriptive Statistics Analysis
Age
Preferred Brand
Total Chanel Louis Vuitton Prada
Under 18 Count 4 3 0 7
% within Age 57.1% 42.9% 0.0% 100%
% within Preferred Brand 1.9% 2.4% 0.0% 1.8%
% of Total 1.0% 0.8% 0.0% 1.8%
18–24 Count 53 29 11 93
% within Age 57.0% 31.2% 11.8% 100%
% within Preferred Brand 25.0% 23.6% 16.9% 23.3%
% of Total 13.3% 7.3% 2.8% 23.3%
(Continued)

71
Table 4.13 (Continued): Age of Respondents: Descriptive Statistics Analysis
Age
Preferred Brand
Total Chanel Louis Vuitton Prada
25–34 Count 119 72 37 228
% within Age 52.2% 31.6% 16.2% 100%
% within Preferred Brand 56.1% 58.5% 56.9% 57.0%
% of Total 29.8% 18.0% 9.3% 57.0%
35–44 Count 29 17 11 57
% within Age 50.9% 29.8% 19.3% 100%
% within Preferred Brand 13.7% 13.8% 16.9% 14.3%
% of Total 7.3% 4.3% 2.8% 14.3%
Over 45 Count 7 2 6 15
% within Age 46.7% 13.3% 40.0% 100%
% within Preferred Brand 3.3% 1.6% 9.2% 3.8%
% of Total 1.8% 0.5% 1.5% 3.8%
Total Count 212 123 65 400
% within Age 53.0% 30.8% 16.3% 100%
% within Preferred Brand 100% 100% 100% 100%
% of Total 53.0% 30.8% 16.3% 100%

72
According to the result of 400 respondents:
7 respondents (1.8%) aged under than 18 year olds: 4 respondents selected
Chanel, 3 respondents selected Louis Vuitton and none of them selected
Prada.
93 respondents (23.3%) aged between18–24 year olds: 53 respondents
selected Chanel, 29 respondents selected Louis Vuitton, and 11
respondents selected Prada.
228 respondents (57.0%) aged between 25–34 year olds: 119 respondents
selected Chanel, 72 respondents selected Louis Vuitton, and 37
respondents selected Prada.
57 respondents (14.3%) aged between 35–44 year olds: 29 respondents
selected Chanel, 17 respondents selected Louis Vuitton, and 11
respondents selected Prada.
15 respondents (3.8%) aged over than 45 years old: 7 respondents selected
Chanel, 2 respondents selected Louis Vuitton, and 6 respondents selected
Prada.
Chanel has the highest percentage of consumer’s brand selection all over the
aged, which mostly over 50% except aged over than 45 years old that has only 46.7%.
42.9% of respondents aged under than 18 years old selected and 31.6% of aged
between 25–34 year olds selected Louis Vuitton. The highest percentage of consumer
who preferred Prada is respondents who aged over than 45 year olds (40%), which are
6 respondents from 15 respondents.

73
4.3.3 Marital Status of Respondents
Table 4.14: Marital Status of Respondents: Descriptive Statistics Analysis
Marital Status
Preferred Brand
Total Chanel Louis Vuitton Prada
Single Count 164 96 40 300
% within Marital Status 54.7% 32.0% 13.3% 100%
% within Preferred Brand 77.4% 78.0% 61.5% 75.0%
% of Total 41.0% 24.0% 10.0% 75.0%
Married Count 42 23 24 89
% within Marital Status 47.2% 25.8% 27.0% 100%
% within Preferred Brand 19.8% 18.7% 36.9% 22.3%
% of Total 10.5% 5.8% 6.0% 22.3%
Other Count 6 4 1 11
% within Marital Status 54.5% 36.4% 9.1% 100%
% within Preferred Brand 2.8% 3.3% 1.5% 2.8%
% of Total 1.5% 1.0% 0.3% 2.8%
Total Count 212 123 65 400
% within Marital Status 53.0% 30.8% 16.3% 100%
% within Preferred Brand 100% 100% 100% 100%
% of Total 53.0% 30.8% 16.3% 100%

74
According to the result of 400 respondents:
300 respondents (75%) are single: 164 respondents selected Chanel, 96
respondents selected Louis Vuitton, and 40 respondents selected Prada.
89 respondents (22.3%) are married: 42 respondents selected Chanel, 23
respondents selected Louis Vuitton, and 24 respondents selected Prada.
11 respondents (2.8%) have other status: 6 respondents selected Chanel,
4 respondents selected Louis Vuitton, and 1 respondent selected Prada.
Chanel has the highest scores in every marital status.
4.3.4 Occupation of Respondents
Table 4.15: Occupation of Respondents: Descriptive Statistics Analysis
Occupation
Preferred Brand
TotalChanel Louis Vuitton Prada
Student Count 37 30 10 77
% within Occupation 48.1% 39.0% 13.0% 100%
% within Preferred Brand 17.5% 24.4% 15.4% 19.3%
% of Total 9.3% 7.5% 2.5% 19.3%
Working Count 107 54 25 186
% within Occupation 57.5% 29.0% 13.4% 100%
% within Preferred Brand 50.5% 43.9% 38.5% 46.5%
% of Total 26.8% 13.5% 6.3% 46.5%
(Continued)

75
Table 4.15 (Continued): Occupation of Respondents: Descriptive Statistics Analysis
Occupation
Preferred Brand
TotalChanel Louis Vuitton Prada
Self–employed Count 44 28 24 96
% within Occupation 45.8% 29.2% 25.0% 100%
% within Preferred Brand 20.8% 22.8% 36.9% 24.0%
% of Total 11.0% 7.0% 6.0% 24.0%
Unemployed Count 7 2 1 10
% within Occupation 70.0% 20.0% 10.0% 100%
% within Preferred Brand 3.3% 1.6% 1.5% 2.5%
% of Total 1.8% 0.5% 0.3% 2.5%
Others Count 17 9 5 31
% within Occupation 54.8% 29.0% 16.1% 100%
% within Preferred Brand 8.0% 7.3% 7.7% 7.8%
% of Total 4.3% 2.3% 1.3% 7.8%
Total Count 212 123 65 400
% within Occupation 53.0% 30.8% 16.3% 100%
% within Preferred Brand 100% 100% 100% 100%
% of Total 53.0% 30.8% 16.3% 100%

76
According to the result of 400 respondents:
77 respondents (19.3%) are student: 37 respondents selected Chanel,
30 respondents selected Louis Vuitton, and 10 respondents selected Prada.
186 respondents (46.5%) are working: 107 respondents selected Chanel,
54 respondents selected Louis Vuitton, and 25 respondents selected Prada.
96 respondents (24%) are self-employed: 44 respondents selected Chanel,
28 respondents selected Louis Vuitton, and 24 respondents selected Prada,
10 respondents (2.5%) are unemployed: 7 respondents selected Chanel,
2 respondents selected Louis Vuitton, and 1 respondent selected Prada.
31 respondents (7.8%) have other occupation: 17 respondents selected
Chanel, 9 respondents selected Louis Vuitton, and 5 respondents selected
Prada.
57.5% or 107 respondents who working preferred Chanel, while 30
respondents or 39% of students selected Louis Vuitton.

77
4.3.5 Personal Income of Respondents
Table 4.16: Personal Income of Respondents: Descriptive Statistics Analysis
Personal Income
Preferred Brand
TotalChanel Louis Vuitton Prada
Under 15000
Baht
Count 27 14 6 47
% within Personal Income 57.4% 29.8% 12.8% 100%
% within Preferred Brand 12.7% 11.4% 9.2% 11.8%
% of Total 6.8% 3.5% 1.5% 11.8%
15000–30000
Baht
Count 66 36 18 120
% within Personal Income 55.0% 30.0% 15.0% 100%
% within Preferred Brand 31.1% 29.3% 27.7% 30.0%
% of Total 16.5% 9.0% 4.5% 30.0%
30000-45000
Baht
Count 62 35 18 115
% within Personal Income 53.9% 30.4% 15.7% 100%
% within Preferred Brand 29.2% 28.5% 27.7% 28.8%
% of Total 15.5% 8.8% 4.5% 28.8%
45000–60000
Baht
Count 25 29 10 64
% within Personal Income 39.1% 45.3% 15.6% 100%
% within Preferred Brand 11.8% 23.6% 15.4% 16.0%
% of Total 6.3% 7.3% 2.5% 16.0%
(Continued)

78
Table 4.16 (Continued): Personal Income of Respondents: Descriptive Statistics
Analysis
Personal Income
Preferred Brand
TotalChanel Louis Vuitton Prada
Over 60000
Baht
Count 32 9 13 54
% within Personal Income 59.3% 16.7% 24.1% 100%
% within Preferred Brand 15.1% 7.3% 20.0% 13.5%
% of Total 8.0% 2.3% 3.3% 13.5%
Total Baht Count 212 123 65 400
% within Personal Income 53.0% 30.8% 16.3% 100%
% within Preferred Brand 100% 100% 100% 100%
% of Total 53.0% 30.8% 16.3% 100%
According to the result of 400 respondents:
47 respondents (11.8%) have personal income lower than 15000 baht:
27 respondents selected Chanel, 14 respondents selected Louis Vuitton,
and 6 respondents selected Prada.
120 respondents (30%) have personal income between 15000 to 30000
baht: 66 respondents selected Chanel, 36 respondents selected Louis
Vuitton, and 18 respondents selected Prada.
115 respondents (28.8%) have personal income between 30000 to 45000
baht: 62 respondents selected Chanel, 35 respondents selected Louis
Vuitton, and 18 respondents selected Prada.

79
64 respondents (16%) have personal income between 45000 to 60000 baht:
25 respondents selected Chanel, 29 respondents selected Louis Vuitton,
and 10 respondents selected Prada.
54 respondents (13.5%) have personal income higher than 60000 baht:
32 respondents selected Chanel, 9 respondents selected Louis Vuitton, and
13 respondents selected Prada.
The highest percentage of people who preferred Chanel based on this survey
is people who have personal income between 15000 to 30000 baht. Respondents who
have personal income between 45000 to 60000 baht are most preferred Louis Vuitton
(45.3%). Only 16.7% of respondents with more than 60000 baht preferred Louis
Vuitton lower than people who preferred Prada (24.1%).
CHAPTER 5
DISCUSSION AND CONCLUSION
In this Chapter, it’s present a summary of overall important component of
this research, along with discussion, and recommendations and some opinions for
the future related research.
The researcher’s main purpose is to study the factors that affecting consumer
buying preference towards top three luxury fashion brands including Chanel, Louis
Vuitton and Prada in Bangkok, Thailand. This research is conducted for beneficial
purpose to marketing experts, business owners, Thai’s Fashion enterprises, and many
more. The result of this study be a guideline for Thai’s enterprise to positioning their
brand, to planning and adapting marketing strategies in order to raise more advantages
over competitors, to understand consumers’ behavior, and increasing company
demand.
The study of factors that affecting consumer buying preference towards top
three luxury fashion brands including Chanel, Louis Vuitton and Prada in Bangkok,
Thailand, has two objective of study as:
Identify the marketing factors that affecting consumer buying preference
towards top three luxury fashion brands including Chanel, Louis Vuitton
and Prada
Understanding the consumer behavior that affecting consumer buying
preference in Bangkok, Thailand.
Following the conceptual framework in order to analyzed and explored
consumer-buying decision; the hypotheses are as the following:

81
Since P–value of βBrand Equity < .05; therefore, we can reject null
hypothesis and conclude that brand equity significantly influences consumer’s buying
preference in Bangkok.
H1o: βBrand Logo, Brand Awareness, Brand Association, Brand Identity,
Brand Image, Brand Loyalty, Perceived Quality, Value = 0
H1a: At least one of βBrand Logo, Brand Awareness, Brand Association,
Brand Identity, Brand Image, Brand Loyalty, Perceived Quality, Value ≠ 0
Since P–value of βSocial Factors > .05; therefore, we cannot reject null
hypothesis and cannot conclude that social factors significantly influences consumer’s
buying preference in Bangkok.
H2o: βAdvertisement, Celebrities Influence, Family Social Image, Self-
identity, Social Acceptance, Social Media Influence, Social Status = 0
H2a: At least one of βAdvertisement, Celebrities Influence, Family Social
Image, Self-identity, Social Acceptance, Social Media Influence, Social
Status ≠ 0
Since P–value of βProduct > .05; therefore, we cannot reject null hypothesis
and cannot conclude that product significantly influences consumer’s buying
preference in Bangkok.
H3o: βDesign and Feature, Differentiation, Durability, Exclusivity,
Function, Materials, Quality = 0
H3a: At least one of βDesign and Feature, Differentiation, Durability,
Exclusivity, Function, Materials, Quality ≠ 0

82
Since P–value of βPrice > .05; therefore, we cannot reject null hypothesis and
cannot conclude that price significantly influences consumer’s buying preference in
Bangkok.
H4o: βRange of Price, Reasonable Price, Resale Value = 0
H4a: At least one of βRange of Price, Reasonable Price, Resale Value ≠ 0
Since P–value of βPlace > .05; therefore, we cannot reject null hypothesis
and cannot conclude that place significantly influences consumer’s buying preference
in Bangkok.
H5o: βLocation, Convenience, Number of Store = 0
H5a: At least one of βLocation, Convenience, Number of Store ≠ 0
Since P–value of βPromotion < .05; therefore, we can reject null hypothesis
and conclude that promotion significantly influences consumer’s buying preference
in Bangkok.
H6o: βSale Promotion Offer, Membership Rewards, Special gift = 0
H6a: At least one of βSale Promotion Offer, Membership Rewards, Special
gift ≠ 0
Since P–value of βPeople > .05; therefore, we cannot reject null hypothesis
and cannot conclude that people significantly influences consumer’s buying
preference in Bangkok.
H7o: βService-Minded Employee, Communication, Customer
Relationship, Skill and Creditability = 0
H7a: At least one of βService-Minded Employee, Communication,
Customer Relationship, Skill and Creditability ≠ 0

83
Since P–value of β Physical Evidence > .05; therefore, we cannot reject null
hypothesis and cannot conclude that physical evidence significantly influences
consumer’s buying preference in Bangkok.
H8o: βLuxurious Environments, Store Design and Decorations = 0
H8a: At least one of βLuxurious Environments, Store Design and
Decorations ≠ 0
Since P–value of β Process> .05; therefore, we cannot reject null hypothesis
and cannot conclude that process significantly influences consumer’s buying
preference in Bangkok.
H9o: βHi–end Experience, Services, After Services and Warranty, Online
Shopping = 0
H9a: At least one of βHi–end Experience, Services, After Services and
Warranty, Online Shopping ≠ 0
Since P–value of βLifestyle < .05; therefore, we can reject null hypothesis
and conclude that lifestyle significantly influences consumer’s buying preference in
Bangkok.
H10o: βLuxury Lifestyle, Hard-working, Materialism, Modernity, Party
Animal, Socialize = 0
H10a: At least one of βLuxury Lifestyle, Hard-working, Materialism,
Modernity, Party Animal, Socialize ≠ 0
This independent study is a qualitative research, researcher using survey and
online survey as tools for data collection process. Population of the research is people
who lived in Bangkok and experienced these three luxury fashion brands including
Chanel, Louis Vuitton and Prada. The total number of sample group is 400

84
respondents: 176 are male and 224 are female. This questionnaire divided into four
parts, which are brand choice selection, the key independent variables, the element
mix of independent variable and demographics.
5.1 Conclusions and Discussion
The most preferred brand is Chanel with the number 212 out of 400
respondents (or 53.0%), second is Louis Vuitton with the number 123 out of 400
respondents (or 30.8%), and the last one is Prada with the number 65 of 400
respondents (or 16.3%). The analysis of Cross Tabulation shows that:
The majority respondents of Chanel brand are female with the number of
125 (or 59.0% within preferred brand), are in range 25–34 years old
(or 56.1% within preferred brand), are single (164 out of 212 respondents),
are working (107 of 212 respondents or 57.5%), and their personal income
are between 15000 –30000 baht (or 31.1% within preferred brand).
The majority respondents of Louis Vuitton brand are male with the
number of 69 (or 56.1% within preferred brand), are in range 25–34 years
old (or 58.5% within preferred brand), are single (96 out of 123
respondents), are working (54 of 123 respondents or 43.9%), and their
personal income are between 15000–30000 baht (or 29.3% within
preferred brand).
The majority respondents of Prada brand are female with the number of 45
(or 69.2% within preferred brand), are in range 25–34 years old (or 56.9%
within preferred brand), are single (40 out of 65 respondents), are working
(25 of 65 respondents or 38.5%), and their personal income are between

85
15000–30000 and 30000–45000 baht (both are 27.7% within preferred
brand).
After analyzing with the multinomial logistic regression of the significant
factors, the output highlight the main reasons why people selected the brand as
following:
Brand Equity, 117 of 400 respondents selected very strong effects (or
29.3%). The results of brand equity are:
185 respondents selected somewhat agree on brand logo (or 46.3%)
175 respondents selected somewhat agree on brand awareness (or 43.8%)
168 respondents selected somewhat agree on brand association (or 42.0%)
187 respondents selected somewhat agree on brand identity (or 46.8%)
190 respondents selected on brand image (or 47.5%)
164 respondents selected somewhat agree on brand loyalty (or 41.0%)
191 respondents selected strongly agree on perceived quality (or 47.8%)
195 respondents selected strongly agree on value (or 48.8%).
Social Factors, 122 of 400 respondents selected very strong effects (or
30.5%). The results of social factors are:
164 respondents selected somewhat agree on advertisement (or 41.0%)
171 respondents selected somewhat agree on celebrities influence (or
42.8%)
207 respondents selected somewhat agree on family social image (or
51.8%)
183 respondents selected somewhat agree on self-identity (or 45.8%)
189 respondents selected somewhat agree on social acceptance (or 47.3%)

86
198 respondents selected somewhat agree on social media (or 49.5%)
172 respondents selected somewhat agree on social status (or 43.0%).
Product, 141 of 400 respondents selected very strong effects (or 35.3%).
The results of product are:
196 respondents selected somewhat agree on design and feature (or
49.0%)
163 respondents selected somewhat agree on differentiation (or 40.8%)
176 respondents selected somewhat agree on durability (or 44.0%)
153 respondents selected somewhat agree on exclusivity (or 38.8%)
185 respondents selected somewhat agree on function (or 46.3%)
196 respondents selected somewhat agree on material (or 49.0%)
200 respondents selected strongly agree on quality (or 50.0%).
Price, 129 of 400 respondents selected very strong effects (or 32.3%).
The results of price are:
152 respondents selected somewhat agree on range of price (or 44.8%)
179 respondents selected somewhat agree on reasonable price (or 44.8%)
179 respondents selected somewhat agree on resale value (or 44.8%).
Place, 107 of 400 respondents selected strong effects (or 26.8%). The results
of place are:
180 respondents selected somewhat agree on location (or 45.0%)
195 respondents selected somewhat agree on convenience (or 48.8%)
173 respondents selected somewhat agree on number of store (or 43.3%).

87
Promotion, 113 of 400 respondents selected very strong effects (or 28.3%).
The results of promotion are:
152 respondents selected somewhat agree on sale promotion (or 38.0%)
148 respondents selected somewhat agree on membership (or 37.0%)
169 respondents selected somewhat agree on special gift (or 42.3%).
People, 107 of 400 respondents selected very strong effects (or 26.8%). The
results of people are:
173 respondents selected somewhat agree on service-minded (or43.3%)
172 respondents selected somewhat agree on communication (or 43.0%)
180 respondents selected somewhat agree on customer relationship
(or 45.0%)
194 respondents selected somewhat agree on skill and creditability
(or 48.5%).
Physical Evidence, 124 of 400 respondents selected strong effects (or 31.0%).
The results of physical evidence are:
183 respondents selected somewhat agree on luxurious environments (or
45.8%)
200 respondents selected somewhat agree on store design and decorations
(or 50.0%).
Process, 118 of 400 respondents selected very strong effects (or 29.5%). The
results of process are:
177 respondents selected somewhat agree on high-end experience (or
44.3%)

88
179 respondents selected somewhat agree on services (or 44.8%)
171 respondents selected strongly agree on after services and warranty (or
42.8%)
162 respondents selected somewhat agree on online shopping (or 40.5%)
Lifestyle, 119 of respondents selected strong effects (or 29.8%). The results
of lifestyles are:
184 respondents selected somewhat agree on luxury lifestyle (or 46.0%)
194 respondents selected somewhat agree on hard-working (or 48.5%)
179 respondents selected somewhat agree on materialism (or 44.8%)
211 respondents selected somewhat agree on modernity (52.8%)
179 respondents selected somewhat agree on party animal (or 44.8%)
178 respondents selected somewhat agree on socialize (or 44.5%).
5.2 Managerial Implications
In a recent year, brand name products affecting Thai people in terms of social
factors and lifestyles. Social faces and social status play a big role in Thai society,
along with the influences of foreign culture that changed Thai people lifestyle. In
business terms, marketing experts, business owners, Thai entrepreneur can use the
results of this study to see and understand the factors that affecting consumer buying
preference in Bangkok, Thailand. Brand equity, promotion, and consumer lifestyle are
the key factors that affecting consumer buying decision. To fulfill consumer needs,
companies also need to concern about social factors, product, price, place,
salesperson, physical evidence, process or services too. The author propose the
recommendations as follow:

89
Firstly, brand image is very important. Nowadays, brand represents its
products and services quality. People mostly selected the brand their believe in,
so company should create the trust to their consumers through communication such as
consumer relation, advertising, and more.
Secondly, as many people in the society concerned about their social faces,
the company could diversify the prices of the product so consumers can have more
choices. Create a variety of price range to support the consumer with different
income.
Thirdly, Luxury fashion business is base on consumers’ satisfaction so
process and services are important. As a consumer, they expected to get the high–end
service experience, company should consider on salesperson ability such as to
communicate well, know all the product information, so they can serve more
professional.
5.3 Recommendation for Future Research
As overall, the research results are achieved its objectives, which is to
identify the factors that affecting consumer buying preference towards top three
luxury fashion brands including Chanel, Louis Vuitton and Prada in Bangkok,
Thailand. Through the results of study can be use as a guideline and recommendations
for marketing people, Thailand fashion industries, or related field. According to this
paper, it was limited only three brands and in Bangkok only, so the future research
can have a comparative study with other brand, other city, or more in demographics
that could be added for the next future research.

90
Lastly, the understanding of consumer preferences and consumer buying
decision can help the companies in creating a good marketing strategy, and improve
their business demand.

91
BIBLIOGRAPHY
Aaker, D. (1991). Managing brand equity: Capitalizing on the value of a brand
name. London: WPP Group.
Aaker, D. (2016). What is brand equity and why is it valuable?. Retrieved from
https://www.prophet.com/thinking/2013/09/156-what-is-brand-equity-and-
why-is-it-valuable/.
Acutt, M. (2015). The marketing mix 4P’s and 7P’s explained. Retrieved from
http://marketingmix.co.uk.
Anjum, B., Dhanda, S., & Nagra, S. (2012). Impact of celebrity endorsed
advertisements on consumers. Retrieved from
http://indianresearchjournals.com/pdf/apjmmr/2012/october/2.pdf.
Arienti, P. (2016). Global powers of luxury goods 2016: Global power of luxury
goods top 100. Retrieved from https://www2.deloitte.com/content/dam/
Deloitte/tr/Documents/consumer-business/luxury-goods-2016.pdf.
Babbie, E. (2010). The basic of social research (7th ed.). Belmont, Calif:
Wadsworth.
Babbie, E., & Benaquisto, L. (2010). Fundamentals of social research (2nd ed.).
Toronto, ON: Nelson.
Bennett, S. (2013). 5 reasons why social media is so influential. Retrieved from
http://www.adweek.com/digital/social-media-influential/.
Berger, J. (2008). What influences your brand choice as a consumer?. Retrieved
from http://economictimes.indiatimes.com/brand-equity/what-influences-
your-brand-choice-as-a-consumer/articleshow/2936505.cms.

92
Bhasin, H. (2016). Service marketing mix–7P’s of marketing. Retrieved from
http://www.marketing91.com/service-marketing-mix/.
Blanchflower, D. G., & Oswald, A. J. (2000). Well-being over time in Britain and
the USA. Retrieved from http://www.dartmouth.edu/~blnchflr/papers/
Wellbeingnew.pdf.
Brand equity models and measurement. (2016). Retrieved from
http://www.insightsassociation.org/issues-policies/best-practice/brand-equity-
models-and-measurement.
Brand identity–definition and concept. (2010). Retrieved from
http://www.managementstudyguide.com/brand-identity.htm.
Chadha, R., & Husband, P. (2006). Inside Asia’s love affair with luxury: The cult of
the luxury brand. London: Nicholas Brealey.
Chans, F. (2015). Utility maximization model. Retrieved from
http://staffwww.fullcoll.edu/fchan/Micro/3utility_maximization_model.htm.
Coco Chanel biography. (2016). Retrieved from
http://www.biography.com/people/coco-chanel-9244165#synopsis.
Coffin, T. (2014). The defination of brand image. Retrieved from
https://www.quora.com/What-is-the-definition-of-brand-image-with-
examples.
Crawford, D., Boding, R., & Hoglund, R. (1993). The school for quality learning.
Champaign, IL: Research.
Digitizing #luxury brands. (2016). Retrieved from
http://www.wolffolins.com/views/1351854940/digitizing-luxury-brands.

93
Farooq, U. (2011). 5 stage of buying decision process: Consumer decision process.
Retrieved from http://www.studylecturenotes.com/management-sciences/
marketing/190-consumer-buying-decision-process
.Glasser, W. (1998). The Glass approach: Choice theory. Retrieved from
http://www.wglasser.com/the-glasser-approach/choice-theory.
Greathouse, M. (2015). Prada: A 5 minute history. Retrieved from
https://www.tradesy.com/blog/prada-a-5-minute-history/.
Gunelius, S. (2013). What is brand loyalty and why your brand needs it building
brand loyalty. Retrieved from https://aytm.com/blog/research-junction/
building-brand-loyalty-part-1/.
Hablorow, O. (2012). Louis Vuitton. Retrieved from
http://www.vogue.co.uk/article/louis-vuitton.
Hoffman, E. (1999). The right to be human. A biography of Abraham Maslow.
New York: McGraw Hill.
Jiang, P., & Jones, D. (2014). An exploratory study of factors affecting consumer
international online shopping. Retrieved from http://www.igi-global.com/
article/an-exploratory-study-of-factors-affecting-consumer-international-
online-shopping-behavior/114183.
Jitpleecheep, P. (2012). Louis Vuitton introduces Siam Paragon Shop. Retrieved
from https://www.pressreader.com/thailand/bangkok-post/20120707/
281990374625289.
Johnston, E. (2016). 5 steps to understanding your customer’s buying process.
Retrieved from https://www.b2bmarketing.net/en/resources/blog/5-steps-
understanding-your-customers-buying-process.

94
Johnson, E., Pham, M., & Johar, G. (2014). Consumer behavior and marketing.
Retrieved from http://www.columbia.edu/~tdp4/SPHBP2007.pdf.
Keller, K. (2016). Seven benefits of brand equity. Retrieved from
http://www.insightsassociation.org/issues-policies/best-practice/brand-equity-
models-and-measurement.
Louis Vuitton biography.com. (2014). Retrieved from
http://www.biography.com/people/louis-vuitton-17112264.
Lovell, A. (2015). What does luxury retail actually mean?. Retrieved from
https://www.linkedin.com/pulse/what-does-luxury-retail-actually-mean-andy-
lovell.
Luxury goods in Thailand. (2016). Retrieved from
http://www.euromonitor.com/luxury-goods-in-thailand/report.
Marketing 101: The buyer decision process: Evaluation of alternatives. (2015).
Retrieved from http://marketmedialife.blogspot.com/2013/03/marketing-101-
buyer-decision-process.html.
Maslow, A.H. (1943). A theory of human motivation. Psychological Review, 50,
370–396.
Mathapati, A. (2014). Brand associations. Retrieved from
http://www.slideshare.net/akashcm/brand-associations-31378666.
McLeod, S. (2007). Maslow’s hierachy of needs. Retrieved from
http://www.simplypsychology.org/maslow.html.

95
Mei–lian, L., Haibo, L., & Qiong, S. (2012). Brand choice model based on web
consumer brand preferences. Retrieved from
http://www.freepatentsonline.com/article/International-Journal-Business-
Research/312171909.html.
Melymbrose, J. (2016). How to define your core brand values (and why you should).
Retrieved from https://business.tutsplus.com/tutorials/how-to-define-your-
core-brand-values-and-why-you-should--cms-26301.
Mull, A. (2016). 10 things every handbag lover should know about chanel flap bags.
Retrieved from http://www.purseblog.com/guides/chanel-flap-bag-facts-
history/.
Niles, R. (2010). Survey sample sizes and margin of error. Retrieved from
http://www.robertniles.com/stats/margin.shtml.
Nueno, S., & Quelch J. (1998). The mass marketing of luxury. Business Horizons,
6, 61–68.
Offers, A. (2015). What does luxury retail mean today?. Retrieved from
https://www.linkedin.com/pulse/what-does-luxury-retail-actually-mean-andy-
lovell .
Penn, S. (2007). Business theories of buying behavior. Retrieved from
http://smallbusiness.chron.com/business-theories-buying-behavior-
13883.html.
Phataranawik, P. (2012). Louis Vuitton opens fourth Thai boutiques at Siam
Paragon. Retrieved from http://www.pressreader.com/thailand/the-nation/
20120707/281578057764974.

96
Prada Japan flourishes. (2015). Retrieved From https://insideretail.asia/2015/08/10/
prada-japan-flourishes/.
Bughin, J. (2015). Getting a sharper picture of social media’s influence. Retrieved
from http://www.mckinsey.com/business-functions/marketing-and-sales/our-
insights/getting-a-sharper-picture-of-social-medias-influence.
Radnor, A. (2010). Celebrities and their influence. Retrieved from
http://www.teenink.com/opinion/entertainment_celebrities/article/82342/
Celebrities-and-Their-Influence/.
Riley, J. (2016). Marketing & buyer behaviour–the decision–marketing process.
Retrieved from http://www.tutor2u.net/business/reference/marketing-buyer-
behaviour-the-decision-making-process.
Saxena, V. (2015). Yamane formula. Retrieved from https://www.quora.com/What-
is-Yamane-sample-calculation.
Senft, A. (2011). History of prada. Retrieved from
http://www.fashionintime.org/prada/.
Shane, D. (2014). 6 ways to create a positive brand perception. Retrieved from
https://smallbiztrends.com/2014/01/create-positive-brand-perception.html.
Smith, K. (2016). Exploring the identity of a brand: How to discover and measure
brand associations. Retrieved from https://www.brandwatch.com/blog/
discover-measure-brand-associations/
Solomon, M. R., Marshall, G. W., Stuart, E. W. (2009). Marketing: real people, real
choice (8th ed.). Australia: Pearson Education.

97
Somma, M. (2014). Brand perceptions: Perceived quality rules the day. Retrieved
from https://www.brandingstrategyinsider.com/2014/03/brand-perceptions-
perceived-quality-rules-the-day.html#.WKqoABh7FE4.
Sullo, B. (2011). The ten axioms of choice theory. Retrieved from
http://www.choicetheory.com/ct.htm.
Tavakol, M., & Dennick, R. (2011). Making sense of Chronbach’s Alpha.
International Journal of Medical Education, 2, 53–55.
Tracy, B. (2004). Marketing mix (price, place promotion, product). Retrieved from
http://businesscasestudies.co.uk/business-theory/marketing/marketing-mix-
price-place-promotion-product.html#axzz4ZDI02BZY.
Trochim, W. (2006). Descriptive statistics. Retrieved from
http://www.socialresearchmethods.net/kb/statdesc.php.
Tunstall, D. (2013). Brand thinking. Retrieved from
https://www.brainpickings.org/2013/05/01/brand-thinking-debbie-millman/.
Umar, F. (2011). 5 stages of buying decision process: Consumer decision process.
Retrieved from http://www.studylecturenotes.com/management-sciences/
marketing/190-consumer-buying-decision-process.
Vliet, V. (2013). Marketing mix 4P’s by McCarthy. Retrieved from
http://www.toolshero.com/marketing/marketing-mix-4p-mccarthy/.
Vineeth, A. (2007). Brand image. Retreived from
https://www.slideshare.net/air/brand-image.
Yamane, T. (1973). Statistic: An introductory analysis (3rd ed.). New York:
Harper & Row.

98
Zeithaml, V. A., & Bitner, M. J., (2007). Services marketing. Singapore:
McGraw–Hill.

99
APPENDIXES

100
Appendix A: Questionnaire
As a part of MBA Independent Study course in Bangkok University, the
researcher conducted a survey that investigate “ The factors that affecting consumer-
buying preference towards top three luxury fashion brands in Bangkok: Chanel, Louis
Vuitton, and Prada. Any information obtained in connection with this study that can
be identified with you will remain confidential. The research will appreciate if the
attendant completes the following question.
This survey is divided into 4 parts:
1. Brand Choice Selection
2. The Key Independent Variables
3. The Element Mix of Independent Variables
4. Demographics
“The study of factors that affecting consumer buying preference towards top
three luxury fashion brands including Chanel, Louis Vuitton and Prada in
Bangkok, Thailand”
PART I Please check the circle that best corresponds to your answer for the question
below.
Q.1 Please select your most preferred brand?
o Chanel
o Louis Vuitton
o Prada

101
PART II Please rate the following factors that influence your buying preference
in question1?
0 1 2 3 4 5 6 7
2.1 Brand Equity
2.2 Social Factors
2.3 Product
2.4 Price
2.5 Place (Location)
2.6 Promotion
2.7 People
(Salesperson)
2.8 Physical
Evidence
2.9 Process or
Services
2.10 Lifestyle
No Effect
Mild Effect
Strong Effect

102
PART III Please rate the following factors that affect your buying preference in
question1?
1= Disagree 2= Somewhat Disagree 3= Neutral
4=Somewhat Agree 5= Strongly Agree
3.1 Brand Equity 1 2 3 4 5
Brand Logo
Brand Awareness
Brand Association
Brand Identity
Brand Image
Brand Loyalty
Perceived Quality
Value
3.2 Social Factors 1 2 3 4 5
Advertisement
Celebrities Influence
Family Social Image
Self-identity (Uniqueness)
Social Acceptance
Social Media Influence
Social Status
Disagree Strongly Agree

103
1= Disagree 2= Somewhat Disagree 3= Neutral
4=Somewhat Agree 5= Strongly Agree
3.3 Product 1 2 3 4 5
Design and Feature
Differentiation
Durability (Usage)
Exclusivity
Function
Material
Quality
3.4 Price 1 2 3 4 5
Range of Price
Reasonable Price
Resale Value
3.5 Place 1 2 3 4 5
Location
Convenience (Easy to go)
Number of Store
Disagree Strongly Agree

104
1= Disagree 2= Somewhat Disagree 3= Neutral
4=Somewhat Agree 5= Strongly Agree
3.6 Promotion 1 2 3 4 5
Sale Promotion Offer
Membership Rewards
Special gift
3.7 People 1 2 3 4 5
Service-Minded Employee
Communication (Information Giving)
Customer Relationship
Skill and Creditability
3.8 Physical Evidence 1 2 3 4 5
Luxurious Environments
Store Design and Decorations
3.9 Process or Services 1 2 3 4 5
High–end Experience
Services
After Services and Warranty
Online shopping
Disagree Strongly Agree

105
1= Disagree 2= Somewhat Disagree 3= Neutral
4=Somewhat Agree 5= Strongly Agree
3.10 Lifestyle 1 2 3 4 5
Luxury Lifestyle
Hard–Working
Materialism
Modernity
Party Animal
Socialize
PART IIII Demographics (Background)
Gender:
o Male
o Female
Age:
o Under 18 years old
o 18–24 years old
o 25–34 years old
o 35–44 years old
o Over 45 years old
Disagree Strongly Agree

106
Marital Status:
o Single
o Married
o Others
Occupation:
o Student
o Working
o Self-employed
o Unemployed
o Others
Personal Income:
o Less than 150000 Baht
o 15000–30000 Baht
o 30000–45000 Baht
o 45000–60000 Baht
o More than 60000 Baht

107
Appendix B: Content Validity
To prove the consistency of the question, the researcher using Index of Item
Objective Congruence method (IOC) to calculate the consistency between
questions and objective. The consistency index value will be accepted the value at
0.5 or above, and the equation is:
IOC = ∑𝑅
𝑁
IOC = consistency between the objective and questions.
ΣR= total assessment points given from all qualified experts.
N = number of qualified experts.

108
Index of Item–Objective Congruence (IOC) from three experts result are as
follows:
No. Question Expert 1 Expert 2 Expert 3 Total
Score
IOC
Σ
Total
Scores
Σ
1 0 -1 1 0 -1 1 0 -1
1 1 ✓ ✓ ✓ 3 1 Acceptable
2 2.1 ✓ ✓ ✓ 2 0.67 Acceptable
3 2.2 ✓ ✓ ✓ 3 1 Acceptable
4 2.3 ✓ ✓ ✓ 2 0.67 Acceptable
5 2.4 ✓ ✓ ✓ 3 1 Acceptable
6 2.5 ✓ ✓ ✓ 2 0.67 Acceptable
7 2.6 ✓ ✓ ✓ 3 1 Acceptable
8 2.7 ✓ ✓ ✓ 3 1 Acceptable
9 2.8 ✓ ✓ ✓ 2 0.67 Acceptable
10 2.9 ✓ ✓ ✓ 3 1 Acceptable
11 2.10 ✓ ✓ ✓ 3 1 Acceptable
12 2.11 ✓ ✓ ✓ 1 0.34 Acceptable
13 3.1 ✓ ✓ ✓ 2 0.67 Acceptable
14 3.2 ✓ ✓ ✓ 3 1 Acceptable
15 3.3 ✓ ✓ ✓ 3 1 Acceptable

109
No. Question Expert 1 Expert 2 Expert 3 Total
Score
IOC
Σ
Total
Scores
Σ
1 0 -1 1 0 -1 1 0 -1
16 3.4 ✓ ✓ ✓ 2 0.67 Acceptable
17 3.5 ✓ ✓ ✓ 3 1 Acceptable
18 3.6 ✓ ✓ ✓ 3 1 Acceptable
19 3.7 ✓ ✓ ✓ 2 0.67 Acceptable
20 3.8 ✓ ✓ ✓ 3 1 Acceptable
21 3.9 ✓ ✓ ✓ 2 0.67 Acceptable
22 3.10 ✓ ✓ 3 1 Acceptable
23 3.11 ✓ ✓ ✓ 1 0.34 Deny
There are three levels of assessment point:
+1 means the question is certainly consistent
0 means the question is unsure to be consistent
–1 means the question is inconsistent
Where:
IOC = consistency between the objective and questions.
ΣR = total assessment points given from all qualified experts.
N = number of qualified experts.

110
Therefore IOC =
= 0.828
The assessment result is equal 0.828, and there are two questions that have
IOC index less than 0.5.

111
BIODATA
Name: Atip Thepsongkroh
Date of Birth: December 25, 1990
Address: 46 Sathupradit 12 Road, Thungwatdorn,
Sathorn, Bangkok, 10120 Thailand.
Email: [email protected]
Contact Number: +66829553569
Education Background: Computer Graphics and Multimedia
Bangkok University International College