The structure of Victoria’s farm sector When to quit farming? When to sell the farm? Who to sell...
36
• The structure of Victoria’s farm sector • When to quit farming? • When to sell the farm? • Who to sell to?
-
Upload
brook-boone -
Category
Documents
-
view
220 -
download
3
Transcript of The structure of Victoria’s farm sector When to quit farming? When to sell the farm? Who to sell...

• The structure of Victoria’s farm sector
• When to quit farming?
• When to sell the farm?
• Who to sell to?


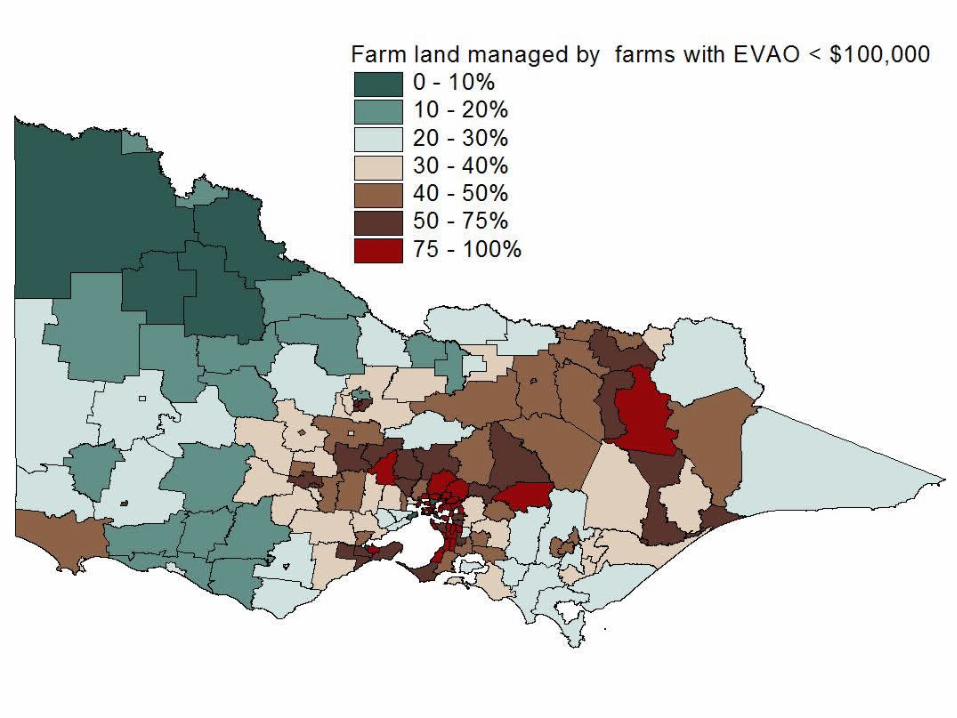
Many small farms, few large farms
0
10
20
30
40
50
60
Lessthan100
100-200
200-300
300-400
400-500
500-600
600-700
700-800
800-900
900-1000
1000-1500
1500+
Farm value of production (EVAO $000s)
% o
f fa
rms,
EV
AO
% of farms % value of production

Bulk of farm production comes from largest 25%
0
10
20
30
40
50
60
70
80
Smallest 25%(<$35k)
2nd quartile ($35k-$105)
3rd quartile ($105k-$213k)
Largest 25% (>$213k)
Farm size (EVAO) quartiles
% o
f fa
rm p
rod
uc
t

Cash surplus and non-farm family income
Farms less than $100,000 EVAO
0
50000
100000
150000
200000
250000
1990
1991
1992
1993
1994
1995
1996
1997
1998
1999
2000
2001
2002
2003
2004
2005
2006
Fa
rm C
as
h In
co
me
($
)
Farm Cash Income Total Non Farm Income

Cash surplus and non-farm family income
Farms $100,000-$200,000 EVAO
0
50000
100000
150000
200000
250000
1990
1991
1992
1993
1994
1995
1996
1997
1998
1999
2000
2001
2002
2003
2004
2005
2006
Fa
rm C
as
h In
co
me
($
)
Farm Cash Income Total Non Farm Income

Farm cash surplus and non-farm family income
Farms $200,000-$400,000 EVAO
0
50000
100000
150000
200000
250000
1990
1991
1992
1993
1994
1995
1996
1997
1998
1999
2000
2001
2002
2003
2004
2005
2006
Fa
rm C
as
h In
co
me
($
)
Farm Cash Income Total Non Farm Income

Farm cash surplus and non-farm family income
Farms $400,000+ EVAO
0
50000
100000
150000
200000
250000
300000
350000
1990 1991 1992 1993 1994 1995 1996 1997 1998 1999 2000 2001 2002 2003 2004 2005 2006
Far
m C
ash
Su
rplu
s ($
)
Farm Cash Income Total Non Farm Income

Most farms with turnover > $50,000 managed by someone who describes farming as their main
occupation
0
10,000
20,000
30,000
40,000
50,000
60,000
<50
100-
150
200-
250
300-
350
400-
450
500-
600
700-
800
900-
1000
1500
+
EVAO ($1000s) in 1996 dollars
Est
abli
shm
ents
Major occupation Minor occupation No response

Slow and steady farm aggregationNumber of Victorian farmers 1971-2006
0
20,000
40,000
60,000
80,000
100,000
120,000
1971 1976 1981 1986 1991 1996 2001 2006
Year
Nu
mb
er o
f fa
rmer
s
Total Male Female


“men once fully committed to farming leave it reluctantly and slowly[and] young men refuse to enter farming as long as income
prospects are poor”
0.0
5.0
10.0
15.0
20.0
25.0
Exi
ts a
s a
per
cen
t o
f ag
e g
rou
p
25-29
30-34
35-39
40-44
45-49
50-54
55-59
60-64
65-69
70-74
75-79
80 85
Age
1976-81 1981-86 1986-91 1991-96 1996-2001 2001-06

-200
0
200
400
600
800
1000
1200
1400
15 20 25 30 35 40 45 50 55 60 65 70 75 80
Age cohort
Nu
mb
er o
f d
airy
far
mer
s
Exits from farming Entries to farming
The Victorian dairy industry: entry and exit 1986-96

-50
0
50
100
150
200
250
300
15 20 25 30 35 40 45 50 55 60 65 70 75 80
Age Cohort
Nu
mb
er o
f b
eef
farm
ers
Exits from farming Entries to farming
The Victorian beef industry: entry and exit 1986-96


“One of the problems that is all the time tugging at the heart of farmer of this country is the absence from
the farm of the young man. There are many neighbourhoods in which not one in ten of the male
members of the community can be truthfully called a young man The farmers are deprived of the earnest, intelligent help which naturally belongs to them, rural
society loses one of its best elements, the cities are overcrowded and all parties at interest are losers
The shops, the factories, the stores and the offices are
swallowing up sturdy young men every where”

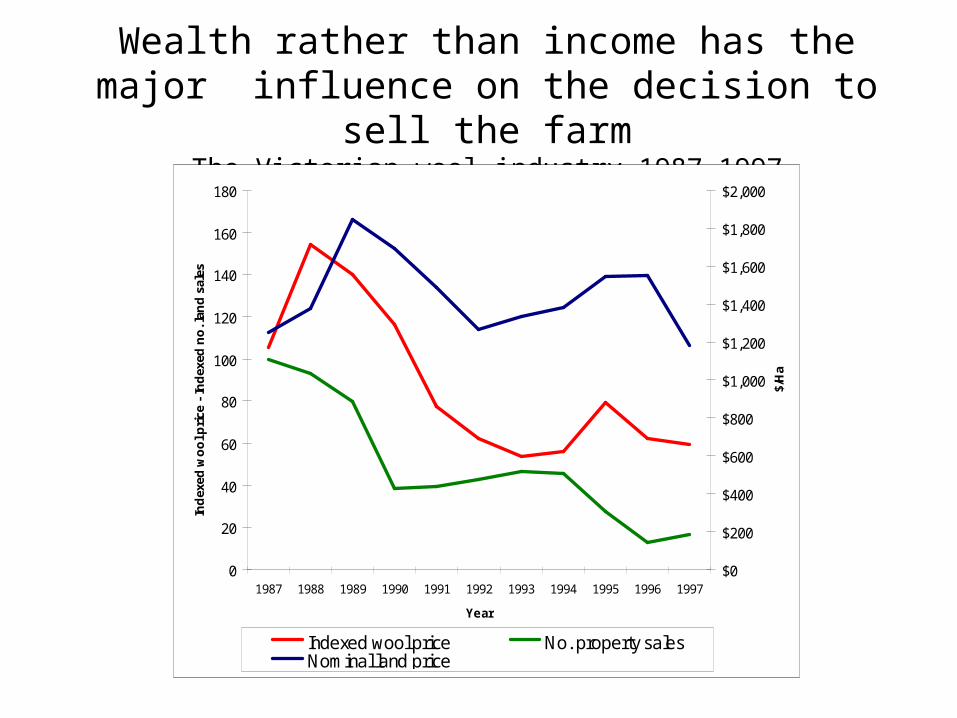
Wealth rather than income has the major influence on the decision to sell the farm
The Victorian wool industry 1987-1997
0
20
40
60
80
100
120
140
160
180
1987 1988 1989 1990 1991 1992 1993 1994 1995 1996 1997
Year
Ind
exed
wo
ol p
rice
- In
dex
ed n
o. l
and
sal
es
$0
$200
$400
$600
$800
$1,000
$1,200
$1,400
$1,600
$1,800
$2,000
$/H
a
Indexed wool price No. property salesNominal land price


Farm entry is as important as farm exit in determining “adjustment rate”
Victorian farm entry and exit rates 1976-2006
0
1
2
3
4
5
6
7
8
9
1976
1981
1986
1991
1996
2001
2006
% o
f fa
rmer
s
Entry Rate Exit Rate


Ratio of local and non local land purchases 1991-2001
Less than 0.20.2 - 0.330.33 - 0.50.5 - 11 - 22 - 33 - 5Greater than 5Non agricultural land
Who buys the farm land?

Ratio of land value per hectare to production value per hectare: 1990-1997

Purchases by locals and outsiders

Number of land purchases by persons residing outside the SLA of purchase
1996-2001
Count of purchasers from outside SLA 20010 - 100100 - 200200 - 400400 - 500500 - 700

Number of land purchases by persons residing outside the SLA of purchase
2001-2006
Count of purchasers from outside SLA 20060 - 100100 - 200200 - 400400 - 500500 - 700


Production LandscapeMedian price per hectare ($2006) by property size
Indexed to 1988


Amenity LandscapeMedian price per hectare ($2006) by property size
Indexed to 1988