THE STATUS AND IMPACT OF TECHNOLOGY TRANSFER AND ...
227
THE STATUS AND IMPACT OF TECHNOLOGY TRANSFER AND INNOVATION ON THE PRODUCTIVITY AND COMPETITIVENESS OF SMALL-SCALE AGRO- PROCESSING BUSINESSES IN MASHONALAND CENTRAL (ZIMBABWE) AND FREE STATE (SOUTH AFRICA) By: JUSTIN GUMBOCHUMA Doctor Business Administration In the Faculty of Management Sciences CENTRAL UNIVERSITY OF TECHNOLOGY, FREE STATE PROMOTER: PROFESSOR P RAMBE CO-PROMOTER: PROFESSOR DY DZANSI November 2017 © Central University of Technology, Free State
Transcript of THE STATUS AND IMPACT OF TECHNOLOGY TRANSFER AND ...
THE STATUS AND IMPACT OF TECHNOLOGY TRANSFER AND INNOVATION ON
THE PRODUCTIVITY AND COMPETITIVENESS OF SMALL-SCALE AGRO-
PROCESSING BUSINESSES IN MASHONALAND CENTRAL (ZIMBABWE) AND
FREE STATE (SOUTH AFRICA)
By:
JUSTIN GUMBOCHUMA
Doctor Business Administration
In the
Faculty of Management Sciences
CENTRAL UNIVERSITY OF TECHNOLOGY, FREE STATE
PROMOTER: PROFESSOR P RAMBE
CO-PROMOTER: PROFESSOR DY DZANSI
November 2017
© Central University of Technology, Free State

ii | P a g e
DECLARATION
I, Justin Gumbochuma, student number , declare that the thesis entitled “The status and
impact of technology transfer and innovation on the productivity and competitiveness of small-scale agro-
processing businesses in Mashonaland Central (Zimbabwe) and Free State (South Africa)” hereby
submitted for the degree Doctor of Business Administration has not previously been submitted for a
degree at this or any other university. I further declare that this is my own independent work in design
and execution and that all materials contained herein have been duly acknowledged. I cede the copyright
of this thesis in favour of the Central University of Technology, Free State.
16 FEBRUARY 2017
............................................... ..........................................
SIGNATURE OF STUDENT DATE
© Central University of Technology, Free State

iii | P a g e
ACKNOWLEDGEMENTS
It is my pleasure to express my appreciation and gratitude to the following people for their immerse
contributions to my academic life and the successful completion of this study.
All family members including my wife (Mrs Linda Gumbochuma) and kids (Lisa, Nyasha and
Malvin) who supported me during the research period.
Family friends like Mr K and Mrs S Tagwirei
My main supervisor, Professor Patient Rambe for his professional guidance and direction.
My co-supervisor, Professor Dennis Y. Dzansi for the support and guidance.
The statistics team for conducting the statistical analysis including Dr T Ndofirepi.
To all my colleagues and friends for their contributions in various diverse ways.
Various agro-processing institutions and individuals respondents for the time spent responding the
questionnaires.
To the Central University of Technology Free State for funding this project.
Above all, I praise the Almighty Lord for granting me the strength and blessings needed to
accomplish this project.
© Central University of Technology, Free State

iv | P a g e
ABSTRACT
The variations in agricultural production and declining food security situations in Zimbabwe and South
Africa have been attributed to the low uptake of agricultural technology, the innovation chasm, low
mechanisation and persistent climatic changes, which threaten human existence and the sustainable
survival of agro-processing firms in both countries. As such, this study explores the status and impact of
technology transfer and innovation on the productivity and competitiveness of selected small agro-
processing firms in Zimbabwe and South Africa. Founded on a positivist epistemology, a quantitative
approach, survey design and probabilistically sampled respondents, the study explored the extent to
which technology transfer and innovation influence the levels of productivity and competitiveness in the
small agro-processing firms in selected provinces in both countries.
Percentage analyses and a non-parametric technique, the Spearman Correlation, were employed to
assess the relationships among technology transfer, innovation, productivity and competitiveness of
selected small agro-processing firms in Zimbabwe and South Africa. Multiple regression analysis was
conducted to test a number of predictive effects. Firstly, it was used to test the predictive effect of
technology transfer and innovation on the financial productivity of these enterprises. Secondly, it was
used to assess the predictive effects of technology transfer and innovation on the non-financial
productivity of these agro-processing firms.
The results revealed some positive and significant correlations of varying strengths among technology
transfer, innovation, productivity and competitiveness in both Zimbabwe and South African samples.
Mixed results were also reported on the impact of innovation and technology transfer on financial and
non-financial productivity in both samples. For instance, the influence of innovation and technology
transfer on financial productivity was non-significant for the Zimbabwean sample. In the South Africa
sample, only technology transfer had a significant predictive influence on financial productivity.
Furthermore, only technology transfer had a significant predictive effect on non-financial productivity with
the Zimbabwean sample, whereas both innovation and technology transfer had a strong predictive effect
on non-financial productivity.
To some extent, the results validated the proposed conceptual model as a guiding tool for estimating
agricultural productivity. Thus, the proposed model provides important theoretical and analytical lenses
for academics, educators and policy-makers’ concerned with finding effective ways of enhancing
agricultural productivity among small agro-based businesses in Zimbabwe and South Africa.
© Central University of Technology, Free State
v | P a g e
LIST OF ABBREVIATIONS AND ACRONYMS
ADB African Development Bank
ANC African National Congress
APCF Agro-Processing Competitiveness Fund
APEC Asia-Pacific Economic Cooperation
ASGISA Accelerated and Shared Growth Initiative-South Africa
BBBEE Broad-Based Black Economic Empowerment
BEE Black Economic Empowerment
BRICS Brazil, Russia, India, China and South Africa
CAADP Comprehensive African Agriculture Development Programme
CAPF Comprehensive Agricultural Policy Framework
CAPSA Centre for Alleviation of Poverty through Sustainable Agriculture
CIMMYT International Maize and Wheat Improvement Centre
DAFF Department of Agriculture, Fisheries and Forestry
DFID Department for International Development
ESCAP Economic and Social Commission for Asia and the Pacific
EU European Union
EU-SAFTA European Union - South Africa Free Trade Agreement
FDI Foreign Direct Investment
FTLRP Fast Track Land Redistribution Programme
GDP Gross Domestic Product
GII Global Innovation Index
ICRISAT International Crop Research Institute for the Semi-arid Tropics
ICT Information and Communication Technology
IFC International Finance Corporation
ILO International Labour Organisation
IMF International Monetary Fund
MAFISA Micro Agriculture Financial Institutions of South Africa
MATF Maendeleo Agricultural Technology Fund
NBSSI National Board for Small-Scale Industries
NGOs Non-Governmental Organisations
© Central University of Technology, Free State
vi | P a g e
NEPAD New Partnership for Africa’s Development
OECD Organisation for Economic Co-operation and Development
RAS Agricultural Research Services
R&D Research and Development
SADC Southern African Development Community
SAFTA South Africa Free Trade Area
SEDA Small Enterprise Development Agency
SMEs Small and Medium Enterprises
SMMEs Small, Micro and Medium Enterprises
SSABs Small-Scale Agro-Based Businesses
UK United Kingdom
UNCTAD United Nations Conference on Trade and Development
UNIDO United Nations Industrial Development Organisation
USA United States of America
WFP World Food Programme
WTO World Trade Organisation
ZimAsset Zimbabwe Agenda for Sustainable Socio-Economic Transformation
ZANU-PF Zimbabwe African National Union – Patriotic Front
© Central University of Technology, Free State
vii | P a g e
TABLE OF CONTENTS
DECLARATION ....................................................................................................................................... ii
ACKNOWLEDGEMENTS ........................................................................................................................ iii
ABSTRACT ............................................................................................................................................ iv
LIST OF ABBREVIATIONS AND ACRONYMS ....................................................................................... v
TABLE OF CONTENTS .......................................................................................................................... vii
LIST OF TABLES .................................................................................................................................. xiv
LIST OF FIGURES ................................................................................................................................ xvi
CHAPTER 1: ORIENTATION OF THE STUDY ....................................................................................... 1
1.1. Introduction .................................................................................................................................................. 2
1.2. Important terms............................................................................................................................................ 4
1.2.1. Technology transfer .............................................................................................................................. 4
1.2.2. Innovation ............................................................................................................................................. 5
1.2.3. Productivity ........................................................................................................................................... 6
1.2.4. Competitiveness ................................................................................................................................... 6
1.2.5. Agro-businesses ................................................................................................................................... 7
1.2.6. Knowledge transfer capacity ................................................................................................................ 9
1.3. Problem Background ................................................................................................................................. 10
1.4. Problem Statement .................................................................................................................................... 13
1.5. Aim of the study ......................................................................................................................................... 14
1.6. Research Questions .................................................................................................................................. 15
1.7. Objectives .................................................................................................................................................. 15
1.8. Significance of the study ............................................................................................................................ 15
1.9. Limitation of the study ................................................................................................................................ 16
1.10. Delimitation of the study .......................................................................................................................... 16
1.11. Chapter summary .................................................................................................................................... 16
CHAPTER 2: TECHNOLOGY TRANSFER AND AGRO-PROCESSING FIRMS IN EMERGING
ECONOMIES ......................................................................................................................................... 17
2.1. Introduction ................................................................................................................................................ 18
2.2. Defining technology and technology transfer ............................................................................................. 18
© Central University of Technology, Free State

viii | P a g e
2.2.1. Technology ......................................................................................................................................... 18
2.2.2. Technology transfer ............................................................................................................................ 19
2.3. Modes of promoting technology transfer ................................................................................................... 21
2.3.1. Foreign direct investment, joint ventures and licensing ...................................................................... 21
2.3.2. Importation and exportation of capital goods ...................................................................................... 22
2.3.3. Co-operative alliances ........................................................................................................................ 22
2.3.4. Sub-contracting .................................................................................................................................. 22
2.3.5. Brain drain and gain ........................................................................................................................... 23
2.3.6. Technical assistance and co-operation .............................................................................................. 23
2.4. Types of agriculture technology ................................................................................................................. 24
2.5. Theorisation of technology transfer ........................................................................................................... 24
2.5.1. Neo-classical theory ........................................................................................................................... 25
2.5.2. Traditional Liberal theory .................................................................................................................... 25
2.5.3. Industrial Development theory ............................................................................................................ 26
2.5.4. Contingency Effectiveness Model on technology transfer .................................................................. 27
2.6. Technology transfer institutions ................................................................................................................. 28
2.6.1. Universities ......................................................................................................................................... 29
2.6.2. Government departments in advanced economies ............................................................................ 30
2.6.3. Government departments in emerging economies ............................................................................. 31
2.6.4. Research institutes ............................................................................................................................. 33
2.6.5. Non-Governmental Organisations ...................................................................................................... 35
2.7. Importance/impact of agriculture technology transfer in Africa .................................................................. 36
2.8. Technology transfer in developing economies........................................................................................... 38
2.8.1. Africa .................................................................................................................................................. 38
2.8.2. Zimbabwe ........................................................................................................................................... 40
2.8.3. South Africa ........................................................................................................................................ 41
2.9. Agro-business-related institutions in Zimbabwe and South Africa ............................................................. 43
2.10. Barriers to technology transfer ................................................................................................................. 44
2.11. Challenges of agricultural technology transfer ......................................................................................... 45
© Central University of Technology, Free State
ix | P a g e
2.12. Chapter summary .................................................................................................................................... 46
CHAPTER 3: INNOVATION AND SMALL-SCALE AGRO-PROCESSING FIRMS IN DEVELOPED
AND EMERGING ECONOMIES ............................................................................................................ 47
3.1. Introduction ................................................................................................................................................ 48
3.2. Nature of innovation ................................................................................................................................... 48
3.3. Facets of agricultural innovation ................................................................................................................ 49
3.3.1. Innovations in crop production ........................................................................................................... 49
3.3.2. Innovations in animal husbandry ........................................................................................................ 50
3.3.3. Innovation of crop growing conditions ................................................................................................ 50
3.3.4. Innovation through new agricultural implements ................................................................................ 50
3.4. Reasons for small-scale agricultural enterprises’ pursuit of innovation ..................................................... 51
3.4.1. Risks................................................................................................................................................... 51
3.4.2. Opportunities ...................................................................................................................................... 52
3.4.3. Socio-cultural and demographic factors ............................................................................................. 52
3.5. Approaches to innovation in small-scale agri-businesses ......................................................................... 53
3.5.1. Innovation platforms ........................................................................................................................... 53
3.5.2. Innovation intermediaries ................................................................................................................... 53
3.5.3. Informal social and economic networks .............................................................................................. 54
3.6. Theories of innovation ............................................................................................................................... 55
3.6.1. The Creative Destruction Theory........................................................................................................ 55
3.6.2. Diffusion of Innovation Theory ............................................................................................................ 55
3.6.3. Disruptive Innovation Theory .............................................................................................................. 56
3.6.4. The Henderson and Clark Theory ...................................................................................................... 56
3.7. Agricultural innovation systems ................................................................................................................. 57
3.8. Innovation-productivity relationship-An overview ....................................................................................... 58
3.9. Significance of SSABs in agricultural innovation and development ........................................................... 58
3.10. Studies on innovation in agro-based firms in advanced AND emerging economies ................................ 59
3.10.1. European Union ............................................................................................................................... 59
3.10.2. Vietnam ............................................................................................................................................ 60
© Central University of Technology, Free State
x | P a g e
3.10.3. Uganda ............................................................................................................................................. 62
3.10.4. South Africa ...................................................................................................................................... 62
3.11. Chapter summary .................................................................................................................................... 64
CHAPTER 4: AGRICULTURAL PRODUCTIVITY AND COMPETITIVENESS ...... Error! Bookmark not
defined.
4.1. Introduction ................................................................................................................................................ 66
4.2. Defining agricultural productivity ................................................................................................................ 66
4.2.1. Measuring agricultural productivity ..................................................................................................... 67
4.3. Agricultural competitiveness ...................................................................................................................... 69
4.3.1. Measuring agricultural competitiveness. ............................................................................................ 70
4.4. Importance of agricultural productivity ....................................................................................................... 71
4.4.1. Poverty reduction and promoting well-being ...................................................................................... 71
4.4.2. Promoting food security and stability of staple food prices ................................................................. 71
4.4.3. Structural transformation of the labour market ................................................................................... 72
4.4.4. Involvement in foreign trade ............................................................................................................... 73
4.5. Factors affecting growth of agriculture productivity and competitiveness .................................................. 73
4.5.1. Technological changes ....................................................................................................................... 73
4.5.2. Agriculture research and extension services ...................................................................................... 74
4.5.3. Farm size ............................................................................................................................................ 75
4.5.4. Factor intensity ................................................................................................................................... 76
4.5.5. Human capital .................................................................................................................................... 76
4.5.6. Investment in public facilities and infrastructure ................................................................................. 77
4.5.7. Natural resource endowment ............................................................................................................. 77
4.6. Case studies .............................................................................................................................................. 77
4.6.1. Europe ................................................................................................................................................ 78
4.6.2. Latin America ..................................................................................................................................... 78
4.6.3. Africa .................................................................................................................................................. 80
4.6.4. South Africa ........................................................................................................................................ 83
4.6.5. Zimbabwe ........................................................................................................................................... 86
© Central University of Technology, Free State

xi | P a g e
4.7. Chapter summary ...................................................................................................................................... 88
CHAPTER 5: RESEARCH METHODOLOGY........................................................................................ 89
5.1. Introduction ................................................................................................................................................ 90
5.2. Research epistemology ............................................................................................................................. 90
5.3. Research approach ................................................................................................................................... 91
5.4. Research Design ....................................................................................................................................... 91
5.5. Research process ...................................................................................................................................... 92
5.6. Target Population ...................................................................................................................................... 92
5.7. Sampling technique and sample size ........................................................................................................ 93
5.8. Designing the questionnaire ...................................................................................................................... 95
5.8.1. Contents of the questionnaire............................................................................................................. 96
5.8.2. Data collection .................................................................................................................................... 96
5.9. Credibility of the study ............................................................................................................................... 97
5.9.1. Validity ................................................................................................................................................ 97
5.9.2. Reliability ............................................................................................................................................ 98
5.10. Pilot study ................................................................................................................................................ 98
5.11. Ethical considerations .............................................................................................................................. 99
5.12. Data preparation ...................................................................................................................................... 99
5.12.1. Data cleaning ................................................................................................................................... 99
5.12.2. Data coding and entry ...................................................................................................................... 99
5.13. Data analysis ........................................................................................................................................... 99
5.14. Chapter summary .................................................................................................................................. 100
CHAPTER 6: FINDINGS AND DISCUSSION ...................................................................................... 101
6.1. Introduction .............................................................................................................................................. 101
6.2. Response rate ......................................................................................................................................... 101
6.3. demographics .......................................................................................................................................... 101
6.3.1. Gender composition of respondents ................................................................................................. 103
6.3.2. Age composition of respondents ...................................................................................................... 104
6.3.3. Educational status ............................................................................................................................ 105
© Central University of Technology, Free State

xii | P a g e
6.3.4. Number of years in business ............................................................................................................ 105
6.3.5. Racial composition ........................................................................................................................... 105
6.3.6. Number of employees ...................................................................................................................... 106
6.3.7. Value of assets ................................................................................................................................. 106
6.3.8 Agro-business activities ..................................................................................................................... 106
6.4. Construction of composite scores ............................................................................................................ 106
6.5. Reliability ................................................................................................................................................. 107
6.6. Test for normality ..................................................................................................................................... 108
6.7. The status and level of productivity of agro-processing firms operating in Mashonaland central province in
Zimbabwe (Mashonaland) and Free State province (South Africa) ................................................................ 109
6.7.1. Financial productivity ........................................................................................................................ 109
6.7.2. Non-financial productivity ................................................................................................................. 113
6.7.3. Output productivity levels ................................................................................................................. 114
6.7.4. Productivity output per hectare ......................................................................................................... 116
6.7.5. Capacity utilisation output per hectare ............................................................................................. 118
6.7.6 Market productivity-growth ................................................................................................................ 120
6.7.7 Market productivity-reputation ........................................................................................................... 122
6.8. The level of competitiveness and quality of products of agro-processing firms in Mashonaland and Free
State region .................................................................................................................................................... 124
6.8.1. General market competitiveness ...................................................................................................... 125
6.8.2 Customer satisfaction of agro-processing firms ................................................................................ 127
6.8.3. Market price competitiveness ........................................................................................................... 130
6.8.4 Market domination ............................................................................................................................. 132
6.8.5. Product quality .................................................................................................................................. 134
6.8.6. Promotion ......................................................................................................................................... 136
6.8.7. Organisational competitiveness........................................................................................................ 138
6.9. The relationship among technology transfer, financial and non-financial productivity of agribusinesses in
Mashonaland Central Province (Zimbabwe) and Free State Province (South Africa) .................................... 140
6.10. Impact of technology transfer and innovation on the productivity of small scale agro-processing firms in
the two regions ............................................................................................................................................... 142
© Central University of Technology, Free State

xiii | P a g e
6.11. Chapter summary .................................................................................................................................. 147
CHAPTER 7: CONCLUSION AND RECOMMENDATIONS ................................................................ 149
7.1. Introduction .............................................................................................................................................. 150
7.2. Conclusion ............................................................................................................................................... 150
7.2.1. Research question 1 ........................................................................................................................ 150
7.2.2. Research question 2 ........................................................................................................................ 152
7.2.3. Research question 3 ........................................................................................................................ 154
7.2.4. Research question 4 ........................................................................................................................ 154
7.2.5. Research question 5 ........................................................................................................................ 155
7.3. Recommendations for policy and practice ............................................................................................... 155
7.3.1. Creation of agro-business technology transfer information centres and innovation platforms ......... 155
7.3.2. Need to amend land ownership policies ........................................................................................... 156
7.3.3. Need for the government to review policy on local agriculture related research and development
activities...................................................................................................................................................... 157
7.3.4. Promote technology transfer and innovation .................................................................................... 157
7.3.5. Encourage all stakeholder involvement in agricultural technology transfer initiatives ...................... 158
7.3.6. Financial support for small-scale agro-processing businesses ........................................................ 158
7.4. Implications for future studies .................................................................................................................. 159
7.5. Limitations ............................................................................................................................................... 159
7.6. Contribution of the study .......................................................................................................................... 160
7.6.1. Theoretical contribution .................................................................................................................... 160
7.6.2. Practical contribution ........................................................................................................................ 162
7.7. Chapter summary .................................................................................................................................... 164
REFERENCES .................................................................................................................................... 165
APPENDIX A ....................................................................................................................................... 197
APPENDIX B ....................................................................................................................................... 198
APPENDIX C ....................................................................................................................................... 210
© Central University of Technology, Free State

xiv | P a g e
© Central University of Technology, Free State

xv | P a g e
LIST OF TABLES
Table 3.1: Levels of dominance in the South African agricultural Sector .............................................................. 64
Table 3.2: Crop Production and Livestock in Vietnam .......................................................................................... 61
Table 5.1: Sample size selection guide ................................................................................................................. 95
Table 6.1: Demographic details of respondents .................................................................................................. 102
Table 6.2: Reliability test results ......................................................................................................................... 107
Table 6.3: Normality test results .......................................................................................................................... 109
Table 6.4a: Status and level of financial productivity (Zimbabwe) ...................................................................... 110
Table 6.4b: Status and level of financial productivity (South Africa) ................................................................... 112
Table 6.5a: Status and level of non-financial productivity (Zimbabwe) ............................................................... 113
Table 6.5b: Status and level of non-financial productivity (South Africa) ............................................................ 114
Table 6.6a: Status and level of output productivity (Zimbabwe) .......................................................................... 115
Table 6.6b: Status and level of output productivity (South Africa) ....................................................................... 116
Table 6.7a: Level of productivity output per hectare (Zimbabwe) ....................................................................... 117
Table 6.7b: Level of productivity - output per hectare (South Africa) .................................................................. 118
Table 6.8a: Level of capacity utilisation - output per hectare (Zimbabwe) .......................................................... 119
Table 6.8b: Level of capacity utilisation-output per hectare (South Africa) ......................................................... 120
Table 6.9a: Status and level of market productivity-growth (Zimbabwe) ............................................................. 121
Table 6.9b: Status and level of market productivity-growth (South Africa) ......................................................... 122
Table 6.10a: Status and level of market productivity-reputation (Zimbabwe) ...................................................... 123
Table 6.10b: Status and level of market productivity-reputation (South Africa) ................................................... 124
Table 6.11a: Status and level of general market competitiveness (Zimbabwe) .................................................. 126
Table 6.11b: Status and level of general market competitiveness of South African agro-processing firms ........ 127
Table 6.12a: Status and level of customer satisfaction (Zimbabwe) ................................................................... 129
Table 6.12b: Status and level of customer satisfaction (South Africa) ................................................................ 130
Table 6.13a: Status and level of market price competitiveness (Zimbabwe) ...................................................... 131
Table 6.13b: Status and level of market price competitiveness (South Africa) ................................................... 132
Table 6.14a: Status and level of market domination (Zimbabwe) ....................................................................... 133
Table 6.14b: Status and level of market domination (South Africa) .................................................................... 134
Table 6.15a: Level of product quality (Zimbabwe) .............................................................................................. 135
Table 6.15b: Level of Product quality (South Africa) ........................................................................................... 136
Table 6.16a: Status of promotional activities (Zimbabwe) ................................................................................... 137
Table 6.16b: Status of promotional activities (South Africa) ................................................................................ 138
Table 6.17a: Level of organisational competitiveness (Zimbabwe) ..................................................................... 139
Table 6.17b: Level of Organisational effectiveness (South Africa) ...................................................................... 139
Table 6.18: Correlation among technology transfer, financial and non-financial productivity .............................. 141
© Central University of Technology, Free State

xvi | P a g e
Table 6.19: Relationship among financial productivity, non-financial productivity, technology transfer and
innovation ............................................................................................................................................................ 143
Table 6.20a: Regression analysis results of innovation and technology transfer predicting financial productivity
(Zimbabwe) ......................................................................................................................................................... 144
Table 6.20b: Regression analysis results of innovation and technology transfer predicting financial productivity
(South Africa) ...................................................................................................................................................... 144
Table 6.21a: Regression analysis results of innovation and technology transfer predicting non-financial productivity
(Zimbabwe) ......................................................................................................................................................... 145
Table 6.21b: Regression analysis results of innovation and technology transfer predicting non-financial productivity
(South Africa) ...................................................................................................................................................... 146
Table 6.22a: Regression analysis results of innovation and technology transfer predicting competitiveness
(Zimbabwe) ......................................................................................................................................................... 147
Table 6.22b: Regression analysis results of innovation and technology transfer predicting competitiveness (South
Africa) .................................................................................................................................................................. 147
© Central University of Technology, Free State

xvii | P a g e
LIST OF FIGURES
Figure 2.1: The Contingent Effectiveness Model of technology transfer ............................................................... 28
Figure 3.1. Henderson-Clark model ...................................................................................................................... 57
Figure 4.1: Agricultural productivity in Brazil ......................................................................................................... 80
Figure 4.2: Trends in South Africa’s agricultural yields ......................................................................................... 83
Figure 4.3: Agriculture production statistics 1990-2014 ........................................................................................ 85
Figure 4.4: Agricultural productivity in Zimbabwe .................................................................................................. 87
Figure 7.1: Relationship between technology transfer, innovation, productivity and competitiveness ................ 164
© Central University of Technology, Free State

1 | P a g e
CHAPTER 1: ORIENTATION OF THE STUDY
1.1. INTRODUCTION
1.2. IMPORTANT TERMS
1.2.1. Technology transfer
1.2.2. Innovation
1.2.3. Productivity
1.2.4. Compeitiveness
1.2.5. Agro-businesses
1.3. PROBLEM BACKGROUND
1.4. PROBLEM STATEMENT
1.5. AIM OF THE STUDY
1.6. RESEARCH QUESTIONS
1.7. OBJECTIVES
1.8. SIGNIFICANCE OF THE STUDY
1.9. LIMITATIONS OF THE STUDY
1.10. DELIMITATION OF THE STUDY
1.11. CHAPTER SUMMARY
© Central University of Technology, Free State
2 | P a g e
1.1. Introduction
This comparative study examines status and impact of technology transfer and innovation on the
productivity and competitiveness of small-scale agro-processing firms in Zimbabwe focusing on
Mashonaland Central region in Zimbabwe and the Free State region in South Africa. The pre-occupation
of this study with technology transfer and innovation to optimise the productivity of agro-processing firms
in the two countries derives from growing food crises and persistent food insecurity that has led to growing
humanitarian aid in Zimbabwe. Although the Free State region has not been aid-dependent like
Mashonaland Central and other rural parts of Zimbabwe, the recent cycles of droughts in the Free State
region have also threatened the food security situation in this South African region.
Zimbabwe’s agro-business activities show signs and symptoms of severe stress - judging from declining
production levels, failure to meet domestic consumption demands and international production quality
standards, increasing food imports all compounded by structural changes in land ownership and
agricultural reform. Makate, Wang, Makate and Mango (2016) note that the switching of Zimbabwean
agro farmers from food crop production to cash crops such as tobacco, cotton and sunflowers has
contributed to the decrease in national food production, which has contributed to growing food insecurity.
In addition, climate change has also exacerbated the frequency of droughts, with 1.3 million people in
food insecurity situation in 2016. The production of maize, the staple crop of Zimbabwe, has also declined
to 833.000 tons in 2016 from 2 million tons previous harvested before the year 2000 land reform
programme. In South Africa, national maize production has retained a constant output of 8.9 to 10 million
tons yearly, which is a cause for concern amid the continuous increase in the South Africa population.
Thornton (2010) notes that in emerging economies, farmers are becoming more vulnerable to poverty
due to global trends such as declining agricultural commodity prices and consumer prices; increasing
gaps between farmers’ prices and consumer prices; the changing patterns of food demand; and global
changes in agro food system. These challenges point to the rapid changes in the agro-processing sector
- including the need for lasting solutions to declining productivity, competitiveness, profitability and
sustainability of agro-processing firms in emerging economics such as Zimbabwe and South Africa.
In South Africa, agriculture contributes 12% of Gross Domestic Product (GDP), which is a substantial
contribution to the national economy. While the country produces enough food to meet local demand at
national level with more than 40% of total population depending on agriculture, the continuous increase
in urban and rural population presents a real food security threat to the country unless agro-processing
industries change their production systems and processes especially through technology transfer and
© Central University of Technology, Free State
3 | P a g e
innovation. Despite the prevalence of major drivers of agricultural productivity and research and
development in agriculture in South Africa such as Agriculture Research Council, Ministry of Agriculture,
Fisheries and Forestry, other agricultural institutes and universities, food insecurity remains a perennial
feature of some rural, peri-urban and urban informal settlements of the country. Sasson (2012) states
that in South Africa, food shortage and insecurity are linked to overpopulation, natural disasters,
persistent climate and weather conditions, water shortages, low food production and poor food
distribution.
In view of these global sustainability challenges, therefore, technology transfer through acquisition of
agro-processing machinery, tools and equipment could be a necessary driver and prerequisite for the
successful expansion of the agricultural sector and increased productivity of the agro-processing firms in
South Africa. There is growing evidence on the capacity of technology transfer to increase overall
agricultural productivity and quality of life (Collier & Dercon, 2014) and contribute to the achievement of
the Millennium Development goals of increasing the general level of food production, meeting food and
nutritional requirements as well as poverty requirements (Juma, 2015). Recently, technology transfer has
also been credited with impacting the agricultural productivity of small-holder farmers substantially (Njeru,
2016).
South Africa’s early technology transfer scenario is unique as it is founded on protectionism, self-
sufficiency and self-containment during Apartheid and immediately after independence in 1994. Mungai
(2015) notes that until early 1998, the South African government regulated and controlled the marketing
and production of most agricultural goods in the country while the country remained isolated from the
global market. After independence and the integration of the country into the global economy, the
government formulated a new policy of rural agriculture development through promoting technology
transfer and globalisation. Although anecdotal evidence tends to connect technology transfer to the
success of agro-business activities, what remains under-explored in literature is the nature and exact
impact of technology transfer and innovation on the productivity and competitiveness of agro-processing
products in emerging economies such as South Africa and Zimbabwe.
A study on commercial agriculture in Africa conducted by the World Bank (2017) compared costs of
producing agricultural products such as maize, rice, wheat and cassava in countries in South East Asia
and Latin America such as Thailand and Argentina with that of Africa countries such as South Africa,
Mozambique, and Nigeria. This study reported that the availability and application of technology transfer
and innovation research presented opportunities for high productivity, high profitability and high
© Central University of Technology, Free State
4 | P a g e
competitiveness of agro-business firms. The study also confirmed inverse relationship when technology
and innovation were not availed. Yet factor-driven economies such as Zimbabwe and efficiency-driven
economies like South Africa must be compared in view of their geographical proximity and some shared
climatic characteristics to establish variations and similarities in relationships between these variations
and basis for vertical and horizontal integration and international agricultural cooperation.
1.2. Important terms
The terms that are fundamental to this investigation, are technology transfer, innovation, competitiveness,
productivity and agribusiness. In view of their multiple definitions and characterisations, these terms
require sufficient attention as attempted in subsequent sections of this study.
1.2.1. Technology transfer
Technology straddles multiple disciplines, sectors and industries and hence, a broad definition is more
appropriate than a narrow, prescriptive one. Lunogelo and Baregu (2013) characterise technology
transfer broadly as a process of knowledge creation and application, knowledge mobilisation and
exchange, information search and transformation. It denotes the movement of knowledge and skills from
the laboratory to industry, firms, and organisations and from one application in one domain to another
(Phillips, 2002).
Dogra, Garg and Jatav (2013) adopt a location-specific definition of technological transfer in which it is
conceived as a process whereby technology is moved from one physical or geographical location to
another for the purpose of application. As such, the process of technology transfer in agro-processing
firms can take the form of training and education - in particular farming methods, processes, skills. This
ensures that stakeholders and participants acquire agriculture knowledge and information through
participation and involvement in agro business activities.
The impact of technology transfer on the productivity of small-scale agribusiness can be conceived from
multiple theoretical perspectives, namely Neo-classical theory, Traditional Liberal theory and Industrial
Development Theory. In this comparative study of South Africa (Free State) and Zimbabwe
(Mashonaland) all theories are going to be considered but a major focus will be on traditional liberal
theory, which ensures cooperation, partnership and complementation of government and private sector
in promoting agriculture technology transfer and innovation.
© Central University of Technology, Free State
5 | P a g e
1.2.2. Innovation
There is no single definition of innovation because it ranges from the implementation of something new
to improvements in products (goods or services), processes, marketing or organisational methods.
Gholami, Asli, Shirkouhi and Noruzy (2013) perceive innovation as the application of new knowledge to
productive or organisational processes. It comes about when society takes ownership of knowledge,
ideas, practices and technologies, translating them into a change that is useful and beneficial to
productive or organisational life. In other words, it means applying knowledge, ideas or practices that are
new to a particular context with the purpose of creating positive change that will provide a way to meet
needs, and take on challenges or seize opportunities. Such novelties and useful changes could be
substantial (i.e. a large change or significant improvements) or cumulative (small changes that together
produce a significant improvement). An innovation system consists of a wide array of public and private
organisations, firms and individuals that demand and supply codified or tacit knowledge and technical,
commercial and financial competencies. It also includes the rules and mechanisms by which these
different stakeholders interact and relate to one another in social, political, economic and institutional
settings (World Bank, 2017).
Innovativeness reflects a business’ willingness and ability to create new products or services for its
customers. Studies report that innovation leads to business competitiveness and success (Verhees &
Meulenberg, 2004; Cillo, De Luca & Troilo, 2010; Rubera & Kirca, 2012). While some literature affirm the
positive relationship among innovativeness and technology transfer and productivity, it was very low to
moderate (GEM Reports 2012, 2013) and the level of innovativeness in South African business is
unfortunately on a very low to moderate scale. However, other studies report higher levels of high
technology transfer and innovation in South African agricultural firms - depending on the province or
region (Agbobli, 20113; Agbotame, 2015).
Innovation focuses on the creation of a new product or service for customers allowing the business to
grow and increase its profit levels. Innovation can be defined as the concretisation of an initial idea for a
new product development or product improvement (Okanga, 2017). However, others describe innovation
as a combination of invention based on creativity and commercialisation of the invention. In this study,
innovation is centred on the introduction of new ideas in small agro business farming techniques.
Classifications of innovation include radical (disruptive) innovation, which involves dramatic
breakthroughs in ideas or process; reorganisation requiring enormous resources or capital investments.
Incremental innovation focuses on the introduction of new products or processes gradually using
© Central University of Technology, Free State

6 | P a g e
relatively smaller amounts of resources (Kuratko, 2009, Toner, 2011). Large investments in agro-
businesses may contribute to radical innovations, while incremental innovations are normally
implemented by small businesses or already existing knowledge platforms with minor deviations from
already existing knowledge. This research study takes cognisance of the classification of innovation as
either incremental or radical processes of change.
1.2.3. Productivity
Productivity relates to the outcome of production, which covers various aspects like output, profit
generation, expansion of markets including improved systems of production. In the Zimbabwe agriculture
sector where low levels of capital endowments are involved, there is restricted uptake of farm technology,
which results in low productivity in terms of crop yields and outputs (Moyo, 2014).
One dimension of productivity is the equation of inputs and outputs. As such, Syverson (2011) argues that
productivity performance is a reflection of relative growth of factors such as inputs and outputs. The
growth of output can be measured with the sum of input elasticity’s equals to 1 (i.e. constant returns are
assumed). This calculation leaves total factor productivity as residual, which is the difference between
output growth and capital labour growth. The growth of the equation is manipulated through intervention
mechanisms to effect changes in labour and production productivity.
1.2.4. Competitiveness
The President’s Congress Report (2016) defines agricultural competitiveness as the ability of agricultural,
agribusiness and agro-industrial concerns to produce and offer products that meet the quality standards
of the local and world markets at prices that are competitive and provide adequate returns on the
resources employed or consumed in producing them. It describes the ability to compete or sell in the
competitive marketplace and underlies the agro-processing’s growing ability to achieve a better price
result in competitive markets globally. Whether measured by amount of output or reduced level of inputs,
increased competitiveness requires increased productivity, marketability and price received.
The Africa Competitiveness Report (2015) recommends application of the Global Competitiveness Index
(GCI) when measuring firm competitiveness of a country. The GCI defines competitiveness as the set of
institutions, policies, and factors that determine the level of productivity of a country. The current and
future levels of productivity, in turn, set the sustainable level of prosperity an economy realises in the
medium to long term. The measurement of competitiveness is a complex undertaking. To address this
complexity, the distinct pillars of the GCI affirms the idea that diversity matters for competitiveness. These
© Central University of Technology, Free State
7 | P a g e
include public and private institutions, infrastructure, the macroeconomic environment, health and primary
education, higher education and training, goods market efficiency, labour market efficiency, financial
market development, technological readiness and market size.
There are two possible ways of measuring competitiveness. The first involves measuring production
costs, profitability, and productivity. This measurement is based on production output volumes, yields,
unit prices; levels of exports; private investment in the agricultural sector; levels of value addition; and
the ability to lower costs and increase input of productivity. Generally, an increase in competitiveness
happens when a firm lowers its costs relative to those incurred by rival firms. Similarly, high levels of
investment (both domestic and foreign) and rising yields coupled with sustained high productivity are
indications of competitiveness. The second method measures trade-related competitiveness using real
exchange rates, comparative advantage indices, and export or import indices. If a country can fetch high
prices for its agricultural commodities, and is able to maintain or increase its market share of that
particular commodity in the world market, it is generally understood to be competitive in that particular
commodity or industry.
1.2.5. Agro-businesses
The diverse range of agro-processing activities in Zimbabwe and South Africa complicates the
development of a single universal definition of agribusiness for these countries. Gandhi (2014) defines
agribusiness as all market and private business-oriented entities involved in the production, storage,
distribution, and processing of agro-based products; in the supply of production inputs; and in the
provision of services, such as extension and research.
Louw (2007) defines agribusinesses as industries from suppliers of inputs and services to producers, to
processors and markets of agricultural products, manufacturers, exporters, retailers, the distribution
systems and to consumers. It suffices to say that agribusinesses are directly and/or indirectly connected
to primary agriculture as well as to value-adding enterprises further down the agricultural value chain. In
most Southern African countries, agribusinesses and agricultural sectors are critical for economic growth
and poverty eradication as a large portion of the poor population depends on agricultural production for
their livelihoods. It also plays a major role in industrial, urban and regional development as it contributes
to the gross domestic product, and promotes exports and stimulates wider investments in the economy.
This helps to increase food security through the provision of food, improves employment creation,
generation and redistribution of income and improvement in the standard of living. As such, agriculture
offers the best hope of initiating national economic growth.
© Central University of Technology, Free State

8 | P a g e
South Africa plays a dominant role in Africa, particularly in the Southern African region. The South African
economy contributes about 20% of the continent’s GDP and about 40% and 70% of the output of sub-
Saharan Africa and Southern Africa respectively (Louw, Nhemachena & van Zyl, 2008). There is no doubt
as Louw et al. (2008) state, that agribusinesses are important stakeholders in the agricultural supply
chain in Southern Africa as major receivers, processors of and marketers of agricultural products, as well
as suppliers of production inputs and services. Therefore, the agribusiness sector is important vehicle for
economic growth and poverty eradication in Africa and the Southern African region.
This scholar contends that there has been positive growth in agro-business in South Africa due to
changes in agricultural markets. Louw et al. (2008) affirm that Southern Africa has experienced erratic
growth and transformation in agricultural markets and restructuring of food marketing chains from
traditional markets, with the entry of new major players, such as supermarkets and convenience stores,
in urban centres. Factors such as globalization, trade liberalization (increases in migration, urbanization
and the emergence and growth of the economic middle class), information and technological changes
and improvements in quality standards were and are still the driving forces of change in the agribusiness
sector. There has been a substantial increase in large retailers and processors in the agribusiness supply.
Khan (1995) identifies two types of agro-based businesses; firstly, those that are engaged in the
processing of agro products; and secondly, those that are engaged in the processing and production of
a number of agricultural inputs. These characterisations include firms that produce agricultural inputs
such as farm machinery, agricultural inputs, fertilizers, seeds and other modern inputs including
businesses engaged in the supply of these inputs to farmers, all of which will be considered in this study.
The Ministry of Agriculture, Forestry and Fisheries in the Free State Province in South Africa has an
estimated 240 000 small-scale agribusinesses, while the Mashonaland Province in Zimbabwe has an
estimated 50 0000 small agribusinesses.
In view of the definitions and characterisations of agri-businesses, this research conceives agro-based
firms as business entities or industries that add value to agricultural raw materials, both food and non-
food, through their processing, marketing, usability or being edible, while enhancing the income and
production of agriculture products in African countries. In South Africa and Zimbabwe, as in the EU, the
characterisation of these firms approximates small businesses called small, micro and medium
enterprises (SMMEs) (Makanyeza & Dzvuke, 2015). For the purpose of this study, the South African
definition of small business, which generally implies businesses with not more than 200 employees, is
applied because the study is focused on South Africa and Zimbabwe, of which Zimbabwe has a definition
© Central University of Technology, Free State

9 | P a g e
which is closer to the South guideline on SMMEs. In addition, the terms small businesses and SMMEs
are used interchangeably to mean the same business category in Africa.
Suffice to say, all these small agro-processing firms engage in processing and value addition. However,
it is important to distinguish between these two terms that are often confused namely, “processing” and
“value addition”. “Processing” entails changing the form of a product, while “value addition” implies
addition of value to a product after which a buyer is willing to pay a higher price for the product that
compensates for the cost of the inputs used in the process. However, value can be added to products
without changing their physical form and cleaning, grading or labelling are examples of such value
addition. To an extent that a product undergoes some process, say grading, then value addition does
involve processing, even though the physical form of the products does not change (Department of
Agriculture, Forestry and Fisheries [DAFF], 2012).
1.2.6. Knowledge transfer capacity
This emphasises the creation of tacit knowledge and the ability to transfer the knowledge (that is,
efficiency in its transmission to a different user). Just as firms and their business units possess differing
abilities to create knowledge, they also differ in their ability to transfer knowledge (Kogut & Zander, 1993;
Szulanski, 1996).
Conceptually, knowledge creation and transfer of skills are separate dimensions. Again, some firms may
be simultaneously strong at creating and transferring knowledge. All knowledge transfer events involve
both a source, or transferor, and a recipient, or transferee (Szulanski, 1996; Paulin & Suneson, 2012).
This comparative study of South Africa and Zimbabwe refers to a transferor’s ability to transfer knowledge
effectively as source transfer capacity. It defines source transfer capacity (STC) as the ability of a firm (or
the relevant business unit within it) to articulate uses of its own knowledge, assess the needs and
capabilities of the potential recipient thereof, and transmit knowledge so that it can be put to use in
another.
Arrigo (2012) states that external knowledge is increasingly critical to the creation of new technology.
With today’s competitive landscape, there is a need to secure knowledge in a flexible way to
accommodate new technology developments, changing market conditions, new agro-business financing
such as corporate venture capital investments, equity technology alliance, joint ventures, minority holding
mergers and acquisitions to fund external knowledge in technology transfer.
© Central University of Technology, Free State
10 | P a g e
1.3. Problem Background
South Africa is dual agriculture economy with both well-developed commercial and small subsistence
producers. The country has a population of 54 million, contributes about 40% of Gross National Income
of sub-Saharan Africa. The Free State Province is the fourth largest of South Africa’s provinces
representing 10.6% of agriculture arable land. The traditional breadbasket of South Africa with extensive
commercial farmers is Free State and Western Cape with three quarters of maize and wheat being
produced in these areas. Genetically modified agriculture produce are allowed in South Africa causing
threat to sustainable farming due exotic chemicals such as pesticides, herbicides. This also resulted in
the 2007 ban on South African inorganic food crops exports to European Union countries giving rise to
global uncompetitive agriculture production and agro-business status that needs to be assessed in this
study.
At face value, the South Africa and Zimbabwean government failed to transform the configuration of
nature of the inherited settler agricultural systems bequeathed by colonial regimes, in particular, the
colonial settler agriculture, which had differentiated mechanized systems and support. In reality, Ngie
(2016) notes that the national story is different from that of the Free State, the breadbasket of South
Africa. The agriculture output levels have been preserved by over 50 000 commercial farmers and also
240 000 small-scale agro business famers who maintain comparatively high agriculture production levels.
However, such productivity is threatened continually by rising cost of inputs, oil prices, foreign currency
exchanges and water scarcity.
Zimbabwe has a population of 14 million with the Mashonaland region being the breadbasket of the
country, with most arable land in Zimbabwe. Before the land reform distribution programme, the
commercial farm sector owned 56% of the total arable land, while the subsistence sector owned 44%
nationally. However, the land reform programme resulted in an increase by area and numbers in
smallholder subsistence agriculture (74%) in relation to commercial agriculture - even though poor
farming methods have contributed to a decline in agriculture output and food insecurity (Toringepi, 2016).
In this research, the problem is that South Africa has a stagnant agriculture production level, which is a
concern given continuous population increase, which might lead to food insecurity. In contrast, Zimbabwe
has a declining agricultural output production. Although Zimbabwe is an agro-based economy with 30%
of its GDP coming from agriculture (Development Bank of Southern Africa Report, 2014), there has been
a sharp decline in agricultural output in the country, forcing the country to slide from being the “bread
basket of Southern Africa” (as it was called before 1990) to a “basket curse” to date. Notwithstanding the
© Central University of Technology, Free State
11 | P a g e
government’s propaganda about a thriving agricultural revolution and persistent use of droughts as
scapegoats for intermittent agricultural losses, there is sufficient evidence of agricultural strain and
contracting agricultural output in the country.
Bahta, Willemse and Grove (2014) outline that the Free State Province is one of nine provinces in South
Africa with a population of 2.8 million people, which is approximately 5.7% of the South African population.
The Free State has a surface area of 129 480 km2, which makes it the fourth largest province in South
Africa, covering 10.6% of the total area of the country. The Free State is subdivided into five district
council municipalities, namely Xhariep, Motheo, Lejweleputswa, Thabo Mofutsanyane and Fezile Dabi
(Northern Free State). These district councils comprise 20 municipalities (Speelman & Olifant, 2016). The
Free State is aptly referred to as the “breadbasket” of South Africa (Kanyane, 2006) because of its thriving
agricultural sector.
In analysing the literature on land reform in both Zimbabwe and South Africa, there has been a land
paradigm shift due to the history of colonialism and apartheid. Kloppers and Pienaar (2014) indicate that
South Africa’s government introduced land and agrarian reform in the constitution after the 1994
independence based on tenure reform, restitution and redistribution to distribute agriculture land. The
Broad Based Black Economic Empowerment (BBBEE) and Accelerated and Shared Growth Initiative
also supported these policy interventions. In the Zimbabwean scenario, Makunike (2014) highlights that
the government introduced various policies such as Economic Structural Adjustment Programme
(ESAP), Fast Track Land Reform programme, indigenisation and economic empowerment and
mechanisation of agribusiness and input scheme. The challenge, however, lies in funding and transfer of
technology to farmers for provision of farming knowledge and equipment to improve productivity levels in
the agriculture sector.
As far as agro-processing firms and agriculture in general is concerned, Duvenage (2013) suggests that
both governments and donors should shift from the aid approach to a developmental approach, which is
productive, profitable and sustainable. Consistent with the developmental approach, the South African
government embarked on Accelerated and Shared Growth Initiative to support the development of the
agriculture economy, while Zimbabwe’s efforts were hinged on the promotion of various social, political,
legal and economic development engraved in the current economic blueprint policy document named
Zimbabwe Agenda for Social Sustainable Economic Transformation (ZimAsset). However, the agriculture
reforms from both countries have been undermined by soaring global food price crises and, of late, global
economic recession.
© Central University of Technology, Free State

12 | P a g e
The Land Reform Programme in Zimbabwe resulted in smaller holder farmers and more than 4 million
hectares owned earlier by commercial farmers previously being transferred to small-scale farmers. The
involvement of small-scale agricultural farmers with limited experience in agricultural farming meant that
systematic planning of the institutional framework, relevant technology transfer, human capacity and skills
development, agricultural research and, agricultural inputs and financial services were needed to improve
their chances of scaling up productivity. Pienaar (2015) notes that South Africa also embarked on land
agrarian reform after independence, with the constitution providing legal foundation for state land reform
with three distinct components namely tenure reform, restitution and redistribution.
Accordingly, this study acknowledges the decline of agriculture production in Zimbabwe in the past
decade, which has led to an increase in humanitarian AID from Non-Governmental Organisations (NGOs)
in the country. Tawodzera (2010) highlights that the food crisis in Zimbabwe has been evidenced by the
government’s importation of maize from neighbouring countries such as Zambia, Malawi and South
Africa. More so, the Zimbabwe African National Union Patriotic Front (ZANU PF) government has also
requested humanitarian food aid from NGOs in various parts of the country due to persistent droughts.
At a continental level, Asante and Amuakwa-Mensah (2015) also provide a disturbing account of low
agricultural output and starvation because of persistent droughts and global warming leading to
escalating humanitarian assistance in sub-Saharan countries.
Dube and Sigauke (2015) also note that food insecurity in developing countries is an enormous challenge
- especially in the African and Asian continents. In rural communities, food insecurity is a perennial
problem that requires undivided attention to ensure household survival and sustainability. The failed
politics, climate change and weather extreme events in the agriculture sector and unclear government
policies operating in the agro-processing sector have increased food deficit in Zimbabwe. The importance
of rural irrigation schemes in addressing agricultural community development, increasing sustainable
household food security and ensuring health nutrition uptake are equally paramount. Rural irrigation
systems enable farmers to become net food sellers allowing them to benefit from food price volatility over
a period of time and seasons due to irrigation water availability. Therefore, it is uncontested that
smallholder farmers play a pivotal role in the global agricultural village as they account for a significant
amount of food produced and consumed in less developed countries. Despite smallholder farmers'
significant contribution to ensuring food security, they are faced with a host of challenges such as
increased population growth, lack of funding and climate change hindering their capacity to increase food
production.
© Central University of Technology, Free State

13 | P a g e
Dube and Sigauke (2015) suggest that in most developing countries such as Zimbabwe, climate change
has exacerbated the challenge of food insecurity by reducing crop yields and increasing production
variability. This challenge is also prevalent in the Sub-Sahara African region, which has low adaptive
capacity to climate change due to poor economic performance and technical incapacity - as indicated by
its overreliance on dry land farming. These challenges in the African region necessitate the adoption of
innovative technologies to ensure food security. Irrigation schemes represent one example of a critical
technology considered to enhance food production through efficient usage of water. Nhundu and
Mushunje (2010) and Dube and Sigauke (2015) indicate that irrigation farming is a critical industry that
increases per unit area food production leading to improvements in food availability and accessibility.
Crucially, irrigation and mechanisation are examples of crop technologies that can trigger sustainable
household economic performance and a broad spectrum of crop production as it facilitates the use of
fertilizers and adoption of high-yielding seed varieties that doubled yields between 1995 and 2001
(Hussain & Hanjra, 2004).
1.4. Problem Statement
Evidence of continual and increased humanitarian assistance by food aid organisations in Zimbabwe
after the land redistribution exercise shows signs of a distressed agriculture sector and growing food
security in the country. Toringepi (2016) notes Zimbabwe is now characterised by chronic food insecurity
and is entirely dependent on international food aid. The declining agriculture production and heightened
food insecurity in a country that used to be the food basket of Southern Africa is grave cause for concern
in the Southern African region, especially neighbouring South Africa, which has seen a growing number
of economic migrants from Zimbabwe permeating its porous borders.
The FAO (2012) highlightes that while food for human and commercial use should be between
1.825 million and 2 million tons of maize to ensure food security in the country, the nation has recorded
a decline to 800 000 tons and 350 thousand tons of wheat. While South Africa has recorded 8.9 million
tons of maize in 2012 and continues to sustain its agricultural output, the lack of significant increases in
production may threaten food security due to rapid population increases. Poor farming methods have
exacerbated low productivity, contributed to uncompetitive agricultural commodities on the global market
and reduced the viability and profitability of agribusinesses.
Khapayi and Celliers (2016) assert that smallholder farming in Zimbabwe is affected by dwindling maize
yields due to declining soil fertility and the negative effects of climate variability and change and soil
quality indicators such as infiltration. This highlights the need for technology transfer and greater
© Central University of Technology, Free State

14 | P a g e
innovation to allow for better resource utilisation, application of inputs, vibrant and efficient extension
services and ensure that land is used for specific purposes such farming, animal ranching or game
ranching to maximize land usage. Land uses such as extensive livestock production or game ranching
may be better and more profitable alternatives for farmers in these situations.
The evidence of sub-optimal agricultural competitiveness in Zimbabwe include contracting maize and
wheat outputs, plummeting of agricultural exports and rising maize imports from South Africa, a
ballooning import bill on agricultural foodstuffs (Department of Agriculture, Forestry and Fisheries [DAFF],
2017). A large spectacle has been the continual demand for food humanitarian assistance from
International food donor organisations in the country. The efforts by agro-processing firms at improving
agriculture production through agriculture technology transfer and innovation to correct this food crisis in
Zimbabwe should be explored to establish their impact on product and competitiveness in Zimbabwe.
While agro-processing firms in South Africa contribute 20% to agriculture production, their capacity to
harness technology transfer and innovation to contribute to increased food security in the country through
increased production and competitiveness has not been tested. While 80% of arable land is under
commercial agriculture, the majority of the 16% contribution of small agro-businesses in the Free State
comes from commercial agriculture. Therefore, the need to increase the profitability and productivity of
agro-processing firms in the Free State cannot be overemphasised. Greyling (2012) noted that South
Africa’s annual food production remained constant, which is a great concern in view of the increasing
food consumption and growing population. Therefore, the current trends in food production will not meet
the rising national demand resulting in growing food insecurity.
The challenge, therefore, is our limited understanding of the impacts of technology transfer and innovation
on small-scale agro businesses productivity and competitiveness in resource dependent and efficiency
driven economies. As the literature on technology transfer-productivity and innovation-productivity
relationships will show in the literature review chapters, the relationships between these variables have
been explored independently. This study fill this gap by exploring the influence of technology transfer and
innovation on the productivity and competitiveness of agro-processing agribusinesses, drawing on a
comparative study covering two agriculturally productive regions in Zimbabwe and South Africa.
1.5. Aim of the study
The aim of the study is to contribute to the development of sustainable agro-processing economies in
South Africa and Zimbabwe through the advancement of innovation and technology transfer knowledge.
© Central University of Technology, Free State
15 | P a g e
The study also endeavours to contribute to efficient and effective agro-processing firms through
promoting a paradigm shift that ingrains innovation processes and technology transfer into their in
production and marketing processes.
1.6. Research Questions
1 What is the status and level of productivity of small-scale agro-processing firms operating in
Mashonaland Central Province in Zimbabwe and the Free State Province in South Africa?
2 What is the level of competitiveness and quality of products of agro-processing firms in Mashonaland
and Free State provinces?
3 What is the relationship among technology transfer, profitability and productivity of agro-processing
firms in Mashonaland and Free State provinces?
4 Which variable (technology transfer or innovation) has a greater impact on the productivity of small-
scale agro-processing firms in these countries’ provinces?
5 How can a sustainable agro-processing production model be constituted to ensure effective and
efficient agro-processing business in Mashonaland and Free State provinces?
1.7. Objectives
1 To establish the status and productivity levels of small-scale agro-processing firms operating in
Mashonaland Central province in Zimbabwe and Free State province in South Africa.
2 To examine the level of competitiveness and quality of products of agro-processing firms in
Mashonaland and Free State provinces.
3 To establish the relationship between technology transfer, profitability and productivity of agro-
processing firms in Mashonaland and Free State provinces.
4 To explore which variable (technology transfer or innovation) has a greater impact on the productivity
of small-scale agro-processing firms in these countries’ provinces.
5 To develop a sustainable agro-processing production model for effective and efficient agro-
processing business in Mashonaland and the Free State.
1.8. Significance of the study
This research will contribute to the development of sustainable agribusiness model for small South
African and Zimbabwean firms through the utilisation of technology transfer and innovation. Sustainable
agriculture is considered critical to the alleviation of the growing food crisis and deteriorating food security
situation in both countries. The study will also contribute to literature on effective technology transfer
© Central University of Technology, Free State
16 | P a g e
knowledge based on the understanding of the impacts technology transfer on productivity and agriculture
competitiveness in the two countries.
Given the agro-based nature of the Free State economy, the development of best practices on innovation
and technology transfer in the agro-business sector will be relevant to the government’s discourses on
socio-economic empowerment through agriculture and productive use of indigenous resources. The best
practice model of technology transfer and innovation founded on these variables’ interaction with
productivity, quality and competitiveness can positively impact national economic development through
reducing the cost of production, the use of modern, efficient production methods, and viable agriculture
cost per unit among other considerations.
1.9. Limitation of the study
The determination and calculation of agricultural productivity represent one of the limitations of agro-
processing research. The researcher avoided inquiring about exact production and profit figures as these
would vary significantly as well as cause uneasiness in respondents. The researcher opted to use
classified ranges and frequencies to encourage respondents to respond. To increase the response rate,
the researcher also avoided asking direct questions - which might typically increase reluctance to
respond. Although the sample sizes were sufficient for making generalisations about the population in
both provinces, increasing the sample size in future studies may contribute to results that are more robust.
1.10. Delimitation of the study
The research covered two provinces in the two countries and, therefore, cannot generalise about the
agricultural processes at national levels. The generalisations made are restricted to the provinces
covered in this study.
The study was also specific in terms of the concepts examined, namely, technology transfer and
innovation. Despite the wider application of technology, the specific technology in question was
agricultural technology and not other high technologies applied in other industries and sectors.
1.11. Chapter summary
This chapter focused on the problem background, enunciated the research problem, and presented the
research questions, methodology, the significance and limitations of the study. The next chapter
reviews the literature on technology transfer.
© Central University of Technology, Free State
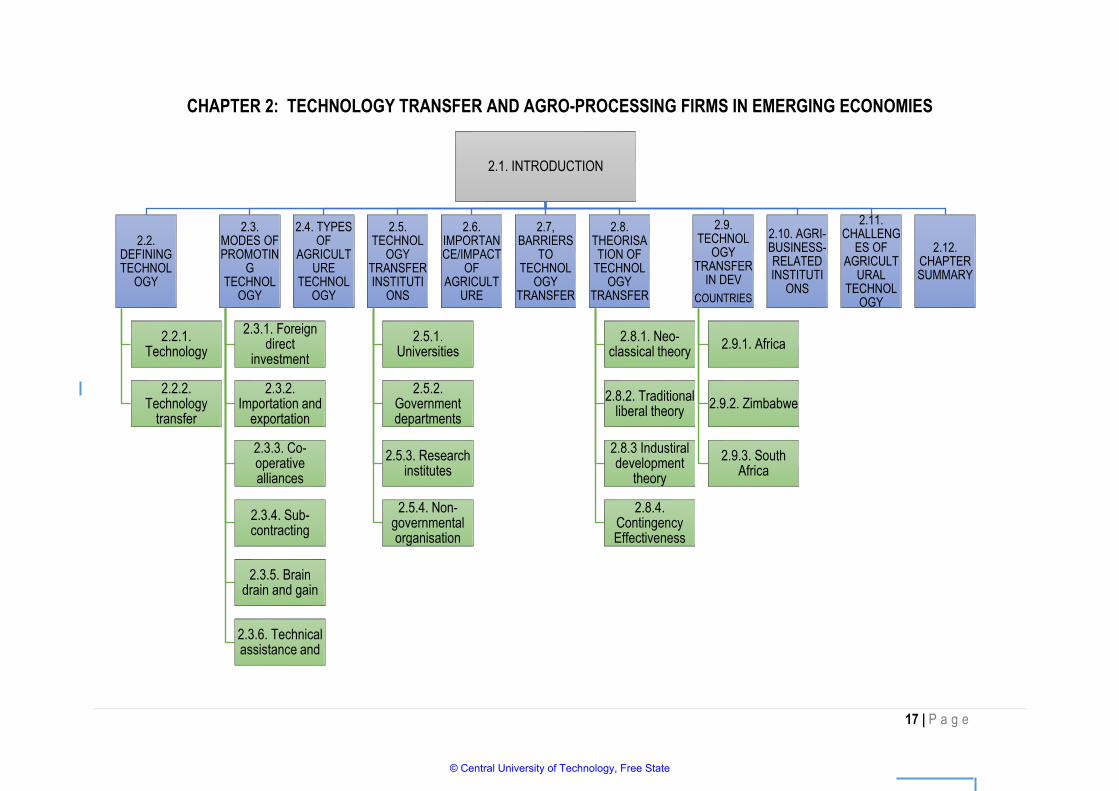
17 | P a g e
CHAPTER 2: TECHNOLOGY TRANSFER AND AGRO-PROCESSING FIRMS IN EMERGING ECONOMIES
2.1. INTRODUCTION
2.2. DEFINING TECHNOL
OGY
2.2.1. Technology
2.2.2. Technology
transfer
2.3. MODES OF PROMOTIN
G TECHNOL
OGY
2.3.1. Foreign direct
investment
2.3.2. Importation and
exportation
2.3.3. Co-operative alliances
2.3.4. Sub-contracting
2.3.5. Brain drain and gain
2.3.6. Technical assistance and
2.4. TYPES OF
AGRICULTURE
TECHNOLOGY
2.5. TECHNOL
OGY TRANSFER INSTITUTI
ONS
2.5.1. Universities
2.5.2. Government departments
2.5.3. Research institutes
2.5.4. Non-governmental organisation
2.6. IMPORTANCE/IMPACT
OF AGRICULT
URE
2.7, BARRIERS
TO TECHNOL
OGY TRANSFER
2.8. THEORISATION OF
TECHNOLOGY
TRANSFER
2.8.1. Neo-classical theory
2.8.2. Traditional liberal theory
2.8.3 Industiral development
theory
2.8.4. Contingency Effectiveness
2.9. TECHNOL
OGY TRANSFER
IN DEV
COUNTRIES
2.9.1. Africa
2.9.2. Zimbabwe
2.9.3. South Africa
2.10. AGRI-BUSINESS-RELATED INSTITUTI
ONS
2.11. CHALLENG
ES OF AGRICULT
URAL TECHNOL
OGY
2.12. CHAPTER SUMMARY
© Central University of Technology, Free State
18 | P a g e
2.1. Introduction
The introductory chapter presented an overarching narrative on the influence of technology transfer on
the productivity of small agro-processing businesses in South Africa and Zimbabwe. This chapter
augments the previous chapter by rendering an elaborate literature review on agricultural technology
transfer, one of the variables adopted in the current study. Notwithstanding the fragmented nature of the
extant literature on the transfer of agricultural technology particularly in the developing world, this chapter
attempts to present a comprehensive and synthesised literature covering the diverse facets of technology
transfer with specific reference to South Africa and Zimbabwe. The ensuing sections will render
comprehensive narrative of the theorisation and contextual application of technology transfer.
2.2. Defining technology and technology transfer
In spite of their currency and popular usage in diverse fields of study, the concepts, technology and
technology transfer are difficult to distinguish from each other due to the fluidity of their definitions and
lack of uniformity in their application. Nevertheless, in view of Gilsing, Bekkers, Freitas and Van der
Steen’s (2011) proclamation that ‘good science has to begin with good definitions’, this subsection
provides some definitions of technology and technology transfer to prevent confusion and misconceptions
arising from their use in this study.
2.2.1. Technology
There is no one single definition for the term technology as its conceptualisation and reference varies
with people’s diverse knowledge, skills, processes and systems - which leads to the flourishing of multiple
definitions. For instance, the International Code of Conduct on the Transfer of Technology (1985: chapter
1, para.1.2.) defines technology as “systematic knowledge for the application of a process that results in
the manufacture of a product or the delivery of a service.” This definition emphasises the practical
application of knowledge in situ irrespective of its scale, location and agent (i.e. the person applying or
transferring the knowledge). To Wahab, Rose and Osman (2012), technology relates to the theoretical
and practical knowledge, skills, and artefacts that can be used to develop products and services as well
as their production and delivery systems. Like the previous definition, an instrumental perspective is
foregrounded where technology is conceived as a means (i.e. tool and strategy) to realise socially
desirable ends rather than something pursued for its own sake. According to Wahab et al. (2012)
technology is embodied in products, processes, and managerial methods. Viewed from this perspective,
technology is perceived as a manufactured product or service ready for transfer from the producer to the
consumer. Collectively, the aforementioned definitions treat technology as the conversion of knowledge,
information, skills and artefacts into products, services, processes and methods that are conveniently
© Central University of Technology, Free State
19 | P a g e
reproducible and exchangeable. This form of technology constitutes the first category of technology,
namely technology as a public good or service.
However, technology can also encompass knowledge about particular applications that are not
conveniently produced, recyclable or transferable. To illustrate this point, some knowledge and technical
know–how can be generated by and secured within a particular organisation for internal usage, without
any specific intention for rolling them on a wider scale. Specialised technologies, which are specifically
developed for research and development, such as space aircrafts, advanced military technology (e.g.
long-range ballistic missiles) and genetically modified foods, may not have been developed with wide
scale commercialisation in mind, and they fall into this category. In this way, technology accumulates
within the confines of the institutions/organisations, beyond the reach of the general public. In this way,
technology is defined as firm-specific knowledge and techniques whose production and transfer would
involve an initial learning process by the acquiring party (Mateso, 2014).
Other definitions characterise technology as either software, hardware or ideas relevant to practical
problem solving within society (Hämäläine, De Wever, Malin & Cincinnato, 2015). This definition is
suitable for the agro-processing firms as it encompasses all complementary aspects that are utilised in
the production of goods with market value. Examples of such technology include new crop varieties,
manufactured inputs, machinery, management techniques and agricultural training. The outcome of the
effective adoption of a particular technology in agricultural institutions and societal settings is improved
productivity. Having defined technology, it is logical to unravel the meaning of technology transfer.
2.2.2. Technology transfer
Like the concept of technology, defining technology transfer (TT) is a complicated task given its multi-
faceted and multi-disciplinary nature (Bozeman, Rimes & Youtie, 2015). A survey of extant literature
reveals that the concept has received scholarly attention from diverse fields of study including economics,
agriculture, science, management and engineering among others (Reddy, 2015). As a consequence of
this popularity, the concept has rapidly evolved and attracted multiple characterisations, reflecting the
diverse disciplinary research origins.
In separate studies, Longo, Clark, Shriver and Clausen (2016) contend that in view of the diversity of
research fields that have addressed the technological transfer concept, three broad categories of
definitions emerge from literature, namely economics/management/business-related, sociology-related
and anthropology-related definitions. The scholars observe that the economics and other business-
© Central University of Technology, Free State
20 | P a g e
related characterisations directly link TT to a nation’s economic growth (Audretsch, Lehmann, Paleari &
Vismara, 2016). Thus, such economics/management/business-related definitions explain TT in terms of
aspects of production and design and hence emphasise appropriate versus inappropriate technology
transfer, labour versus capital-intensive technology transfer, and small-scale versus large-scale
technology transfer.
Sociology-based definitions make a connection between TT and diffusion of innovations in society/social
systems (Hornung, 2014). In essence, they focus on how TT affects the members of a social system’s
ability to cope with modernity and the change that accompanies it. Even though Roger’s (1962) Diffusion
of Innovation Theory has a strong technological inclination and has been applied extensively in
technological studies, it falls squarely in this category.
Another variant of TT categorisation is the anthropological perspective, which depicts how technology
influences the pattern of culture and way of life of humans within a particular social system (Bozeman,
2000; Abidin, Hasnan, Abdullah, Mohtar & Zulhumadi, 2013). The use of indigenous technologies and
knowledge systems to preserve agricultural products (Derbile, 2013) and the integration of indigenous
knowledge systems, artificial intelligence and information and Communication Technology (ICTs) to
develop drought prediction software applications (Masinde, 2015) fall into this category. One definition of
TT that fall into this category is a process of knowledge creation and application, knowledge mobilisation
and exchange of information (Lunogelo & Baregu, 2013) within particular socio-economic and cultural
contexts. The central point here is that technology transfer does not unfold in a vacuum, but evolves in a
specific situated context.
From an institutional perspective, this study defines technology transfer as “the process of movement or
transfer of information, technical know-how and people among corporate technical functions such as
research and development (R&D), engineering, manufacturing and non-technical functions such as sales
in order to yield innovative products and services that meet corporate business goals and fulfil customer
needs” (Henry, Kneller & Milner, 2009: 238). This definition postulates that although the outcomes of TT
such as innovative products and services can be inter-organisational and of social nature, the
organisations remains the main source and incubator of technology. From a societal perspective,
however, TT involves the sharing or introduction of technology from one country to another followed by
the spread or expanded utilization of the new technology, generally proceeding from central points to the
periphery (Masum, Lackman & Bartleson, 2013). This definition advances the international diffusion of
technology, even though it acknowledges the centrality of origin. This modernist perspective, however, is
© Central University of Technology, Free State
21 | P a g e
problematic to the extent that it fails to acknowledge the reverse flow of technology - from the periphery
to the centre.
In view of the foregoing discussion on institutional and society-centred perspectives on TT, the current
study adopts the following operational definition of TT as: the movement of organisational scientific
knowledge, skills, expertise and artefacts from the manufacturing organisation/partner (individuals,
institutions and enterprises) to enhance the receiving partner’s knowledge, expertise and competitive
position to meet society’s developmental needs such as improved agricultural practices, increased
productivity, and better management practices.
2.3. Modes of promoting technology transfer
Technology transfer in agriculture and rural development, a primary vehicle for elimination of inequality
and poverty mainly in the rural areas, is achieved through various means. These methods are as follows:
foreign direct investment (FDI), joint ventures and licencing; import and export of capital goods; co-
operative alliances; sub-contracting; brain drain/gain; and technical assistance and co-operation. These
are briefly discussed below.
2.3.1. Foreign direct investment, joint ventures and licensing
According to Hall (2014), foreign direct investment (FDI) relates to resource commitments made outside
the home country of the investor but inside the investing company. The resource commitments include
but are not limited to fixed assets, capital, technology, management skills, access to markets and
entrepreneurship. The investor retains ownership and has greater control over the use of the invested
resources. The activities of multinational companies such as FDI and other forms of investment remain
a key mechanism for technology transfer - particularly in developing countries which are still
industrialising (Iwasaki & Tokunaga, 2016). The significance of licensing as key form of technology
transfer can be noted through the receipts generated by transnational companies from licence fees and
royalties of disembodied technologies (Hall, 2014). In efficiency-driven economies with less stringent
monetary systems such as South Africa, foreign investors could opt for portfolio investments compared
to FDI, which are comparably less movable. That said, in this country, both FDI and portfolio investments
tend to flourish due to a more sophisticated financial and economic infrastructure compared to Zimbabwe.
© Central University of Technology, Free State
22 | P a g e
2.3.2. Importation and exportation of capital goods
Capital goods generally have some technological content that is regionally transferred each time these
type of goods are imported or exported (Mitra, Sharma & Véganzonès-Varoudakis, 2014). That being the
case, the importation of capital goods remains a key means for technology transfer in the developing
world because of the large volume of such imports, which at times exceed the value of FDI (Parrado &
De Cian, 2014). However, Munemo (2013) underscores the decreasing importance of
importation/exportation of capital goods as a single source of technology transfer, pointing out the
increasingly intangible content of new technologies, which makes the emphasis on equipment alone out-
dated. However, this channel remains relevant if complemented by other transfer mechanisms that are
appropriate for intangible technology.
2.3.3. Co-operative alliances
At the outset, it is essential to distinguish co-operative alliances from proximal technology transfer
mechanisms like FDI, mergers, acquisitions or any other arm’s length corporate relationships. While the
notion of co-operative alliances is difficult to define, Nepelski, and De Prato (2015) defines them as an
increasingly popular form of technology partnerships characterised by a two-way flow of technology. In
this mode of technology transfer, there is increasing interdependence between the parties who are
involved in joint knowledge production and sharing. This form of technology transfer is an increasingly
important complement to traditional mechanisms like FDI.
2.3.4. Sub-contracting
According to Radosevic (1999), sub-contracting occurs when a firm (the principal) places an order with
another firm (the subcontractor) for the manufacture of parts, components, sub-assemblies or assemblies
to be incorporated into a product that the principal will sell. Such areas may include the treatment,
processing or finishing materials or parts by the sub-contractor at the principal’s request. The
arrangement usually involves technology exchange and co-operation between the partaking firms in
which sub-contracted entities have the opportunity to absorb production and design methods. In the
automobile industry, this model is not normally employed as companies prefer to establish subsidiary
companies in the host country rather than sub-contract their services for fear of exposing and
externalising their value creating competencies.
Generally, sub-contracting is an underrated mode of technology transfer, given that technology is not
explicitly mentioned as an object of exchange in such arrangements. This form of technology transfer is
common in secondary industries and is increasingly popular following the growth of international
© Central University of Technology, Free State
23 | P a g e
production outsourcing to cut labour costs. Geographically, the phenomenon of sub-contracting is popular
in East Asia and some Eastern Europe countries.
2.3.5. Brain drain and gain
The significance of human movement across the globe as a vehicle for technology transfer cannot be
underrated (Clemens, Özden & Rapoport, 2015). Researchers highlight the role of the migration of
researchers and engineers in the industrialisation of the United States of America and Europe (Nunn,
Qian & Sequeira, 2017). However, the contribution of the migration of skilled labour towards agriculture
technology transfer in developing countries has not been empirically verified. Also, some scholars
acknowledge the contribution of returning individuals (i.e. brain gain) in some of the economically vibrant
Asian economies. Lin and Rasiah (2014) attribute the technological sophistication of electronics sectors
in East Asia countries over the years to reverse brain drain or reverse engineering.
2.3.6. Technical assistance and co-operation
Technical assistance and co-operation through aid programmes by international development agencies
like the World Bank and the International Monetary Fund (IMF) and other NGOs from economically
developed countries constitute an important channel for technology transfer. Perhaps, a historically
significant form of this assistance is the USA technical assistance to post-war Europe through the
Marshall Plan. However, the success of this channel as a platform for technology transfer in the
contemporary world is generally questionable. Its shortcomings are attributed mainly to over-investment
in capital equipment and less focus on the development of host country human resource capabilities.
One form of technical assistance is agricultural mechanization, which Nowak and Kijek (2017) define as
the application of mechanical technology and increased potential of agriculture to enhance the
productivity of human labour and to achieve results beyond the capacity of human labour. Where
technical assistance is effectively adopted, production increases and as such, productivity differences in
agriculture are increasingly a function of scientific technology, industrial capacity and education of people
in the farming business (Enete & Amusa, 2010).
Technical assistance can also take the form of imported irrigation equipment and various water sources
that are critical for the success of agro businesses. Van Averbeke, Denison and Mnkeni (2011) highlight
that irrigation schemes address the declining level of agro business production and output due to erratic
© Central University of Technology, Free State
24 | P a g e
rains in the South Africa agriculture sector. Many farmers with irrigation schemes have more significant
income from farming activities compared to those who rely on rain agriculture.
Technology transfer through acquisition of agro-processing machinery, tools and equipment is, therefore,
a precondition and prerequisite for the successful expansion of the agricultural sector and improvement
of outputs of the agro-processing firms in South Africa. Mungai (2015) notes that in South Africa until
early 1998, the production and marketing of most agriculture goods were regulated and controlled as
South Africa was isolated from global market. This resulted in the government’s formulation of a new
policy of rural agriculture development policy through technology transfer, even though it was not yet
sophisticated.
2.4. Types of agriculture technology
Agriculture technology encompasses various tools and machinery used primarily to support agricultural
enterprise such as ploughs, threshers, and irrigation systems (Rockefeller Foundation, 2017). An
illustration of the implementation and adoption of agricultural technology is agricultural mechanisation,
which involves use of machinery and equipment to maximise productivity. Asoegwu and Asoegwu (2007)
and Sims and Kienzle (2016) consider agricultural mechanisation to be the application of mechanical
technology and increased creative potential of the agriculture sector to enhance the productivity of human
labour and to achieve results beyond capacity of human labour. Such mechanisation include the use of
technology such as tractors, irrigation systems, food processing, related technology and equipment, and
provision of mechanical technology that is appropriate and compatible with local, agronomic socio–
economic environment and industrial conditions of the countries involved. However, technology transfer
is not entirely limited to agricultural technology, but extends to cover various forms of knowledge, skills,
and capabilities, which can positively be identified with improving production systems and efficient
delivery of goods and services.
2.5. Theorisation of technology transfer
A survey of literature reveals four main theories of technology transfer namely Neo-classical theory,
Traditional Liberal theory, Industrial Development Policy theory and Contingency effectiveness model.
The Neo-classical theory focuses on the market as the most efficient allocator of technology, while the
role of government is to deregulate and remove the barriers through free trade, reduced taxation and the
promotion of research development. Traditional Liberal theory illustrates the collaborative efforts among
government, research institutions and universities through the creation of good technological, innovation
© Central University of Technology, Free State
25 | P a g e
and competitive policies. The Industrial Development Policy theory takes into consideration the reality
that markets are not always efficient for innovation diffusion and economic growth to happen and hence
the need for the government to play a very critical and significant role in development. The Contingency
Effectiveness acknowledges the involvement of different players in the technology transfer process and
their ever-competing strategies, intentions and transfer processes. This study deals with these theories
in detail in the following sub-sections.
2.5.1. Neo-classical theory
The basic assumption of the Neo-classical theory is that technology is freely available within and between
countries, and to all economic entities. To the extent that technology is available to any technology agent
who intends to adopt it and all individuals have the means to acquire it, it is considered non-exclusive
(Camagni, 2017). This theory, therefore, postulates that there is free-flow of technology among parties in
the market and that firms operate on the same production function (Cecere, 2015). Firms decide on the
factors to acquire based on their relative factor prices. In other words, there is no economic value in
developing world agricultural firms’ acquisition of advanced agricultural technologies from developed
countries and their adaptation to the local conditions. Should TT happen, however, the transfer process
should be smooth, seamless and unhindered. Since the market is conceived as an effective allocator of
technological resources, investments and private businesses, it becomes the ideal vehicle for and
effective transmitter of new technologies from their areas of production and origin to their context of use.
The theory assumes the absence of market imperfections, which is an erroneous assumption in
developing countries were market failures persist, hence its limited application to these countries (Collier
& Dercon, 2014).
For the Neo-classical theory, the role of the government is to eliminate barriers in business, promote
competitive trade, relax or even deregulate stringent trade conditions, ensure effective tax credit and
promote a business-friendly environment. The main source of new technologies and innovations in the
market are research and development institutions such as agriculture research institutions, universities,
agriculture training institutions, various private sector and Non-Governmental Organisations that
encourage innovation and diffusion of technology transfer in agro-businesses. Apart from that, foreign
direct investment is also an important source of such technologies.
2.5.2. Traditional Liberal theory
The Traditional Liberal theory notes that business agencies and government can collaborate and assist
each other, though this partnership will be limited to missions or agencies in research and development
© Central University of Technology, Free State

26 | P a g e
(R&D) relating to technology transfer. In identifying with this theory, it is possible that a cooperation model
whereby government complements private business’ efforts to ensure technology transfer would be more
effective to technology diffusion than one in which these sectors compete for space and influence. To
illustrate this co-operation, the Agriculture Research Council in South Africa is an important vehicle
through which the government intervenes to shape agricultural research, innovation and the transfer of
technology from government to technology consumers. The Agriculture Research Board is also a vital
conduit through which agricultural research and technology are applied to areas of need in various
sectors.
Bozeman (2000) argues that the theory is useful for informing government and business relations and
their impact on technology transfer, which invariably influences the productivity and competitiveness of
small agribusiness. For the sake of brevity, the theory promotes private-public partnerships that ensure
the availability and transfer of agricultural technology from the source to intended technology recipients
and across various sectors.
2.5.3. Industrial Development theory
Bozeman (2000) notes that this theory dwells on centralised cooperative technology and affirms that
markets are not always the most efficient route to innovation and economic development. Hence, the
global economy requires centralised planning and broader support for public technology development,
which will ensure that industries are developed. Government institutions and agriculture institutions can
play a role in technology development influenced by sustainable development goals and applied research
and development (R&D).
Sampath (2015) concurs with the Industrial Development theory by arguing that technology transfer is
determined by choice of development induced by political system, which is predominantly shaped by the
central government. In the case of South Africa and Zimbabwe, technology transfer in the agriculture
sector is also facilitated through industrial development policies in the agriculture sector through these
nations’ respective national budgets, government policy and economic blueprints. In both countries, the
Industrial Development Corporation (IDC) is instrumental in shaping the industrial expansion policy and
the transfer of technology across sectors in both countries. The IDC offices seek to enhance the industrial
capability of South Africa and Zimbabwe, and the rest of the continent, thereby boosting economic growth
and industrial development of both countries. These offices achieve this through the funding of
entrepreneurs starting new enterprises or supporting companies that want to extend existing operations.
In the case of assistance to agro-processing firms, the South African IDC runs the Agro-Processing
© Central University of Technology, Free State

27 | P a g e
Competitiveness Fund (APCF) valued at R250 million, whose objective is to facilitate increased
competition, growth and development in the agro-processing and beverage sector.
2.5.4. Contingency Effectiveness Model on technology transfer
The Contingency Effectiveness Model derives its name from its assumption that the parties involved in
technology transfer have many objectives and effectiveness yardstick. The model argues that the effect
of technology transfer can be fully comprehended in terms of who is doing the transfer, how they are
transferring it, what is being transferred and to whom. Bozeman (2000) and Bozeman et al. (2015) state
that in the Contingency Effectiveness Model, technology transfer is determined by the following factors:
(1) characteristics of the transfer agent, (2) characteristics of the transfer media, (3) characteristics of the
transfer object, (4) demand environment, and (5) characteristics of the transfer recipient.
First, the transfer agent relates to the institution or organisation seeking to transfer technology. This can
be a government agency, university or any private firm and their individual character and nature of their
transferring mode informs the effectiveness of transfer process. Second, the characteristics of the transfer
media relates to the vehicle through which technology is transferred. This generally takes the form of
inter alia, license, copyright, person-to-person, formal literature and transfer arrangements such as
partnerships and collaborations. Third, the transfer object refers to the technology that needs to be
transferred. This takes the form of scientific knowledge, technological device, process, know-how and
specific characteristics of each. The alignment of the transfer object to the situated conditions such as
cultural norms and value systems and natural resource endowments is instrumental in ensuring effective
and sustainable transfer of the technology. Fourth, the transfer recipient is the organisation or institution
that is accepting and adopting the transfer object. This could be a firm, agency, organisation, consumer,
informal group or any form of institution whose internal systems and organisational culture would also
facilitate or hinder the transfer of the technology. Last, the demand environment relates to the factors
driving the need for the object of transfer. This can be forces like the price for technology, substitutability,
relation to technologies currently in use and availability of subsidies. While these determinants are not
exhaustive, they encompass the critical factors that influence technology transfer in diverse contexts. The
model is diagrammatically presented in Figure 2.1. The arrows on the diagram indicate the relationship
between variables.
Bozemen’s model suggests a comprehensive list of criteria for evaluating the effectiveness of technology
transfer. The list includes items like (i) impact on scientific and technical human capital (ii) opportunity
© Central University of Technology, Free State

28 | P a g e
costs (iii) extent of political reward emanating from participation in technology transfer (iv) effects on a
regional or national economy and (v) market impact.
Figure 2.1: The Contingent Effectiveness Model of technology transfer
(Adapted from Bozeman 2000:636)
Figure 2.1. illustrates the Contingence Effectiveness Model, some of whose components are technology
transfer, agricultural technology, productivity and effectiveness, will be used in the current study.
Agricultural effectiveness is measured by agricultural productivity, profitability, sustainability, stable
agricultural prices, which are governed by the agricultural environment - such as the government,
droughts and climatic change.
2.6. Technology transfer institutions
There is growing consensus that the process of technology transfer is primarily achieved through the
deliberate interventions of institutions like universities, government departments, research institutes and
non-governmental organisations (Costantini & Liberati, 2014; Nelsen, 2016). In fact, TT in various
spheres of life including in the agriculture sector, is largely a conscious and deliberate decision - even
though they may be some chance occurrences. The contribution of these aforementioned institutions is
discussed in the following sub-sections.
Transfer
Agent
Management style
Government policy
Transfer
media
Projects
Demonstrations
Environment
Economic Political Social factors
Transfer
Recipient
Institutions Agro business
organisations
Effectiveness
Output level
Profitability
Sustainability
Productivity Global
Competitors
Transfer object Knowledge Know how Technology
design
© Central University of Technology, Free State

29 | P a g e
2.6.1. Universities
Several studies have revealed that universities are uniquely positioned to facilitate technology transfer
from its producers to the beneficiaries in any economic sector through their centres of excellence,
research units and company spin offs. According to Nelsen (2016), higher learning institutions, through
university-industry relationships, have special roles in national innovation systems to develop and transfer
technology. Through these relationships and special networks, universities create and deploy knowledge
thereby contributing to economic growth and prosperity of the nation. At South African higher educational
institutions, Departments of Agriculture, Genetics, Chemistry and Bio Technology are known for
developing livestock vaccination drugs, experimentation with high yielding varieties and the testing of
genetically produced products. Cesaroni and Piccaluga (2016) highlight how senior university faculty and
other staff spearhead the commercialisation of knowledge, which results in the creation of new spin-off
of companies. The Central University of Technology’s (CUT) Department of Electrical Engineering is
renowned for having developed one of the first energy serving, photo-voltaic panel systems, which could
support the electrification of various agricultural projects. The aforementioned view is corroborated by
Boh, De-Haan and Strom (2016) who claim that more established university ecosystems have a
substantial influence on technology transfer with their university technology transfer office and university
commercial policies being the primary technology transfer mechanisms.
Many South African Universities have Idea Generators that facilitate the experimentation with new
technologies, commercialisation of technological breakthroughs and the diffusion of university innovation
spin offs into society, and Intellectual Property Office that are responsible for the patenting and protection
of innovative ideas. Therefore, universities are key drivers of technology transfer and are expected to
reap the rewards of such endeavours because of their rich knowledge networks, greater funding potential
and depth of expertise (Wright, 2014). The challenge, however, is that universities do not always
commercialize technological breakthroughs, which may otherwise remain unexploited (Van Burg,
Romme, Gilsing & Reymen (2008) and the thinking of universities as agents of technology transfer
sustains the monolithic argument where academic entrepreneurship and innovation are only achieved
through the exploitation of research and development (R&D) results (Malele, Mpofu & Muchie, 2017).
However, as it may, universities in Zimbabwe also continue to play an important role in the dissemination
of technological breakthroughs. For instance, the National Institute of Health Research, an affiliate of the
University of Zimbabwe, then named the Blair Research Laboratory was instrumental in the development
of the Blair toilet (or pit latrine) which revolutionised sanitation in many African countries.
© Central University of Technology, Free State

30 | P a g e
2.6.2. Government departments in advanced economies
Although many governments across the world have contributed significantly to technology transfer, the
most popular examples of technology transfer include the United States, European Union and Japan.
These “best examples” of agricultural technology transfer are highlighted in subsequent sections of this
study.
2.6.2.1. United States
In the United States, the main forces of technology transfer include the Department of Homeland and
Security, Energy and Agriculture. The Department of Homeland and Security’s (DHS) Science and
Technology’s Technology Transfer and Commercialization section serves as the nerve centre
responsible for managing technology transition throughout DHS and the DHS laboratory network. Most
of the technologies that are generated in the department can have commercial applications in the USA,
in the process enhancing the competitiveness of small businesses (Organisation for Economic Co-
operation and Development [OECD], 2017). Separately, the National Institute of Food and Agriculture in
the United States’ Department of Agriculture offers technical assistance to establish and enhance small
businesses, promote technology transfer through partnerships among businesses, academic and non-
profit research institutions, or helping small businesses apply for funding and technical assistance. In the
same department, Agricultural Research Service’s (ARS) Office of Technology Transfer helps transfer
ARS-developed technology to the marketplace. At the same time, the office actively seeks technology
transfer partnerships to augment research programmes, expedite research results to the private sector,
exchange information and knowledge, stimulate new business and economic development, enhance U.S.
trade, preserve the environment, and improve the quality of life for all Americans (National Institute of
Food and Agriculture, 2017).
2.6.2.2. European Union
While agricultural technology transfer predominantly unfolds in the United States through various
government departments, it is implemented in the European Union through research institutes, public
agencies, NGOs/Civil society, regional and international organisations, the private sector and
universities. Global food security is a top priority for the EU and in times of crises, the Union works to
help poor countries. As a result, the EU continues to play an active role in various regional and global
initiatives on agriculture, food security and nutrition. An illustration of an EU supported technology transfer
programme is The Network for Knowledge Transfer on Sustainable Agricultural Technologies and
Improved Market Linkages in South and South-East Asia (SATNET Asia) which is a three-year project
funded by the European Union (EU) (SATNET, 2017). The target countries for the programme are
© Central University of Technology, Free State
31 | P a g e
Afghanistan, Bangladesh, Bhutan, Cambodia, India, Indonesia, Lao People's Democratic Republic
(PDR), Myanmar, Nepal and Pakistan. The direct project participants in these countries are change
agents along domestic and regional value chains, national agricultural scientists, extension workers and
policymakers. The expected final beneficiaries encompass value chain actors – poor and vulnerable small
farmers, agricultural intermediaries, retailers, importers and exporters in target countries. The
implementing agencies for the programme include:
Centre for Alleviation of Poverty through Sustainable Agriculture (CAPSA) of the Economic and
Social Commission for Asia and the Pacific (ESCAP), Indonesia; (United Nations Centre for
Alleviation of Poverty through Sustainable Agriculture (CAPSA) http://uncapsa.org/).
Asian and Pacific Centre for Transfer of Technology (APCTT) of ESCAP, India;
Trade and Investment Division of ESCAP, Thailand;
The World Vegetable Center-AVRDC, Thailand; and
Food Security Center of the University of Hohenheim, Germany (Food Security Center, https://fsc.uni-hohenheim.de/en)
2.6.2.3. Japan
Ito, Kaneta and Sundstrom (2016) note that the Japanese government has embarked on a number
technology transfer initiatives meant to facilitate the transfer of technology from Japanese universities to
local industries. For instance, they put into place technology licencing officers in several Japanese
universities to increase the patenting and licensing of technologies generated by such institutions. This
was by then a rare technology transfer model. However, such efforts are not without hindrances - most
of which are of a historical and institutional nature. To illustrate this point, patenting and licencing of
university-generated technology was traditionally left to collaborating partners who themselves were
external to universities. Thus, university themselves rarely performed this role and only concentrate on
the research aspect. However, Bradley, Hayter and Link (2013) proclaim that there is a severe handicap
in the efforts of universities in facilitating technology transfer. These scholars criticise universities’ over-
simplification and straightjacket approach to the process as well as putting too much emphasis on
patenting and licensing.
2.6.3. Government departments in emerging economies
For the sake of brevity, the technology transfer of activities in Brazil, Russia, India and China (the BRIC
countries), will be collectively examined, thereafter Nigeria, Kenya and then the selected country studies
of South Africa and Zimbabwe. These are discussed in the subsequent sections of this study.
© Central University of Technology, Free State
32 | P a g e
2.6.3.1. South Africa and Zimbabwe
In African emerging economies, government departments such as their Ministries of Agriculture, play a
critical function in the transfer of agriculture technology such as biotechnology products, machinery, high
yielding varieties and pest control chemicals (Zhou, 2015; Ahuja, Ma & Howell, 2016). For example, the
South African Department of Agriculture, Fisheries and Forestry has partnered with private entrepreneurs
to provide water conservation technologies to farmers to cushion them against the negative
consequences of continuous droughts. In the South African contexts, where there is dire need for food
security due to climatic change leading to droughts, the application of suitable empirically-tested
agricultural technologies to enhance agricultural productivity remains a key priority. As a result,
agriculture departments (i.e. the Ministry of Agriculture in Zimbabwe and the Department of Agriculture,
Forestry and Fisheries in South Africa) employ extension workers, usually highly trained and experienced
subject-matter specialists, who are responsible for effectively transmitting such technologies to farmers
(Juma, 2015; Wheeler, Zuo, Bjornlund, Mdemu, van Rooyen & Munguambe, 2017). Since the majority of
farmers in the developing nations are engaged in subsistence farming in rural areas and are of diverse
socio-economic backgrounds, academic abilities and learning requirements (Abate, Fisher, Abdoulaye,
Kassie, Lunduka, Marenya & Asnake, 2017), the agriculture extension workers who are under the employ
of government ministries have to find the appropriate means and techniques to transmit as well as
encourage the adoption of new technologies (Machila, Lyne & Nuthall, 2016). In this way, government
facilitates the flow of agricultural technology to the farmers and employ applied research and development
to provide customised solutions to farmers' problems. The success of government interventions in
technology transfer depends on the extension workers’ comprehension of farmers’ knowledge
requirements, priorities and opportunities as well as the obstacles to technology acceptance.
The Zimbabwean experience with general technology transfer and agricultural technology transfer has
generally been a fruitful one with the government agricultural extension services and aid agencies
adopting a participatory approach to technology transfer. However, the uptake of certain technologies
like conservation agriculture has been negative owing to negligible increases in yields following the
adoption of these new technologies.
In spite of the reported responsibilities of government agricultural extension services, some scholars have
criticised the role of such extension services (Elias, Nohmi, Yasunobu & Ishida, 2016). The key concerns
raised are the over-emphasis of technology transfer of cash crop varieties at the expense of dietary crops,
absence of technology collaboration arrangements with technology-generating centres to reduce
technology dependence, as well as low levels of training and compensation of extension workers. Overall,
© Central University of Technology, Free State
33 | P a g e
these limitations negatively impact on the ability of government departments to facilitate the timely
appropriation, predictable transfer of appropriate technology services. Notwithstanding, some success
stories of government-driven technology transfer programmes can be observed in some emerging
economies.
Charles, Godfray and Garnett (2014) argues that increasing yields depends upon fertility of the area
cultivated, the use of better seeds and technologies - hence reducing the risk of food insecurity in
emerging economies. In the African agro-business community, long-term food security depends on
sustainable intensification of production through usage on tested seeds, fertilizers, equipment and
agriculture technologies usage. The application of technology transfer includes the use of organic inputs,
soil conservation methods, well-functioning agro based markets, sustainable and appropriate agricultural
inputs, which contribute to intensified agriculture output levels and increase in productivity. Abdu-
Raheem, and Worth (2011) consider technology transfer as a means of meeting the goals of income
growth, increased food security and improved social well-being in Africa.
2.6.4. Research institutes
Apart from individual governments, research institutes are critical drivers in the transfer of technology.
Research institutes often liaise and collaborate with government departments responsible for agricultural
extension and agricultural teaching institutions, in their efforts to transfer agricultural technology such as
hardware stores and farms to technology recipients (Ahuja et al., 2016). The research institutes, with
their assemblages of agriculture experts and scientific facilities, are a key source of useful ideas and
practical information related to agriculture.
2.6.4.1. BRIC countries
In the BRIC countries, the main research institutions responsible for agricultural technology transfer are
universities, agricultural institutes and some cognate government ministries. As an illustration, the
Chinese University of Agriculture and the Chinese Academy of Agricultural Sciences are at the forefront
of agricultural knowledge and technology transfer in China. Similarly, Brazilian universities and the
Brazilian Agricultural Research Corporation (Embrapa), which was created in 1973 as an agricultural
research organisation under Brazil’s Ministry of Agriculture and was almost entirely funded by
government resources, are at the forefront of agricultural technology transfer in Brazil.
In September 2016, the Ministers of Agriculture from Brazil, Russia, India, China, South Africa (BRICS)
met in New Delhi (India) to set up a research centre for greater agriculture cooperation (Upadhyay, 2016).
© Central University of Technology, Free State

34 | P a g e
The BRICS countries, which account for 45% of global agricultural output, concurred to establish an
Agricultural Research Centre to generate and share models for sustainable agriculture. The Centre is
intended to promote food security, sustainable agri-development and poverty alleviation through strategic
cooperation in agriculture within the BRICS countries. Its key focus areas include agriculture science,
policy research and development extension, technology transfer, training and capacity building and
scientific information sharing.
2.6.4.2. South Africa
In South Africa, the Agriculture Research Council (ARC) whose mandate is to conduct research, promote
development and transfer technology in order to promote agriculture and industry, contributes to a better
quality of life, facilitates natural resource conservation and alleviate poverty, plays a critical role in
technology transfer in the South African context. The Council’s Agricultural Economics and Capacity
Development Division facilitates the transfer of technology by translating the ARC's research results into
useable outputs in support of agrarian transformation and the efficiency and competitiveness of the
sector. This is achieved through analysis of research activity in order to allow the ARC to exploit its
intellectual property, maximise utilisation of research and development outputs and transfer technology
to farmers and agribusiness. In addition, the Research and Innovation Systems (RIS) Division provides
a wide range of technologies that are integrated with both the Crop Sciences and Animal Sciences
divisions. RIS includes Agricultural Engineering, Biotechnology, Natural Resource Management, Climate
Smart Agriculture, Informatics, Biometry and Knowledge Management Systems. With a wide range of
service, development and research functions, the RIS Division provides collaborative and support
functions to a wide range of technologies in areas such as genomics, phenomics, remote sensing,
agricultural systems modelling and engineering systems.
2.6.4.3. Zimbabwe
In Zimbabwe, the International Crops Research Institute for the Semi-Arid Tropics (ICRISAT) in
Zimbabwe conducts research with partners, develops human capital and fosters innovation to support
and develop the agricultural sector in the respective countries. The organisation, which has been in the
country since 1984, collaborates with multilateral organisations, including national and regional
agricultural research institutes, civil society organisations, academia and the private sector. It is active in
agricultural research for sustainable development, reducing rural poverty, improving food security,
improving nutrition and health, and sustainably managing natural resources via donor funding. The
significance of organisations like ICRISAT needs not to be over-emphasized given the current climatic
changes and rainfall pattern unreliability currently experienced across the globe. The climatic changes,
© Central University of Technology, Free State
35 | P a g e
which are accompanied by droughts, negatively affect crop yields and food security. Hence, the vital
intervention of research institutes whose aim is to produce the necessary research to help mitigate and
promote agricultural development, cannot be over emphasised.
However, the contribution of such institutes has been called into question. Not discrediting the capability
of research institutes to generate knowledge, Hoffmann, Probst and Christinck (2007) argue that because
of their independent nature, their research priorities may not be in line with national technology needs or
strategies. At the same time, the often isolated nature of research institutes, both physically and in terms
of research objectives, may disrupt the flow of technology from the source (technology agents) to the
consumers (Shiva, 2016). Davis (2008) proffers that research institutes often have tenuous or non-
existent relations with government agricultural extension workers whose traditional role enables a two-
way information exchange between the two parties. As a result, research institutes may accumulate vast
research findings, which have the potential to enhance the agricultural productivity of farmers but still
remain stuck with such data because of weak or absence of technology dissemination and
implementation linkages. Thus, for research institutes to fulfil their role in agriculture technology transfer
effectively, robust reciprocal task-relationships between research institutes and government
departments/ministries should be nurtured and supported. This, in turn, requires cohesion and integration
of national technology transfer strategies (Spithoven, Clarysse & Knockaert, 2011) to ensure wide-scale
rollout of technology in places of need such as farms, forestry and hardware stores.
2.6.5. Non-Governmental Organisations
Non-governmental organisations and international aid agencies from more developed economies are
actively engaged in technology transfer processes in the least developed economies. The following
sections will summarise African experiences before examining the experiences in the two case studies,
the focus of this study.
2.6.5.1 Selected African experiences
Through their highly structured and well-co-ordinated developmental projects, aid agencies and other
Non-Governmental Organisations (NGOs) provide technical expertise and funding to agriculture and
farming-related activities (Andersson & D'Souza, 2014; Pedzisa, Rugube, Winter-Nelson, Baylis &
Mazvimavi, 2015). As an illustration, between 1996 and 1998, the Department of Agricultural Technical
and Extension Services in Zimbabwe’s Ministry of Agriculture together with the German Technical
Cooperation Agency engaged in a joint project to implement reduced tillage in smallholder farming
systems. The primary objective was to disseminate cultivation technologies to redress the problems of
© Central University of Technology, Free State

36 | P a g e
soil loss, runoff and erosion. From 2003, a consortium of organisations including Food and Agriculture
Organisation of the United Nations (FAO), Department for International Development (DFID), European
Union, International Crop Research Institute for the Semi-arid Tropics (ICRISAT), International Maize and
Wheat Improvement Centre (CIMMYT), University of Zimbabwe, various non-governmental organisations
(NGOs) and extension services were actively involved in research and advancement of conservation
agriculture technologies across Zimbabwe (Mafongoya, Rusinamhodzi, Siziba, Thierfelder, Mvumi, Nhau,
Hove & Chivenge, 2016). While some tillage knowledge, the practice of gully reclamation and the
prevention of stream bank cultivation were disseminated over the years, these gains could have been
reversed during the land reform programme, when grass burning to clear arable land and the cultivation
of steep slopes and cultivation of riverbanks increased among small-scale farmers.
Aid agencies and NGO-driven technology transfer projects are usually acclaimed for being soundly
conceived and internally well-co-ordinated (Xu, Li, Qi, Tang & Mukwereza, 2016). However, they are
often criticised for pursuing wrong developmental priorities, imposing what has worked in their home
countries to host countries. As a result, foreign NGOs from different countries fail to support each other’s
efforts and pursue their individual national interests instead. Apart from that, Ockwell, Sagar and de
Coninck (2015) observe that while different projects by different autonomous bodies may pursue a
common developmental agenda, their prescriptions in relation to technology may differ. In the case of
farming technologies, species selection, management strategies, and assumptions about the farming
system may differ widely (Grabowski & Kerr, 2014). This makes co-ordination of such technology transfer
efforts sometimes costly and time-consuming. Alemu, Cook and Gubo (2015), nonetheless, advises that
for multi-donor technology projects to succeed in the developing world, there is need to fit in local agents
of the technology transfer system to promote uniformity with the national strategy and agrarian
requirements.
Having discussed the various institutions and organisations that drive the technology transfer process,
the next section examines the importance of agricultural technology transfer in Africa.
2.7. Importance/impact of agriculture technology transfer in Africa
The introduction of new technology to agricultural producers has the potential to raise overall productivity
and quality of life within an area (Collier & Dercon, 2014). According to Juma (2015), technology transfer
is a key mechanism through which agricultural advancement can achieve the millennium development
goals of increasing the general level of food production, meeting food and nutritional requirements as
well as reducing poverty levels. For example, the Maendeleo Agricultural Technology Fund (MATF),
© Central University of Technology, Free State
37 | P a g e
which was started in 2002, has had a substantive impact on the agricultural productivity of smallholder
farmers in some East African countries (Njeru, 2016). The Fund was setup by FARM-Africa, a United
Kingdom non-governmental organisation, to promote the adoption of new agricultural technologies so as
to the increase agricultural production and improve the livelihoods of smallholder farmers in East Africa.
In the past, the fund had supported agricultural projects in Kenya, Uganda and Tanzania and covered a
range of farm enterprises like bananas, chickens, sunflower and honey, sweet potato, beans, cassava
and silage for dairy cows (Roothaert & Magado, 2011; Roothaert, Ssalongo & Fulgensio, 2011). The most
successful of the technology transfer projects are those that have involved the active participation of the
intended recipients with smallholder farmers benefiting from agriculture training and input support.
Studies proclaim that TT has a greater role to play in the economic development of developing countries
given the very limited agricultural research and development activities are carried out in these countries
(Tittonell & Giller, 2013; Collier & Dercon, 2014; Juma, 2015; Meijer, Catacutan, Ajayi, Sileshi &
Nieuwenhuis, 2015). In view of the restrictions of local sources of new agricultural technology in emerging
economies, the acquisition of new technologies by developing countries will help to enhance the local
technological capabilities and meet the national socio-economic targets. The reason behind the
promotion of TT from developed countries to the developing world is to help the lagging economies to
transition from traditional-based agriculture to technology-based agriculture through agriculture-related
technical and material assistance (Collier & Dercon, 2014). For instance, smallholder farmers from
several West African countries have benefited from institutional changes meant to support sustainable
agricultural practices from European countries such as France (Struik, Klerkx, van Huis & Röling, 2014).
Santacreu (2015) suggests three different objectives and areas of impact for which technology transfer
is undertaken. First, these scholars argue that new and innovative technology are acquired from foreign
nations for the purpose of import substitution. This means that the acquired technology is used to
enhance the productivity and competitiveness of an existing indigenous production system and reduce
reliance on foreign supplies. Second, the acquisition of new technology is done to enhance a country’s
export competitiveness through enhancing the productivity of domestic export-oriented industries. Last,
technology transfer helps developing countries to boost their already existing capabilities, in the process
helping them to compete on the global arena. Examples include the adoption of no-tillage agriculture and
bioenergy crops in some countries (Kraucunas, Clarke, Dirks, Hathaway, Hejazi, Hibbard & Leung, 2015).
Given the above-cited significance of technology transfer to developing economies, it is evident that
African agricultural activities stand to benefit more from such technology exchange relationships through
© Central University of Technology, Free State

38 | P a g e
improved local production and the meeting of local food security requirements. Obi and Nwakaire (2014)
argue that African countries should thus target to acquire new agriculture technology, first, to meet local
food requirements and, second, to promote import substitution and export-promotion or any other goal.
For instance, the Zimbabwean government has permitted non-governmental organisation to transfer
agricultural technology that promotes food security and sustainable practices like conservation agriculture
(Andersson & D'Souza, 2014).
2.8. Technology transfer in developing economies
The subsequent sections of this study will examine literature on technology transfer processes in African,
South African and Zimbabwean countries.
2.8.1. Africa
Several scholars underscore the significance of effective technology transfer processes and mechanisms
for the success of any modern economy, particularly in developing countries where the governments are
ill-funded or poorly resourced to develop their own technology or conduct any meaningful research
(Collier & Dercon, 2014; Juma, 2015; Ahuja et al., 2016). There is convergence of scholarly opinion on
the need for agriculture systems to evolve from the less productive, labour intensive subsistence
agriculture systems to the capital intensive, commercially-driven one (Juma, 2015; Meijer et al., 2015;
Amanor & Chichava, 2016). Literature affirm the need for African countries to import agriculture related
technology in order to substitute imports, augment export-oriented products, and as well enhance the
prevailing indigenous capabilities (Ulrich, 2014; Juma, 2015; Adenle, Manning & Azadi, 2017).
Previous research conducted on the African continent point to the significance of agriculture technology
transfer in increasing productivity, distribution and consumption of agricultural produce (Obi & Nwakaire,
2014). For a continent which is poverty-ridden and whose majority lives off subsistence farming, effective
transfer of technology such as hybrid seed, fertiliser and agriculture biotechnology and the adoption of
transformative agricultural practices such as crop rotation, soil protection and land tenure arrangements
provide a solid foundation for improved agricultural productivity (Andersson & D’Souza, 2014; Juma,
2015). This is particularly so for agro-driven economies like Gambia where the agricultural sector employs
three quarters of the country’s total labour force and accounts for 30% of the country’s Gross Domestic
Product (Gibba & Mark, 2016). Therefore, the capacity of existing technology transfer institutions and the
speed of technology adoption accounts for the marked disparities in productivity and high costs of
production in African countries.
© Central University of Technology, Free State
39 | P a g e
In regions where TT structures are weak or non-existent, the contribution of technology has been non-
existent. As an illustration, the poor productivity and performance of the Gambian horticulture sector is
often attributed to poor supply of sophisticated agriculture inputs, low crop yields and poor market access
(Mehra & Rojas, 2008). In the Nigerian case, the shunning of careers in agriculture by the educated youth
due to poor rewards and seasonality of the sector creates a disturbing eventuality where the country’s
agriculture sector is manned by the elderly whose resistance to change contributes to the persistence
only small-scale, rural agriculture based on traditional methods (Maiga, Christiaensen & Palacios-Lopez,
2017). Such methods are not productive enough even to meet the needs of the local population, often
leading to food imports and solicitation of aid. As such, resistance to many radical technological changes
and institutional inertia has contributed to the limited acceptance, adoption and adaptation of transferred
technology.
For Obi and Nwakaire (2014), the effective transfer of agricultural technology in Africa will only happen if
the whole process is synchronised to the needs and culture of the recipient communities. Instead of
emphasising high technology, which might not suit the physical environment and institutional
preparedness of the local governments and communities, emphasis should on appropriate innovations
that meet the needs of local communities and embrace participatory processes of technology adoption.
According to Juma (2015) and Kaushik et al. (2014) the technology transfer process is successful if
accepted and adapted to local people’s knowledge base, value systems, resource endowments and
situated conditions.
A good example of a sustained effort at transferring agricultural technology to Africa is the establishment
in some countries of Agriculture Technology Demonstration Centres (ATDC) by the Chinese government
as new forms of foreign aid and South-South co-operation (Xu et al., 2016). The Chinese government
believes that the failure of the African agriculture system despite vast tracts of land lies in poor farming
techniques and know-how (Gu et al., 2016). Thus, according to them, the solution lies the transfer of
agriculture technology to the African continent through bundling aid with business to ensure the continuity
of the established programmes once the co-operation period lapses. Under this arrangement, rather than
sell/send/transfer the technology (knowledge/know-how/artefacts/ ideological and political arrangements)
only to the continent as part of the aid arrangement, the Chinese government sends technical experts as
well. However, like similar attempts at transferring western technology, the process has also encountered
some obstacles. For instance, the technologies that yielded high productivity in China fail to do so in
Africa once the Chinese expatriates withdraw, a factor that is blamed on the local people’s obstinacy and
© Central University of Technology, Free State
40 | P a g e
resistance to Chinese technology. To this end, Wekesa (2016) laments that the African farmers need a
revolution of the mind-set for them to accept Chinese technologies.
2.8.2. Zimbabwe
A survey of literature reveals that post-1980, the process of agricultural technology transfer in Zimbabwe
has involved numerous parties including farmers, traditional and local leaders, extension officers, Non-
Governmental Organisations, donors, research organisations and researchers, media organisations,
product marketers among several other interested parties (Gisselquist, Nash & Pray, 2002; Tilman,
Balzer, Hill & Befort, 2011). Up to 2000, the process was mainly targeted at small-scale rural farmers
given their limited agriculture resources and technical expertise (Chiputwa, Langyintuo & Wall, 2011).
Given the diversity and often diverging interests of the numerous stakeholders involved in the technology
transfer process, the process has achieved mild success. Before the recipients of agriculture technology
accept and implement it, they are expected to evaluate its perceived merits and demerits, an evaluative
process that could be complicated for small-scale farmers due to their limited agricultural technology
knowledge. In fact, the process of technology acceptance and diffusion is complex and often is influenced
by aspects like age, gender, socio-economic status of targeted households, and the physical environment
of the targeted area (Abdullah & Samah, 2013).
However, the Zimbabwean agriculture sector undoubtedly requires the support of appropriate technology
to enhance its productivity. To a large extent, the sector is rain-fed and therefore relies on seasonal rains
which are unreliable in terms of amount, spatial distribution and timing (Andersson & D’Souza, 2014).
Owing to this condition, agriculture crop output is perennially not guaranteed and perpetuates food
insecurity within the country (Cheesman, Andersson & Frossard, 2017). Hence, the sector stands to
benefit more from the adoption of new agriculture technology such as planting hydroponically produced
crops, green house effects, gravel and wire-covered storm drains and gully reclamation in addition to
preservation of productive conservative farming methods (e.g. compost farming, mulching, inter-
cropping).
The need for new technology was felt more following the Fast Track Land Reform Programme (FTLRP)
of 2000 in Zimbabwe that introduced new, unskilled and ill-equipped cadres in the formerly white-owned
commercial farming areas (Chambati, 2013). One of the unintended outcomes of the process was the
sharp drop in the land under irrigation from approximately 200 000 ha to around 120 000 ha. Arguably,
the intensification of the transfer and implementation of the new technologies that enhance water
© Central University of Technology, Free State

41 | P a g e
conservation and agricultural land productivity would put the country’s agriculture sector on sound footing
and regain its breadbasket status.
A classic illustration of attempts at transferring agricultural technology as a countermeasure to the
unreliable rainfall patterns in Zimbabwe is the joint effort of the Zimbabwean government and some NGOs
to entrench water conservation farming techniques such as building dams, use of drip irrigation and
modern water harvesting methods in rural areas. Conservation agriculture involves ensuring no soil
disturbance, permanent soil cover and crop rotation (Thierfelder & Wall, 2012). The purpose of this
farming technique is to increase crop yields, even though literature reveals that its adoption has yielded
limited success with recipients reporting insignificant changes in their crop yields (Baudron, Andersson,
Corbeels & Giller, 2012). This raises doubts about the suitability of this knowledge to the Zimbabwean
physical conditions.
Another example of institutional arrangements aimed at supporting agriculture technology transfer from
outside is the establishment of China Zimbabwe Agriculture Demonstration Centre in Zimbabwe in 2012
(Gu, Zhang, Vaz & Mukwereza, 2016). This gesture is an effort by the Chinese government to provide
sustainable technological support to the Zimbabwean agriculture sector. Though funded by the Chinese
government, the project is overseen by a private Chinese company whose human resources have
previous agriculture experience gained in China. Apart from transferring agriculture knowledge at the
Centre, the private company engages in commercial activities like selling farm equipment and products,
as well as ploughing services to farmers. However, there are doubts relating to the appropriateness of
this technology transfer model. The feasibility of extending Chinese domestic models to foreign contexts
- especially when all human resources are expatriates from China comprises the legitimacy and suitability
of the model, which could be perceived as new cultural imperialism.
2.8.3. South Africa
South African policy documents emphasise the importance of the agriculture sector to the South African
economy (Lipper, Thornton & Campbell, 2014; Springer & Duchin, 2014). Politicians and other
stakeholders also underscore the role of agriculture in stabilising food prices, ensuring domestic food
security, provision of employment and promotion of export-led growth. However, hard evidence shows
that 95% of the nation’s prime land is under large-scale commercial farming, while the remainder is
composed of former homeland farming. In total, the two sectors constitute only 3% of the total economy
(Bernstein, 2013). In fact, some academic evidence suggests that the SA agriculture sector perennially
performs below expectations and has not meaningfully contributed towards economic growth when
© Central University of Technology, Free State

42 | P a g e
compared to other economic sectors (Aliber & Cousins, 2013). Although the reasons for such
underperformance could be many, limited application of technology transferred could be a contributing
factor (Okudoh, Trois, Workneh, Schmidt & Cibati, 2014).
Findings from a study by Greyling (2012) suggest that there is scope for growth and improvement of the
agricultural sector if there is substantial investment in infrastructure and technology. A historical overview
of the SA agriculture sector helps increase understanding of the transfer and adoption of agriculture
technology. Until 1994, the SA agriculture industry was dominated by white-owned commercial farming
activities (Schirmer, 2015). Following the end of apartheid, this was followed by de-segregation of land-
ownership, diverse institutions invested in encouraging black participation in commercial agriculture. This
brought marginal changes in the racial composition of participants in the sector partly because of the
highly capital-intensive nature of commercial agriculture, limited culture of high investments and limited
agricultural knowledge of most black Africans at independence.
The introduction of trade liberalisation in South Africa after the abolition of apartheid contributed to relaxed
trade barriers and increased modern farming opportunities to the majority of South Africans. Historically,
agriculture accounted for approximately 15.2% of GDP in the 1950’s and 10% in the 1960’s before
decelerating to less than 3% during 2001 and 2009. This downward trend has continued to date. Although
the relative size of the agricultural sector is small, the value added by agriculture showed an upward
trend, perhaps demonstrating the contribution of technology transfer to farming per unit of land. This can
be attributed to the IDC and other financial institutions’ substantial investment in agriculture as well as
other government interventions in the sector.
There has been some paradoxes in technology transfer in South Africa’s agriculture. Schirmer (2015)
notes that in the twentieth century, South Africa saw substantial shifts in structures of production,
innovation and the level of technology transfer due to the fact that she introduced land reform restitution
initiatives beginning in 1994 when she got independence from the apartheid regime. The land reform was
part of initiatives to support native black farmers through land redistribution coupled with agriculture
support programmes. The latter would require a more interventionist developmental state to ensure that
transformative land reform and technology transfer happens, while the former would perhaps require
gradualist Traditional Liberalist Model, where market forces would drive land reform based on market
value. The post independent agricultural reform also witnessed the introduction of a comprehensive
agriculture support programme for post-land resettlement support and the introduction of Micro
© Central University of Technology, Free State
43 | P a g e
Agriculture Financial Institutions of South Africa (MAFISA) supported through the Land Bank to promote
technology transfer in the agricultural sector.
It can be argued that agriculture technology development and transfer (TDT) affects virtually all aspects
of the economy from short-term run changes in export and imports volumes and domestic prices to long-
term changes in health, nutrition, employment, institutional development and economic development.
TDT will provide an opportunity for low-income producers and consumers to improve their real income
and create rural enterprise to grow into global competitive agro business farmers.
The New Partnership for Africa’s Development [NEPAD] (2014) noted that information and technologies
in the agricultural sector in Africa have contributed to improved agro-business production and productivity.
The process of embracing technology in South African agribusiness has contributed to increased
agricultural productivity, improvement in farmers’ practices, higher efficiency in production processes and
agro-business products of higher quality, which contribute to their improved competitiveness.
Technology transfer has the potential to contribute to economic development and growth of the agro-
business sector. Kamoyo and Chidoko (2013) suggest that developing capacity to transfer appropriate
and affordable technology is essential to accelerating the process of economic development. In the same
vein, poor technology management is the cause of failures in technology programmes in developing
countries (Marais, 2012).
2.9. Agro-business-related institutions in Zimbabwe and South Africa
Zimbabwe has various agriculture departments that cascade from national level to provinces and districts
- such as research and specialist services like the Agriculture and Extension Services, Institute of
Agriculture Engineering, Veterinary Services, Tobacco Research Board, Agriculture Research Institute,
University Zimbabwe’s Faculty of Agriculture, Agriculture Marketing Authority, agricultural training
colleges. While these institutions play a critical role in the implementation of government programmes
and addressing food security, the overall contribution of these institutes and departments need to be
evaluated in future studies to determine if they are instrumental in sustainable technological transfer in
Zimbabwe.
The Government of South Africa placed importance on subsistence agriculture through improved food
production, the development of policy intervention such as land technology, credit financing in agro-
processing, irrigation machinery and equipment, and food processing technology. However, trends of
© Central University of Technology, Free State
44 | P a g e
agriculture production has shown a stagnancy in agriculture production and its contribution to the Gross
Domestic Product (GDP), which needs further investigation.
2.10. Barriers to technology transfer
A survey of literature reveals three broad categories of obstacles to effective technology transfer, namely
technical, attitudinal and market-related barriers (Kaushik, Kumar, Luthra & Haleem, 2014; Kumar, Luthra
& Haleem, 2015; Luthra, Kumar, Garg & Haleem, 2015). While technical barriers relate to scientific and
technical limitations to technology use - such as industry-specific equipment, materials and equipment
for the research, attitudinal barriers relate to technology recipients’ negative perceptions towards
imported technology. Market-related barriers relate to the cost of purchasing the technology, recipient’s
ability to afford the technology, the extent to which it is marketed, the marketing medium and its
effectiveness in promoting the transfer of the technology. All three may contribute towards to the
resistance to change agricultural practices, which is a key hindrance to agriculture technology adoption
and adaptation in the developing world. Other often-cited barriers include issues such as language
barriers, cultural differences, customary law, technological development maturity of the locality, economic
strength, proximity of the locality to and from the transfer location and available natural materials (Rupf,
Bahri, de Boer & McHenry, 2015; Xu et al., 2016) which may contribute to the questioning of, scepticism
about and even open resistance to the implementation of transferred technologies.
Technology transfer efforts go beyond focusing on the individual farmer or farming entity. Generally,
agricultural development based on new technology acquisition depends on the availability and efficient
operation of certain institutions and infrastructure systems (Ockwell & Byrne, 2016). According to Obi and
Nwakaire (2016), technology transfer in African countries is hamstrung by the absence of institutional
support frameworks to accept, adopt and adapt transferred technologies. Thus, African governments
have a key role to provide the institutional support fundamental frameworks and the basic infrastructure
for technological transfer, adaptation, adoption and acceptance. In most instances, however, international
cooperation programmes involving international non-governmental organisations and other world
development agencies like the United Nations and the World Bank often plug this support gap through
the aid and technical assistance that they offer (Zhou, 2015). However, Juma (2015) observes that
international aid does not always incorporate technology transfer arrangements from advance economies
to developing economies. It should, however, be noted that development assistance agencies are not a
major carrier of technology to poor and developing countries as their assistance is often channelled
through pandemic prevention, relief aid and other humanitarian programmes. Juma (2015) adds that if
technical assistance and aid are not carefully crafted, they will simply pile-up funding and agricultural
© Central University of Technology, Free State

45 | P a g e
equipment that developing countries cannot effectively use. One of the white elephant projects arising
from this is the Chinese-Zimbabwe Agricultural Technology Demonstration Centre (ATDC) (Lixia, Yan,
Wenjie, Mukwereza & Xiaoyun, 2015).
The quick pace of change in the operational environment also presents a challenge to technology transfer
efforts - particularly in the developing world. The technology transfer process is complicated by numerous
innovations in agricultural technology itself, dynamism of political and socioeconomic environments,
changes in the human capita with unique characteristic needs, and evolutions that push people into new
jobs areas (Rodrik, 2014).
2.11. Challenges of agricultural technology transfer
It is critical to examine challenges of agricultural technology transfer focusing on the countries considered
in this research. One of the challenges is that South Africa and Zimbabwe are increasingly relying on
imports of cereal crops (e.g. wheat) and livestock products (e.g. poultry), while their agriculture
increasingly depends on imports of inputs (e.g. fertiliser, feed, mechanisation). This points to the need to
strengthen agricultural competitiveness by supporting import substitution and depending on indigenous
agricultural technologies in farming activities and industries where both countries have the potential.
Technology transfer should also contribute to increased rural development, poverty alleviation and
increased participation of small-scale agro-processing firms.
Broadly, the main challenges of agricultural technology transfer in both countries relate to limited access
for small-scale producers, imperfect information, regulative and institutional arrangements that do not
render and support integrated approaches to technology transfer and dissemination. For instance, while
the Department of Agriculture, Fisheries and Forestry [DAFF] (2014) emphasises the critical relevance
of new farming knowledge, information management, integrated spatial economic planning, access to
such information also remains a challenge - especially for small-scale producers, which affects their
productivity and competitiveness. Inadequate information also undermines government’s ability to plan
and implement agricultural technology transfer and support interventions, complicates the identification
of priority areas where interventions are required and therefore, compromises the overall impact of these
interventions. The reluctance to adopt or integrate indigenous knowledge systems into new technology
transferred also limits the scope of options available making interventions less context-informed and
undermining the legitimacy of such technology transfer programmes.
© Central University of Technology, Free State
46 | P a g e
In spite of training and education of Zimbabwean farmers being fundamental forms of technology transfer,
Zimbabwe just like other Southern African countries, has not sufficiently explored and exploited them for
transmitting agricultural innovations and transferring technologies. The education and training of agro-
processing business owners and farmers would be integral to their acquisition of appropriate knowledge
and information relevant to agricultural production, processing, distribution and consumption and other
farming operations. The acquisition of knowledge on usage of farming inputs, capital-intensive machinery
and equipment is integral to successful agro-processing and farming businesses.
Manyati (2014) cites the difficulties that small-scale farmers encounter in introducing innovation and
developing technological innovations to include limited economies of scale, financial constraints,
antiquated knowledge systems, poor communication of weather and climatic information, ever-changing
socio-economic and climatic conditions, which undermine agro farming and agro-processing productivity.
Other challenges of small-scale agro-processors in Mashonaland include lack of synergy and proper
coordination of efforts of rural farmers, technology transfer agencies and the innovators’ skills and
knowledge gaps. As such, production-oriented practices such the adoption of high yielding varieties
(HYVs), irrigation systems, use of agricultural inputs such as fertilizers, chemicals, pesticides and use of
agricultural machinery often fail to yield the intended outcomes due to incongruence of technology
supplied to the context of application and coordination challenges.
2.12. Chapter summary
This chapter addressed the concept of technology transfer and its relevance to the agricultural sectors in
Zimbabwe and South Africa. Issues relating to the definition of technology transfer, its importance for the
agricultural sector, barriers to technology transfer, institutions and modes for technology transfer were
dealt with. Case studies of agriculture technology transfer in the African context were also discussed.
The next chapter addresses the issue of agricultural innovation as it relates to agro-processing
productivity and competitiveness.
© Central University of Technology, Free State

47 | P a g e
CHAPTER 3: INNOVATION AND SMALL-SCALE AGRO-PROCESSING FIRMS IN
DEVELOPED AND EMERGING ECONOMIES
3.1.
INT
RO
DU
CT
ION
3.2. NATURE OF INNOVATION
3.3. FACETS OF AGRICULTURAL INNOVATION
3.3.1. Innovations in crop production
3.3.2. Innovations in animal husbandry
3.3.3. Innovation of crop growing condi
3.3.4. Innovation through new agric imple
3.4. REASONS FOR SSAB'S PURSUIT OF INNOVATION
3.4.1. Risks
3.4.2. Opportunities
3.4.3. Socio-cultural factors
3.5. APPROACHES TO INNOVATION IN SSABS
3.5.1. Innovation platforms
3.5.2. Innovation intermediaries
3.5.3. Informal social and economic networks
3.6. THEORIES OF INNOVATION
3.6.1. The creative destruction theory
3.6.2. Diffusion of innovation theory
3.6.3. Disruptive innovation theory
3.6.4. The Henderson-Clark Theory
3.7. AGRICULTURAL INNOVATION SYSTEM
3.8. INNOVATION-PRODUCTIVITY RELATION
3.9. SIGNIFICANCE OF SSABs IN AGRICULTURE
3.10. STUDIES ON INNOVATION IN AGRICULTURE
3.10.1. European Union
3.10.2. Vietnam
3.10.3. Uganda
3.10.4. South Africa
3.11. CHAPTER SUMMARY
© Central University of Technology, Free State
48 | P a g e
3.1. Introduction
The previous chapter examined agricultural technology transfer, its modes of application and associated
barriers to implementation in developed and emerging economies. This chapter focuses on innovation,
its theorisation, approaches to implementation and case studies of its practical application in agro-
processing contexts. In the new global economy, innovation has become a central issue in the
performance of nations and business-related entities. The presence of innovation within organisations as
expressed by new product development and creation of new businesses is claimed to drive organisational
productivity (Hung & Chou, 2013; Camisón & Villar-López, 2014), while the absence of innovation
contributes to the slow death of businesses entities. The need for innovation is felt now more than ever
because of the combination of the rapid transformation of the present business environment as well as
the increased pace of globalisation (Prepletaný, 2013). This has in turn presented new gaps and niches
for innovating firms and threats to the obstinate ones.
The concept of innovation, which spans many disciplines including economics, management, sociology
and psychology, also has a significant impact on the agricultural sector (Fischer & Fröhlich, 2013).
Acknowledging Drucker’s (2014) observation that innovation is the tool for entrepreneurs in pursuit of
business opportunities, there is a need to trace the sources of and opportunities for innovation. Also, the
study of innovation requires a sector-specific approach - such as innovation in agriculture considered in
this study. This approach is appropriate given the need to expand and guarantee global food supply and
security amidst an ever-expanding world population.
3.2. Nature of innovation
The concept of innovation is multi-faceted and complex (Fischer & Fröhlich, 2013) and hence the difficulty
of developing a precise definition for it. A survey of extant literature on the concept reveals the multi-
disciplinary nature of innovation with studies having been carried out in management sociology,
geography, management sciences and natural sciences, among others (Fromhold-Eisebith, Werker &
Vojnic, 2014; Maghsoudi, Duffield & Wilson, 2015). In broad terms, an innovation is defined as a new
product, service, idea or way of doing things. Tidd and Bessant (2014) draw on Schumpeter’s (1934)
distinction between innovation and invention, the latter referring to a separate concept defined as an idea,
sketch, model for a new or improved device, product or process which has not been commercialised.
An innovation is a commercialised invention and is, therefore, already part of the economic system (Tidd
& Bessant, 2014). The term innovation is commonly used in connection with technological innovations.
This category of innovations comprises new products, processes and significant technological changes
© Central University of Technology, Free State
49 | P a g e
of products and services (Baden-Fuller & Haefliger, 2013). The salient features of innovation are as
follows: novelty, technology, creativity and commercialisation. Thus, invention on its own is a subset of
innovation. In a nutshell, an innovation comes in the form of new products, services, production processes
and organisational/management structures (Tidd & Bessant, 2014). It has different characteristics that
can either be technological, intellectual, physical and behavioural.
In the context of agriculture, innovation is an outcome of the collective efforts of farmers, researchers,
extension workers, traders, service providers and development organisations (Kilelu, Klerkx, Leeuwis, &
Hall, 2013). Kilelu et al (2013) elaborate that the phenomenon of innovation is often accompanied by
technological, institutional and social change. Bragdon and Smith (2015) proclaim that for small-scale
farmers, innovation encompasses the following aspects:
Technological innovations,
Institutional innovation,
The application of indigenous knowledge systems to changing circumstances,
The maintenance, use and development of agro-biodiversity and farm management practices,
Responding to changing socio-economic, technological or environmental conditions and
The adaptation of modern technologies to suit specific local needs.
According to Van der Veen (2010), the goal of agricultural innovation is to increase the levels of
production in terms of food, fodder, secondary products at the same time improving the quality of output,
growing conditions and the production process. Thus, agricultural innovation will touch on areas related
to crops, animals, growing conditions and implements. These are covered in the next subsection.
3.3. Facets of agricultural innovation
As highlighted in the preceding paragraph, agricultural innovations are wide ranging and impinge on the
following areas: crops, animals, growing conditions, implements and management practices. The
subsequent sections discuss these dimensions each in turn.
3.3.1. Innovations in crop production
Crop innovations incorporate biological or genetic modification of crops leading to new breeds and
varieties (Barrows, Sexton & Zilberman, 2014; Klumper & Qaim, 2014). The outcomes of such
innovations include higher-yielding or drought-resistant varieties leading to food security (Qaim & Kouser,
2013). Apart from improved productivity and greater food availability, the biological and or genetic
modification of crops introduces new species that extend the farming calendar or the type of farming, a
© Central University of Technology, Free State
50 | P a g e
development that may improve the farmers’ income (Barrows et al., 2014; Fuglie, 2016). Other
innovations in crop production include new farming techniques like conservation agriculture, which albeit
its supposed merits, has not been fully supported in the developing world where it is supposed to bring
benefits (World Trade Report, 2014).
3.3.2. Innovations in animal husbandry
Over the years, animal husbandry, a branch of agriculture that entails the day-to-day care, breeding and
the raising of livestock for the purpose of meat, milk, fibre and eggs has also encompassed biological
and/or genetic changes to improve yields (Eisler, Lee, Tarlton, Martin, Beddington, Dungait &
Misselbrook, 2014). Although ethically controversial, biotechnological techniques like cloning have been
widely used to preserve good quality animal species and enhance disease resistance in livestock (Laible,
Wei & Wagner, 2015). Apart from that, finding new and innovative ways to extract more value from
domesticated animals had been emphasised. For instance, secondary products like wool, blood and milk
extracted from animals, in addition to the primary products like meat and hides, is a growing focus of
attention.
3.3.3. Innovation of crop growing conditions
Like in crop and animal husbandry, the whole practice of farming has evolved in its application. For
instance, innovative methods of farming like the adoption of organic agriculture and use of bio-fertilisers,
natural pesticides; crop rotations, intercropping and relay intercropping and mulching, among others, are
widely practiced in emerging economies (Wezel, Casagrande, Celette, Vian, Ferrer & Peigné, 2014).
However, organic agriculture is contentious as far as efficiency and productivity is concerned. As an
illustration, Reganold and Wachter (2016) note that organic agriculture gives lower yields in comparison
to orthodox agriculture. However, its redeeming features are: (i) its profitability, given that it serves
dedicated and loyal markets (ii) its environmental friendliness, and (iii) its low or no pesticide deposits
compared with conventional farming (Levidow, Zaccaria, Maia, Vivas, Todorovic & Scardigno, 2014).
However, there has been a low uptake of some innovative farming practices like water-efficient irrigation
practices, because intended beneficiaries have no inducements to adopt more efficient agricultural
practices (Levidow et al., 2014).
3.3.4. Innovation through new agricultural implements
Innovation in agriculture also lies in the introduction of more efficient farming implements (Long, Blok &
Coninx, 2016). The need for innovation in agricultural equipment cannot be over-emphasised, given that
farmers in developing countries generally find generic agricultural equipment such as soil tillers, planters
© Central University of Technology, Free State
51 | P a g e
and harvesters expensive (Family farm, 2014). Thus, innovative, scale appropriate farm implements
afford small-scale farmers in the developing world the opportunity to conserve natural resources, improve
productivity and increase profits (Spiegel, Mocollo & Cady, 2016). As an illustration, Bangladesh has
been a source of agricultural implement innovations, chiefly those that are jointly used with two wheel
tractors that are suitable for small-scale farmers (Baudron, Needle, Rijnsdorp, & Marshall 2014). Such
made-in-Bangladesh innovations include zero tillage and strip tillage seed and fertilizer drills, bed
planters, axial flow irrigation pumps, strip tillage blades, improved furrow openers and seed metering
mechanisms. For a country where small-scale farmers constitute a large component of the agrarian
economy, the adoption of innovative agricultural implements has developed the accuracy and swiftness
of planting and harvesting processes while dropping fuel, irrigation water and labour needs.
3.4. Reasons for small-scale agricultural enterprises’ pursuit of innovation
A review of literature reveals a number of reasons why small-scale agro-businesses seek to innovate.
These can be categorised as the need to mitigate exposure to risk, the need to take advantage of
business opportunities, as well as preserving particular local socio-cultural practices. These reasons are
dealt with in detail in the following section.
3.4.1. Risks
One of the reasons why small-scale agri-businesses are under pressure to innovate, is the increasing
risk on agricultural competitiveness and productivity created by the rising environmental unpredictability
and intensifying environmental pressures. As an example, Uddin, Bokelmann and Entsminger (2014)
observe that there has been an increase in the frequency of drought and soil nutrients’ depletion,
phenomena which compromise agricultural productivity and competitiveness - particularly in the
developing world. In the case of climate change, farmers are forced to be innovative in terms of crop
selections, crop rotation and timing of planting seasons to cope with increasingly shorter and
unpredictable rain seasons (Mehar, Mittal & Prasad, 2016). With regard to environmental degradation,
small-scale farmers are forced to be innovative in terms of their land rehabilitation and adaptation
methods so as enhance their agricultural output (Shiferaw, Tesfaye, Kassie, Abate, Prasanna & Menkir,
2014).
Subsidised agricultural imports force down local prices - in the process creating market risks for local
small-scale agro-businesses as their products will be uncompetitive against the imports (Takeshima &
Liverpool-Tasie, 2015). Thus, local small-scale businesses are forced to come-up with improved ways of
lowering production costs and earning revenue. Lastly, concerns about food insecurity in the face of a
© Central University of Technology, Free State

52 | P a g e
growing global population also calls for better ways of producing more food to counter starvation and
malnutrition (Juma, 2015).
3.4.2. Opportunities
Like any other forms of business, small-scale businesses innovate as a response to windows of
opportunities in the market place. Such windows that present opportunities to generate more income and
make profit increase as the market for agricultural produce grow. For instance, participation in foreign
trade creates more opportunities for cash crops (e.g. tobacco, cotton, and sunflowers) and further
processed products for high value markets crops, as well as the opportunity to participate in downstream
and upstream activities in the agricultural value chain. Apart from this, the availability of funds and
supporting infrastructure for innovation gives small-scale agro-businesses the impetus to experiment with
ideas in order to improve the manner in which they conduct their economic activities.
3.4.3. Socio-cultural and demographic factors
In the case of small-scale farmers in the developing world, the aspiration for communal respect and
prestige within society also incentivises them to engage in innovative activities. As an illustration, findings
from Eyhorn’s (2007) study on the adoption of organic farming for sustainable livelihoods in developing
countries revealed that farmers who adopted organic agriculture envisioned themselves as community
leaders. In addition, they also felt that their social status had improved because of their improved
economic conditions. This observation is corroborated by Wolfenson (2013) and BenYishay and Mobarak
(2013) who proclaim that one’s designation as a lead farmer ascribes higher social standing and respect.
It can also be stressed that the inclination of small-scale agro-businesses is also a function of
inquisitiveness, the tendency to try-out new things (Ololube, Uriah & Dudafa, 2014) and other personal
characteristics like age, gender and education (Parrotta, Pozzoli & Pytlikova, 2014; Läpple, Renwick &
Thorne, 2015). A study on the relationship between individual work-related curiosity and worker
innovation conducted by Celik, Storme, Davila and Myszkowski (2016) revealed that individual work-
related curiosity was a positive predictor of worker innovation and that worker-divergent thinking mediated
this relationship. When juxtaposed to the agricultural context, the implication of this finding is that
individual inquisitiveness supports exploratory skills, which in turn support agricultural innovation.
© Central University of Technology, Free State
53 | P a g e
3.5. Approaches to innovation in small-scale agri-businesses
Owing to the reasons mentioned in Section 3.3, small-scale agri-businesses are continuously innovating,
generating their own creations. A review of literature reveals a number of approaches through which
small-scale agri-businesses innovate. The next sub-section discusses these approaches.
3.5.1. Innovation platforms
One approach to agro-processing innovation is the use of innovation platforms, also known as multi-
stakeholder platforms, innovation networks or learning alliances. According to Cullen, Tucker, Snyder,
Lema and Duncan (2014:263) innovation platforms (IPs) are “forums that are designed to bring together
stakeholders from different interest groups, disciplines, sectors and organisations to exchange
knowledge, ideas and resources and take action to solve common problems in order to bring about a
desired change.” The system of innovation is generally adopted as a way of including all stakeholders in
the innovation process. Such stakeholder may include government, public sector agricultural research
institutes, private companies, universities, the agri-food industry and farmers’ organisations. In the
context of agriculture, innovation platforms are a new framework for inclusive innovation. For example,
Sanyang, Pyburn, Mur and Audet-Bélanger (2014) provide evidence of the success of innovative
platforms in maize value-chain projects that support smallholder farmers in West-Africa. According to
these scholars, Burkina Faso saw a marked increase in the level of commercial maize seed production
following the adoption of innovation platforms through Institut de l’environment et de recherche agricoles
(INERA) in 2008.
The chief merit of innovation platforms lies in their perceived potential as a robust means for fostering
agricultural research for development (Schut, Klerkx, Sartas, Lamers Mc Campbell, Ogbonna, & Leeuwis,
2016). Through increasing interaction, innovation platforms facilitate integrated, systemic innovation that
is essential for achieving agricultural development impacts. However, there have been calls for more
robust evidence of the impact of the interventions (Sanyang et al., 2014).
3.5.2. Innovation intermediaries
Innovation intermediaries are organisations or bodies that act as middlemen in any respect of the
innovation process between two or more parties (Katzy, Turgut, Holzmann & Sailer, 2013). In agricultural
contexts, the concept relate to “supporting actors that facilitate interaction among disparate or isolated
farmer innovation systems, or between farmer innovators and formal innovation systems” (Bragdon &
Smith, 2015:12). The role of the middlemen includes being translators and disseminators of research or
© Central University of Technology, Free State
54 | P a g e
facilitators of access to knowledge rather than translators and transmitters of this knowledge (Kilelu,
2013).
According to Bragdon and Smith (2015), the generic roles of innovation intermediaries in agriculture
include but are not limited to the following:
Facilitating closer cooperation between farmers and rural extension and advisory service providers
and articulating the needs and demands of farmers.
Providing farmers with information and technical expertise directly and facilitating farmers’ access
to market.
Helping in designing and supporting participatory research and social learning processes.
Building personal relations among actors, building and managing social networks based on trust.
Connecting farmers with investors and service providers such as banks, marketing boards or
supermarkets.
Handling paperwork such as farming records for certification and project funding applications.
Interpreting public standards and developing technical guides for water, pesticide and fertilizer
management and food safety.
Creating an overarching vision regarding the scope and nature of the innovation (i.e. its role in
societal transformation, poverty alleviation and environmental sustainability).
Helping innovators reflect upon and re-interpret their position relative to outside institutional and
economic factors, i.e. provide perspective and facilitate ‘systems learning’.
Bringing awareness of farmers’ creativity and capacity for experimentation into policy dialogues,
participate in farmers’ advocacy and help give farmers a voice to influence national innovation
priorities.
3.5.3. Informal social and economic networks
Because communities are held together by diverse relationships, the actions of players within them
cannot be fully comprehended unless these are linked to those of other community members to whom
they are connected through social networks. According to Farinha, Ferreira and Gouveia (2016), social
and economic ties present individuals and firms with opportunities for learning and robust knowledge
creation. The knowledge created through the networks is used to generate new products and production
processes. Such social ties, which rest on dependence and mutuality can enhance collaboration, lessen
transaction costs, increase market leverage and afford groups of individuals the opportunity to share the
hazards concomitant with carrying out tests and adopting new innovations (Bragdon & Smith, 2015).
These scholars elaborate that small-scale farmers’ innovation is positively correlated with the strength of
© Central University of Technology, Free State

55 | P a g e
intra-community linkages and that small farmers are more inclined to adopt new farming technologies
and practices from their fellow farmers than from any other source.
3.6. Theories of innovation
While innovation is a multifaceted concept that has enticed numerous theories traversing across fields,
only four and most applicable theories apply to this study. These are the Creative Destruction Theory
(Schumpeter, 1942), the Disruptive Innovation Theory (Christensen, 1997), the Diffusion of Innovation
Theory (Rogers, 1962) and the Henderson and Clark theory (1990).
3.6.1. The Creative Destruction Theory
The Creative Destruction Theory, a brainchild of Joseph Schumpeter - an Austrian economist, takes an
economics perspective to innovation. At the heart of the theory is the revolutionary role of innovation in
bringing about market and economic changes. Schumpeter (1942) argues that economic change comes
through the creative destruction that is initiated by innovation and innovation arises when a new order
replaces an old order. Creative destruction is the explanatory force behind the morphing of markets from
competitive to monopolistic structures, or vice versa.
The theory reasons that small firms, because of their size and concomitant flexibility, are optimally placed
to innovate when compared to larger firms, which are handicapped by their bureaucratic structures.
However, Schumpeter recognised the advantages that large firms, because of their better resources and
market leverage, have over small firms in terms of innovation.
3.6.2. Diffusion of Innovation Theory
Rooted in the sociological realm, this theory is a brainchild of Rogers (1962). The theory fundamentally
explains how societies adopt new things and innovations. Thus, the process of adoption is here termed
innovation. Rogers (1962) observed that the process takes place over a long period of time, and can be
slow or fast. According to him, the process of diffusion of innovations is affected by four main factors i.e.
inventions, channels of communication, time and social systems. Other factors include the features of an
innovation, the nature of the decision-making process involved, individual characteristics, effect of
innovation on society, and lastly, the communication channels used by adopters. There is a wide
spectrum of adopters of innovation and these include innovators, early adopters, early majority, late
majority and laggards. The Diffusion of Innovations Theory underscores the role of opinion leaders and
information networks in the adoption of innovations, which mirrors small-scale agro-processers’
© Central University of Technology, Free State

56 | P a g e
occasional dependence on informal peer community and informal decision makers for their adoption of
agricultural innovations.
3.6.3. Disruptive Innovation Theory
Christensen’s (1997), the Innovator’s dilemma summarises this theory. According to the theory, a
disruptive innovation is any new product that leads to new markets and value networks culminating in the
displacement of old technology with the new technology. In essence, such innovations bring about radical
changes to markets. The theory focuses mainly on technological innovations and draws attention to how
seemingly invincible technological products can be abruptly displaced by new ones, creating new growth
pathways for entities that initiate them.
The process of introducing disruptive innovations takes time and follows a number of stages:
i. Early stage- at this stage innovation serves a niche market.
ii. Later stage-the product attributes would be modified to suit and serve the traditional markets.
iii. Disruption-at this stage, the new technology completely displaces the old technology.
3.6.4. The Henderson and Clark Theory
A subset of the Product Innovation Theory, the Henderson-Clark Model gives insight into the different
types of product innovations and how these can be distinguished. The theory emerged following the
realisation of the inadequacies of a simple categorisation of innovations as either incremental or radical.
The theory argues that such a categorisation badly explained why and how firms innovate. Thus, the
Henderson-Clark Theory proposes a different framework to addressing the said shortcomings from
previous models. The theory proposes that innovative knowledge arises from two types of knowledge i.e.
knowledge about components and knowledge about the links between these components. Knowledge
about components relates to the design of components, while knowledge about links is about how
components connect to form a whole entity.
The differences between the two sets of knowledge clarify how innovators differ from each other. Figure
3.1 shows the four types of innovations arising from such distinctions.
© Central University of Technology, Free State
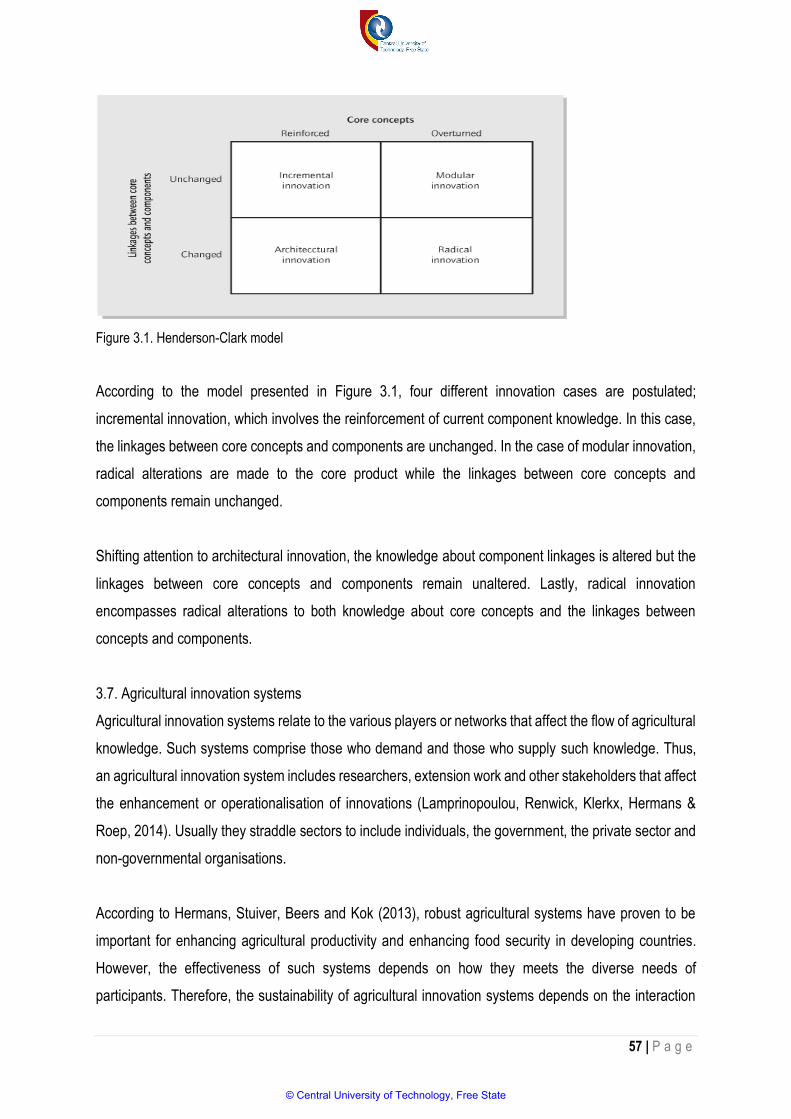
57 | P a g e
Figure 3.1. Henderson-Clark model
According to the model presented in Figure 3.1, four different innovation cases are postulated;
incremental innovation, which involves the reinforcement of current component knowledge. In this case,
the linkages between core concepts and components are unchanged. In the case of modular innovation,
radical alterations are made to the core product while the linkages between core concepts and
components remain unchanged.
Shifting attention to architectural innovation, the knowledge about component linkages is altered but the
linkages between core concepts and components remain unaltered. Lastly, radical innovation
encompasses radical alterations to both knowledge about core concepts and the linkages between
concepts and components.
3.7. Agricultural innovation systems
Agricultural innovation systems relate to the various players or networks that affect the flow of agricultural
knowledge. Such systems comprise those who demand and those who supply such knowledge. Thus,
an agricultural innovation system includes researchers, extension work and other stakeholders that affect
the enhancement or operationalisation of innovations (Lamprinopoulou, Renwick, Klerkx, Hermans &
Roep, 2014). Usually they straddle sectors to include individuals, the government, the private sector and
non-governmental organisations.
According to Hermans, Stuiver, Beers and Kok (2013), robust agricultural systems have proven to be
important for enhancing agricultural productivity and enhancing food security in developing countries.
However, the effectiveness of such systems depends on how they meets the diverse needs of
participants. Therefore, the sustainability of agricultural innovation systems depends on the interaction
© Central University of Technology, Free State

58 | P a g e
between the participants or stakeholders, institutions and the existence of an environment that supports
innovation (Schut, Rodenburg, Klerkx, van Ast, & Bastiaans, 2014).
3.8. Innovation-productivity relationship-An overview
According to Carayannis and Grigoroudis (2016), the notions of innovation, productivity, and
competitiveness are innately linked. The introduction of novel products in the market generates new
demand, often leading to improved economies of scale (Kritikos, 2014). Assuming a new production
process, technique or technology may have a knock effect on the level of productivity because of the
production of new products and efficient use of inputs (Mohnen & Hall, 2013). Most relevant to agro-
based firms is process innovation, which essentially is accompanied by new production processes that
are implemented to lower production costs through greater returns to scale. The positive impact of
innovation on productivity emerges from enhanced price competitiveness of a firm’s products due to price
reduction following the initial improvement in productivity (Roos, 2016). In target markets where demand
is price elastic, a disproportionate growth in sales often follows on initial improvements in productivity.
This leads to productivity enhancements due to improved returns to scale.
3.9. Significance of SSABs in agricultural innovation and development
There is a convergence of opinion among policy-makers and academics on the important role of
innovation in generating small-scale agricultural businesses’ (SSABs) growth and promoting social
development in factor driven-economies of the developing world (Hung & Chou, 2013; Camisón & Villar-
López, 2014). The significance of innovations in such contexts is ascribed to the contemporary
competitive environment arising from increased globalisation, deregulated foreign trade and improved
information and communication technologies. Extant literature suggests that in any economic sector,
SMMEs are more inclined towards innovation compared to larger firms (Spithoven, Vanhaverbeke &
Roijakkers, 2013; Deschryvere, 2014; Klewitz & Hansen, 2014; Triguero, Córcoles & Cuerva, 2014). This
readiness to innovate is attributed to the economic factor mobility in small firms leading to more relative
dynamism and responsiveness to market trends. Results from Annan-Diab’s (2012) study on the role of
SMMEs in innovation in the European Union underscores the fact that the impact of SMMEs in innovative
systems is appreciated in circumstances where these are many, representing a large bloc of economic
activity within a particular country.
While this may not readily apply to the agriculture sector, technology-based SMMEs in other spheres of
economic activity generate and exploit new technologies (Lin and Rasiah (2014). This leads to the
development of new economic sector, setting the scene for future innovations of the economy (Chen &
© Central University of Technology, Free State
59 | P a g e
Zhang, 2014). Thus, high-tech SMMEs will provide a robust source of new technologies to larger firms.
Arguably, countries with such innovative SMMEs will be an ideal investment destination for related
businesses. Evidently, the significance of innovative SMMEs, SSABs included, cannot be over-
emphasized. However, literature suggests that SMMEs are naturally disadvantaged as far as generating
innovations is concerned. According to Annan-Diab (2012), larger entities operating in a concentrated
market are the major source and instigators of technological evolutions. The underlying argument is that
large firms are better positioned to foot the bill needed to undertake the research and development
activities that are a major source of innovation. The Sillicon Valley project involving large start-up firms in
the United States attests to this. Their size affords them the opportunity to enjoy economies of scale in
the production of innovations. Moreover, external funders are more willing to support research and
development projects of large firms (Hottenrott, Lopes-Bento & Veugelers, 2015; Lee, Sameen &
Cowling, 2015).
Notwithstanding, past studies on the relationship between firm size and innovation have not found a
significant direct effect of firm size. Regardless of this observation, there is evidence that small firms
encounter numerous hindrances to their efforts to innovate. These hindrances include restricted access
to capital, excessive perceived economic risks, exorbitant innovation costs, lack of qualified personnel
and information on technology, among many factors (Klewitz,& Hansen, 2014; Pinget, Bocquet & Mothe,
2015; Bigliardi & Galati, 2016). The next section deals with the area studies for agro-based industries in
different contexts.
3.10. Studies on innovation in agro-based firms in advanced AND emerging economies
3.10.1. European Union
While innovation drives the productivity, profitability and competitiveness in the agricultural sector
(Organisation for Economic Cooperation and Development [OECD], 2013). Läpple, et al., (2016) contend
that the European agricultural sector operates below potential in terms of innovation capacity. The
scholars believe that such a scenario undermines the competitiveness of the European Union agro-food
industry. The OECD (2013) argues that there are marked differences in agricultural innovation across
member states of the European Union, owing to a number of factors among which are differing policies,
institutions and operational environments.
Renwick, Läpple, O’Malley and Thorne’s (2014) investigation into the performance of the Agri-food
Innovation System within Ireland made some interesting revelations. Using indicators categorised in
© Central University of Technology, Free State

60 | P a g e
terms of innovation inputs (e.g. private and public investment in research and development [R&D]),
innovation outputs (e.g. patents, publications) and innovation outcomes (firm and farm performance), the
findings from the study showed that Ireland has the 5th most innovative agri-food sector in the European
Union according to this index, behind Denmark, Finland, Germany and the Netherlands. The country’s
research capacity, education levels, physical infrastructure, tax regime, government support, regulation,
advisory services and training in agri-food skills were identified as the major facilitators of innovation at
farm-level. On the other hand, land mobility, age structure, farm business structure, power of
supermarkets and availability of finance were acknowledged as the key impediments to innovation.
The major conclusion drawn from Renwick et al.’s (2014) study was that although Ireland’s agro-food
sector is comparatively strong in innovation, it had relatively limited capacity to develop new products. It
was also noted that although Ireland had innovative and globally competitive companies, the number was
very limited to make the country a global leader in agro-innovation.
3.10.2. Vietnam
Vietnam is one of the most populated countries in the world with 93.5 million people. The population is
projected to rise to 98.2 million by 2020. A surging population size brings along the responsibility to
guarantee a secure supply of food. The country’s agriculture sector contributes 18.1% of the GDP and
employs 47% of the adult population. The sector has experienced steady growth in recent years, with
rice being the primary agricultural product. Table 3.2 presents the trends in Vietnam’s agriculture
production over the years.
© Central University of Technology, Free State

61 | P a g e
Table 3.1: Crop Production and Livestock in Vietnam
Despite the seemingly upward trend in agricultural productivity, the World Bank (2017) in its report entitled
“Transforming Vietnamese Agriculture: Gaining more from less” underscores the need for Vietnam to
restructure its agricultural sector in order to make it more viable and sustainable. The suggestion is that
the focus should switch from primary production to agro-processing. However, this measure has a
downside in that employment in the primary agricultural sector will sharply fall from the current 47% if
agro-processing comes in as it requires more technology and mechanisation, which has the potential to
reduce labour intensity. Another suggestion is for the country to improve the quality of the product for
export purposes. According to the Food and agriculture organisation of the United Nations [FAO] (2016),
the Vietnamese government is considering revamping the agricultural sector by increasing the adoption
of innovative products and technology in the value-addition process.
© Central University of Technology, Free State

62 | P a g e
3.10.3. Uganda
Uganda is one African state that has taken huge steps to enhance innovation in its agricultural sector.
The country boasts of one of the most diversified agro-business sectors, which is characterised by
different sized suppliers of agricultural inputs, agro-dealers, farming activities, harvesting and post-
harvest undertakings like processing of raw output, branding, and marketing of value-added agri-food
products that are targeted towards the final consumers (Kearney, 2016). The country’s Global Innovation
Index rankings (GII) between the years 2013 to 2016 reveal it to have consistently outperformed other
countries in Africa, which are at the same level of economic development. The agricultural sector is key
to Uganda’s economy constituting 73% of the total employment in the country and contributing 14%
towards the country’s GDP at the end of 2014. However, the overall competitiveness and productivity of
the country’s agricultural sector has encountered a series of setbacks as shown by a general lack of
profitability in recent years.
Lybbert, Saxena, Ecuru, Kawooya and Wunsch-Vincent (2017) proclaim that the output from the Uganda
agri-food sector fell from 7.9% in 2001 to 3% in 2014, a rate which is lower than the 6% annual agricultural
sector growth rate that was proposed by the African governments under the Comprehensive Africa
Agriculture Development Programme. Innovation in the country’s agro-sector is hindered mainly by the
fact that most of the agriculture producers are small and thus total arable land under cultivation is in the
hands of small farmers who have neither the ability nor motivation to invest in innovation and productivity.
The same farmers are hampered by erratic rainfall patterns; natural disasters; uninsured production;
inadequate funding, poor training and narrow market prospects among others. Thus, Uganda has to act
on the barriers to innovation and productivity if it is to reap any economic rewards from the agriculture
sector. Such actions may include strengthening its institutions to sponsor and safeguard intellectual
property rights, nurture innovation, and afford a supporting milieu to encourage cooperative action.
3.10.4. South Africa
Although the South African agriculture sector contributes only about 2.5% to the country’s GDP and
approximately 8% to formal employment, it is among the most established and innovative in Africa,
producing various products for both the domestic and international markets. The country’s agro-business
sector is well supported by the research, development and innovation efforts from the Agricultural
Research Council (ARC) and universities. Different from most sub-Saharan African countries,
commercial farming contributes the bulk of agriculture production in South Africa, with subsistence
farmers producing only 10%.
© Central University of Technology, Free State
63 | P a g e
According to the Department of Agriculture, Forestry and Fisheries’ (2016) Operation Phakisa policy
document, a disturbing feature of South Africa’s agriculture sector is the technological imbalance across
participants. As an illustration, South African commercial farming activities are technologically advanced
as compared to smallholders and subsistence producers. Most of the technology which may be in the
form of agricultural inputs or implements is either imported or locally operated under licence. Thus, most
of the growth in the productivity levels of the South African agriculture sector has been driven by
innovations in the commercial sector and through imports.
Apart from a large and commercially driven primary production sector, South Africa boasts of a highly
developed and growing agro-processing sector. This is attributed to an increase in the consumption rate
of processed food in the country. According to Trade and Industrial Policy Strategies (TIPS) (2017), the
industry is skewed and concentrated in the hands of a few big players at the expense of smaller players.
Table 3.2 presents a summary of the statistics on the levels of dominance in the sector.
© Central University of Technology, Free State
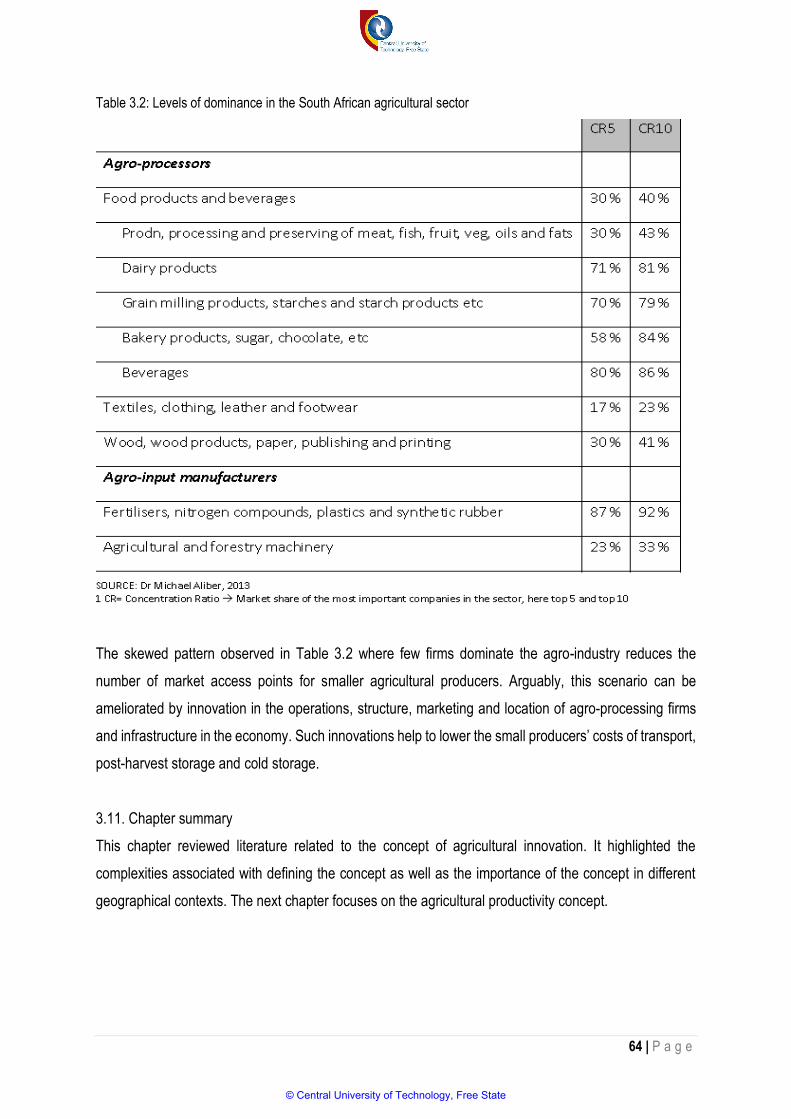
64 | P a g e
Table 3.2: Levels of dominance in the South African agricultural sector
The skewed pattern observed in Table 3.2 where few firms dominate the agro-industry reduces the
number of market access points for smaller agricultural producers. Arguably, this scenario can be
ameliorated by innovation in the operations, structure, marketing and location of agro-processing firms
and infrastructure in the economy. Such innovations help to lower the small producers’ costs of transport,
post-harvest storage and cold storage.
3.11. Chapter summary
This chapter reviewed literature related to the concept of agricultural innovation. It highlighted the
complexities associated with defining the concept as well as the importance of the concept in different
geographical contexts. The next chapter focuses on the agricultural productivity concept.
© Central University of Technology, Free State

65 | P a g e
4.1. INTRODUCTION
4.2. DEFINING AGRICULTURAL PRODUCTIVITY
4.2.1. Measuring agricultural productivity
4.2.1.1 Land productivity
4.2.1.2. Labour prductivity
4.3. AGRICULTURAL
COMPETITIVENESS
4.4. IMPORTANCE OF AGRICULTURE
4.4.1. Poverty and well-being
4.4.2. Promoting food security
4.4.3. Structural transformation of the labour
market
4.4.4. Involvement in foreign trade
4.5. FACTORS AFFECTING GROWTH OF AGRIC
PRODUCTIVITY
4.5.1. Technological
changes
4.5.2. Agriculture research and
extension services
4.5.3. Farm size
4.5.4. Factor intensity
4.5.5. Human capital
4.5.6. Investment in public facilities
and infrastructure
4.5.7. Natural resource
endowments
4.6. CASE STUDY
4.6.1. Europe
4.6.2. Latin America
4.6.3. Africa
4.6.4. South Africa
4.6.5. Zimbabwe
4.7.CHAPTER SUMMARY
© Central University of Technology, Free State

66 | P a g e
4.1. Introduction
The previous chapter examined the concept of innovation to provide a comprehensive perspective on
the influence of agricultural innovation on the productivity and competitiveness of small-scale
agricultural firms. In view of economists and policy-makers’ growing concerns about the sustainability of
current and future food supply and future food requirements across the globe, the current chapter
examines the intricate relationship between agricultural productivity and competitiveness of agro-
processing firms. The World Bank (2015) projects that the world’s population will be at 9 billion by the
year 2050, while the United Nations (2015) forecasts it to swell from 7.3 billion in 2015 to 9.7 billion by
2050. In the same time frame, the global middleclass is expected to increase from 50% to 70% with
developing countries contributing a large proportion to this growth, and contributing to increased
pressure in global consumption. This growth of the middle class is expected to be accompanied by a
substantial increase in spending on expensive food, feed, fibre and fuel (Steensland, 2016) raising
critical questions about the capacity of agro-processing firms to meet this growth in demand.
The United Nations (2014) projects that the urban populations across the world will increase by 2.5 billion.
As such, the consequence of this rapid urban sprawl could be the dwindling of the world’s countryside
population leading to the shrinking of human capital needed for farming and food production in labour
intensive rural farms. The World Bank (2015) highlights that the increased urban population would require
a 50% increase in the level of output of crops, livestock and fisheries. The dependence on agricultural
inputs in developing countries can also be offset by improved agricultural productivity of agro-processing
firms and its implications for the competitiveness of such firms.
This chapter addresses the meaning, determinants and methods of measuring agricultural productivity
and competitiveness. In addition, case studies on agricultural productivity and competitiveness from
across the world are presented.
4.2. Defining agricultural productivity
Although it is uncontested that the effectiveness of a business’ application of resources in the production
of goods and services contributes to its productivity, the exact meaning of agricultural productivity is
contested. In the agricultural sector, productivity refers to the relationship between inputs and outputs
(United Nations Conference for Trade and Development, 2015) implying that a more productive entity will
have a higher proportion of outputs in relation to its inputs in comparison to a less productive one. In
other words, the concept of productivity relates to the effectiveness of the farming process involving the
© Central University of Technology, Free State
67 | P a g e
conversion of inputs into outputs (agricultural goods and services). By extension, a temporal variation in
the ratio of outputs to inputs is known as productivity growth.
4.2.1. Measuring agricultural productivity
While national governments, non-governmental organisations and world bodies recognise the need for a
drastic improvement in the level of performance of the agriculture sector to ensure food security (Juma,
2015), the precise measurement of agricultural productivity is inherently complex. However, a review of
literature reveals that the performance of the agriculture sector is assessed using production (i.e. level of
output), productivity (i.e. output per unit of input) and efficiency (i.e. actual output relative to potential
output) (Gollin, Lagakos & Waugh, 2014). Although these three are generally acceptable measures,
productivity is the commonly used measure because of its contribution to a healthy and thriving economy
(Giannakis & Bruggeman, 2015). Capalbo and Antle (2015) observe that the agricultural productivity
measures can be sub-divided into three broad categories; namely total, multi-factor and partial
productivity.
The term total factor productivity is generally understood to mean an index of total outputs over an index
of total inputs (Capalbo & Antle, 2015). This measure evaluates how an entity can make the best use of
a set of inputs to produce outputs. In deriving this index, factors used in farm production like land, labour,
physical capital and material inputs (seed, fertilisers, chemicals and livestock) are rated against total
quantity of agricultural output. Like all index numbers, however, total factor productivity depends on the
approach used to aggregate various outputs and various inputs. Because of this sensitivity, different
aggregation methods lead to different indices being derived, complicating the accuracy of the measure
particularly in some least developed countries where the quality of statistics is poor.
Given that it is difficult to deduce the full set of inputs used to produce particular agricultural outputs,
multi-factor productivity is used in place of total factor productivity. A common characteristic of both multi-
factor productivity (MFP) and total factor productivity (TFP) is that they are calculated on the basis of
more than one input factor (Alston & Pardey, 2016). Thus, they compare agricultural output at a particular
time against a basket of input factors. The measures demonstrate the collective impact of diverse factors
like the adoption of new agricultural technologies, improvement in agricultural expertise and restructuring
of the production process on agricultural production. An alternative productivity indicator to multiple factor
productivity and total factor productivity is partial factor productivity. In literature, this term refers to an
index used to measure how output per unit of a particular input changes over time (Kimura & Sauer,
© Central University of Technology, Free State
68 | P a g e
2015). The main partial factors in agriculture are labour and land. These sub-components are addressed
below.
4.2.1.1. Land productivity
Agricultural productivity needs to be understood with reference to land productivity as much of the former
unfolds on arable land. Land productivity refers to the quantity of land needed to meet food requirements
(Desiere & Jolliffe, 2017) with in given country or geographical region. This can be interpreted to mean
the crop yield per amount of land such as tons of maize per hectare of land, which depends on among
other considerations on the quality of land.
4.2.1.2. Labour productivity
According to Dorward (2013), labour/work productivity is the amount of work undertaken within a specific
time unit by an individual worker. This type of productivity depends on aspects like agriculture related
knowledge, technology and nature of administration systems (Andrews, Criscuolo & Gal, 2016). As an
example, small-scale subsistence farmers tend to engage in labour-intensive agricultural activities in the
developing nations whose output per unit of labour applied is relatively low. Based on a study conducted
in Bangladesh, Hussain, Talukde and Ahmed (2015) assert that, generally, labour productivity in
agriculture is relatively lower compared to non-agriculture-based economic sectors.
Small-scale agricultural enterprises (SSAEs) in both South Africa and Zimbabwe tend to employ less than
10 persons and are owned and or managed by the same person (Agbobli, 2013). While labour
productivity statistics unique to the agriculture sector are not available, Food and agriculture organisation
of the United Nations [FAO] (2015) suggests that the agricultural value added per worker in South Africa
rose from US$3 866 in 2000 to US$7 238 in 2014. In the case of Zimbabwe, the trend has been downward
with US$474 in 2000 and US$ 279 in 2014.
For the purpose of fulfilling the objectives of this study, financial and non-financial measures of
productivity are used. As for financial measures, aspects like sales revenue, gross profit, net profit,
percentage return on investment among others are used. In the case non-financial productivity, the
following measures are used: output levels, output per hectare, capacity utilisation per hectare and growth
are used.
© Central University of Technology, Free State

69 | P a g e
4.3. Agricultural competitiveness
The definition of agricultural competitiveness is heavily contested in literature as no single definition is
comprehensive enough to cover all the nuances of the concept (Wigier, 2014). The diverse
characterisation of agricultural competitiveness arise from the varying units of analysis, which range from
national, sectoral, or firm-level indicators. As such, agricultural competitiveness is a relative measure
founded on multiple contexts of application. The definitions are summarised in Table 4.1 below.
Being competitive refers to the ability of an agro-processing firm to deliver goods and services at the time,
place and form sought by overseas buyers at prices as good as or better than those of other potential
suppliers, whilst earning the least opportunity cost returns on resources employed (Sharples & Milham,
1990). This definition takes an economics perspective and is more applicable to firms engaged in
international trade. It is the ability to compete or sell in the competitive marketplace (Latruffe, 2010). The
implication of this definition is that firms with lesser competitive capabilities in terms of price, quality and
quantities are vulnerable and less likely to succeed in a competitive market.
Dlamini (2012) refers to agricultural competitiveness as the ability of agricultural, agribusiness and agro-
industrial concerns to produce and offer products that meet the quality standards of the local and world
markets at prices that are competitive and provide adequate returns on the resources employed or
consumed in producing them. Compared to others, this definition is dedicated to agriculture-related firms,
covers a wide set of variables relating to a firm’s capabilities and is more applicable to the current study.
Conceived as the capability to remunerate its factors of production (Bielik & Rajčániová, 2004) - this
definition adopts an economic perspective where a firm’s competitiveness is evaluated based on its ability
to reward its economic resources. Thus, a firms’ competitiveness is reflected through the level of its
profits, interest and wages paid. The current study adopts an operational definition of agricultural
competitiveness founded at the firm level as follows; “the ability of agricultural, agribusiness and agro-
industrial concerns to produce, process, market and avail products and services that meet the quality
standards of the local and world markets at competitive prices while providing adequate returns on the
resources employed or consumed in producing them.” As such, enhanced competitiveness is conceived
to entail the capacity of an agro-processing firm to overcome inter-firm competition through optimal pricing
or better product offerings in domestic and foreign markets. Drawing on these definitions, it is logical to
argue that enhanced productivity encompasses the productivity, marketability and competent pricing of
product offering, which collectively form the yardsticks for measuring agricultural productivity.
© Central University of Technology, Free State
70 | P a g e
As already alluded to, small-scale agricultural enterprises (SSAEs) in South Africa operate in the
agricultural sector which substantially contribute to national output and exports. Equally important, the
sector guarantees the nation’s food security. Apart from that, the agricultural sector employs about 4.8%
of the country’s workforce (Statistics SA, 2013). Thus, the need for competitiveness of SSAEs in the
sector needs not be over-emphasized. Similarly, SSAEs in Zimbabwe are also major contributors towards
food security, economic development and employment. Numerous scholars refer to the need to improve
the competitiveness of the agricultural sector if Zimbabwe is to reduce its food import bill and regain its
status as the breadbasket of Southern Africa (Mango, Mapemba, Tchale, Makate, Dunjana & Lundy,
2015; Dube, 2016; Mutsvangwa-Sammie, Manzungu & Siziba, 2016). Enhanced competitiveness can
also strengthen the manufacturing sector as agro-processing firms provide adequate raw material inputs
for the domestic processing and value addition of agricultural goods and products. It also contributes to
increased revenue collection by government, which improves the funding of social sectors, infrastructure
and other development programmes, enhances export earnings and expands the country’s foreign
currency reserves (Nworu, 2017). A competitive agriculture sector also increases employment
opportunities, improves standards of living in rural areas and reduces poverty. The next subsection deals
with measuring agricultural competitiveness (Thondhlana, 2015).
4.3.1. Measuring agricultural competitiveness.
As earlier alluded to, agricultural competitiveness is multi-faceted and is therefore measured using
multiple criteria. At firm level, Awale and Rowlinson (2014) proffer that the concept be measured using
economic criteria like agricultural costs, profitability, and productivity. Agricultural competitiveness can
also be assessed using output volumes, yields, unit prices; levels of exports; private investment in the
agricultural sector; value addition; and the ability to lower costs and increase input productivity. The
justification for using such measurements is that the overall focus of firms in the short to long term is on
business efficiency, growth and success.
For the purpose of fulfilling the objectives of this study, agricultural competitiveness is conceptualized in
terms of commercial performance parameters like the product’s market competitiveness, customer
satisfaction, market price competitiveness, business market dominance, product quality, promotional
strategy and organisational competitiveness.
© Central University of Technology, Free State

71 | P a g e
4.4. Importance of agricultural productivity
The value of agricultural productivity can be conceived from the perspective of reducing poverty and
improving well-being of people in different countries, promoting food security and stability of staple food
prices, structural transformation of the labour market and involvement in foreign trade. These issues are
dealt with in the following subsection.
4.4.1. Poverty reduction and promoting well-being
Agriculture competitiveness is a primary determinant of levels of income and quality of life in most
developing countries since it is a key source of employment in such areas (Gollin, Lagakos & Waugh,
2014; Grindling & Newhouse, 2014; Shiferaw, Tesfaye, Kassie & Abate, 2014). For instance, the
International Labour Organisation’s (ILO) labour market statistics reveal that 67.23% of Zimbabwe’s
workforce was employed in the agriculture sector in 2015. In fact, the persistence of low levels of
productivity in the agriculture sector explains why low incomes and standards of life continue to ravage
most agro-based economies in the developing world (Tittonell & Giller, 2013) including Zimbabwe. In the
case of South Africa, with a population of 49 million in 2009 which is growing at 2% per annum, either
food production or imports must expanded by more than double to meet the population explosion (Wise,
2013). This has to be done using the same or fewer natural resources. Recent trends reveal that the
growth in South Africa’s middle class has enabled a substantial section of the South African population
to switch from staple grain crops to a more diversified diet.
The direct relationship between low productivity and income levels is more pronounced in the rural areas
where the low productivity levels are linked to low earnings due to the poor adoption of agriculture
technology (Collier & Dercon, 2014). The end result is that a significant number of households in rural
areas are poor, undernourished and are vulnerable to nutrition deficiency illnesses (Tittonell & Giller,
2013). As can be seen, a growth agricultural productivity is imperative for the well-being of a significant
number households in both Zimbabwe and South Africa.
4.4.2. Promoting food security and stability of staple food prices
According to Chavas, Hummels and Wright (2014), improved agricultural productivity is a leading
indicator of lower food prices in many low-income countries. Lower or stable food prices afford rural
people greater income at their disposal, benefiting food-deficit households in the process (Dorward,
2012). Thus, the stability of such prices contributes directly to improved food security as more poor-prone
rural and peri-urban dwellers gain access to more affordable food in the process. According to the Food
and Agriculture Organisation of the United Nations (FAO, 2015), food security prevails when all people,
© Central University of Technology, Free State
72 | P a g e
at all times, have physical and economic access to sufficient, safe and nutritious food to meet their dietary
needs and food preferences for an active and healthy life. Thus, any improvement in agricultural
productivity contributes to increased food security, stabilising food supply eradication of hunger and
starvation. The Department of Agriculture, Fisheries and Forestry (2016) Economic Review of the South
African Agriculture Report reveals that the estimated volume of agricultural production during 2016 was
2.8% lower than in 2015, with the volume of field crop production having decreased by 6.0%. This was a
result of a decrease in the production of summer grains (maize and sorghum), oilseeds (especially soya
beans and peanuts), as well as sugar cane due to the devastating drought experienced in 2016. Following
this negative development in agricultural production, consumer prices of all agricultural items increased
by 6.3% for the year that ended 31 December 2016. This development serves to show how instability in
production leads to unstable prices and price increases.
4.4.3. Structural transformation of the labour market
According to McMillan, Rodrik and Verduzco-Gallo (2014), there is a huge rift in labour productivity in the
old and current parts of the economy in the least developed countries, creating a situation of allocative
resource inefficiency. For developing economies where most economically active people partake in
agriculture related activities, the augmentation of agricultural productivity through technology transfer and
adoption helps transform the structure of the agriculture sector and labour market (Juma, 2015). That is
to say, increasing the capital intensity of agriculture leads to lower dependence on human labour
(Adekunle, Osazuwa & Raghavan, 2016), and in the process releases essential human capital needed
for other productive sectors of the economy leading to the reconfiguration of the labour market.
According to Olaoye (2014), improved agricultural productivity enhances the supply path for agro-
processing firms and other related service providers. Thus, growth in agriculture competitiveness and
productivity spills over and enhances productivity in other economic sectors. Although the supporting
evidence on this relationship in extant literature is inconclusive, these connections explain the
longstanding economic belief in the need to enhance productivity in the agriculture sector as a
prerequisite for industrial development (Hayami & Yamada, 1969; Adenle, Manning & Azadi, 2017). As
an illustration, Awokuse and Xie’s (2014) investigation of the cause and effect relationships between
agriculture and gross domestic product growth in nine developing countries revealed that although
agriculture productivity affected the economic performance of a country, the influence fluctuates from
country to country. There was evidence of agriculture productivity-led economic growth in some instances
and the need for a vibrant economy as a pre-condition for successful agriculture development in other
cases.
© Central University of Technology, Free State
73 | P a g e
4.4.4. Involvement in foreign trade
Growth in agricultural productivity potentially nurtures exports by reducing the pressure on farmers to
choose between using land for either cash or food crops as room for both alternatives is created
(Awokuse & Xie, 2015). In the process, surplus products that could otherwise have been imported, can
be produced domestically. Such produce can be exported - leading to increased export earnings and the
accumulation of capital reserves, which can be re-invested in other economic sectors (Robinson, 2013).
Another way that agricultural productivity can improve export trade is through the ripple effect of lower
food prices on export competitiveness. Lower food prices make locally produced goods comparatively
cheaper on the international market. In the case of the Zimbabwean situation, Kanyenze, Chitambara
and Tyson (2017) proclaim that the use of the overvalued USD as the main currency of transacting has
undermined export competitiveness, while imports - especially from the major trading partner South
Africa, have become more affordable due to the depreciation of the rand.
4.5. Factors affecting growth of agriculture productivity and competitiveness
There is no universally accepted set of self-contained factors that determine agriculture productivity.
Previously, the economists’ perspective proposed that agriculture productivity is an outcome of the
combination of traditional economic resources like capital, labour, land and entrepreneurship (Gollin,
2010). However, the inadequacy of these explanatory factors has opened avenues for the consideration
of other factors such as climatic and geographical conditions, consumer demand, government
intervention in the agricultural sector among others. Latruffe (2010) separates these factors into those
which agro-processing managers can control and those beyond their control. Factors subject to the
managers’ control include size of the business, its legal status, factor intensity, product specialisation,
production and marketing practices, structure of the land, labour and capital, and the characteristics of
farm labour. Those outside managers’ control include climatic and geographical conditions, consumer
demand, government intervention in the agricultural sector, expenditures in agricultural research,
agricultural extension services, infrastructure and location of activities. The most prominent among the
alternative factors are human capital, public goods, education, agriculture research and extension and
public infrastructure (Tey & Brindal, 2012; Capalbo & Antle, 2015). The paragraphs below address some
of the factors influencing agricultural productivity and competitiveness.
4.5.1. Technological changes
The adoption of modern farming technologies such as combine harvesters and drip irrigation equipment
in least developing countries over the years has transformed agriculture in unprecedented ways.
According to King (2017) a technological revolution in farming led by advances in robotics and sensing
© Central University of Technology, Free State

74 | P a g e
technologies is projected to disrupt modern agricultural practice. The impact of technology, agricultural
mechanisation, use of modern transport, genetically modified plants, development plant feeds, breeding
of disease resistant animals as well as plant irrigation on agricultural productivity and competitiveness is
felt through increased yields per input, lower overhead costs and improved earnings (National Institute
of Food and Agriculture [NIFA], 2017). Sasmal’s (2016) study of the impact of technological change and
adoption on the growth of productivity of the agriculture sector in India reveal positive results. As an
illustration, the study findings show that agricultural productivity in the country significantly increased over
the years owing to the adoption of novel farming technologies like high yielding seed varieties, intensive
farming methods, chemical inputs and the use of ground water irrigation by small-scale farmers.
However, the adoption of these technologies is accompanied by a number of downsides such as
excessive depletion of ground water and serious damage to natural resources. As such, the increasing
consciousness about the shortcomings of some farming technologies has generated calls for adoption of
environmentally sustainable technologies only (Campbell, Thornton & Zougmoré, 2014; Springer &
Duchin, 2014). In the case of Zimbabwe, NGOs have increasingly propagated for new conservation
farming methods in communal farming areas where the adoption of the farming techniques has
contributed to improved yields (Nyamangara, Masvaya, Tirivavi Nyengerai, & 2013). Overall, the adoption
of modern agriculture techniques has generated some growth in productivity, albeit some shortcomings.
The South African agricultural sector is comparatively more technologically sophisticated compared to
those of most sub-Sahara African countries because of a well-established agriculture support
infrastructure and robust agricultural value chain (Bernstein, 2014). This has afforded role-players the
opportunity to develop leading innovations and technologies attuned to the South African environment.
4.5.2. Agriculture research and extension services
Agriculture research and extension services influence agricultural productivity through the generation of
new ideas and knowledge (Aguilar, Carranza, Goldstein, Kilic & Oseni, 2015). They are often conceived
as a potential source of agricultural innovations as they often generate finished goods, services and
technologies (Organisation for Economic Co-operation Development [OECD], 2011). Since agricultural
research and extension services encompasses substantial commitments of resources, the various
stakeholders in the agriculture sector would be concerned about the extent to which such investments
translate into future productivity and competitiveness in the agriculture sector.
Agricultural research and development literature affirms a positive association between the extent and
quality of research and extension and agricultural productivity in the developing world context (Abebaw
© Central University of Technology, Free State
75 | P a g e
& Haile, 2013; Kilelu, Klerkx & Leeuwis, 2013; Ragasa, Berhane, Tadesse & Taffesse, 2013; Berhanu &
Poulton, 2014). In spite of this association, it is difficult to find a suitable methodology for measuring both
agricultural productivity and investment in research and development to provide convincing empirical
evidence on this perceived relationship. As such, there is no documented method of reliably and validly
identifying research and development induced agricultural productivity - hence the complexity of linking
research and development to agricultural productivity. The measurement of the relationship is further
complicated by the reality that findings on agriculture research carried out by private sector are often
proprietary property hidden from the public domain. In some cases, research on agriculture productivity
is not consistently carried out on a sustainable long-term basis, creating gaps in the data inventory on
the subject. However, there is widespread acknowledgement of the trickle-down effect of the benefits of
investment in research and development on productivity (Zhang, Chen & Vitousek, 2013; Hurley, Rao &
Pardey, 2014; Vanlauwe, Coyne & Gockowski, et al., 2014).
4.5.3. Farm size
The relationship between farm-size and productivity is not clear cut (Savastano & Scandizzo, 2017). A
survey of literature on agricultural productivity from across the globe demonstrates that the nature of the
relationship is influenced by contingent factors like the individual characteristics of the farmer, available
agriculture support infrastructure, and the technology in use among others (Adamopoulos & Restuccia,
2014; Ali & Deininger, 2015; Savastano & Scandizzo, 2017). The simple logic in the economic perspective
dictates that productivity increases as farm size increases. The reasoning behind this view is that larger
farms tend to provide larger economies of scale and have better access to output and input markets
compared to smaller ones. Other studies question this simple logic casting doubt on its applicability. For
instance, Savastano and Scandizzo’s (2017) study revealed that there is no unidirectional relationship
between farm size and agriculture productivity. Drawing on their findings and those made from other
scholars in Ethiopia, they deduced an inverted “U” relationship (i.e. direct-inverse-direct) relationship
between farm-size and agricultural productivity. The scholars noted that the relationship was positive for
smallholders, negative for middle scale farmers and positive for large-scale farmers.
Deininger, Nizalou and Singh (2013) explored the farm size-productivity linkage using panel data for the
years 2000-2011 on farming activities in the Ukraine farming estates of a size above 200 hectares. They
observed that higher yields from the farms were a function other unobserved farm level factors rather
than farm size. To illustrate the effect of the unobserved, these scholars argued that the exit of
unproductive farmers and entrance of effective farmers had a significant effect on the productive farms.
© Central University of Technology, Free State
76 | P a g e
4.5.4. Factor intensity
Factor intensity is an economics concept that compares factors of production across various industries
to emphasise the intensity with which an industry employs a given factor (Syverson, 2011; Jian, Deng &
Seto, 2013). In the context of agriculture, extant literature suggests that there is no consistent linkage
between the level of productivity and factor intensity indicators such as capital-labour ratio, or land- labour
ratio (OECD, 2011). For instance, an attempt to enhance technical efficiency by hiring highly skilled and
qualified labour may bring in a new problem related to supervisory issues (Capalbo & Vo, 2015). In the
same vein, there are suggestions that farmers who borrow skilled labour in order to fund their agricultural
activities are most likely to be technically efficient because of the effort these experts exert in order to
meet their debt obligations (Sujan, Islam, Azad & Rayhan, 2017). This observation is corroborated by
Afrin, Haider and Islam’s (in press) investigation of the impact of financial inclusion on the enhancement
of paddy farmers’ Technical Efficiency (TE) in Bangladesh, which reports that “…farmers were
approximately 86% technically efficient and amongst them, credit takers were more efficient than non-
credit takers.” The implication is that developing world farmers can enhance the productivity of their
agricultural activities through committing more technical efficiency and capital.
4.5.5. Human capital
The human capital factor which relates to “a general notion of the knowledge and skills embodied in a
human being which plays an important role in determining their labour productivity” (Yamauchi, 2010:1)
arguably influences the agricultural productivity in any context. Previous studies have reported the
influence of human capital on farm/agricultural technical efficiency and productivity transformation using
pointers like farmers' age or number of years of experience, education level or type, gender, and time
spent on the farm (Carletto, Savastano & Zezza, 2013; Kilic, Palacios-López & Goldstein, 2015). Vu
(2012) describes the unproductive phenomenon of cell-phone or absentee landlord farming in the
Zimbabwean context where landowners resident in towns give the charge of conducting farming activities
to their labourers while they infrequently visit their farms.
The impact of a farmer's age on technical efficiency can be either positive or negative as found in various
studies (Latruffe, 2010; Asante, Villano & Battese, 2014; Chiona, Kalinda & Tembo, 2014). While older
farmers may be reluctant or unable to adopt technological innovations, they are more experienced and
can use their knowledge to use inputs more efficiently. However, Zagata and Sutherland’s (2015) findings
from their European study revealed that lesser participation in agricultural activities by younger
generations undercut the efficiency and economic potential of European agriculture.
© Central University of Technology, Free State
77 | P a g e
Ndour’s (2017) study on the effects of human capital on agricultural productivity in Senegal revealed that
improving the level of education and experience of participants in agriculture is likely to increase yields
and to make the farmers more efficient. The study affirmed that better education and more agricultural
experience enhanced technical efficiency because of the more developed farm-running skills. All things
considered, it can be inferred that investment in the development of agriculture-related human capital
can enhance the level of agricultural productivity.
4.5.6. Investment in public facilities and infrastructure
Empirical studies suggest that farming enterprises operating in areas with more developed public facilities
and infrastructure like transport, water and market facilities tend to have higher farm technical efficiency
(Collier & Dercon, 2014). Tong, Yu, Cho, Jensen and Ugarte’s (2013) study of the spatial spill over effects
of transportation infrastructure on agricultural output across the United States revealed that a state’s road
disbursement had positive effect on the state’s agricultural output - meaning that spending on roads in a
state also had spill-over effect on the state’s agriculture. Bah and Fang (2015) claim that a poor business
environment characterised by low investment in public infrastructure in large parts of sub-Sahara Africa
causes a misallocation of resources - leading to considerable reductions in productivity and output.
4.5.7. Natural resource endowment
Geographic disparities in agricultural productivity may be explained by the features of the physical milieu
in which farms operate (Noltze, Schwarze & Qaim, 2013). For instance, good quality soils are associated
with high technical efficiency of farming activities and better crop yields (Bhardwaj, Ansari, Sahoo &
Tuteja, 2014). Wheeler and Von Braun (2013) also mention the negative influence of climate on
agricultural productivity. They elaborate that there is a marked trend involving climate change negatively
affecting stability of food supply, a development that may disturb the efforts towards a world free from
hunger. The increased frequency of occurrence of catastrophic climatic events like storms, floods and
landslides are also cited as being behind the fall in agricultural labour productivity in some developing
countries across the globe (Burke & Lobell, 2017).
4.6. Case studies
Agricultural development and input utilisation varies spatially and from time to time depending on inter
alia, the individual nation’s stage of economic development, government policy, resource endowment,
market conditions and ecological conditions. In spite of the disparities in terms of productivity, economies
follow the same phases of agricultural development. For instance, Chang and Zepeda (2001) profess
that there are three stages of the agriculture transformation process i.e. land augmentation phase, labour
© Central University of Technology, Free State

78 | P a g e
substitution phase and the knowledge and input intensity phase. This subsection addresses cases
relating to agricultural production, productivity and competitiveness from regions across the world.
4.6.1. Europe
According to the Tangermann, and von Cramon-Taubade (2013) agricultural productivity in the European
Union (EU) is following a steady upward trend. There is a renewed interest in agricultural activity in the
EU as shown by its attempt to adopt resource efficiency by 2020. This is quite a difficult task as human
beings are often resistant to change their conduct. A useful tool monitoring productivity growth is the Total
Factor Productivity (TFP) measure, which the EU seeks to apply consistently in the region. As highlighted
in the earlier sections of the current chapter, this measure indicates the joint effects of numerous factors
such as new technologies, efficiency gains, economies of scale, managerial skill, and changes in the
organisation of production.
According to the Tangermann, and von Cramon-Taubade (2013) the average EU countries’ annual
growth rate for productivity between 1995 and 2005 exceeded 1%. However, it fell to 0.8% between 2005
and 2015. The TFP sharply increased by 9% in 2015 owing to conditions that favoured crop and animal
production. Equally important, this growth in TFP is attributable to the lesser dependency on human
labour and increasing capital investments in the agriculture sector. In the decade preceding 2015, the
agricultural sector in the EU cut its labour force by an estimated 25%.
4.6.2. Latin America
Agricultural activity is arguably at the heart of Brazil's economy with crops like sugarcane, coffee,
soybeans, beef, and crop-based ethanol being the key output and export products. The country is one of
the major producers of food and bio-fuels in the world. According to the FAO (2015), the land area under
harvest in Brazil increased from 263 million hectares in 1990 to 739 million hectares in 2014 (see Figure
4.1 below). Correspondingly, the agriculture sectors contribution to GDP rose from US$9 997 million in
1990 to US$14 555 million in 2014, which is about 33% of the total GDP. The agricultural sector has
undergone significant structural differences compared to what it was like during the 1970s (Filho,
Eustáquio & Fornazier, 2016). For instance, the increasing mechanisation of the sector reduced the
percentage of people employed in the agricultural sector from 22.8% in 1990 to 15.3% in 2014. However,
all agriculture related businesses employ about 17.7 million rural workers in Brazil and contributes 42%
of the country exports.
© Central University of Technology, Free State
79 | P a g e
Significantly, Brazil is a net food exporter with the cereal import dependency ratio percentage at - 3% in
2014. Under those circumstances, the percentage prevalence of under-nourishment population in the
country dropped significantly from 14.8% in 1990 to less than 5% in 2014 (FAO, 2015). All things
considered, Brazil has a vibrant agricultural sector with high levels of crop production which has led to
the country being termed the world's bread basket.
However, the growth of agriculture in Brazil comes amidst a growing population, increasing demand for
food and competition for land and water resources. For this reason, some scholars argue for more
efficient use of the available resources. In fact, estimates suggest that at least 80% of the expansion of
agricultural output will come from improved productivity associated with technology adoption and
mechanisation (Filho et al., 2016). In that case, Brazil is well-placed for such a development given the
country's strong capital investment and technological innovation that have contributed to an estimated
70% increase in value-added crop production over the past decade. Export growth in beef, poultry, sugar
and ethanol and soya beans testifies to such technology innovation even though such innovation is not
uniform across the country.
To further illustrate the productivity improvements in the country, Brazil produced 150.8 million tons of
grain compared to 17.2 million in 1960, in the face of an estimated 190.7 million inhabitants in 2010
compared with 70 million in 1960. The 2010 tonnage was produced using 47.5 million hectares of land.
Had the farmers been using the 1960 technology, they could have required estimated 145 million
hectares. In terms of productivity level, the country had 783 kilogrammes per hectare of cereals in 1960
compared to 3 173 kilogrammes per hectare in 2010. Livestock productivity rose from 0.47 heads per
hectare in 1960 to 1.2 heads/hectare in 2010 (Lora, 2012; FAO, 2015).
© Central University of Technology, Free State

80 | P a g e
Table 4.1: Agricultural productivity in Brazil (Source: FAO 2015)
4.6.3. Africa
Zambia is a typical example of an African country that boasts of a well-supported and vibrant agricultural
sector that ranks among the best on the African continent. Participants in this sector range from large,
medium and small-scale subsistence farmers who actively participate in the country's agricultural value
chain. Table 4.2 presents data on Zambia's farming sector.
© Central University of Technology, Free State
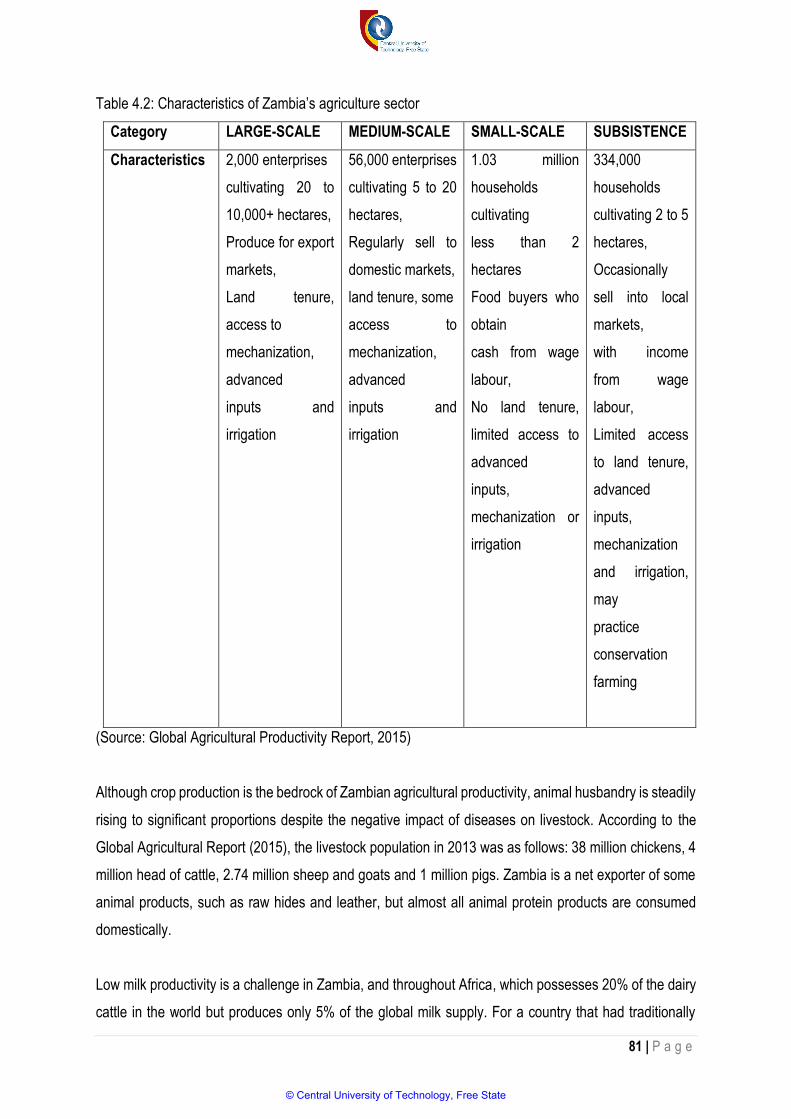
81 | P a g e
Table 4.2: Characteristics of Zambia’s agriculture sector
Category LARGE-SCALE MEDIUM-SCALE SMALL-SCALE SUBSISTENCE
Characteristics 2,000 enterprises
cultivating 20 to
10,000+ hectares,
Produce for export
markets,
Land tenure,
access to
mechanization,
advanced
inputs and
irrigation
56,000 enterprises
cultivating 5 to 20
hectares,
Regularly sell to
domestic markets,
land tenure, some
access to
mechanization,
advanced
inputs and
irrigation
1.03 million
households
cultivating
less than 2
hectares
Food buyers who
obtain
cash from wage
labour,
No land tenure,
limited access to
advanced
inputs,
mechanization or
irrigation
334,000
households
cultivating 2 to 5
hectares,
Occasionally
sell into local
markets,
with income
from wage
labour,
Limited access
to land tenure,
advanced
inputs,
mechanization
and irrigation,
may
practice
conservation
farming
(Source: Global Agricultural Productivity Report, 2015)
Although crop production is the bedrock of Zambian agricultural productivity, animal husbandry is steadily
rising to significant proportions despite the negative impact of diseases on livestock. According to the
Global Agricultural Report (2015), the livestock population in 2013 was as follows: 38 million chickens, 4
million head of cattle, 2.74 million sheep and goats and 1 million pigs. Zambia is a net exporter of some
animal products, such as raw hides and leather, but almost all animal protein products are consumed
domestically.
Low milk productivity is a challenge in Zambia, and throughout Africa, which possesses 20% of the dairy
cattle in the world but produces only 5% of the global milk supply. For a country that had traditionally
© Central University of Technology, Free State

82 | P a g e
relied on minerals as a source of wealth, the Zambian government has over the past decade attempted
to diversify its economy, and shift to other sectors like agriculture. As evidence of this new economic
thrust, Zambia committed to increasing its annual expenditures for agriculture to 10 per cent of its annual
budget in 2015. Actually, income from agriculture constitutes between 7% and 10% of GDP. Apart from
government support, the agricultural sector benefits from public-private partnerships in maize, livestock,
groundnuts and horticulture production. There is evidence of small-scale farmers adopting innovative
farming technologies that include improved hybrid seeds, fertilizer, mechanisation and conservation
farming techniques.
4.6.3.1. Socio-economic challenges
However, rural poverty rates remain high (those living on less than $1.25/ day) at about 80 % of the
national population. Zambia’s agricultural value chains are still vulnerable to environmental shocks and
changing climate patterns. Arguably, they can draw substantial benefits from the knowledge, resources
and opportunities that arise from technological transfer arrangements with developed agricultural
systems. For Hichaambwa, Sitko and Chamberlin (2014), most farmers particularly small-scale ones, are
undercapitalised and face challenges of investment in productivity-enhancing and labour-saving
agricultural technologies.
Table 4.3: Agricultural productivity in Zambia (1990-2014)
Year 1990 2000 2014
The setting
Government expenditure on aggregate (% total outlays) 9.7
Area harvested (million hectares) 1 2 4
Cropping intensity ratio 0.1 0.1
Hunger dimensions
GDP per capita (US$) 2407 2 202 3 800
Domestic food price volatility (index) 9.2 3.2
Cereal import dependency ratio (%) 24.3 7.1 -8.2
Food supply
Food production value, (million US$) 709 812 1 772
Agriculture, value added (% GDP) 21 18 10
Food exports (million US $) 11 42 756
Food imports (million US$) 49 62 378
© Central University of Technology, Free State

83 | P a g e
Production indices
Net food 74 84 184
Net crops 61 72 158
Livestock 78 91 216
(Source: FAO 2015 Report)
4.6.4. South Africa
Even though at least 80% of South Africa's land is arable, only 13% is being used for agricultural
purposes. Notably, the country is prone to unpredictable rainfall patterns and significant soil erosion even
though agricultural land use is projected to be at most 15% in the near future. The aforementioned
challenges, therefore, calls for increased efficiency and productivity in the use of the available land given
the adverse conditions (Du Toit, Van Eyden & Ground, 2006). Despite the country’s relative self-reliance
in terms of agricultural produce, it still imports rice, tea, coffee, and cocoa. Figure 4.1 shows the country’s
crop yields over the years.
Figure 4.1: Trends in South Africa’s agricultural yields (UNDP, 2012:26)
© Central University of Technology, Free State
84 | P a g e
As can be seen from the diagram, yields for cereals, fruit, roots and tubers generally followed an upward,
long-term trend - even though at a subdued rate.
A number scholars have studied South African agricultural productivity trends in the past decade.
Conradie, Piesse and Thirtle (2009) studied the district, regional and national measures of agricultural
productivity in the Western Cape Province of South Africa. Using statistics for the period ranging from
1952-2002, the scholars noted that production in the province grew at double the national rate - even
though there were variations across the districts in the region. They reported that while a positive growth
trend was experienced in the Boland area, negative growth rates were noted in the Karoo area.
In a separate study, Liebenberg and Pardey (2010) examined agricultural production and productivity
patterns in South Africa and found some interesting aspects. Although there has been a shift towards
capitalised agriculture and decrease in the use of human labour, emphasis has also shifted from animal
husbandry and staple crop farming towards market gardening. However, in spite of some improvements
in agricultural output levels, the growth rate is generally below the continental average. The results of
Liebenberg and Pardey’s (2010) indicate that land productivity grew at an average rate of 2.49% per year
from 1911 to 2008, slightly slower than the corresponding rate of labour productivity growth, which
averaged at 2.83% per year. Multifactor productivity (MFP) grew by 1.49% on average per year from
1947 to 2008. MFP was stagnant during 1989 to 2008, owing to a decline in the rate of output growth
coupled with an increase in the rate of input use in agriculture. With the evidence presented, investments
and the incentive structures that affect agricultural research and development were suggested to better
the situation.
Ramaila, Mahlangu and Du Toit's (2011) draw attention to the fact that overall national agricultural
productivity in South Africa has been more or less unchanged since the turn of the millennium. Such a
situation is problematic given the increasing concerns about food security, poverty and unemployment in
the country. The findings from Ramaila et al.’s (2011) study suggest that the little growth rate in
agricultural productivity that has been accumulated over the years have been inadequate for meet South
Africa’s food requirements.
© Central University of Technology, Free State
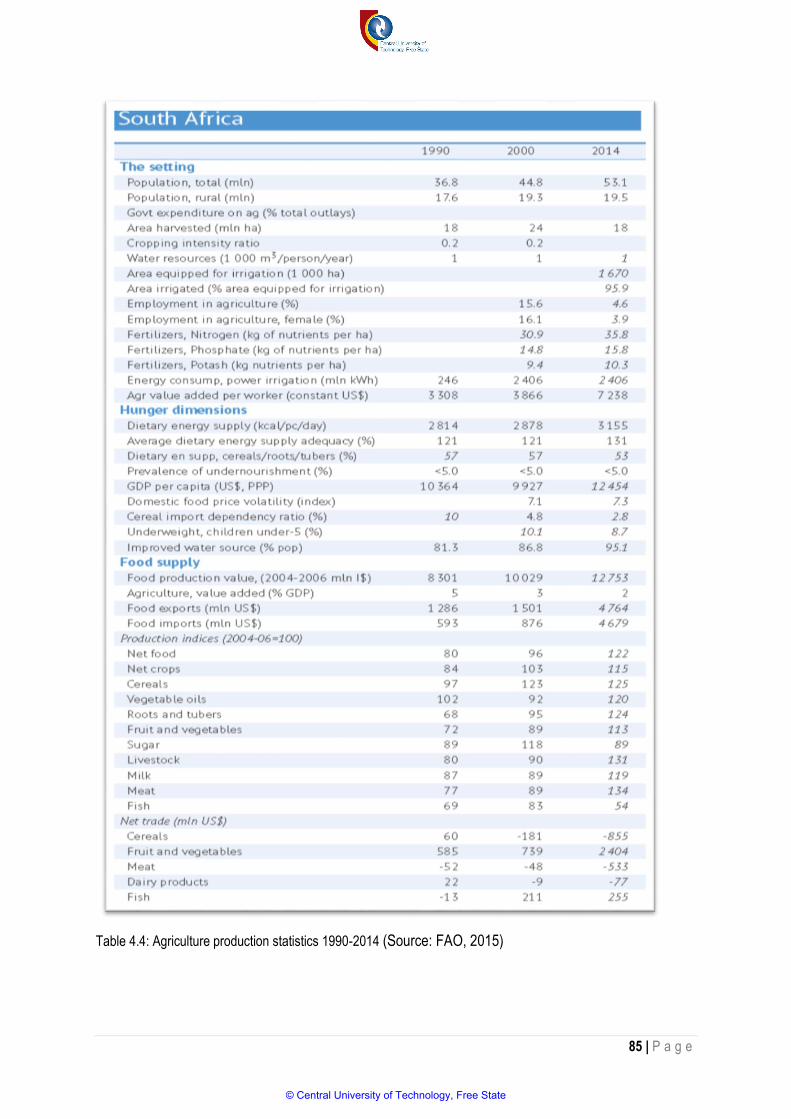
85 | P a g e
Table 4.4: Agriculture production statistics 1990-2014 (Source: FAO, 2015)
© Central University of Technology, Free State
86 | P a g e
Figure 4.4 shows some relatively recent statistics on the performance of the South African agriculture
sector. Some of the agricultural productivity and competitiveness indices shown on Figure 4.4 reveal
some positive trends. For instance, agriculture value added per worker and the food import dependency
ratio reveal some positive trends. In addition, food exports and the net food production indices also show
positive trends, indicating a country with a robust agricultural sector and secure food supplies for the
foreseeable future.
4.6.5. Zimbabwe
Agriculture is the backbone of Zimbabwe’s economy and underpins the economic, social and political
lives of the majority of the people of Zimbabwe (Maiyaki, 2010; FAO, 2015). The sector sustains the
livelihoods of an estimated 70% of the population, contributes 15% - 20% of GDP and 40% of exports
and supplies 63% of agro-industrial raw materials. The preceding statistics underscores the growing
dependence of Zimbabwe’s economy on the agriculture sector for employment and food security. They
also signal the need to pay attention to the levels of productivity and competitiveness in the sector if their
contributions are to be enhanced. The Government of Zimbabwe’s 2012 Comprehensive Agricultural
Policy Framework (CAPF) (2012-2032) affirms that the Zimbabwean agriculture sector grew by 33% in
2010, 9.6% in 2011 and 4.6% in 2012. Women contribute about 70% of the agricultural labour and the
bulk of them are subsistence farmers. The agricultural sector, which saw a sharp increase in the number
of farmers and relatively smaller sizes of farms following the fast-track land reform programme in 2000,
is operating at sub-optimal levels and will benefit greatly from an increase of investment in farming
technology (Mashingaidze, Belder, Twomlow, Hove & Moyo, 2013).
The Zimbabwe agricultural sector produces various commodities that contribute to agricultural GDP as
follows: maize 14%, tobacco 25%, cotton 12.5%, sugar and horticulture 7%, beef and fish 10%, livestock
24%, and subsistence crops 0.5% (Zimbabwe Agricultural Investment Plan, 2013). This output is
generated by the country’s three farming clusters i.e. 4 317 large-scale commercial farms, 22 072 small
to medium scale commercial farms and 1 313 656 farmers in the smallholder sector (ZimStats, 2015).
The sector which historically had very strong links with the manufacturing sector has performed poorly
over the years causing downstream and upstream factories connected to farming to operate at less than
40% of their potential throughput capacity. The negative effect has been felt in both the domestic and
export markets. Figure 4.5 demonstrates the trend of agricultural productivity in Zimbabwe since 1990.
© Central University of Technology, Free State

87 | P a g e
Table 4.5: Agricultural productivity in Zimbabwe
The statistics in Figure 4.5 shows interesting trends in agricultural production statistics. While the
population size growth trend is upward from 1990 to 2014, most indicators of agricultural production and
productivity reveal an upward trend from 1990 to 2000 and then a downward trend from 2000 to 2014.
© Central University of Technology, Free State

88 | P a g e
Note that the drop in productivity indices (e.g. agriculture value added per worker, cereal import
dependency ratio and food production value) coincide with the year 2000 when the fast-track land reform
programme was launched. Arguably, while the programme promoted new, smaller-scale farming
activities, it certainly disrupted the long-established commercial farming sector and cognate agro-
processing firms.
4.7. Chapter summary
This chapter addressed the issues of agricultural productivity and competitiveness with special emphasis
on definitional issues, measurement and significance of the agricultural sector. Special attention was also
drawn to the factors influencing agricultural productivity. Lastly, the chapter provided case studies of
agricultural productivity from selected regions across the globe. The next chapter deals with the research
design and methodology.
© Central University of Technology, Free State

89 | P a g e
CHAPTER 5: RESEARCH METHODOLOGY
5.1.
INT
RO
DC
TIO
N
5.2. RESEARCH EPISTEMOLOGY
5.3. RESEARCH APPROACH
5.4. RESEARCH DESIGN
5.5. RESEARCH PROCESS
5.6. TARGET POPULATION
5.7. SAMPLING TECHNIQUES AND
SAMPLE SIZE
5.8 DESIGNING THE QUESTIONNAIRE
5.9. CREDIBILITY OF THE STUDY
5.9.1. Validity
5.9.1.1 Content validity
5.9.1.2. Construct validity
5.9.1.3. Criterion validity
5.9.2 Reliability
5.10 PILOT STUDY
5.11. ETHICAL CONSIDERATIONS
5.12. DATA PREPARATION
5.13. DATA ANALYSIS
5.14. CHAPTER SUMMARY
© Central University of Technology, Free State

90 | P a g e
5.1. Introduction
The previous chapter addressed the literature on the agricultural productivity and competitiveness,
variables associated with the current study. According to Cooper and Schindler (2011:11), “writers usually
treat the research study as a sequential process involving several clearly defined steps.” Concurring with
the preceding view, Leedy and Ormrod (2005) explain that research involves a systematic process that
entails data collection, analysis and interpretation for the understanding of a phenomenon of interest.
This chapter outlines the research methodology used to address the research questions of the present
study. Howell (2013) explains that the research methodology is a systematic, theoretical analysis of the
methods applied to a field of study in research, theoretical analysis of the body of methods and principles
associated with a branch of knowledge. Typically, it encompasses various concepts such as the research
paradigm, theoretical model, phases of conducting research and quantitative or qualitative techniques.
This study was quantitative in nature. Creswell (2003) proffers that quantitative research studies are
concerned with cause and effect linking to hypotheses, use of measurement and observation, and the
test of various theories in the area of study.
This research adopts a quantitative approach that seeks to get a broad understanding of the productivity
and competitiveness of agro-business firms from both countries. To the researcher’s knowledge, no
comparative study has been conducted on the status and the impact of technology transfer and
innovation on productivity and competitiveness covering Zimbabwean and South African regions.
5.2. Research epistemology
A positivist epistemology was adopted for this study. Since positivists are hard realists who believe in a
single reality and total objectivity (Guba & Lincoln, 2005; Merriam, 2007), they argue that there is a single
truth that can be studied and measured. Since this study sought to establish the objective condition (i.e.
status and exact impact of technology transfer and innovation on the productivity and competitiveness of
agro-processing firms in two regions of Zimbabwe and South Africa), a positivist epistemology was ideal
for scientifically determining the levels of technology transfer and innovation and ascertaining the
associative and predictive relationships in this study.
The purpose of positivist research is to predict and control nature (Guba & Lincoln, 2005; Merriam, 2007)
and hence there is no reason to interact with who or what is studied. The use of a quantitative approach,
a structured questionnaire, and quantitative analysis was therefore selected to ensure objectivity, allow
the researcher to direct and control the research processes, and allow for the prediction of relationships
© Central University of Technology, Free State
91 | P a g e
between variables respectively. These research processes would be inconceivable using interpretive
epistemology and qualitative research approaches.
5.3. Research approach
This comparative study been South Africa and Zimbabwe agro-processing firms adopted a quantitative
research approach, which is based on the positivist world-view. Positivism assumes that science or
knowledge creation is confined to what is observed and measurable. In addition, the process rests
exclusively on testable theories and hypotheses that can be confirmed or disconfirmed (Cohen, Manion
and Morrison, 2007). The study employs theories of technology transfer and innovation and addresses
quantitative and relational questions to make inferences about the relationships between variables.
The choice of a quantitative approach was informed by the need to ascertain the status and impact of
technology transfer on the productivity and competitiveness of small agro-processing business firms in
Zimbabwe (Mashonaland) and South Africa (Free State). Hence, the quantitative approach afforded the
opportunity to test for any associative or predictive relationships between independent variables and
dependent variables. The approach was deemed appropriate since the current study was guided by a
conceptual model of hypothesised relationships whose interaction could be met through the collection of
precise self-reported data. Evidently, the choice of a research paradigm or approach influences the
research design. According to Saunders, Lewis and Thornhill (2013), an appropriate research design
must be clearly constructed and defended before any study is undertaken. Naturally, this leads to the
need to explain the research design adopted for the current study briefly.
5.4. Research Design
The research design is a process of creating an empirical test to support or refute a knowledge claim with
support of knowledge in the research area of interest. Delport and Fouche (2011) proclaim that the
research design is a plan for the collection of data so that the desired information can be obtained with
sufficient precision. A research design involves a set of decisions regarding the topic to be studied: the
population, formulation of knowledge and choice of research methods.
The study adopted a survey approach as the research design. Saunders et al. (2013) proclaim that a
survey approach is adopted as one’s research design if the information required needs broader
explanation and empirical evidence. To the extent that this study seeks to provide a descriptive account
of the status of technology transfer and innovation levels including uncovering the relationships among
© Central University of Technology, Free State

92 | P a g e
technology transfer, innovation and productivity of small-scale agro-processing firms, the survey
approach is ideal for the exploring and explicating these relationships.
5.5. Research process
The research process involved defining the problem statement, the postulation of important questions
(some of which can be converted into hypothesis), conduct of an in-depth literature review of concepts,
determination of sampling procedures, development of measurement instrument, administering the
questionnaire, and analysing and interpreting results. The first stage is the problem statement and this
was defined and clarified in the first chapter of the study. Zikmund, Babin, Carr and Griffin (2013) state
that a problem well defined is a problem -solved. The other stage was the setting of the research
objectives, which involved in the setting of the research goals (Cooper & Schindler, 2011; Zikmund et al.,
2013). Once research objectives were formulated, they were converted into research questions as
research hypotheses were not tested. Once a problem was defined, and the research objectives and
questions were formulated, the next stage focused on establishing relevant knowledge through
conducting an in-depth literature review.
The next critical stage involved the determination of the study population, sampling procedures and
methods relevant to the study. This was then followed by the design and pilot-testing of the measurement
tools used in the study. The next stage involved the administering of the questionnaire, a process that
essentially encompassed the data collection procedure. The last stage involved statistical analysis and
interpretation of results, which is made up of descriptive and inferential statistical analyses.
5.6. Target Population
It is essential for the researcher to determine the population of the study. Doing so affords the researcher
the opportunity to decide whether to use the entire population of elements to be studied or only a sample
of elements. The target population is the researcher’s interest group. It is to this group that the results of
the study will be generalised. The target population for this study comprised all small-scale agro-based
firms covering small-scale agro-processing farmers, suppliers of agricultural equipment and inputs,
farming associations and other farm-related businesses in Zimbabwe (Mashonaland Central) and South
Africa (Free State). In the absence of hard current data relating to the actual numbers of small-scale agro-
businesses (i.e. the population of small-scale agro-businesses) in the Free State and Mashonaland
Central provinces, the researcher relied on data estimates from the Ministry of Agriculture in Zimbabwe
and South Africa. The Department of Agriculture, Forestry and Fisheries in the Free State estimated that
there was approximately 12 000 agro-processing firms (comprising predominantly agro-farming
© Central University of Technology, Free State
93 | P a g e
businesses) in South Africa and of this total, the Free State Province had approximately 3000 agro-
processing firms. The Ministry of Agriculture, Mechanisation and Crop Production in Zimbabwe estimated
the number of agro-processing firms in Mashonaland Central to be 4000. The total population for the two
countries was therefore, 7000 agro-processing firms.
The primary unit of analysis was the individual owners or managers of the small businesses. A unit of
analysis is the entity or object that is being studied and analysed (Blumberg, Cooper & Schindler, 2008).
Rubin and Babbie (2016:163) explain the unit of analysis as “those things that we examine in order to
create summaries and explain the differences among them.” The units can be individuals, objects or
groupings. The next sub-section addresses the issues relating to sampling.
5.7. Sampling technique and sample size
Banerjee and Chaudhury(2010) states that researchers can rarely study the entire population because it
is simply too large; hence, researchers should devise ways of drawing a sample from the target
population. The sample needs to be smaller, more manageable set of elements, which is a subset of
population selected to represent the entire population. Other issues that make sampling unavoidable
include the logistical constraints, exorbitant costs and long duration required to collect information from a
whole target population.
However, Leedy and Ormody (2010) proffer that the process of sample selection should be in line with
sound empirical research guidelines. Put differently, the target population needs to be framed in a manner
that the results of a sample drawn from the population can be generalised to the entire population. A
sampling frame describes the list of the items or people forming a population from which a sample is to
be drawn from. The sampling frame for the current study comprised lists of all small agro-businesses
registered with the Ministry of Agriculture, Mechanisation and Crop Production in Zimbabwe, and the
Department of Agriculture, Forestry and Fisheries in South Africa. The researcher relied on the estimates
from these two institutions already highlighted in this study.
Sampling techniques fall into two groups, that is, probability and non-probability sampling. Probability-
based sampling can be further sub-divided into random sampling and non-random sampling. With
random sampling, every element in the target population has a chance of being considered as part of the
sample. In this study, simple random sampling was used because of its suitability for quantitative studies
that use statistical techniques for data analysis. The researcher used an online random number generator
that utilises statistical algorithm to produce random numbers to select elements from the sampling frame.
© Central University of Technology, Free State

94 | P a g e
Random numbers were picked from the sampling frame until the desired size was achieved. This method
is presumed to be free from sampling bias and thus preserves the representativeness of the sample. This
is important because of the need to generalise the findings and make precise generalisations to the target
population.
Ascertaining an appropriate number of elements to include in a sample that represents a particular target
population is one of the challenging tasks that are encountered in conducting a scientific study. The law
of large numbers suggests that the larger a sample size is, the greater the probability that it is normally
distributed. Therefore, larger samples afford the researcher more latitude for conducting different
statistical analyses (Saunders, Lewis & Thornhill, 2009). The process of choosing a particular sample
size is guided by factors that include cost, time frame, the size of the target population and the level of
representativeness which is required (Martínez-Mesa, González-Chica, Duquia, Bonamigo, & Bastos,
2016). In the cases of quantitative research, mathematical formulae are often used to ascertain a suitable
size.
According to Saunders et al. (2009), an unwritten rule in quantitative studies is to adopt a minimum
sample size of 30 elements. Usually, the distribution around the mean of such elements is nearly normal
(Cohen et al., 2007; Saunders et al., 2009). Findings from a sample whose elements are not normally
distributed cannot be generalised to the target population. Guetterman (2015) proclaims that the choice
of a particular sample size is ultimately an informed, personal choice. A total sample size of 400
respondents, 200 from each of the two countries was chosen for this study. The process of determining
sample size was guided by Strydom and De Vos’ (2005) statistical tables for determining sample size
(see Table 5.1).
© Central University of Technology, Free State
95 | P a g e
Table 5.1: Sample size selection guide
Population Percentage suggested No. of
respondents
20 100 % 20
30 80 % 24
50 64 % 32
100 45 % 45
200 32 % 64
500 20 % 100
1000 14 % 140
10 000 4.5 % 450
100 000 2 % 2000
200 000 1 % 2000
In view of the estimate of 4 000 registered agro-processing firms in Mashonaland Central Province
provided by the Ministry of Agriculture, Mechanisation and Crop Production in Zimbabwe, and the 3 000
registered agro-processing firms in Free State Province given by the Department of Agriculture, Forestry
and Fisheries in South Africa, the total estimate of agro-processing firms in the two provinces was 7 000.
Given that the approximate total number of small–scale businesses in the two provinces was less than
10 000 but more than 1 000, the sample size of 400 was consistent.
5.8. Designing the questionnaire
The researcher developed a single, structured questionnaire, which was used to collect data from owners
and or managers of small-agro-based businesses in Mashonaland Province and the Free State Province.
The questionnaire was pre-coded in preparation for further statistical analysis. A structured questionnaire
limits the respondents’ answers to a supplied set of alternatives. The goal of using a structured
questionnaire in this study was to collect accurate data from a sample of respondents in a short time and
at minimal cost. An effort was made to ensure that the questionnaire was balanced, clear and easy to
understand such that the respondents developed an interest and were encouraged to complete it (Babbie,
2007). The questionnaire was developed in English, which is one of the official languages in both South
Africa and Zimbabwe.
© Central University of Technology, Free State

96 | P a g e
5.8.1. Contents of the questionnaire
The questionnaire used to collect the data requested respondents to provide information on the following
issues:
Demographic information
Age
Gender
Highest academic qualification
Race/Ethnic
Level of education at which entrepreneurial skills were acquired
Business information
Length of time business has been operating
Nature of business activity engaged in
Number of employees including owner/manager
Percentage growth in pre-tax profit over past five years
Percentage growth in employment over past five years
Information on technology transfer, innovation, productivity and competitiveness of small agro-business
firms in South Africa and Zimbabwe
Indication of the status and level of productivity.
Indication of the state and level of business competitiveness
Indications of the state and relevance of innovation and technology in the participating firms
Relevance/importance of availability of foreign technology and quality.
The non-demographic response items were outlined in the Likert scale format. A five-point Likert scale
was provided for respondents to specify their level of agreement or disagreement on a scale for a series
of statements. The scale ranged from 1, ‘strongly disagree’, to 5, ‘strongly agree’.
5.8.2. Data collection
As indicated earlier, a structured questionnaire was used to collect primary data from small-scale
agricultural businesses in Mashonaland and the Free State Province. Small-scale agricultural businesses
were considered as those agro-based businesses that employ between 1 and 50 employees (Department
of Trade and Industry). The researcher with the assistance of trained research assistants administered
400 questionnaires to respondents to fill in. Some of the questionnaires were completed whilst the
researchers waited, while the others were dropped at the respondents’ workplace and collected
afterwards.
© Central University of Technology, Free State
97 | P a g e
5.9. Credibility of the study
Any shortcomings in designing research instruments threaten the credibility of the findings of any
research (Leedy & Ormrod, 2010). The researcher may measure or observe the wrong things, or may
not measure or observe variables accurately. The end result is that wrong results and subsequently
flawed conclusions and generalisations are made. According to Blumberg, Copper and Schindler (2008),
the extent of error and bias in any scientific study can be curtailed through ensuring the validity and
reliability of the research instrument used in a particular study. Validity relates to the extent to which a
measure adequately represents the underlying construct that it purports to measure. This instrument
should be designed in such a way that it reduces biases within a research tool. The consequence is that
researchers should design research instruments that measure what they are intended to measure.
On the other hand, reliability is about the degree to which the measurement of a construct is consistent
or dependable. Put differently, if an instrument is used to measure the same construct numerous times,
the outcome should be the same every time, supposing that the core phenomenon is not fluctuating. The
next part is dedicated to how the concerns of augmenting validity and reliability were dealt with in the
current study.
5.9.1. Validity
According to Cooper and Schindler (2011), validity refers to the degree to which a research instrument
serves the purpose for which it was constructed. The preceding authors recognise three types of validity,
namely: content, construct and criterion validity. These are discussed below.
5.9.1.1. Content validity
Content validity (or face validity) of a measuring instrument refers to the degree to which the research
tool covers the domain of the subject of interest. The study ensured content validity by including elements
that adequately covered the constructs of productivity, competitiveness, innovation and technology
transfer by drawing on dimensions of these concepts presented in the literature review. In addition, the
questionnaire received input from two subject experts and the statistician.
5.9.1.2. Construct validity
According to Leedy and Ormord (2010), construct validity refers to the extent to which an instrument
measures a characteristic that cannot be directly observed. In other words, it shows the degree to which
the research instrument measures what it anticipates to measure and whether a suitable identification of
the independent and dependent factors was done in the study (Hair, Anderson, Tatham & Black, 2008).
© Central University of Technology, Free State
98 | P a g e
To ensure this, the researcher operationally defined the dependent and independent variables and
extensively used literature to generate the questionnaire items.
5.9.1.3. Criterion validity
Criterion validity demonstrates the prognostic capacity of the items used to measure a variable against a
certain yardstick (Blumberg, Cooper & Schindler, 2014). More directly, it refers to the level to which a
measure is related with some other standard yardstick that is known to indicate the same construct
accurately. According to Maree and Pietersen (2016), for criterion validity of an instrument to be
assessed, the ‘existing scores of an existing instrument which is known to measure the same construct
should be available for the same sample of respondents.’ Nonetheless, there is no devoted, existing
research tool that relates to the numerous variables mentioned in this study.
5.9.2. Reliability
Reliability refers to freedom from random or unstable error (Saunders et al., 2009). According to Maree
and Pietersen (2016), the following are the most commonly used techniques for determining the reliability
of an instrument: test-retest reliability; split-half reliability and internal consistency. This study adopted
the internal consistency reliability test for its purposes. This is a technique that seeks to ascertain the
extent of likeness among items in a scale intended to measure a particular construct. The indicator of
internal consistency is known as the Cronbach’s alpha coefficient (r). The coefficient indicates the
strength of the correlations among the items measuring a particular item. A strong correlation among
items is reflected by an alpha coefficient close to one. In contrast, an alpha coefficient close to zero
reflects a weak correlation and poor internal consistency. The scale items for the current study showed
acceptable internal consistency, as the alpha values were above 0.5 (see Table 6.2).
5.10. Pilot study
A pilot study is a limited run of a full-scale study. It can be equated to a practicality study whose goal is
to pre-test the research instrument. Such a study uses elements of the target population who are not part
of the current study. According to Blessing and Chakrabarti (2009), a pilot study increases the probability
of study success by checking the lucidity of the research instrument items, guidelines and design. The
outcome of a pilot study is a better research instrument with higher validity, reliability and feasibility.
The researcher carried out two pilot studies in Mashonaland West Province of Zimbabwe and the other
in North West Province, South Africa from 2 to 7 May 2016 and 14 to 20 July 2016 in turn. A total of 16
questionnaires were administered on small agricultural businesses in each of the two study areas. The
© Central University of Technology, Free State

99 | P a g e
respondents in the pilot study were selected in such a manner that they closely reflected the
characteristics of the sampled elements. While the pilot study tested the questionnaires, it also provided
a training ground for the research assistants. Following the outcome, they were no major alterations to
the instrument except for further clarification of the instructions.
5.11. Ethical considerations
The researcher encountered numerous ethical challenges in carrying this study. The issues related to
informed and voluntary participation, anonymity, and confidentiality. Prior to the study, the researcher
informed the respondents in the research project of their right to voluntarily participate or withdraw from
the study at any stage of the study without suffering any unfavourable consequences. The respondents
were also assured that any information they provided in the course of the study would be treated
confidentially and would be used for the purposes of the study.
To elicit honest answers, the researcher made it clear that respondents would not be recognisable, by
protecting their identities during the course of the research process. The researcher attached a covering
letter to the questionnaire, promising the respondents their anonymity and confidentiality.
5.12. Data preparation
5.12.1. Data cleaning
The filled-in questionnaires from the respondents were examined for faults which could conceivably
undermine the data analysis process. The main problems that were noted during the data preparation
process encompassed half-completed and even blank questionnaires. These were left out of the data
analysis altogether. Overall, a total of 268 questionnaires were analysed.
5.12.2. Data coding and entry
Since the questionnaires used in this study were pre-coded through assigning numbers to alternative
options to statements/questions on the questionnaire, the data was immediately entered into a statistical
software, statistical package for the social sciences (SPSS) 23 following the data cleaning process. This
was done in preparation for detailed statistical analysis.
5.13. Data analysis
All the data collected during the study was analysed using SPSS 23. Preliminary analyses involved
summarising the responses to the questionnaire using descriptive techniques like percentage analysis,
frequency tables and summary statistics.
© Central University of Technology, Free State
100 | P a g e
Advanced statistical techniques were then used to ascertain the relationships between the variables in
the study. Non-parametric tests were used to determine any relationships between the variables since
the datasets were not normally distributed. Thus, the Spearman's correlation test was used to assess the
nature and strength of relationships amongst the numerous pairs of dependent and independent variables
scale. Lastly, multiple regression analyses were then applied to assess the posited prognostic
connections between the independent variables and the dependent variables. This process enabled the
calculation of the regression coefficients for each independent variable to assess their relative effects on
the dependent variable.
5.14. Chapter summary
This chapter presented the methodology used in this study. The research methodology was guided by
the positivist research paradigm. Hence, the chapter addressed issues relating to a quantitative research
approach, survey research design, target population, sampling frame, probability sampling procedure,
sample size, the research instrument and it administration, quantitative data collection and data analysis.
In addition, the credibility of the research instrument was also discussed. The next chapter presents the
findings of the study.
© Central University of Technology, Free State

101 | P a g e
CHAPTER 6: FINDINGS AND DISCUSSION
6.1. Introduction
The previous chapter presented the research methodology adopted in conducting this study. This chapter
presents the results of the surveys carried out in the Free State Province in South Africa and
Mashonaland Province in Zimbabwe. Thus, the chapter presents and discusses the demographic profiles
of these respondents, and the inferential statistics employed to test the diverse relationships of
association and prediction between variables. Since the preliminary checks conducted on the two data
sets generated from the two samples were not normally distributed and, therefore, could not meet the
stringent requirements of parametric techniques, non-parametric statistical analysis techniques were
harnessed to draw inferences from the data. Correlation analysis was employed to test relations of
association among predictor and outcome variables. Lastly, multiple regression analyses were carried
out to evaluate the prognostic effect of the independent variables on the dependent variables.
6.2. Response rate
The survey questionnaire was administered on 400 respondents sampled from small agro-processing
businesses in Zimbabwe and South Africa. There were 165 questionnaires returned from the
Zimbabwean sample and 112 returned from the South African sample, and hence a total of 277
questionnaires were completed and returned. There were nine (9) incorrectly filled questionnaires among
the 277 and these were excluded from the analyses. This means that 268 questionnaires were analysed,
representing a 69% response rate.
6.3. demographics
This section addresses the demographic characteristic of the respondents. Frequencies were calculated
for gender, age, race, years of business operation, number of employees, value of business assets,
nature of agriculture-related business activity, and highest level of agriculture qualification. The details
are presented in Table 6.1.
© Central University of Technology, Free State
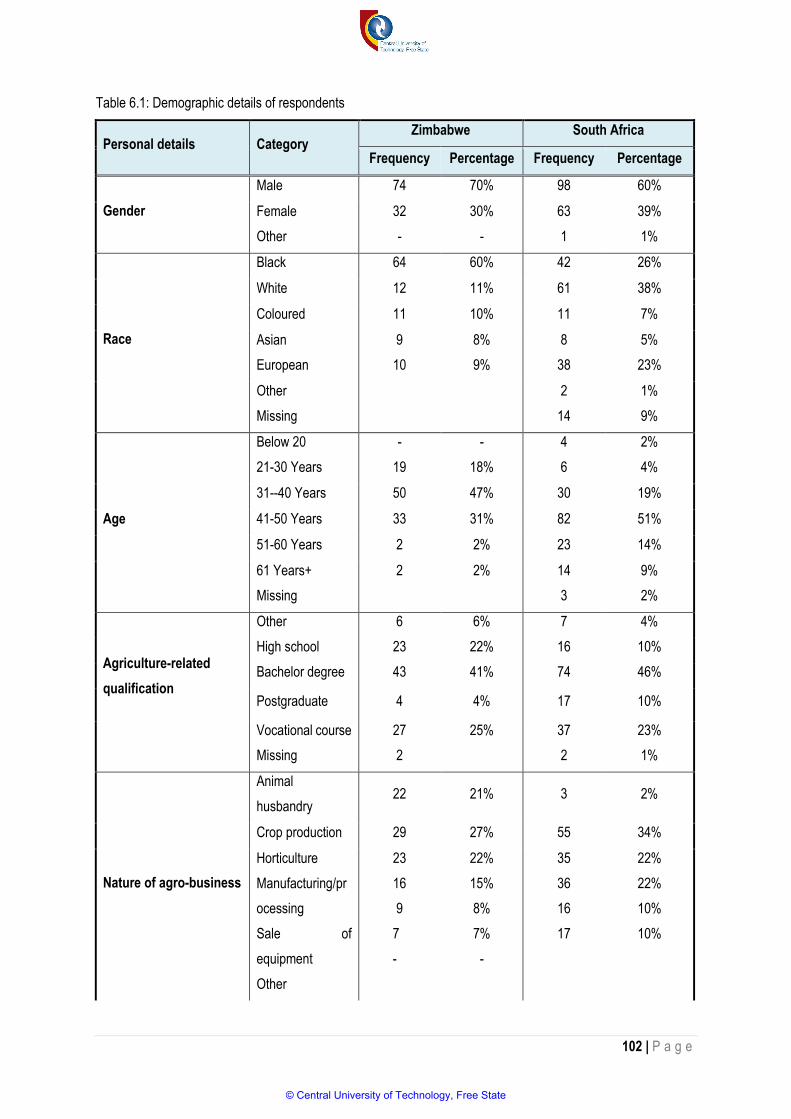
102 | P a g e
Table 6.1: Demographic details of respondents
Personal details Category Zimbabwe South Africa
Frequency Percentage Frequency Percentage
Gender
Male 74 70% 98 60%
Female
Other
32
-
30%
-
63
1
39%
1%
Race
Black 64 60% 42 26%
White 12 11% 61 38%
Coloured 11 10% 11 7%
Asian
European
9
10
8%
9%
8
38
5%
23%
Other
Missing
2
14
1%
9%
Age
Below 20
21-30 Years
-
19
-
18%
4
6
2%
4%
31--40 Years 50 47% 30 19%
41-50 Years 33 31% 82 51%
51-60 Years 2 2% 23 14%
61 Years+
Missing
2
2%
14
3
9%
2%
Other 6 6% 7 4%
Agriculture-related
qualification
High school 23 22% 16 10%
Bachelor degree 43 41% 74 46%
Postgraduate 4 4% 17 10%
Vocational course
Missing
27
2
25%
37
2
23%
1%
Nature of agro-business
Animal
husbandry 22 21% 3 2%
Crop production 29 27% 55 34%
Horticulture
Manufacturing/pr
ocessing
Sale of
equipment
Other
23
16
9
7
-
22%
15%
8%
7%
-
35
36
16
17
22%
22%
10%
10%
© Central University of Technology, Free State

103 | P a g e
Missing
Business assets-value
in US$
Less than
$200000-00 44 42% 8 5%
$200000-
$499000 42 40% 79 49%
$500000-
$999999
$1000000-
$4999999
$5000000-
$9999999
Over 10 million
9
5
4
2
8%
5%
4%
2%
32
15
12
16
20%
9%
7%
10%
Years of existence of
Business
1 to 5 18 17% 13 8%
6 to 10 43 41% 45 28%
11 to 15 36 34% 62 38%
16 to 20 8 8% 21 13%
21 to 50 1 1% 11 7%
Over 50 0 0% 7 4%
Missing 0 0% 3 2%
Number of employees
1 to 10 29 27% 11 7%
11 to 20 25 24% 71 44%
21 to 50 34 32% 46 28%
51 to 100 17 16% 9 6%
101 to 200 1 1% 16 10%
Over 200 0 0% 6 4%
Missing 0 0% 3 2%
Note. Due to rounding errors, percentages may not equal 100%. Also note that those respondents below 20 years
were not necessarily minors as they were aged 18 years or older but less than 20 years of age.
6.3.1. Gender composition of respondents
For the Zimbabwean sample, the largest proportion of respondents was males within the 31 to 40 (47%)
and 41 to 50 (31%) years of age. Similarly, some males in the 31 to 40 (19%) and 41 to 50 (51%) years
age groups dominated the South African sample. This implies that the active male population dominates
© Central University of Technology, Free State

104 | P a g e
the ownership and management of small-scale agro-businesses in both samples. The finding on male
domination of ownership and management of agro-processing businesses in the South African sample
resonates with Agbobli’s (2013) study which reported that most (58%) of South African small scale
agricultural enterprises (SSAEs) in the Vryburg area were owner-managed. The domination of male
respondents in both regions is also in consonant with Agbotame’s (2015) study, which affirmed the
prevalence (79.5%) of male respondents in his South African sample of SSAEs. Studies carried out by
Bhatasara and Chiweshe (2017) and Mutopo and Chiweshe (2014) on Zimbabwean agro-processing
firms also stress the male domination of the ownership and management of agriculture related resources.
6.3.2. Age composition of respondents
The findings also revealed that young people (under the age of 20 years) and females were not much
involved in the management of agro-related businesses in both Mashonaland Central (Zimbabwe) and
Free State provinces (South Africa). Although these respondents were below 20 years of age, they were
mature enough to start businesses (that is, they were older than 18 years of age). The limited youth and
female participation in agro-processing businesses can be attributed to financial, social, institutional and
cultural barriers. There is a general consensus that agro-processing businesses engage in hard manual
labour, requires large capital outlays and women and young people tend to be prejudiced against doing
business deals by men and mature adults (World Bank, 2009; Sahan & Mikhail, 2012; Agbotame, 2015).
The dominance (over 70%) of the mature adult population (36-55 years) was also reported in previous
South African agro-based studies (Agbobli, 2013; Agbotame, 2015) and Zimbabwean studies (Machila,
Lyne, & Nuthall, 2015; Scoones, Mavedzenge, Murimbarimba & Sukume, 2017). The dominance of the
31-50 years age group in the Zimbabwean sample may also be a direct result of year 2000 land reform
and redistribution programme where middle-aged individuals were the largest beneficiaries and therefore
had the head-start to establish small-scale agro businesses (Mwiturubani & van Wyk, 2010).
Apart from the above, the dominant age groups possibly consists of individuals with substantial work
experience from various sectors of the economy, which gives them a strong foundation to establish
businesses in the agro-sector. This finding buttress the claim on the existence of a direct relationship
between the establishment and survival of small scale agricultural businesses (SSABs) and the age of
owners and managers as older agro-processing business owners/managers have better practical
experience and financial resources to run business successfully than the younger ones (Agbotame,
2015).
© Central University of Technology, Free State
105 | P a g e
6.3.3. Educational status
In terms of educational status of respondents, Table 6.1 illustrates that a sizable number of respondents
(41%) for Mashonaland (Zimbabwe) at least had a bachelor’s degree. As for the South African sample,
most respondents (46%) had bachelor’s degrees. Only 6% of the respondents did not have any formal
education. Perhaps the demands for agricultural knowledge, skills and expertise to effectively run
agricultural businesses explains the sizable number of respondents in both samples who had tertiary
qualification. This can be contrasted with Chamboko, Mwakiwa and Mugabe’s (2017) study on the
determinants of participation in the milk market and volume of sales to milk collection centres of the
smallholder dairy value chain in Zimbabwe, which revealed that non-graduates constituted a majority of
participants in small-scale agricultural business in rural areas.
6.3.4. Number of years in business
When it comes to number of years in business, Table 6.1 shows that those with the highest number of
years in business ranges from 6-10 (41%) in Zimbabwe followed by those with 11-15 years (38%). This
finding suggests that most businesses in this country had survived their first years of existence. This can
be compared to the South African sample where those who had 11 to 15 years in business constituted
the largest chunk (38%), followed by 6 to 10 years (28%). The findings from the South African sample
corroborate Agbobli’s findings, which revealed a similar pattern of surviving businesses.
6.3.5. Racial composition
For the Zimbabwean respondents, the modal response category of race was Black (n = 64, 60%). The
dominance of black participation in small scale agro-processing activities in this sample can be attributed
to the reality that a majority of citizens (99.7%) in this country are black (Zimbabwe National Statistics
Agency [ZimStat], 2012). More so, the higher representation of blacks can also be a consequence of the
controversial land reform programme, which increased black ownership of land and participation in
agricultural activities (Makunike, 2014).
Compared to the Zimbabwean sample, the South African sample was white dominated (n = 61, 38%);
European (n=85, 53%). These statistics are representative of the predominantly untransformed character
of land ownership and agricultural activity in the country – one in which the racial groups that owned land
in the country before independence continue to do so in the post-independence era (Cousins, 2013).
Therefore, parallels can be made between the two samples, with the Zimbabwean sample demonstrating
some evidence of transformation in land ownership and management in a post-independent era.
© Central University of Technology, Free State
106 | P a g e
6.3.6. Number of employees
A comparative analysis of the number of employees employed small scale agro-processing firms in
Zimbabwe and South Africa reveals minor variations. For instance, most South African firms who
participated in the study employed between 11 to 50 employees (68%), while in the case of the
Zimbabwean sample most of the firms employed between 1 and 50 employees (83%). These highlight
the significance of small firms as an employment provider for both economies.
6.3.7. Value of assets
The majority (82%) of the Zimbabwean sample had agri-business owner/managers whose asset values
were less than US$499 999. On the contrary, the majority (69%) of the South African sample had
respondents whose asset values ranged from US$200 000 to US$999 999. Perhaps the advanced nature
of the South African economy and the higher resource endowments in the country relative to Zimbabwe
explains these variations (Giampiccoli, Lee & Nauright, 2015).
6.3.8 Agro-business activities
Table 6.1 shows that the majority of Zimbabwean respondents were involved in crop production, animal
husbandry and horticulture. The popularity of these activities can be explained by Zimbabwe’s traditional
agrarian status of being Southern Africa’s breadbasket and Zimbabwe’s wish to ensure food security for
its citizenry (Nhundu & Mushunje, 2010). The country’s history of agricultural production (especially cereal
and cash crop production and animal rearing) explain the dominance of these agricultural activities (Dube,
Homann-Kee Tui, Van Rooyen & Rodriguez, 2014; Nezomba, Mtambanengwe, Tittonell & Mapfumo,
2015). In the case of the South African sample, most of the respondents were involved in animal
husbandry, horticulture or agro-processing/manufacturing. The prevalence of agro-
processing/manufacturing in the South African sample could be a consequence of the higher capital base
which makes the acquisition of heavy machinery and value chain processing more feasible in the country
compared to the Zimbabwean sample.
6.4. Construction of composite scores
Before carrying out the various statistical analyses on the collected data, composite scores were created
for the continuous variables. In other words, distinct questionnaire items concerning a particular variable
were combined to create a total score for that variable. The purpose of performing this procedure was to
transform the raw data to continuous or scale data, which is suitable for the conduct of inferential
statistical analysis of the data. The following scale variables were consequently produced for agricultural
productivity, agricultural competitiveness, innovation, technology transfer and agriculture technology
© Central University of Technology, Free State
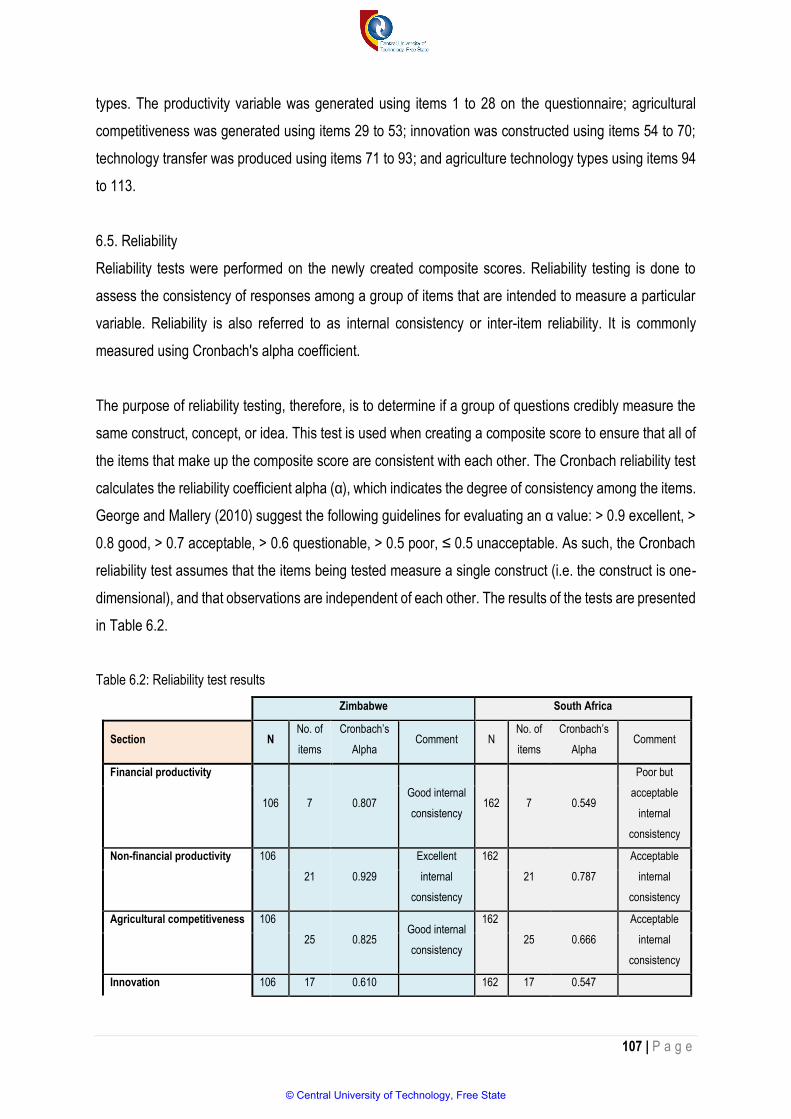
107 | P a g e
types. The productivity variable was generated using items 1 to 28 on the questionnaire; agricultural
competitiveness was generated using items 29 to 53; innovation was constructed using items 54 to 70;
technology transfer was produced using items 71 to 93; and agriculture technology types using items 94
to 113.
6.5. Reliability
Reliability tests were performed on the newly created composite scores. Reliability testing is done to
assess the consistency of responses among a group of items that are intended to measure a particular
variable. Reliability is also referred to as internal consistency or inter-item reliability. It is commonly
measured using Cronbach's alpha coefficient.
The purpose of reliability testing, therefore, is to determine if a group of questions credibly measure the
same construct, concept, or idea. This test is used when creating a composite score to ensure that all of
the items that make up the composite score are consistent with each other. The Cronbach reliability test
calculates the reliability coefficient alpha (α), which indicates the degree of consistency among the items.
George and Mallery (2010) suggest the following guidelines for evaluating an α value: > 0.9 excellent, >
0.8 good, > 0.7 acceptable, > 0.6 questionable, > 0.5 poor, ≤ 0.5 unacceptable. As such, the Cronbach
reliability test assumes that the items being tested measure a single construct (i.e. the construct is one-
dimensional), and that observations are independent of each other. The results of the tests are presented
in Table 6.2.
Table 6.2: Reliability test results
Zimbabwe South Africa
Section N No. of
items
Cronbach’s
Alpha Comment N
No. of
items
Cronbach’s
Alpha Comment
Financial productivity
106 7 0.807 Good internal
consistency 162 7 0.549
Poor but
acceptable
internal
consistency
Non-financial productivity 106
21 0.929
Excellent
internal
consistency
162
21 0.787
Acceptable
internal
consistency
Agricultural competitiveness 106
25 0.825 Good internal
consistency
162
25 0.666
Acceptable
internal
consistency
Innovation 106 17 0.610 162 17 0.547
© Central University of Technology, Free State

108 | P a g e
Acceptable
internal
consistency
Poor but
acceptable
internal
consistency
Technology transfer 106
22 0.920
Excellent
internal
consistency
162
22 0.954
Excellent
internal
consistency
Technology types 106
22 0.935
Excellent
internal
consistency
162
22 0.935
Excellent
internal
consistency
6.6. Test for normality
The selection of a suitable statistical analysis technique to use for a particular data-set is contingent on
whether the datasets is normally distributed or not. Parametric tests, which have specific pre-conditions,
are suitable for normally distributed data-sets. On the other hand, non-parametric techniques (which do
not carry stringent conditions) are appropriate for datasets which are not normally distributed. With this
in mind, the Kolmogorov-Smirnov (KS) test was performed on the data-set for all scale variables to
ascertain its normality, and consequently select the appropriate category of inferential statistics to apply.
The results are presented in Table 6.3.
© Central University of Technology, Free State

109 | P a g e
Table 6.3: Normality test results
Zimbabwe South Africa
Variables KS Statistic p-value KS Statistic p-value
Financial productivity 1.736 0.000 2.734 0.000
Non-financial productivity 1.302 0.007 0.801 0.542
Agricultural competitiveness 1.523 0.019 1,755 0.004
Innovation 1.858 0.002 1.870 0.002
Technology transfer 2.564 0.000 1.955 0.001
Technology types 0.618 0.840 2.190 0.000
In order to make inferences from the results of the KS test, the p-value provided by the test is assessed.
This evaluation is made at either 0.01 or 0.05 significance levels, depending on the degree of precision
which is needed (0.01 is more precise than 0.05). A dataset for a specific variable is not normally
distributed if it has a significant p-value i.e. one that is less than 0.01 or 0.05. On the other hand, it is
normally distributed if its p-value is greater than the stated significance level of 0.01 or 0.05. The findings
presented in Table 6.3 demonstrate that most of the variables that were tested, except for technology
types (for Zimbabwe) and non-financial productivity (for South Africa), had p-values less than 0.05,
suggesting that the data sets were not normally distributed. Put differently, the data had a skewed
distribution. Consequently, non-parametric tests had to be used for inferential statistical analysis.
6.7. The status and level of productivity of agro-processing firms operating in Mashonaland central
province in Zimbabwe (Mashonaland) and Free State province (South Africa)
This sub-section addresses the following research question: What is the status and level of productivity
of agro-processing firms operating in Mashonaland Central province in Zimbabwe and Free State
province in South Africa?
Percentage analyses of responses to questionnaire statements relating to financial productivity, non-
financial productivity, output productivity, output per hectare, capacity utilisation per hectare, market
growth and market reputation were performed to answer this research question. The analysis of each of
the sub-components is presented in the ensuing sub-sections.
6.7.1. Financial productivity
Table 6.4a presents summaries of findings relating to the status and level of financial productivity of
Zimbabwean and South African agro-processing firms. Between 21% and 31% of the Zimbabwe
respondents indicated that there was, at least, an increase in each of the elements of financial productivity
© Central University of Technology, Free State

110 | P a g e
in the past 5 years. This means that the most frequent response category to each of the statements
presented on the questionnaire was either “decrease by between 1-10%” (statement 1) or “no change”
(statements 2 to 7). These results are clearly consistent with the current recession and negative growth
affecting the country.
Table 6.4a: Status and level of financial productivity of Mashonaland Central Province (Zimbabwe)
Financial Productivity (Zimbabwean sample)
Frequency Distribution
Dec
reas
ed b
y ov
er
10%
D
ecre
ased
by
betw
een
1%-1
0%
No
chan
ge
Incr
ease
d by
1%
-10%
Incr
ease
d by
ove
r 10
%
Tot
al %
incr
ease
Late
nt F
acto
r
(Prin
cipa
l com
pone
nt)
Please indicate the extent to which the agro-
business’ sales from agricultural products/services
increased/decreased over the past 1-5 years
Count 0 42 36 26 2
27%
0.879
% 0% 40% 34% 25% 2%
Please indicate the extent to which the agro-
business’ sales from agricultural products/services
increased/decreased compared to production costs
over the past 1-5 years
Count 0 42 42 18 4
21%
0.962
% 0% 40% 40% 17% 4%
Please indicate the extent to which the agro-
business’ total revenue increased/decreased
compared to production costs over the past 1-5 years
Count 1 41 42 18 4
21%
0.955
% 1% 39% 40% 17% 4%
Please indicate the extent to which the agro-
business’ gross profit increased /decreased over the
last 1-5 years
Count 5 33 38 26 4
29%
0.958
% 5% 31% 36% 25% 4%
Please indicate the extent to which the agro-
business’ net profit increased/declined over the last
1-5 years
Count 8 30 40 24 4
27%
0.933
% 8% 28% 38% 23% 4%
Please indicate the extent to which the agro-
business’ return on investment (financial returns
generated from the business’ start-up capital/initial
investment) grew/declined over the last 1-5 years
Count 9 30 34 29 4 0.453
% 9% 28% 32% 27% 4% 31%
Please indicate the extent to which the agro-
business’ total finances grew/ fell over the last 1-5
years
Count 12 25 43 22 4 0.915
% 11% 24% 41% 21% 4% 25%
Total variance explained by latent factors=77.75%
Note: Totals of percentages may not add up to 100 because of rounding off of figures.
In contrast to the Mashonaland Central Province respondents (i.e. Zimbabwean sample) where the
majority of respondents reported no change on financial productivity or decline in productivity, most
© Central University of Technology, Free State

111 | P a g e
respondents from the Free State Province (i.e. the South African sample) indicated that agricultural
productivity was at least increasing. As can be illustrated in Table 6.4b, the responses that indicated at
least an increase in the status and level of productivity ranged from 87% to 94%. Thus, the majority of
respondents indicated an increase in the level of financial productivity of their business in the previous 5
years.
Very little current disaggregated information was found in the literature on the financial productivity of
small-scale agro-processing firms in Zimbabwe due to unavailability of data. However, the Reserve Bank
of Zimbabwe’s Quarterly Economic Review of June 2017, the Ministry of Finance and Economic
Development’s First Quarter Economic Bulletin of 2017, and the Zimbabwe National Statistics Agency
(ZIMSTAT)’s Agriculture and Livestock Survey (ALS) in Small-Scale Commercial Farming Report for the
2014/2015 agriculture season from February to December 2015 reveal lacklustre financial performance
of the small scale agricultural sector in the Zimbabwean economy as a whole. This is in sync with the
findings from the current study which revealed significantly lower levels of agricultural financial
productivity based on the respondents’ perceptions. In fact, this collaborates Masunda’s (2014)
observation that the sustainability of Zimbabwe’s agriculture sector as a whole has been undermined by
high operational costs, which undercut the profits of agro-processing firms in the sector. Therefore, the
high cost of operations and low capital efficiency compel most small-scale agro-processing firms in
Zimbabwe to operate on a subsistence basis and below optimal levels. With reference to the South Africa
sample, the very high rates of financial productivity reported by agro-processing firm owner/managers
were surprising given the often-cited insurmountable challenges faced by small-scale firms in the South
African agriculture sector - such as access to resources and support services including marketing
constraints (Ducastel & Anseeuw, 2017).
© Central University of Technology, Free State
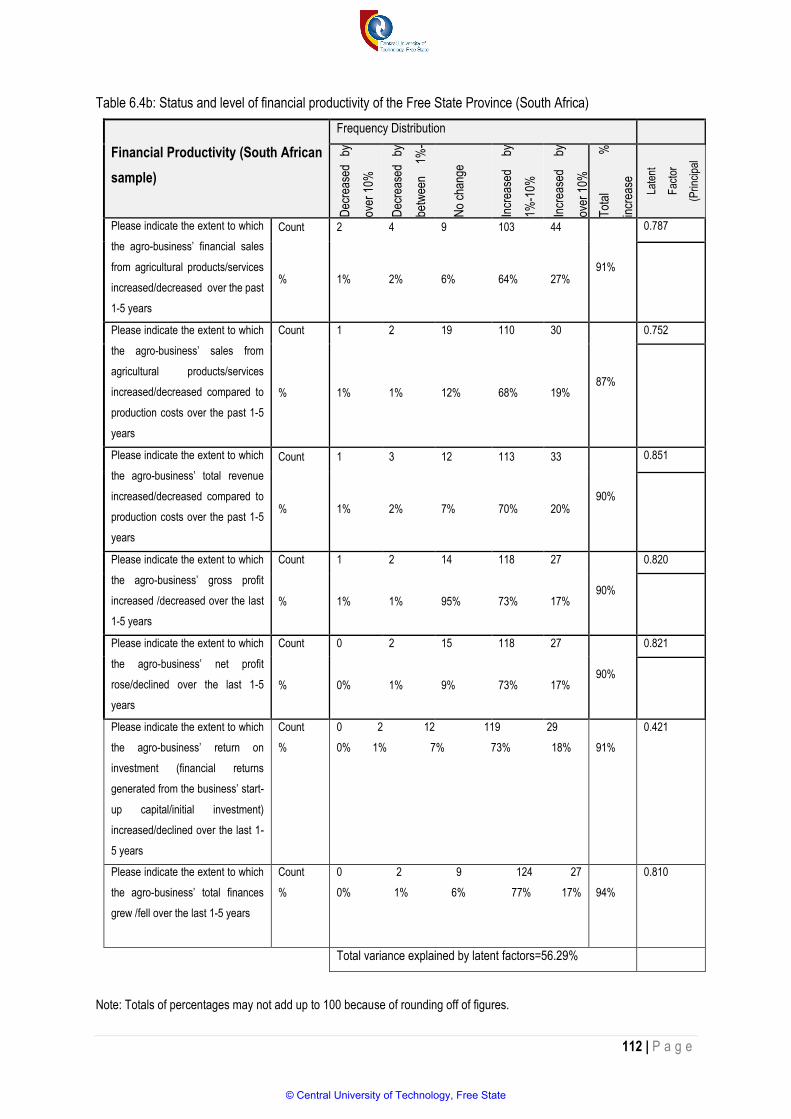
112 | P a g e
Table 6.4b: Status and level of financial productivity of the Free State Province (South Africa)
Note: Totals of percentages may not add up to 100 because of rounding off of figures.
Financial Productivity (South African
sample)
Frequency Distribution
Dec
reas
ed
by
over
10%
Dec
reas
ed
by
betw
een
1%-
10%
N
o ch
ange
Incr
ease
d by
1%-1
0%
Incr
ease
d by
over
10%
Tot
al
%
incr
ease
Late
nt
Fac
tor
(Prin
cipa
l
com
pone
nttt)
Please indicate the extent to which
the agro-business’ financial sales
from agricultural products/services
increased/decreased over the past
1-5 years
Count 2 4 9 103 44
91%
0.787
% 1% 2% 6% 64% 27%
Please indicate the extent to which
the agro-business’ sales from
agricultural products/services
increased/decreased compared to
production costs over the past 1-5
years
Count 1 2 19 110 30
87%
0.752
% 1% 1% 12% 68% 19%
Please indicate the extent to which
the agro-business’ total revenue
increased/decreased compared to
production costs over the past 1-5
years
Count 1 3 12 113 33
90%
0.851
% 1% 2% 7% 70% 20%
Please indicate the extent to which
the agro-business’ gross profit
increased /decreased over the last
1-5 years
Count 1 2 14 118 27
90%
0.820
% 1% 1% 95% 73% 17%
Please indicate the extent to which
the agro-business’ net profit
rose/declined over the last 1-5
years
Count 0 2 15 118 27
90%
0.821
% 0% 1% 9% 73% 17%
Please indicate the extent to which
the agro-business’ return on
investment (financial returns
generated from the business’ start-
up capital/initial investment)
increased/declined over the last 1-
5 years
Count
%
0 2 12 119 29
0% 1% 7% 73% 18%
91%
0.421
Please indicate the extent to which
the agro-business’ total finances
grew /fell over the last 1-5 years
Count
%
0 2 9 124 27
0% 1% 6% 77% 17%
94%
0.810
Total variance explained by latent factors=56.29%
© Central University of Technology, Free State
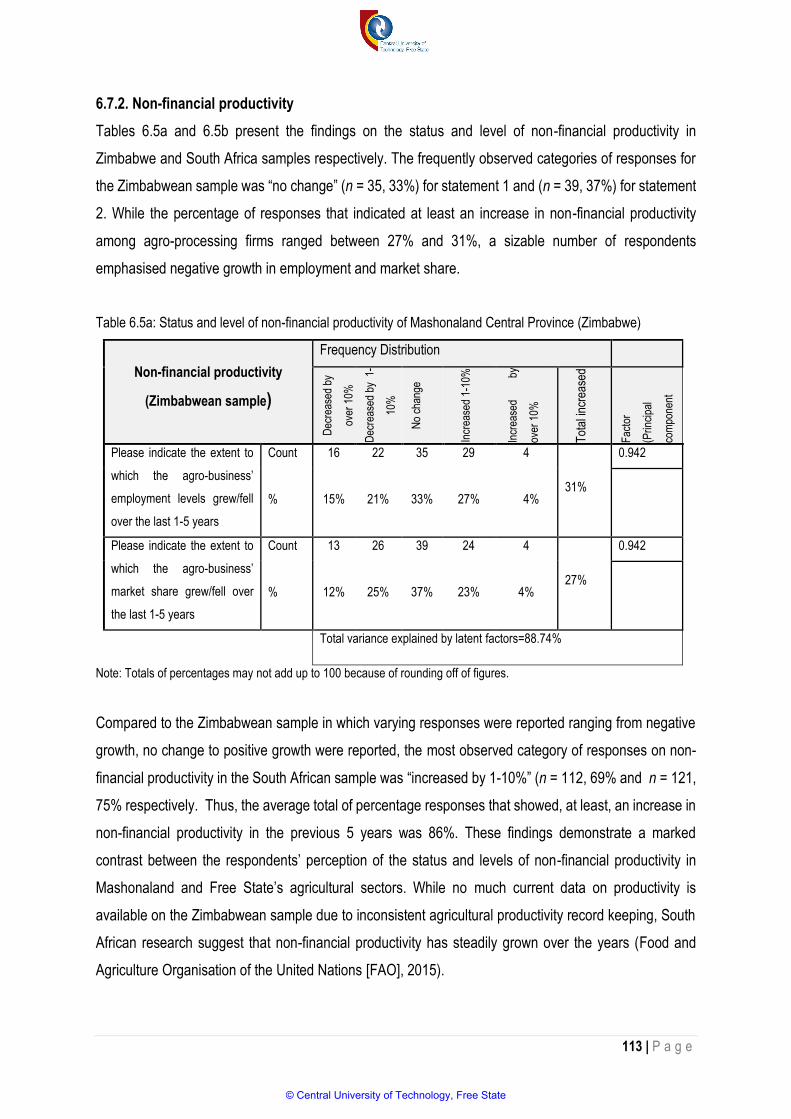
113 | P a g e
6.7.2. Non-financial productivity
Tables 6.5a and 6.5b present the findings on the status and level of non-financial productivity in
Zimbabwe and South Africa samples respectively. The frequently observed categories of responses for
the Zimbabwean sample was “no change” (n = 35, 33%) for statement 1 and (n = 39, 37%) for statement
2. While the percentage of responses that indicated at least an increase in non-financial productivity
among agro-processing firms ranged between 27% and 31%, a sizable number of respondents
emphasised negative growth in employment and market share.
Table 6.5a: Status and level of non-financial productivity of Mashonaland Central Province (Zimbabwe)
Non-financial productivity
(Zimbabwean sample)
Frequency Distribution
Dec
reas
ed b
y
over
10%
Dec
reas
ed b
y 1
-
10%
No
chan
ge
Incr
ease
d 1-
10%
Incr
ease
d by
over
10%
Tot
al in
crea
sed
Fac
tor
(Prin
cipa
l
com
pone
nt
Please indicate the extent to
which the agro-business’
employment levels grew/fell
over the last 1-5 years
Count 16 22 35 29 4
31%
0.942
% 15% 21% 33% 27% 4%
Please indicate the extent to
which the agro-business’
market share grew/fell over
the last 1-5 years
Count 13 26 39 24 4
27%
0.942
% 12% 25% 37% 23% 4%
Total variance explained by latent factors=88.74%
Note: Totals of percentages may not add up to 100 because of rounding off of figures.
Compared to the Zimbabwean sample in which varying responses were reported ranging from negative
growth, no change to positive growth were reported, the most observed category of responses on non-
financial productivity in the South African sample was “increased by 1-10%” (n = 112, 69% and n = 121,
75% respectively. Thus, the average total of percentage responses that showed, at least, an increase in
non-financial productivity in the previous 5 years was 86%. These findings demonstrate a marked
contrast between the respondents’ perception of the status and levels of non-financial productivity in
Mashonaland and Free State’s agricultural sectors. While no much current data on productivity is
available on the Zimbabwean sample due to inconsistent agricultural productivity record keeping, South
African research suggest that non-financial productivity has steadily grown over the years (Food and
Agriculture Organisation of the United Nations [FAO], 2015).
© Central University of Technology, Free State
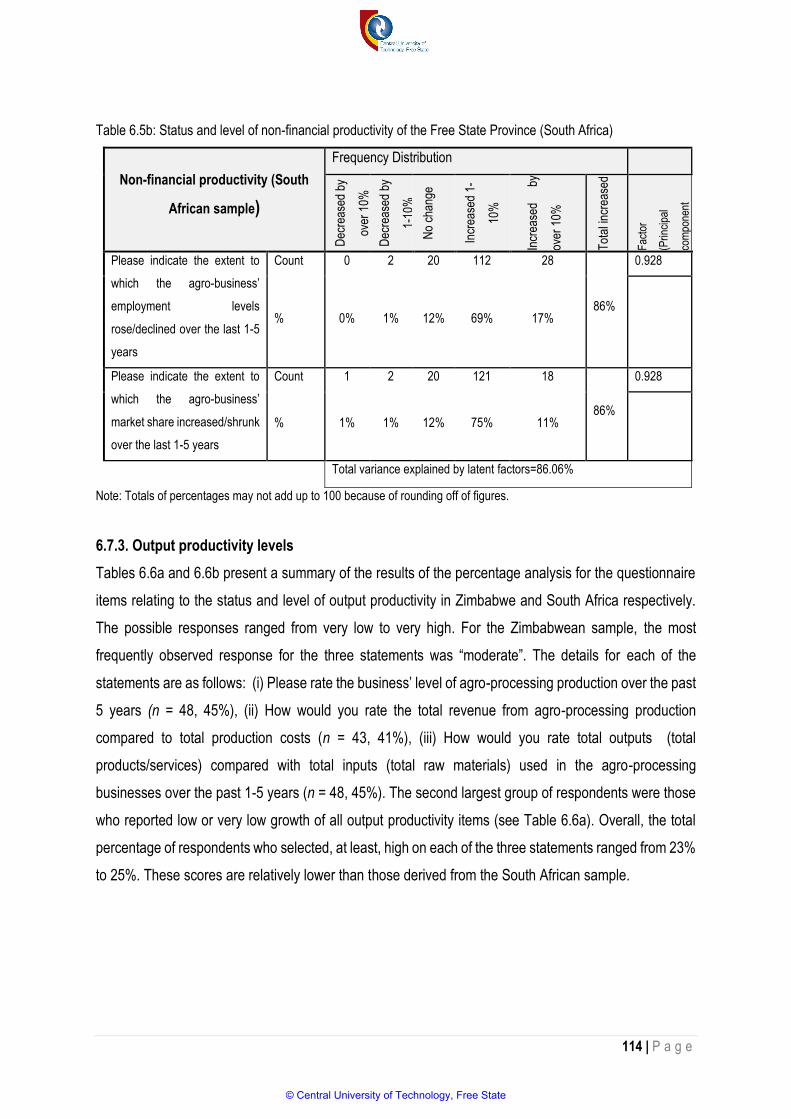
114 | P a g e
Table 6.5b: Status and level of non-financial productivity of the Free State Province (South Africa)
Non-financial productivity (South
African sample)
Frequency Distribution
Dec
reas
ed b
y
over
10%
Dec
reas
ed b
y
1-10
%
No
chan
ge
Incr
ease
d 1-
10%
Incr
ease
d by
over
10%
Tot
al in
crea
sed
Fac
tor
(Prin
cipa
l
com
pone
nt
Please indicate the extent to
which the agro-business’
employment levels
rose/declined over the last 1-5
years
Count 0 2 20 112 28
86%
0.928
% 0% 1% 12% 69% 17%
Please indicate the extent to
which the agro-business’
market share increased/shrunk
over the last 1-5 years
Count 1 2 20 121 18
86%
0.928
% 1% 1% 12% 75% 11%
Total variance explained by latent factors=86.06%
Note: Totals of percentages may not add up to 100 because of rounding off of figures.
6.7.3. Output productivity levels
Tables 6.6a and 6.6b present a summary of the results of the percentage analysis for the questionnaire
items relating to the status and level of output productivity in Zimbabwe and South Africa respectively.
The possible responses ranged from very low to very high. For the Zimbabwean sample, the most
frequently observed response for the three statements was “moderate”. The details for each of the
statements are as follows: (i) Please rate the business’ level of agro-processing production over the past
5 years (n = 48, 45%), (ii) How would you rate the total revenue from agro-processing production
compared to total production costs (n = 43, 41%), (iii) How would you rate total outputs (total
products/services) compared with total inputs (total raw materials) used in the agro-processing
businesses over the past 1-5 years (n = 48, 45%). The second largest group of respondents were those
who reported low or very low growth of all output productivity items (see Table 6.6a). Overall, the total
percentage of respondents who selected, at least, high on each of the three statements ranged from 23%
to 25%. These scores are relatively lower than those derived from the South African sample.
© Central University of Technology, Free State
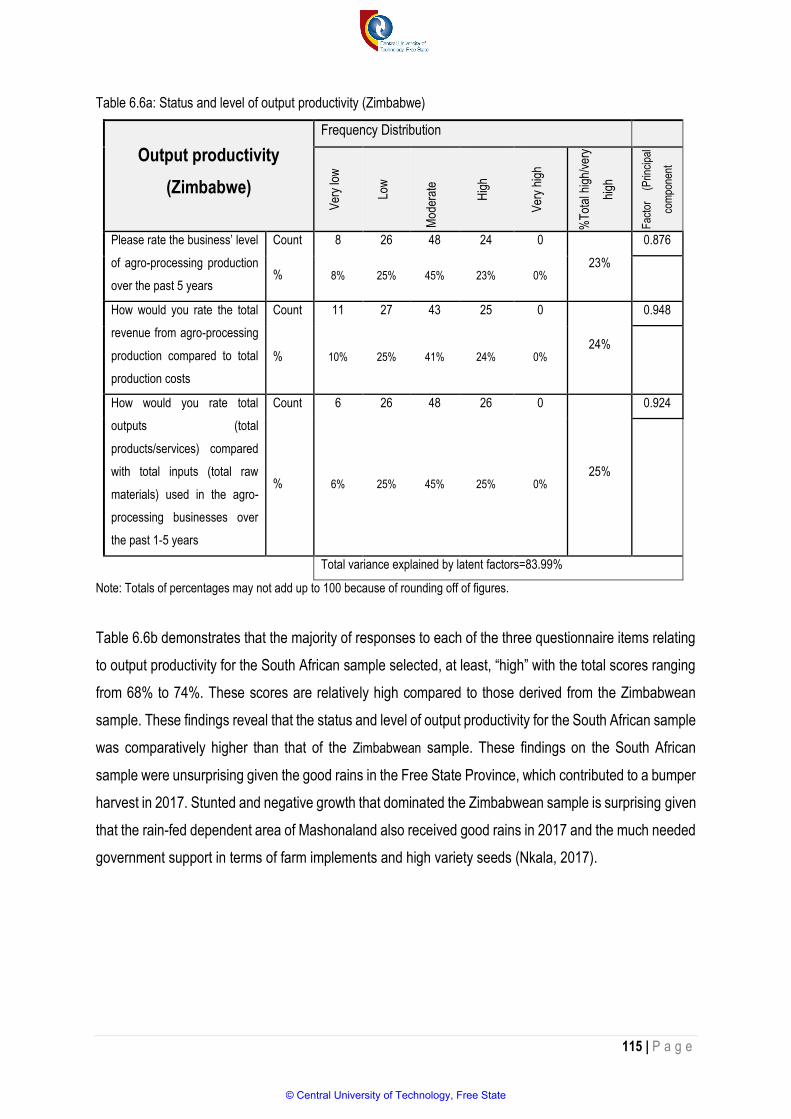
115 | P a g e
Table 6.6a: Status and level of output productivity (Zimbabwe)
Output productivity
(Zimbabwe)
Frequency Distribution
Ver
y lo
w
Low
Mod
erat
e
Hig
h
Ver
y hi
gh
%T
otal
hig
h/ve
ry
high
Fac
tor
(P
rinci
pal
com
pone
nt
Please rate the business’ level
of agro-processing production
over the past 5 years
Count 8 26 48 24 0
23%
0.876
% 8% 25% 45% 23% 0%
How would you rate the total
revenue from agro-processing
production compared to total
production costs
Count 11 27 43 25 0
24%
0.948
% 10% 25% 41% 24% 0%
How would you rate total
outputs (total
products/services) compared
with total inputs (total raw
materials) used in the agro-
processing businesses over
the past 1-5 years
Count 6 26 48 26 0
25%
0.924
% 6% 25% 45% 25% 0%
Total variance explained by latent factors=83.99%
Note: Totals of percentages may not add up to 100 because of rounding off of figures.
Table 6.6b demonstrates that the majority of responses to each of the three questionnaire items relating
to output productivity for the South African sample selected, at least, “high” with the total scores ranging
from 68% to 74%. These scores are relatively high compared to those derived from the Zimbabwean
sample. These findings reveal that the status and level of output productivity for the South African sample
was comparatively higher than that of the Zimbabwean sample. These findings on the South African
sample were unsurprising given the good rains in the Free State Province, which contributed to a bumper
harvest in 2017. Stunted and negative growth that dominated the Zimbabwean sample is surprising given
that the rain-fed dependent area of Mashonaland also received good rains in 2017 and the much needed
government support in terms of farm implements and high variety seeds (Nkala, 2017).
© Central University of Technology, Free State

116 | P a g e
Table 6.6b: Status and level of output productivity (South Africa)
Output productivity(South
Africa)
Frequency Distribution
Ver
y lo
w
Low
mod
erat
e
Hig
h
Ver
y hi
gh
% T
otal
hig
h
Fac
tor
(
Prin
cipa
l
com
pone
nt
Please rate the business’ level
of agro-processing production
over the past 5 years
Count 1 2 39 96 24
74%
0.547
% 1% 1% 24% 59% 15%
How would you rate the total
revenue from agro-processing
production compared to total
production costs
Count 1 2 48 91 20
68%
0.644
% 1% 1% 30% 56% 12%
How would you rate total
outputs (total
products/services) compared
with total inputs (total raw
materials) used in the agro-
processing businesses over
the past 1-5 years
Count 1 1 50 88 22
68%
0.565
% 1% 1% 31% 54% 14%
Total explained variance-=34.465%
Note: Totals of percentages may not add up to 100 because of rounding off of figures.
6.7.4. Productivity output per hectare
Tables 6.7a and 6.7b present a summary of the results of the percentage analysis for the questionnaire
items relating to the level of productivity output per hectare in Zimbabwe and South Africa respectively.
These questionnaire items only applied to respondents who were involved in crop production and
horticulture. For the Zimbabwean sample, the most frequently observed response for most of the five
statements was “moderate”. Overall, the respondents who selected, at least, high on each of the five
statements ranged from 25% to 33%. This means that the majority of Zimbabwean respondents
perceived productivity output per hectare to be either moderate or lower. This could be a consequence
fluctuating weather conditions, inadequate resources and increasing costs of agricultural inputs
(Cheesman, Andersson & Frossard, 2017).
For the South African sample, the modal response for the five statements was “high”. Overall, the total
percentage of respondents who selected “high” on each of the five statements ranged from 55% to 61%.
This means that the majority of South African respondents perceived the level of productivity
© Central University of Technology, Free State
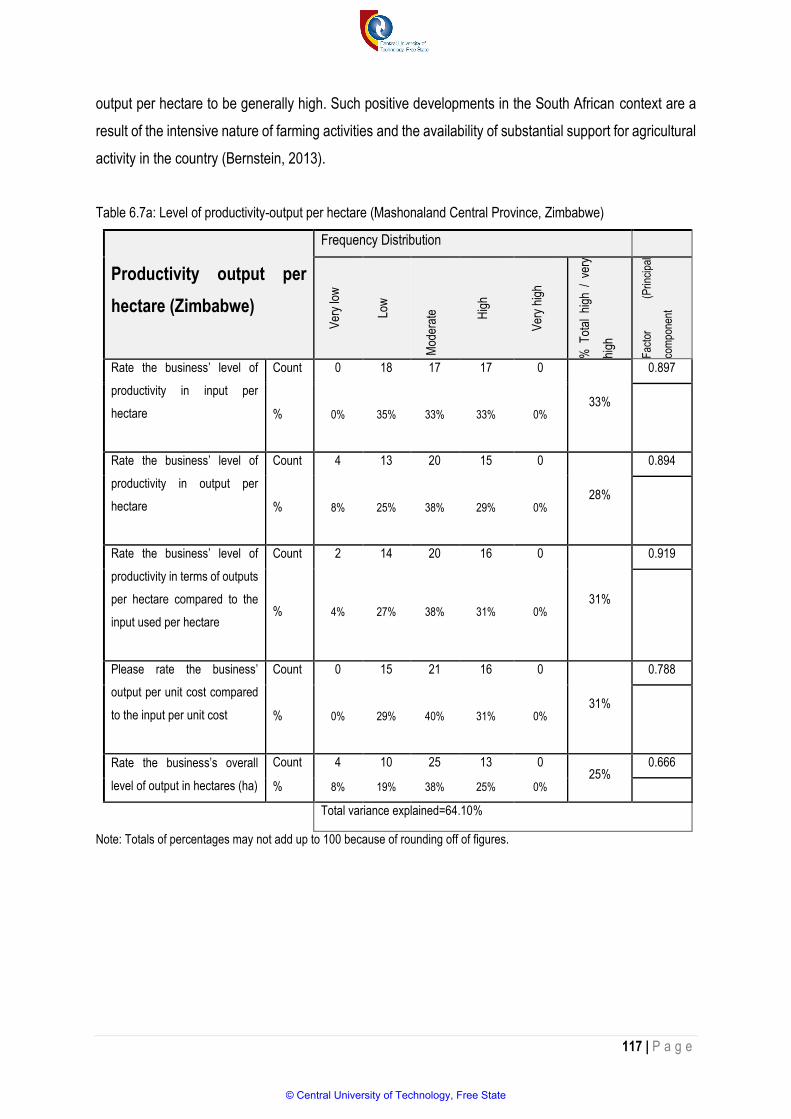
117 | P a g e
output per hectare to be generally high. Such positive developments in the South African context are a
result of the intensive nature of farming activities and the availability of substantial support for agricultural
activity in the country (Bernstein, 2013).
Table 6.7a: Level of productivity-output per hectare (Mashonaland Central Province, Zimbabwe)
Productivity output per
hectare (Zimbabwe)
Frequency Distribution
Ver
y lo
w
Low
Mod
erat
e Hig
h
Ver
y hi
gh
% T
otal
hig
h /
very
high
Fac
tor
(P
rinci
pal
com
pone
nt
Rate the business’ level of
productivity in input per
hectare
Count 0 18 17 17 0
33%
0.897
% 0% 35% 33% 33% 0%
Rate the business’ level of
productivity in output per
hectare
Count 4 13 20 15 0
28%
0.894
% 8% 25% 38% 29% 0%
Rate the business’ level of
productivity in terms of outputs
per hectare compared to the
input used per hectare
Count 2 14 20 16 0
31%
0.919
% 4% 27% 38% 31% 0%
Please rate the business’
output per unit cost compared
to the input per unit cost
Count 0 15 21 16 0
31%
0.788
% 0% 29% 40% 31% 0%
Rate the business’s overall
level of output in hectares (ha)
Count 4 10 25 13 0 25%
0.666
% 8% 19% 38% 25% 0%
Total variance explained=64.10%
Note: Totals of percentages may not add up to 100 because of rounding off of figures.
© Central University of Technology, Free State

118 | P a g e
Table 6.7b: Level of productivity - output per hectare (Free State Province, South Africa)
Productivity output per
hectare (South Africa)
Frequency Distribution
Ver
y lo
w
Low
Mod
erat
e
Hig
h
Ver
y hi
gh
% T
otal
hig
h/ve
ry
high
Fac
tor
(
Prin
cipa
l
com
pone
nt
Rate the business’ level of
productivity in input per
hectare
Count 0 2 33 46 9
61%
0.809
% 0% 2% 37% 51% 10%
Rate the business’ level of
productivity in output per
hectare
Count 0 1 39 46 4
55%
0.834
% 0% 1% 43% 51% 4%
Rate the business’ level of
productivity in terms of outputs
per hectare compared to the
input used per hectare
Count 0 4 35 48 3
56%
0.859
% 0% 4% 39% 53% 3%
Please rate the business’
output per unit cost compared
to the input per unit cost
Count 0 2 37 42 9
57%
0.844
% 0% 2% 41% 47% 10%
Rate the business’s overall
level of output in hectares ha
Count 0 3 33 50 4 60%
0.813
% 0% 3% 37% 56% 4%
Total variance explained by latent factors=69.21%
Note: Totals of percentages may not add up to 100 because of rounding off of figures.
6.7.5. Capacity utilisation output per hectare
Tables 6.8a and 6.8b present a summary of the results of the percentage analysis for the questionnaire
items relating to the status and level of capacity utilisation output per hectare in Zimbabwe and South
Africa respectively. This questionnaire items only applied to respondents who were involved in crop
production and horticulture. For the Zimbabwean sample, the most frequently observed response for
most of the five statements was “moderate”. Generally, the total percentage of respondents who selected,
at least, “high” for each of the five statements ranged from 17% to 35%. This means that most
Zimbabwean respondents observed productivity output per hectare to be either moderate or lower. The
fall in the level of capacity utilisation of productive agricultural land since the fast-track land reform
program is recognised in Zimbabwean literature (Sukume, Mavedzenge, Murimbarima & Scoones, 2015).
For the South African sample, the modal response category for the five statements was “high”. The total
percentage of respondents who selected “high” on each of the five statements ranged from 42% to 65%.
© Central University of Technology, Free State
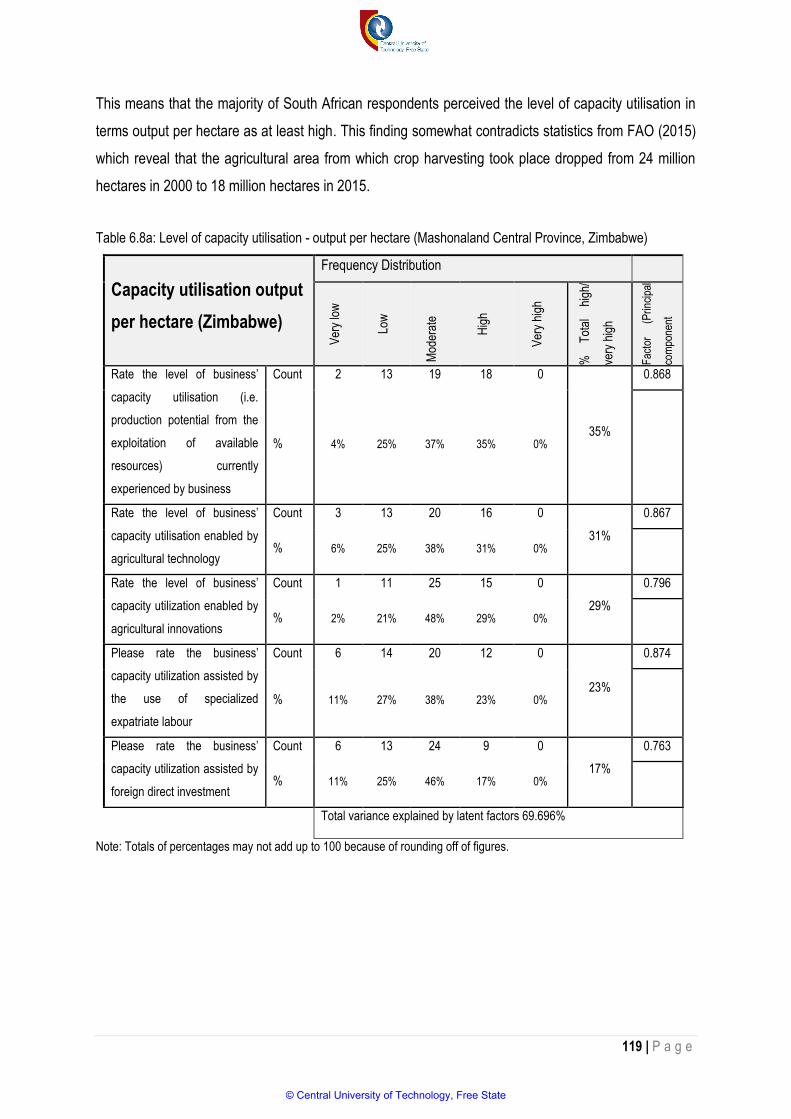
119 | P a g e
This means that the majority of South African respondents perceived the level of capacity utilisation in
terms output per hectare as at least high. This finding somewhat contradicts statistics from FAO (2015)
which reveal that the agricultural area from which crop harvesting took place dropped from 24 million
hectares in 2000 to 18 million hectares in 2015.
Table 6.8a: Level of capacity utilisation - output per hectare (Mashonaland Central Province, Zimbabwe)
Capacity utilisation output
per hectare (Zimbabwe)
Frequency Distribution
Ver
y lo
w
Low
Mod
erat
e
Hig
h
Ver
y hi
gh
%
Tot
al
high
/
very
hig
h
Fac
tor
(
Prin
cipa
l
com
pone
nt
Rate the level of business’
capacity utilisation (i.e.
production potential from the
exploitation of available
resources) currently
experienced by business
Count 2 13 19 18 0
35%
0.868
% 4% 25% 37% 35% 0%
Rate the level of business’
capacity utilisation enabled by
agricultural technology
Count 3 13 20 16 0
31%
0.867
% 6% 25% 38% 31% 0%
Rate the level of business’
capacity utilization enabled by
agricultural innovations
Count 1 11 25 15 0
29%
0.796
% 2% 21% 48% 29% 0%
Please rate the business’
capacity utilization assisted by
the use of specialized
expatriate labour
Count 6 14 20 12 0
23%
0.874
% 11% 27% 38% 23% 0%
Please rate the business’
capacity utilization assisted by
foreign direct investment
Count 6 13 24 9 0
17%
0.763
% 11% 25% 46% 17% 0%
Total variance explained by latent factors 69.696%
Note: Totals of percentages may not add up to 100 because of rounding off of figures.
© Central University of Technology, Free State
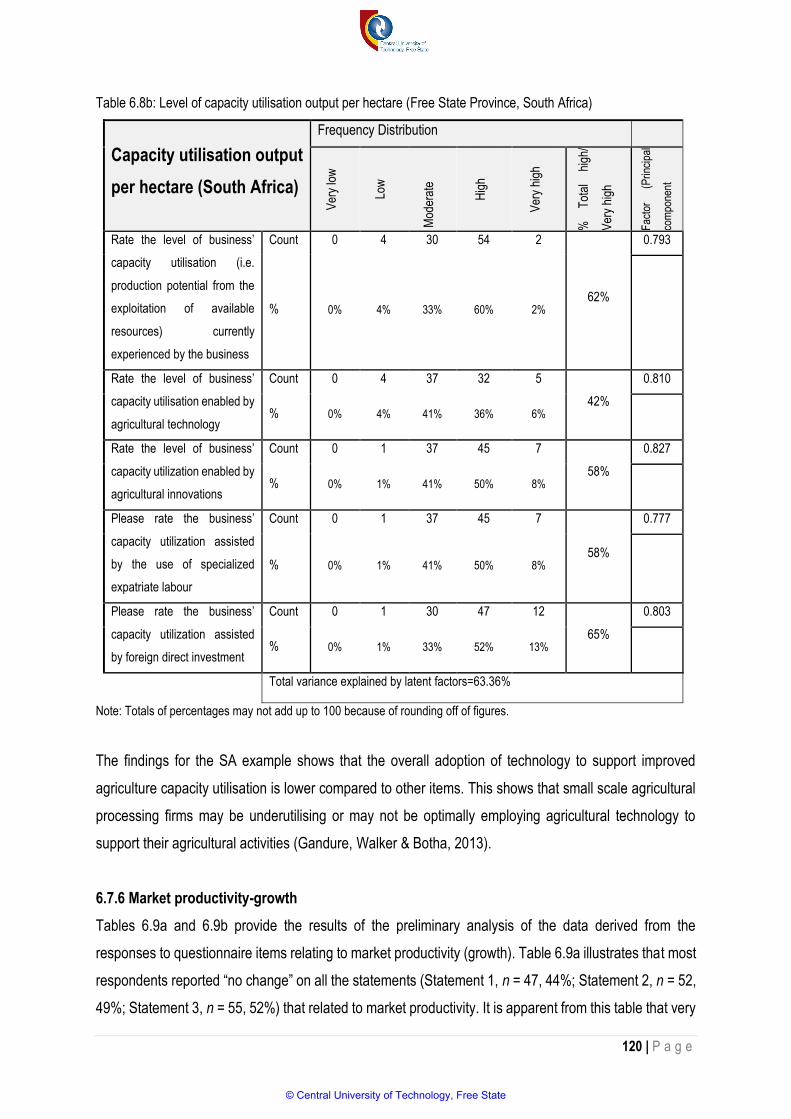
120 | P a g e
Table 6.8b: Level of capacity utilisation output per hectare (Free State Province, South Africa)
Capacity utilisation output
per hectare (South Africa)
Frequency Distribution
Ver
y lo
w
Low
Mod
erat
e
Hig
h
Ver
y hi
gh
%
Tot
al
high
/
Ver
y hi
gh
Fac
tor
(
Prin
cipa
l
com
pone
nt
Rate the level of business’
capacity utilisation (i.e.
production potential from the
exploitation of available
resources) currently
experienced by the business
Count 0 4 30 54 2
62%
0.793
% 0% 4% 33% 60% 2%
Rate the level of business’
capacity utilisation enabled by
agricultural technology
Count 0 4 37 32 5
42%
0.810
% 0% 4% 41% 36% 6%
Rate the level of business’
capacity utilization enabled by
agricultural innovations
Count 0 1 37 45 7
58%
0.827
% 0% 1% 41% 50% 8%
Please rate the business’
capacity utilization assisted
by the use of specialized
expatriate labour
Count 0 1 37 45 7
58%
0.777
% 0% 1% 41% 50% 8%
Please rate the business’
capacity utilization assisted
by foreign direct investment
Count 0 1 30 47 12
65%
0.803
% 0% 1% 33% 52% 13%
Total variance explained by latent factors=63.36%
Note: Totals of percentages may not add up to 100 because of rounding off of figures.
The findings for the SA example shows that the overall adoption of technology to support improved
agriculture capacity utilisation is lower compared to other items. This shows that small scale agricultural
processing firms may be underutilising or may not be optimally employing agricultural technology to
support their agricultural activities (Gandure, Walker & Botha, 2013).
6.7.6 Market productivity-growth
Tables 6.9a and 6.9b provide the results of the preliminary analysis of the data derived from the
responses to questionnaire items relating to market productivity (growth). Table 6.9a illustrates that most
respondents reported “no change” on all the statements (Statement 1, n = 47, 44%; Statement 2, n = 52,
49%; Statement 3, n = 55, 52%) that related to market productivity. It is apparent from this table that very
© Central University of Technology, Free State
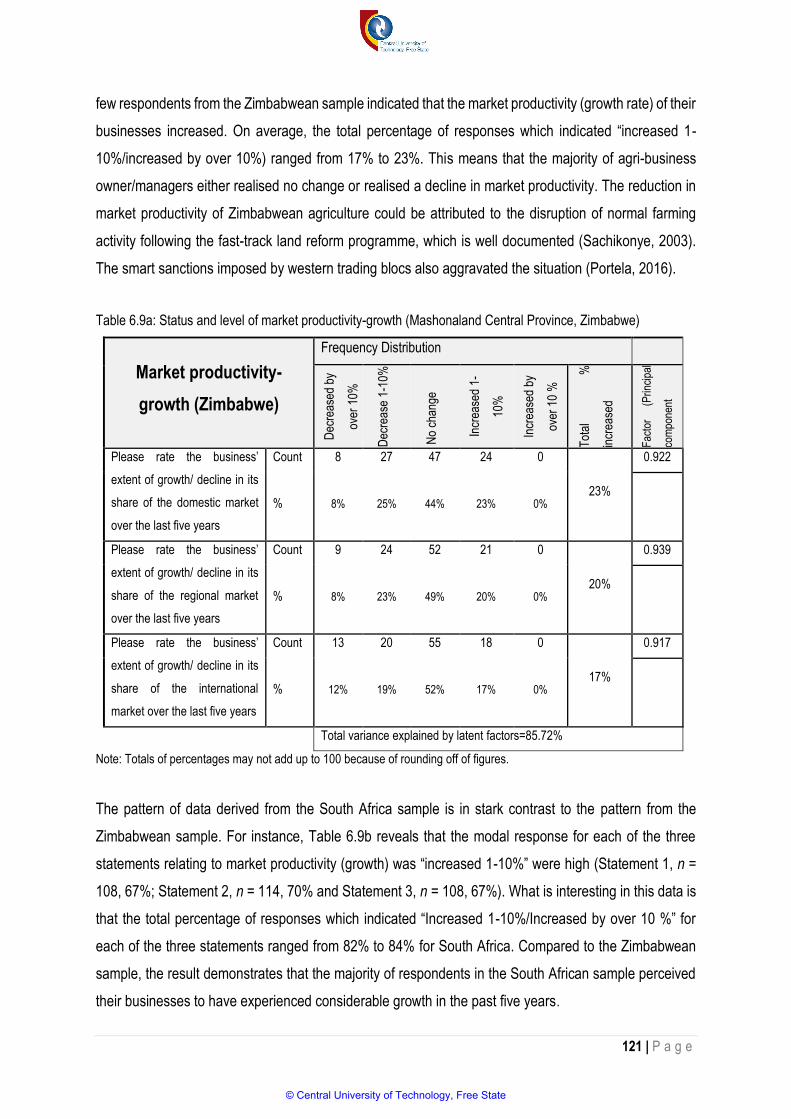
121 | P a g e
few respondents from the Zimbabwean sample indicated that the market productivity (growth rate) of their
businesses increased. On average, the total percentage of responses which indicated “increased 1-
10%/increased by over 10%) ranged from 17% to 23%. This means that the majority of agri-business
owner/managers either realised no change or realised a decline in market productivity. The reduction in
market productivity of Zimbabwean agriculture could be attributed to the disruption of normal farming
activity following the fast-track land reform programme, which is well documented (Sachikonye, 2003).
The smart sanctions imposed by western trading blocs also aggravated the situation (Portela, 2016).
Table 6.9a: Status and level of market productivity-growth (Mashonaland Central Province, Zimbabwe)
Market productivity-
growth (Zimbabwe)
Frequency Distribution
Dec
reas
ed b
y
over
10%
Dec
reas
e 1-
10%
No
chan
ge
Incr
ease
d 1-
10%
Incr
ease
d by
over
10
%
Tot
al
%
incr
ease
d
Fac
tor
(P
rinci
pal
com
pone
nt
Please rate the business’
extent of growth/ decline in its
share of the domestic market
over the last five years
Count 8 27 47 24 0
23%
0.922
% 8% 25% 44% 23% 0%
Please rate the business’
extent of growth/ decline in its
share of the regional market
over the last five years
Count 9 24 52 21 0
20%
0.939
% 8% 23% 49% 20% 0%
Please rate the business’
extent of growth/ decline in its
share of the international
market over the last five years
Count 13 20 55 18 0
17%
0.917
% 12% 19% 52% 17% 0%
Total variance explained by latent factors=85.72%
Note: Totals of percentages may not add up to 100 because of rounding off of figures.
The pattern of data derived from the South Africa sample is in stark contrast to the pattern from the
Zimbabwean sample. For instance, Table 6.9b reveals that the modal response for each of the three
statements relating to market productivity (growth) was “increased 1-10%” were high (Statement 1, n =
108, 67%; Statement 2, n = 114, 70% and Statement 3, n = 108, 67%). What is interesting in this data is
that the total percentage of responses which indicated “Increased 1-10%/Increased by over 10 %” for
each of the three statements ranged from 82% to 84% for South Africa. Compared to the Zimbabwean
sample, the result demonstrates that the majority of respondents in the South African sample perceived
their businesses to have experienced considerable growth in the past five years.
© Central University of Technology, Free State

122 | P a g e
Table 6.9b: Status and level of market productivity-growth (Free State Province, South Africa)
Market productivity-
growth (South Africa)
Frequency Distribution
Dec
reas
ed b
y
over
10%
Dec
reas
e 1-
10%
No
chan
ge
Incr
ease
d 1-
10%
Incr
ease
d by
over
10
%
%T
otal
incr
ease
d
Fac
tor
(
Prin
cipa
l
com
pone
nt
Please rate the business’
extent of growth/ decline in its
share of the domestic market
over the last five years
Count 0 3 24 108 27
84%
0.783
% 0% 2% 15% 67% 17%
Please rate the business’
extent of growth/ decline in its
share of the regional market
over the last five years
Count 0 3 22 114 23
84%
0.862
% 0% 2% 14% 70% 14%
Please rate the business’
extent of growth/ decline in its
share of the international
market over the last five years
Count 0 3 27 108 24
82%
0.782
% 0% 2% 17% 67% 15%
Total variance explained=65.56%
Note: Totals of percentages may not add up to 100 because of rounding off of figures.
6.7.7 Market productivity-reputation
Tables 6.10a and 6.10b show the results from the preliminary analysis of the responses on the status
and level of market productivity (reputation) for the Zimbabwean and South African samples. With regard
to Zimbabwe, Table 6.10a reveals that the modal response for the three items relating to market
productivity was “moderate” (Statement 1, n = 49, 46%; Statement 2, n = 49, 46% and Statement 3, n =
56, 53%). Between 21% and 22% of the respondents indicated that the extent of reputation of their agro-
processing products was at least high. In other words, the majority of respondents felt that the reputation
of their firms were low.
Table 6.10b which relates to the South Africa sample, provides a comparatively different picture to the
one of Zimbabwe. Firstly, the most frequent response to all the three questionnaire items relating to
reputation for the SA sample was “high” (Statement 1, n = 104, 64%; Statement 2, n = 106, 65% and
© Central University of Technology, Free State
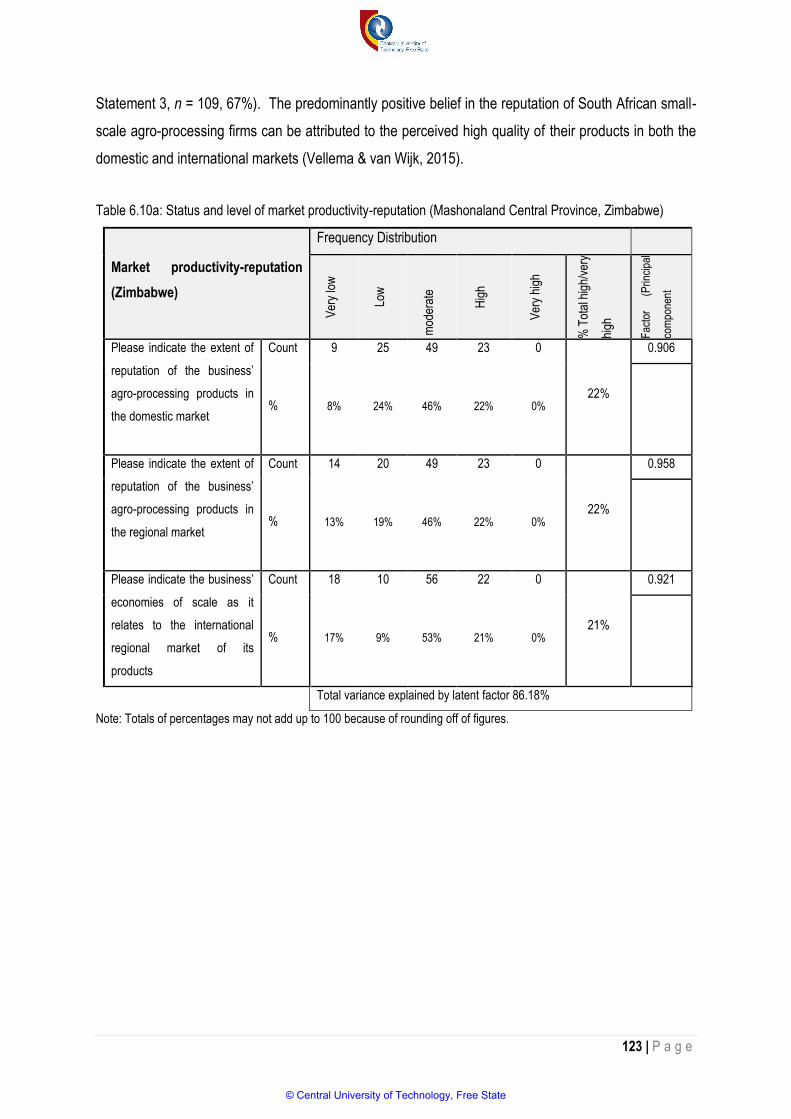
123 | P a g e
Statement 3, n = 109, 67%). The predominantly positive belief in the reputation of South African small-
scale agro-processing firms can be attributed to the perceived high quality of their products in both the
domestic and international markets (Vellema & van Wijk, 2015).
Table 6.10a: Status and level of market productivity-reputation (Mashonaland Central Province, Zimbabwe)
Market productivity-reputation
(Zimbabwe)
Frequency Distribution
Ver
y lo
w
Low
mod
erat
e
Hig
h
Ver
y hi
gh
% T
otal
hig
h/ve
ry
high
Fac
tor
(
Prin
cipa
l
com
pone
nt
Please indicate the extent of
reputation of the business’
agro-processing products in
the domestic market
Count 9 25 49 23 0
22%
0.906
% 8% 24% 46% 22% 0%
Please indicate the extent of
reputation of the business’
agro-processing products in
the regional market
Count 14 20 49 23 0
22%
0.958
% 13% 19% 46% 22% 0%
Please indicate the business’
economies of scale as it
relates to the international
regional market of its
products
Count 18 10 56 22 0
21%
0.921
% 17% 9% 53% 21% 0%
Total variance explained by latent factor 86.18%
Note: Totals of percentages may not add up to 100 because of rounding off of figures.
© Central University of Technology, Free State
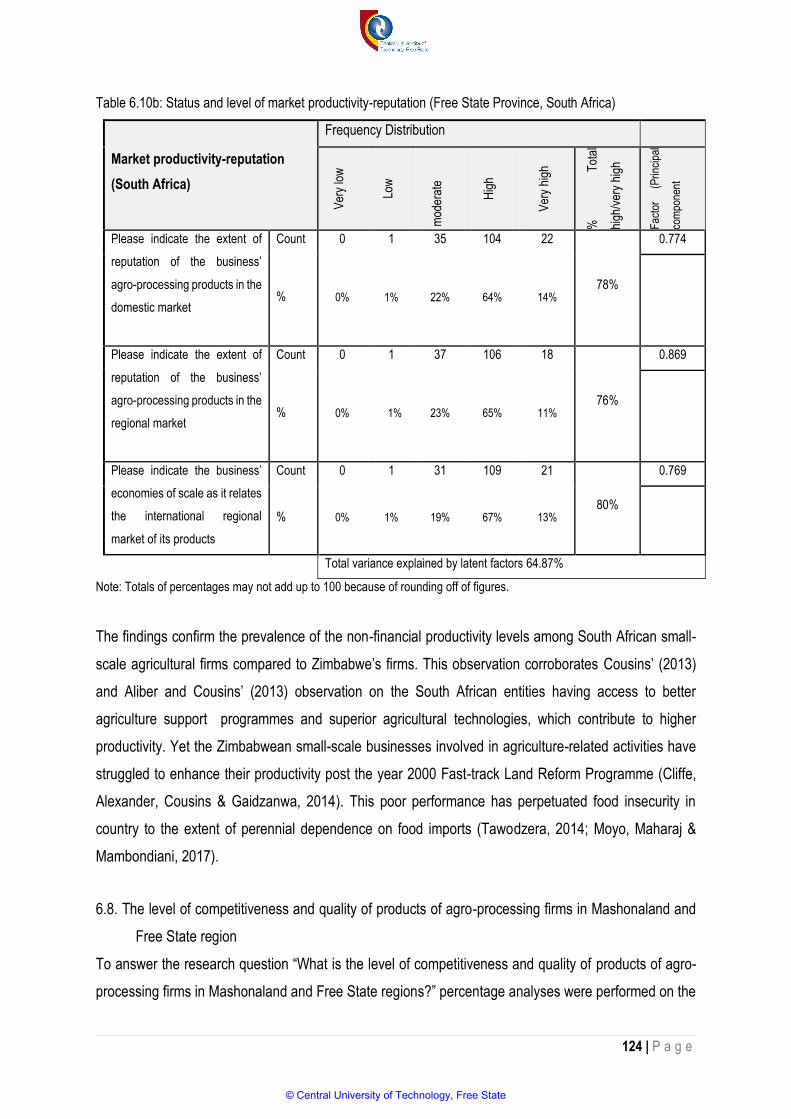
124 | P a g e
Table 6.10b: Status and level of market productivity-reputation (Free State Province, South Africa)
Market productivity-reputation
(South Africa)
Frequency Distribution
Ver
y lo
w
Low
mod
erat
e
Hig
h
Ver
y hi
gh
%
Tot
al
high
/ver
y hi
gh
Fac
tor
(
Prin
cipa
l
com
pone
nt
Please indicate the extent of
reputation of the business’
agro-processing products in the
domestic market
Count 0 1 35 104 22
78%
0.774
% 0% 1% 22% 64% 14%
Please indicate the extent of
reputation of the business’
agro-processing products in the
regional market
Count 0 1 37 106 18
76%
0.869
% 0% 1% 23% 65% 11%
Please indicate the business’
economies of scale as it relates
the international regional
market of its products
Count 0 1 31 109 21
80%
0.769
% 0% 1% 19% 67% 13%
Total variance explained by latent factors 64.87%
Note: Totals of percentages may not add up to 100 because of rounding off of figures.
The findings confirm the prevalence of the non-financial productivity levels among South African small-
scale agricultural firms compared to Zimbabwe’s firms. This observation corroborates Cousins’ (2013)
and Aliber and Cousins’ (2013) observation on the South African entities having access to better
agriculture support programmes and superior agricultural technologies, which contribute to higher
productivity. Yet the Zimbabwean small-scale businesses involved in agriculture-related activities have
struggled to enhance their productivity post the year 2000 Fast-track Land Reform Programme (Cliffe,
Alexander, Cousins & Gaidzanwa, 2014). This poor performance has perpetuated food insecurity in
country to the extent of perennial dependence on food imports (Tawodzera, 2014; Moyo, Maharaj &
Mambondiani, 2017).
6.8. The level of competitiveness and quality of products of agro-processing firms in Mashonaland and
Free State region
To answer the research question “What is the level of competitiveness and quality of products of agro-
processing firms in Mashonaland and Free State regions?” percentage analyses were performed on the
© Central University of Technology, Free State

125 | P a g e
data solicited from respondents. The level of competitiveness was ascertained using Likert-scale
statements which were grouped under the following constructs: general market competitiveness, market
price competitiveness, market domination, customer satisfaction, promotion and organisational
effectiveness. These sub-components are dealt with each in turn.
6.8.1. General market competitiveness
As shown in Table 6.11a, the most frequently observed category of the responses to the questionnaire
items measuring general market competitiveness was “neutral” for the Zimbabwe sample (Item 1, n = 62,
58%; Item 2, n = 49, 46%; Item 3, n = 54, 51%; Item 4, n = 56, 53%; Item 5, n = 46, 43%). Essentially,
the total percentage of respondents who indicated “agree/strongly agree” to the questionnaire items
ranged between 16% and 39%. Based on the distribution of these responses, it can be concluded that
status and level of general market competitiveness of Zimbabwean firms was relatively lower than the
South African ones.
A close analysis of Table 6.11b shows that, save for item 1, the modal response to most of the items
measuring general market competitiveness was “agree” for the South African sample ( Item 2, n = 124,
Item 3, n = 126, 78%; Item 4, n = 137, 85%; Item 5, n = 140, 86%). Except for item 1, the percentage
total of respondents who “agreed/strongly agreed” to each of the questionnaire items was, on average,
above 90%. Founded on these observations, it can be concluded that the state and level of general
market competitiveness for the South African firms was comparatively high. This market competitiveness
can be attributed to marketing efficiencies, multiple electronic marketing platforms, and social media
platforms, which are highly developed in the South African context (Bernstein, 2013).
© Central University of Technology, Free State

126 | P a g e
Table 6.11a: Status and level of general market competitiveness of Mashonaland Central agro-processing firms
General market
competitiveness
(Zimbabwe)
Frequency Distribution
Str
ongl
y
Dis
agre
e
Dis
agre
e
indi
ffere
nt
Agr
ee
Str
ongl
y A
gree
% A
gree
/
Str
ongl
y A
gree
Fac
tor
(P
rinci
pal
com
pone
nt
The business has established
strong agro-processing
brands/services in the market
compared to its competitors
Count 1 26 62 3 14
16%
0.885
% 1% 25% 25% 3% 13%
The business’ agro-processing
products/services have
considerable competitive
advantage over those of its
competitors
Count 8 14 49 35 0
33%
0.920
% 8% 13% 46% 33% 0%
The business’ agro-processing
products or services are easily
recognizable in the market
compared to those of its
competitors
Count 5 16 54 30 1
29%
0.907
% 5% 15% 51% 28% 1%
The business’ agro-processing
products/services enjoy higher
sales in the market compared to
those of competitors
Count 2 14 56 32 2
32%
0.312
% 2% 13% 53% 30% 2%
The agro-processed products
or services have more
dominance over those of the
firm’s competitors
Count 4 15 46 40 1
39%
0.864
% 4% 14% 53% 38% 1%
Total variance explained by latent factors=65.919%
Note: Totals of percentages may not add up to 100 because of rounding off of figures.
© Central University of Technology, Free State

127 | P a g e
Table 6.11b: Status and level of general market competitiveness of Free State agro-processing firms
General market
competitiveness
(South Africa)
Frequency Distribution
Str
ongl
y
Dis
agre
e
Dis
agre
e
indi
ffere
nt
Agr
ee
Str
ongl
y A
gree
% A
gree
/
Str
ongl
y A
gree
Fac
tor
(P
rinci
pal
com
pone
nt
The business has established
strong agro-processing
brands/services in the market
compared to its competitors
Count 25 112 25 0 0
0%
0.748
% 15% 69% 15% 0% 0%
The business’ agro-processing
products/services have
considerable competitive
advantage those of its
competitors
Count 0 1 14 124 23
91%
0.801
% 0% 1% 9% 77% 14%
The business’ agro-processing
products or services are easily
recognizable in the market
compared to those of its
competitors
Count 0 1 9 127 25
94%
0.707
% 0% 1% 6% 79% 15%
The business’ agro-processing
products or services enjoy
higher sales in the market
compared to those of
competitors
Count 0 2 7 137 16
95%
0.756
% 0% 1% 4% 85% 10%
The agro-processed products or
services have more dominance
over those of the firm’s
competitors
Count 0 3 4 140 15
95%
0.670
% 0% 2% 2% 86% 9%
Total variance explained by latent factor=45.295%
Note: Totals of percentages may not add up to 100 because of rounding off figures.
6.8.2 Customer satisfaction of agro-processing firms
In the current study, the customer satisfaction variable also formed part of the criteria used for assessing
the status and level of competitiveness of agro-processing firms in Zimbabwe and South Africa. An
© Central University of Technology, Free State
128 | P a g e
analysis of Tables 6.12a and 6.12b reveals a stark contrast between the results derived from the samples
from the two participating countries. In the case of the Zimbabwean sample, the most frequent response
to the five questionnaire items measuring customer satisfaction was “indifferent” (Item 2, n = 50, 47%;
Item 3, n = 56, 53%; Item 4, n = 49, 46%; Item 5, n = 57, 54%). Apart from that, the percentage total of
the responses which fall under the “Agree/ Strongly agree” categories ranged from 30% to 40% for all
the five questionnaire items measuring customer satisfaction. This means that the majority of
Zimbabwean respondents (agro-business owners) felt that their customers were either undecided or not
satisfied with the level of service they received from local agro-businesses. This supports the findings of
Makate, Siziba, Hanyani-Mlambo, Sadomba and Mango (2016) which suggest that small and medium
enterprises in the agro-processing industry in Zimbabwe were modestly efficient, profitable and
competitive owing to the moderate satisfaction enjoyed by their customers.
Table 6.12b illustrates the results from the South African sample. Unlike the Zimbabwean sample, results
where the modal response was “indifferent”, the most frequently observed response category for the five
items category was “agree” (Item 1, n = 133, 82%; Item 2, n = 131, 81%; Item 3, n = 128, 79%; Item 4, n
= 127, 78%; Item 5, n = 123, 76%). In addition, percentage totals of “agree or strongly agree” responses
were above 80% for all the five items measuring customer satisfaction. The results suggest that the
majority of South African agri-business owners who participated in this study believed that their customers
were satisfied with the level of service they received. Since these are self-reports, it is difficult to establish
whether these accounts were authentic reflections of these agro-processing business’ customers
experiences or they were just self-constructions of their beliefs (Kormos & Gifford, 2014).
© Central University of Technology, Free State

129 | P a g e
Table 6.12a: Status and level of customers’ satisfaction with Mashonaland Central agro-processing firms’
products/services
Customer satisfaction
(Zimbabwe)
Frequency Distribution
Str
ongl
y
Dis
agre
e
Dis
agre
e
Indi
ffere
nt
Agr
ee
Str
ongl
y A
gree
% A
gree
/
Str
ongl
y A
gree
Fac
tor
(P
rinci
pal
com
pone
nt
The customers are satisfied
with the business’ agro-
business brands/services
compared to those of its
competitors
Count 1 15 40 49 1
47%
0.871
% 1% 14% 38% 46% 1%
The business’ agro-
processing products /services
are bought by customers
ahead of those of competitors
Count 4 12 50 39 1
38%
0.910
% 4% 11% 47% 37% 1%
The business’ agro-
processing products/services
are preferred by customers
compared to those of
competitors
Count 10 5 56 33 2
33%
0.933
% 9% 5% 53% 31% 2%
The price of the business’
agro-processing products
/services are preferred by
customers compared to those
of its competitors
Count 8 6 49 41 2
41%
0.886
% 8% 6% 46% 39% 2%
The business has strong
relationship with its customers
base compared to its
competitors
Count 4 13 57 31 1
30%
0.851
% 4% 12% 54% 29% 1%
Total variance explained by latent factors=79.356%
Note: Totals of percentages may not add up to 100 because of rounding off of figures.
© Central University of Technology, Free State
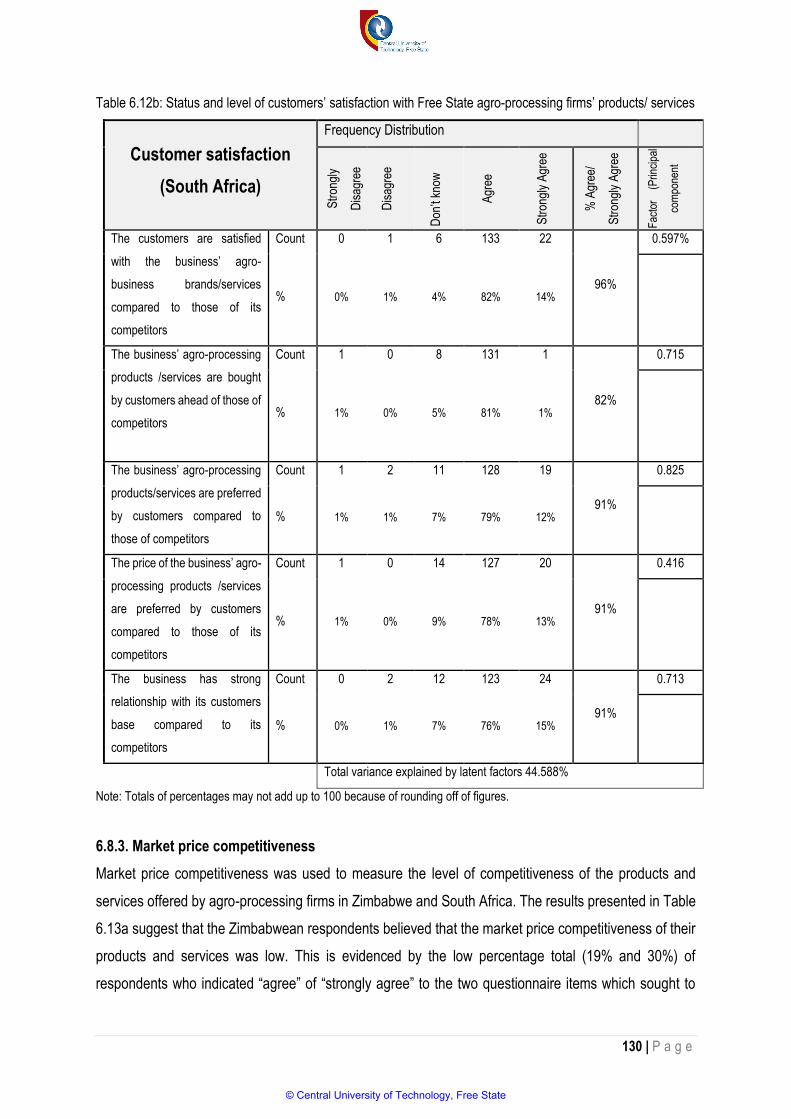
130 | P a g e
Table 6.12b: Status and level of customers’ satisfaction with Free State agro-processing firms’ products/ services
Customer satisfaction
(South Africa)
Frequency Distribution
Str
ongl
y
Dis
agre
e
Dis
agre
e
Don
’t kn
ow
Agr
ee
Str
ongl
y A
gree
% A
gree
/
Str
ongl
y A
gree
Fac
tor
(P
rinci
pal
com
pone
nt
The customers are satisfied
with the business’ agro-
business brands/services
compared to those of its
competitors
Count 0 1 6 133 22
96%
0.597%
% 0% 1% 4% 82% 14%
The business’ agro-processing
products /services are bought
by customers ahead of those of
competitors
Count 1 0 8 131 1
82%
0.715
% 1% 0% 5% 81% 1%
The business’ agro-processing
products/services are preferred
by customers compared to
those of competitors
Count 1 2 11 128 19
91%
0.825
% 1% 1% 7% 79% 12%
The price of the business’ agro-
processing products /services
are preferred by customers
compared to those of its
competitors
Count 1 0 14 127 20
91%
0.416
% 1% 0% 9% 78% 13%
The business has strong
relationship with its customers
base compared to its
competitors
Count 0 2 12 123 24
91%
0.713
% 0% 1% 7% 76% 15%
Total variance explained by latent factors 44.588%
Note: Totals of percentages may not add up to 100 because of rounding off of figures.
6.8.3. Market price competitiveness
Market price competitiveness was used to measure the level of competitiveness of the products and
services offered by agro-processing firms in Zimbabwe and South Africa. The results presented in Table
6.13a suggest that the Zimbabwean respondents believed that the market price competitiveness of their
products and services was low. This is evidenced by the low percentage total (19% and 30%) of
respondents who indicated “agree” of “strongly agree” to the two questionnaire items which sought to
© Central University of Technology, Free State
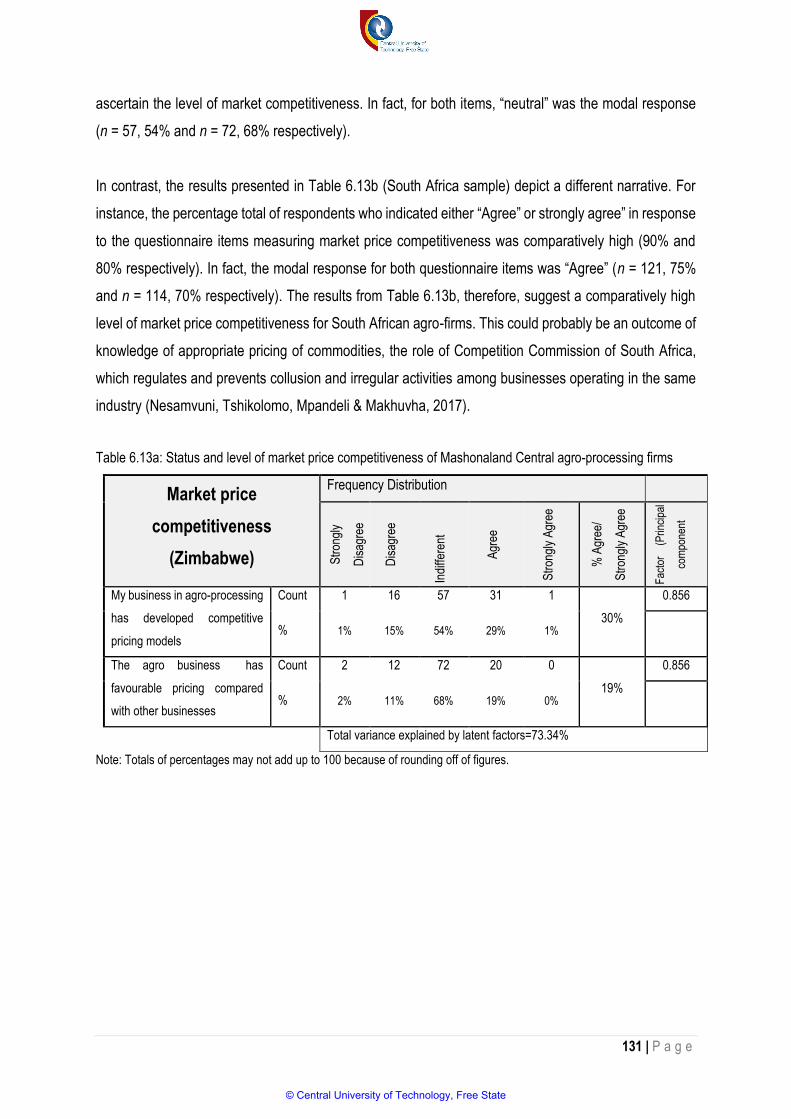
131 | P a g e
ascertain the level of market competitiveness. In fact, for both items, “neutral” was the modal response
(n = 57, 54% and n = 72, 68% respectively).
In contrast, the results presented in Table 6.13b (South Africa sample) depict a different narrative. For
instance, the percentage total of respondents who indicated either “Agree” or strongly agree” in response
to the questionnaire items measuring market price competitiveness was comparatively high (90% and
80% respectively). In fact, the modal response for both questionnaire items was “Agree” (n = 121, 75%
and n = 114, 70% respectively). The results from Table 6.13b, therefore, suggest a comparatively high
level of market price competitiveness for South African agro-firms. This could probably be an outcome of
knowledge of appropriate pricing of commodities, the role of Competition Commission of South Africa,
which regulates and prevents collusion and irregular activities among businesses operating in the same
industry (Nesamvuni, Tshikolomo, Mpandeli & Makhuvha, 2017).
Table 6.13a: Status and level of market price competitiveness of Mashonaland Central agro-processing firms
Market price
competitiveness
(Zimbabwe)
Frequency Distribution
Str
ongl
y
Dis
agre
e
Dis
agre
e
Indi
ffere
nt
Agr
ee
Str
ongl
y A
gree
% A
gree
/
Str
ongl
y A
gree
Fac
tor
(P
rinci
pal
com
pone
nt
My business in agro-processing
has developed competitive
pricing models
Count 1 16 57 31 1
30%
0.856
% 1% 15% 54% 29% 1%
The agro business has
favourable pricing compared
with other businesses
Count 2 12 72 20 0
19%
0.856
% 2% 11% 68% 19% 0%
Total variance explained by latent factors=73.34%
Note: Totals of percentages may not add up to 100 because of rounding off of figures.
© Central University of Technology, Free State

132 | P a g e
Table 6.13b: Status and level of market price competitiveness of Free State agro-processing firms
Market price competitiveness
(South Africa)
Frequency Distribution
Str
ongl
y
Dis
agre
e
Dis
agre
e
Don
’t kn
ow
Agr
ee
Str
ongl
y A
gree
% A
gree
/
Str
ongl
y A
gree
Fac
tor
(Prin
cipa
l
com
pone
nt
My business in agro-
processing has developed
competitive pricing models
Count 0 0 17 121 24
90%
0.874
% 0% 0% 10% 75% 15%
The agro business has
favourable pricing compared
with other businesses
Count 0 1 30 114 17
80%
0.874
% 0% 1% 19% 70% 10%
Total variance explained by latent factors 76.34%
Note: Totals of percentages may not add up to 100 because of rounding off figures.
6.8.4 Market domination
Another factor used to assess the level of competitiveness of selected Zimbabwean and South African
agro-businesses in the current study was the level of market domination. Table 6.14a provides the results
from the preliminary analysis of the Zimbabwean sample data. An examination of the results reveals that
the most frequent response was “moderate” (Item 1, n = 69, 65%; Item 2, n = 53, 50%; Item 3, n = 55,
52%; Item 4, n = 47, 44%; Item 5, n = 44, 42%). In addition, the percentage total of respondents who
believed the market domination of their business to be “high” or “very high” ranged from 10% to 41%.
This suggests a low perception of market domination agro-processing firms in this country.
On the other hand, Table 6.14b (South Africa) depicts a different picture to the one presented in Table
6.14a. The modal response category for questionnaire items measuring market domination was “high”
(Item 1, n = 99, 61%; Item 2, n = 95, 59%; Item 3, n = 95, 59%; Item 4, n = 102, 63%; Item 5, n = 105,
65%). Apart from that, the percentage totals of responses “high” or “very high” ranged from 67% to 72%
and so indicates a relatively high perception of market domination among the South African respondents.
© Central University of Technology, Free State
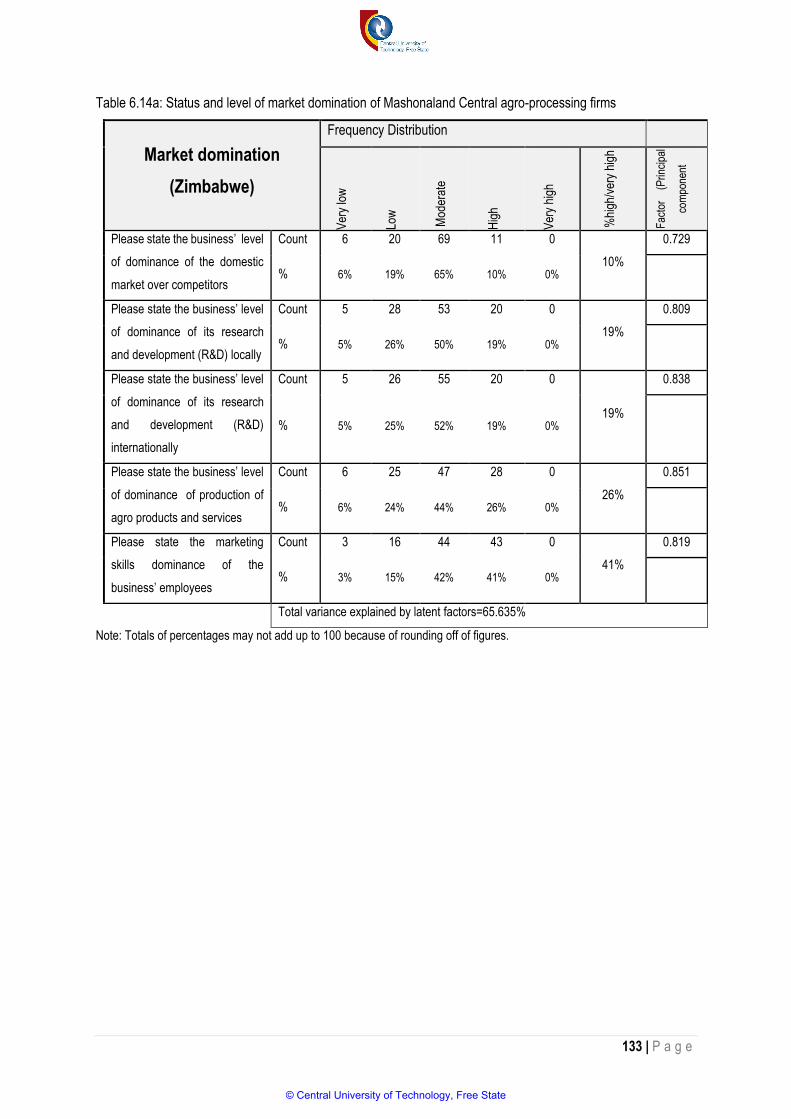
133 | P a g e
Table 6.14a: Status and level of market domination of Mashonaland Central agro-processing firms
Market domination
(Zimbabwe)
Frequency Distribution
Ver
y lo
w
Low
Mod
erat
e
Hig
h
Ver
y hi
gh
%hi
gh/v
ery
high
Fac
tor
(P
rinci
pal
com
pone
nt
Please state the business’ level
of dominance of the domestic
market over competitors
Count 6 20 69 11 0
10%
0.729
% 6% 19% 65% 10% 0%
Please state the business’ level
of dominance of its research
and development (R&D) locally
Count 5 28 53 20 0
19%
0.809
% 5% 26% 50% 19% 0%
Please state the business’ level
of dominance of its research
and development (R&D)
internationally
Count 5 26 55 20 0
19%
0.838
% 5% 25% 52% 19% 0%
Please state the business’ level
of dominance of production of
agro products and services
Count 6 25 47 28 0
26%
0.851
% 6% 24% 44% 26% 0%
Please state the marketing
skills dominance of the
business’ employees
Count 3 16 44 43 0
41%
0.819
% 3% 15% 42% 41% 0%
Total variance explained by latent factors=65.635%
Note: Totals of percentages may not add up to 100 because of rounding off of figures.
© Central University of Technology, Free State
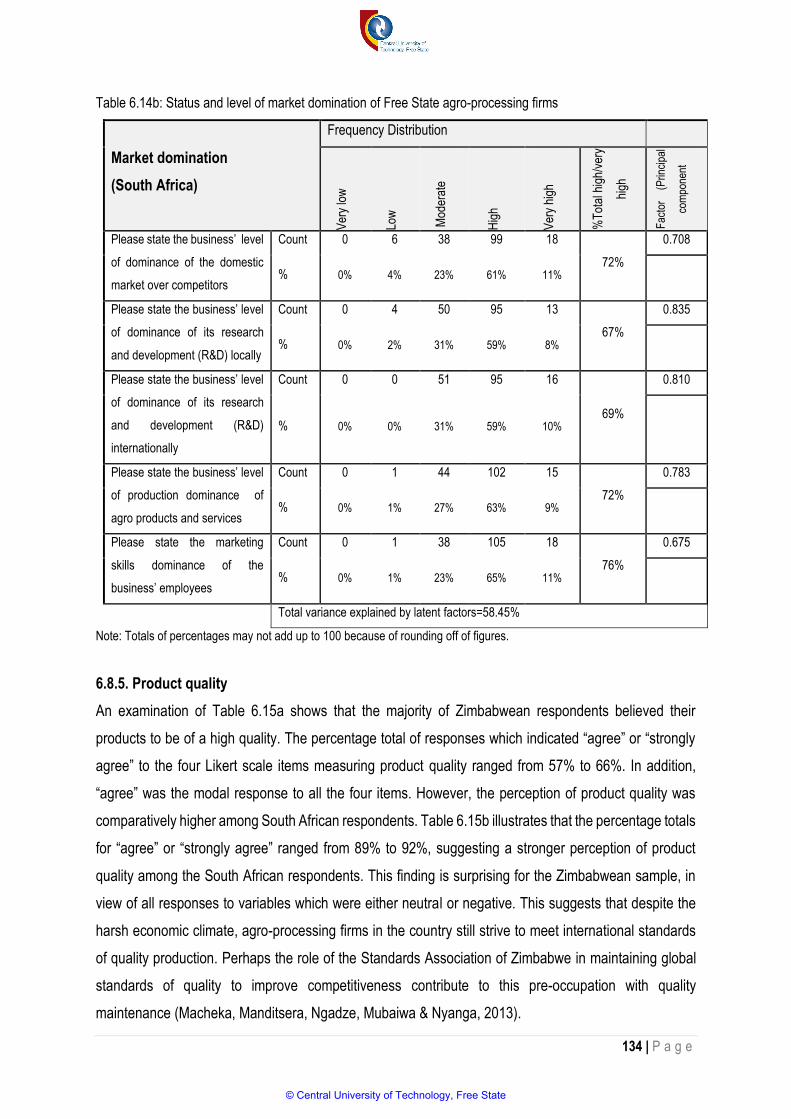
134 | P a g e
Table 6.14b: Status and level of market domination of Free State agro-processing firms
Market domination
(South Africa)
Frequency Distribution
Ver
y lo
w
Low
Mod
erat
e
Hig
h
Ver
y hi
gh
%T
otal
hig
h/ve
ry
high
Fac
tor
(P
rinci
pal
com
pone
nt
Please state the business’ level
of dominance of the domestic
market over competitors
Count 0 6 38 99 18
72%
0.708
% 0% 4% 23% 61% 11%
Please state the business’ level
of dominance of its research
and development (R&D) locally
Count 0 4 50 95 13
67%
0.835
% 0% 2% 31% 59% 8%
Please state the business’ level
of dominance of its research
and development (R&D)
internationally
Count 0 0 51 95 16
69%
0.810
% 0% 0% 31% 59% 10%
Please state the business’ level
of production dominance of
agro products and services
Count 0 1 44 102 15
72%
0.783
% 0% 1% 27% 63% 9%
Please state the marketing
skills dominance of the
business’ employees
Count 0 1 38 105 18
76%
0.675
% 0% 1% 23% 65% 11%
Total variance explained by latent factors=58.45%
Note: Totals of percentages may not add up to 100 because of rounding off of figures.
6.8.5. Product quality
An examination of Table 6.15a shows that the majority of Zimbabwean respondents believed their
products to be of a high quality. The percentage total of responses which indicated “agree” or “strongly
agree” to the four Likert scale items measuring product quality ranged from 57% to 66%. In addition,
“agree” was the modal response to all the four items. However, the perception of product quality was
comparatively higher among South African respondents. Table 6.15b illustrates that the percentage totals
for “agree” or “strongly agree” ranged from 89% to 92%, suggesting a stronger perception of product
quality among the South African respondents. This finding is surprising for the Zimbabwean sample, in
view of all responses to variables which were either neutral or negative. This suggests that despite the
harsh economic climate, agro-processing firms in the country still strive to meet international standards
of quality production. Perhaps the role of the Standards Association of Zimbabwe in maintaining global
standards of quality to improve competitiveness contribute to this pre-occupation with quality
maintenance (Macheka, Manditsera, Ngadze, Mubaiwa & Nyanga, 2013).
© Central University of Technology, Free State

135 | P a g e
Table 6.15a: Level of quality of Mashonaland Central agro-processing firms’ products/services
Product quality
(Zimbabwe)
Frequency Distribution
Str
ongl
y
Dis
agre
e
Dis
agre
e
Don
’t kn
ow
Agr
ee
Str
ongl
y A
gree
% A
gree
/
Str
ongl
y A
gree
Fac
tor
(P
rinci
pal
com
pone
nt
The business develops /
produces high quality agro
product/services
Count 0 0 36 69 1
66%
0.662
% 0% 0% 34% 65% 1%
The business has ISO
certification of products to meet
local quality
Count 0 8 28 69 1
66%
0.878
% 0% 8% 26% 65% 1%
The business’ products or
services meet the international
quality standards set by global
institutions
Count 0 11 30 65 0
61%
0.803
% 0% 10% 28% 61% 0%
The business is involved in
continuous agro product
development and improvement
Count 1 4 41 60 0
57%
0.568
% 1% 4% 39% 57% 0%
Total variance explained by latent factors=54.428%
Note: Totals of percentages may not add up to 100 because of rounding off of figures.
The comparatively lower agreement for the Zimbabwean sample suggests that even though these firms
strive to attain high quality production standards, perhaps the lack of resources, lack of government
technical and financial support and international drift of highly experienced agricultural personnel
(especially to South Africa, New Zealand, Canada and Australia) could be contributing to the lowering of
standards (Edgar & Lucas, 2016) compared to those of international players. This can be contrasted to
the South African experience where resources are comparatively higher, government technical and
financial support is mostly guaranteed for established agro-processing firms (Masutha & Rogerson,
2014).
© Central University of Technology, Free State

136 | P a g e
Table 6.15b: Level of quality of Free State agro-processing firms’ products/services
Product quality
(South Africa)
Frequency Distribution
Str
ongl
y
Dis
agre
e
Dis
agre
e
Indi
ffere
nt
Agr
ee
Str
ongl
y A
gree
% A
gree
/
Str
ongl
y A
gree
Fac
tor
(P
rinci
pal
com
pone
nt
The business develops /
produces high quality agro
product/services
Count 0 0 28 116 18
89%
0.712
% 0% 0% 17% 72% 17%
The business has ISO
certification of products to meet
local quality
Count 0 1 15 124 22
91%
0772
% 0% 1% 9% 77% 14%
The business’ products or
services meet the international
quality standards set by global
institutions
Count 1 0 8 138 15
94%
0.766
% 1% 0% 5% 85% 9%
The business is involved in
continuous agro product
development and improvement
Count 1 0 12 124 25
92%
0.731
% 1% 0% 7% 77% 15%
Total variance explained by latent factor= 55.59%
Note: Totals of percentages may not add up to 100 because of rounding off of figures.
The level of agro-business product quality for South Africa agri-businesses has been ranked higher and
this can be attributed to the level of investment in research and development, agro-processing firms’
partnership with international institutions with higher innovation capabilities, higher levels of technology
transfer by the government and tertiary institutions, which contribute to the production of high quality
products. Kang, Khan and Ma (2009) argues that increasing the quality and quantity of agricultural yields
depends on the fertility of the area cultivated, the use of better seeds and investment in new technologies,
which reduce the risk of food insecurity in agro-business areas, and improves the competitiveness of
agriculture commodities.
6.8.6. Promotion
Tables 6.16a and 6.16b present the results of the percentage analysis of data relating to the respondents’
perception of the effectiveness of promotion activities among agro-business owners in Zimbabwe and
South Africa. A closer examination of the results shows that “agree” was the modal response to the
measurement scales related to effectiveness of promotional activities for both samples. However, the
© Central University of Technology, Free State
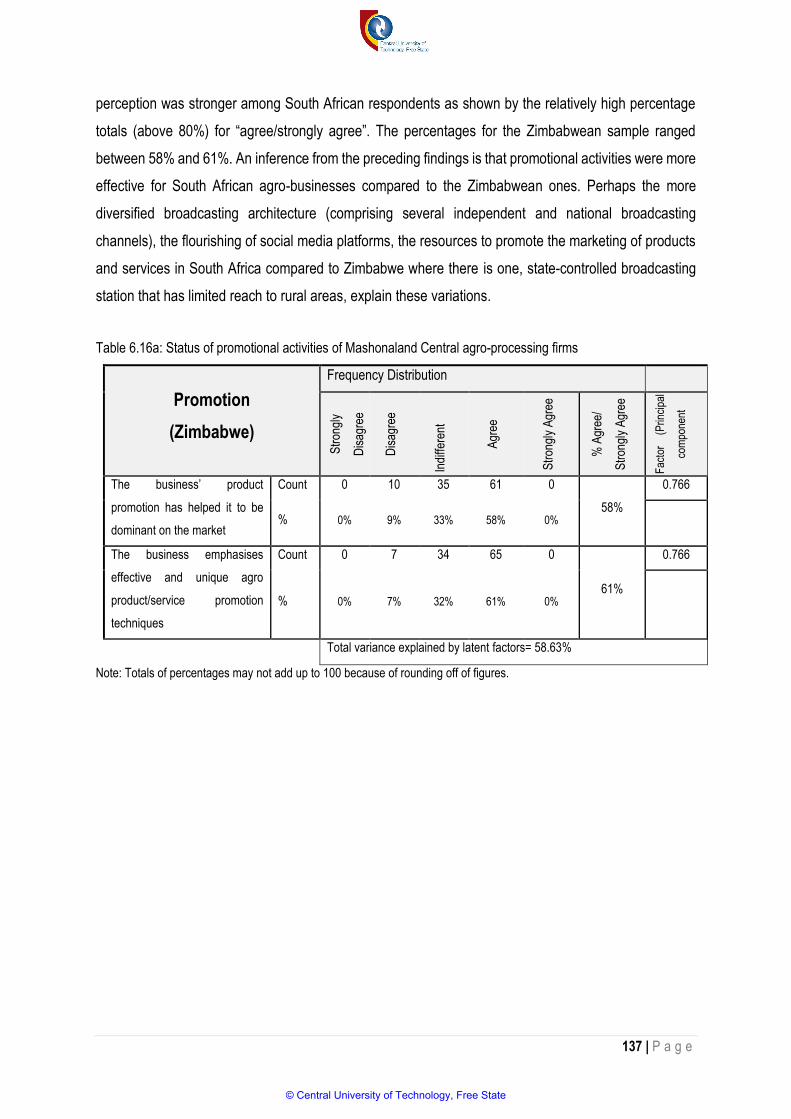
137 | P a g e
perception was stronger among South African respondents as shown by the relatively high percentage
totals (above 80%) for “agree/strongly agree”. The percentages for the Zimbabwean sample ranged
between 58% and 61%. An inference from the preceding findings is that promotional activities were more
effective for South African agro-businesses compared to the Zimbabwean ones. Perhaps the more
diversified broadcasting architecture (comprising several independent and national broadcasting
channels), the flourishing of social media platforms, the resources to promote the marketing of products
and services in South Africa compared to Zimbabwe where there is one, state-controlled broadcasting
station that has limited reach to rural areas, explain these variations.
Table 6.16a: Status of promotional activities of Mashonaland Central agro-processing firms
Promotion
(Zimbabwe)
Frequency Distribution
Str
ongl
y
Dis
agre
e
Dis
agre
e
Indi
ffere
nt
Agr
ee
Str
ongl
y A
gree
% A
gree
/
Str
ongl
y A
gree
Fac
tor
(P
rinci
pal
com
pone
nt
The business’ product
promotion has helped it to be
dominant on the market
Count 0 10 35 61 0
58%
0.766
% 0% 9% 33% 58% 0%
The business emphasises
effective and unique agro
product/service promotion
techniques
Count 0 7 34 65 0
61%
0.766
% 0% 7% 32% 61% 0%
Total variance explained by latent factors= 58.63%
Note: Totals of percentages may not add up to 100 because of rounding off of figures.
© Central University of Technology, Free State
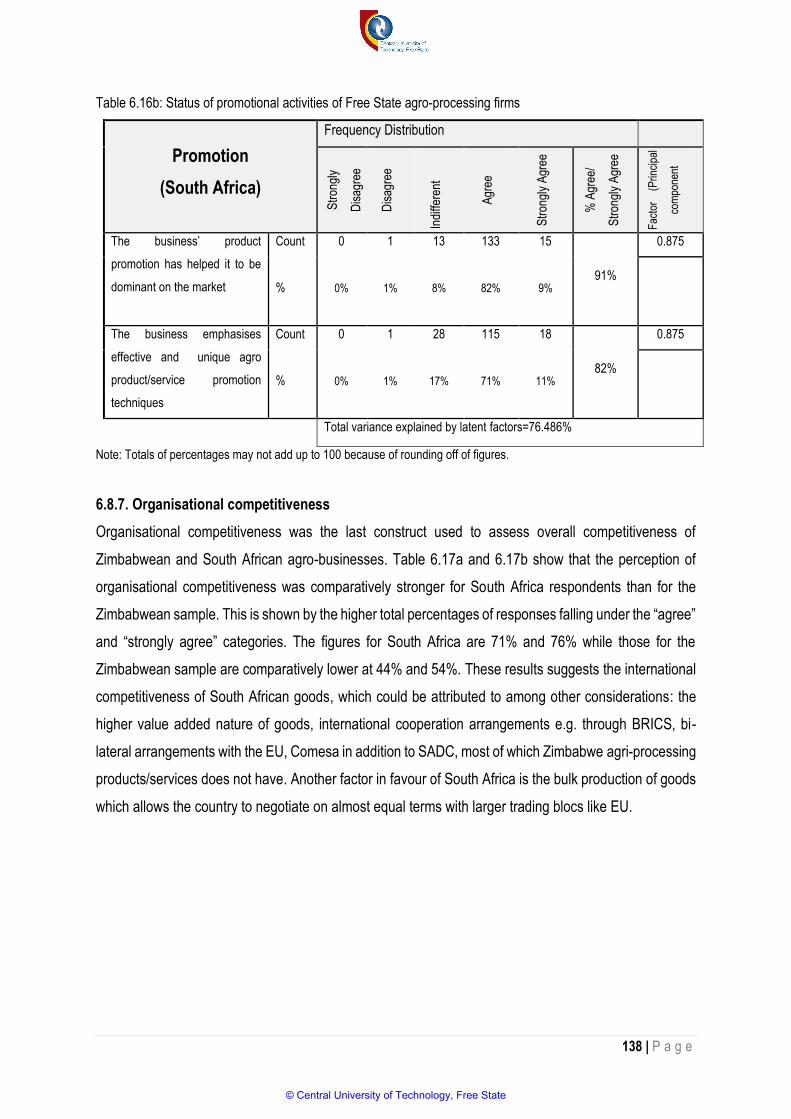
138 | P a g e
Table 6.16b: Status of promotional activities of Free State agro-processing firms
Promotion
(South Africa)
Frequency Distribution
Str
ongl
y
Dis
agre
e
Dis
agre
e
Indi
ffere
nt
Agr
ee
Str
ongl
y A
gree
% A
gree
/
Str
ongl
y A
gree
Fac
tor
(P
rinci
pal
com
pone
nt
The business’ product
promotion has helped it to be
dominant on the market
Count 0 1 13 133 15
91%
0.875
% 0% 1% 8% 82% 9%
The business emphasises
effective and unique agro
product/service promotion
techniques
Count 0 1 28 115 18
82%
0.875
% 0% 1% 17% 71% 11%
Total variance explained by latent factors=76.486%
Note: Totals of percentages may not add up to 100 because of rounding off of figures.
6.8.7. Organisational competitiveness
Organisational competitiveness was the last construct used to assess overall competitiveness of
Zimbabwean and South African agro-businesses. Table 6.17a and 6.17b show that the perception of
organisational competitiveness was comparatively stronger for South Africa respondents than for the
Zimbabwean sample. This is shown by the higher total percentages of responses falling under the “agree”
and “strongly agree” categories. The figures for South Africa are 71% and 76% while those for the
Zimbabwean sample are comparatively lower at 44% and 54%. These results suggests the international
competitiveness of South African goods, which could be attributed to among other considerations: the
higher value added nature of goods, international cooperation arrangements e.g. through BRICS, bi-
lateral arrangements with the EU, Comesa in addition to SADC, most of which Zimbabwe agri-processing
products/services does not have. Another factor in favour of South Africa is the bulk production of goods
which allows the country to negotiate on almost equal terms with larger trading blocs like EU.
© Central University of Technology, Free State
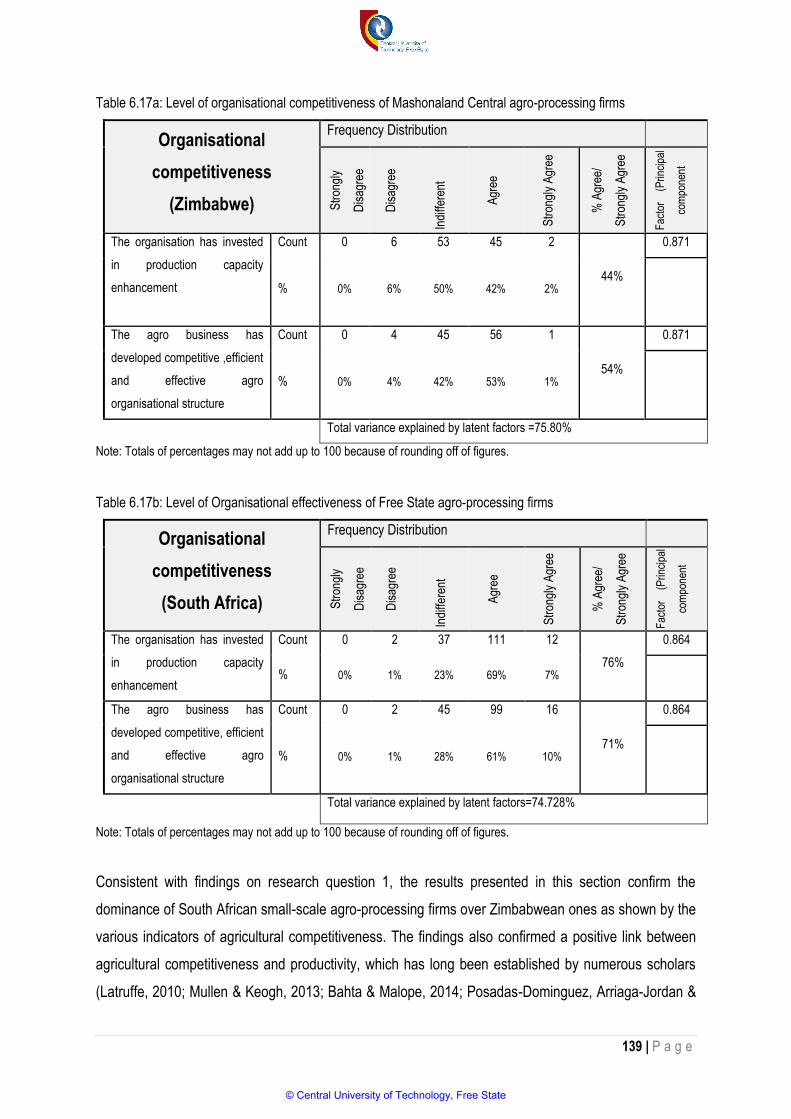
139 | P a g e
Table 6.17a: Level of organisational competitiveness of Mashonaland Central agro-processing firms
Organisational
competitiveness
(Zimbabwe)
Frequency Distribution
Str
ongl
y
Dis
agre
e
Dis
agre
e
Indi
ffere
nt
Agr
ee
Str
ongl
y A
gree
% A
gree
/
Str
ongl
y A
gree
Fac
tor
(P
rinci
pal
com
pone
nt
The organisation has invested
in production capacity
enhancement
Count 0 6 53 45 2
44%
0.871
% 0% 6% 50% 42% 2%
The agro business has
developed competitive ,efficient
and effective agro
organisational structure
Count 0 4 45 56 1
54%
0.871
% 0% 4% 42% 53% 1%
Total variance explained by latent factors =75.80%
Note: Totals of percentages may not add up to 100 because of rounding off of figures.
Table 6.17b: Level of Organisational effectiveness of Free State agro-processing firms
Organisational
competitiveness
(South Africa)
Frequency Distribution
Str
ongl
y
Dis
agre
e
Dis
agre
e
Indi
ffere
nt
Agr
ee
Str
ongl
y A
gree
% A
gree
/
Str
ongl
y A
gree
Fac
tor
(P
rinci
pal
com
pone
nt
The organisation has invested
in production capacity
enhancement
Count 0 2 37 111 12
76%
0.864
% 0% 1% 23% 69% 7%
The agro business has
developed competitive, efficient
and effective agro
organisational structure
Count 0 2 45 99 16
71%
0.864
% 0% 1% 28% 61% 10%
Total variance explained by latent factors=74.728%
Note: Totals of percentages may not add up to 100 because of rounding off of figures.
Consistent with findings on research question 1, the results presented in this section confirm the
dominance of South African small-scale agro-processing firms over Zimbabwean ones as shown by the
various indicators of agricultural competitiveness. The findings also confirmed a positive link between
agricultural competitiveness and productivity, which has long been established by numerous scholars
(Latruffe, 2010; Mullen & Keogh, 2013; Bahta & Malope, 2014; Posadas-Dominguez, Arriaga-Jordan &
© Central University of Technology, Free State
140 | P a g e
Martinez-Castaneda, 2014; Capalbo & Antle, 2015). The findings also lend support to the frequently cited
technological sophistication of South Africa’s agriculture sector which is arguably among the most
innovative and capital-intensive on the African continent (Francis, Mytalka, Huis, & Röling, 2016; Hart,
Jacobs, Ramoroka, Mhula-Links & Letty, 2016; Senyolo, Long, Blok & Omta, 2017). The present finding
also support Chawarika, Chamboko and Mutambara’s (2017) study, which concluded that certain areas
of crop farming in the Zimbabwean sector were not productive and competitive because of high
operational costs associated with such activities.
6.9. The relationship among technology transfer, financial and non-financial productivity of
agribusinesses in Mashonaland Central Province (Zimbabwe) and Free State Province (South
Africa)
Because the data collected for the current study did not conform to the requirements of parametric
techniques, a Spearman correlation analysis (a non-parametric technique) was conducted among
technology transfer, financial and non-financial productivity. Cohen's standard was used to evaluate the
strength of the relationships, where correlation coefficients between 0.10 and 0.29 represent a small
effect size, coefficients between 0.30 and 0.49 represent a moderate effect size, and coefficients above
0.50 indicate a large effect size (Cohen, 1988). A Spearman correlation requires that the relationship
between each pair of variables does not change direction (Conover & Iman, 1981). This assumption is
violated if the points on the scatterplot between any pair of variables appear to shift from a positive to
negative or negative to positive relationship. This assumption was complied with in this study. Table 6.18
presents the correlation matrix of the relationship among technology transfer, financial and non-financial
productivity.
For the Zimbabwean sample, there was a significant positive correlation between financial productivity
and non-financial productivity (rs = 0.771, p < 0.001). The correlation coefficient between financial
productivity and non-financial productivity was 0.771 indicating a large effect size. This indicates that as
financial productivity increases, non-financial productivity tends to increase. This means that as financial
growth improves for small-scale agro-businesses, there could be excess revenue available for the pursuit
of non-financial activities.
There was also a significant positive correlation between financial productivity and technology transfer
(rs = 0.339, p < 0.001). This indicated a moderate effect size. Thus, as financial productivity increased,
technology transfer also tends to increase. This means that the small firms’ capacity to acquire and
© Central University of Technology, Free State
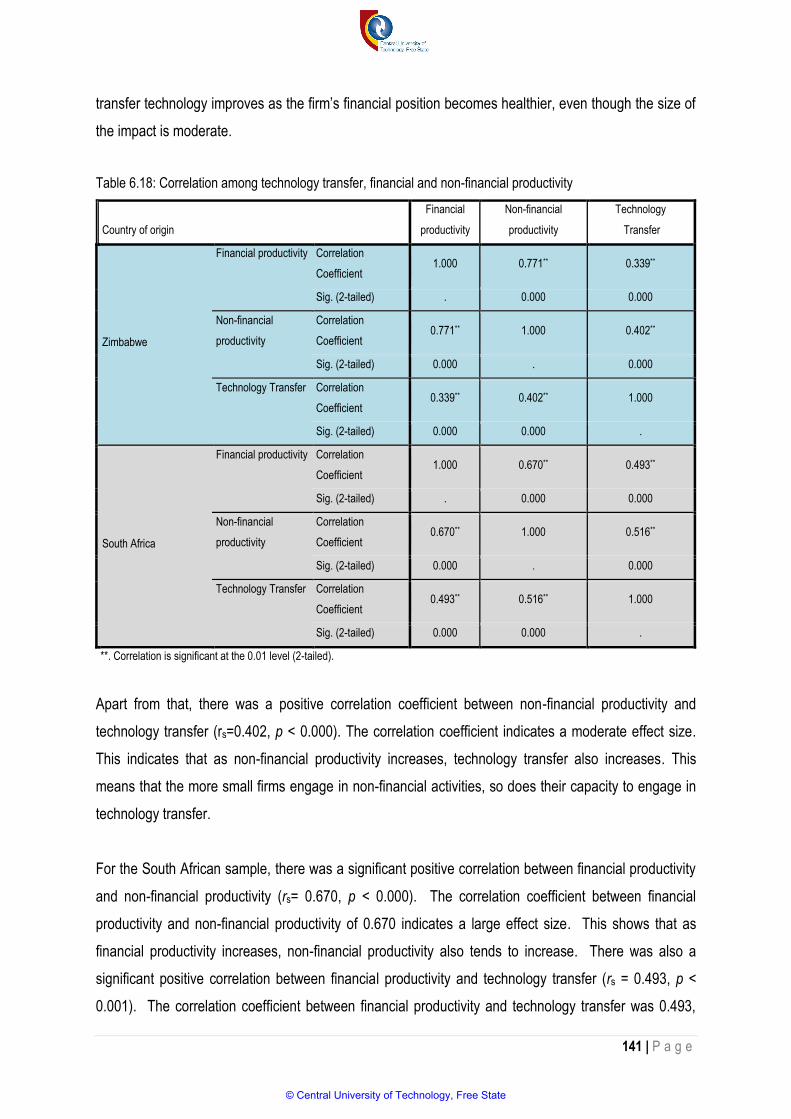
141 | P a g e
transfer technology improves as the firm’s financial position becomes healthier, even though the size of
the impact is moderate.
Table 6.18: Correlation among technology transfer, financial and non-financial productivity
Country of origin
Financial
productivity
Non-financial
productivity
Technology
Transfer
Zimbabwe
Financial productivity Correlation
Coefficient 1.000 0.771** 0.339**
Sig. (2-tailed) . 0.000 0.000
Non-financial
productivity
Correlation
Coefficient 0.771** 1.000 0.402**
Sig. (2-tailed) 0.000 . 0.000
Technology Transfer Correlation
Coefficient 0.339** 0.402** 1.000
Sig. (2-tailed) 0.000 0.000 .
South Africa
Financial productivity Correlation
Coefficient 1.000 0.670** 0.493**
Sig. (2-tailed) . 0.000 0.000
Non-financial
productivity
Correlation
Coefficient 0.670** 1.000 0.516**
Sig. (2-tailed) 0.000 . 0.000
Technology Transfer Correlation
Coefficient 0.493** 0.516** 1.000
Sig. (2-tailed) 0.000 0.000 .
**. Correlation is significant at the 0.01 level (2-tailed).
Apart from that, there was a positive correlation coefficient between non-financial productivity and
technology transfer (rs=0.402, p < 0.000). The correlation coefficient indicates a moderate effect size.
This indicates that as non-financial productivity increases, technology transfer also increases. This
means that the more small firms engage in non-financial activities, so does their capacity to engage in
technology transfer.
For the South African sample, there was a significant positive correlation between financial productivity
and non-financial productivity (rs= 0.670, p < 0.000). The correlation coefficient between financial
productivity and non-financial productivity of 0.670 indicates a large effect size. This shows that as
financial productivity increases, non-financial productivity also tends to increase. There was also a
significant positive correlation between financial productivity and technology transfer (rs = 0.493, p <
0.001). The correlation coefficient between financial productivity and technology transfer was 0.493,
© Central University of Technology, Free State
142 | P a g e
indicating a moderate effect size. This reveals that as financial productivity increases, the capacity of the
agro-processing firms to transfer technology also increases. Separately, there was a positive correlation
coefficient between non-financial productivity and technology transfer (rs=0.516, p < 0.000). The positive
correlation coefficient (0.516) indicates a large effect size. This indicates that as non-financial productivity
increases, technology transfer also increases. The result corresponds with earlier literature (Awang et
al., 2016; Fuglie, 2016; Xu, Li, Qi, Tang & Mukwereza, 2016; Zhan, Tian, Zhang, Yang, Qu, & Tan 2017)
which proposes a strong connection between technology transfer in the agriculture sector, and the status
and level of productivity including non-financial productivity. The striking observation that emerges from
the data comparison was the similar pattern of outcomes from the Zimbabwean and South Africa samples
given the already observed disparities between the two countries in terms of innovation, technology
transfer and agricultural productivity.
6.10. Impact of technology transfer and innovation on the productivity of small scale agro-processing
firms in the two regions
Multiple regression analysis was performed in order to ascertain which factor, between technology
transfer or innovation, had the greatest predictive effect on financial productivity and non-financial-
productivity. Multiple regression analysis is a statistical technique which strives to ascertain if a prognostic
connection exists between a single dependent variable and more than one independent variable
Sreejesh, Mohapatra & Anusree (2014). Among other things, the technique assumes a linear relationship
between the independent(s) and the dependent variables, as well as no multi-collinearity or perfect
correlation between predictor variables.
Prior to conducting the multiple regression analysis, a correlation analysis of the variables involved was
performed to check the nature of the linkage among the variables. As was seen in Table 18, they were
significant and positive correlations among all the variables, thus meeting all the pre-conditions for
regression analysis. Also, multi-collinearity between the predictors was assessed using variance inflation
factors (VIF). High VIFs i.e. above 10 are unacceptable since they indicate increased effects of multi-
collinearity in the model. All the predictors in the proposed regression model had variance inflation factors
(VIF) which are less than 2, implying a lack of multicollinearity and satisfying the conditions for multiple
regression analysis.
To understand the impacts of technology and innovation on productivity, multiple regression analysis was
performed in order to ascertain which factor, between technology transfer and innovation, had the
greatest predictive effect on productivity.
© Central University of Technology, Free State
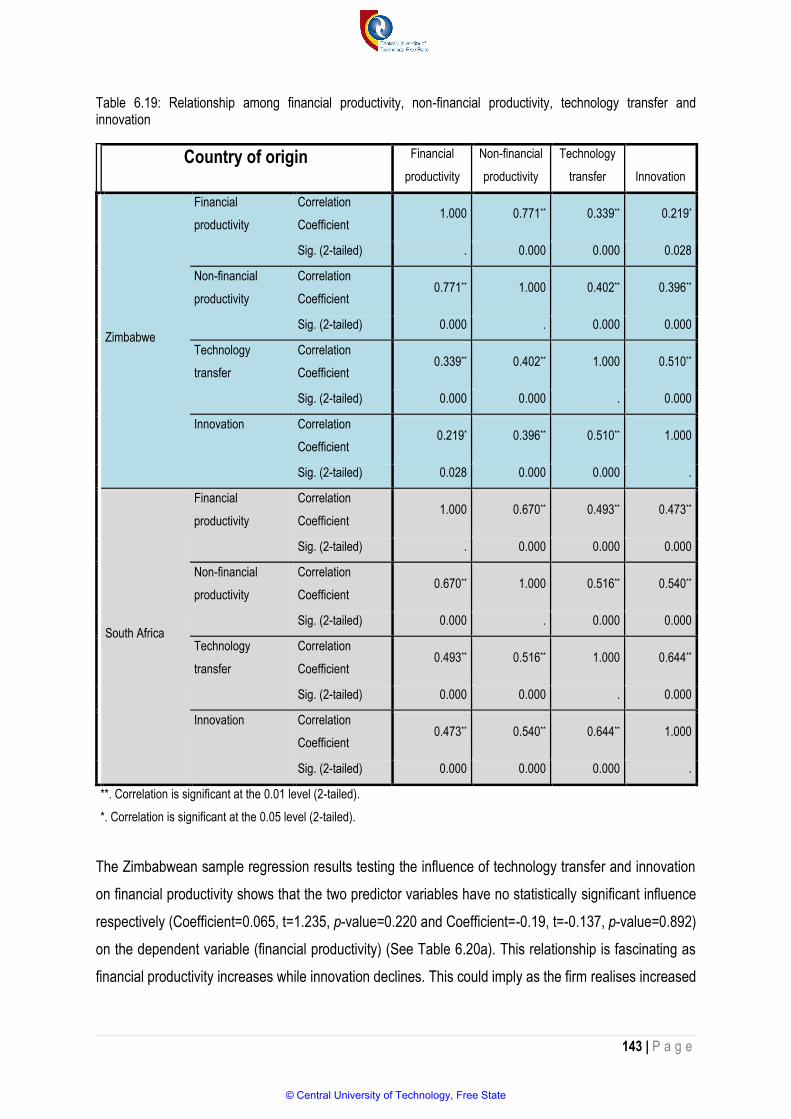
143 | P a g e
Table 6.19: Relationship among financial productivity, non-financial productivity, technology transfer and innovation
The Zimbabwean sample regression results testing the influence of technology transfer and innovation
on financial productivity shows that the two predictor variables have no statistically significant influence
respectively (Coefficient=0.065, t=1.235, p-value=0.220 and Coefficient=-0.19, t=-0.137, p-value=0.892)
on the dependent variable (financial productivity) (See Table 6.20a). This relationship is fascinating as
financial productivity increases while innovation declines. This could imply as the firm realises increased
Country of origin Financial
productivity
Non-financial
productivity
Technology
transfer Innovation
Zimbabwe
Financial
productivity
Correlation
Coefficient 1.000 0.771** 0.339** 0.219*
Sig. (2-tailed) . 0.000 0.000 0.028
Non-financial
productivity
Correlation
Coefficient 0.771** 1.000 0.402** 0.396**
Sig. (2-tailed) 0.000 . 0.000 0.000
Technology
transfer
Correlation
Coefficient 0.339** 0.402** 1.000 0.510**
Sig. (2-tailed) 0.000 0.000 . 0.000
Innovation Correlation
Coefficient 0.219* 0.396** 0.510** 1.000
Sig. (2-tailed) 0.028 0.000 0.000 .
South Africa
Financial
productivity
Correlation
Coefficient 1.000 0.670** 0.493** 0.473**
Sig. (2-tailed) . 0.000 0.000 0.000
Non-financial
productivity
Correlation
Coefficient 0.670** 1.000 0.516** 0.540**
Sig. (2-tailed) 0.000 . 0.000 0.000
Technology
transfer
Correlation
Coefficient 0.493** 0.516** 1.000 0.644**
Sig. (2-tailed) 0.000 0.000 . 0.000
Innovation Correlation
Coefficient 0.473** 0.540** 0.644** 1.000
Sig. (2-tailed) 0.000 0.000 0.000 .
**. Correlation is significant at the 0.01 level (2-tailed).
*. Correlation is significant at the 0.05 level (2-tailed).
© Central University of Technology, Free State
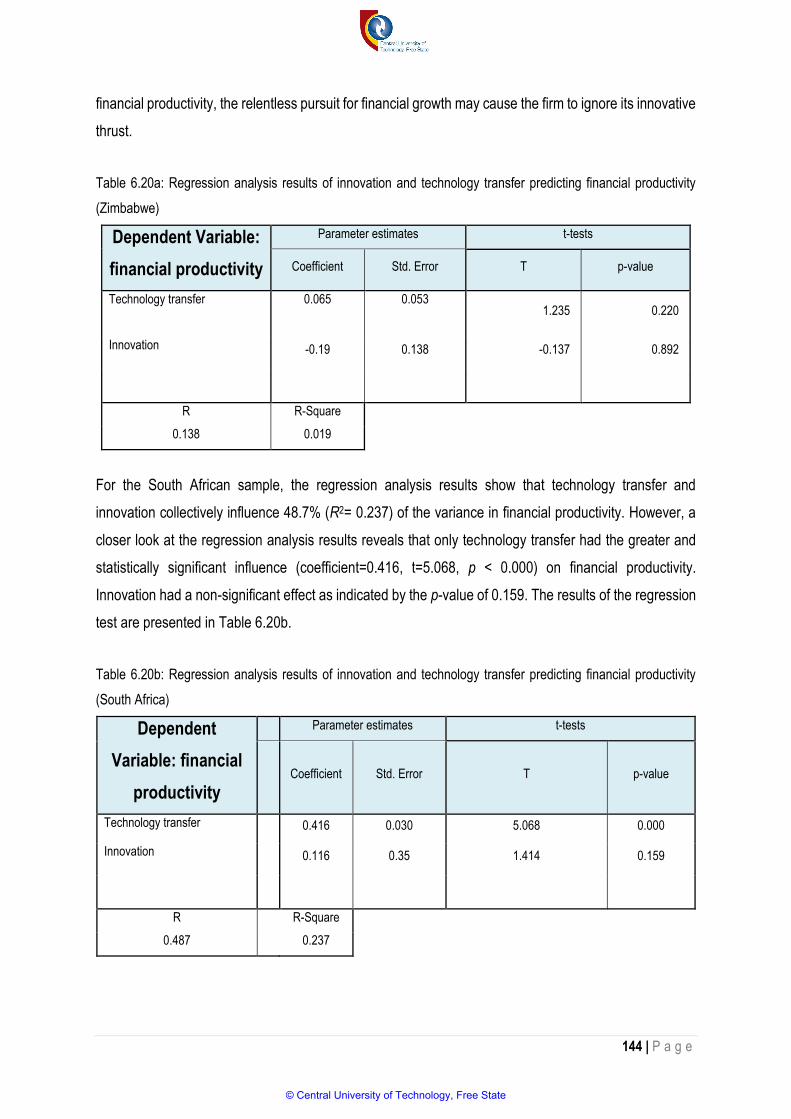
144 | P a g e
financial productivity, the relentless pursuit for financial growth may cause the firm to ignore its innovative
thrust.
Table 6.20a: Regression analysis results of innovation and technology transfer predicting financial productivity
(Zimbabwe)
Dependent Variable:
financial productivity
Parameter estimates t-tests
Coefficient Std. Error T p-value
Technology transfer 0.065
0.053
1.235 0.220
Innovation -0.19 0.138 -0.137 0.892
R R-Square
0.138 0.019
For the South African sample, the regression analysis results show that technology transfer and
innovation collectively influence 48.7% (R2= 0.237) of the variance in financial productivity. However, a
closer look at the regression analysis results reveals that only technology transfer had the greater and
statistically significant influence (coefficient=0.416, t=5.068, p < 0.000) on financial productivity.
Innovation had a non-significant effect as indicated by the p-value of 0.159. The results of the regression
test are presented in Table 6.20b.
Table 6.20b: Regression analysis results of innovation and technology transfer predicting financial productivity
(South Africa)
Dependent
Variable: financial
productivity
Parameter estimates t-tests
Coefficient Std. Error T p-value
Technology transfer 0.416 0.030 5.068 0.000
Innovation 0.116 0.35 1.414 0.159
R R-Square
0.487 0.237
© Central University of Technology, Free State
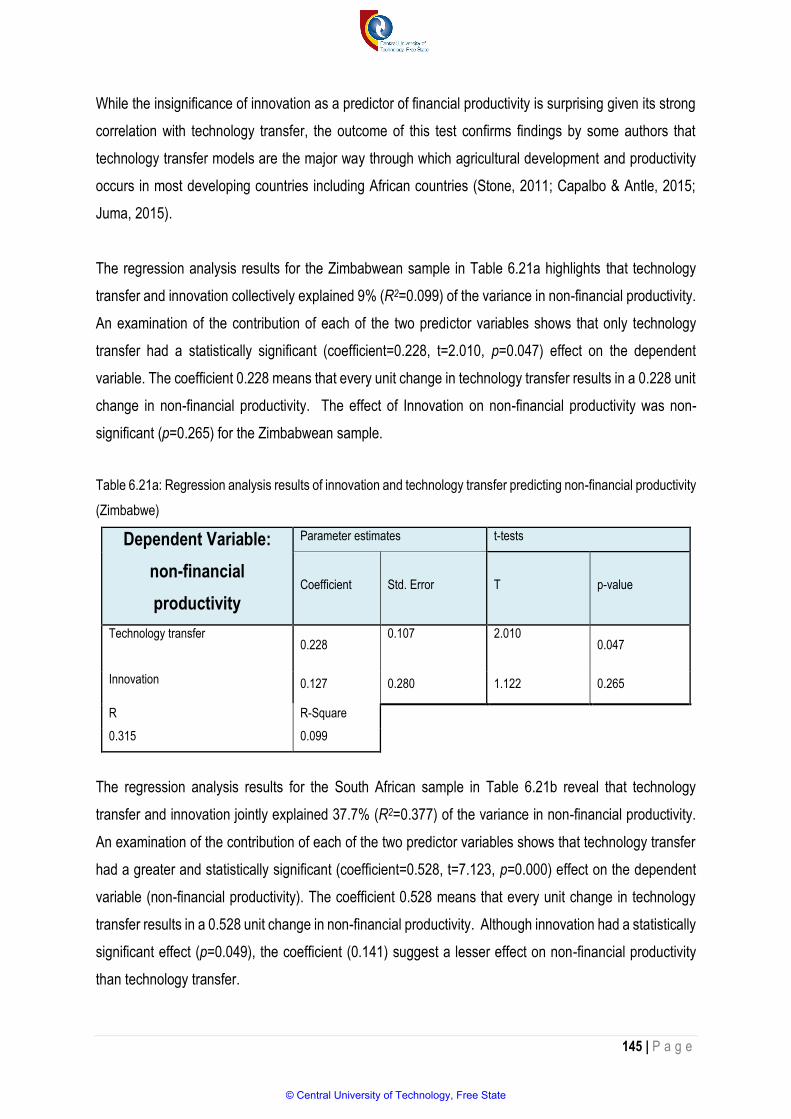
145 | P a g e
While the insignificance of innovation as a predictor of financial productivity is surprising given its strong
correlation with technology transfer, the outcome of this test confirms findings by some authors that
technology transfer models are the major way through which agricultural development and productivity
occurs in most developing countries including African countries (Stone, 2011; Capalbo & Antle, 2015;
Juma, 2015).
The regression analysis results for the Zimbabwean sample in Table 6.21a highlights that technology
transfer and innovation collectively explained 9% (R2=0.099) of the variance in non-financial productivity.
An examination of the contribution of each of the two predictor variables shows that only technology
transfer had a statistically significant (coefficient=0.228, t=2.010, p=0.047) effect on the dependent
variable. The coefficient 0.228 means that every unit change in technology transfer results in a 0.228 unit
change in non-financial productivity. The effect of Innovation on non-financial productivity was non-
significant (p=0.265) for the Zimbabwean sample.
Table 6.21a: Regression analysis results of innovation and technology transfer predicting non-financial productivity
(Zimbabwe)
Dependent Variable:
non-financial
productivity
Parameter estimates t-tests
Coefficient Std. Error T p-value
Technology transfer 0.228
0.107
2.010
0.047
Innovation 0.127 0.280 1.122 0.265
R R-Square
0.315 0.099
The regression analysis results for the South African sample in Table 6.21b reveal that technology
transfer and innovation jointly explained 37.7% (R2=0.377) of the variance in non-financial productivity.
An examination of the contribution of each of the two predictor variables shows that technology transfer
had a greater and statistically significant (coefficient=0.528, t=7.123, p=0.000) effect on the dependent
variable (non-financial productivity). The coefficient 0.528 means that every unit change in technology
transfer results in a 0.528 unit change in non-financial productivity. Although innovation had a statistically
significant effect (p=0.049), the coefficient (0.141) suggest a lesser effect on non-financial productivity
than technology transfer.
© Central University of Technology, Free State
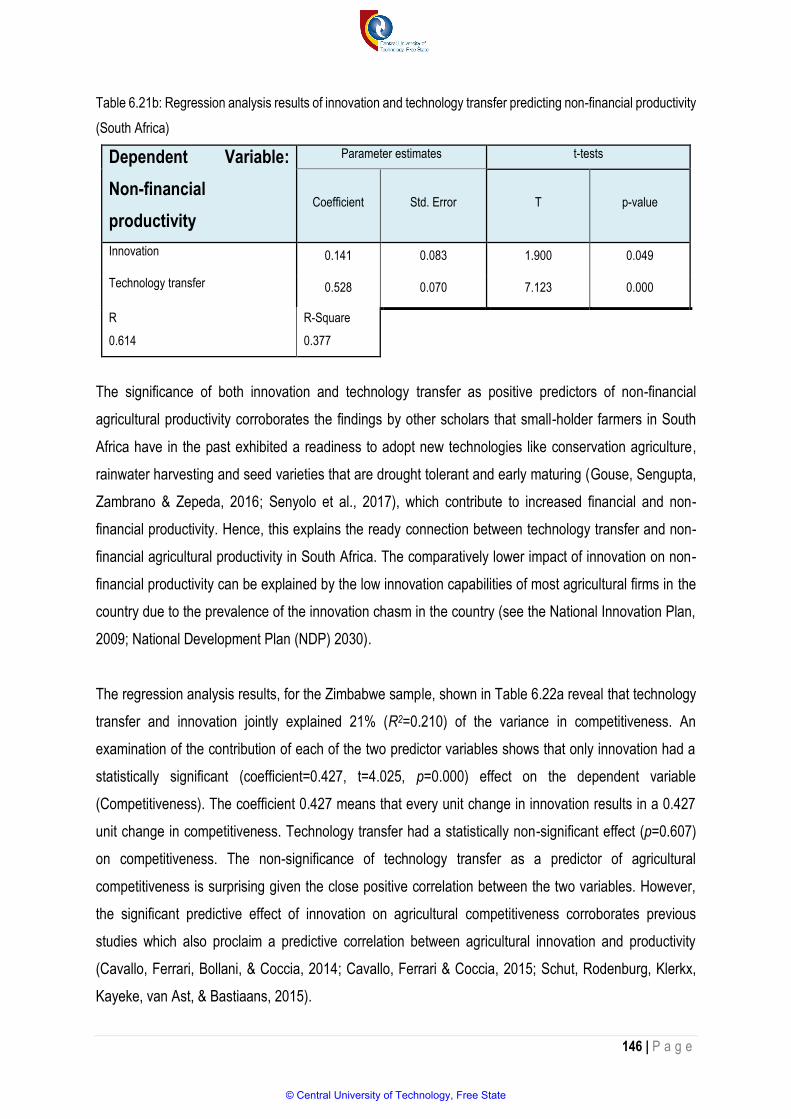
146 | P a g e
Table 6.21b: Regression analysis results of innovation and technology transfer predicting non-financial productivity
(South Africa)
Dependent Variable:
Non-financial
productivity
Parameter estimates t-tests
Coefficient Std. Error T p-value
Innovation 0.141 0.083 1.900 0.049
Technology transfer 0.528 0.070 7.123 0.000
R R-Square
0.614 0.377
The significance of both innovation and technology transfer as positive predictors of non-financial
agricultural productivity corroborates the findings by other scholars that small-holder farmers in South
Africa have in the past exhibited a readiness to adopt new technologies like conservation agriculture,
rainwater harvesting and seed varieties that are drought tolerant and early maturing (Gouse, Sengupta,
Zambrano & Zepeda, 2016; Senyolo et al., 2017), which contribute to increased financial and non-
financial productivity. Hence, this explains the ready connection between technology transfer and non-
financial agricultural productivity in South Africa. The comparatively lower impact of innovation on non-
financial productivity can be explained by the low innovation capabilities of most agricultural firms in the
country due to the prevalence of the innovation chasm in the country (see the National Innovation Plan,
2009; National Development Plan (NDP) 2030).
The regression analysis results, for the Zimbabwe sample, shown in Table 6.22a reveal that technology
transfer and innovation jointly explained 21% (R2=0.210) of the variance in competitiveness. An
examination of the contribution of each of the two predictor variables shows that only innovation had a
statistically significant (coefficient=0.427, t=4.025, p=0.000) effect on the dependent variable
(Competitiveness). The coefficient 0.427 means that every unit change in innovation results in a 0.427
unit change in competitiveness. Technology transfer had a statistically non-significant effect (p=0.607)
on competitiveness. The non-significance of technology transfer as a predictor of agricultural
competitiveness is surprising given the close positive correlation between the two variables. However,
the significant predictive effect of innovation on agricultural competitiveness corroborates previous
studies which also proclaim a predictive correlation between agricultural innovation and productivity
(Cavallo, Ferrari, Bollani, & Coccia, 2014; Cavallo, Ferrari & Coccia, 2015; Schut, Rodenburg, Klerkx,
Kayeke, van Ast, & Bastiaans, 2015).
© Central University of Technology, Free State
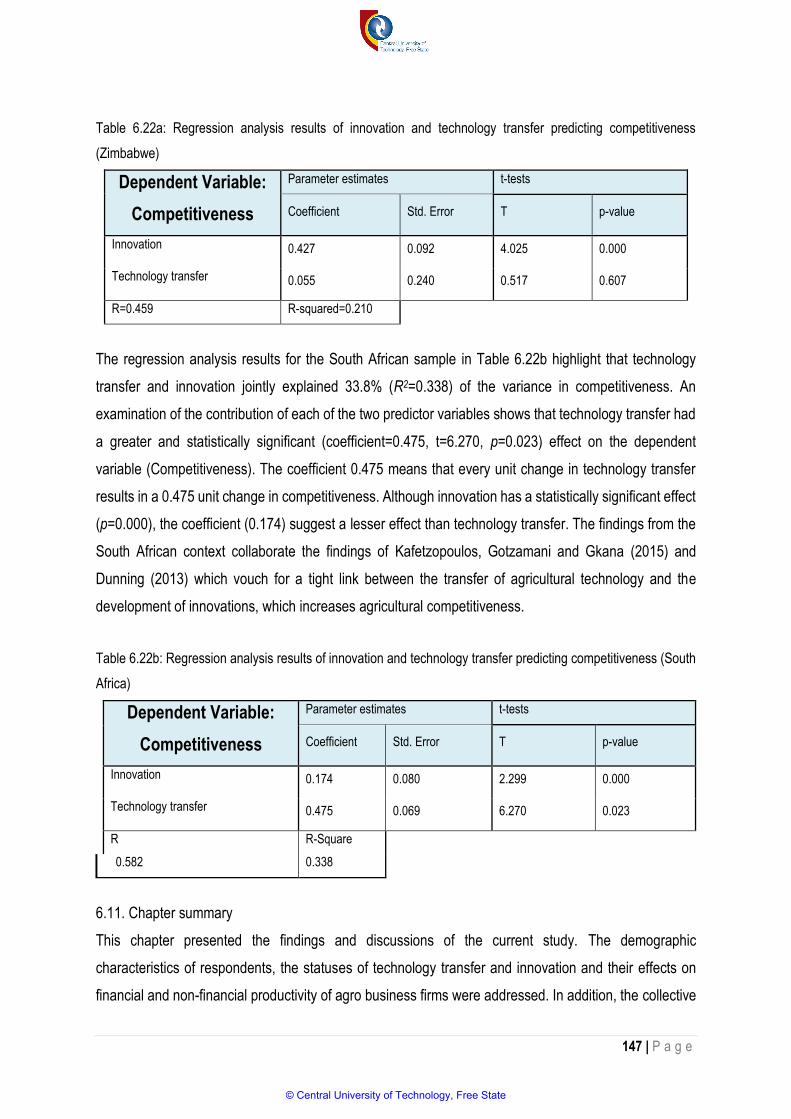
147 | P a g e
Table 6.22a: Regression analysis results of innovation and technology transfer predicting competitiveness
(Zimbabwe)
Dependent Variable:
Competitiveness
Parameter estimates t-tests
Coefficient Std. Error T p-value
Innovation 0.427 0.092 4.025 0.000
Technology transfer 0.055 0.240 0.517 0.607
R=0.459 R-squared=0.210
The regression analysis results for the South African sample in Table 6.22b highlight that technology
transfer and innovation jointly explained 33.8% (R2=0.338) of the variance in competitiveness. An
examination of the contribution of each of the two predictor variables shows that technology transfer had
a greater and statistically significant (coefficient=0.475, t=6.270, p=0.023) effect on the dependent
variable (Competitiveness). The coefficient 0.475 means that every unit change in technology transfer
results in a 0.475 unit change in competitiveness. Although innovation has a statistically significant effect
(p=0.000), the coefficient (0.174) suggest a lesser effect than technology transfer. The findings from the
South African context collaborate the findings of Kafetzopoulos, Gotzamani and Gkana (2015) and
Dunning (2013) which vouch for a tight link between the transfer of agricultural technology and the
development of innovations, which increases agricultural competitiveness.
Table 6.22b: Regression analysis results of innovation and technology transfer predicting competitiveness (South
Africa)
Dependent Variable:
Competitiveness
Parameter estimates t-tests
Coefficient Std. Error T p-value
Innovation 0.174 0.080 2.299 0.000
Technology transfer 0.475 0.069 6.270 0.023
R R-Square
0.582 0.338
6.11. Chapter summary
This chapter presented the findings and discussions of the current study. The demographic
characteristics of respondents, the statuses of technology transfer and innovation and their effects on
financial and non-financial productivity of agro business firms were addressed. In addition, the collective
© Central University of Technology, Free State

148 | P a g e
impact of technology transfer and innovation on the agricultural productivity and competitiveness of agro
business firms in Zimbabwe and South Africa was evaluated. The next chapter presents conclusions and
recommendations based on these findings.
© Central University of Technology, Free State

149 | P a g e
CHAPTER 7: CONCLUSION AND RECOMMENDATIONS
7.1. INTRODUCTION
7.2. CONCLUSION
7.2.1. Research question 1
7.2.2. Research question 2
7.2.3. Research question 3
7.2.4. Research question 4
7.2.5 Research question 5
7.3. RECOMMENDATIONS FOR POLICY
7.4. IMPLICATIONS FOR FUTURE STUDIES
7.4.1. Creation of agro-business technology transfer
7.4.2. Need to amend land ownership policies
7.4.3 Need for the government to review agric
policy
7.4.4. Promote technology transfer and innovation
7.4.5. Encourage all stakeholder involvement in
agricultural technology
7.4.6. Financial support for small scale agro processing
businesses
7.5. LIMITATIONS
7.6. CONTRIBUTION OF THE STUDY
7.7. CHAPTER SUMMARY
© Central University of Technology, Free State

150 | P a g e
7.1. Introduction
The previous chapter presented findings and discussion of this empirical study, including the various
relationships among technology transfer, financial and non-financial productivity, as well as the
relationship among financial productivity, non-financial productivity, technology transfer and innovation.
Adhering to such a procedure accorded the researcher the opportunity to critique the findings, linking
them to extant literature. This created a strong and context-relevant background for a theoretical
contribution towards the existing body of knowledge on the subject. This chapter presents the conclusion
and recommendations of the study founded on responses to the research objectives and questions. The
research questions presented in Chapter 1 were tested in order to draw conclusions and make
recommendations.
7.2. Conclusion
The results from the Mashonaland Central province (Zimbabwe) and Free State province (South Africa)
samples are linked to the research questions and respective conclusions made.
7.2.1. Research question 1
What is the status and level of productivity of agro-processing firms operating in Mashonaland Central
Province (Zimbabwe) and Free State Province (South Africa) regions?
Percentage analyses were performed to address this research question. This procedure was carried out
on data relating to the following indicators of the status and level of agricultural productivity: financial
productivity, non-financial productivity, output productivity, output per hectare, capacity utilisation per
hectare, market productivity (growth) and market productivity (reputation).
The average percentage scores for the Zimbabwean and South African respondents who perceived the
financial productivity of their respective firms to have increased were 25.9% and 90.4% respectively.
These percentage scores demonstrate that fewer respondents from the Zimbabwean sample perceived
higher financial productivity in their firms compared to those from the South African sample. Thus, it can
be concluded from these results that South African small-scale agro-processing firms experienced higher
financial productivity than the Zimbabwean ones.
Furthermore, the average percentage scores for the Zimbabwean and South African respondents who
perceived the non-financial productivity of their respective firms to have increased were 29% and 86%
respectively. These percentage scores demonstrate that fewer respondents from the Zimbabwean
sample reported growth in non-financial productivity in their respective firms compared to those from the
© Central University of Technology, Free State
151 | P a g e
South African sample. Thus, it can be concluded from these results that South African small-scale agro-
processing firms experienced higher non-financial productivity than the Zimbabwean ones.
Apart from that, the average percentage scores for the Zimbabwean and South African respondents who
perceived the output productivity of their respective firms to have increased were 24% and 70%
respectively. These percentage scores demonstrate that fewer respondents from the Zimbabwean
sample perceived increased output productivity in their respective firms compared to those from the South
African sample. Thus, it can be concluded that South African small-scale agro-processing firms yielded
higher output productivity than the Zimbabwean ones.
In addition, the average percentage scores for the Zimbabwean and South African respondents who
perceived the output per hectare of their respective firms to have increased were 29.6% and 57.8%
respectively. These percentage scores demonstrate that fewer respondents from the Zimbabwean
sample perceived growth in output per hectare in their respective firms compared to those from the South
African sample. Thus, it can be concluded that South African small-scale agro-processing firms yielded
higher output per hectare than the Zimbabwean ones.
Also, the average percentage scores for the Zimbabwean and South African respondents who perceived
the capacity utilisation of their respective firms to have increased were 27% and 57% respectively. These
percentage scores demonstrate that fewer respondents from the Zimbabwean sample reported some
improvements in capacity utilisation of their respective firms compared to those from the South African
sample. Thus, it can be concluded that South African small-scale agro-processing firms experienced
higher capacity utilisation than the Zimbabwean ones.
The average percentage scores for the Zimbabwean and South African respondents who perceived the
market productivity (growth) of their respective firms to have increased were 20% and 83% respectively.
These percentage scores demonstrate that fewer respondents from the Zimbabwean sample reported
increased market productivity (growth) in their respective firms compared to those from the South African
sample. Thus, it can be concluded that South African small-scale agro-processing firms experienced
higher market productivity (growth) than the Zimbabwean ones.
Lastly, the average percentage scores for the Zimbabwean and South African respondents who
perceived the market productivity (reputation) of their respective firms to have increased were 20% and
83% respectively. These percentage scores demonstrate that fewer respondents from the Zimbabwean
© Central University of Technology, Free State
152 | P a g e
sample reported increased market productivity (reputation) in their respective firms compared to those
from the South African sample. Thus, it can be concluded from these results that South African small-
scale agro-processing firms experienced higher market productivity (reputation) than the Zimbabwean
ones.
Based on the preceding, it can be concluded that the overall status and level of productivity of South
African small-scale agro-processing firms was comparatively higher than those of Zimbabwean ones.
7.2.2. Research question 2
What is the level of competitiveness and quality of products of agro-processing firms in Mashonaland
Central province (Zimbabwe) and Free State province (South Africa)?
To answer this research question, percentage analyses were carried out on the gathered data relating to
the following indicators of the level of competitiveness and quality of products of agro-processing firms:
general market competitiveness, customer satisfaction, market price competitiveness, market
domination, product quality, product promotion and organisational capabilities.
Firstly, the average percentage scores for the Zimbabwean and South African respondents who
expressed agreement to the questionnaire items relating to the general market competitiveness of their
firms were 29.8% and 75% respectively. These percentage scores revealed that fewer respondents in
the Zimbabwean sample reported the general market competitiveness of their respective firms compared
to those from the South African sample. Hence, it is inferred from these results that South African small-
scale agro-processing firms had higher general market competitiveness than their Zimbabwean
counterparts.
Secondly, a greater average percentage of South African than Zimbabwean respondents expressed the
sentiment that customers were satisfied with the level of customer service that they received from small
agro-processing firms. On average, 90.2% of the South African compared to 37.8% Zimbabwean
respondents believed that their customers were satisfied with the service received from small scale agro-
processing firms. Therefore, the conclusion is that South African small scale agro-processing firms
offered a perceived better level of customer satisfaction than Zimbabwean firms.
Thirdly, the average percentage scores for the Zimbabwean and South African respondents who
expressed agreement to the questionnaire items relating to the market price competitiveness of their
© Central University of Technology, Free State
153 | P a g e
respective organisations were 24.5% and 85% respectively. These percentage scores show that fewer
respondents in the Zimbabwean sample reported market price competitiveness of their agro-processing
products or services compared to those from the South African sample. Therefore, it is observed from
these outcomes that agro-processing products and services of South African small-scale agro-processing
firms had comparatively superior market price competitiveness than those of Zimbabwean firms.
Fourthly, more South African respondents reported their organisations to be dominant in the market
compared to Zimbabwean respondents. On average, 71.2% of the South Africans owner/managers
believed their firms were dominant in the market, compared to 23% of Zimbabwean respondents who
reported the same. Therefore, the conclusion is that South African small-scale, agro-processing firms
were dominant in their respective markets compared to Zimbabwean firms.
Fifth, the analysis of the data on the respondents’ perceptions of product quality revealed marked
variations between the South African and Zimbabwean samples. An average of 62% of Zimbabwe
respondents believed that the overall quality of products offered by their respective firms to be high. This
can be contrasted with 91.5% of the South African respondents who believed the same. As a result, it is
concluded that the quality of agricultural products produced by South African small-scale agro-processing
firms were perceivably of higher quality compared to those produced by Zimbabwean firms of comparable
size.
Sixth, the average percentage scores for the Zimbabwean and South African respondents who regarded
the promotional activities of their respective firms as effective were 59.5% and 86.5% respectively. These
percentage scores demonstrate that fewer respondents from the Zimbabwean sample perceived their
firms’ promotional activity to be effective when compared to those from the South African sample. Thus,
it can be concluded that South African small-scale agro-processing firms conducted more effective
promotional activities than Zimbabwean firms.
Lastly, a greater percentage of South African respondents believed their respective firms to be
organisationally competitive, compared to the percentage scores for the Zimbabwean respondents. On
average, 73.5% of the South African respondents indicated that their respective firms were
organisationally competitive. The aforementioned scores can be compared to 49% score for Zimbabwean
respondents. Therefore, the conclusion is that South African small-scale agro-processing firms were
more organisationally competitive than Zimbabwean firms.
© Central University of Technology, Free State

154 | P a g e
All things considered, it is concluded that the competitiveness of South African small-scale agro-
processing firms was higher than those in Zimbabwe.
7.2.3. Research question 3
What is the relationship among technology transfer, financial and non-financial productivity of
agribusiness Mashonaland Central Province (Zimbabwe) and Free State Province (South Africa)?
The findings from the study reveal that significant positive correlations of varying strengths were observed
among the three variables under study. In the case of Mashonaland Central Province, there was a strong
positive correlation between financial productivity and non-financial productivity (rs=0.771, p < 0.001),
while a moderate positive correlation existed between technology transfer and financial productivity
(rs=0.339, p < 0.001) as well as between technology transfer and non-financial productivity (rs=0.402, p
< 0.001).
In the South African sample, there were also strong significant and positive correlations between financial
productivity and non-financial productivity (rs=0.670, p< 0.000) as well as between technology transfer
and non-financial productivity (rs= 0.516, p < 0.000). However, a moderate but positive correlation was
observed between financial productivity and technology transfer (rs = 0.493, p < 0.000). Therefore, the
conclusion is that there are significant positive correlations of varying strengths among technology
transfer, financial and non-financial productivity.
7.2.4. Research question 4
Which variable between technology transfer and innovation has a greater impact on the productivity of
small-scale agro-processing firms in the Mashonaland Central province (Zimbabwe) and Free State
province (South Africa)?
The results of the multiple regression analysis indicated that the model encompassing technology transfer
and innovation as independent variables and agricultural productivity as the dependent variable revealed
mixed results for the two samples. For the Zimbabwean sample, technology transfer and innovation had
a non-significant predictive effect on the financial productivity of small agro-processing firms. However,
the two independent variables accounted for 9.9% of the variance in non-financial productivity. A closer
analysis of the contribution of the two factors revealed that only technology transfer had a statistically
significant impact on non-financial productivity.
© Central University of Technology, Free State

155 | P a g e
In the case of the South African sample, technology transfer and innovation explained 23.7% of the
variance in the financial productivity of small agro-processing firms. However, only technology transfer
had a statistically significant impact on the dependent variable. Collectively, technology transfer and
innovation jointly explained 37.7% of the variance in non-financial productivity. However, technology
transfer had a greater explanatory effect on the dependent variable than innovation. It can, therefore, be
concluded that for the South African sample, technology transfer had a greater impact on financial
productivity - while for the Zimbabwean sample, technology transfer had a significant impact on non-
financial productivity.
7.2.5. Research question 5
How can the agro-processing production model be constituted to ensure effective and efficient agro-
processing business in Mashonaland Central province (Zimbabwe) and Free State province (South
Africa) regions? The answer to this question is found in the model that summarises the contribution to
this study in Section 7.6. Suffice to say that, the model should comprise the dimensions of the variables
(technology transfer, innovation, financial and non-financial productivity) which exhibited positive
statistically strong relationships with strong effect sizes in the correlation and regression analysis sections
of this study.
7.3. Recommendations for policy and practice
This study sought to determine the status and impact of technology transfer and innovation on the
productivity and competitiveness of small-scale agro-processing businesses in Mashonaland Central
province in Zimbabwe and Free State province in South Africa. The results of the study revealed the
significance of technology transfer in enhancing agricultural output as well as a number of policy
challenges that beset the small agri-businesses in the specified study areas. Since agro-businesses
empower communities in countering socio-economic challenges, their significance is beyond question.
There is, therefore, a definite need for targeted interventions aimed at promoting seamless technology
transfer to improve overall agricultural productivity.
7.3.1. Creation of agro-business technology transfer information centres and innovation
platforms
In view of the results of the correlations among technology transfer, financial and non-financial
productivity, which were positive, statistically significant (with effect sizes ranging from moderate to
strong), the further dissemination and transfer of technology in agri-businesses with and across the two
countries cannot be taken for granted. The creation of agro business information centres in the two
© Central University of Technology, Free State
156 | P a g e
provinces will contribute towards providing a database of information on new agricultural technologies,
new agricultural innovations and knowledge on new ways to improve productivity. In addition, there is a
need to create and adopt agriculture innovation platforms to deal with institutional and administrative
obstacles to technological transformation in agricultural systems of the regions in the two countries.
7.3.2. Need to amend land ownership policies
The overall status and level of productivity of South African small-scale agro-processing firms was
comparatively higher than those of Zimbabwean ones from the perspectives of all dimensions ranging
from output productivity, output per hectare, capacity utilisation, market growth, market productivity
(reputation), financial productivity and non-financial productivity. Given the reality that the South African
economy was under a prolonged economic recession while Zimbabwe was projected to be on an
economic recovery path (projected economic growth of 2.8% in 2017 from 0.7% in 2016) due to good
rains and greater harvests (World Bank, 2017), it is surprising that Zimbabwean agro-processing firms
reported comparatively lower productivity indicators. Perhaps greater capacity utilisation, more integrated
agricultural infrastructure and input supply system, and government support backed by an untransformed
land tenure system explained this reality for the South African scenario.
While the South African productivity outlook is appealing, it unfolds under a climate of heavy
concentration of farming and agro-processing industry along ethnic minority lines, which could be
contributing to the stagnancy in the productivity, food security concerns, and concerns by the black
majority about the land ownership system in the country. As such, there is a need for a more inclusive
land ownership policy that ensures broader participation of various racial groups in agriculture and agro-
processing in the country. Following the abolition of apartheid in South Africa, the new government
introduced tenure reform, restitution and redistribution to redistribute agricultural land even though the
land ownership system remains untransformed in the eyes of the black majority despite the high but
stagnant levels of productivity.
In contrast, the agrarian reform and land redistribution programme in Zimbabwe resulted in the issuing of
99-year lease agreements to land holders as opposed to title deeds, itself a failure to transform the
inherited settler agricultural systems bequeathed by colonial regimes. Perhaps the difficulty of investing
in land could be attributed to a sense of lack of ownership and hence the need to introduce a land
ownership system that would render title deeds to land owners to increase their commitment to invest in
land and agro-processing activities. Such deeds could also be used as a form of collateral for accessing
© Central University of Technology, Free State

157 | P a g e
loans and other incentives from financial institutions and contribute to increasing the level of investments
in agro business firms.
7.3.3. Need for the government to review policy on local agriculture related research and
development activities
In view of the positive statistically significant but moderate correlation between technology transfer and
financial productivity reported for the two regions in the two countries, it can be argued that there could
be a sub-optimal use of technology transfer to drive agricultural productivity, which enhances financial
productivity. In view of the central role of agricultural research and development (R&D) in driving
technology transfer, there is a need for the South African and Zimbabwean governments to review their
policies on research and development (R&D) of research institutes, universities and other agricultural
institutions to ensure the scaling up and leveraging of technology transfer to support agricultural
productivity to ensure increased financial productivity.
To act as effective agents of technology transfer, research institutes that conduct agricultural and agro-
processing research need to be more financially resourced as much as the agro-processing institutions
themselves need financial support to drive their activities. Furthermore, small-scale agro-processing firms
in both Zimbabwe and South Africa require continuous technological and technical support through
research and development to update and extend their technological knowledge base in order for them to
effectively adopt and use cutting age agricultural technology. Although technology transfer is an
imperative for desirable economic and social development, developing countries under-spend on
agricultural research and development, an area key to the development of new technologies or modifying
available technologies into appropriate forms needed for agricultural operations and productivity. This
partially explains why most technology patents are held in the developed world. So, as Southern African
governments increase their investment in agriculture research and development, so does their capacity
to develop technological artefacts, tools and equipment needed for the agriculture sector and agro-
processing industry.
7.3.4. Promote technology transfer and innovation
In view of the centrality of technology transfer and innovation in predicting financial and non-financial
productivity in the South African sample, and the significance of technology transfer in predicting non-
financial productivity in the Zimbabwean sample (see section 7.2.4), the Zimbabwean’s Industrial
Development Corporation and South Africa’s Science and Technology department need to adopt a more
proactive role in the acquisition, development, dissemination and uptake of technology and innovation by
© Central University of Technology, Free State

158 | P a g e
agro-processing firms through equipping and partnering with their technology transfer agents and spin
offs to promote the free movement and acquisition and knowledge to agro-processing firms. In addition,
the two governments should provide vital support in the form of financial support and subsidies in the
area of technology transfer and innovation.
7.3.5. Encourage all stakeholder involvement in agricultural technology transfer initiatives
Given that a myriad of role-players are involved in different aspects of agriculture technology transfer in
both Zimbabwe and South Africa, there is a need for increased participation and involvement by
beneficiaries, benefactors and other stakeholders. An all-inclusive approach creates room for trialling of
novel innovations and technologies, and the promotion of learning and co-operation among all those
concerned. This is significant in two ways. Firstly, stakeholder involvement in the decision-making and
processes pertaining to technology transfer initiatives enables buy-in and willingness to accept solutions
suggested by technology sources and agents. Secondly, different stakeholders would bring different
views to the problem at hand and develop richer standpoints on technologies, which are realistic,
adaptable and acceptable in the local contexts.
7.3.6. Financial support for small-scale agro-processing businesses
One of the challenges that small-scale agro-firms in Zimbabwe face, is inadequate financial support to
enable the adoption and absorption of technology. In line with this, financial support ranges from financial
incentives to support infrastructure development, research institutes and other incentives from banks and
other financial institutions. A classic example of such a home country technology transfer support
programme is the Canada-Brazil and Southern Cone-Canada Technology Transfer Fund (TTF). The fund
assists Canadian organisations that intend to transfer know-how and technology to compatriot
organisations in some South American countries. The Canadian International Development Agency
(CIDA) oversees the fund and avails financial support to facilitate the effective transfer and adaptation of
Canadian technologies in conjunction with local organisations. The fund finances the buying of equipment
as well as licencing of specific technology by recipient country firms. It also caters for the training of
equipment operators and the upkeep of labourers. Hence, adopting a similar approach in the
Zimbabwean and South African context would probably enhance the small agro-firms’ adoption of new
technology as a bed-rock for improved productivity levels.
© Central University of Technology, Free State
159 | P a g e
7.4. Implications for future studies
This research has presented many questions in need of further investigation. Perhaps a cross-national
study involving a larger sample size, with samples selected from other provinces within the two countries,
would enhance the generalisability of the research results.
More broadly, research is also needed to determine the other factors that influence the competitiveness
and productivity of small-scale agro-processing firms. The chosen determinants of agricultural
competitiveness and productivity employed in this study are only a few among a myriad of factors. Future
studies need to expand the research horizons by accommodating diverse contributing factors to ascertain
the most important predictors of competitiveness and productivity in small agro-businesses.
The study approach adopted for this research was quantitative in nature. Future studies can complement
quantitative research with qualitative studies to capture the complex subjective experiences of agro-
processing owner/managers on the issues investigated in this study. Dispositions and perceptions of
small business owners/managers could be captured to establish whether the findings will be similar or
different from the current study’s findings.
Furthermore, future research can explore the role of specific agriculture development programmes in
promoting agricultural technology transfer and innovation and their subsequent effect on the
competitiveness and productivity of small-scale agro-based firms. For instance, in the Zimbabwean case,
a starting point would be to investigate the impact of the government-driven command agriculture
programme that was launched in 2016.
7.5. Limitations
Finally, a number of important limitations need to be considered. First, the current study adopted a cross-
sectional research design in addressing the factors influencing firm competitiveness and productivity of
agro-processing firms. Perhaps a longitudinal study could provide a more comprehensive picture of the
variations in the dependent variables over the long term compared to a cross sectional design.
Secondly, the study focused on one province from each participating country, which restricts the
generalisation of the results. A more inclusive approach can consider several provinces from the
participating countries to allow for the generalisation of results within the given countries.
© Central University of Technology, Free State
160 | P a g e
Thirdly, only two variables were used to investigate the agricultural competitiveness and productivity of
small agro-based firms in the study. More variables could have been incorporated to gain fuller insight
into the key determinants of agricultural competitiveness and productivity.
7.6. Contribution of the study
7.6.1. Theoretical contribution
The technology transfer and innovation scenario in the South African agro-processing industry exhibits a
fusion of the Traditional Liberal Theory and Industrial Development Theory. The former is characterised
by deliberate cooperation in research and development between the government, research institutes and
private industry (e.g. through Agriculture Research Council in South Africa, Agriculture Research Board)
to advance technology transfer and productivity (Bozeman, 2000). Other manifestations of Traditional
Liberal Theory relate to the South African government’s exaltation of the market as an efficient allocator
of technology resources - especially promoting private participation in the production and diffusion of
agricultural technology and efficient price allocation. In the process, the government creates sufficient
favourable conditions for technology investment through deregulation and eliminating unfair competition
(e.g. the role of the Competition Commission of South Africa in fair pricing of agricultural technologies,
equipment and commodities). The government also strives to eliminate barriers to trade through reduced
taxation, promotion of agricultural technology research development and allowing the free-flow of
technology among parties in the market (Cecere, 2015).
In the South African case of technology transfer, the Industrial Development Theory is characterised by
direct, systematic government interventions through centralised planning to identify and locate specific
agricultural areas for technology investment, technology exchange and cooperation, to create the perfect
conditions for technology transfer and to correct market imperfections in the agricultural sector. The
Department of Science and Technology’s Technology Innovation Plan, and the Republic of South Africa’s
National Development Plan are perfect examples of government intervention. Through interventions such
as the Technology Innovation Plan, government departments in collaboration with research institutions
and private companies should make decisions on whether to import agricultural capital goods or to locally
produce agricultural equipment and agricultural engineering products through transnational corporations’
subsidiaries such as Pannar Seed South Africa, Syngenta South Africa and Mahindra South Africa.
The higher levels of agro-processing productivity in the country, the comparatively stronger correlations
between technology transfer and productivity, and between innovation and productivity compared to
those of Zimbabwe suggest that South Africa has a fairly sophisticated agricultural infrastructure and a
© Central University of Technology, Free State
161 | P a g e
well-developed institutional systems for technology transfer (mainly Multi-National Corporation
subsidiaries), which are located and operating in the country.
The innovation scenario for South African agro-processing firms is not sufficiently compatible with Roger’s
(1962) Diffusion of Innovation theorisation, in which agricultural innovation is created, packaged and
disseminated from its source to its consumers (such as agro-processing farmers and businesses). The
traditional model of Diffusion of Innovation assumes geographical and psychological proximity between
the innovation source (e.g. a region of higher concentration of technology innovation, and readiness and
willingness of the technology recipient to adopt the technology innovation) to the technology
client/consumers (e.g. region of lower concentration) as technology needs to be transmitted easily from
its source to the technology users. In reality, the traditional formulation of the theory seems to negate the
role of technology transfer intermediaries (i.e. technology transfer agents) between the technology
creator (for instance, multi-national corporations) and the technology consumer (agro-processing firms).
In the innovation scenario of agro-processing firms in South Africa, innovation diffusion either unfolds
though transnational companies’ subsidiaries located in South Africa or in rare cases is imported from
developed countries. Domestic production and diffusion of technology innovation contradict Rogers’
(1962) theorisation about technology transfer from developed countries to developing countries either
through development assistance from World Development bodies, foreign technical cooperation or
transfer of actual agricultural technological artefacts, tools and equipment from the host country to the
recipient country. The current study reports a high concentration of innovations (e.g. high yielding
varieties, agricultural equipment, and irrigation technology) that are designed and transferred within
South Africa through innovation intermediaries, and the flourishing technology transfer situation -
including the consistently higher correlations between technology transfer and productivity in South
African agro-processing firms. This does not match Roger’s (1962) postulations about technology
mismatches and discontinuities that result in the abandonment of technology transfer by the technology
agent upon the end of agricultural projects.
The Zimbabwean case of innovation diffusion somewhat matches Roger’s (1962) theoretical narrative.
Under the Fast Track Land Reform Programme and Command Agriculture, the Zimbabwean government
has harnessed its Look East Policy to intensify the importation of agricultural technology from Chinese
companies to support its irrigation systems, agricultural mechanisation schemes involving the acquisition
of tractors, machinery and other agricultural equipment. The uptake of innovation and technology transfer
(even though comparatively lower to that of South Africa), the positive, statistically significant but
moderate to weaker correlations between technology transfer and productivity, and innovation and
© Central University of Technology, Free State
162 | P a g e
productivity, perhaps point to the complexities of adapting Chinese and Malaysian technologies to
Zimbabwean agricultural contexts with limited adaptation and contextualisation. This interpretation
consummates Rogers’ (1962) postulations about local conditions, national social systems and channels
of communication shaping the process of diffusion of innovations.
The Traditional Liberal Theory seems to match the Zimbabwe’s technology transfer scenario before the
2000 Land reform Programme, which destabilised agricultural production in the country. Up to the mid-
1990s, the then Ministry of Agriculture worked closely with agricultural extension officers, university
agricultural departments, and research institutes to engage in collaborative research and development
initiatives that gave rise to the birth of new agricultural technologies adopted by agri-farmers and agro-
processing firms. The hailing of Zimbabwe as the break basket of Southern Africa, manifested in high
agricultural productivity, the strong synergies between technology transfer and productivity, and the
thriving agricultural innovation and transfers of technology in the country before 2000. The innovation and
technology transfer successes revolved around high-yielding varieties, drought-resistant early maturing
crop varieties, pest-control chemical and agricultural equipment manufacturing, irrigation systems,
conservation agricultural techniques such as gully reclamation, crop rotation, mulching and greenhouse
technologies. The collapse of agricultural systems, the attendant growing food insecurity, collapse of
research synergies and collaborations between government institutions, parastatals and research
institutions after the controversial land reform programme in 2000 all point to the abandonment of
Traditional Liberal Theory and the insurrection of Industrial Development Theory in Zimbabwe.
The positive statistically significant moderate to weak correlations between technology transfer and
(financial and non-financial) productivity and between innovation and (financial and non-financial)
productivity demonstrate that although predictor variables such as technology transfer and innovation are
critical to increased productivity, the reality is that agro-processing farmers could be underutilising them
as their source of competitiveness and increased productivity. Alternatively, they could be weakly
integrating them into their agricultural activities due to weaker financial and technical agricultural support
from government.
7.6.2. Practical contribution
The current study is exploratory in nature and spans two countries, a design that has not been used in
prior studies conducted on Zimbabwe and South Africa on the same topic. The current findings add to
our understanding of the performance of small-scale agricultural enterprises through a novel combination
of factors that influence agricultural productivity and competitiveness. Some studies have explored the
© Central University of Technology, Free State
163 | P a g e
relationship between innovation and productivity on the one hand, and agricultural productivity and
competitiveness on the other (Lööf, & Heshmati, 2006; Loevinsohn, Sumberg, Diagne, & Whitfield, 2013;
Capalbo & Vo, 2015). In addition, others have also examined the relationship between technology
transfer and productivity including competitiveness in different economic activities (Dunning, 2013;
Cavallo, Ferrari & Coccia, 2015; Gaunand, Hocde, Lemarié, Matt & De Turckheim, 2015). No studies to
the researcher’s knowledge have explored in one study the association among technology transfer,
innovation, competitiveness and productivity among small-scale agro-businesses in developing
economies (Zimbabwe and South Africa).
The outcome of the study, which partially proved the predictive effects of technology transfer and
innovation on competitiveness and productivity, provided a credible and empirically validated explanatory
tool for the performance of small scale agricultural enterprises (SSAEs) in Zimbabwe and South Africa.
Based on the empirical findings and the associated conclusions, the study proposed a model for the key
determinants of competitiveness and productivity in small-scale agro businesses in Zimbabwe and South
Africa. The model is diagrammatically presented in Figure 7.1. Greater understanding of each of the
factors influencing the dependent variables will enable the small firms to put more emphasis on those
factors that have the greatest and significant effect on competitiveness and productivity as articulated in
the findings chapter of this study.
© Central University of Technology, Free State
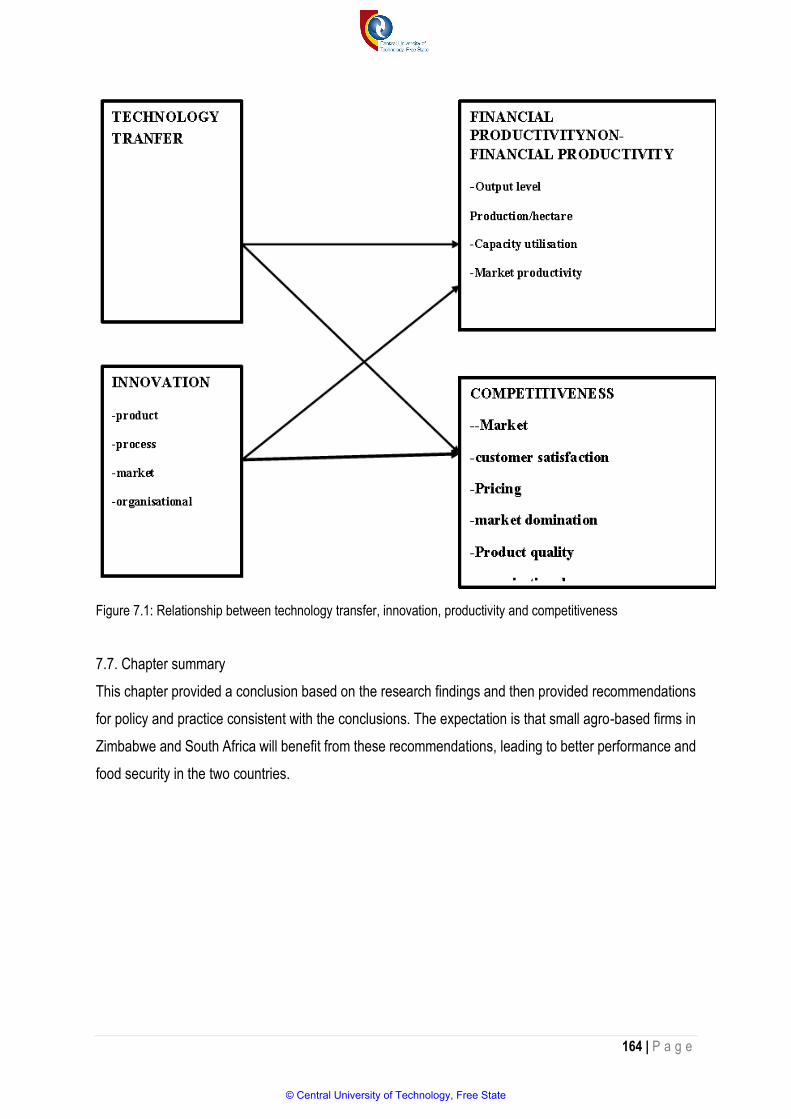
164 | P a g e
Figure 7.1: Relationship between technology transfer, innovation, productivity and competitiveness
7.7. Chapter summary
This chapter provided a conclusion based on the research findings and then provided recommendations
for policy and practice consistent with the conclusions. The expectation is that small agro-based firms in
Zimbabwe and South Africa will benefit from these recommendations, leading to better performance and
food security in the two countries.
© Central University of Technology, Free State
165 | P a g e
REFERENCES
Abdullah, F.A. & Samah, B.A. 2013. Factors impinging farmers’ use of agriculture Technology. Asian.
Social Science, 9(3), 120-124.
Abdu-Raheem, K.A. & Worth, S.H. 2011. Household food security in South Africa: evaluating
extension's paradigms relative to the current food security and development goals. South
African Journal of Agricultural Extension, 39(2), 91-103.
Abebaw, D. & Haile, M.G. 2013. The impact of cooperatives on agricultural technology adoption:
Empirical evidence from Ethiopia Food Policy, 38, 82-91.
Abidin, R., Hasnan, N., Abdullah, C.S., Mohtar, S. & Zulhumadi, F. 2013. Relationship between social
capital and technology transfer performance: A study on companies in technology park. Journal
of Southeast Asian Research, 2013, 1-9.
Adamopoulos, T. & Restuccia, D. 2014. The size distribution of farms and international productivity
differences. The American Economic Review, 104(6), 1667-1697.
Adekunle, A., Osazuwa, P. & Raghavan, V. 2016. Socio-economic determinants of agricultural
mechanisation in Africa: A research note based on cassava cultivation
mechanisation. Technological Forecasting and Social Change, 112, 313-319.
Adenle, A.A., Manning, L. & Azadi, H. 2017. Agribusiness innovation: A pathway to sustainable
economic growth in Africa. Trends in Food Science & Technology, 59, 88-104
Agbobli, E.K. 2013. The influence of entrepreneurial and market orientations on small scale agricultural
enterprises in the Vryburg Region. Unpublished doctoral dissertation. Central University of
Technology, Free State.
Agbotame, L.A.K. 2015. The impact of selected aspects of globalisation on small-scale agro-based
businesses in a rural South African Setting. Unpublished doctoral dissertation. Central
University of Technology, Free State.
Aguilar, A., Carranza, E., Goldstein, M., Kilic, T. & Oseni, G. 2015. Decomposition of gender
differentials in agricultural productivity in Ethiopia Agricultural Economics, 46 (3), 311-334.
Ahuja, L.R., Ma, L. & Howell, T.A. Eds. 2016. Agricultural system models in field research and
technology transfer. The journal of technology transfer, 39(3), 322-334.
Alemu, D., Cook, S. & Gubo, Q. 2015. Chinese agricultural expertise support in Ethiopia: approaches,
motives and perspectives. Future agricultures consortium, working paper. [Online]. Available:
https://www.eldis.org/document/A72521 [2017, November 05].
Ali, D.A. & Deininger, K. 2015. Is there a farm size–productivity relationship in African agriculture?
Evidence from Rwanda. Land Economics, 91(2), 317-343.
© Central University of Technology, Free State

166 | P a g e
Aliber, M., & Cousins, B. 2013. Livelihoods after land reform in South Africa. Journal of Agrarian
Change, 13(1), 140-165.
Alston, J.M. & Pardey, P.G. 2016. Antipodean agricultural and resource economics at 60: agricultural
innovation. Australian Journal of Agricultural and Resource Economics, 60(4), 554-568.
Amanor, K.S. & Chichava, S. 2016. South–South cooperation, agribusiness, and African agricultural
development: Brazil and China in Ghana and Mozambique. World Development, 81, 13-23.
Andersson, J. A. & D'Souza, S. 2014. From adoption claims to understanding farmers and contexts:
A literature review of conservation agriculture (CA) adoption among smallholder farmers in
southern Africa. Agriculture, Ecosystems and Environment, 187, 116-132.
Andrews, D., Criscuolo, C. & Gal, P.N. 2016. The global productivity slowdown, technology divergence
and public policy: A firm level perspective. [Online]. Available: https://www.brookings.edu/wp-
content/uploads/2016/09/wp24_andrews-et-al_final.pdf [2017, November 02].
Annan-Diab, F. 2012. Multinational enterprises and investment motivations: A strategic analysis of
inward foreign direct investment into Ireland. Unpublished doctoral dissertation. Royal Holloway
University of London.
Arrigo, E. 2012. Alliances, open innovation and outside-in management, Symphonya. Emerging Issues
in Management, 2, 53-65.
Asante BO, Villano RA & Battese GE, 2014. The effects of the adoption of yam minisett technology on
technical efficiency of yam farmers in the forest-savanna transition zone of Ghana. African
Journal of Agricultural and Resource Economics, 9, 75-90.
Asante, F.A. & Amuakwa-Mensah, F. 2015. Climate change and variability in Ghana: stocktaking.
Climate, 3(1), 78-101.
Asoegwu, S.N. & Asoegwu, A.O. 2007. An overview of agricultural mechanization and its
environmental management in Nigeria. Agricultural Engineering International: the CIGR
Ejournal. Invited Overview, 6(IX), 1-20.
Audretsch, D.B., Lehmann, E.E., Paleari, S. & Vismara, S. 2016. Entrepreneurial finance and
technology transfer. Journal of Technology Transfer, 41, 1-9.
Awale, R. & Rowlinson, S. 2014. A conceptual framework for achieving firm competitiveness in
construction: A 'creating shared value' (CSV) concept. In: Raiden, A B and Aboagye-Nimo, E
(Eds) 30th Annual ARCOM Conference, 1-3 September 2014, Portsmouth, UK. Association of
Researchers in Construction Management, 1285-1294.
© Central University of Technology, Free State
167 | P a g e
Awang, A.H., Hashim, K., Ramli, Z., Lyndon, N. & Ali, M.N. 2016. The effects of technology transfer,
good agriculture practices on the productivity of independent palm oil
smallholders. International Journal of Economic Perspectives, 10(4), 300-304
Awokuse, T.O. & Xie, R. 2015. Does agriculture really matter for economic growth in developing
countries? Canadian Journal of Agricultural Economics, 63(1), 77-99.
Babbie, E. 2007. Conducting qualitative field research. In The practice of social research. 11th Edition.
U.S.A.: Thomson Wadsworth.
Baden-Fuller, C. & Haefliger, S. 2013. Business models and technological innovation. Long Range
Planning, 46(6), 419-426.
Bah, E.I.H. & Fang, L. 2015. Impact of the Business Environment on Output and Productivity in Africa.
African development bank group. [Online]. Available:
https://www.afdb.org/fileadmin/uploads/afdb/Documents/Publications/WPS_No_219_Impact_of_the_b
usiness_Environment_on_Output_and_Productivity_in_Africa.pdf [2017, November 06].
Bahta, S. & Malope, P. 2014. Measurement of competitiveness in smallholder livestock systems and
emerging policy advocacy: An application to Botswana. Food Policy, 49(2), 408-417.
Bahta, Y.T., Willemse, B.J. & Grove, B. 2014. The role of agriculture in welfare, income distribution
and economic development of the Free State Province of South Africa: A CGE approach.
Agricultural Economics Research, Policy and Practice in Southern Africa, 53(1), 44-74.
Banerjee, A. & Chaudhury, S. 2010. Statistics without tears: populations and samples. Industrial
Psychiatry Journal, 19(1), 60-65.
Barrows, G., Sexton, S. & Zilberman, D. 2014. Agricultural biotechnology: The promise and prospects
of genetically modified crops. The Journal of Economic Perspectives, 28(1), 99-119.
Baudron, A.R., Needle, C.L., Rijnsdorp, A.D. & Marshall, C.T. 2014. Warming temperatures and
smaller body sizes: synchronous changes in growth of North Sea fishes. Global Change
Biology, (20), 4, 1023-1031.
Baudron, F., Andersson, J.A., Corbeels, M. & Giller, K.E. 2012. Failing to yield? Ploughs, conservation
agriculture and the problem of agricultural intensification: An example from the Zambezi Valley,
Zimbabwe. Journal of Development Studies, 48(3), 393-412.
Baudron, F., Andersson, J.A., Corbeels, M. & Giller, K.E. 2014. Warming temperatures and smaller
body sizes: Synchronous changes in growth of North Sea fishes. Global Change
Biology, 20(4), 1023-1031.
© Central University of Technology, Free State
168 | P a g e
BenYishay, A. & Mobarak, A.M. 2013. Communicating with farmers through social networks. [Online].
Available: https://web.stanford.edu/group/SITE/SITE_2013/2013_segment_6/2013-
segment_6_papers/mobarak.pdf [2017, April 10]
Berhanu, K. & Poulton, C. 2014. The political economy of agricultural extension policy in Ethiopia:
Economic Growth and Political Control. Journal of Development Policy Review, 32(2), 197-214.
Bernstein, H. 2013. Commercial agriculture in South Africa since 1994: ‘Natural, simply
capitalism’. Journal of Agrarian Change, 13(1), 23-46
Bhardwaj, D., Ansari, M.W., Sahoo, R.K., & Tuteja, N. 2014. Biofertilizers function as key player in
sustainable agriculture by improving soil fertility, plant tolerance and crop productivity. Microbial
Cell Factories, 13(1), 66.
Bhatasara, S., & Chiweshe, K.M. 2017. Beyond gender: interrogating women’s experiences in FTLRP
in Zimbabwe. Africa Review, 9(2), 154-172.
Bielik, P. & Rajčániová, J. 2004. Scale efficiency of agricultural enterprises in Slovakia. Agricultural
Economics-Czech, 50(8), 331-335.
Bigliardi, B. & Galati, F. 2016. Which factors hinder the adoption of open innovation in SMMEs?
Technology Analysis and Strategic Management, 28(8), 869-885.
Blessing L. & Chakrabarti A. 2009. A Design Research Methodology (DRM). Springer-Verlag London
Limited.
Blumberg, B., Cooper, D.R. & Schindler, P.S. 2011. Business Research Methods. 3rd Edition. McGraw-
Hill: Berkshire.
Blumberg, B., Cooper, D.R. & Schindler, P.S. 2014. Business Research Methods. 4th Revised Edition.
McGraw Hill Higher Education, London.
Blumberg, B., Cooper, D.R. and Schindler, P.S. 2008. Business research methods, Berkshire:
McGraw-Hill.
Boh, W. F., De-Haan, U. & Strom, R. 2016. University technology transfer through entrepreneurship:
faculty and students in spinoffs. The Journal of Technology Transfer, 41(4), 661-669.
Bozeman, B. 2000. Technology transfer and public policy: a review of research and theory. Research
Policy, 29 (4), 627-655.
Bozeman, B.; Rimes, H. & Youtie, J. 2015. The evolving state-of-the-art in technology transfer
research: Revisiting the contingent effectiveness model. Research Policy, 44(1), 34-49.
Bradley, S.R., Hayter, C.S. & Link, A.N. 2013. Models and Methods of University Technology Transfer.
Foundations and Trends in Entrepreneurship, 9(6), 571-650.
© Central University of Technology, Free State

169 | P a g e
Bragdon, S.H. & Smith, C. 2015. Small-scale farmer innovation. Quaker United Nations Office,
Geneva. [Online]. Available:
http://www.quno.org/sites/default/files/resources/SSF%20Innovation%20WEB.pdf [2017,
November 06].
Burke M. & Lobell D. 2010. Food security and adaptation to climate change: What do we know?
In D. Lobell & M. Burke (Eds). Climate Change and Food Security. Advances in Global
Change Research, Springer, Dordrecht. 133-153
Camagni, R. 2017. Technological change, uncertainty and innovation networks: Towards a dynamic
theory of economic space, in R. Capello (Eds) Seminal Studies in Regional and Urban
Economic. Springer, Cham. 65-92.
Camisón, C. and Villar-López, A. 2014. Organisational innovation as an enabler of technological
innovation capabilities and firm performance. Journal of Business Research, 67, 2891-2902.
Campbell, B.M., Thornton P., Zougmoré, R., van Asten P. & Lipper L. 2014. Sustainable
intensification: What is its role in climate smart agriculture? Current Opinion in Environmental
Sustainability, 8, 39-43.
Capalbo, S.M. & Antle, J.M. Eds. 2015. Agricultural productivity: measurement and explanation. New
York: Routledge Publishing.
Capalbo, S.M. & Vo, T.T. 2015. A review of the evidence on agricultural productivity. Agricultural
productivity: Measurement and explanation, New York: Routledge Publishing.
Carayannis E. & Grigoroudis E. 2016. Quadruple Innovation Helix and Smart Specialization:
Knowledge Production and National Competitiveness. Foresight and STI Governance, 10(1),
31-42.
Carletto, C., Savastano, S. & Zezza, A. 2013. Fact or artifact: the impact of measurement errors on
the farm size–productivity relationship. Journal of Development Economics, 103, 254-261.
Cavallo, E., Ferrari, E. & Coccia, M. 2015. Likely technology trajectories in agricultural tractors by
analysing innovative attitudes of farmers. International Journal of Technology, Policy and
Management, 15(2), 158-177.
Cavallo, E., Ferrari, E., Bollani, L. & Coccia, M. 2014. Strategic management implications for the
adoption of technological innovations in agricultural tractor: the role of scale factors and
environmental attitude. Technology Analysis & Strategic Management, 26(7), 765-779.
Cecere, G. 2015. The economics of innovation: A review article. The Journal of Technology
Transfer, 40(2), 185-197.
© Central University of Technology, Free State
170 | P a g e
Celik, P., Storme, M., Davila, A. & Myszkowski, N. 2016. Work-related curiosity positively predicts
worker innovation. Journal of Management Development, 35(9), 1184-1194.
Cesaroni, F. & Piccaluga, A. 2016. The activities of university knowledge transfer offices: towards the
third mission in Italy. The Journal of Technology Transfer, 41(4), 753-777.
Chambati, W. 2013. Changing agrarian labour relations after land reform in Zimbabwe. Land and
Agrarian Reform in Zimbabwe: Beyond White-Settle Capitalism, 157-194.
Chamboko, T., Mwakiwa, E. & Mugabe, P.H. 2017. Determinants of milk market participation and
volume of sales to milk collection centres of the smallholder dairy value chain in
Zimbabwe. Journal of Agricultural Science, 9(10), 156.-164
Chang, H. & Zepeda, L. 2001. Agricultural Productivity for Sustainable Food Security in Asia and the
Pacific: The Role of Investment. In Agricultural Investment and Productivity in Developing
Countries. FAO Economic and Social Development Paper 148. Edited by Lydia Zepeda,
Department of Consumer Science, University of Wisconsin-Madison USA. [Online]. Available:
http://www.fao.org/docrep/003/X9447E/X9447E00.HTM [2017, November 06].
Charles, H., Godfray, J. & Garnett, T. 2014. Food security and sustainable intensification.
Philosophical Transactions of the Royal Society B: Biological Sciences, 369(1639), 1-20.
Chavas, J.P., Hummels, D. & Wright, B.D. 2014. The economics of food price volatility. University of
Chicago Press, Chicago.
Chawarika, A. Mutambara, J. & Tafireyi Chamboko, T. 2017. Competitiveness of wheat production in
Zimbabwe. African Journal of Science, Technology, Innovation and Development, 9(3), 263-
268.
Cheesman, S., Andersson, J.A. & Frossard, E. 2017. Does closing knowledge gaps close yield gaps?
On-farm conservation agriculture trials and adoption dynamics in three smallholder farming
areas in Zimbabwe. The Journal of Agricultural Science, 155(1), 81-100.
Chen, C.P. & Zhang, C.Y. 2014. Data-intensive applications, challenges, techniques and technologies:
A survey on Big Data. Information Sciences, 314-347.
Chiona, S., Kalinda, T. & Tembo, G. 2014. Stochastic frontier analysis of the technical efficiency of
smallholder maize farmers in Central Province, Zambia. Journal of Agricultural Science, 6(10),
108-18.
Chiputwa, B., Langyintuo, A. S. & Wall, P. 2011. Adoption of conservation agriculture technologies by
smallholder farmers in the Shamva District of Zimbabwe: A Tobit application. In 2011 annual
meeting. February 5–8, 2011, Southern Agricultural Economics Association, Corpus Christi,
Texas
© Central University of Technology, Free State

171 | P a g e
Christensen, C.M. 1997. The innovator's dilemma: when new technologies cause great firms to fail.
[Online]. Available: http://www.hbs.edu/faculty/Pages/profile.aspx?facId=6437&click=byline
[2017, November 12].
Cillo, P., De Luca, L. M. & Troilo, G. 2010. Market information approaches, product innovativeness,
and firm performance: An empirical study in the fashion industry. Research Policy, 39(9), 1242-
1252.
Clemens, M. A., Özden, Ç. & Rapoport, H. 2015. Reprint of: Migration and development research is
moving far beyond remittances. World Development, 65, 1-5.
Cliffe, L., Alexander, J., Cousins, B., & Gaidzanwa, R. Eds. 2014. Outcomes of post-2000 fast track
land reform in Zimbabwe. Routledge.
Cohen, J. 1988. Statistical power analysis for the behavioural sciences. 2nd edition. Hillsdale, NJ:
Lawrence Earlbaum Associates
Cohen, L.M., Manion, L. & Morrison, K. 2007. Research Methods in Education. 6th Edition, London:
Routledge.
Collier, P. & Dercon, S. 2014. African agriculture in 50 years: Smallholders in a rapidly changing
world? World development, 63, 92-101.
Conover, W.J. & Iman, R.L. 1981. Rank Transformations as a Bridge Between Parametric and
Nonparametric Statistics. The American Statisrician, 35(3), 124-133.
Conradie, B., Piesse, J. & Thirtle, C. 2009. District level total factor productivity in agriculture: Western
Cape Province, South Africa, 1952-2002. Agricultural Economics, 40(3), 265-280.
Cooper, D. & Schindler, P. 2011. Business Research Methods. 11th Edition, McGraw Hill, Boston
Costantini, V. & Liberati, P. 2014. Technology transfer, institutions and development. Technological
Forecasting & Social Change, 88, 26-48.
Cousins, B. 2013. Smallholder irrigation schemes, agrarian reform and ‘accumulation from above and
from below’ in South Africa. Journal of Agrarian Change, 13(1), 116-139.
Creswell, J.W. 2003. Research design: qualitative, quantitative, and mixed methods approaches. 2nd
Edition. Thousand Oaks, CA: Sage Publications.
Cullen, B., Tucker, J., Snyder, K., Lema, Z. & Duncan, A. 2014. An analysis of power dynamics within
innovation platforms for natural resource management. Innovation and Development, 4(2), 259-
275.
© Central University of Technology, Free State
172 | P a g e
Davis, K. 2008. Extension in sub-Saharan Africa: Overview and assessment of past and current
models and future prospects. Journal of International Agricultural & Extension Education, 15(3),
15-28.
Deininger, K., Nizalov, D. & Singh, S. 2013. Are mega-farms the future of global agriculture? Exploring
farm Size-Productivity Relationship and Productivity Dynamics for Large Commercial Farms in
Ukraine. World Bank Policy Research Working Paper 6544. Washington, DC: World Bank.
Delport, C.S.L. & Fouché, C.B. 2011. Mixed methods research. In De Vos A.S., Strydom, H., Fouché
C.B. & Delport C.S.L. Research at the grass roots for the social sciences and human service
professions. 4th Edition. Pretoria: JL Van Schaik Publishers.
Department of Agriculture, Forestry and Fisheries. 2012. Agro-processing strategy [Online]. Available:
http://www.nda.agric.za/doaDev/sideMenu/AgroProcessingSupport/docs/DAFF%20agro-
processing%20strategy.pdf [2017, November 13]
Department of Agriculture, Forestry and Fisheries. 2014. Agricultural policy action plan (APAP).
[Online]. Available: https://www.agrisa.co.za/wp-content/uploads/2014/10/011-APAP-
AgriSA.pdf [2017 November 12].
Department of Agriculture, Forestry and Fisheries. 2016. Economic review of the South African
agriculture. [Online]. Available:
http://www.daff.gov.za/daffweb3/portals/0/statistics%20and%20economic%20an
alysis/economic%20analysis/economic%20review%202016.pdf [2017 November
12].
Derbile, E.K. 2013. Reducing vulnerability of rain-fed agriculture to drought through indigenous
knowledge systems in North-Eastern Ghana. International Journal of Climate Change
Strategies and Management, 5(1), 71-94.
Deschryvere, M. 2014. R&D, firm growth and the role of innovation persistence: An analysis of Finnish
SMMEs and large firms. Small Business Economics, 43, 767–785.
Desiere, S. & Jolliffe, D. 2017. Land productivity and plot size: Is measurement error driving the inverse
relationship? [Online]. Available:
http://documents.worldbank.org/curated/en/119781498874101671/pdf/WPS8134.pdf [2017,
November 02].
Development Bank of Southern Africa Report. 2014. DBSA projects: Wind and solar energy. Integrated
annual report 2014. [Online]. Available: https://www.dbsa.org/EN/About-
© Central University of Technology, Free State

173 | P a g e
Us/Publications/Annual%20Reports/DBSA%20Integrated%20Annual%20Report%202013-
14.pdf [2017, November 10].
Dlamini, B.P. 2012. Analysing the competitiveness of the agribusiness sector in Swaziland.
Unpublished master’s thesis. University of Pretoria
Dogra, R., Garg, R. & Jatav, P. 2013. Technology transfer in pharmaceutical industry: transfer of
process from development to commercialisation. International Journal of Pharmaceutical
Sciences and Research, [Online]. Available: http://ijpsr.com/bft-article/technology-transfer-in-
pharmaceutical-industry-transfer-of-process-from-development-to-
commercialization/?view=fulltext [2017, November 10].
Dorward, A. 2012. The short-and medium-term impacts of rises in staple food prices. Food
security, 4(4), 633-645.
Dorward, A. 2013. Agricultural labour productivity, food prices and sustainable development impacts
and indicators. Food Policy, 39, 40-50.
Drucker, P. 2014. Innovation and entrepreneurship. New York: Routledge.
Du Toit, C.B., Van Eyden, R. & Ground, M. 2006 Does South Africa have the potential and capacity to
grow at 7 per cent?: A labour market perspective. University of Pretoria Working Paper: 2006-
03 February 2006. [Online]. Available:
http://www.up.ac.za/media/shared/61/WP/wp_2006_03.zp39549.pdf [2017, November 05].
Dube, K. & Sigauke, E. 2015. Irrigation technology for smallholder farmers: A strategy for achieving
household food security in lower Gweru Zimbabwe. South African Journal of Agricultural
Extension, 43(1), 1-11.
Dube, K. 2016. Implications of rural irrigation schemes on household economy. A case of lower Gweru
Irrigation Scheme, Zimbabwe. South African Journal of Agricultural Extension, 44(1), 75-90
Dube, T., Homann-Kee Tui, S., Van Rooyen, A.F. & Rodriguez, D. 2014. Baseline and situation
analysis report: integrating crop and livestock production for improved food security and
livelihoods in rural Zimbabwe, Socioeconomics Discussion Series Paper Series 29. [Online].
Available:https://cgspace.cgiar.org/handle/10568/56935?show=full [2017, March 01].
Ducastel, A. & Anseeuw, W. 2017. Agriculture as an asset class: reshaping the South African farming
sector. Agriculture and Human Values, 34(1), 199-209.
Dunning, J. H. 2013. Multinationals, Technology & Competitiveness. Vol. 13. RLE International
Business: Routledge.
© Central University of Technology, Free State
174 | P a g e
Duvenage, I.A. 2013. The Implementation and achievement of biofuel sustainability principles in Sub‐
Saharan Africa: Recognising limitations and opportunities. Unpublished doctoral dissertation.
Bond University Gold Coast, Queensland, Australia.
Edgar, B. & Lucas, D. 2016. Zimbabwe's emigrants: Growth and change in Australia. Australasian
Review of African Studies, 37(2), 33-55.
Eisler, M.C., Lee, M.R., Tarlton, J.F., Martin, G.B., Beddington, J., Dungait, J.A. & Misselbrook, T.
2014. Agriculture: Steps to sustainable livestock. Nature, 507(7490), 32-34.
Elias, A., Nohmi, M., Yasunobu, K. & Ishida, A. 2016. Farmers’ satisfaction with agricultural extension
service and its influencing factors: a case study in North West Ethiopia. Journal of Agricultural
Science and Technology, 18(1), 39-53.
Enete, A.A. & Amusa, T.A. 2010. Challenges of agricultural adaptation to climate change in Nigeria: A
synthesis from the literature. Journal of Field Action, 4, 1-20.
Eyhorn, F. 2007. Organic farming for sustainable livelihoods in developing countries. The case of
cotton in India. Unpublished doctoral dissertation. University of Deutschland.
Family Farming. 2014. Food and agriculture organisation of the United. [Online]. Available:
https://mafiadoc.com/family-farming-food-and-agriculture-organization-of-the-united-
_599401fc1723ddcc692f2f39.html [2017, November 05].
Farinha, L., Ferreira, J. & Gouveia, B. 2016. Networks of innovation and competitiveness: A triple helix
case study. Journal of the Knowledge Economy, 7(1), 258-275
Filho, V., Eustáquio, J. & Fornazier, A. 2016. Agricultural productivity: closing the gap between Brazil
and the United States. Economic Commission for Latin America and the Caribbean, 203-220.
Fischer, M.M. & Fröhlich, J. Eds. 2013. Knowledge, complexity and innovation systems. Springer
Science & Business Media.
Food and agriculture organisation of the United Nations (FAO). 2012. Voluntary guidelines on the
responsible governance of land fisheries and forests in the context of national food security (the
voluntary guidelines) of the inter-governmental world committee on food security. [Online].
Available: http://www.fao.org/nr/tenure/voluntary-guidelines/en/ [2016, April 03].
Food and agriculture organisation of the United Nations (FAO). 2015. The state food insecurity in the
world. [Online]. Available: http://www.fao.org/3/a-i4646e.pdf [2017 November 06].
Food and Agriculture Organisation of the United Nations (FAO). 2016. The state of food insecurity in
the world. [Online]. Available: http://www.fao.org/3/a-i4646e.pdf [2017 November 06].
Francis, J., Mytelka, L., Huis, A. van & Röling, N. (Eds.). 2016. Innovation systems: Towards effective
strategies in support of smallholder farmers. Wageningen, the Netherlands: Technical Centre
© Central University of Technology, Free State
175 | P a g e
for Agricultural and Rural Cooperation and Wageningen University and Research Centre.
[Online]. Available: https://cgspace.cgiar.org/handle/10568/79166?show=full [2017, November
05].
Fromhold-Eisebith, M., Werker, C. & Vojnic, M. 2014. 7 Tracing the social dimension in innovation
networks–from conceptualisation to empirical testing, in Christopherson, S.M., Feldman, M.,
Grabher, G., Martin, R. & Perry, M. The social dynamics of innovation networks, 121-140.
Fuglie, K.O. 2016. Investing in agricultural productivity in Indonesia. Forum Penelitian Agro Ekonomi,
17(2), 1-16
Gandhi, V.P. 2014. Growth and transformation of the agribusiness sector: Drivers, models and
challenges. Indian Journal of Agricultural Economics, 69(1), 44-74.
Gandure, S., Walker, S. & Botha, J. 2013. Farmers' perceptions of adaptation to climate change and
water stress in a South African rural community. Environmental Development, 5, 39-53.
Gaunand, A., Hocde, A., Lemarie, S., Matt, M. & De Turckheim, E. 2015. How does public agricultural
research impact society? A characterisation of various patterns. Research Policy, 44, 849-861.
George, D. & Mallery, P. 2010. SPSS for Windows Step by Step: A Simple Guide and Reference 17.0
Update. 10th Edition, Pearson, Boston.
Gholami, M.H., Asli, M.N., Shirkouhi, S.N. & Noruzy, A. 2013. Investigating the influence of knowledge
management practices on organisational performance: A empirical study. Acta Ploytechnica
Hungarica, 10(2), 205-216.
Giampiccoli, A., Lee, S.S. & Nauright, J. 2015. Destination South Africa: Comparing global sports
mega-events and recurring localised sports events in South Africa for tourism and economic
development. Current Issues in Tourism, 18(3), 229-248
Giannakis, E. & Bruggeman, A. 2015. The highly variable economic performance of European
agriculture. Land Use Policy, 45, 26-35.
Gibba, A. & Mark, M. 2016. An empirical study on factors of economic growth in the Gambia: lessons
from agriculture and exports. Journal of Management, 29(2), 63-69.
Gilsing, V., Bekkers, R., Freitas, I.M.B. & van der Steen, M. 2011. Differences in technology transfer
between science-based and development-based industries: Transfer mechanisms and barriers.
Technovation, 31, 638-647.
Gisselquist, D., Nash, J. & Pray, C. 2002. Deregulating the transfer of agricultural technology: lessons
from Bangladesh, India, Turkey, and Zimbabwe. The World Bank Research Observer, 17(2),
237-265.
© Central University of Technology, Free State

176 | P a g e
Global agricultural productivity report GAP Report®. 2015. Building sustainable breadbaskets.
[Online]. Available: http://www.globalharvestinitiative.org/GAP/2015_GAP_Report.pdf [2017,
November 05].
Global Entrepreneurship monitor GEM 2012. Global report. [Online]. Available:
http://www.gemconsortium.org/report/48545 [2017, November 05].
Global Entrepreneurship monitor GEM 2013. Global report: Fifteen years of assessing
entrepreneurship across the globe. [Online]. Available:
http://www.gemconsortium.org/report/48545 [2017, November 05].
Gollin, D. 2010. Agricultural productivity and economic growth. Handbook of Agricultural Economics,
4, 3825-3866.
Gollin, D., Lagakos, D. & Waugh, M.E. 2014: The agricultural productivity gap. Quarterly Journal of
Economics, 129(2), 939-993.
Gollin, D., Lagakos, D., & Waugh, M. E. 2014. Agricultural productivity differences across countries.
The American Economic Review, 104(5), 165-170.
Gouse, M., Sengupta, D., Zambrano, P., & Zepeda, J. F. 2016. Genetically modified maize: Less
drudgery for her, more maize for him? Evidence from smallholder maize farmers in South Africa.
World Development, 83, 27-38.
Grabowski, P.P., & Kerr, J.M. 2014. Resource constraints and partial adoption of conservation
agriculture by hand-hoe farmers in Mozambique. International Journal of Agricultural
Sustainability, 12(1), 37-53.
Greyling, J.C. 2012. The role of the agricultural sector in the South African economy. Unpublished
Master’s thesis. University of Stellenbosch.
Grindling, T. & Newhouse, D. 2014. Self-employment in the developing world. World Development,
56, 313-331.
Gu, J., Zhang, C., Vaz, A. & Mukwereza, L. 2016. Chinese state capitalism? Rethinking the role of the
state and business in Chinese development cooperation in Africa. World Development, 81, 24-
34.
Guba, E.G. & Lincoln, Y.S. 2005. Paradigmatic controversies, contradictions, and emerging
confluences. In N.K Denzin & Y.S. Lincoln (eds.) The Sage handbook of qualitative research
3rd Edition. Thousand Oaks: Sage, 191-215.
Guetterman, T.C. 2015. Descriptions of sampling practices within five approaches to qualitative
research in education and the health sciences. Forum: Qualitative Social Research, 16(2), 1-
34.
© Central University of Technology, Free State
177 | P a g e
Hair, J.F., Anderson, R.E., Tatham, R.L. & Black, W.C. 2008. Multivariate Data Analysis. 7th Edition.
Prentice Hall Publisher, Upper Saddle River, New Jersey.
Hall, B.H. 2014. Does patent protection help or hinder technology transfer. Intellectual property for
Economic Development, 11-32.
Hämäläinen, R., De Wever, B., Malin, A. & Cincinnato, S. 2015. Education and working life: VET adults'
problem-solving skills in technology-rich environments. Computers & Education, 88, 38-47.
Hart, T., Jacobs, P., Ramoroka, K., Mhula-Links, A. & Letty, B. 2016. Innovation and the development
nexus: prospects from rural enterprises in South Africa. Africanus: Journal of Development
Studies, 45(1), 1-9.
Hayami, Y. & Yamada, S. 1969. Agricultural productivity at the beginning of the industrialisation in K.
Ohkawa, B. Johnston, & H. Kaneda (eds.), Agriculture and economic growth: Japan’s
experience, Tokyo: University of Tokyo Press, 109-135.
Henderson, R.M. & Clark. K.B. Architectural innovation: The reconfiguration of existing product
technologies and the failure of established firms. Administrative Science Quarterly, 35, 9-30.
Henry, M., Kneller, R. & Milner, C. 2009. Trade, technology transfer and national efficiency in
developing countries. European Economic Review, 53(2), 237-254.
Hermans, F., Stuiver, M., Beers, P. J. & Kok, K. 2013. The distribution of roles and functions for
upscaling and outscaling innovations in agricultural innovation systems. Agricultural Systems,
115, 117–128
Hichaambwa, M., Sitko, N. & Chamberlin, J. 2014. Does Land Titling Increase Smallholder Agricultural
Productivity in Zambia? Indaba Agricultural Policy Research Institute, 63, 1-5. [Online].
Available: http://fsg.afre.msu.edu/zambia/ps_63.pdf 2017, November 06].
Hoffmann, V., Probst, K. & Christinck, A. 2007. Farmers and researchers: How can collaborative
advantages be created in participatory research and technology development? Agriculture and
human values, 24(3), 355-368.
Hornung, E. 2014. Immigration and the diffusion of technology: The Huguenot diaspora in Prussia. The
American Economic Review, 104(1), 84-122.
Hottenrott, H., Lopes-Bento, C. & Veugelers, R. 2015. Direct and cross-scheme effects in a research
and development subsidy program. [Online]. Available:
https://papers.ssrn.com/sol3/papers.cfm?abstract_id=2555454 [2017, November 12]
Howell, K.E. 2013. An introduction to the philosophy of methodology. Thousand Oaks, CA: Sage
Publications.
© Central University of Technology, Free State
178 | P a g e
Hung, K. P. & Chou, C. 2013. The impact of open innovation on firm performance: The moderating
effects of internal R&D and environmental turbulence. Technovation, 33(10), 368-380.
Hurley, T.M., Pardey, P.G. & Rao, X. 2014. Returns to food and agricultural R&D Investments
worldwide, 1958-2011. InSTePP Brief. St. Paul, MN: International Science & Technology
Practice & Policy, November 2014. [Online]. Available:
https://ageconsearch.umn.edu/record/159649/files/HurleyEtAlR2014.pdf [2017, November 06].
Hussain I. & Hanjra. M. 2004. Irrigation and poverty alleviation: Review of the empirical evidence.
Irrigation and Drainage, 53(1), 1-15.
Hussain, A.Z., Talukder, M.Q.K. & Ahmed, T. 2015. Nutrition background paper to inform the
preparation of the 7th five year plan. Dhaka: Planning Commission, Ministry of Planning
Bangladesh. [Online]. Available: http://www.plancomm.gov.bd/wp-
content/uploads/2015/02/23_FINAL-Nutrition-Background-Paper-for-7th-Five-Year-Plan-_-23-
Feb-2015.pdf [2017, November 06].
Ito, T., Kaneta, T. & Sundstrom, S. 2016. Does university entrepreneurship work in Japan? A
comparison of industry-university research funding and technology transfer activities between
the UK and Japan. Journal of Innovation an Entrepreneurship, 5(8), 1-21.
Iwasaki, I. & Tokunaga, M. 2016. Technology transfer and spillovers from FDI in transition economies:
A meta-analysis. Journal of Comparative Economics, 44(4), 1086-1114.
Jiang, L., Deng, X. & Seto, K.C. 2013. The impact of urban expansion on agricultural land use intensity
in China. Land Use Policy, 35, 33-39
Juma, C. 2015. The new harvest: agricultural innovation in Africa. Oxford University Press.
Kafetzopoulos, D., Gotzamani, K. & Gkana, V. 2015. Relationship between quality management,
innovation and competitiveness. Evidence from Greek companies. Journal of Manufacturing
Technology Management, 26(8), 1177-1200.
Kamoyo, M. & Chidoko, C. 2013. International trade, technology transfer and firm competitiveness:
The case of Zimbabwe exporting and non-exporting firms. Greener Journal of Business and
Management Business Studies, 3(1), 46-53.
Kang, Y. Khan, S. & Ma, X. 2009. Climate change impacts on crop yield, crop water productivity and
food security – A review. Progress in Natural Science, 19(12), 1665-1674.
Kanyane, M.H. 2006. Conflict of interest in South Africa: A comparative case study. Unpublished
doctoral dissertation. University of Pretoria.
Kanyenze, G., Chitambara, P. & Tyson, J. 2017. The outlook for the Zimbabwean economy. Supporting
economic transformation. [Online]. Available: http://set.odi.org/wp-
© Central University of Technology, Free State

179 | P a g e
content/uploads/2017/08/SET-Outlook-for-Zimbabwe-Economy_Sep2017.pdf 2017, November
06].
Katzy, B., Turgut, E., Holzmann, T. & Sailer, K. 2013. Innovation intermediaries: a process view on
open innovation coordination. Technology Analysis & Strategic Management, 25(3), 295-309.
Kaushik, A., Kumar, S., Luthra, S. & Haleem, A. 2014. Technology transfer: enablers and barriers–a
review. International Journal of Technology, Policy and Management, 14(2), 133-159.
Kearney, A.T. 2016. Foreign direct investment confidence index. FDI on the rebound? Despite stalling
globalisation, business executive are turning to FDI for growth opportunities. [Online]. Available:
https://www.atkearney.com/documents/10192/8064626/2016+A.T.+Kearney+Foreign+Direct+I
nvestment+Confidence+Index%E2%80%93FDI+on+the+Rebound.pdf/e61ec054-3923-4f96-
b46c-d4b4227e7606 [2017, November 12].
Khan, M.H. 1995. State failure in week states: A critiques of new institutionalist explanations, In J.
Harris, J. Hunter and C.M. Lewis (eds) The new institutional economic and third world
development, London and new York, NY: Routledge, 71-76.
Khapayi M. & Celliers P.R. 2016. Factors limiting and preventing emerging farmers to progress to
commercial agricultural farming in the King William's Town area of the Eastern Cape Province,
South Africa. South African Journal of Agricultural Extension, 44(1), 1-19.
Kilelu, C.W. 2013. Unravelling the role of innovation intermediaries in smallholder agricultural
development: Case studies from Kenya. Unpublished doctoral dissertation Wageningen
University and Research Centre.
Kilelu, C.W., Klerkx, L. & Leeuwis, C. 2013. Unravelling the role of innovation platforms in supporting
co-evolution of innovation: Contributions and tensions in a smallholder dairy development
programme. Agricultural Systems, 118, 65-77
Kilic, T., Palacios-López, A. & Goldstein, M. 2015. Caught in a productivity trap: A distributional
perspective on gender differences in Malawian agriculture. World Development, 70,416-463.
Kimura, S. & Sauer, J. 2015. Dynamics of dairy farm productivity growth: Cross-country
comparison No. 87. OECD Publishing. [Online]. Available: http://www.oecd-
ilibrary.org/docserver/download/5jrw8ffbzf7l-
en.pdf?expires=1509938415&id=id&accname=guest&checksum=E1FAAF27A978C9DECEF2
91738F5314E4 [2017, November 02].
King, A. 2017 A technological revolution in farming led by advances in robotics and sensing
technologies looks set to disrupt modern practice. [Online]. Available:
http://www.readcube.com/articles/10.1038/544S21a [2017, November 12].
© Central University of Technology, Free State
180 | P a g e
Klewitz, J. & Hansen, E.G. 2014. Sustainability-oriented innovation of SMMEs: A systematic review.
Journal of Cleaner Production, 65, 57-75.
Kloppers, H.J. & Pienaar, G.J. 2014. The historical context of land reform in South Africa and early
policies. Potchefstroomse Elektroniese Regsblad, 17(2), 676-707.
Klümper, W. & Qaim, M. 2014. A meta-analysis of the impacts of genetically modified crops. Plos One,
9(11), 1-2.
Kogut, B. & Zander, U. 1993. Knowledge of the firm and the evolutionary theory of the multinational
corporation. Journal of International Business Studies, 24(4), 625-645.
Kormos, C. & Gifford, R. 2014. The validity of self-report measures of proenvironmental behaviour: A
meta-analytic review. Journal of Environmental Psychology, 40, 359-371.
Kraucunas, I., Clarke, L., Dirks, J., Hathaway, J., Hejazi, M., Hibbard, K. & Leung, R. 2015.
Investigating the nexus of climate, energy, water, and land at decision-relevant scales: The
platform for regional integrated modelling and analysis. Climatic Change, 129(3-4), 573-588
Kritikos, A.S. 2014. Entrepreneurs and their impact on jobs and economic growth. IZA World of Labour,
8, 1-10
Kumar, S., Luthra, S. & Haleem, A. 2015. Benchmarking supply chains by analysing technology
transfer critical barriers using AHP approach. Benchmarking: An International Journal, 22(4),
538-558.
Kuratko, D.F, 2009. Entrepreneurship: Theory, process and practice. 9th Edition. Mason, South
Western Cengage Learning.
Laible, G., Wei, J. & Wagner, S. 2015. Improving livestock for agriculture–technological progress from
random transgenesis to precision genome editing heralds a new era. Biotechnology Journal,
10(1), 109-120.
Lamprinopoulou, C., Renwick, A., Klerkx, L., Hermans, F. & Roep, D. 2014. Application of an
integrated systemic framework for analysing agricultural innovation systems and informing
innovation policies: Comparing the Dutch and Scottish agrifood sectors. Agricultural Systems,
Vol. 129(1), 40-54.
Läpple, D., Renwick, A. & Thorne, F. 2015. Measuring and understanding the drivers of agricultural
innovation: Evidence from Ireland. Food Policy, 51, 1-8.
Latruffe, L. 2010. Competitiveness, productivity and efficiency in the agricultural and agri-food sectors,
oecd food, agriculture and fisheries working papers, No. 30, OECD Publishing. [Online].
Available: http://prodinra.inra.fr/ft?id=3A5BC298-6056-4530-B66F-182E8D2E5D3B [2017
November 06].
© Central University of Technology, Free State
181 | P a g e
Lee, N., Sameen, H. & Cowling, M. 2015. Access to finance for innovative SMMEs since the financial
crisis. Research Policy, 44(2), 370-373.
Leedy, P.D. & Ormrod, J.E. 2005. Practical research: planning and design. Upper Saddle River, N.J.:
Prentice Hall.
Leedy, P.D. & Ormrod, J.E. 2010. Practical research: Planning and design. 9th Edition. New Jersey:
Pearson.
Levidow, L., Zaccaria, D., Maia, R., Vivas, E., Todorovic, M. & Scardigno, A. 2014. Improving water-
efficient irrigation: Prospects and difficulties of innovative practices. Agricultural Water
Management, 146, 84-94.
Liebenberg, F. and Pardey, P.G. 2010. South African Agricultural Production and Productivity
Patterns. In: Alston, J., Babcock, B. and Pardey, P. (eds.), the shifting patterns of agricultural
production and productivity worldwide. [Online]. Available:
https://www.card.iastate.edu/products/books/shifting_patterns/pdfs/chapter13.pdf [2017,
November 13].
Lin, Y. & Rasiah, R. 2014. Human capital flows in Taiwan’s technological catch up in integrated circuit
manufacturing. Journal of Contemporary Asia, 44(1), 64-83.
Lipper, L., Thornton, P. & Campbell, B.M. 2014. Climate smart agriculture for food security. Nature
Climate Change, 4, 1068-1072.
Lixia, T.,Yan, L., Wenjie, Z., Mukwereza, L. & Xiaoyun, L. 2015. Blurring the lines between aid and
business in the agricultural technology demonstration centre in Zimbabwe. [online]. available:
https://opendocs.ids.ac.uk/opendocs/bitstream/handle/123456789/7097/fac_working_paper_1
29.pdf?sequence=1&isallowed=y [2017, November 10].
Loevinsohn, M., Sumberg, J., Diagne, A. & Whitfield, S. 2013. Under what circumstances and
conditions does adoption of technology result in increased agricultural productivity? A
systematic review. [Online]. Available: http://www.3ieimpact.org/en/evidence/systematic-
reviews/details/248/ [2017, November 06].
Long, T., Blok, V. & Coninx, I. 2016. Barriers to the adaption and diffusion of technology innovation for
climate-smart agriculture in Europe: Evidence from the Netherlands, France, Switzerland and
Italy. Journal of Cleaner Production, 112, 9-12.
Longo, S.B., Clark, B., Shriver T.E. & Clausen, R. 2016. Sustainability and environmental
sociology: putting the economy in its place and moving toward an integrative socio -ecology.
Sustainability, 8(5), 437-468.
© Central University of Technology, Free State
182 | P a g e
Lööf, H. & Heshmati, A. 2006. On the relationship between innovation and performance: A sensitivity
analysis. Economics of Innovation and New Technology, 15(4-5), 317-344.
Lora, R.S. 2012. Brazilian agriculture in figures. [Online]. Available:
http://www.maff.go.jp/primaff/meeting/kaisai/pdf/brazil_sep2012sec.pdf 2017, November 06].
Louw, A. 2007. Agribusiness Issues. Working paper for ABSA Agribusiness Chair, Department of
Agricultural Economics and Rural Development, University of Pretoria.
Louw, A., Nhemachena, C. & Van Zyl, S. 2008. Re-governing Markets: Agribusiness linkages in the
Southern African region: Small farmer participation. Policy Brief 2, Department of Agricultural
Economics, Extension and Rural Development, University of Pretoria
Lunogelo, B.H. & Baregu, S. 2013. Indo –Africa relationship: Opportunities for technology transfer
between India and African countries. [Online]. Available: http://esrf.or.tz/docs/DiscussionPaper-
52.pdf [2017, November 10].
Luthra, S., Kumar, S., Garg, D. & Haleem, A. 2015. Barriers to renewable/sustainable energy
technologies adoption: Indian perspective. Renewable and Sustainable Energy Reviews, 41,
762-776.
Lybbert, T., Saxena, K., Ecuru, J., Kawooya, D. & Wunsch-Vincent, S. 2017. In In S. Dutta, B. Lanvin
& S. Wunsch-Vincent (Editors), The Global Innovation Index 2017: Enhancing Innovation in the
Ugandan Agri-Food Sector: Progress, Constraints, and Possibilities (pp. 151-158).
Fontainebleau, Ithaca & Geneva. Cornell University, INSEAD and WIPO.
Macheka, L., Manditsera, F.A., Ngadze, R.T., Mubaiwa, J., & Nyanga, L.K. 2013. Barriers, benefits
and motivation factors for the implementation of food safety management system in the food
sector in Harare Province, Zimbabwe. Food Control, 34(1), 126-131.
Machila, M., Lyne, M. & Nuthall, P. 2016. Impacts of a donor-funded extension service on small farmers
in the Mutasa district of Zimbabwe. [Online]. Available:
https://www.researchgate.net/publication/277923932_Impacts_of_a_donor-
funded_extension_service_on_small_farmers_in_the_Mutasa_district_of_Zimbabwe. [2017,
November 06].
Machila, M., Lyne, M. & Nuthall, P.L. 2015. Assessment of an outsourced agricultural extension service
in the Mutasa district of Zimbabwe. Journal of Agricultural Extension and Rural Development,
7(5), 142-149.
Mafongoya, P., Rusinamhodzi, L., Siziba, S., Thierfelder, C., Mvumi, B.M., Nhau, B., Hove, L.&
Chivenge, P. 2016. Maize productivity and profitability in Conservation Agriculture systems
© Central University of Technology, Free State
183 | P a g e
across agro-ecological regions in Zimbabwe: a review of knowledge and practice. Agriculture,
Ecosystems and Environment, 220, 211–225.
Maghsoudi, S., Duffield, C. & Wilson, D. 2015. Innovation evaluation: past and current models and a
framework for infrastructure projects. International Journal of Innovation Science, 7(4), 281-297.
Maiga, E., Christiaensen, L. & Palacios-Lopez, A. 2017. Is African Youth Exiting Agriculture en Masse?
World Bank: mimeographed.
Maiyaki, A.A. 2010. Zimbabwe’s agricultural industry. African Journal of Business Management, 4(19),
4159-4166.
Makanyeza, C. & Dzvuke, G. 2015. The influence of innovation on the performance of small and
medium enterprises in Zimbabwe. Journal of African Business, 16(1-2), 198-214.
Makate, C., Siziba, S., Hanyani-Mlambo, B. T., Sadomba, Z. & Mango, N. 2016. The efficiency of small
and medium enterprises in informal metal manufacturing in Zimbabwe: Implications for
stakeholders in the agricultural sector. Development Southern Africa, 33(2), 247-257.
Makate, C., Wang, R., Makate, M. & Mango, N. 2016. Crop diversification and livelihoods of
smallholder farmers in Zimbabwe: adaptive management for environmental change.
Springerplus, 5(1), 1-17.
Makunike, B. 2014. Land reform and poverty alleviation in Mashonaland East, Zimbabwe. Unpublished
doctoral dissertation. University of the Free State.
Malele, V., Mpofu, K. & Muchie, M. 2017. A University-Sponsored Student Business Venture Model
for Bridging the Entrepreneurial and Innovation Chasm. Unpublished paper presented at the 1st
International conference on entrepreneurship development (ICED) 5-7 April, Bloemfontein.
Mango, N., Mapemba, L., Tchale, H., Makate, C., Dunjana, N. & Lundy, M. 2015. Comparative analysis
of tomato value chain competitiveness in selected areas of Malawi and Mozambique. Cogent
Economics & Finance, 3(1), 1-38.
Manyati, T. 2014. Agro-based technological innovation: A critical analysis of the determinants of
innovation in the informal sector in Harare, Zimbabwe. African Journal of Science, Technology,
Innovation and Development, 6(6), 553-561.
Marais, H. 2012. A Multi-methodological framework for the design and evaluation of complex research
projects and reports in business and management studies. Electronic Journal of Business
Research Methods, 10(2), 64-76.
Maree, K. & Pietersen, J. 2016. Surveys and the use of questionnaires, in K. Maree (ed.). First steps
in research. Pretoria: Van Schaik. 173-189.
© Central University of Technology, Free State
184 | P a g e
Martínez-Mesa, J., González-Chica, D.A., Duquia, R.P., Renan Rangel Bonamigo, R.R. & Bastos, J.L.
2016. Sampling: How to select participants in my research study? Anais Brasileiros De
Dermatologia, 91(3), 326-330.
Mashingaidze, N., Belder, P., Twomlow, S., Hove, L. & Moyo, M. 2013. Improving maize (Zea mays
L.) performance in semi-arid Zimbabwe through micro-dosing with ammonium nitrate tablets.
Experimental Agriculture, 49(2), 179-196.
Masinde, M. 2015. An innovative drought early warning system for Sub-Saharan Africa: Integrating
modern and indigenous approaches. African Journal of Science, Technology, Innovation and
Development, 7(1), 8-25.
Masum, H., Lackman, R. & Bartleson, K. 2013. Developing global health technology standards: what
can other industries teach us? Global Health, 9(49), 1-24.
Masunda, F. 2014. Assessing the impact of sustainable farming techniques on smallholder farm
enterprises in Zimbabwe. Masters thesis. Stellenbosch University.
Masutha, M., & Rogerson, C. M. 2014. Small business incubators: An emerging phenomenon in South
Africa's SMME economy. Bulletin of Geography. Socio–economic Series, 26, 141–155.
Mateso, P.E. 2014. Technology transfer: The concepts, practices, and lessons for Tanzania and its
TVET system. Unpublished paper presented at the VET forum. 10-11 December, Tanzania.
McMillan, M., Rodrik, D, & Verduzco-Gallo I. 2014. Globalization, structural change, and productivity
growth, with an update on Africa, in World Development, 63, 11-32.
Mehar, M., Mittal, S. & Prasad, N. 2016. Farmers coping strategies for climate shock: Is it differentiated
by gender? Journal of Rural Studies, 44, 123-131.
Mehra, R. & Rojas, M.H. 2008. Women, food security and agriculture in a global marketplace.
International Centre for Research on Women (ICRW). [Online]. Available:
http://indiaenvironmentportal.org.in/files/ICRW_Apr2010.pdf [2017, November 06].
Meijer, S.S., Catacutan, D., Ajayi, O.C., Sileshi, G.W. & Nieuwenhuis, M. 2015. The role of knowledge,
attitudes and perceptions in the uptake of agricultural and agroforestry innovations among
smallholder farmers in sub-Saharan Africa. International Journal of Agricultural Sustainability,
13(1), 40-54.
Merriam, S.B. 2009. Qualitative research: A guide to design and implementation. San Francisco: John
Wiley and Sons.
Mitra, A., Sharma, C. & Véganzonès-Varoudakis, M.A. 2014. Trade liberalisation, technology transfer,
and firms’ productive performance: The case of Indian manufacturing. Journal of Asian
Economics, 33, 1-15.
© Central University of Technology, Free State
185 | P a g e
Mohnen, P. & Hall, B.H. 2013. Innovation and productivity: An update. Eurasian Business Review,
3(1), 47-65.
Moyo, M 2014. Effectiveneness of a contract farming arrangement: A case study of tobacco farmers
in Mazowe district in Zimbabwe. Unpublished master’s thesis. Stellenbosch University.
Moyo, N., Maharaj, P., & Mambondiani, L. 2017. Food challenges facing people living with HIV/AIDS
in Zimbabwe. African Journal of AIDS Research, 16(3), 225-230.
Mullen, J. & Keogh, M. 2013, February. The future productivity and competitiveness challenge for
Australian agriculture. Unpublished paper prepared for presentation at the 57th Australian
Agricultural & Resources Economic Society (AARES) Annual Conference, 5-8 February,
Sydney
Munemo, J. 2013. Examining imports of capital goods from China as a channel for technology transfer
and growth in Sub-Saharan Africa. Journal of African Business, 14(2), 106-116.
Mungai, A.N. 2015. A framework for investigating the potential to explore new markets in smallholder
farmers in Kenya’s Kiambu West District. Unpublished doctoral dissertation. The University of
Queensland.
Mutopo, P. & Chiweshe, M. 2014. Large-scale land deals, global capital and the politics of livelihoods:
Experiences of women small-holder farmers in Chisumbanje, Zimbabwe. International Journal
of African Renaissance Studies-Multi-, Inter-and Transdisciplinarity, 9(1), 84-99.
Mutsvangwa-Sammie, E.P., Manzungu, E. & Siziba, S. 2016. Profiles of innovators in a semi-arid
smallholder agricultural environment in South West Zimbabwe. Physics and Chemistry of the
Earth, Parts A/B/C, 100, 325-335.
Mwiturubani, D.A. & van Wyk, J.A. 2010. Climate change and natural resources conflicts in Africa.
[Online]. Available: https://issafrica.s3.amazonaws.com/site/uploads/Mono170.pdf [2017,
November 05].
National institute of food and agriculture. 2017. Nifa.usda.gov. [Online]. Available:
https://nifa.usda.gov/government-agencies-and-programs-promoting-public-private-
technology-transfer. [2017, October 30].
Ndour, C.T. 2017. Effects of human capital on agricultural productivity in Senegal. World Scientific
News, 64, 34-43.
Nelsen, L. 2016. Technology transfer in US universities and research institutions. University
technology transfer: The globalisation of academic innovation. Abingdon: Routledge.
© Central University of Technology, Free State
186 | P a g e
Nepelski, D. & De Prato, G. 2015. International technology sourcing between a developing country and
the rest of the world. A case study of China. Technovation, 35, 12-21.
Nesamvuni, A.E., Tshikolomo, K.A., Mpandeli, N.S. & Makhuvha, L. 2017. Perceptions of smallholder
farmers on determinants of competitiveness of the citrus industry in Vhembe District, Limpopo
Province, South Africa. Journal of Human Ecology, 59(2-3), 62-71.
New Partnership for Africa’s Development (NEPAD). 2014. Agriculture in Africa: Transformation and
outlook, [Online]. Available: www.nepad.org/system/files/Agriculture%20in%20Africa.pdf [2017,
November 10].
Nezomba, H., Mtambanengwe, F., Tittonell, P. & Mapfumo, P. 2015. Point of no return? Rehabilitating
degraded soils for increased crop productivity on smallholder farms in eastern Zimbabwe.
Geoderma, 239, 143-155.
Ngie, A. 2016. An investigation into the potential application of multi-and hyperspectral remote sensing
for the spectral characterisation of maize cultivars, quantification of some stress factors, and
yield prediction in the Free State province of South Africa. Unpublished doctoral dissertation.
University of Johannesburg.
Nhundu, K. & Mushunje, A. 2010. Analysis of irrigation development post fast track land reform
programme. A Case Study of Goromonzi District, Mashonaland East Province, Zimbabwe.
Unpublished paper presented at the Joint 3rd African Association of Agricultural Economists
(AAAE) and 48th Agricultural Economists Association of South Africa (AEASA) Conference. 19-
23 September, Cape Town.
Njeru, G.R.N. 2016. Peasant transformation in Kenya: A focus on agricultural entrepreneurship with
special reference to improved fruit and dairy farming in Mbeere, Embu County. Unpublished
doctoral dissertation. University of Nairobi.
Nkala, I. 2017. Zimbabwe’s command agriculture initiative: Maize production woes. FarmBiz, 3(6), 18-
19.
Noltze, M., Schwarze, S. & Qaim, M. 2013. Impacts of natural resource management technologies on
agricultural yield and household income: The system of rice intensification in Timor Leste.
Ecological Economics, 85, 59-68.
Nowak, N. & Kijek, T. 2017 The effect of human capital on labour productivity of farms in Poland.
Studies in Agricultural Economics, 118, 16-21.
Nunn, N., Qian, N. & Sequeira, S. 2017. Migrants and the making of America: The short- and long-run
effects of immigration during the age of mass migration. [Online]. Available:
© Central University of Technology, Free State
187 | P a g e
https://scholar.harvard.edu/files/nunn/files/nunn_qian_sequeira_immigrants.pdf [2017,
November 12].
Nworu, O.C. 2017. Export: Improving Nigerian government revenue base and economic
diversification, Human Resource Management Research, 7(1), 65-73.
Nyamangara, J., Masvaya, E.N., Tirivavi, R., Nyengerai, K., 2013. Effect of hand-hoe based
conservation agriculture on soil fertility and maize yield in selected smallholder areas in
Zimbabwe. Soil and Tillage Research - Journal, 126, 19-25.
Obi, O.F. & Nwakaire, J.N. 2014: Repositioning agricultural development in Africa through appropriate
technology transfer. African Journal of Science, Technology, Innovation and Development, 6(1),
45-50.
Ockwell, D. & Byrne, R. 2017. Sustainable energy for all. London: Routledge.
Ockwell, D., Sagar, A. & de Coninck, H. 2015. Collaborative research and development (R&D) for
climate technology transfer and uptake in developing countries: towards a needs driven
approach. Climatic change, 131(3), 401-415.
Okanga, B. 2017, Small- and medium-sized enterprises’ knowledge management systems as edifiers
of new value innovations. South African Journal of Information Management, 19(1), 1-11.
Okudoh, V.I., Trois, C., Workneh, T.S., Schmidt, S. & Cibati, A. 2014. The potential of cassava biomass
for energy production in South Africa. Unpublished paper presented at the Fifth International
Symposium on Energy from Biomass and Waste, 17-20 November, Venice.
Olaoye, O.A. 2014. Potentials of the agro industry towards achieving food security in Nigeria and Other
Sub-Saharan African Countries. Journal of Food Security, 2(1), 33-41.
Ololube, N.P., Uriah, O.A. & Dudafa, U.J. 2014. The role of university management in sustainable
national development through innovation and entrepreneurial nosiness. International Journal of
Educational Foundations and Management, 2(1), 13-24.
Organisation for economic co-operation and development (OECD), 2017. Enhancing the contributions
of SMMEs in a global and digitalised economy [Online]. Available:
https://www.oecd.org/mcm/documents/C-MIN-2017-8-EN.pdf [2017, June 09].
Organisation for economic co-operation and development (OECD). 2013. Fostering productivity and
competitiveness in agriculture. [Online]. Available: http://www.oecd.org/publications/fostering-
productivity-and-competitiveness-in-agriculture-9789264166820-en.htm [2017, November 09].
Organisation for Economic Co-operation and Development (OECD). 2011. Fostering Productivity and
Competitiveness in Agriculture. OECD Publishing. [Online]. Available:
© Central University of Technology, Free State

188 | P a g e
http://www.oecd.org/publications/fostering-productivity-and-competitiveness-in-agriculture-
9789264166820-en.htm , [2017, November 07]
Parrado, R. & De Cian, E. 2014. Technology spillovers embodied in international trade: Intertemporal,
regional and sectoral effects in a global CGE framework. Energy Economics, 41, 76-89.
Parrotta, P., Pozzoli, D. & Pytlikova, M. 2014. The nexus between labour diversity and firm’s innovation.
Journal of Population Economics, 27(2), 303-364.
Paulin, D. & Suneson, K. 2012. Knowledge transfer, knowledge sharing and knowledge barriers –
three blurry terms in KM. The Electronic Journal of Knowledge Management, 10(1), 81-91.
Pedzisa, T., Rugube, L., Winter-Nelson, A., Baylis, K. & Mazvimavi, K. 2015. Abandonment of
conservation agriculture by smallholder farmers in Zimbabwe. Journal of Sustainable
Development, 8(1), 69-82.
Phillips, R.G. 2002. Technology business incubators: How effective as technology transfer
mechanisms? Elsevier, 24, 299-316.
Pienaar, J.M. 2015. Land reform embedded in the constitution: Legal contextualisation. Scriptura,
114(1), 1-20.
Pinget, A., Bocquet, R. Mothe, C. 2015. Barriers to environmental innovation in SMMEs: Empirical
evidence from French firms. Management, 18(2), 132-155.
Portela, C. 2016. Are European union sanctions “targeted?” Cambridge Review of International Affairs,
29(3), 912-929.
Posadas-Domínguez, R.R., Arriaga-Jordán, C.M. & Martínez-Castañeda, F.E. 2014. Contribution of
family labour to the profitability and competitiveness of small-scale dairy production systems in
central Mexico. Tropical animal health and production, 46(1), 235-240.
Prepletaný, D. 2013. The impact of digital technologies on innovations in retail business models.
Unpublished master’s thesis. Aalborg University.
President’s congress report. 2016. Agriculture competitiveness in Zimbabwe. [Online]. Available:
http://www.cfuzim.org/~cfuzimb/images/president2016.pdf [2017, November 10].
Qaim, M. & Kouser, S. 2013. Genetically modified crops and food security. PloS one, 8(6), 1-16.
Radosevic, S. (1999). International Technology Transfer and Catch-up in Economic Development
Cheltenham: Edward Elgar.
Ragasa, C., Berhane, G., Tadesse, F. & Taffesse, A.S., 2013. Quality matters and not quantity:
Evidence on productivity impacts of extension service provision in Ethiopia, in: 2013 annual
meeting, August 4-6, 2013, Washington, DC. Agricultural and applied economics association.
© Central University of Technology, Free State

189 | P a g e
Ramaila, M., Mahlangu, S. & Du Toit, D. 2011. Agricultural productivity in South Africa: Literature
review. Pretoria: Directorate Economic Service Production Economics Unit. [Online]. Available:
http://www.daff.gov.za/docs/genreports/agricproductivity.pdf [2017, November 13].
Reddy, K.S. 2015. The state of case study approach in mergers and acquisitions literature: A
bibliometric analysis. Future Business Journal, 1(1-2), 13-34.
Reganold, J. & Wachter, J. 2016. Organic agriculture in the twenty-first century. Nature Plants, 2(2),
1-2.
Renwick, A., Läpple, D., O’Malley, A. & Thorne, F. 2014. Innovation in the Irish agrifood sector. 1-16).
[Online]. Available: www.ucd.ie/t4cms/BOI_Innovation_report.pdf [2017, November 12]
Robinson, J. 2013. The accumulation of capital. Palgrave Macmillan.
Rockefeller Foundation. 2017. Food lost and waste Africa. [Online]. Available:
https://www.dalberg.com/system/files/2017-
07/food%20loss%20quarterly%20vol9.pdf [2017, November 12].
Rodrik, D. 2014. The past, present, and future of economic growth. Challenge, 57(3), 5-39.
Rogers, E.M. 1962. Diffusion of innovations. New York: Free Press of Glencoe.
Roos, G. 2016. Design-Based Innovation for Manufacturing Firm Success in High-Cost Operating
Environments. Spring, 2(1), 5-28.
Roothaert, R.L., & Magado, R. 2011. Revival of cassava production in Nakasongola District, Uganda.
International Journal of Agricultural Sustainability, 9(1), 76-81.
Roothaert, R.L., Ssalongo, S. & Fulgensio, J. 2011. The Rakai chicken model: An approach that has
improved fortunes for Ugandan farmers. International Journal of Agricultural Sustainability, 9(1),
222-231.
Rubera, G. & Kirca, A.H. 2012. Firm innovativeness and its performance outcomes: A meta-analytic
review and theoretical integration. Journal of Marketing, 76(3), 130-147.
Rubin, A. & Babbie, E.R. 2016. Empowerment series: Essential research methods for social work. 4th
Edition. United States: Wadsworth Cengage Learning.
Rupf, G.V., Bahri, P.A., de Boer, K. & McHenry, M.P. 2015. Barriers and opportunities of biogas
dissemination in Sub-Saharan Africa and lessons learned from Rwanda, Tanzania, China, India,
and Nepal. Renewable and Sustainable Energy Reviews, 52, 468-476.
Sachikonye, L.M. 2003. The situation of commercial farm workers after land reform in Zimbabwe.
[Online]. Available:
http://citeseerx.ist.psu.edu/viewdoc/download?doi=10.1.1.590.2155&rep=rep1&type=pdf
[2017, November 06].
© Central University of Technology, Free State

190 | P a g e
Sahan, E. & Mikhail, M. 2012. Private Investment in Agriculture: Why it's essential, and what's needed
[Online]. Available: https://oxfam.ca/sites/default/files/dp-private-investment-in-agriculture-
250912-en.pdf 2017, November 06].
Sampath, P.G. 2015. Industrial development for Africa: trade, Technology and the role of the state.
African Journal of Science, Technology, Innovation and Development, 6(5), 438-453.
Santacreu, A.M. 2015. Innovation, diffusion, and trade: Theory and measurement. Journal of Monetary
Economics, 75, 1-20.
Sanyang, S, Pyburn R, Mur R, Audet-Bélanger G, (Eds). 2014. Against the grain ad to the roots. Maize
and Cassava Innovation Platforms in West and Central Africa. CORAF/WECARDDakar and
Amsterdam: KIT Publishers
Sasmal, J. 2016. Technological change and productivity growth in agriculture. In: Resources,
Technology and Sustainability. India Studies in Business and Economics. Springer,
Singapore.
Sasson, A. 2012. Food security for Africa: An urgent global challenge. Agriculture & Food Security,
1(2), 1-26.
SATNET. 2017. Satnetasia.org. [Online]. Available:
http://www.satnetasia.org/sites/default/files/satnet_asia_outcome_summary_may2015.pdf
2017, November 06].
Saunders, M., Lewis, P & Thornhill, A. 2013. Research Methods for Business Students. 6th Edition.
Cape Town: Pearson Education.
Saunders, M., Lewis, P. & Thornhill, A. 2009. Research Methods for Business Students. 5th Edition,
Prentice Hall.
Savastano, S. & Scandizzo, P.L. 2017. Farm size and productivity a “direct-inverse-direct” relationship
World Bank group. . [Online]. Available:
https://openknowledge.worldbank.org/bitstream/handle/10986/27630/WPS8127.pdf?sequence
=1&isAllowed=y [2017, November 10].
Schirmer, S. 2015. Re-thinking agricultural development in South Africa: Black commercial farmers in
the nineteenth and twentieth centuries. African Historical Review, 47(1), 48-75.
Schumpeter, J. 1942. Capitalism, socialism, and democracy. New York: Harper & Row.
Schut, M., Klerkx, L., Rodenburg, J., Kayeke, J., Raboanarielina, C., Hinnou, L.C., Adegbola, P.Y., van
Ast, A. and Bastiaans, L. 2015. RAAIS: rapid Appraisal of Agricultural Innovation Systems (Part
I). A diagnostic tool for integrated analysis of complex problems and innovation capacity.
Agricultural Systems, 132, 1-11.
© Central University of Technology, Free State

191 | P a g e
Schut, M., Klerkx, L., Sartas, M., Lamers, D., Mc Campbell, M., Ogbonna, I., & Leeuwis, C. 2016.
Innovation platforms: Experiences with their institutional embedding in agricultural research for
development. Experimental Agriculture, 52(4), 537-561.
Schut, M., Rodenburg, J., Klerkx, L., Kayeke, J., van Ast, A. & Bastiaans, L. 2015. RAAIS: rapid
appraisal of agricultural innovation systems (Part II). Integrated analysis of parasitic weed
problems in rice in Tanzania. Agricultural Systems, 132(2015), 12–24.
Schut, M., Rodenburg, J., Klerkx, L., van Ast, A. & Bastiaans, L. 2014 Systems approaches to
innovation in crop protection. A systematic literature review. Crop Protection, 56, 98-108.
Scoones, I., Mavedzenge, B., Murimbarimba, F. & Sukume, C. 2017. Tobacco, contract farming, and
agrarian change in Zimbabwe. Journal of Agrarian Change, 1-21.
Senyolo, M. P., Long, T. B., Blok, V. & Omta, O. 2017. How the characteristics of innovations impact
their adoption: An exploration of climate-smart agricultural innovations in South Africa. Journal
of Cleaner Production, 1-16.
Sharples, J. & Milham, N. 1990. Long run competitiveness of Australian agriculture. [Online]. Available:
https://ageconsearch.umn.edu/record/147996/files/faer243.pdf [2017, November 06].
Shiferaw, B. Tesfaye, K., Kassie, M., Abate, T., Prasanna, B.M. & Menkir, A. 2014. Managing
vulnerability to drought and enhancing livelihood resilience in Sub-Saharan Africa:
Technological, institutional and policy options. Weather and Climate Extremes, 3, 67-79.
Shiva, V. 2016. The violence of the green revolution: Third world agriculture, ecology, and politics.
University Press of Kentucky. [Online]. Available: https://muse.jhu.edu/book/44425 [2017,
November 06].
Sims, B. & Kienzle, J. 2016. Making mechanization accessible to smallholder farmers in Sub-Saharan
Africa. Environments, 3(11), 1-18.
Speelman, N. & Olifant, A. 2016. Lejweleputswa District Municipality: IDP review for 2016-2017, final
document. [Online]. Available: http://lejweleputswa.co.za/wp-content/uploads/2010/12/FINAL-
IDP-2016-2017-002.pdf [2017, November 10].
Spiegel, P., Mocollo, C. & Cady, J.M. 2016. Small-scale farmer innovation: How agricultural research
works together with farmers. [Online]. Available:
https://www.misereor.org/fileadmin//user_upload/misereor_org/Publications/englisch/dossier-
small-scale-farmer-innovation-2016.pdf [2017, November 12].
Spithoven, A., Clarysse, B. & Knockaert, M. 2011. Building absorptive capacity to organise inbound
open innovation in traditional industries. Technovation, 31(1), 10-21.
© Central University of Technology, Free State

192 | P a g e
Spithoven, A., Vanhaverbeke, W. & Roijakkers, N. 2013. Open innovation practices in SMMES and
large enterprises. Small Business Economics, 41(3), 537–562.
Springer, N.P. & Duchin, F. 2014. Feeding nine billion people sustainably: Conserving land and water
through shifting diets and changes in technologies. Environmental Science and Technology,
48(8), 4444–4451.
Sreejesh, S., Mohapatra, S. & Anusree, M. 2014. Business research methods. Berlin: Springer
International Publishing AG.
Stats SA, 2013. Agricultural Survey. Statistics South Africa, Pretoria. [Online]. Available:
http://www.statssa.gov.za/publications/P1101/P11012013.pdf [2017, April 03].
Steensland, A. 2016. Pathways to Agricultural Productivity and Nutrition. Global Agricultural
Productivity Report, 56-58.
Stone GD. 2011. Field versus farm in Warangal: Bt cotton, higher yields, and larger questions. World
Development, 39, 387-398.
Struik, P.C., Klerkx, L., van Huis, A. & Röling, N.G. 2014. Institutional change towards sustainable
agriculture in West Africa. International journal of agricultural sustainability, 12(3), 203-213.
Strydom, H. & De Vos, A.S. 2005. Sampling and sampling methods. In: De Vos, D. Developmental
Entrepreneurship (Ed). Research at grass roots: a primer for the caring profession. Pretoria,
South Africa: Van Schaik Publishers.
Sujan, M.H.K., Islam, F., Azad, M.J. & Rayhan, S.J. 2017. Financial profitability and resource use
efficiency of boro rice cultivation in some selected area of Bangladesh. African Journal of
Agricultural Research, 12(29), 2404-2411.
Sukume, C., Mavedzenge, B., Murimbarima, F. & Scoones, I. 2015. Space, markets and employment
in agricultural development: Zimbabwe country report. Institute for Poverty, Land and Agrarian
Studies, 1-4.
Syverson, C. 2011. What determines productivity? Journal of Economic Literature, 49(2), 326-365.
Szulanski, G. 1996. Exploring internal stickiness: impediments to the transfer of best practice within
the firm. Strategic Management Journal, 17, 27-43.
Takeshima, H., & Liverpool-Tasie, L. S. O. 2015. Fertilizer subsidies, political influence and local food
prices in sub-Saharan Africa: Evidence from Nigeria. Food Policy, 54, 11-24.
Tangermann, S. & Von Cramon-Taubade, S. 2013. Agricultural policy in the European Union - An
overview. [Online]. Available: Http://Diskussionsbeitrag-1302%20(1).Pdf [2017, November 05].
Tawodzera, G. 2010. Vulnerability and resilience in crisis: Urban household food insecurity in Epworth,
Harare, Zimbabwe. Unpublished doctoral dissertation, University of Cape Town, Cape Town.
© Central University of Technology, Free State
193 | P a g e
Tawodzera, G. 2014. Household Food Insecurity and Survival in Harare: 2008 and Beyond. Urban
Forum, 25:207–216.
Tey, Y.S. & Brindal, M. 2012. Factors influencing the adoption of precision agricultural technologies: a
review for policy implications. Precision Agriculture, 13(6), 713-730.
The Africa Competitiveness Report. 2015. World economic forum: Committed to improve the state of
the world. The world bank.
https://www.afdb.org/fileadmin/uploads/afdb/Documents/Publications/Africa_Competitiveness
_Report_2015.pdf
Thierfelder, C. & Wall, P.C. 2012. Effects of conservation agriculture on soil quality and productivity in
contrasting agro-ecological environments of Zimbabwe. Soil use and Management, 28 (2), 209-
220.
Thondhlana, G. 2015. Land acquisition for and local livelihood implications of biofuel development in
Zimbabwe. Land Use Policy, 49, 11-19.
Thornton, P.K. 2010. Livestock production: recent trends, future prospects. Philosophical Transactions
of the Royal Society of Biological Sciences, 365(1554), 2853-2867.
Tidd, J. & Bessant, J. 2014. Innovation and entrepreneurship. [Online]. Available:
http://sro.sussex.ac.uk/51678/ [2017, November 06].
Tilman, D., Balzer, C., Hill, J. & Befort, B.L. 2011. Global food demand and the sustainable
intensification of agriculture. Proceedings of the National Academy of Sciences, 108(50),
20260-20264.
Tittonell, P. & Giller, K. E. 2013. When yield gaps are poverty traps: The paradigm of ecological
intensification in African smallholder agriculture. Field Crops Research, 143, 76-90.
Toner, P. 2011. Workforce skills and innovation: An overview of major themes in the literature. [Online].
Available: https://www.oecd.org/innovation/inno/46970941.pdf [2017, November 10].
Tong, T., Yu, T. H.E., Cho, S.H., Jensen, K. & Ugarte, D.D. 2013. Evaluating the spatial spill over
effects of transportation infrastructure on agricultural output across the United States. Journal
of Transport Geography, 30, 47-55.
Toringepi, G. 2016. The contribution of smallholder agriculture production to food security in rural
Zimbabwe: A case study of Masvingo Province. Unpublished master’s thesis. University of Fort
Hare.
Trade & Industrial Policy Strategies (TIPS) 2017. Development dialogue colloquium: The retail sector:
an opportunity for industrialisation? [Online]. Available: http://www.tips.org.za/ [2017, November
12].
© Central University of Technology, Free State

194 | P a g e
Triguero, A., Córcoles, D. & Cuerva, M. 2014. Measuring the persistence in innovation in spanish
manufacturing firms: empirical evidence using discrete-time duration models. Economics of
Innovation and New Technology, 23(5–6), 447–468.
Uddin, M.N., Bokelmann, W. & Entsminger, J.S. 2014. Factors affecting farmers’ adaptation strategies
to environmental degradation and climate change effects: A farm level study in Bangladesh.
Climate, 2, 223-241.
Ulrich, A. 2014. Export-oriented horticultural production in Laikipia, Kenya: Assessing the implications
for rural livelihoods. Sustainability, 6(1), 336-347.
Upadhyay, D. 2016. BRICS to set up Research Centre for greater agriculture cooperation. Rbth.com.
[Online]. Available: https://www.rbth.com/world/2016/09/28/brics-to-set-up-research-centre-for-
greater-agriculture-cooperation_633917 [2017, November 06].
Van Averbeke, W., Denison, J. & Mnkeni, P.N.S. 2011. Smallholder irrigation schemes in South Africa:
A review of knowledge generated by the water research commission. [Online]. Available:
http://www.scielo.org.za/pdf/wsa/v37n5/v37n5a21.pdf [2017, November 12].
Van Burg, E., Romme, A.G.L., Gilsing, V.A. & Reymen, I.M. 2008. Creating university spin‐offs: A
Science‐based design perspective. Journal of Product Innovation Management, 25(2), 114-
128.
Van der Veen, M. 2010. Agricultural innovation: invention and adoption or change and adaptation?
World Archaeology, 42(1), 1-12.
Vanlauwe, B., Coyne, D., Gockowski, J., et al., 2014. Sustainable intensification and the African
smallholder farmer. Current Opinion in Environmental Sustainability, 8, 15-22.
Vellema, S. & van Wijk, J. 2015. Partnerships intervening in global food chains: the emergence of co-
creation in standard-setting and certification. Journal of Cleaner Production, 107, 105-113.
Verhees, F. & Meulenberg, M. 2004. Market orientation, innovativeness, product innovation, and
performance in small firms. Journal of Small Business Management, 42(2), 134-154.
Vu, H. 2012. Moral economy meets global economy: Negotiating risk, vulnerability and sustainable
livelihood among shrimp farming households in Vietnam's Mekong Delta. Unpublished doctoral
dissertations. Maxwell School of Citizenship and Public Affairs.
Wahab, S.A., Rose, R.C. & Osman, S.I.W. 2012. Defining the concepts of technology and technology
transfer: A literature analysis. International Business Research, 5(1), 61-71.
Wekesa, B. 2016. Deborah Brautigam’s will Africa feed China. A critical media-centric review. African
East-Asian Affairs, 4, 152-178.
© Central University of Technology, Free State
195 | P a g e
Wezel, A., Casagrande, M., Celette, F., Vian, J.F., Ferrer, A. & Peigné, J. 2014. Agroecological
practices for sustainable agriculture. A review. Agronomy for sustainable development, 34(1),
1-20.
Wheeler, S.A., Zuo, A., Bjornlund, H., Mdemu, M.V., van Rooyen, A. & Munguambe, P. 2017. An
overview of extension use in irrigated agriculture and case studies in South-Eastern Africa.
International Journal of Water Resources Development, 33(5), 755-769.
Wheeler, T. & Von Braun, J. 2013. Climate change impacts on global food security. Science,
341(6145), 508-513.
Wigier, M. 2014. The competitiveness of Polish agriculture after accession to the EU. Ekonomika
Poljoprivrede, 61(1), 8.
Wise, T.A. 2013. Can we feed the world in 2050? A scoping paper to assess the evidence. [Online].
Available: http://www.ase.tufts.edu/gdae/Pubs/wp/13-04WiseFeedWorld2050.pdf [2017,
November 12].
Wolfenson, K.D.M. 2013. Coping with the food and agriculture challenge: smallholders’ agenda,
Unpublished preparations and outcomes of the 2012 United Nations Conference on Sustainable
Development (Rio+20). April, Rome. [Online]. Available:
http://www.fao.org/fileadmin/templates/nr/sustainability_pathways/docs/Coping_with_food_an
d_agriculture_challenge__Smallholder_s_agenda_Final.pdf [2017, November 12].
World Bank 2009. Gender in Agriculture Source Book. Agriculture and rural development. [Online].
Available:
http://siteresources.worldbank.org/INTGENAGRLIVSOUBOOK/Resources/CompleteBook.pdf
[2017, November 06].
World Bank annual report 2017. End extreme poverty and boost shared prosperity. [Online]. Available:
http://pubdocs.worldbank.org/en/908481507403754670/Annual-Report-2017-WBG.pdf [2017,
November 10].
World Bank annual report 2017. End extreme poverty and boost shared prosperity. [Online]. Available:
http://pubdocs.worldbank.org/en/908481507403754670/Annual-Report-2017-WBG.pdf [2017,
November 10].
World Bank. 2017. World development Report 2017, Governance and Law. [Online]. Available:
http://www.worldbank.org/en/publication/wdr2017 [2017, November 12].
World Trade Report. 2014. Trade and development: Recent trends and the role of the world trade
organisation (WTO). [Online]. Available:
© Central University of Technology, Free State
196 | P a g e
https://www.wto.org/english/res_e/booksp_e/world_trade_report14_e.pdf [2017, November
12].
Wright, M. 2014. Academic entrepreneurship, technology transfer and society: where next? The
Journal of Technology Transfer, 39(3), 322–334.
Xu, X., Li, X., Qi, G., Tang, L. & Mukwereza, L. 2016. Science, technology, and the politics of
knowledge: The case of China’s agricultural technology demonstration centers in Africa. World
Development, 81, 82-91.
Yamauchi, F. 2010. Human capital formation: History, expectations, and challenges in South Africa.
International Food Policy Research Institute (IFPRI) [Online]. Available:
https://econpapers.repec.org/paper/fprresrep/futoshiyamauchi.htm [2017, November 06].
Zagata, L. & Sutherland, L.A. 2015. Deconstructing the young farmer problem in Europe: Towards a
research agenda. Journal of Rural Studies, 38, 39-51.
Zhan, J., Tian, X., Zhang, Y., Yang, X., Qu, Z. & Tan, T. 2017. The Effects of Agricultural R&D on
Chinese Agricultural Productivity Growth: New Evidence of Convergence and Implications for
Agricultural R&D Policy. Canadian Journal of Agricultural Economics, 65(3), 453-475.
Zhang, F., Chen, X. & Vitousek, P. 2013. Chinese agriculture: An experiment for the world. Nature,
497(7447), 33-35
Zhou, H. 2015. Introduction. In foreign aid in China. Springer: Berlin Heidelberg.
Zikmund, W.G., Babin, B.J., Carr, J.C. & Griffin, M. 2013. Business Research Methods. 9th edition.
Toronto: Cengage Learning.
Zimbabwe agriculture investment plan (ZAIP). 2013. A comprehensive framework for the development
of Zimbabwe’s agriculture sector. [Online]. Available:
http://extwprlegs1.fao.org/docs/pdf/zim152671.pdf [2017, November 05].
ZimStat, 2012. Census national report 2012. Zimbabwe National Statistics Agency, Harare. [Online].
Available: http://www.zimstat.co.zw/sites/default/files/img/National_Report.pdf [2017
November 07].
ZimStat, 2015. Quarterly digest of statistics, 2nd quarter 2015. Zimbabwe National Statistics Agency,
Harare. [Online]. Available:
http://www.zimstat.co.zw/sites/default/files/img/publications/Digest/Digest2015/Digest_2_2015
.pdf [2017, November 07].
© Central University of Technology, Free State

197 | P a g e
APPENDIX A
BIOGRAPHY
Mr Justin Gumbochuma (born 19 September 1983) is a Zimbabwean businessman. He graduated with
a Bsc Honours in Administration and a Master’s in Business Administration from the University of
Zimbabwe and National University of Science and Technology. He is a Doctorate candidate at the Central
University of Technology, Free State, South Africa. He also worked as a lecturer of strategic
management, public finance, public policy, organisational development and as a consultant for Beverley
Business School.
His experience include working for United Nations Information Centre, United States of America Embassy
in Harare as Inventory consultant (2005-2007). Justin is the Founder and Board Chairman of Credfund
Finance, Covenant Finance, Abovelimit Holdings and Industries, Legbead Hiring and Public Private
Partnership Institute of Zimbabwe (PPPIZ). Mr G umbochuma served as a consultant of the Government
of Zimbabwe for special projects like Indigenization and economic empowerment rollout programme and
Command Agriculture and former special government committee member on indigenization and
economic empowerment. He also served as a former board member of Youth empowerment Taskforce.
Mr Gumbochuma is also a fellow member of the South Africa Institute of Financial Markets and he holds
a postgraduate certificate in Investments and portfolio management from the University of Zimbabwe.
Justin is a devout Christian and a leader of the Seventh Day Adventist and Board member of Adventist
Laymen’s Services and Industries (ASI) for Zimbabwe and Africa region. He serves as a committee
member for ASI programs and projects North America Division (NAD) covering USA and Canada.
© Central University of Technology, Free State

198 | P a g e
APPENDIX B
QUESTIONNAIRE
Section A
Instructions to respondents:
1 Your answers will be kept confidential
2 Please be honest as much as possible in completing this questionnaire.
3 Indicate your response by encircling or ticking the relevant option in the boxes provided
SECTION A
1. Country
2. Gender (Representative)
3 Choose appropriate from 1/2/3/4/5/other.
Age
1
Below 21
years
2
Between
21-30
years
3
Between
31-40
years
4
Between 41-
50 years
5
Between
51-60 yrs.
61+
yrs.
Ethnic/
Race
1
White
2
Coloured
3
Black
4 European 5
Asian
Other
Specify……………
Years in
business
1
(1-5)
2
(6-10)
3
(11-15)
4
(16-20)
5
(21-50)
(Over 50)
Employees
numbers
1
(1-10)
2
(11-20)
3
(21-50)
3
(51-100)
5
(101-200)
(Over 200)
Total assets
value(millions
USD)
1
Less 200
000)
2
200000-
499 999
3
500000-
999 999
4
1000000-4999
999
5
5000 000-9 999
999
Over 10 million
Nature of
Agro
business
1
Animal
Husbandry
2
Crop
production
3
Horticulture
4
Manufacturing
/agro
processing
5
Sale of agro
equipment
6
Marketing of agro
equipment/implements
Add other specify
Agro
business
Qualifications
1
Primary
/short
courses
2
High
school
3
Vocational
Training
course
4
University ‘s
Bachelor’s
Degree
4
Post graduate
diploma/degree
Other
Specify………
Zimbabwe 1 South Africa 2
Male 1 Female 2
© Central University of Technology, Free State
199 | P a g e
Section B
STATUS AND LEVEL OF PRODUCTIVITY OF AGRO-PROCESSING FIRMS
PRODUCTIVITY
LEVELS Financial productivity questions
1.
Please indicate the extent to which the agro-business’s financial sales from agricultural
products/services increased/decreased over the past 1-5 years
1
Decreased by
over 10%
2
Decreased by
between 1%-
10%
3
No change
3
Increased by 1-
10%
4
Increased by
over 10%
2.
Please indicate the extent to which the agro-business’s sales from agricultural
products/services increased/decreased compared to production costs over the past
1-5 years
1
Decreased by
over 10%
2
Decreased by
between 1%-
10%
3
No change
3
Increased by 1-
10%
4
Increased by
over 10%
3. Please indicate the extent to which the agro-business’s total revenue
increased/decreased compared to production costs over the past 1-5 years
1
Decreased by
over 10%
2
Decreased by
between 1%-
10%
3
No change
3
Increased by 1-
10%
4
Increased by
over 10%
4. Please indicate the extent to which the agro-business’ gross profit increased
/decreased over the last 1-5 years
1
Decreased by
over 10%
2
Decreased by
between 1%-
10%
3
No change
3
Increased by 1-
10%
4
Increased by
over 10%
5. Please indicate the extent to which the agro-business’ net profit grew/fell over the
last 1-5 years
1
Decreased by
over 10%
2
Decreased by
between 1%-
10%
3
No change
3
Increased by 1-
10%
4
Increased by
over 10%
© Central University of Technology, Free State
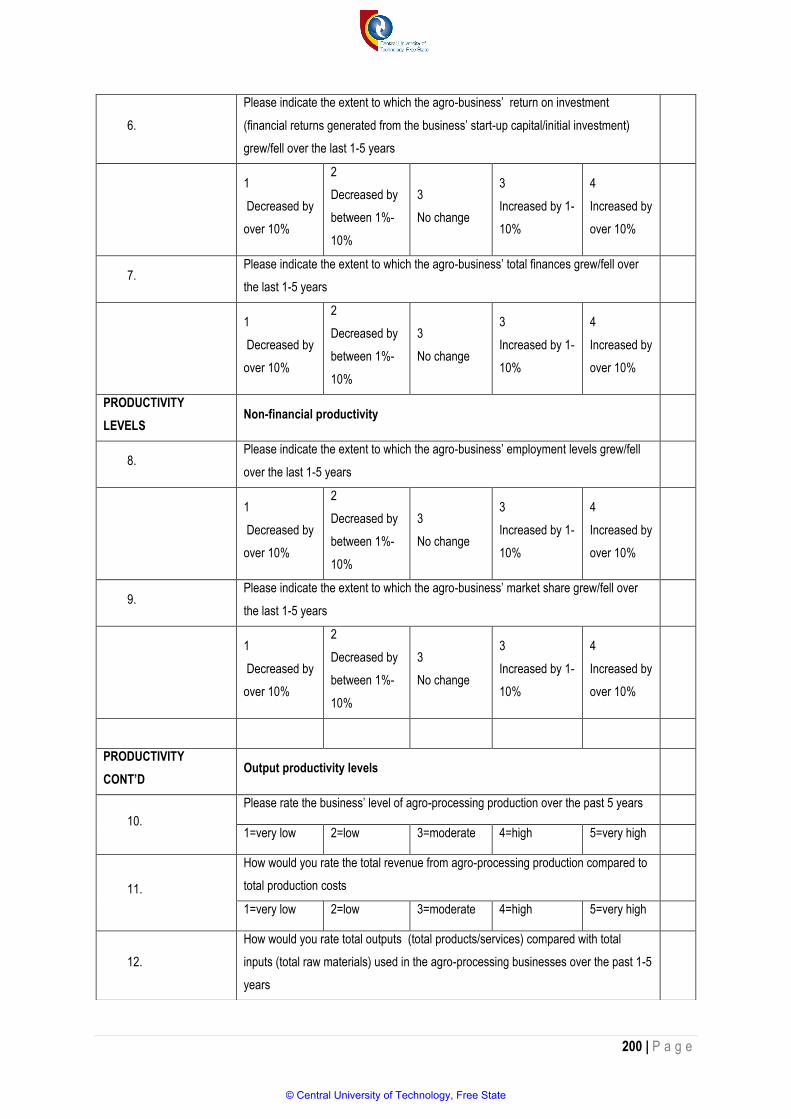
200 | P a g e
6.
Please indicate the extent to which the agro-business’ return on investment
(financial returns generated from the business’ start-up capital/initial investment)
grew/fell over the last 1-5 years
1
Decreased by
over 10%
2
Decreased by
between 1%-
10%
3
No change
3
Increased by 1-
10%
4
Increased by
over 10%
7. Please indicate the extent to which the agro-business’ total finances grew/fell over
the last 1-5 years
1
Decreased by
over 10%
2
Decreased by
between 1%-
10%
3
No change
3
Increased by 1-
10%
4
Increased by
over 10%
PRODUCTIVITY
LEVELS Non-financial productivity
8. Please indicate the extent to which the agro-business’ employment levels grew/fell
over the last 1-5 years
1
Decreased by
over 10%
2
Decreased by
between 1%-
10%
3
No change
3
Increased by 1-
10%
4
Increased by
over 10%
9. Please indicate the extent to which the agro-business’ market share grew/fell over
the last 1-5 years
1
Decreased by
over 10%
2
Decreased by
between 1%-
10%
3
No change
3
Increased by 1-
10%
4
Increased by
over 10%
PRODUCTIVITY
CONT’D Output productivity levels
10.
Please rate the business’ level of agro-processing production over the past 5 years
1=very low 2=low 3=moderate 4=high 5=very high
11.
How would you rate the total revenue from agro-processing production compared to
total production costs
1=very low 2=low 3=moderate 4=high 5=very high
12.
How would you rate total outputs (total products/services) compared with total
inputs (total raw materials) used in the agro-processing businesses over the past 1-5
years
© Central University of Technology, Free State
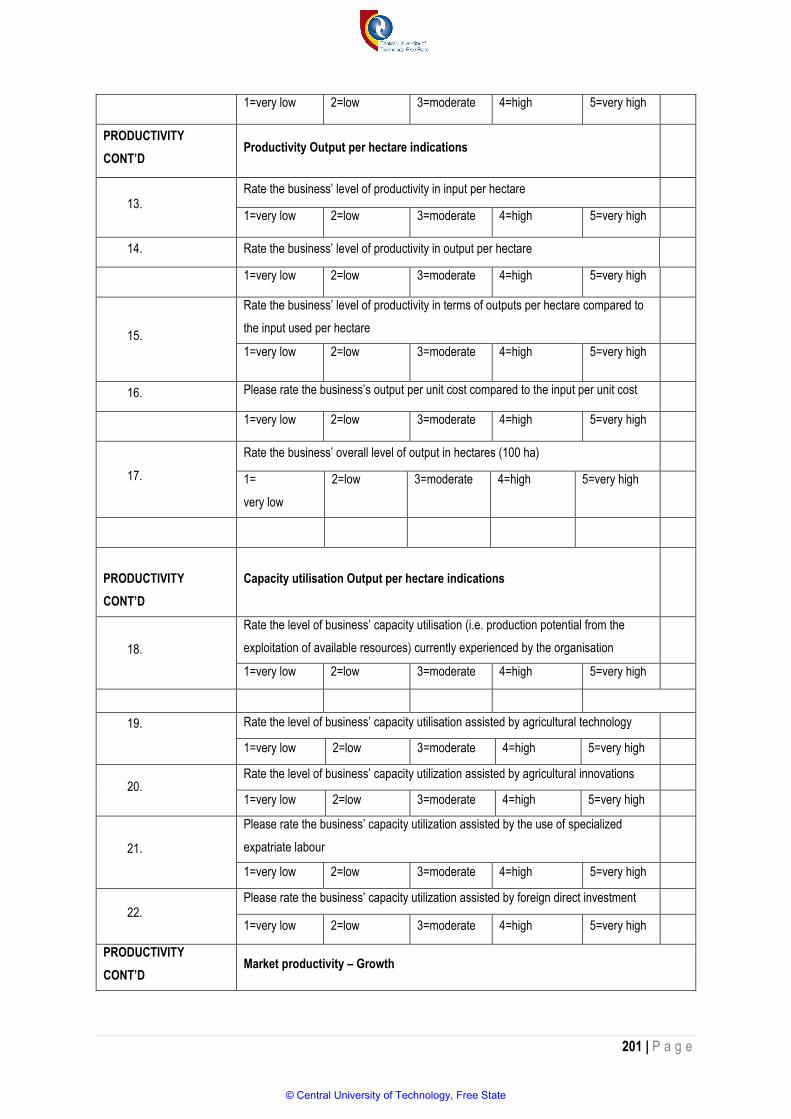
201 | P a g e
1=very low 2=low 3=moderate 4=high 5=very high
PRODUCTIVITY
CONT’D Productivity Output per hectare indications
13. Rate the business’ level of productivity in input per hectare
1=very low 2=low 3=moderate 4=high 5=very high
14. Rate the business’ level of productivity in output per hectare
1=very low 2=low 3=moderate 4=high 5=very high
15.
Rate the business’ level of productivity in terms of outputs per hectare compared to
the input used per hectare
1=very low 2=low 3=moderate 4=high 5=very high
16. Please rate the business’s output per unit cost compared to the input per unit cost
1=very low 2=low 3=moderate 4=high 5=very high
17.
Rate the business’ overall level of output in hectares (100 ha)
1=
very low
2=low 3=moderate 4=high 5=very high
PRODUCTIVITY
CONT’D
Capacity utilisation Output per hectare indications
18.
Rate the level of business’ capacity utilisation (i.e. production potential from the
exploitation of available resources) currently experienced by the organisation
1=very low 2=low 3=moderate 4=high 5=very high
19.
Rate the level of business’ capacity utilisation assisted by agricultural technology
1=very low 2=low 3=moderate 4=high 5=very high
20. Rate the level of business’ capacity utilization assisted by agricultural innovations
1=very low 2=low 3=moderate 4=high 5=very high
21.
Please rate the business’ capacity utilization assisted by the use of specialized
expatriate labour
1=very low 2=low 3=moderate 4=high 5=very high
22. Please rate the business’ capacity utilization assisted by foreign direct investment
1=very low 2=low 3=moderate 4=high 5=very high
PRODUCTIVITY
CONT’D Market productivity – Growth
© Central University of Technology, Free State
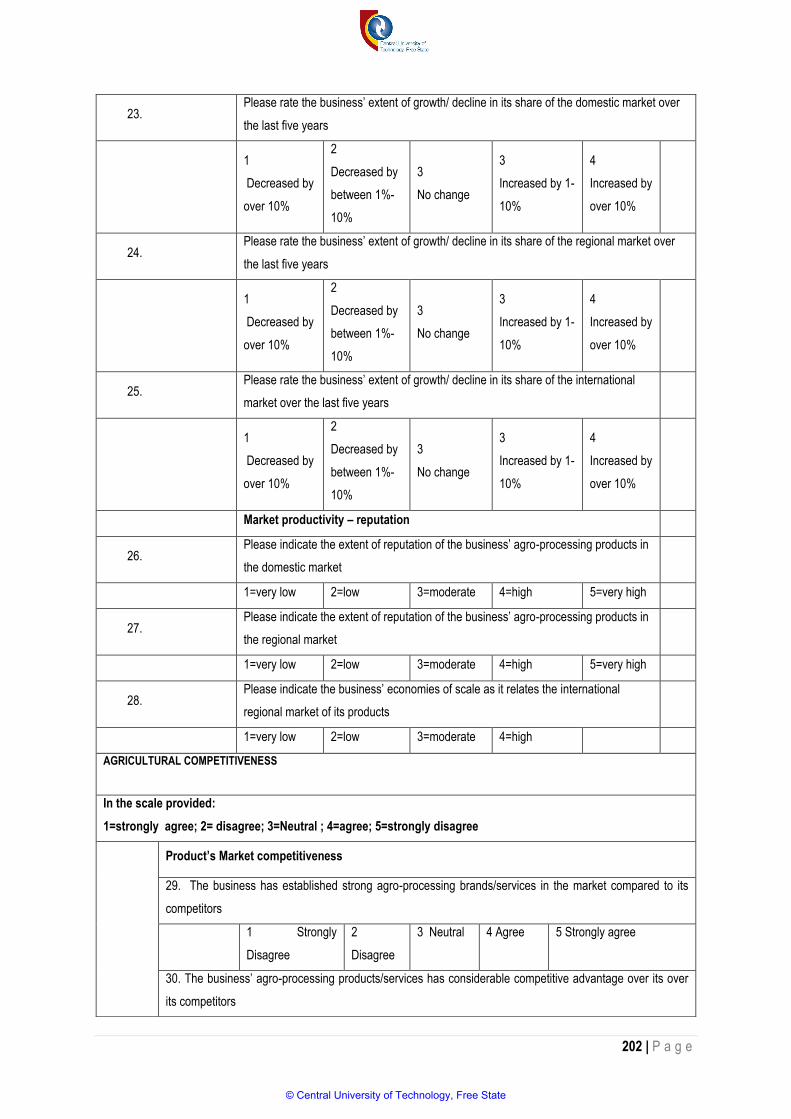
202 | P a g e
23. Please rate the business’ extent of growth/ decline in its share of the domestic market over
the last five years
1
Decreased by
over 10%
2
Decreased by
between 1%-
10%
3
No change
3
Increased by 1-
10%
4
Increased by
over 10%
24. Please rate the business’ extent of growth/ decline in its share of the regional market over
the last five years
1
Decreased by
over 10%
2
Decreased by
between 1%-
10%
3
No change
3
Increased by 1-
10%
4
Increased by
over 10%
25. Please rate the business’ extent of growth/ decline in its share of the international
market over the last five years
1
Decreased by
over 10%
2
Decreased by
between 1%-
10%
3
No change
3
Increased by 1-
10%
4
Increased by
over 10%
Market productivity – reputation
26. Please indicate the extent of reputation of the business’ agro-processing products in
the domestic market
1=very low 2=low 3=moderate 4=high 5=very high
27. Please indicate the extent of reputation of the business’ agro-processing products in
the regional market
1=very low 2=low 3=moderate 4=high 5=very high
28. Please indicate the business’ economies of scale as it relates the international
regional market of its products
1=very low 2=low 3=moderate 4=high
AGRICULTURAL COMPETITIVENESS
In the scale provided:
1=strongly agree; 2= disagree; 3=Neutral ; 4=agree; 5=strongly disagree
Product’s Market competitiveness
29. The business has established strong agro-processing brands/services in the market compared to its
competitors
1 Strongly
Disagree
2
Disagree
3 Neutral 4 Agree 5 Strongly agree
30. The business’ agro-processing products/services has considerable competitive advantage over its over
its competitors
© Central University of Technology, Free State

203 | P a g e
1 Strongly
Disagree
2 Disagree 3 Neutral 4 Agree 5 Strongly agree
31. The business’ agro-processing products or services are easily recognizable in the market compared to
those of its competitors
1 Strongly
Disagree
2 Disagree 3 Neutral 4 Agree 5 Strongly agree
32. The business ‘ agro-processing enjoy higher sales in the market compared to those of competitors
1 Strongly Disagree 2.
Disagree
3 Neutral 4. Agree 5 Strongly agree
33. The agro-processed products or services have more dominance over those of the organisations
competitors
1 Strongly
Disagree
Disagree 3
Neutral
4
Agree
5 Strongly agree
Customer satisfaction
34. The customers are satisfied with the business’ agro-business brands/services compared to that of its
competitors
1 Strongly
Disagree
2
Disagree
3
Neutral
4.
Agree
5. Strongly agree
35. The business’ agro-processing products /services are bought by customers ahead of those of competitors
1 Strongly
Disagree
2.
Disagree
3
Neutral
4
Agree
5 Strongly agree
36. The business’ agro-processing products/services are preferred by customers compared to those of
competitors
1 Strongly
Disagree
2.
Disagree
3
Neutral
4
Agree
5 Strongly agree
37. The price of the business’ agro-processing products /services are preferred by customers compared to
those of its competitors
1 Strongly
Disagree
2.
Disagree
3
Neutral
4
Agree
5 Strongly agree
38. The business has strong relationship with its customers base compared to its competitors
1 Strongly
Disagree
2.
Disagree
3.
Neutral
4.
Agree
5 Strongly agree
Market pricing competitiveness
39. My business in agro-processing has developed competitive pricing model
1 Strongly
Disagree
Disagree 3
Neutral
4
Agree
5 Strongly agree
40. The agro business has favourable pricing compared with other businesses
© Central University of Technology, Free State
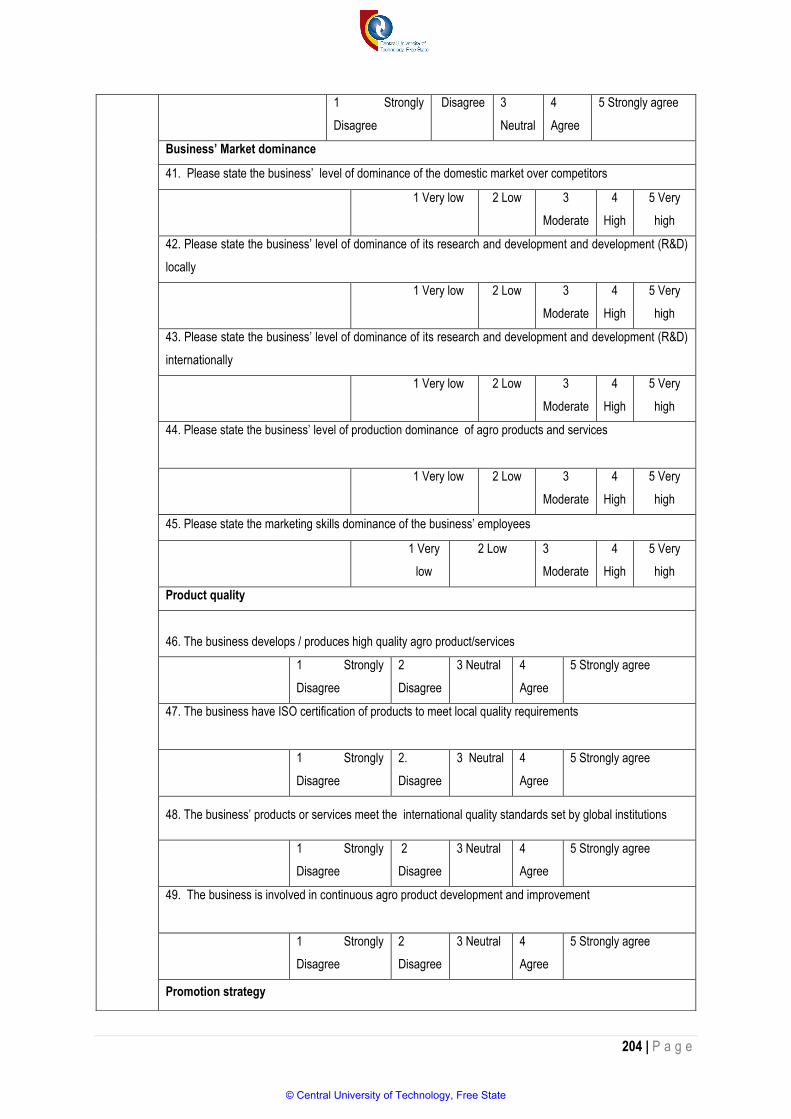
204 | P a g e
1 Strongly
Disagree
Disagree 3
Neutral
4
Agree
5 Strongly agree
Business’ Market dominance
41. Please state the business’ level of dominance of the domestic market over competitors
1 Very low 2 Low 3
Moderate
4
High
5 Very
high
42. Please state the business’ level of dominance of its research and development and development (R&D)
locally
1 Very low 2 Low 3
Moderate
4
High
5 Very
high
43. Please state the business’ level of dominance of its research and development and development (R&D)
internationally
1 Very low 2 Low 3
Moderate
4
High
5 Very
high
44. Please state the business’ level of production dominance of agro products and services
1 Very low 2 Low 3
Moderate
4
High
5 Very
high
45. Please state the marketing skills dominance of the business’ employees
1 Very
low
2 Low 3
Moderate
4
High
5 Very
high
Product quality
46. The business develops / produces high quality agro product/services
1 Strongly
Disagree
2
Disagree
3 Neutral 4
Agree
5 Strongly agree
47. The business have ISO certification of products to meet local quality requirements
1 Strongly
Disagree
2.
Disagree
3 Neutral 4
Agree
5 Strongly agree
48. The business’ products or services meet the international quality standards set by global institutions
1 Strongly
Disagree
2
Disagree
3 Neutral 4
Agree
5 Strongly agree
49. The business is involved in continuous agro product development and improvement
1 Strongly
Disagree
2
Disagree
3 Neutral 4
Agree
5 Strongly agree
Promotion strategy
© Central University of Technology, Free State
205 | P a g e
Section C
INNOVATION
Product innovation
Please state how often the business does the following:
54. The business does new agro-processed product/service development
1 Never 2 Rarely 3
Sometimes
4
Regularly
5 Always
55. The business applies innovative agro-processing information on its products or service business
1 Never 2 Rarely 3
Sometimes
4
Regularly
5 Always
56. The business adds new features to existing agro-processing products and services
1 Never 2 Rarely 3
Sometimes
4
Regularly
5 Always
57. The business encourages creation of new agro-processing products and services
1 Never 2 Rarely 3
Sometimes
4
Regularly
5 Always
Process Innovation
Please state your extent of agreement/disagreement with the following statements about the business
58. The business has established the implementation of new/improved production methods
1 Strongly disagree 2 Disagree 3 Neutral 4 Agree 5 Strongly agree
59. The business uses new delivery and distribution networks in its agro-processing activities
50. The business’ product promotion help has helped it o to be dominant on the market
1 Strongly
Disagree
2
Disagree
3 Neutral 4
Agree
5 Strongly agree
51. The business emphasises effective and unique agro product promotion techniques
1 Strongly
Disagree
2
Disagree
3 Neutral 4
Agree
5 Strongly agree
Organisational competitiveness
52. The organisation has invested in production capacity that is competent
1 Strongly
Disagree
2
Disagree
3
Neutral
4
Agree
5 Strongly
agree
53. The business agro business has developed competitive, efficient and effective agro organisational
structure
1 Strongly
Disagree
2
Disagree
3
Neutral
4
Agree
5 Strongly
agree
© Central University of Technology, Free State
206 | P a g e
1 Strongly disagree 2 Disagree 3 Neutral 4 Agree 5 Strongly agree
60. The business invests in new agro techniques/ equipment/ machinery improve agro-processing activities
1 Strongly disagree 2 Disagree 3 Neutral 4 Agree 5 Strongly agree
61. The business uses and applies business process and information techniques to solve agro business
challenges
1 Strongly disagree 2 Disagree 3 Neutral 4 Agree 5 Strongly agree
62. The business applies key performance indicators in its agro business activities
1 Strongly disagree 2 Disagree 3 Neutral 4 Agree 5 Strongly agree
Market innovation
Please state your extent of agreement or disagreement with the following statements
63. The agro-business business introduces marketing strategies regularly
1 Strongly disagree 2 Disagree 3 Neutral 4 Agree 5 Strongly agree
64. The business tests its new product designs regularly to address customer needs
1 Strongly disagree 2 Disagree 3 Neutral 4 Agree 5 Strongly agree
65. The business employs new product packaging techniques to improve its visibility in the market
1 Strongly disagree 2 Disagree 3 Neutral 4 Agree 5 Strongly agree
66. The business involves its market partners when placing new products in the market
1 Strongly disagree 2 Disagree 3 Neutral 4 Agree 5 Strongly agree
Organisational innovation
Please state how often the agro-business does the following:
67. The organisation is involved in the adoption of wide scale innovations that affect the functioning of the whole
organisation
1 Never 2 rarely 3 sometimes 4 frequently 5 Always
68. The business encourages new organisational methods and development of new organisational systems
1 Never 2 rarely 3 sometimes 4 frequently 5 Always
69. The business has invested in organisational best practices and agro-business efficiency
1 Never 2 rarely 3 sometimes 4 frequently 5 Always
70. The business invests in developing organisational change and operational change at your organisation
1 Never 2 rarely 3 sometimes 4 frequently 5 Always
Section D.
Internal and external technology transfer.
71 Please state the extent to which you agree with the following statements on the business’ internal/ external acquisition of
technology
1 Not at all 2 To a least extent 3 To a less extent 4 To a moderate extent 5 To a large extent
72. The business encourages the free flow of new agro-processing information within the organisation
1 Not at all 2 To a least extent 3 To a less extent 4 To a moderate extent 5 To a large extent
73. The business emphasizes the use of high-technology ideas, methods and technique in agro business acquired from
within the organisation
© Central University of Technology, Free State
207 | P a g e
1 Not at all 2 To a least extent 3 To a less extent 4 To a moderate extent 5 To a large extent
74. The business has invested much capital in the use of technology in agro business
1. Not at all 2 To a least extent 3 To a less extent 4 To a moderate extent 5 To a large extent
75. The business contributes to the diffusion of agriculture knowhow and knowledge
1 Not at all 2 To a least extent 3 To a less extent 4 To a moderate extent 5 To a large extent
76. The business invest in research and development(R&D) in agro-business
1 Not at all 2 To a least extent 3 To a less extent 4 To a moderate extent 5 To a large extent
77. The business acquires the best available technology outside the organisation
1 Not at all 2 To a least extent 3 To a less extent 4 To a moderate extent 5 To a large extent
78. The external acquisition of agro business technology has increased marketing knowledge in the agro business
1 Not at all 2 To a least extent 3 To a less extent 4 To a moderate extent 5 To a large extent
79. The external acquisition of agro business processing technology has reduced the time to market business products
1 Not at all 2 To a least extent 3 To a less extent 4 To a moderate extent 5 To a large extent
80. External sourcing of agro business technology has increased the knowledge base of developing new products and
techniques
1 Not at all 2 To a least extent 3 To a less extent 4 To a moderate extent 5 To a large extent
Transfer of agro-processing business skills(Sub concept 2)
Please state the extent to which you agree/ disagree with the following statements transferring business skills
81. The agro-business emphasizes the development of new productive agro business methods
1. Strongly disagree 2 Disagree 3 Neutral 4 Agree 5 Strongly agree
82. The agro-business imparts new agricultural entrepreneurship skills on employees
1. Strongly disagree 2 Disagree 3 Neutral 4 Agree 5 Strongly agree
83. The agro-business uses agriculture skills development to develop its manpower
1. Strongly disagree 2 Disagree 3 Neutral 4 Agree 5 Strongly agree
84. The external acquisition of technologies methods has improved efficiency and effectiveness
1. Strongly disagree 2 Disagree 3 Neutral 4 Agree 5 Strongly agree
85. The acquisition of the best available technology outside the organisation has made the agro-business to focus on
capabilities
1. Strongly disagree 2 Disagree 3 Neutral 4 Agree 5 Strongly agree
86. The external acquisition of agro business technology has increased competitiveness in the agro business
1. Strongly disagree 2 Disagree 3 Neutral 4 Agree 5 Strongly agree
Technology transfer of agro-processing business abilities
Please state the extent to which you agree with the following statements the business’ agro-processing abilities
87. The business employs agro technologies for its enterprise development activities
1 Not at all 2 To a least extent 3 To a lesser extent 4 To a moderate extent 5 To a greater extent
88. The agro business used technology to facilitate marketing activities
© Central University of Technology, Free State

208 | P a g e
1 Not at all 2 To a least extent 3 To a lesser extent 4 To a moderate extent 5 To a greater extent
89. The agro business employs agriculture technology to develops its planning processes and operations
1 Not at all 2 To a least extent 3 To a lesser extent 4 To a moderate extent 5 To a greater extent
90. The business uses technology to facilitate the diffusion of technical services
1 Not at all 2 To a least extent 3 To a lesser extent 4 To a moderate extent 5 To a greater extent
91. The business employs commercialisation techniques and strategies to make farmers more innovative
1 Not at all 2 To a least extent 3 To a lesser extent 4 To a moderate extent 5 To a greater extent
92. The business uses techniques and strategies to market and distribute agro business products and services
1 Not at all 2 To a least extent 3 To a lesser extent 4 To a moderate extent 5 To a greater extent
Agro-processing technology types: Biotechnology or genetically modification
Please state the degree to which your organisation uses each of these technologies
93. The business develops biotechnology products and services
1 Not at all 2 Rarely 3 To a limited extent 4 To a moderate extent 5 To a large extent
94. The business distributes biotechnology products and services
1 Not at all 2 Rarely 3 To a limited extent 4 To a moderate extent 5 To a large extent
95. The business markets some biotechnology products and services
1 Not at all 2 Rarely 3 To a limited extent 4 To a moderate extent 5 To a large extent
96. Agro-processing technology for storage and preservations
1 Not at all 2 Rarely 3 To a limited degree 4 To a moderate degree 5 To a large degree
97. Please state the degree which your agro-business uses each of these technologies for storage and preservation of agro-
processed products
1 Not at all 2 Rarely 3 To a limited extent 4 To a moderate extent 5 To a large extent
98. The business employees technology in storage
1 Not at all 2 Rarely 3 To a limited extent 4 To a moderate extent 5 To a large extent
99. The agro business use agro-processing technology such as controlled environments for processing its products
1 Not at all 2 Rarely 3 To a limited extent 4 To a moderate extent 5 To a large extent
100. The agro business processing pasteurises and sterilise its products
1 Not at all 2 Rarely 3 To a limited extent 4 To a moderate extent 5 To a large extent
101. The business uses agro-processing technologies equipment to pack preserve its products.
1 Not at all 2 Rarely 3 To a limited extent 4 To a moderate extent 5 To a large extent
102 Transportation and Distribution of agro products
1 Not at all 2 Rarely 3 To a limited degree 4 To a moderate degree 5 To a large degree
Please state the degree which your agro-business uses each of these technologies for the transportation and Distribution
of agro products
103. The businesses uses technologies for transportation such as cold chain distribution, transportation by refrigerated
cars, planes and boats
© Central University of Technology, Free State
209 | P a g e
1 Not at all 2 Rarely 3 To a limited extent 4 To a moderate extent 5 To a large extent
104. Our business uses cold chain distribution to preserve its products
1 Not at all 2 Rarely 3 To a limited extent 4 To a moderate extent 5 To a large extent
105. The business uses refrigerated vehicles (cars/lorries/trucks), planes or boats to transport its agro-processed
products. ask the same for its primary raw materials
1 Not at all 2 Rarely 3 To a limited extent 4 To a moderate extent 5 To a large extent
Technology for processing
106 Please state the extent to which your organisation provides and /uses the following technologies
1 Not at all 2 Rarely 3 To a limited extent 4 To a moderate extent 5 To a large extent
107. Our agro-processing involves the provision and use of freeze –drying
1 Not at all 2 Rarely 3 To a limited extent 4 To a moderate extent 5 To a large extent
108. Our agro-processing involves the provision and use of spray-drying
1 Not at all 2 Rarely 3 To a limited extent 4 To a moderate extent 5 To a large extent
109. Our agro-processing involves the provision and use of micro-wave drying
1 Not at all 2 Rarely 3 To a limited extent 4 To a moderate extent 5 To a large extent
110. Our agro-processing involves the provision and use of frozen-drying
1 Not at all 2 Rarely 3 To a limited extent 4 To a moderate extent 5 To a large extent
111 Our agro-processing involves the provision and use of frozen-grinding
1 Not at all 2 Rarely 3 To a limited extent 4 To a moderate extent 5 To a large extent
112. Our agro-processing involves the provision and use of high-pressure processing
1 Not at all 2 Rarely 3 To a limited extent 4 To a moderate extent 5 To a large extent
113. Our agro-processing involves the provision and use of membrane-filtration
1 Not at all 2 Rarely 3 To a limited extent 4 To a moderate extent 5 To a large extent
THANK YOU!!!
© Central University of Technology, Free State

210 | P a g e
APPENDIX C
PROOF OF LANGUAGE EDITING
© Central University of Technology, Free State