The State the Environment Report 2012 2013 State of the Environment Report 2012 ‐ 2013 Planet...
11
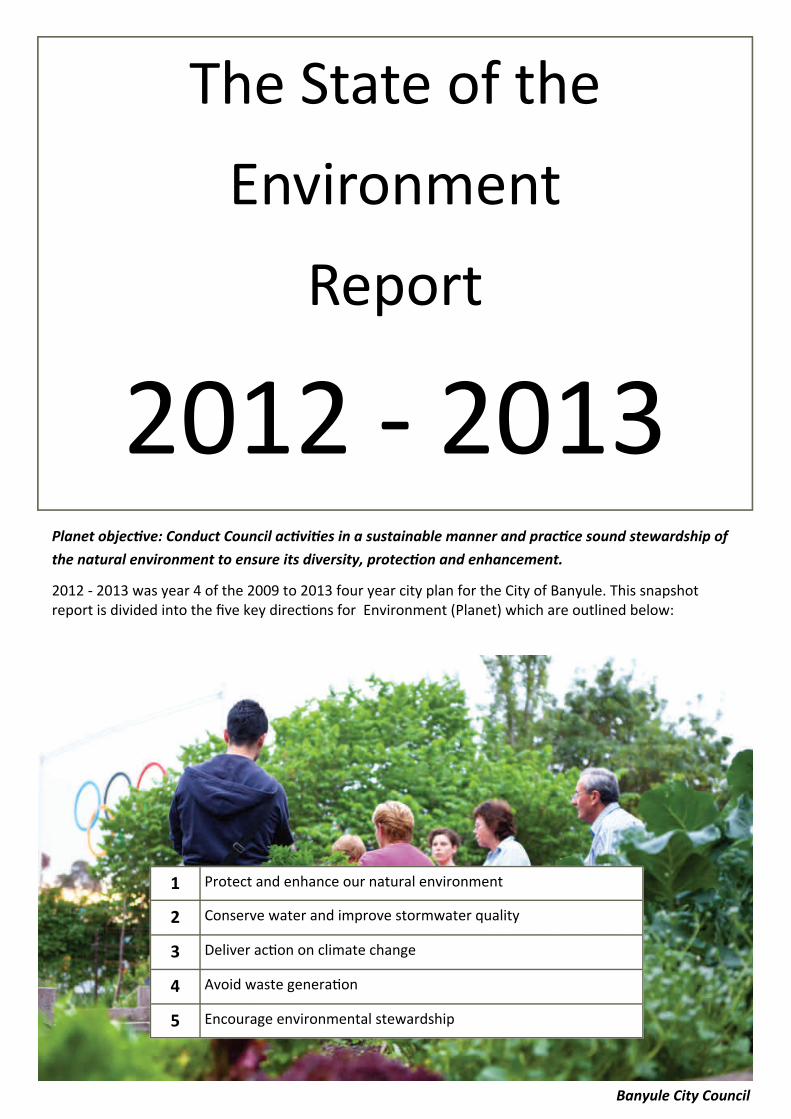
Banyule City Council The State of the Environment Report 2012 ‐ 2013 Planet objecƟve: Conduct Council acƟviƟes in a sustainable manner and pracƟce sound stewardship of the natural environment to ensure its diversity, protecƟon and enhancement. 2012 ‐ 2013 was year 4 of the 2009 to 2013 four year city plan for the City of Banyule. This snapshot report is divided into the five key direcƟons for Environment (Planet) which are outlined below: 1 Protect and enhance our natural environment 2 Conserve water and improve stormwater quality 3 Deliver acƟon on climate change 4 Avoid waste generaƟon 5 Encourage environmental stewardship
Transcript of The State the Environment Report 2012 2013 State of the Environment Report 2012 ‐ 2013 Planet...
Banyule City Council
The State of the
Environment
Report
2012 ‐ 2013 Planet objec ve: Conduct Council ac vi es in a sustainable manner and prac ce sound stewardship of
the natural environment to ensure its diversity, protec on and enhancement.
2012 ‐ 2013 was year 4 of the 2009 to 2013 four year city plan for the City of Banyule. This snapshot report is divided into the five key direc ons for Environment (Planet) which are outlined below:
1 Protect and enhance our natural environment
2 Conserve water and improve stormwater quality
3 Deliver ac on on climate change
4 Avoid waste genera on
5 Encourage environmental stewardship
2012 ‐ 2013 State of the Environment Report 2
1. Protect and enhance our natural environment Key performance
indicator: The number of
tree plan ngs done by
Council’s bushland
management unit and by
volunteer groups within
public lands.
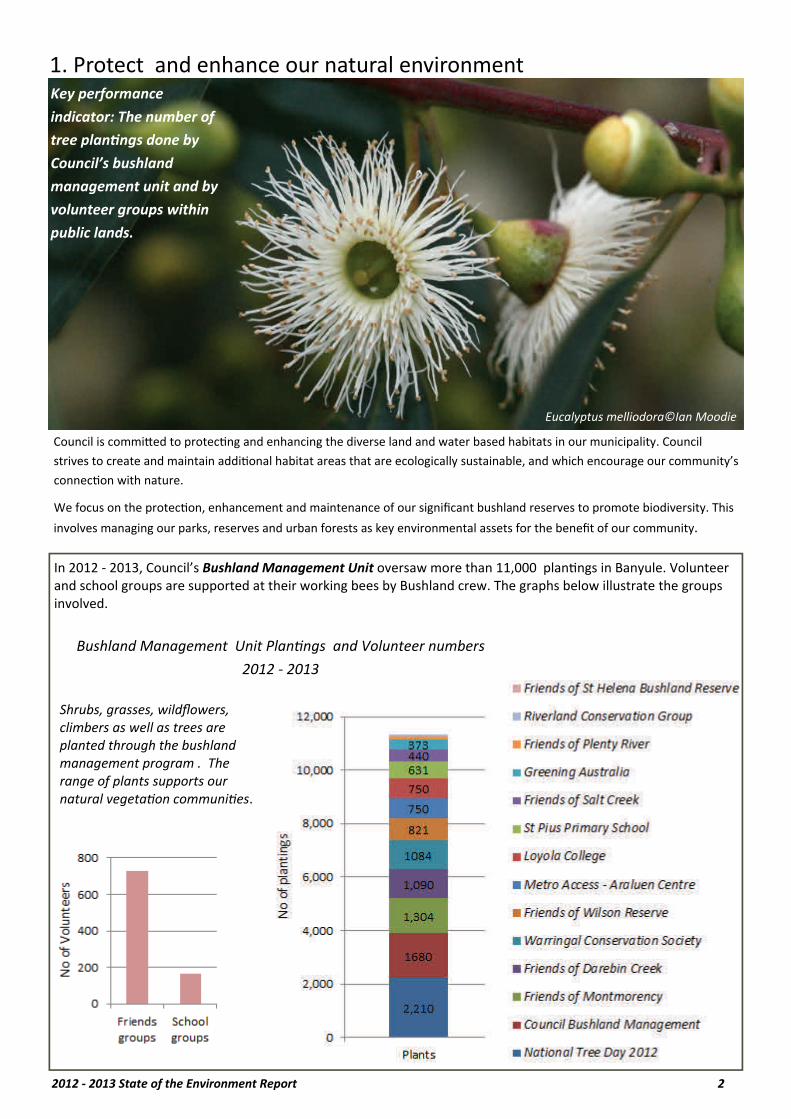
In 2012 ‐ 2013, Council’s Bushland Management Unit oversaw more than 11,000 plan ngs in Banyule. Volunteer and school groups are supported at their working bees by Bushland crew. The graphs below illustrate the groups involved.
Eucalyptus melliodora©Ian Moodie
Shrubs, grasses, wildflowers, climbers as well as trees are planted through the bushland management program . The range of plants supports our natural vegeta on communi es.
Council is commi ed to protec ng and enhancing the diverse land and water based habitats in our municipality. Council
strives to create and maintain addi onal habitat areas that are ecologically sustainable, and which encourage our community’s
connec on with nature.
We focus on the protec on, enhancement and maintenance of our significant bushland reserves to promote biodiversity. This
involves managing our parks, reserves and urban forests as key environmental assets for the benefit of our community.
Bushland Management Unit Plan ngs and Volunteer numbers
2012 ‐ 2013
Banyule City Council 3
Wildlife Corridor funded plants 2012‐2013
Banyule’s environment , with its extensive network of parks, waterways, reserves, gardens and trees, is much loved by residents. In a recent community consulta on, Council received many comments to this effect: “ The greenery makes Banyule special. Wildlife abounds and we are regularly visited by parrots, possums, owls and many other types of na ve animals. This is something you don’t get in other parts of the city.”
In 2012‐2013 friends and community volunteer groups con nued to contribute to Banyule. Some of the projects underway were: bat and frog surveys by Friends of Wilson Reserve, bird counts by Friends of Salt Creek and associated parklands as well as platypus counts organised by the Australian Platypus Conservancy.
As part of Council’s ongoing revegeta on program a total of 1,250 trees were planted in streets and parks in 2012‐2013. The tree care team con nued to inves gate a wide variety of species suitable for use within its parkland and street environment.
The tree care team has ini ated addi onal programs such as integrated pest management to provide greater protec on of its significant street scapes from pest and disease outbreaks.
Banyule inspected and pruned 35,000 trees throughout the municipality under Council’s rou ne Street Tree
Maintenance Contract.
Council is now working on an urban tree management plan, as well as an urban forest plan, which will help us care for and manage our precious trees. It will also help provide a vision for how we manage our green spaces and green infrastructure for future genera ons.
Further community consulta on is planned over the next year. Details will be posted on Council’s website www.banyule.vic.gov.au/Council/News‐and‐Public‐No ces/Urban‐Forest‐Strategy
The Significant Trees and Vegeta on Register lists individual trees, groups of trees and areas of vegeta on in Banyule that have special significance. Any vegeta on nominated for inclusion on the Significant Trees and Vegeta on Register may be located on public or private land.
Council regularly receives nomina ons for significant vegeta on. Nomina on forms can be obtained on Council’s website www.banyule.vic.gov.au or from Council’s service centres. Assessment of nomina ons occurs twice yearly and is conducted by qualified specialists.
Currently there are 420 lis ngs (an increase from 312 lis ngs in 2001) with well over 700 individual species ESO4 protected*.
* ESO4 refers to Schedule 4 to the Environmental significance
overlay which is contained in Council’s ’Banyule Planning Scheme’.
Powerful Owl chick in nes ng box©Ian Moodie
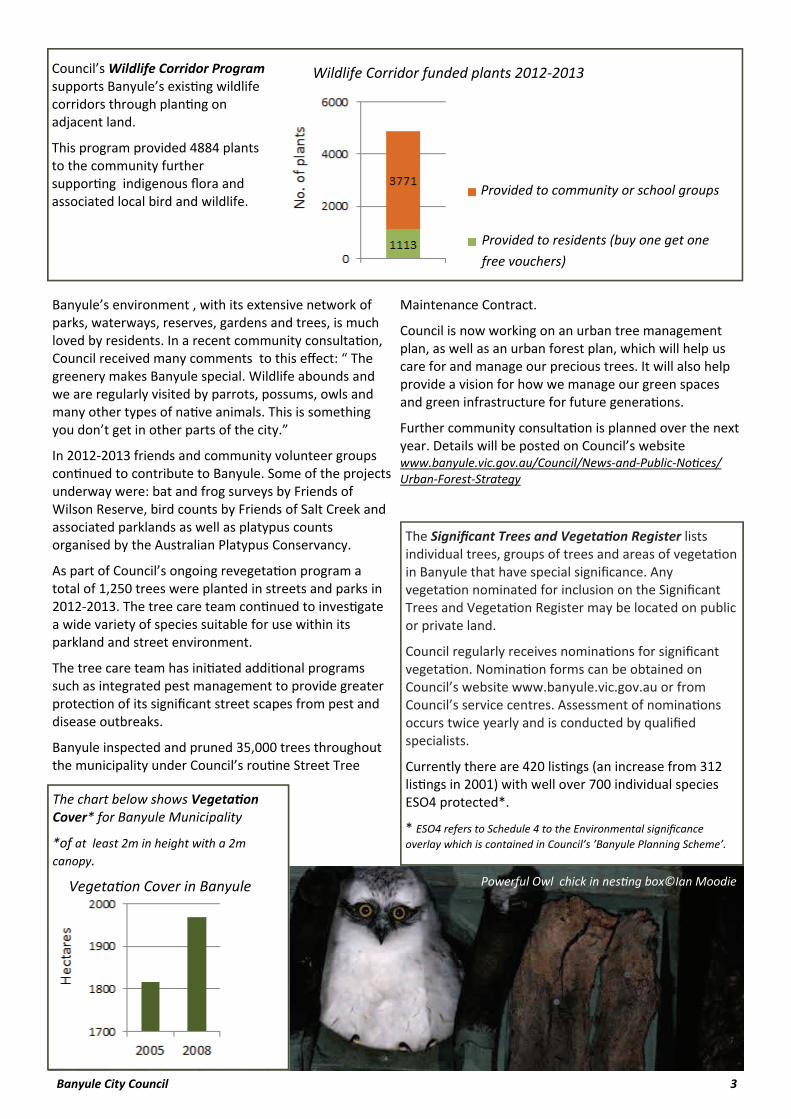
Provided to community or school groups
Provided to residents (buy one get one
free vouchers)
Council’s Wildlife Corridor Program supports Banyule’s exis ng wildlife corridors through plan ng on adjacent land.
This program provided 4884 plants to the community further suppor ng indigenous flora and associated local bird and wildlife.
The chart below shows Vegeta on Cover* for Banyule Municipality
*of at least 2m in height with a 2m
canopy.
Vegeta on Cover in Banyule

2012 ‐ 2013 State of the Environment Report 4
2. Conserve water and improve stormwater quality Key performance indicator: Percentage reduc on in potable water use across Council opera ons
The $6 million Banyule Stormwater Harves ng Project was recently completed at Kalparrin Gardens in Greensborough, Chelsworth Park and Ivanhoe Golf Course in Ivanhoe and DeWinton Park in Rosanna.
The image above shows the Chelsworth Park underground storage being built.
This project is one of the largest collec ons of stormwater treatment, harves ng and re‐use infrastructure in metro Melbourne. When opera onal, this project will have the following benefits:
a more sustainable source of water providing up to 138 million litres of stormwater per year to replace mains water for irriga on to help keep over 30 hectares of open space green
over $300,000 worth of annual water bill savings
over 200 tonnes of pollu on per year stopped from reaching local waterways
improved wildlife habitat
negligible loss of open space with the under‐grounding of over 15 million litres of water storage
As shown in the pie graph below, irriga on of open space for sport and recrea on is Council’s biggest water use. In providing a more sustainable water source, stormwater harves ng underpins community health and wellbeing.
Other open space water conserva on measures include irriga on efficiency upgrades, conversions of sports fields to warm season grasses and tennis court conversions so less water is needed. There have been over 40 sports surface conversions or upgrades.
Water consump on by Sector 2012 ‐ 2013 (kL)
Council’s objec ve is to create a more water sensi ve city by integra ng water conserva on and stormwater improvement.
We will use water more efficiently, harvest rainwater and stormwater as alterna ve sources and improve waterway health by
removing stormwater pollu on.
Banyule City Council 5
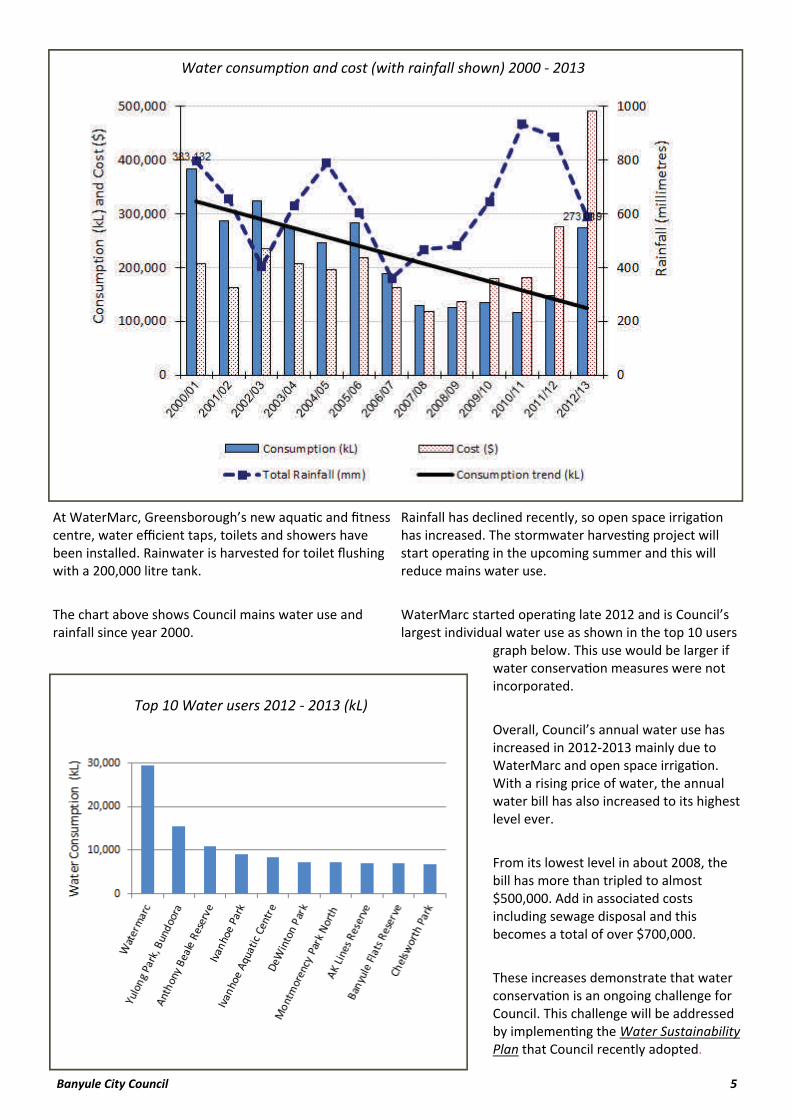
Water consump on and cost (with rainfall shown) 2000 ‐ 2013
Top 10 Water users 2012 ‐ 2013 (kL)
At WaterMarc, Greensborough’s new aqua c and fitness centre, water efficient taps, toilets and showers have been installed. Rainwater is harvested for toilet flushing with a 200,000 litre tank.
The chart above shows Council mains water use and rainfall since year 2000.
Rainfall has declined recently, so open space irriga on has increased. The stormwater harves ng project will start opera ng in the upcoming summer and this will reduce mains water use.
WaterMarc started opera ng late 2012 and is Council’s largest individual water use as shown in the top 10 users
graph below. This use would be larger if water conserva on measures were not incorporated.
Overall, Council’s annual water use has increased in 2012‐2013 mainly due to WaterMarc and open space irriga on. With a rising price of water, the annual water bill has also increased to its highest level ever.
From its lowest level in about 2008, the bill has more than tripled to almost $500,000. Add in associated costs including sewage disposal and this becomes a total of over $700,000.
These increases demonstrate that water conserva on is an ongoing challenge for Council. This challenge will be addressed by implemen ng the Water Sustainability Plan that Council recently adopted.

2012 ‐ 2013 State of the Environment Report 6
3. Deliver ac on on climate change
Key performance indicator: Reduc on in
Council's greenhouse gas emissions
Breakdown of greenhouse gas emissions
tonnes (tCO₂e) 2012 ‐ 2013
Council’s objec ve is to reduce Council energy
use, greenhouse gas emissions and associated
opera ng costs with the eventual target of
carbon neutrality.
Council has allocated $4.7 million over the next two years to improve streetlight energy efficiency. Exis ng 80 wa Mercury Vapour lights will be replaced with new technology that uses 67% less electricity per light to produce similar illumina on. The image above shows one of these new light types, the 30 wa T5 Fluorescent. Project benefits include an approximate 19% Council emissions reduc on and annual cost savings of about $300,000.
Council staff use public transport and a number of hybrid cars. About 10% of streetlights are powered by emissions‐free ‘GreenPower’ renewable electricity.
About $100,000 worth of solar hot water (SHW) panels will be installed across three of Council’s largest energy using buildings.
SHW panels have been installed at WaterMarc, Greensborough’s new aqua c and fitness centre opened in late 2012. Insula on including for the pool hall floor, efficient ven la on and air condi oning and ligh ng are amount other energy saving features.
Installa on is underway of a natural gas fired cogenera on (cogen) plant that will produce electricity and pool hea ng for WaterMarc. Cos ng about $700,000, cogen will be more energy efficient than grid electricity and conven onal boilers. The benefits include an approximate 17% Council emissions reduc on and an annual cost saving of about $100,000.
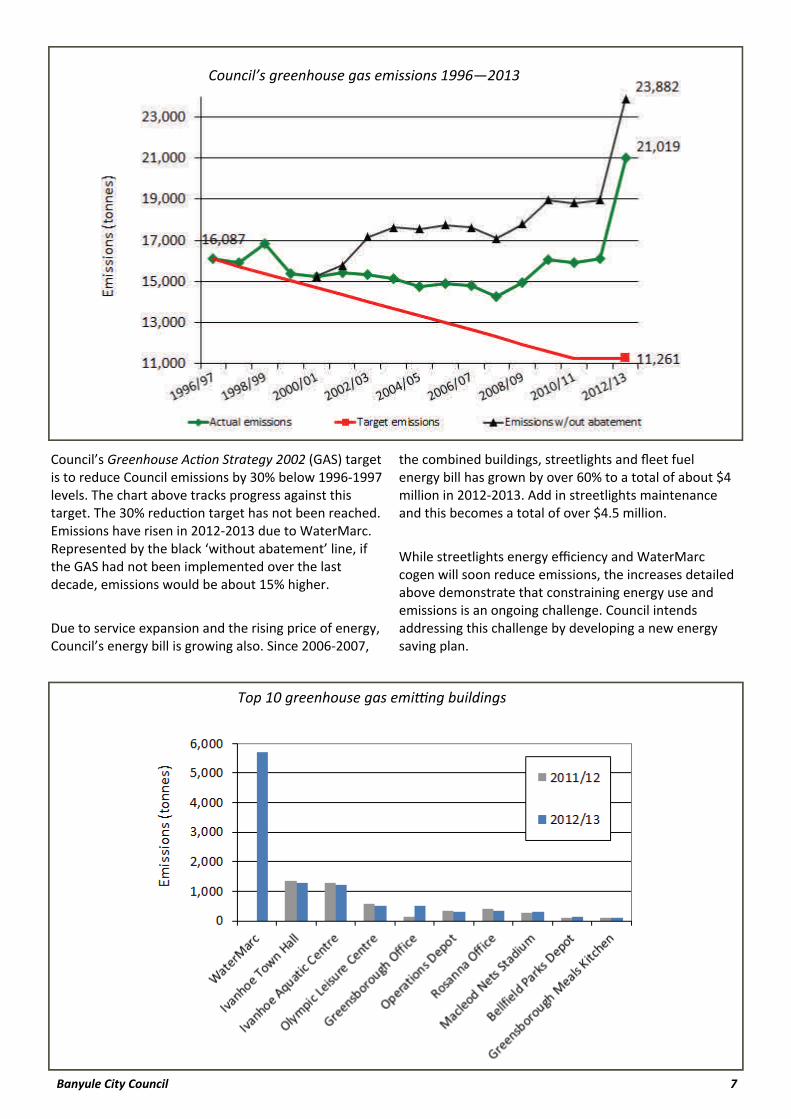
WaterMarc is a large service expansion for Council and it caters for many visitors who derive health and wellbeing benefits. Despite its energy saving features, WaterMarc has become Council’s largest energy using facility as shown in the top 10 greenhouse gas emi ng buildings graph right. It has also contributed to Council’s stock of buildings overtaking streetlights as the largest emissions source category as shown in the in the pie chart le .
Banyule City Council 7
Council’s greenhouse gas emissions 1996—2013
Council’s Greenhouse Ac on Strategy 2002 (GAS) target is to reduce Council emissions by 30% below 1996‐1997 levels. The chart above tracks progress against this target. The 30% reduc on target has not been reached. Emissions have risen in 2012‐2013 due to WaterMarc. Represented by the black ‘without abatement’ line, if the GAS had not been implemented over the last decade, emissions would be about 15% higher.
Due to service expansion and the rising price of energy, Council’s energy bill is growing also. Since 2006‐2007,
the combined buildings, streetlights and fleet fuel energy bill has grown by over 60% to a total of about $4 million in 2012‐2013. Add in streetlights maintenance and this becomes a total of over $4.5 million.
While streetlights energy efficiency and WaterMarc cogen will soon reduce emissions, the increases detailed above demonstrate that constraining energy use and emissions is an ongoing challenge. Council intends addressing this challenge by developing a new energy saving plan.
Top 10 greenhouse gas emi ng buildings

2012 ‐ 2013 State of the Environment Report 8
4. Avoid waste genera on Key performance indicator: Percentage of waste diverted from landfill
This year Council con nued to promote the message of avoiding unnecessary waste. A significant change to Council’s kerbside collec on service occurred in 2004 with the introduc on of the green waste bin along with the introduc on of a fully commingled recycling bin, which moved away from the separate recycling and bundled paper collec on.
The three bin system (rubbish, recycle and green) has seen the waste diversion from landfill increase from around 40% in 2003‐2004 to 53% this year.
It can be seen from the graph below that although the percentage of waste diverted to landfill this year is slightly down from the last two years, this has been caused by an overall reduc on in waste per household rather than an increase in waste going to landfill.
An overall lowering of total waste per household is a very posi ve result as encouraging residents to not
produce as much waste in the first place is fundamental to Council’s Avoid, Reduce, Reuse, Recycle message.
Council’s target to divert waste to landfill is aligned with the state government target of 65% by 2014.
Community Sa sfac on Index scores are commonly used in the market research industry to represent the extent of customer sa sfac on. The Victorian Local Government Community Sa sfac on Survey is coordinated by the Department of Planning and Community Development. In 2013 Banyule achieved a result of 79 for ‘Waste Management (performance). This result was above the average of 74 for metropolitan councils.
This result shows that Banyule residents are sa sfied with Council’s performance in the area of waste management.
Total waste per household over the years 2009 ‐ 2013
Council works to establish policies that support a reduced environmental impact for the Banyule community. We provide
leadership and advocacy to manage resource consump on and minimise environmental impact.
Banyule City Council 9
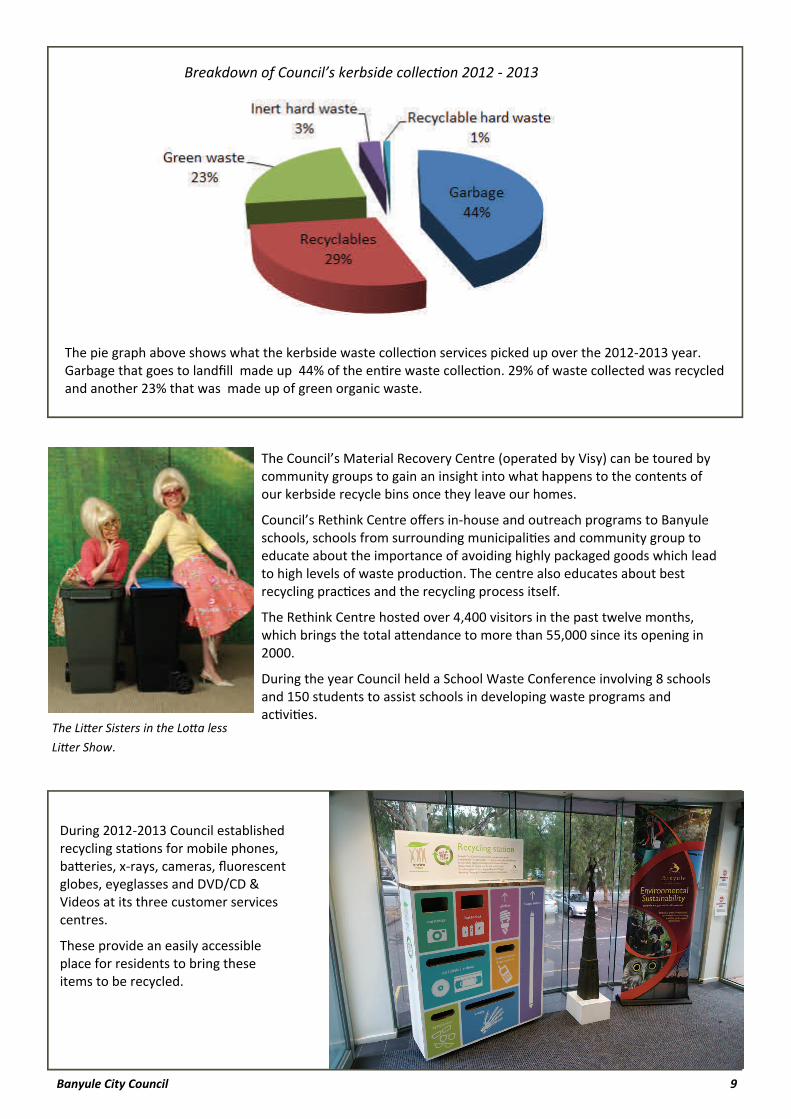
Breakdown of Council’s kerbside collec on 2012 ‐ 2013
The Li er Sisters in the Lo a less
Li er Show.
The pie graph above shows what the kerbside waste collec on services picked up over the 2012‐2013 year. Garbage that goes to landfill made up 44% of the en re waste collec on. 29% of waste collected was recycled and another 23% that was made up of green organic waste.
The Council’s Material Recovery Centre (operated by Visy) can be toured by community groups to gain an insight into what happens to the contents of our kerbside recycle bins once they leave our homes.
Council’s Rethink Centre offers in‐house and outreach programs to Banyule schools, schools from surrounding municipali es and community group to educate about the importance of avoiding highly packaged goods which lead to high levels of waste produc on. The centre also educates about best recycling prac ces and the recycling process itself.
The Rethink Centre hosted over 4,400 visitors in the past twelve months, which brings the total a endance to more than 55,000 since its opening in 2000.
During the year Council held a School Waste Conference involving 8 schools and 150 students to assist schools in developing waste programs and ac vi es.
During 2012‐2013 Council established recycling sta ons for mobile phones, ba eries, x‐rays, cameras, fluorescent globes, eyeglasses and DVD/CD & Videos at its three customer services centres.
These provide an easily accessible place for residents to bring these items to be recycled.

2012 ‐ 2013 State of the Environment Report 10
5. Encourage environmental stewardship Key performance indicator: A endance at Councils in house waste educa on programs
Program Objec ve
Home Harvest Fes val
www.banyule.vic.gov.au/Council/Whats‐On
Run in conjunc on with Nillumbik Shire, over a weekend in March local vegetable growers produce is cooked up into a huge community lunch to be shared.
Environmental Sustainability Grants
www.banyule.vic.gov.au/Council/Grants/Environmental‐sustainability‐Grants
Each year Council awards Environmental sustainability grants to local community groups or organisa ons for projects that aim to achieve posi ve environmental outcomes. Grant applica ons open each July. In 2012‐2013, 20 successful applicants were awarded a total of $16,824.
Departmental Environmental Representa ves
This is a Council internal staff program where they support the opera on of and promote environmental sustainability ini a ves across Council.
Sustainable Homes and Communi es
Program
www.sustainablecommuni es.vic.gov.au
A behaviour change program which offers a range of prac cal informa on and ways to reduce energy use, greenhouse gas emissions, water use, waste produc on, as well as improving biodiversity, uptake of sustainable food op ons, and increasing sustainable transport use in homes and the broader community. In 2012‐2013, 6 workshops were run in Banyule with a total of 360 par cipants. A joint awards night with Darebin Council had an a endance of 216 from Banyule and Darebin municipali es.
Teachers Environmental Network Run in conjunc on with Nillumbik Shire Council. During the 2012‐13 financial year 6 TEN mee ngs were held to provide an opportunity for local teachers to a end professional development on teaching sustainability and making their schools more sustainable places. Topics included potable water conserva on and organic waste management.
Wildlife Corridor Program www.banyule.vic.gov.au/Council/Environment‐and‐Sustainabilty/Wildlife/Wildlife‐Corridor‐Program
Informa on on biodiversity is offered to community groups, individuals who contact Council and schools. In 2012‐2013 Council delivered to 2362 people across 30 events. Most of these sessions include a presenta on about biodiversity and a plan ng ac vity.
Spring Outdoors
www.banyule.vic.gov.au/Council/Environment‐and‐Sustainabilty/Get‐involved/Spring‐Outdoors‐2013
Each Spring Banyule, Manningham and Nillumbik Council’s present an extensive program of events designed to get people outside and engaged in environmental ac vi es. This year Banyule hosted 8 events as a part of the Spring Outdoors program of regional events including Breakfast with the Birds and Catch a Carp Day.
Rethink Waste Wise Educa on Centre and Outreach programs
www.rethink.vic.gov.au
The Rethink Centre provides both in house and out reach educa onal programs addressing minimising waste. These are suitable for Primary, Secondary land ter ary level students along with interested community groups.
Waterwatch
www.vic.waterwatch.org.au
This is a local waterway monitoring program hosted by Banyule Council for 5 local Councils and Melbourne Water. Volunteers are trained to carry out water quality tes ng and repor ng.
Kids Teaching Kids Program The 2012 KTK conference was a joint project with Nillumbik Shire Council and Eltham North Primary. It was a ended by students 10 local schools many of whom presented on the topic of sustainable energy.
1
Council works to encourage environmental educa on and promote
community par cipa on to leverage change within the community

Banyule City Council 11
2
7
6 5
3
4
1. Gardening workshop—Sustainable homes
and communi es program
2. Student plan ng ‐ Wildlife corridor pro‐
gram
3. Learning to mend ‐ Sustainable homes and
communi es program
4. Greenhouse/Chook house ‐ Environmental
sustainability grants
5. Food Swap ‐ Sustainable homes and com‐
muni es program
6. Home Harvest fes val
7. Produce from St Bernade e's Primary‐
Environmental sustainability grants
8. Spring Outdoors ‐ community walk
9. Plan ng for a frog bog
10. Kids teaching kids
8
9 10