The State of Broadband: Broadband catalyzing sustainable development. September 2017. United Nations
104
The State of Broadband: Broadband catalyzing sustainable development September 2017
-
Upload
andres-rodriguez-seijo -
Category
Government & Nonprofit
-
view
1.551 -
download
0
Transcript of The State of Broadband: Broadband catalyzing sustainable development. September 2017. United Nations

broadbandcommission.org
The State of Broadband: Broadband catalyzing
sustainable developmentSeptember 2017
ISBN 978-92-61-25411-7
9 7 8 9 2 6 1 2 5 4 1 1 7


THE STATE OF BROADBAND 2017: BROADBAND CATALYZING SUSTAINABLE DEVELOPMENT
September 2017

This Report has been written collaboratively, drawing on insights and contributions from a range of Commissioners and their organizations. It has been compiled and edited by the chief editor and co-author, Phillippa Biggs with Youlia Lozanova as co-author, who contributed significantly to Chapter 4. Esperanza Magpantay provided statistical support and data. Design concepts were developed by Ahone Njume-Ebong and Jie Huang of ITU, with support from Simon de Nicola. We should especially like to thank Doreen Bogdan-Martin, Christophe Larouer, Catalin Marinescu and Francois Rancy of ITU and Joe Hironaka and Dov Lynch of UNESCO for their valuable review and comments. Contributors are listed in order, and under their contribution. We wish to thank the following people for their kind review and comments (listed in alphabetical order of institution, followed by alphabetical order of surname):
• Prof. Abdulaziz Salem Al Ruwais, Governor of CITC of the Kingdom of Saudi Arabia;• Harald Edquist, Heather Johnson, Richard Möeller, Elaine Weidman-Grunewald, Ericsson;• Lars Erik Forsberg, Hanna Hinrikus and the team at the European Commission Secretariat;• Flavia Alves, Chris Hemmerlein, Kevin Martin and Robert Pepper of Facebook;• Belinda Exelby, Joss Gillet and Claire Sibthorpe, GSMA;• Ivan Huang, Bill Lan, Jessica Song and Gary Yiu of Huawei;• Leong Keng Thai and Angela Wibawa of IMDA, Singapore;• Donna Bethea-Murphy and Rupert Pearce of Inmarsat;• Renata Brazil-David and Patrick Masambu of ITSO;• Phillippa Biggs, Youlia Lozanova, Ahone Njume-Ebong and Anna Polomska of ITU; • Dr. Speranza Ndege of Kenyatta University;• Woori Cho, Yina Ha, Won Joon Chang, Eun Ji Kim, Sunjoo Lee and Byungki Oh of KT;• Marc Vancoppenolle and Julia Jasinska, Nokia;• Dr. Ann Aerts, Aya Caldwell and Allison Lightwine, Novartis Foundation;• Anne Carblanc, Sam Paltridge and Lorrayne Porciuncula of the OECD;• Philipp Metzger and Nicolas Rollier of the Federal Office of Communications (OFCOM) of
Switzerland;• Fatima Sultan Al-Kuwari and Ali Hamad Hassan Al Sulaiti of Ooredoo;• Ghaith Almazaina and Saad Hassan of the TRA of the United Arab Emirates;• David Atchoarena, Indrajit Banerjee, Gulser Corat, Joe Hironaka, Dov Lynch and Julia Romeu of
UNESCO;• Miguel Luengo-Oroz, Mila Romanoff and Josiane Toundzi Dzouankeu of UN Global Pulse;• Melle Groenestege and Tomas Lamanauskas of VEON.
ISBN:
978-92-61-25401-8 (paper version) 978-92-61-25411-7 (electronic version) 978-92-61-25421-6 (eBook version) 978-92-61-25431-5 (mobile version)
2 The State of Broadband 2017

1 Introduction ......................................................................................................................................6
2 Towards our Connected Future: Mostly Still a Strong Growth Story ............................................102.1 Individual Internet Usage .....................................................................................................102.2 Household Internet Connectivity .........................................................................................152.3 International Perspectives on Internet Access ....................................................................162.4 Mobile Telephony & Mobile Broadband ..............................................................................182.5 Next-Generation Networks in Fixed Broadband ..................................................................332.6 Next-Generation Satellite Broadband ..................................................................................34
3 Progress in Policy and Regulation ..................................................................................................423.1 Progress in National Broadband Policy ...............................................................................423.2 The Changing Face of ICT Regulation ...................................................................................493.3 Affordability of Broadband ...................................................................................................583.4 Gender Equality & the Gender Digital Divide .....................................................................59
4 Harnessing Broadband for Sustainable Development ...................................................................644.1 Broadband for Improving Food Security and Ending Hunger .............................................664.2 Broadband for Improving Health and Wellbeing .................................................................674.3 Broadband for Ensuring Inclusive and Quality Education for All .........................................724.4 Broadband for Protecting the Environment ........................................................................76
5 Policy Recommendations ...............................................................................................................805.1 Review and update regulatory frameworks for broadband ................................................805.2 Develop and Enhance National Broadband Plans ...............................................................805.3 Encourage Investment in Internet Infrastructure ................................................................805.4 Benchmark Trends and Developments in Telecom and ICTs ...............................................815.5 Consider Infrastructure-Sharing ..........................................................................................81
List of Acronyms and Abbreviations .....................................................................................................99
3The State of Broadband 2017
CONTENTS

4 The State of Broadband 2017
CONTENTSTables
Table 1: Key Summary Statistics for the Telecom Market, 2010-2017 ............................................... 11Table 2: Location of Individuals using & not using Internet, end 2015, & Mobile, end 2016 ............ 13Table 3: Top Ten Largest Unconnected Markets in Mobile, end 2016 ................................................ 20Table 4: Topical Issues and Stages of Regulatory Intervention in 2015 .............................................. 55Table 5: Open Fiber field study on potential infrastructure re-use .................................................... 58Annex 1: Target 1 – List of National Broadband Policies ..................................................................... 82Annex 2: Fixed-Broadband Subscriptions per 100 inhabitants, 2016 ................................................. 88Annex 3: Active Mobile-Broadband Subscriptions per 100 inhabitants, 2016 ................................... 90Annex 4: Percentage of households with Internet, Developing Countries, 2015 .............................. 92Annex 5: Percentage of Individuals using the Internet, 2016 ............................................................. 94Annex 6: Percentage of Individuals using the Internet, Developing Countries, 2015 ........................ 96Annex 7: Percentage of Individuals using the Internet for LDCs, 2015 .............................................. 98
Figures
Figure 1: The Structure of this Report ................................................................................................... 9Figure 2: Internet User Penetration, 2017 .......................................................................................... 12Figure 3: Key Reasons for Lack of Connectedness to the Internet ..................................................... 12Figure 4: Proportion of Households with Internet Access by Region, 2017 ....................................... 15Figure 5: Mobile Share of Web Traffic, January 2017 ......................................................................... 19Map 1: Mobile Broadband Penetration, 2015 .................................................................................... 22Figure 6: Location of Global Mobile Broadband Subscriptions, 2017 ................................................ 22Figure 7: Time Spent on Mobile in India ............................................................................................. 25Figure 8: Telecom Industry Revenues are Growing, but Value is Shifting from Pipes to Content ...... 26Figure 9: Telco Priorities – Important Aspects in Improving Online Experience ................................ 31Figure 10: Global Fixed Broadband Subscribers, 2016 ....................................................................... 35Figure 11: Policy Leadership in National Broadband Plans, 2007-2017 ............................................. 43Figure 12: Generations of Telecom/ICT Regulation ............................................................................ 49Figure 13: Evolution of ICT regulation, worldwide, 2007-2015 .......................................................... 51Figure 14: Expanding purview of the ICT regulator, 2007 and 2015 .................................................. 53Figure 15: Regulators involved in the ICT Sector, 2015 ....................................................................... 54Figure 16: Net Neutrality Regulations, 2015 ....................................................................................... 56Figure 17: Broadband sub-basket, 2016 ............................................................................................. 58Figure 18: Differences persist between Men and Women’s Internet Use .......................................... 61
Viewpoints
Viewpoint 1: ICTs for Achieving the SDGs ............................................................................................. 7Viewpoint 2: Online Content and Applications as Major Drivers of Demand .................................... 13Viewpoint 3: Harnessing the Power of Connectivity ........................................................................... 16Viewpoint 4: Achieving Internet for All ............................................................................................... 19Viewpoint 5: Qatar’s Path Towards 5G ................................................................................................ 23Viewpoint 6: How Operators are Investing to Close the Coverage Gap ............................................. 25

5The State of Broadband 2017
Viewpoint 7: A Call for a New Deal & Equal Regulatory Treatment .....................................................28Viewpoint 8: Ensuring Future Growth in the Complex Digital Environment .......................................30Viewpoint 9: Wireless Broadband, an Important Ingredient of National Broadband .........................32Viewpoint 10: The Satellite Technology Revolution .............................................................................36Viewpoint 11: Satellite Broadband to Connect the Unconnected ......................................................38Viewpoint 12: The Importance of National Digital Agendas ................................................................44Viewpoint 13: Broadband Development in the Kingdom of Saudi Arabia ...........................................45Viewpoint 14: Bangladesh GiGA Island Partnership for Enhancing Corporate Social Value ...............46Viewpoint 15: Centre for Digital Innovation and Capacity-Building in the UAE ..................................48Viewpoint 16: ‘Digitalization Scorecard’ Assessing Policy & Regulatory Readiness for Digitalization .50Viewpoint 17: The Introduction of 5G in Switzerland – Opportunities and Challenges .....................52Viewpoint 18: Connecting the Unconnected by Collaborating with Power Companies .....................56Viewpoint 19: Making Internet Access in Africa More Affordable ......................................................59Viewpoint 20: Bridging the Gender Gap in Internet and Broadband Access & Use ...........................60Viewpoint 21: Harnessing Mobile Data for Social Good ......................................................................64Viewpoint 22: A Call for Government Leadership and Cooperation between ICT and Health ...........67Viewpoint 23: Preventing Global Epidemics with Broadband & ICTs ..................................................68Viewpoint 24: Leveraging Broadband and ICTs to Achieve SDG 4, Ensure Inclusive and Quality Education for All and to Promote Lifelong Learning ............................................................................72Viewpoint 25: Promoting Technologies in Education in Singapore .....................................................75Viewpoint 26: Monitoring the Mangroves in Malaysia to Protect the Environment ..........................77

The State of Broadband 20176
Since its establishment in 2010 by ITU and UNESCO, the Broadband Commission has sought to promote the adoption of effective and inclusive broadband policies and practices in countries around the world, with a view to achieving more inclusive and sustainable development by empowering individuals and society through the benefits of broadband and on the basis of respecting human rights.
In September 2015, UN Member States and the UN General Assembly agreed the ‘2030 Agenda for Sustainable Development’ (or ‘2030 Agenda’), setting out a global agenda for development based on economic prosperity, social inclusion and environmental sustainability. The Agenda identifies seventeen Sustainable Development Goals (SDGs). Member States acknowledged that ‘the spread of ICT and global interconnectedness has great potential to accelerate human progress’1. The overall Agenda refers to ICT as a cross-cutting ‘Means of Implementation’ (MoI), with four specific targets for ICT in the Goals for education (SDG 4), gender equality (SDG 5), infrastructure (SDG 9) and partnerships (SDG 17).
The SDGs build on the foundations established by the Millennium Development Goals (MDGs), but extend them in several important ways. The 2030 Agenda emphasizes the growing urgency of inclusive development efforts, placing environmental sustainability centre-stage. The 2030 Agenda applies directly to all
UN Member States, developed and developing countries alike.
The 2030 Agenda and the SDGs are often described as ‘universal’, ‘integrated’, ‘interlinked’ and ‘inter-dependent’. The 2030 Agenda is universal, meaning that it applies to all countries and all peoples in its quest “to leave no one behind”.
There are many strong and complex interlinkages among the SDGs. Some Goals and targets interact with others more strongly than others. Some Goals and targets reinforce each other (synergies). Other Goals need careful consideration to avoid them entering into conflict with one another (trade-offs) – for example, there is a need to develop asustainable agriculture capable of reducinghuman hunger, while limiting the impactingon the environment and habitat destruction.Some Goals may be considered by some asprerequisites or necessary for other Goals tobe achieved (enablers).
The SDGs are achievable, but require urgent efforts to improve progress in the speed, degree and equality of development, if they are to be achieved by 2030. This is where the Commission believes that broadband, and ICTs more broadly, can play a key enabling role in helping achieve the SDGs. Where appropriate services, skills and content are available, broadband offers a powerful platform for achieving the SDGs in many different ways (Viewpoint 1).
1 Introduction

For instance, Ericsson has investigated the relationship between ICT maturity and economic, social and environmental development for cities and countries (Ericsson 2014 & 20162). Preliminary results show a correlation of 0.85 between the SDG development index and ICT maturity, suggesting countries with high ICT maturity also rank highly in terms of fulfilling the SDGs3. Ericsson and Imperial College also investigated whether the diffusion of mobile broadband impacts economic development in terms of GDP4. Mobile broadband can be considered as both a driver and a result of GDP growth, and causality is often unclear. However, Ericsson’s study found that mobile broadband is significantly associated with GDP, and that it is the increase in mobile broadband penetration which is driving GDP development.
Broadband technologies are driving substantial transformation in different sectors and are accelerating achievement of the SDGs. Other advances in science, technology, and engineering such as big data, the Internet of Things (IoT), Intelligent Transport Systems (ITS), sensor networks, automation, computational modelling, machine learning, Augmented Reality (AR) and Artificial Intelligence (AI) will also contribute to economic and social welfare worldwide. These advances are becoming increasingly common place in the workplace, public spaces and homes, and of increasing interest to policy-makers. As these technologies continue to develop, stakeholders from academia, industry, government
and civil society should all contribute to discussions on their potential policy implications, and encourage growth through policy environments that support research, competition and innovation.
Viewpoint 1: ICTs for Achieving the SDGs
The SDGs create an unprecedented opportunity to achieve equitable growth, protect the environment and improve the quality of life of people around the world. But ICTs are essential to achieving the SDGs by 2030, by providing new solutions to help realize the vision set forth by the international community.
The possibilities are limitless. In a world where we produce enough food to feed everyone, 795 million people – one in nine – still go to bed hungry each night. Even more – one in three – suffer from some form of malnutrition5. Digital technologies create major opportunities to improve how we produce, distribute and manage food, as a major driver for economic growth and an accelerator for innovation.
In health systems, ICTs are being used to improve timeliness and accuracy of public health reporting and to facilitate disease monitoring, as well as speed responses. For example, healthcare
The State of Broadband 2017 7

The State of Broadband 20178
researchers are leveraging AI to develop new target proteins in the fight against cancer in weeks, rather than months 6. ICTs are also key for distance learning, and for rapid response in emergencies. ICTs can improve the ability to manage and exchange information in all areas of health, from research on molecular genetics to large-scale humanitarian interventions.
In education, ICTs are helping to generate more effective ‘creative learning’ options through online flexible learning spaces – for example, Huawei identifies these as interactive websites, chat rooms, web-based courses and online libraries7. Online websites offer learning resources and forums for interactive discussion, questions and advice for teachers, parents and students. ICTs can enhance learning for the more than 260 million children and youth around the world who are out of school8.
Broadband and ICTs are transforming traditional ways of conducting trade. They are enabling rapid growth in e-commerce and helping reduce trade costs, improve market information, expand market access, reach a broader network of buyers and participate in global value chains, while offering new opportunities for employment, training and skill improvement. While global trade growth has been stagnant for several years, e-commerce has been growing rapidly. According to UNCTAD, between 2013 and 2015, the value of online trade increased from USD 16 trillion to USD 22 trillion9. However, the benefits of ICTs and e-commerce may not materialize automatically nor smoothly – the returns to e-commerce differ significantly across different economies and industries, depending on their ability to adapt to the digital economy. Policy-makers at all levels need to consider carefully which actions to take, and which policy safeguards
to put in place to smooth the transition towards digital trade.
There has been considerable debate recently about whether ICTs and automation are creating or destroying jobs and enhancing working conditions (in terms of number, quality, productivity and working conditions). Although it still seems too early to draw a definitive conclusion, there have been some recent encouraging studies. The OECD report, “The Next Production Revolution”, published in May 2017 suggests that overall employment and economic effects from ICTs have proved positive10.
As ICTs become more powerful, more productive and more invisible, they offer opportunities in many different domains to help improve human lives and human existence. The Internet is a unique platform enabling direct communication among nearly 3.5 billion people today. It is also fast becoming our major portal to the world’s amassed knowledge. It enables one-on-one individual communication, as well as global dialogue and exchange, and helps make policy-makers and Governments more accountable to their citizens.
However, some 52% of the world’s population still do not have access to the Internet (ITU, 2017). Despite its widespread proliferation, while men outnumber women in terms of Internet usage in all regions of the world. The damage caused by recent malware attacks clearly reveals our growing vulnerability, along with our growing dependence on ICTs. We need to adapt regulatory responses to the pace of technological change and ensure that policies are put in place to maximize the benefits of ICTs, while minimizing their risks and downsides. The world needs the SDGs; the SDGs need ICTs.
Source: Houlin Zhao, Secretary-General of ITU, based on ITU’s recent report, “Fast-Forward Progress: Leveraging Tech to Achieve the Global Goals”, available from: www. itu. int/ ict4sdg.

The State of Broadband 2017 9
Figure 1: The Structure of this Report
Source: The Broadband Commission for Sustainable Development.
This report explores the current status of broadband around the world, and how it is contributing to development purposes. Following on from this introduction, Chapter 2 explores global trends in broadband connectivity and technologies, Chapter
3 explores developments in policies and regulation, Chapter 4 explores the important applications of broadband for sustainable development, while Chapter 5 presents some preliminary policy recommendations.
10 The State of Broadband 2017
1 Paragraph 15, ‘Transforming our world: The 2030 Agenda for Sustainable Development’, available at: https:// sustainabledevelopment. un. org/ content/ documents/ 7891TRANSFORMING%20 OUR%20 WORLD. pdf
2 https:// www. ericsson. com/ res/ docs/ 2016/ 2016- networked- society- city- index. pdf https:// www. ericsson. com/ assets/ local/ networked- society/ reports/ city- index/ networked- society- city- index- 2014. pdf
3 https:// www. ericsson. com/ res/ docs/ 2016/ 2016- networked- society- city- index. pdf 4 “How Important Are Mobile Broadband Networks for the Global Economic Development?”, Ericsson and
Imperial College (2017), written by Harald Edquist, Peter Goodridge, Jonathan Haskel, Xuan Li and Edward Lindquist https:// spiral. imperial. ac. uk/ bitstream/ 10044/ 1/ 46208/ 2/ Goodridge%202017 -05. pdf
5 World Food Programme at http:// www1. wfp. org/ zero- hunger 6 ITU Blog, The next frontier is here: 3 key capabilities that make AI so valuable, 3 April 2017. 7 White Paper on Technology & Education, Huawei (2017), at: www. huawei. com/ en/ news/ 2017/ 2/ WhitePaper-
Technology- Education8 UNESCO, 263 Million Children and Youth Are Out of School, 15 July 2016. 9 UNCTAD, Harnessing the power of e-commerce for economic growth and sustainable development, 15 March
2017. 10 www. oecd. org/ newsroom/ new- technology- still- under- used- by- businesses. htm
Endnotes
Chapter 1

The State of Broadband 201710
Global broadband continues to show healthy growth, although there are some challenges in terms of: 1) growing digital inequality between developed and developing countries, as well as between the rich and the poor within countries; 2) the rates, roll-outs and financing needs of new deployments and network upgrades; 3) slowing growth in mobile subscriptions and SMS volumes may be inevitable as some markets approach maturity (as well as for some operators, revenues), operators are having to navigate slowing subscription growth and adapt to meet consumer demands for data; and 4) making Internet access more affordable in developing countries.
It is becoming increasingly difficult to define and monitor – let alone measure – broadband and ICTs. The latest technologies are increasingly integrated, invisible and ubiquitous. The boundaries between telecoms, IT, ICT and Internet are now rather blurred1. Any estimate of the size of telecoms and the ICT sector depends on which categories are – and are not – included.
According to the research consultancy IDC, the global Information Technology (IT) market (including hardware, software, services, and telecommunications), was estimated at USD 3.8 trillion in 2016, up from USD 3.7 trillion in 2015, with the US market alone accounting for just over a quarter or approximately 28% of this total (equivalent to just over USD 1 trillion). Gartner’s forecasts are slightly
lower, estimating that worldwide IT spending amounted to some USD 3.4 trillion in 2016, projected to approach USD 3.5 trillion in 2017 and USD 3.8 trillion in current dollars by 20202.
The online market intelligence portal Statista estimates revenues of the global ICT sector as amounting to some 3.98 trillion euros (approximately USD 4.4 trillion) for 2016, projected to reach 4.46 trillion euros by 2019. S&P Capital IQ estimates that telecommunication revenues amounted to USD 3.8 trillion for 2015 (Figure 8), although Statista estimates annual telecom service revenues above 1 trillion euros (USD 1.4 trillion)3. Back in 2012, the Boston Consulting Group (BCG) estimated the size of the broader ‘Internet economy’ would reach USD 4.2 trillion by 2016, equivalent to 5.3% of total GDP for G-20 economies alone (an increase in share from 4.1% of total GDP in 2010). While these estimates vary, they are all large – and growing.
2.1 Individual Internet Usage
In terms of connectivity, and who is connected (and who is not), the picture is rather different for mobile and for Internet (Table 1). By the end of 2017, some 3.58 billion people are projected to be online, equivalent to some 48.0% of the global population, up from
2 Towards our Connected Future: Mostly Still a Strong Growth Story
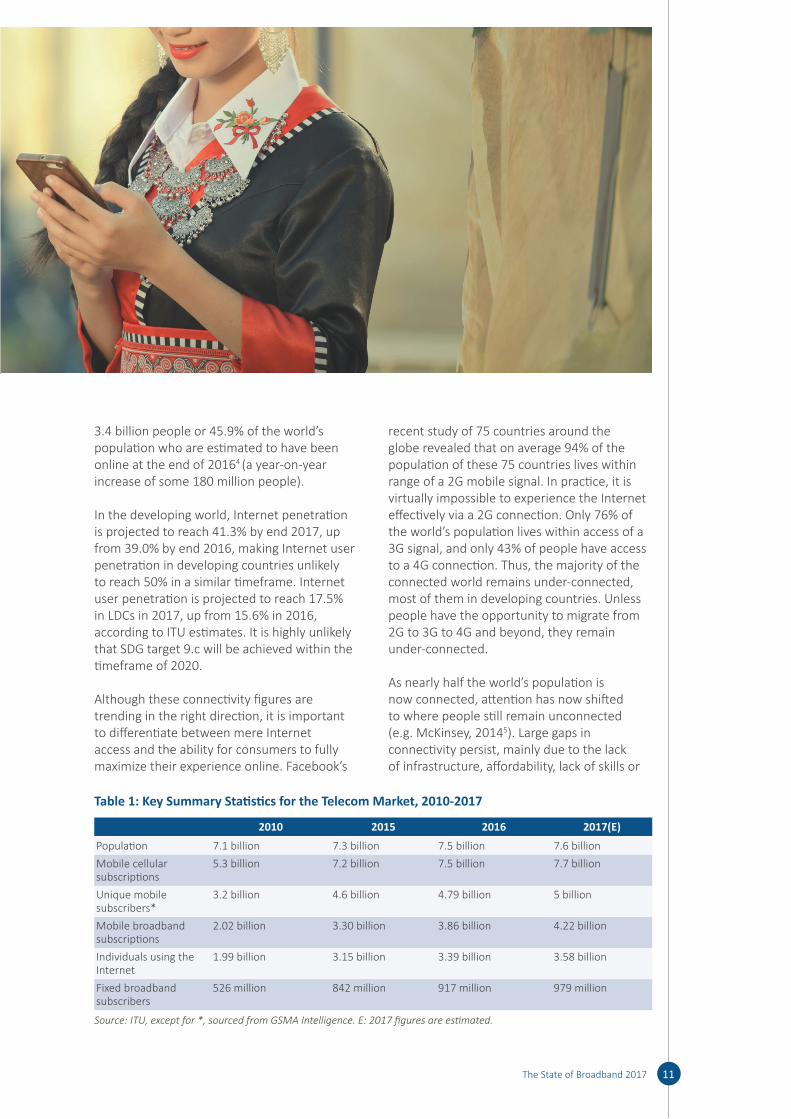
3.4 billion people or 45.9% of the world’s population who are estimated to have been online at the end of 20164 (a year-on-year increase of some 180 million people).
In the developing world, Internet penetration is projected to reach 41.3% by end 2017, up from 39.0% by end 2016, making Internet user penetration in developing countries unlikely to reach 50% in a similar timeframe. Internet user penetration is projected to reach 17.5% in LDCs in 2017, up from 15.6% in 2016, according to ITU estimates. It is highly unlikely that SDG target 9.c will be achieved within the timeframe of 2020.
Although these connectivity figures are trending in the right direction, it is important to differentiate between mere Internet access and the ability for consumers to fully maximize their experience online. Facebook’s
recent study of 75 countries around the globe revealed that on average 94% of the population of these 75 countries lives within range of a 2G mobile signal. In practice, it is virtually impossible to experience the Internet effectively via a 2G connection. Only 76% of the world’s population lives within access of a 3G signal, and only 43% of people have access to a 4G connection. Thus, the majority of the connected world remains under-connected, most of them in developing countries. Unless people have the opportunity to migrate from 2G to 3G to 4G and beyond, they remain under-connected.
As nearly half the world’s population is now connected, attention has now shifted to where people still remain unconnected (e.g. McKinsey, 20145). Large gaps in connectivity persist, mainly due to the lack of infrastructure, affordability, lack of skills or
The State of Broadband 2017 11
Table 1: Key Summary Statistics for the Telecom Market, 2010-2017
2010 2015 2016 2017(E)Population 7.1 billion 7.3 billion 7.5 billion 7.6 billionMobile cellular subscriptions
5.3 billion 7.2 billion 7.5 billion 7.7 billion
Unique mobile subscribers*
3.2 billion 4.6 billion 4.79 billion 5 billion
Mobile broadband subscriptions
2.02 billion 3.30 billion 3.86 billion 4.22 billion
Individuals using the Internet
1.99 billion 3.15 billion 3.39 billion 3.58 billion
Fixed broadband subscribers
526 million 842 million 917 million 979 million
Source: ITU, except for *, sourced from GSMA Intelligence. E: 2017 figures are estimated.

The State of Broadband 201712
lack of relevant local content (Figure 3). On the supply side, ineffective policies, outdated regulatory frameworks and reduced incentives to invest also play their part. The business models required to achieve universal service goals are also evolving. While industry may be focusing its efforts on potentially more lucrative, easy-to-serve urban areas, there is a need to stimulate deployment across the whole territory, including rural and remote areas. The source and origin of most of the investment in telecoms may also be changing (Viewpoint 6). Promoting investment in broadband connectivity from a broad range of sectors can help achieve the full potential of these technologies and bring the world closer to the goal of an inclusive digital society accessible by all.
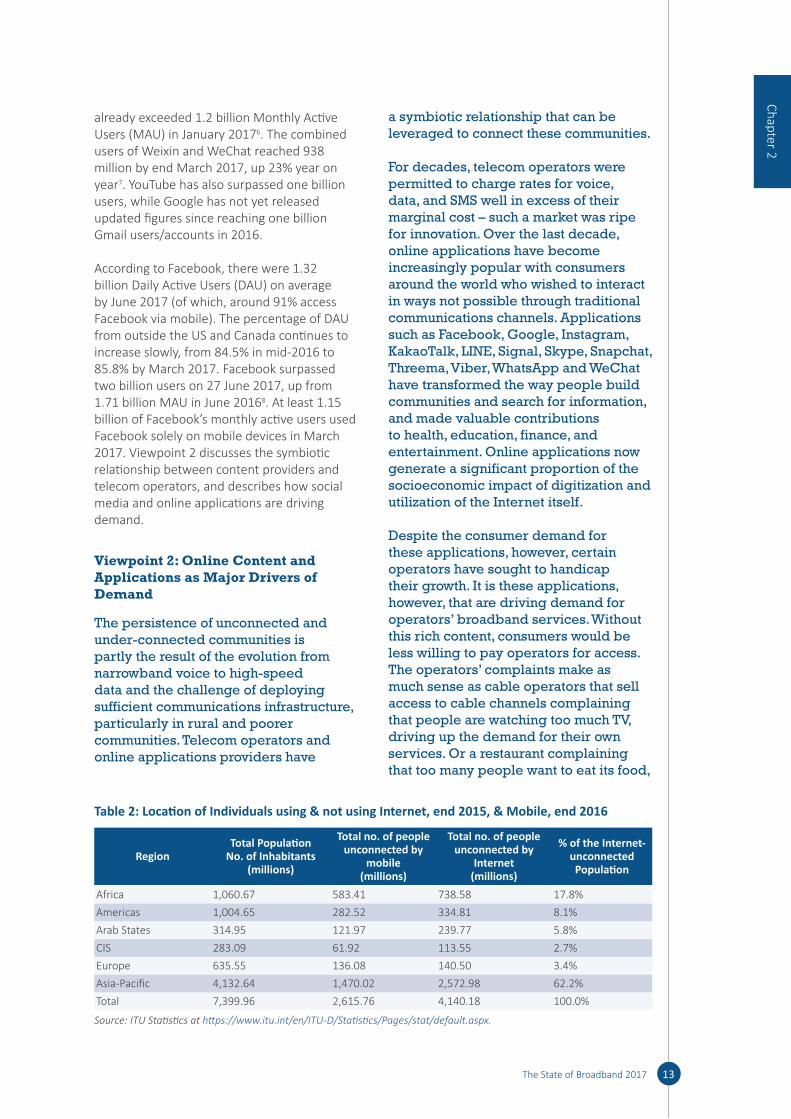
Table 2 shows the regional location of individuals using and not using the Internet, with around 62% of all people not online residing in the Asia & the Pacific region. China is the world’s largest Internet market, with around 700 million Internet users, followed by India with 355 million.
No discussion of growth in the Internet would be complete without discussion of growth in online tools and applications used for health, education, entertainment, finance, and government services, which seek to meet demand and the increase in connections and devices. For a discussion of health and education, see Chapter 4.
With regard to social media, from the milestone of one billion WhatsApp users (achieved in February 2016), WhatsApp
Figure 2: Internet User Penetration, 2017
Note:* denotes an estimate. Source: ITU World Telecommunication Indicators Database.
Figure 3: Key Reasons for Lack of Connectedness to the Internet
Source: “Working Together to Connect the World by 2020 – Reinforcing Connectivity Initiatives for Universal and Affordable Access“, available from: www. broadbandcommission. org.
The State of Broadband 2017 13
already exceeded 1.2 billion Monthly Active Users (MAU) in January 20176. The combined users of Weixin and WeChat reached 938 million by end March 2017, up 23% year on year7. YouTube has also surpassed one billion users, while Google has not yet released updated figures since reaching one billion Gmail users/accounts in 2016.
According to Facebook, there were 1.32 billion Daily Active Users (DAU) on average by June 2017 (of which, around 91% access Facebook via mobile). The percentage of DAU from outside the US and Canada continues to increase slowly, from 84.5% in mid-2016 to 85.8% by March 2017. Facebook surpassed two billion users on 27 June 2017, up from 1.71 billion MAU in June 20168. At least 1.15 billion of Facebook’s monthly active users used Facebook solely on mobile devices in March 2017. Viewpoint 2 discusses the symbiotic relationship between content providers and telecom operators, and describes how social media and online applications are driving demand.
Viewpoint 2: Online Content and Applications as Major Drivers of Demand
The persistence of unconnected and under-connected communities is partly the result of the evolution from narrowband voice to high-speed data and the challenge of deploying sufficient communications infrastructure, particularly in rural and poorer communities. Telecom operators and online applications providers have
a symbiotic relationship that can be leveraged to connect these communities.
For decades, telecom operators were permitted to charge rates for voice, data, and SMS well in excess of their marginal cost – such a market was ripe for innovation. Over the last decade, online applications have become increasingly popular with consumers around the world who wished to interact in ways not possible through traditional communications channels. Applications such as Facebook, Google, Instagram, KakaoTalk, LINE, Signal, Skype, Snapchat, Threema, Viber, WhatsApp and WeChat have transformed the way people build communities and search for information, and made valuable contributions to health, education, finance, and entertainment. Online applications now generate a significant proportion of the socioeconomic impact of digitization and utilization of the Internet itself.
Despite the consumer demand for these applications, however, certain operators have sought to handicap their growth. It is these applications, however, that are driving demand for operators’ broadband services. Without this rich content, consumers would be less willing to pay operators for access. The operators’ complaints make as much sense as cable operators that sell access to cable channels complaining that people are watching too much TV, driving up the demand for their own services. Or a restaurant complaining that too many people want to eat its food,
Chapter 2
Table 2: Location of Individuals using & not using Internet, end 2015, & Mobile, end 2016
RegionTotal Population
No. of Inhabitants (millions)
Total no. of people unconnected by
mobile (millions)
Total no. of people unconnected by
Internet (millions)
% of the Internet-unconnected Population
Africa 1,060.67 583.41 738.58 17.8%Americas 1,004.65 282.52 334.81 8.1%Arab States 314.95 121.97 239.77 5.8%CIS 283.09 61.92 113.55 2.7%Europe 635.55 136.08 140.50 3.4%Asia-Pacific 4,132.64 1,470.02 2,572.98 62.2%Total 7,399.96 2,615.76 4,140.18 100.0%
Source: ITU Statistics at https:// www. itu. int/ en/ ITU- D/ Statistics/ Pages/ stat/ default. aspx.

The State of Broadband 201714
driving up its food costs. Operators sell access—not content—but people only want that access to use online content. Online applications drive demand for their product. Without innovative online applications and content, why would people buy Internet access from operators?
Some operators have attempted to blame the popularity of online applications as limiting mobile operators’ ability to invest in their networks based upon inaccurate claims. Some operators have called for regulators to apply the “same rules for the same service” by encouraging authorities to subject all online applications to legacy telecommunications regulations. Such suggestions are misguided for several reasons. First, online applications do not offer the “same service” as telecom operators, and subjecting them to the “same rules” would be entirely inappropriate. For example, Google and Facebook do not provide equivalent services as operators – telecom operators and providers of online applications offer fundamentally different services. Operators offer access and some vertically integrated services that take advantage of, and are bundled with, general access. Online applications by contrast offer rich interactive experiences beyond voice and SMS (including chat, photo and video sharing, and payment services).
Emergency service obligations provide a good illustration of why technical distinctions between operators and applications matter. A critical component of providing emergency services is knowing the location of the caller to connect to emergency services, if necessary. Telecom operators have access to that information not because of the voice services they provide, but because of the network infrastructures they own. By contrast, online applications are not able to identify automatically the location of the caller or the location of the nearest first responder, or to easily connect the two.
Moreover, fundamental differences between the two sectors have led naturally to different rules. Traditional telecom regulations are intended to ensure that incumbent operators – which own underlying access infrastructure with high barriers to entry and face little competition – do not use these privileges to disadvantage consumers. By contrast, providers of online applications do not control underlying network infrastructure bottlenecks and must compete vigorously to retain customers that can easily switch between competing applications.
Further, some operators have argued that online applications do not generate economic value in the communities where their consumers live. However, recent research has shown that a 10% increase in online application usage has added on average USD 5.6 trillion in GDP across a panel of 164 countries in the period 2000 to 20159. Analysis Group has estimated that a 5% increase in WhatsApp generates USD 22.9 billion in global GDP, including significant value in Asia, Africa, and Latin America10. Deloitte estimated that, in 2014, Facebook enabled USD 227 billion of economic impact and 4.5m jobs globally11, numbers that have undoubtedly grown in the years since.
It has also been suggested that online applications “free ride” on network infrastructure financed wholly by operators. In truth, providers of online applications invest billions of dollars annually in a combination of physical facilities (such as data centers), fibre networks, servers and routers, which form an essential part of the physical fabric of the Internet. Providers of online applications invested an average of USD 33 billion per year in infrastructure from 2011-201312. More importantly, considerable operator revenue is spurred by consumer hunger for online applications. Online applications drive consumers’ willingness to pay for Internet access, giving telecom providers more opportunities to earn

The State of Broadband 2017 15
revenue and finance new infrastructure13. Consumers who demand the most data from their operator have been shown to spend more money on mobile contracts featuring high-speed data14, 15.
Regulatory authorities do not have to choose directly between the interests of online application providers and telecom operators. A more inclusive Internet—one that is widely available, affordable, and relevant—is the product of regulatory and policy frameworks that prioritize connectivity, competition, innovation, and most importantly, benefits to consumers.
Source: Facebook.
2.2 Household Internet Connectivity
In terms of connected households, the Broadband Commission’s target aimed to connect 40% of households in developing countries with Internet access (either fixed or mobile). The proportion of households in developing countries with access to the Internet is estimated to have increased from 37.6% in 2015 to 41.1% in 2016 and 42.9% in 2017 (Figure 4). This means that the Broadband Commission target of 40% was
achieved in 2016. However, this is a global average, which still masks strong regional disparities in access, with household Internet connectivity rates varying between 18.0% for Africa and 84.2% for Europe in 2017.
One new metric in this regard is the number of smart homes or homes equipped with devices that can be controlled remotely by smartphone or computer. In Europe and North America, the number of smart homes reached 17.9 million in 2015, of which, some 12.7 million smart homes were located in North America, representing 56% year-on-year growth. This number is expected to rise to 46.2 million by 2020, equivalent to a third (35%) of all North American households16. The European market is two to three years behind North America in terms of penetration and market maturity. By the end of 2015, there were 5.3 million smart homes in Europe forecasted to grow at a CAGR of 54% over the next five years to reach 44.9 million smart homes by 2020, equivalent to 20% of European households, according to the consultancy Berg Insight.
As mobile Internet speeds improve, fewer homes may seek or renew fixed connections. For example, the Pew Research Center suggests that the proportion of Americans surveyed who have home broadband adoption in the US might in fact have fallen for the first time, from 70% in 2013 to 67% of the adult population in 201517.
Chapter 2
Figure 4: Proportion of Households with Internet Access by Region, 2017
Source: ITU World Telecommunication Development Indicators.

The State of Broadband 201716
2.3 International Perspectives on Internet Access
The international digital divide typically compares access to the Internet between countries; however, qualitative differences in speed of access and Quality of Service (QoS) also matter. Akamai finds that the gap between the countries with the highest connection speeds and those with lowest connection speeds is continuing to grow in absolute terms. Akamai (Q1, 2017) finds that global average broadband connection speed increased steadily at 15% year-on-year to reach 7.2 Mbps for Q1 2017. Improvements in average connection speeds were positive in 114 out of 149 qualifying countries and regions. The top ten in terms of average connection speed are all OECD economies, except for Hong Kong (SAR, China)18.
According to Akamai, worldwide, 4, 10, 15 and 25 Mbps broadband adoption rates increased by 13%, 29%, 33% and 42% year-on-year, respectively. Global average peak connection speed increased 28% year-on-year to 44.6 Mbps for Q1 2017. The Republic of Korea continues to have the highest average connection speed globally (at 28.6 Mbps, up a stunning 9.3% since Q4 2016 alone), while Singapore continues to have the highest peak connection speed at 184.5 Mbps.
Meanwhile, the lowest performing countries continue to suffer from barely increased average national speeds, suggesting that the absolute gap is increasing. This matches an intriguing finding from Huawei’s recent 2017 Global Connectivity Index (GCI) that absolute gap inequality in global connectivity between countries may in fact be increasing (Viewpoint 3).
Viewpoint 3: Harnessing the Power of Connectivity
We are currently witnessing the fastest pace of change in ICTs the world has ever seen. But this is also a moment of great opportunity to thrive. ICT infrastructure, especially connectivity, plays an increasingly critical role in driving sustainable growth and
prosperity. Huawei’s Global Connectivity Index (GCI) is designed to provide policy-makers with a 360-degree view of the Digital Economy, supported by useful data and actionable insights needed as they transform toward the Digital Economy. The index tracks the progress of 50 nations in digital transformation, based on analysis of 40 indicators. It groups nations into three clusters based on their GCI scores: Starters, Adopters and Frontrunners. It points to progress made by the interplay of investment, adoption, user experience and the future potential of ICTs.
One of the key GCI findings this year is that the ‘digital divide’ risks becoming a ‘digital chasm’. Based on three years’ worth of observations of GCI data, the results reveal a widening S-curve in GCI scores (see Box Figure), indicating deepening inequality in global connectivity between starters, adopters and frontrunner countries.
In the GCI 2017 results, the ‘Frontrunner’ countries pull even further ahead, improving their GCI scores by 4.7 points, while ‘Adopters’ improve by 4.5 points. However, the ‘Starters’ lag even farther behind, improving their GCI score on average by only 2.4 points. We are witnessing the ICT equivalent of sociology’s “Matthew Effect”, where the “rich get richer and the poor get poorer” based on accumulated advantages over time. Policy-makers in Adopter countries, and especially in digital Starter countries, must consider the growing inequality in connectivity scores, as it will have continuing consequences for their ability to compete and sustain economic growth in the future digital economy and online trade and commerce.
The Frontrunners’ growing advantage is based on their head-start in ICT infrastructure deployment, as well as expertise in five core technologies: broadband, datacenters, cloud, Big Data and IoT. The GCI data show that investment in ICT Infrastructure

The State of Broadband 2017 17
can initiate a positively reinforcing ‘chain reaction’ leading to digital transformation, with cloud as a catalyst for that reaction.
Cloud adoption requires a strong and accessible broadband network to be in place first. From correlations of GCI data, the following findings emerge:
• The significance of fixed broadband: As Starters’ fixed broadband subscriptions reach 10%, they can begin to compete with Adopters’ Cloud capability. As Adopters’ fixed broadband subscriptions reach 35%, they reach the level of Frontrunners’ Cloud adoption rate.
• 4G coverage: As Starters achieve 15% 4G coverage, they can compete with Adopters’ cloud adoption rate. At 70% 4G coverage, Adopters can
compete with Frontrunners’ cloud adoption rates.
• Cloud acts as a catalyst: Once deployed, Cloud acts as a catalyst accelerating the time for a nation to tap the economic benefits of Big Data and IoT – ultimately leading to growth and prosperity. According to GCI data, when a nation reaches a threshold of 3% of its total IT spending on cloud, it begins to effectively use Big Data and IoT capabilities. This is a noticeable threshold that separates the Frontrunners from the rest.
These GCI findings suggest that there are increasing returns to investments in ICT infrastructure. A nation that makes an additional 10% investment in ICT Infrastructure from 2016 to 2025 can benefit from a multiplier effect to that investment. Based on an economic
Chapter 2
Box Figure: The Digital Divide Risks Becoming a Digital Chasm
Source: Huawei’s Global Connectivity Index.

The State of Broadband 201718
impact model, we find that every additional USD 1 of ICT infrastructure investment could bring a return of USD 3 in GDP at present, USD 3.7 in 2020 and the potential return increased to USD 5 in 2025. This equates to an accumulative USD 17.6 trillion in GDP to boost the global economy by 2025, broadly equivalent to the size of the European Union’s GDP in 2016.
Source: Huawei’s Global Connectivity Index 2017.
Over the last year, there has been impressive growth in the number of new Internet Exchange Points (IXPs), an important form of support infrastructure which can potentially help reduce latency, and cut transit costs. According to Packet Clearing House, 24 more countries established a new IXP over the twelve months between mid-2016 and mid-2017 (of which eleven were African). By mid-2017, 119 ITU Member States now have IXPs19, compared with 76 ITU Member States which do not. The total number of IXPs in ITU Member States globally is 471.
The EU as a whole has 145 IXPs. Eight countries have more than ten national IXPs, including: U.S. (84), Brazil (27), Russia (21) Argentina and Germany (20), Australia (18), France and Japan (16). Twenty-nine African countries have IXPs by mid-2017, nearly twice as many as the 15 African countries which had an IXP back in 2008. The growth of IXPs in Africa over the last year is nothing short of remarkable – Benin, Botswana, Burkina Faso,
Côte d’Ivoire, Rep. of Congo, Madagascar, Malawi, Mozambique, Rwanda, Sudan and Zimbabwe all established an IXP over the last twelve months to mid-2017.
2.4 Mobile Telephony & Mobile Broadband
The importance of mobile communications cannot be understated in terms of its economic and social significance. The GSMA estimates that the mobile industry contributes some USD 3.1 trillion (or about 4.3%) to global GDP and some USD 431 billion in public funding, and employs 32 million people either directly or indirectly.
A large and growing proportion of Internet usage takes place via mobile devices (on average, an estimated half of all web traffic – Figure 5), with many people now accessing the Internet exclusively via a mobile device. Media agency Zenith’s forecasts are even higher, estimating that 71% of all Internet consumption took place via mobile in 2016 and three-quarters of all Internet use was via mobile by 2017, with a growing number of consumers around the world accessing the web on smartphones and tablets. (The type of access device should not be confused with type of network, however – despite being accessed over mobile devices, Internet traffic is often still carried over fixed backhaul networks and accessed via Wi-Fi, as well as the mobile network).
Box Figure: Every Additional US$1 Invested Could Yield US$5 in GDP Growth by 2025
Source: Huawei’s Global Connectivity Index.

The State of Broadband 2017 19
With regard to mobile telephony, there were 4.79 billion unique mobile subscribers by the end of 2016 according to GSMA Intelligence (GSMAi), with the number of unique mobile subscribers set to surpass 5 billion this year20. Ericsson (2017) suggests this milestone may already have been achieved, estimating this figure slightly higher at 5.2 billion unique mobile subscribers today21. In any case, the number of unique mobile subscribers is growing fast – GSMAi forecasts that there will be 5.6 billion unique mobile subscribers globally by 2020, more than the estimated number of people with electricity at home (5.3 billion), bank accounts (4.5 billion) or running water (3.5 billion). The vast majority of new subscriber additions will come from developing markets – as many as 93%. GSMA (2016) estimates that the high growth rate in unique mobile subscribers of 7.7% between 2010-15 is set to slow to 4% from 2016.
Mobile telephony remains far more broadly available than Internet access. Cellular mobile connections now amount to 7.7 billion, exceeding the world’s population at 7.6 billion by mid-2017. By the end of 2016, around two-thirds of the world’s population were estimated to have personal access to a mobile phone (compared with around 48% overall Internet usage).
However, this means that around one-third of the world’s inhabitants still do not own a personal mobile phone, although a further 10-20% among the unconnected might have indirect access to one (taking into account larger household size among developing countries, for example). The top ten largest unconnected markets in mobile are shown in Table 3, accounting for just over six-tenths or 61.3% of the total number of people without access to mobile telephony. Half of these countries are in Asia, three countries are in Africa, and two are in the Americas. The top five largest unconnected markets in mobile in terms of absolute subscriber numbers in fact account for nearly half (47.8%) of the total number of people without access to mobile telephony.
Viewpoint 4: Achieving Internet for All
Mobile networks have brought voice and Internet services to billions of people around the globe over the last 25 years, and and the technology is now accessible to nearly 50% of the world’s population. However, more than 50 percent of the world’s population still do not have Internet access. The most cost-efficient way to bring more people online is to leverage existing mobile
Chapter 2
Figure 5: Mobile Share of Web Traffic, January 2017
Source: Slide 257, Hootsuite Statcounter, “Internet Trends”, Mary Meeker, May 2017, www. kpcb. com/ internet- trends

The State of Broadband 201720
network infrastructure. If this happens, covering 95% of the world’s population within five years’ time is within reach. The social benefits that mobile broadband brings are increasingly recognized in, for example, improved access to educational resources, more efficient health systems, and the possibilities to improve livelihoods through mobile financial services, to name just a few.
Ericsson and Imperial College have investigated to what extent the diffusion of mobile broadband has impacted economic development in terms of GDP. This joint study shows that mobile broadband is significantly associated with GDP. There is a positive association when mobile broadband is first introduced, followed by a longer run effect as mobile broadband gradually diffuses throughout different economies. The findings provide evidence that mobile broadband introduction and penetration drive growth in GDP. The study suggests that a 10% increase in mobile broadband adoption may drive a 0.6–2.8% increase on average in economic growth.
Achieving the SDGs by 2030 means leveraging existing and widely-deployed technologies (including mobile broadband), to help overcome social and financial exclusion in developing countries, and also requires new types of PPPs. The vast majority
of the population without access to the Internet live in developing countries. Internet access is a fundamental enabler for improving quality of life, as it provides the opportunity to access useful information and services. This is a critical factor in fulfilling the SDGs, and governments now view mobile broadband infrastructure investments as key to national development. Through selective investment with mature mobile broadband technologies, operators can sustainably expand mobile broadband coverage by upgrading existing 2G sites to 3G and 4G, as well as targeting uncovered areas with new deployments.
According to the Ericsson Mobility Report (June 2017), by the end of 2016, around 3.2 billion subscribers out of the world’s total population of 7.4 billion had access to the Internet via mobile broadband technology. It is forecast that an additional 2.6 billion subscribers will have mobile broadband Internet access by 2022. Key drivers behind this subscriber uptake are a growing young population with increasing digital skills, and decreasing smartphone prices, as well as continued deployments of 3G and 4G mobile broadband technologies in developing markets.
As more radio base stations are deployed, the world’s mobile network population coverage continues to increase. At the current trajectory, mobile broadband will provide network
Table 3: Top Ten Largest Unconnected Markets in Mobile, end 2016
Top Ten Markets Unconnected (millions)
Total Population (millions)
% of Population Unconnected (per capita penetration)
1. India 660.19 1,334.66 49.5%2. China 362.28 1,385.28 23.6%3. Nigeria 101.68 189.41 53.7%4. Pakistan 101.12 194.79 51.9%5. Brazil 85.35 210.41 40.6%6. Bangladesh 75.73 163.87 46.2%7. Ethiopia 68.45 103.10 66.4%8. Indonesia 64.45 262.05 24.7%9. United States 61.88 325.30 19.0%10. Congo, D.R. 59.93 80.98 74.0%
Source: Broadband Commission for Sustainable Development, based on GSMAi data. Note: * % unconnected includes infants and young children, who may not be a target market for commercial purposes.

The State of Broadband 2017 21
coverage to around 95% of the world’s population by 2022. To address very low ARPU customer segments, expansion of network coverage requires capex and opex-efficient solutions. Operators, vendors, governments and regulators should continue to address affordability and uptake of services usage in parallel with mobile broadband technology deployment by, for example:
• Developing cost/benefit-based business models targeting urban and rural areas;
• Nurturing ecosystems for local apps and content development in local languages; and/or
• Prioritizing development of ICT literacy and skills.
The main barriers to Internet access are no longer the availability of network technology, but rather include illiteracy, affordability and perceived relevance of digital services. Today’s mobile broadband technologies have two major advantages of scalability (as the demand for performance grows) and economies of scale (as solutions with the greatest volumes achieve decreasing cost per unit of output).
This enables deployment of cost-effective mobile coverage solutions, making it possible to connect low-income subscriber groups with low-cost, low-energy solutions where needed, in presently uncovered areas. Technology will not be enough, however. To accelerate achievement of the SDGs, governments, regulators, network operators and service providers must ramp up their efforts to tackle the barriers outlined above, if we are to achieve the goal of bringing Internet to all.
Source: Börje Ekholm, President & CEO, Ericsson.
The figures for mobile broadband (3G and 4G) are considerably lower than the overall figures for mobile telephony, due to their later
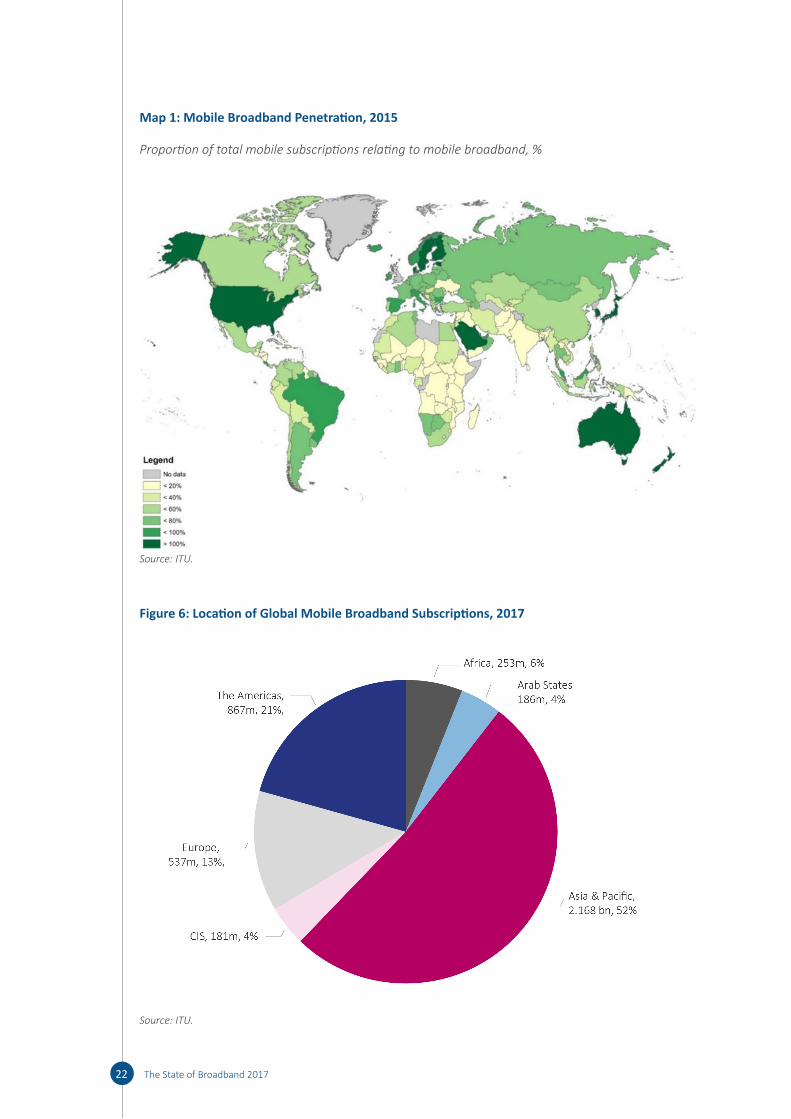
roll-out patterns. By end 2016, only around one third or 32.1% of the world’s population are estimated to have access to either a 3G or 4G mobile phone. Map 1 depicts mobile broadband penetration worldwide for end 2015, while Figure 6 shows the proportion of mobile broadband subscriptions per region for end 2017.
Meanwhile, the first phase-outs of 2G networks have started – the US carrier AT&T Mobility discontinued its 2G service on 1 January 2017 on schedule as announced in mid-2012), while Verizon Wireless is planning to shut down its CDMA 1X network by 31 December 2019. In Singapore, all 2G networks were shut down on 1 April 2017. To facilitate the migration of 2G subscribers, the mobile network operators worked with the government to raise public awareness and conduct roadshows, provide low-cost options for mobile devices and allow 2G subscribers to retain existing mobile plans at no additional cost.
In terms of the locations where 3G networks are being upgraded to 4G networks, there is evidence to suggest that 3G and 4G networks are being rolled out primarily in urban areas, while 4G networks are effectively being layered in on top of existing 3G networks in urban areas, rather than new network build-outs into rural areas. In India, for example, 2G is the main technology in use in rural areas, while 3G and 4G are available mainly in towns22.
Meanwhile, the race towards 5G has started, supported by the ITU standardization process for IMT-2020 and prospects of global harmonization of millimeter bands for IMT-2020 (5G) at the next ITU World Radiocommunication Conference (WRC-19). Sufficient amount of harmonized spectrum in different frequency bands is prerequisite for global accessibility and affordability of mobile broadband. WRC-07 and WRC-15 achieved global harmonization of the digital dividend bands at 700 MHz and 800 MHz for IMT, providing larger and more affordable coverage to rural areas, opening up greater opportunities for bridging the digital divide. Viewpoint 5 considers Qatar’s path towards 5G.
Chapter 2
The State of Broadband 201722
Map 1: Mobile Broadband Penetration, 2015
Proportion of total mobile subscriptions relating to mobile broadband, %
Source: ITU.
Figure 6: Location of Global Mobile Broadband Subscriptions, 2017
Source: ITU.

The State of Broadband 2017 23
Most countries have already allocated or are currently in the process of allocating that spectrum to the mobile service, as a result of the spectrum efficiencies gained by the transition from analogue to digital terrestrial television. Examples of such spectrum re-arrangements and information on the transition to digital television are presented in the ITU-R “Handbook on Digital Terrestrial Television Broadcasting Networks and Systems Implementation” and ITU-R Report SM.2353, “The challenges and opportunities for spectrum management resulting from the transition to digital terrestrial television in the UHF bands”.
The next Conference, WRC-19 will likely open the bands above 24 GHz for IMT, enabling full 5G deployment. These bands offer huge capacities in terms of bandwidth and are therefore crucial for enhanced mobile broadband, especially in urban areas, ensuring the rates comparable with the ones of the fixed broadband. WRC-19 will also attempt to satisfy spectrum requirements for non-geostationary satellite systems and High Altitude Platform Stations (HAPS), that are expected to complement cellular networks by providing mobile broadband services in low population density areas.
Viewpoint 5: Qatar’s Path Towards 5G
Qatar is a regional pioneer in delivering cutting-edge mobile technology, and is on the brink of becoming a ‘smart nation’. Fueling this development is a series of technological breakthroughs which demonstrate the potential of 5G for industry, society and individuals
alike. In Q1 2017, Qatar’s average connection speeds increased 64% year-on-year, while Qatar continues to benefit from one of the top ten average peak connection speeds in the world23. Qatar is one of a few nations around the world to have successfully tested 10Gbps FTTH services, as well as completing one of the first 5G mobile trials in the MENA region, reaching speeds of 35.46 Gbps24.
The upgrade to 10 Gbps, alongside other significant enhancements to network infrastructure, is part of a broader strategy to introduce 5G services and offer 8K TV technology for entertainment fans. During a successful trial in December 2016, Ooredoo’s 5G technology delivered extremely high broadband speeds while reducing latency to just one millisecond. Ooredoo will offer a fully-accessible proprietary 5G networks, built primarily upon Ooredoo’s 5G Supernet infrastructure.
The testing of 5G equipment, software, and spectrum requirements is contributing to the standardization of 5G, expected to be finalized by ITU-R in 2020, on the basis of the spectrum decisions taken by the ITU World Radiocommunication Conference 2019, after which technology partners and handset manufacturers will launch their 5G offerings. Recent successful trials have provided an example of the role that 5G will play in this as well as helping build a knowledge-based economy for Qatar, enabling intelligent automation and supporting the deployment of enhanced IoT solutions.
Chapter 2

The State of Broadband 201724
Box Figure: 5G and the Evolution of Mobile Networks
Source: Viavi, “The State of 5G Trials Globally”, at: https:// www. viavisolutions. com/ en- us/ 5G.
Source: Ooredoo.
Smartphones continue to grow ever more powerful in terms of functionality and capabilities. Deloitte (2017) estimates that, by the end of 2017, 40% of smartphone and tablet owners will use fingerprint authentication, compared with 5% of owners using facial, voice or iris recognition for authentication, while the mainstream adoption of smartphone biometrics will act as a catalyst for the deployment of biometric sensors in other environments25.
Smartphones currently account for just under half (48%) of all mobile phones globally. Smartphones present a platform for consumers to use Rich Interactive Applications (RIAs) that improve social well-being and generate economic value. A recent study by WIK showed that a 10% increase in RIA usage has added on average USD 5.6 trillion to GDP (0.33% of GDP), exceeding the economic
benefits of basic telecommunication services across a panel of 164 countries from 2000-2015.
Ericsson estimates there were 3.9 billion smartphone subscriptions worldwide by end 201626. Mary Meeker, the technology analyst and venture capitalist, estimates there was a total of 2.8 billion actual smartphones worldwide by end 2016, but growth has shrunk to just 3% year-on-year, down from 10% in 2015. Business Intelligence attributes this to intensifying competition between carriers, which has lengthened the smartphone replacement cycle, posing a challenge for handset-makers and software developers alike. GSMAi is still optimistic, projecting that there will still be 5.6 billion smartphones by 2020, with around 90% of this growth originating from LMICs. But with subscriber growth in mature markets stagnating, carriers are looking to alternative sources of revenue (such

The State of Broadband 2017 25
as connected cars and IoT devices) to drive growth.
4G LTE subscriptions will make up the largest portion of overall mobile subscriptions globally, as India and emerging markets in the Middle East and Africa catch up with the rest of the world in terms of average penetration rates (but potentially with growing inequality between countries – see Viewpoint 3). There may be around 530 million 5G subscriptions globally by 2022, according to Ericsson. GSMAi forecasts that 5G connections are set to surpass 1 billion by 2025.
Entertainment (including music and games) remains the primary type of Internet service accessed by most smartphone users in Asia, outstripping communication, search, news and information, and other forms of content. In India, a staggering 79% of all time spent on mobile is devoted to entertainment, search, social and messaging, with shopping, news and finance far behind. This echoes similar findings by the Pew Internet Center about gaming being a major purpose in the US.
This growth in entertainment and online messaging usage illustrates the dynamism of the communications industry and the value that innovative services are generating. Rich interactive applications (RIAs) drive consumers’ willingness to pay for Internet access, giving telecom providers more opportunities to earn revenue and finance new infrastructure. Research shows a significant correlation
between application usage intensity and the willingness to pay for Internet access, as well as the likelihood of consumers having purchased a new Internet access contract recently. There is also a shift in value in the industry, with a reallocation of revenues away from operators towards content players (Figure 8), implying telecom operators may be getting a proportionately smaller slice of a growing pie.
The impact of this shift in value on operators’ investment is unclear. The GSMA projects that, although mobile operators’ revenues may continue to increase, levels of capital expenditure (capex) investment may actually begin to decline, as operators’ incentives to invest are potentially diminished (Viewpoint 6). Viewpoint 7 describes the experience of the operator Digicel investing in telecom networks in 32 markets in the Caribbean and Pacific. Viewpoint 8 describes how operators can ensuring future growth in a complex digital environment.
Viewpoint 6: How Operators are Investing to Close the Coverage Gap
According to GSMA estimates, there are currently 3.85 billion people without a connection to the Internet, forecast to reduce to 2.01 billion by 2020, just over a quarter of the world’s population. 1.25 billion of these people who are currently unconnected live in an area without 3G
Chapter 2
Figure 7: Time Spent on Mobile in India
Source: Mary Meeker’s “Internet Trends 2017” report.

The State of Broadband 201726
or 4G mobile coverage. The developing world accounts for 95% of the people facing this coverage gap.
These offline populations typically live in sparsely populated, rural areas and suffer from low income levels and weak or non-existent enabling infrastructure (such as electricity and high-capacity fixed telecom networks). The remaining places in the world without 3G or 4G coverage are often geographically isolated or politically the places where it is most difficult and expensive for mobile operators to roll out networks and generate a return on their investment.
All of these factors adversely affect the business case for mobile network expansion in these areas. The revenue opportunity for new base stations in rural or remote locations can be as much as ten times lower than in an equivalent site in an urban area, with opex as much as
three times greater and capex up to two times greater.
At the same time, competition, regulatory intervention, declining Average Revenue Per User (ARPU) and slowing subscriber growth are having a significant impact on mobile operator revenues. This will inevitably affect operators’ ability to invest in the roll-out of new networks to address the coverage gap. Despite a short-term spike in revenues in 2016 (which were up 2.2% on 2015), revenue growth rates are down considerably on the rates mobile operators have witnessed over the last ten years.
Since 2010, mobile operators have invested USD 1.2 trillion in capex as they look to deploy mobile broadband networks and increase capacity. Global annual capex increased from 2010, to reach a peak of USD 197 billion in 2015. However, global mobile capex levels have subsequently fallen by 6% in 2016,
Figure 8: Telecom Industry Revenues are Growing, but Value is Shifting from Pipes to Content
Operators account for a shrinking share of industry profits, despite their role in enabling digitalization
Source: World Economic Forum/Accenture, “Digital Transformation Initiative: Telecom Industry White Paper”, at: http:// reports. weforum. org/ digital- transformation/ wp- content/ blogs. dir/ 94/ mp/ files/ pages/ files/ dti- telecommunications- industry- white- paper. pdf.

The State of Broadband 2017 27
and are forecast to fall further over the period to 2020. In developing markets in 2016, there was a particularly strong decline in capex of almost 10% year-on-year. GSMAi predicts that developing market capex will continue to fall over the medium-term, as declines in China and macro-economic pressures in other developing economies offset the growth experienced in markets such as India.
Given the projected reductions in capex by mobile operators over the next three years, alternative solutions are needed to close this coverage gap. Both the private sector and the public sector have critical roles to play. With regard to the private sector, mobile operators are developing new business models
to offer new platforms and services. As well as opening the door to new revenue streams, these trends will allow a faster pace of innovation and raise the prospect of a lower cost operating model for operators at a time when margins and cash flows remain under pressure.
Many mobile operators are collaborating more closely with tech start-ups and developing more open models of innovation. Over time, these will reverse the decline in revenues from traditional telecom services, potentially freeing up capital for investment in network expansion. For example, total investments in venture capital and start-up companies by telecom operators tripled between 2014 and 2015.
Chapter 2
Box Figure: Mobile Revenues 2014-2020 (USD billions)
Source: GSMAi.
Box Figure: Mobile Capex 2014-2020 (USD billions)
Source: GSMAi.

The State of Broadband 201728
Reflecting the ongoing shift in growth and innovation in the mobile ecosystem to emerging markets, operators have invested an increasing amount in developing regions. In 2015 alone, the total was USD3.2 billion, well over double the amount in the previous year.
Infrastructure sharing models (including sharing of passive and active network elements) and national roaming, are other ways in which the mobile industry is increasing the proportion of the population that can be covered on a commercially sustainable basis without the need for public subsidies or development funding. Such sharing models should be seen by governments and policy-makers as a preferred approach to expanding the footprint of mobile connectivity, as they can help preserve competition and commercial sustainability. Infrastructure sharing models can have a profound, positive impact on the economics of network expansion into rural and remote areas, allowing operators to reduce capital and investment costs by as much as 50-70%, while maintaining revenue opportunities.
Source: GSMA, based on GSMAi projections.
Viewpoint 7: A Call for a New Deal & Equal Regulatory Treatment
Mobile network operators in emerging markets are at the very forefront of expanding mobile broadband coverage in remote areas and “connecting the unconnected”. Digicel continues to build out networks in remote, island markets in the Caribbean and Pacific, which have previously been under-served in basic communication and Internet services. We have seen first-hand the dramatic impact of access to communication and Internet services, particularly on local economies.
Digicel operates in some of the least developed countries in the world and understands the need to drive mobile broadband penetration to help encourage economic growth in
developing countries. For example, over 80% of Papua New Guinea’s 7.8 million population live in rural areas and fixed broadband penetration is below 1% of the population. Papua New Guinea is one of Digicel’s largest markets, with over 2.7 million subscribers.
Digicel PNG, our local subsidiary, launched 4G services in 2011 and LTE services in 2014. Together with the World Bank, Digicel PNG installed telecommunication points of contact in 59 sites across all four regions of the country, providing telecommunication services to nearly 500,000 unserved people in rural areas. Currently, in PNG, Digicel provides Internet coverage to 50% of the population through a combination of basic EDGE services and high-speed LTE services.
Internet services are literally transforming the lives of Papua New Guineans as the country moves from a subsistence-based agricultural economy to a more vibrant economy based around SMEs. In our view, the provision of Internet services is clearly crucial to the ongoing development of the PNG economy.
The roll-out and maintenance of a mobile network remains extremely challenging due to, amongst other factors, the terrain and climate. For example, in Papua New Guinea:
• 40% of sites had no road access, with almost 10% having helicopter access only;
• Access to the site from the nearest road ranges from 20 metres to 15 kilometres in some cases;
• The highest site (Mount Otto) functions at an altitude of 11,000 feet;
• Only 10% of households are connected to the National Power Grid, making access to reliable power sources a significant issue, while 70% of sites rely on generators.

The State of Broadband 2017 29
• There is no competitively priced submarine cable giving Papua New Guinea international off-island connectivity. While Digicel uses the world’s latest satellite technology to help drive Internet penetration, the lack of access to cheap off-island capacity is limiting the ability to drive Internet penetration to the next level.
Access to localized mobile apps and content is necessary to facilitate usage and the growth of, for example, m-commerce, m-banking and micro-finance. Given their understanding of local market needs, Digicel and other telecom operators are uniquely positioned to drive the expansion of broadband penetration and usage. For example, Digicel has invested significantly in local news programmes, local and international sports broadcasts and local classified apps in its operating markets.
The vast majority of network investment is carried out by mobile operators. Digicel is committed to the expansion of broadband penetration and relevant Internet services in these markets. To date, Digicel has invested cumulatively over USD 5 billion in its 32 operating markets. Digicel employs over 8,000 staff throughout its operations, the vast majority (95%) of whom are citizens of local markets.
In addition, Digicel through the Digicel Foundations and other CSR projects has invested over USD130 million in its local markets, primarily in Jamaica, Haiti and Papua New Guinea. Education is a particular area of focus for the Digicel Foundations, with over 173 schools constructed in Haiti and 242 elementary schools and 220 primary school classrooms built in Papua New Guinea. Digicel remains committed to investing in bringing the full benefits of a connected society to the countries where it operates.
In many countries, demand for connectivity is largely being driven by OTT operators (including Google, Facebook, WhatsApp, and Skype), which provide communication and messaging services that effectively replace some of the services provided by mobile operators. Despite providing equivalent services, the operation of such OTT services in emerging markets is largely unregulated, whereas mobile operators are heavily regulated. In light of this, the GSMA has repeatedly called for regulators to apply “the same rules for the same service”27.
A recent UNCTAD report finds that mobile operators invest significant sums in the local economy, pay taxes and employ significant staff locally, while OTTs have a light “foreign asset footprint”28 and limited “on-the-ground” investment in remote emerging markets in terms of either people or infrastructure. However, they are enjoying strong growth in these markets. For example, Facebook’s Q1 report stated that in its “Rest of World” segment, DAU increased by 20% year-on-year from 340 million users to 408 million users and ARPU increased by 39.5% from USD0.91 to USD1.27. There is no revenue share with the telecom operators, which invest vast amounts of capital in the initial roll-out the modern networks on which Facebook and other OTTs rely as a prerequisite to generate their revenue. This is hardly fair. Mobile operators cannot be expected to fund the majority of all the cost of expanding coverage, while other parties reap considerable benefits to those investments. Otherwise, long-term incentives to invest in network roll-outs are considerably diminished.
Given their business models, global OTT operators are not focused on driving or encouraging local investment in content or local app development as their focus is on driving advertising income to their own global platforms, this draws advertising revenue out of the emerging markets and back to the developed world (mainly in the U.S.).
Chapter 2

The State of Broadband 201730
In emerging markets, where we seek to expand mobile broadband access to the next 5 billion people, there is a fundamental issue as the ability of customers to pay for data connectivity is not in line with the costs to mobile operators of providing the service, especially when that service is facilitating the flow of funds out of the local market to OTTs. Mobile operators cannot be expected to fund the cost of expanding coverage while other parties (e.g. OTT operators) reap the benefits of this investment.
Mobile operators welcome innovation and new business models. However, it is not sustainable to build a business around using the assets of another business free of charge: e.g., you cannot sell advertising on a billboard attached to a building you do not own without paying rent. There needs to be a “New Deal” for all participants in the broadband ecosystem including governments, regulators, development agencies, telecom operators and OTT operators to ensure broadband access reaches the next five billion people. Everybody needs to contribute to the costs of network roll-out and share revenues.
Source: Denis O’Brien, Chairman & Founder, Digicel Group.
Viewpoint 8: Ensuring Future Growth in the Complex Digital Environment
Connectivity has increased rapidly, with 84% of the world population now covered by a mobile broadband network, driven by a profitable telecom sector. This growth is slowing however, as digitization is shifting the distribution of value among industry players, changing incentives for investment. To ensure continuing expansion of connectivity, telecom operators need to adapt to a competitive environment shaped by disruptive OTTs, advanced analytics and digital platforms. Policy-makers should facilitate this transition by ensuring policies do not disadvantage players with local presence, intelligent data
protection frameworks are in place, and innovative content creation is enabled.
Digital natives (such as Snapchat, WhatsApp and WeChat) are forcing traditional telecom operators to innovate to sustain their profitability. International voice traffic (in minutes) by carriers was overtaken by OTTs in 201629, and OTT competition will likely result in a spending drop on traditional services by 36% over the next ten years30. Despite telecom operators facing competition from substitute services, regulatory frameworks have often not yet adapted. Regulations need to treat digital businesses equally. This does not mean that old regulations should simply be applied to new players, but it is increasingly difficult to define clear and stable categories of services for the application of certain rules. Instead, clear policy objectives should be the starting point, and overly strict regulations avoided as these would only negatively affect local digital economies by forcing innovation out of respective countries.
Data is shaping the business models of the future, with global data flows now contributing almost as much to GDP as the trade in goods31. For telecom operators, exploiting the benefits of advanced analytics and unlocking the untapped potential of vast amounts of data will be key to their future success. It can improve customer retention, upselling, and capital expenditure planning, but most of all, having the improved analytics capabilities can enable operators to meet consumer needs better, even providing contextual services.
Although data is now recognized as a driver of economic activity, national and regional data protection frameworks are often outdated, incompatible or absent32, reducing consumer confidence while increasing corporate risk. Overly stringent regulations (including data localization requirements or attempts to apply ‘personal data’ concepts in IoT)

The State of Broadband 2017 31
could increase costs and risks unduly or limit innovation. Ultimately, providing security and enabling consumers to be meaningfully in control over which data are shared benefits all parties and should be the objective of policy-makers.
Data-driven digital platforms have accelerated the development of new services and applications. To compete with online platforms, mobile operators should be able to provide their customers with innovative new content. Content partnerships are mutually beneficial as they help new entrants gain traction for their products or services and give telecom operators new opportunities. For emerging markets, they can improve the availability of relevant local content, a key driver of Internet adoption. Furthermore, in the environment where virtually all smartphones shipped have one of the two operating systems installed (with more than 80% operating on Android), it seems outdated to see telecom operators as gatekeepers to the open Internet. Telecom operators and policy-makers should recognize that ensuring future expansion of connectivity is
about shifting from managing networks to generating digital customer value. Barriers to renewed growth should be removed to facilitate this shift.
Source: VEON.
In response to this situation, an operator survey of the most important user-facing service elements to help keep customers satisfied found that operators of course still remained concerned about declining ARPU and churn. However, new priorities for telcos are emerging to try and keep customers happy (Figure 9). Optimal network performance (58%), service personalization (58%) and subscriber behavior analytics (57%, to help operators understand what customers want, when they want it and how they want it) topped the list of priorities, followed by cybersecurity defence (41%) and premium services (25%). Taking this further, predictive analytics could help operators give customers better and more relevant services.
Another recent development is the development of wireless broadband technologies, which has been reinvigorated by 4G mobile. Viewpoint 9 explores how a growing number of countries are including wireless broadband as an important ingredient of National Broadband Plans (NBPs).
Chapter 2
Figure 9: Telco Priorities – Important Aspects in Improving Online Experience
Source: “Broadband Outlook 2016”, Telecoms Intelligence (sponsored by Nominum, Commscope and Netrounds).

The State of Broadband 201732
Viewpoint 9: Wireless Broadband, an Important Ingredient of National Broadband
3G technologies were the basis of wireless broadband solutions, but 3G wireless broadband typically provides lower access quality than fixed broadband. The adoption of 4G LTE technologies reinvigorates wireless broadband. Wireless broadband combines advantages from traditional fixed wireless solutions (such as rapid and flexible deployment and low costs), with fixed broadband-class bandwidth and quality, which should enable wireless broadband to accelerate in the household market segment. Nowadays, recognizing the value of bandwidth, a growing number of countries are formulating their national Internet and Broadband Plans to include wireless broadband.
China is a perfect case. In 2013, the State Council of China released the "Broadband China" Strategy and implementation plan. In 2014, the Ministry of Industry and Information Technology of China published a Notice promoting wireless broadband in rural areas, facilitating the national broadband strategy, and creating a new vista for mobile Internet. In this Notice, a three-step goal of urban-rural broadband development was proposed to clarify the significance of wireless broadband in promoting broadband services in rural areas. In large areas with a population density less than 200 households per square kilometre, the cost of deploying wired broadband networks ranges from USD 500-800 per wire or higher, while the break-even period is 10 years. Wireless broadband networks are generally more cost-effective than optical fibre networks. Since 2015, wireless broadband networks have expanded rapidly in rural areas in Jilin, Sichuan, Yunnan and Anhui provinces, and mid-west China. This demonstrates the unique features of wireless
broadband as an important ingredient of national broadband.
Wireless broadband has proven itself as an essential component in national broadband in developed countries as well as developing countries such as China. Governments in Australia, Germany, and Norway endorse wireless broadband and hope to provide universal broadband services and improve broadband experience using wireless networks. To fulfill this goal, they created preferential policies or concrete measures to promote wireless development. In Germany, the government demands operators provide universal broadband services in small towns and rural areas using the 800 MHz frequency band. The Australian government set up the NBN Company to implement its broadband plan. The Norwegian government provides ultra-broad spectrum at preferential prices to operators who build cost-effective and high-quality wireless broadband networks.
4G Development Facilitates NBP Goals Beyond xMbps
In order to deliver satisfactory wireless broadband experience to the consumers and to ensure that countries maintain their competitiveness, government, mobile operators and relevant stakeholders can join hands in setting out short- and long-term goals to propel the mobile industry towards a vibrant and sustainable ecosystem. The rapid development of wireless technologies can enable countries to have more options for their consideration, based on local environment. For instance, apart from traditional wireless coverage (% of population, for instance), the availability of more spectrum and technologies such as 4G open up the possibilities for using data speed (Mbps) and monthly data usage (GB per month) as indicators. Each of these indicators has different roles to advance connectivity for each nation (Box Figure).

The State of Broadband 2017 33
Box Figure: Potential National Broadband Targets Towards a More Connected World with Wireless Technology
Source: Huawei. Note: DoU means Data of Usage.
Many countries have already established a National Broadband target. As demand and technology evolve over time, the US revised its definition of “broadband” to a minimum of 25 Mbps per user in 2015, up from 4 Mbps in 2011. The EU reinforced its commitment to support connectivity goals by raising its target broadband speeds to 30 Mbps. China, Japan and Korea are pushing forward their NBPs with wireless technology, by setting a target of +25 Mbps and above. Many developing countries are still working to achieve their targets. Nigeria’s broadband speed requirement remains at 1.5 Mbps. Thailand’s mobile broadband penetration requirement has been set at 80% and 100% for 2015 and 2020 respectively, without explicit requirements for user experience.
Public Policies
Various policies can be considered in terms of spectrum resources, technology evolution, and physical resources. For example, more spectrum is needed. The ecosystem of WRC-07/12 is very mature and global bands such as remaining 900/1800/2100/2300/2600/3500MHz bands should be released as soon as possible. Regulators may also wish to consider refarming and implementation for WRC-15 700/L-Band/C-Band in their preparations for WRC-19, which is vital for 5G evolution.
Spectrum efficiency increased five times from 3G to 4G. Regulators are also encouraged to adopt technology-neutral approaches to help incentivize mobile operators to upgrade their networks, thus providing a better service to customers and promoting a more efficient use of spectrum resources. The costs of site acquisition is another major consideration in rolling out communications in rural areas. Industry has pushed forward the commercial availability of smaller products. Governments may wish to consider the use of public facilities for operators’ network deployment, which could greatly improve the business model and facilitate national broadband development.
Source: Huawei.
2.5 Next-Generation Networks in Fixed Broadband
The processes of evolution in fixed lines and continuous technological upgrades continue. Next-Generation technologies comprise a number of different technologies – ITU-T defines Next Generation Networks (NGN) as a “packet-based network able to provide telecommunication services to users and able to make use of multiple broadband, QoS-enabled transport technologies and in which service-related functions are independent
Chapter 2
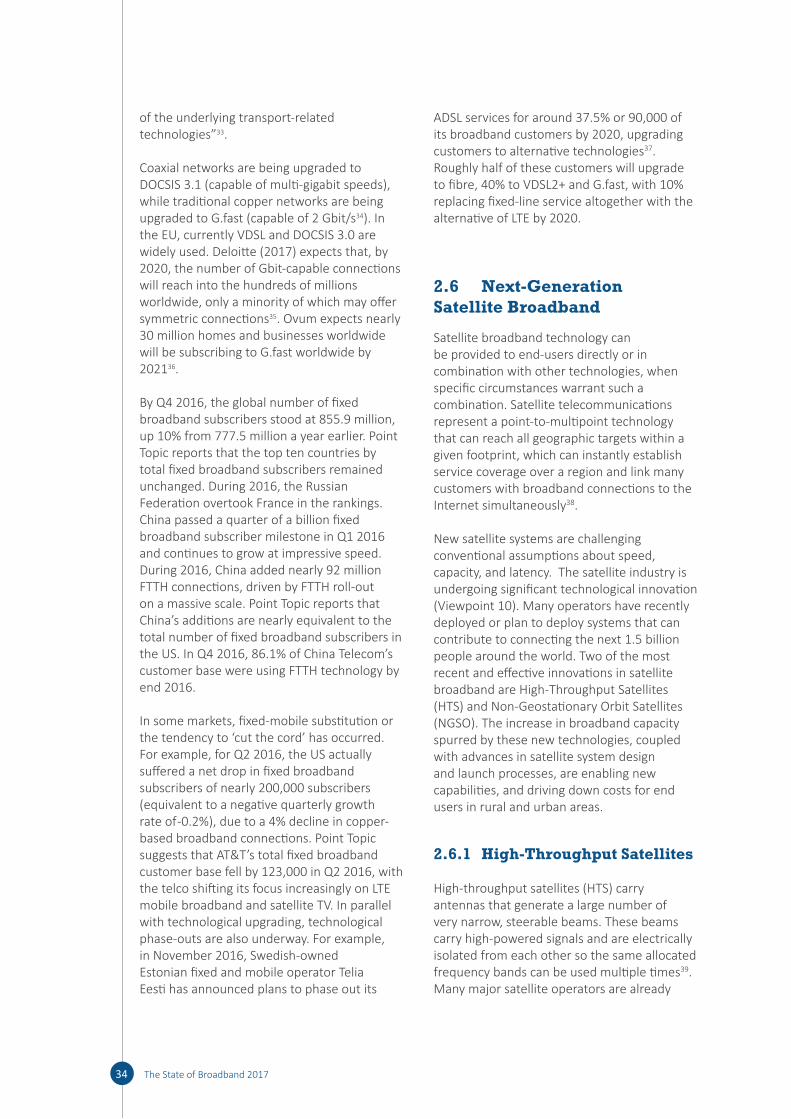
The State of Broadband 201734
of the underlying transport-related technologies”33.
Coaxial networks are being upgraded to DOCSIS 3.1 (capable of multi-gigabit speeds), while traditional copper networks are being upgraded to G.fast (capable of 2 Gbit/s34). In the EU, currently VDSL and DOCSIS 3.0 are widely used. Deloitte (2017) expects that, by 2020, the number of Gbit-capable connections will reach into the hundreds of millions worldwide, only a minority of which may offer symmetric connections35. Ovum expects nearly 30 million homes and businesses worldwide will be subscribing to G.fast worldwide by 202136.
By Q4 2016, the global number of fixed broadband subscribers stood at 855.9 million, up 10% from 777.5 million a year earlier. Point Topic reports that the top ten countries by total fixed broadband subscribers remained unchanged. During 2016, the Russian Federation overtook France in the rankings. China passed a quarter of a billion fixed broadband subscriber milestone in Q1 2016 and continues to grow at impressive speed. During 2016, China added nearly 92 million FTTH connections, driven by FTTH roll-out on a massive scale. Point Topic reports that China’s additions are nearly equivalent to the total number of fixed broadband subscribers in the US. In Q4 2016, 86.1% of China Telecom’s customer base were using FTTH technology by end 2016.
In some markets, fixed-mobile substitution or the tendency to ‘cut the cord’ has occurred. For example, for Q2 2016, the US actually suffered a net drop in fixed broadband subscribers of nearly 200,000 subscribers (equivalent to a negative quarterly growth rate of -0.2%), due to a 4% decline in copper-based broadband connections. Point Topic suggests that AT&T’s total fixed broadband customer base fell by 123,000 in Q2 2016, with the telco shifting its focus increasingly on LTE mobile broadband and satellite TV. In parallel with technological upgrading, technological phase-outs are also underway. For example, in November 2016, Swedish-owned Estonian fixed and mobile operator Telia Eesti has announced plans to phase out its
ADSL services for around 37.5% or 90,000 of its broadband customers by 2020, upgrading customers to alternative technologies37. Roughly half of these customers will upgrade to fibre, 40% to VDSL2+ and G.fast, with 10% replacing fixed-line service altogether with the alternative of LTE by 2020.
2.6 Next-Generation Satellite Broadband
Satellite broadband technology can be provided to end-users directly or in combination with other technologies, when specific circumstances warrant such a combination. Satellite telecommunications represent a point-to-multipoint technology that can reach all geographic targets within a given footprint, which can instantly establish service coverage over a region and link many customers with broadband connections to the Internet simultaneously38.
New satellite systems are challenging conventional assumptions about speed, capacity, and latency. The satellite industry is undergoing significant technological innovation (Viewpoint 10). Many operators have recently deployed or plan to deploy systems that can contribute to connecting the next 1.5 billion people around the world. Two of the most recent and effective innovations in satellite broadband are High-Throughput Satellites (HTS) and Non-Geostationary Orbit Satellites (NGSO). The increase in broadband capacity spurred by these new technologies, coupled with advances in satellite system design and launch processes, are enabling new capabilities, and driving down costs for end users in rural and urban areas.
2.6.1 High-Throughput Satellites
High-throughput satellites (HTS) carry antennas that generate a large number of very narrow, steerable beams. These beams carry high-powered signals and are electrically isolated from each other so the same allocated frequency bands can be used multiple times39. Many major satellite operators are already
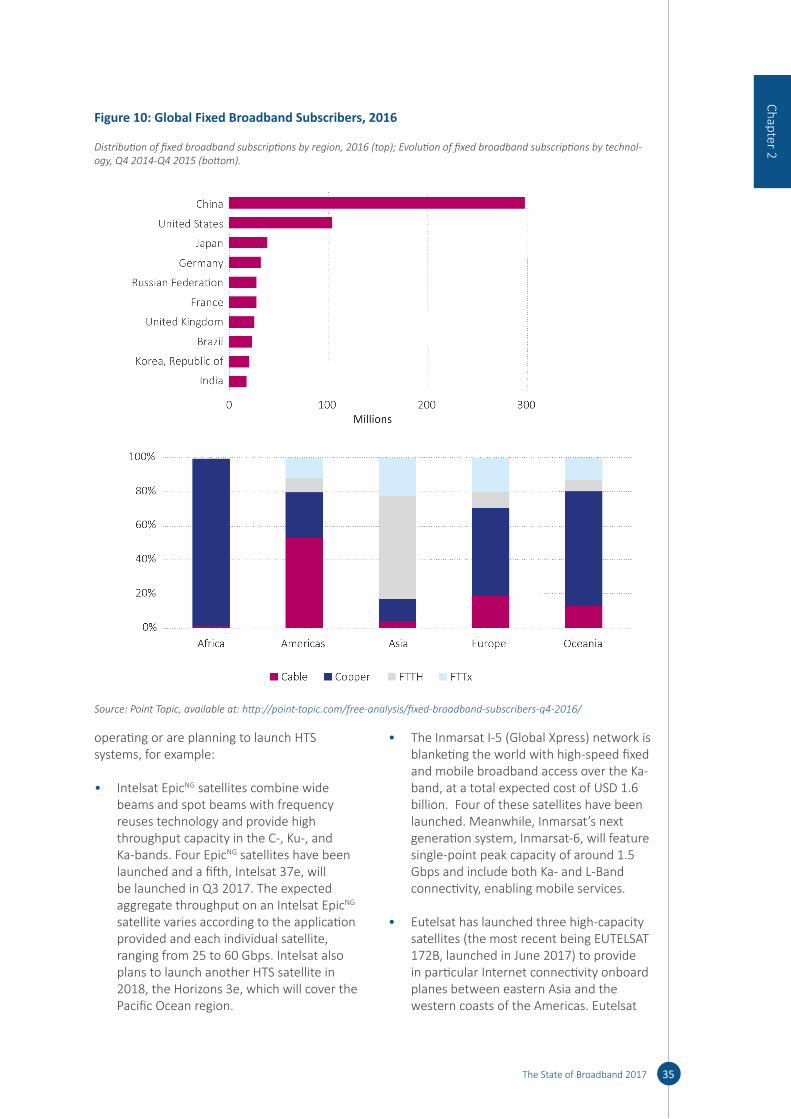
The State of Broadband 2017 35
operating or are planning to launch HTS systems, for example:
• Intelsat EpicNG satellites combine wide beams and spot beams with frequency reuses technology and provide high throughput capacity in the C-, Ku-, and Ka-bands. Four EpicNG satellites have been launched and a fifth, Intelsat 37e, will be launched in Q3 2017. The expected aggregate throughput on an Intelsat EpicNG satellite varies according to the application provided and each individual satellite, ranging from 25 to 60 Gbps. Intelsat also plans to launch another HTS satellite in 2018, the Horizons 3e, which will cover the Pacific Ocean region.
• The Inmarsat I-5 (Global Xpress) network is blanketing the world with high-speed fixed and mobile broadband access over the Ka-band, at a total expected cost of USD 1.6 billion. Four of these satellites have been launched. Meanwhile, Inmarsat’s next generation system, Inmarsat-6, will feature single-point peak capacity of around 1.5 Gbps and include both Ka- and L-Band connectivity, enabling mobile services.
• Eutelsat has launched three high-capacity satellites (the most recent being EUTELSAT 172B, launched in June 2017) to provide in particular Internet connectivity onboard planes between eastern Asia and the western coasts of the Americas. Eutelsat
Chapter 2
Figure 10: Global Fixed Broadband Subscribers, 2016
Distribution of fixed broadband subscriptions by region, 2016 (top); Evolution of fixed broadband subscriptions by technol-ogy, Q4 2014-Q4 2015 (bottom).
Source: Point Topic, available at: http:// point- topic. com/ free- analysis/ fixed- broadband- subscribers- q4- 2016/

The State of Broadband 201736
also plans to launch the African Broadband Satellite in 2019, which will provide 75 Gbps of capacity across a network of 65 spot beams, covering most of Sub-Saharan Africa.
• SES has procured several new satellites scheduled to come online in late 2017/early 2018, carrying 36 GHz total HTS capacity40.
2.6.2 Non-Geostationary Orbit Satellites (NGSO)
Another innovation in satellite technologies is the increased use of non-geostationary satellite orbit satellites (NGSO), such as Medium Earth Orbits (MEO) and Low Earth Orbits (LEO). While GEO satellites such as the HTS are at 36,000 km above the Earth, MEO altitudes are between 36,000 and 2000 km, while LEO altitudes are between 2,000 to 400 km above the Earth. To enable continuous service, NGSO operators must deploy a fleet of several satellites.
Today, the most advanced of the MEO projects in terms of full operational status is the O3b system, which offers 192 Gbps total throughput, up to 1.6 Gbps throughput per beam and low latency of <150 milliseconds. The system is designed to provide fibre-like IP trunking and cellular backhauling services to fixed/mobile networks, maritime, energy companies. OneWeb is planning to build a LEO constellation of 648 satellites offering download speeds of 50 Mbps and upload speeds of 25 Mbps, with the first ten satellites scheduled to be deployed in 201841.
Bridging the digital divide needs a combination of complementary technologies. Satellite networks, fibre-optic cable and terrestrial wireless systems are not mutually exclusive, competing technologies, but together, form a potential inventory for the design, implementation and operation of broadband systems. The technological advances described above improve the quality, increase the capacity and reduce the costs of satellite services, enabling satellite operators to provide innovative solutions to bridging the digital divide and providing broadband for all.
Viewpoint 10 describes the satellite technology revolution, while Viewpoint 11 describes the use of satellite broadband for connecting the unconnected.
Viewpoint 10: The Satellite Technology Revolution
It is a time of extraordinary technological revolution in space-based and upper atmosphere communications. A proliferation of broadband capacity across the globe, spurred by new technologies like HTS, massive NGSO constellations, and broadband HAPS systems is bringing reliable connectivity to the hardest-to-reach corners of the Earth, enabling new capabilities and applications in areas already connected to the global network, and driving down costs for everyone. Owing to their coverage, reliability, mobility and flexibility, space-based and upper atmosphere technologies are an ideal solution for expanding the reach and density of the global Internet, and achieving the SDGs.
Recent technological advances and an explosion in capacity will enable space-based and upper atmosphere technologies to play a critical role in connecting the other 4 billion and meeting the SDGs. Innovation is happening along several fronts:
• Networks: Innovative network designs have caused breakthroughs in the capacity, capabilities, and service quality of space-based and upper atmosphere technologies. HTS systems leverage multiple, narrower spotbeams from satellites in geostationary orbit to increase frequency reuse and huge system capacity. Massive constellations of NGSO satellites in low-Earth orbit (LEO) will blanket the globe in low-latency, high-bandwidth connectivity.
• Hardware: Improved power generation and storage, combined with efficiencies in propulsion and control systems have enabled greater

The State of Broadband 2017 37
power to be available for satellite payload operations. Transmission and reception technologies at both ends of the communication path enable system operators to do more with ever smaller components.
• Expanded Reach: Space-based and upper atmosphere communications systems have a global reach that is unmatched by any other platform. In contrast to other broadband systems, which by economic necessity focus their deployments in densely populated regions with a concentration of potential consumers, space-based and upper atmosphere systems are designed expressly with the intention of providing global coverage.
• Cost Reductions: Technological advances, expanded capacity, and other efficiencies are driving down costs, making space-based and upper atmosphere technologies more accessible than ever before. The price per Gbps of throughput has dropped continuously for the past decade and will continue to do so.
• Interoperability: Technology advances, including network virtualization and small multi-band antennas make it easier than ever to integrate space based technologies with other networks such as Wi-Fi, LTE, and wireline, facilitating networks that are truly global, mobile and economically and environmentally efficient.
Space-based and upper atmosphere systems have significant advantages for expanding broadband coverage in developing countries. They provide instant-on coverage across wide geographies without regard to challenging topography. Unlike terrestrial systems, in which deployment costs rise as population density decreases, capital expenditure for space-based and upper atmosphere technologies is entirely independent of
user density. Space-based and upper atmosphere systems are, by design, highly reliable and immune to most risks that face other networks, including accidental damage, theft, conflict areas and natural disasters. Moreover, these systems are cleaner and greener than terrestrial technologies—leveraging development in solar technology and electric propulsion. Finally, space-based and upper atmosphere connectivity is easy to roll-out. As global satellite coverage already exists, network deployment can be as simple as providing ground terminals.
With unmatched and constantly evolving capabilities, space-based and upper atmosphere communications are driving the solutions that will be essential to meeting the SDGs. While these technologies are key to delivering broadband Internet access to unserved areas, their impact goes far beyond that, including applications in urban and already-connected areas. Space-based and upper atmosphere solutions are key to aviation, maritime, energy, and many other industries. Space-based connectivity is helping to make the Internet of Things - smart cities, intelligent transport systems, e-government, tele-education, e-health, e-logistic, smart energy, smart agriculture – a reality, both in the developed and developing world. And these technologies are facilitating advances in sustainability, banking, and diverse government services.
Revolutionary advancements in these technologies are facilitating the development and deployment of educational, health, and economic platforms necessary for the creation of digital natives. These technologies can globalize local digital innovation hubs allowing digital natives to use that connectivity for creativity and value-added commerce. The Commission’s Working Group on Technologies in Space and the Upper Atmosphere is exploring these issues in depth, and I look forward to its final report being
Chapter 2

The State of Broadband 201738
an important contribution to the global discourse on how to spread the benefits of broadband around the world.
As countries develop and revisit their broadband plans, they should consider the profound ways in which space-based and upper atmosphere technologies can help them reach their goals and reflect these benefits in appropriate policies.
Source: Rupert Pearce, CEO, Inmarsat.
Viewpoint 11: Satellite Broadband to Connect the Unconnected
National governments, international institutions, and the private and public sector have all acknowledged the importance of bridging the digital divide to foster economic growth, social inclusion and meeting consumer demand. However, 3.8 billion people still do not have access to a broadband infrastructure, particularly those living in rural or remote areas. Satellite broadband is particularly useful for the provision of broadband services in those areas and is therefore an essential element in connecting the unconnected and bridging the digital divide42.
There have been several developments of satellite broadband that will prove useful in connecting rural and remote regions:
• Intelsat S.A. announced a joint managed services solution with Gilat Satellite Networks Ltd. to provide 3G infrastructure in remote locations around the globe, where terrestrial services are unlikely to prove feasible43.
• Inmarsat has partnered with several organizations including InStrat Global Health Solutions on a project that brings training videos and medical service applications to medical workers in Nigeria in remote
areas using Inmarsat’s BGAN satellite broadband technology44.
• SES announced its partnership on April 27 2017 with Internet social-media giant Facebook that has leased capacity on three in-orbit SES satellites to provide Wi-Fi connectivity in sub-Saharan Africa through Ku-band capacity45.
• Facebook has also partnered with Eutelsat for a Ka-band satellite, which is scheduled for launch in 2019 to cover 30 African nations. The African Broadband Satellite will provide 75 Gbps of capacity across a network of 65 spot beams covering most of Sub-Saharan Africa46.
• O3b Networks has partnered with Project Loon to provide high-throughput, low latency broadband Internet and 4G/LTE mobile service in Peru in May of 2017 for rural and remote regions that had been affected by the El Niño weather phenomenon47.
These developments will increase access to broadband infrastructure, especially for the populations living in rural areas. Access to terrestrial technologies is limited or non-existent in many parts of the world, in particular in developing countries and sparsely populated rural areas. Satellite technologies are uniquely placed for the delivery of broadband services in those areas either on their own, or in combination with other technologies. However, as referenced in Viewpoint 10, although satellite and other space-based and upper atmosphere technologies are key to delivering broadband Internet access to unserved areas, their impact goes far beyond that, including applications in urban and already-connected areas, which are important to the aviation, maritime, energy, and other sectors.
Source: ITSO.

39The State of Broadband 2017
1 Bob O’Donnell, “10 Tech Predictions for 2017”, 4 January 2017, available at: www. techspot. com/ article/ 1304- tech- predictions- 2017/
2 Gartner Market Databook Q3 2016 update, 4 October 2016, available at: www. gartner. com/ technology/ research/ it- spending- forecast/
3 https:// www. statista. com/ markets/ 418/ topic/ 481/ telecommunications/ 4 ITU “ICT Facts & Figures: The World in 2017”, at: www. itu. int/ en/ ITU- D/ Statistics/ Pages/ facts/ default. aspx5 “Offline & Falling Behind: Barriers to Internet Adoption”, McKinsey (2014), available at: www. mckinsey. com/
industries/ high- tech/ our- insights/ offline- and- falling- behind- barriers- to- internet- adoption 6 Facebook Q4 2016 earnings call, February 2017.7 Page 3, TenCent First Quarter Financial Results : https:// www. tencent. com/ en- us/ articles/ 15000611495014502.
pdf 9 www. wik. org/ fileadmin/ Studien/ 2017/ CCIA_ RIA_ Report. pdf 10 www. analysisgroup. com/ uploadedfiles/ content/ news_ and_ events/ news/ analysis_ group_ whatsapp_ economic_
impact_ infographics. pdf 11 https:// www2. deloitte. com/ content/ dam/ Deloitte/ uk/ Documents/ technology- media- telecommunications/
deloitte- uk- global- economic- impact- of- facebook. pdf12 www. analysysmason. com/ Research/ Content/ Reports/ Content- application- provider- Internet- infrastructure-
Sept2014/ 13 www. wik. org/ fileadmin/ Studien/ 2017/ CCIA_ RIA_ Report. pdf 14 René, Schneider & Hildebrand (2016), "All Communications Services Are Not Created Equal–Substitution of OTT
Communications Services for ECS from a Consumer Perspective", TPRC44 Conference, Arlington, VA, 30 Sept–1 Oct
15 Many consumers do not use online applications and communications services as substitutes; more often than not, consumers use them complementarily. As the European Directorate General for Internal Policies recently noted, it is very common for end-users to employ three or four different types of messaging applications on their device—a phenomenon known as “multi-homing”.
16 www. iot- now. com/ 2016/ 05/ 31/ 47936- the- number- of- smart- homes- in- europe- and- north- america- tops- 17- 9- million- in- 2015/
17 http:// point- topic. com/ us- reports- nationwide- fixed- broadband- subscriber- decline/ and www. telecompetitor. com/ pew- research- sees- broadband- penetration- plateau/
18 “State of the Internet 2017” report, Akamai Technologies, available at: https:// www. akamai. com/ us/ en/ multimedia/ documents/ state- of- the- internet/ q1- 2017- state- of- the- internet- connectivity- report. pdf
19 https:// www. pch. net/ ixp/ summary_ growth_ by_ country 20 GSMA press release, MWC, February 2017.21 Ericsson Mobility Report, June 2017, available at: https:// www. ericsson. com/ assets/ local/ mobility- report/
documents/ 2017/ ericsson- mobility- report- june- 2017. pdf22 Facebook “State of Connectivity 2015:A Report on Global Internet Access”, available from: https:// newsroom. fb.
com/ news/ 2016/ 02/ state- of- connectivity- 2015- a- report- on- global- internet- access/ 23 Akamai’s “State of the Internet Q1 2017” report: https:// www. akamai. com/ fr/ fr/ multimedia/ documents/ state-
of- the- internet/ q1- 2017- state- of- the- internet- connectivity- report. pdf24 https:// www. mobileworldlive. com/ asia/ asia- news/ asia- australasia- operators- dominate- 5g- lab- speed- tests/ 25 Page 4, Deloitte TMT Predictions 2017, available from: https:// www2. deloitte. com/ global/ en/ pages/ technology-
media- and- telecommunications/ articles/ tmt- predictions. html 26 Ericsson Mobility Report, June 2017, available at: https:// www. ericsson. com/ assets/ local/ mobility- report/
documents/ 2017/ ericsson- mobility- report- june- 2017. pdf27 For example, “A Call for Regulatory Rebalancing” by the GSMA, “The State of Broadband 2014” report.28 Digital economy chapter, UNCTAD World Investment Report 2017, at http:// unctad. org/ en/ PublicationsLibrary/
wir2017_ en. pdf 29 TeleGeography Report, 2017
Endnotes

40 The State of Broadband 2017
30 McKinsey: Overwhelming OTT, 2017.31 McKinsey: Digital Globalization, 2016.32 UNCTAD: Data Protection Regulations, 2016.33 www. itu. int/ en/ ITU- T/ gsi/ ngn/ Pages/ definition. aspx 34 ITU-T Recommendation G.9701 Amd.3 at www. itu. int/ rec/ T- REC- G. 9701- 201704- I!Amd335 Deloitte TMT Predictions 2016: “The Dawn of the Gigabit Era”, available from: https:// www2. deloitte. com/ ca/
en/ pages/ technology- media- and- telecommunications/ articles/ tmt- predictions- 2016. html 37 https:// www. telegeography. com/ products/ commsupdate/ articles/ 2016/ 11/ 30/ telia- eesti- to- drop- adsl- within-
four- years/? utm_ source= CommsUpdate& utm_ campaign= f78f4ae966- CommsUpdate+30+November+2016& utm_ medium= email& utm_ term= 0_ 0688983330- f78f4ae966- 11619241
38 ITSO-IADB (2016), “The Provision of Satellite Broadband in Latin American and the Caribbean”, at www. itso. int/ images/ stories/ Publications/ The- Provision- of- Satellite- Broadband- Services- in- Latin- America- and- the- Caribbean. pdf
39 Ibid. 40 ITSO, Inmarsat, Eutelsat IGO, “Satellite as an effective and compelling solution to overcome the digital divide”,
State of Broadband 2016 Report, at: www. itso. int/ images/ stories/ Publications/ Satellite_ as_ an_ effective_ and_ compelling_ solution_ to_ overcome_ the_ digital_ divide_ 07062016. pdf.
41 Report of the Broadband Commission’s Working Group on Technologies in Space and the Upper-Atmosphere (forthcoming).
42 For more information see ITSO-IADB (2016), “The Provision of Satellite Broadband in Latin American and the Caribbean”, at https:// publications. iadb. org/ handle/ 11319/ 7843
43 For more information, see http:// www. intelsat. com/ news/ press- release/ intelsat- and- gilat- unveil- mobile- reach- solar- 3g- solution- for- mobile- network- operators- that- need- to- expand- in- remote- areas/
44 For more information, see https:// ecfsapi. fcc. gov/ file/ 10608169217789/ SIA%20 Telehealth%20 final. pdf 45 For more information, see http:// spacenews. com/ ses- announces- facebook- order- for- african- satellite- capacity-
unclear- link- with- facebook- eutelsat- deal/ 46 Ibid. 47 For more information, see https:// www. o3bnetworks. com/ o3b- networks- works- project- loon- team- reconnect-
people- recovering- floods- peru/


The State of Broadband 201742
Accompanying such growth in subscriber numbers and usage, policy and regulatory frameworks are being adapted to keep up with the tremendous pace of technological change. As technologies continue to develop, regulatory efforts should be designed to promote competition, investment, and innovation. Appropriate regulation for any given digital communications market is a trade-off that requires consideration and restraint, including consideration of whether there is a need to pass sector specific legislation or whether existing legislation is sufficient to maintain principles of law "on and off-line". This chapter first considers National Broadband Plans as overarching statements of policy, principles or intent, and then considers some of the trends in supporting regulation as the means to achieve those policies.
3.1 Progress in National Broadband Policy
Although the Commission’s target on National Broadband Plans (NBPs) has not been fully achieved, there has been steady progress in the number of countries that have introduced a Plan or policy, or updated legislation to become more comprehensive (Figure 11). Growth in the number of countries with NBPs has shown good progress, but has effectively stabilized over recent years (Figure 11, top). According to ITU data, 80% of all countries
now have a NBP, currently at 156, up from 151 last year. 35 countries do not have a Plan (Figure 11, bottom). Countries which approved a National Plan this year include Senegal, Togo, Guatemala, Kuwait and Myanmar (Appendix 1). A further four countries are still planning to introduce a National Broadband Plan or Digital Agenda (Cuba, Dominica, Seychelles and the Solomon Islands).
For example, China’s National Development & Reform Commission and the Ministry of Industry & Information Technology (MIIT) have created a three-year action plan for investment in the construction of information infrastructure (2016-2018) worth a combined total of USD 174.35 billion (CNY1.2 trillion) to develop high-speed fibre-optic, advanced mobile broadband systems, global network facilities and applications1.
Even once a National Plan is approved, it may be subject to constant revision and refinement. A further number of countries are now regularly reviewing their previous NBP – for example, the UK has followed up its ‘Digital Britain’ Plan with the ‘UK Digital Strategy’2 which guarantees a right to a broadband connection, and has more recently published a 5G Strategy for the UK3. There is some indication that these measures might be proving successful, as the UK had the highest average mobile connection speed in Q1 2017 worldwide at 26 Mbps, according to Akamai (2017) 4. Meanwhile, the Government of India has announced that it is fast-tracking a policy
3 Progress in Policy and Regulation
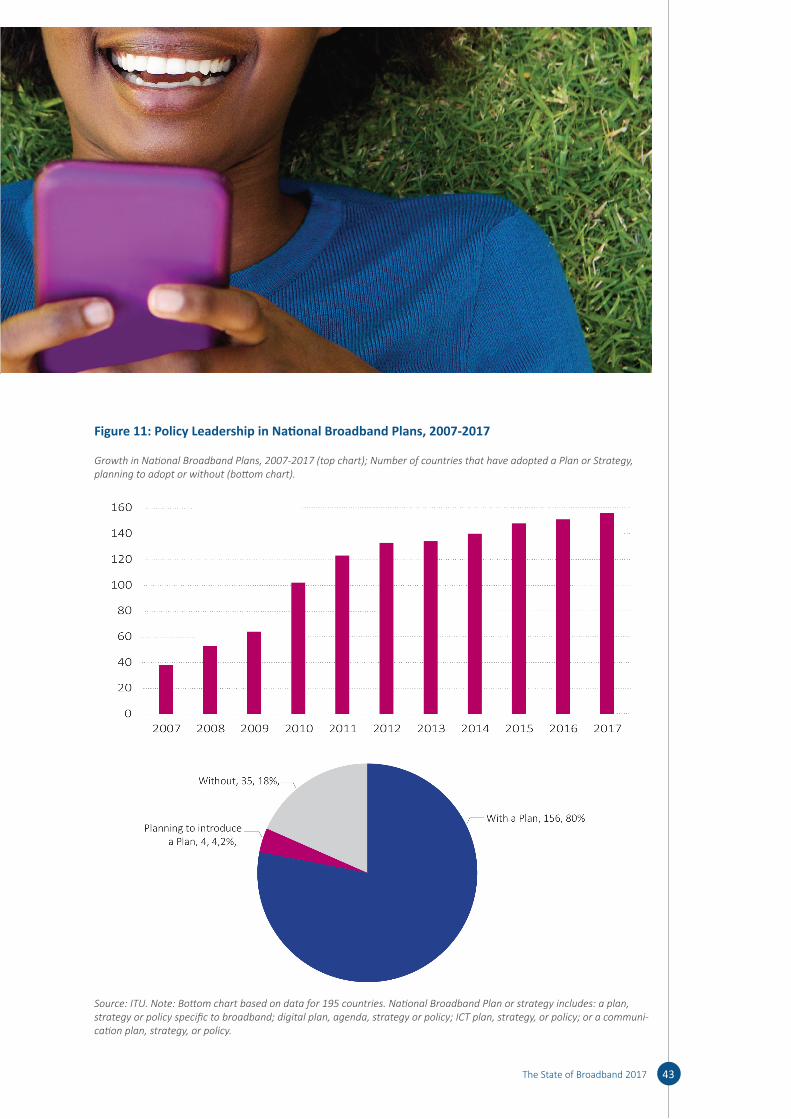
The State of Broadband 2017 43
Figure 11: Policy Leadership in National Broadband Plans, 2007-2017
Growth in National Broadband Plans, 2007-2017 (top chart); Number of countries that have adopted a Plan or Strategy, planning to adopt or without (bottom chart).
Source: ITU. Note: Bottom chart based on data for 195 countries. National Broadband Plan or strategy includes: a plan, strategy or policy specific to broadband; digital plan, agenda, strategy or policy; ICT plan, strategy, or policy; or a communi-cation plan, strategy, or policy.

The State of Broadband 201744
on the usage of high-frequency spectrum bands to ensure regulations are in place in time for Indian operators to use the airwaves for 5G technology5. Viewpoint 12 describes the importance of National Digital Agendas and including both demand- and supply-side issues, while Viewpoint 13 describes Saudi Arabia’s experience with its new broadband initiative.
Viewpoint 12: The Importance of National Digital Agendas
Closing broadband access and usage gaps is an urgent and complex task, essential to developing the digital economy. However, succeeding in seizing the benefits of the digital economy requires a broader understanding of both supply- and demand-side issues and the adoption of a cross-sectoral policy approach. Experience shows that when there is insufficient competition, governments can make a substantial difference, through well-designed policies and regulation, in increasing broadband deployment, investment, competition and use, therefore expanding the new opportunities of the digital transformation made possible for individuals, business and the public sector. Many of these issues, especially demand-side ones, go beyond the traditional scope set by NBPs. National digital agendas, or digital strategies, are a useful tool for coordinating broader actions.
Digital agendas address many inter-connected issues related to the digital economy and ICT promotion, from supply-side policies designed to encourage broadband coverage, to demand-side policies targeted at promoting ICT skills, affordability, e-government, e-health, e-commerce and ICT use by business and citizens. Digital agendas enable to deal in an integrated manner with issues that may not have an obvious relationship. Indeed, the mere exercise of designing a digital agenda, when well done, can provide governments with useful insights, information and networks of
stakeholders that will serve to advance policy objectives for the future.
Colombia offers a good example of a country that has adopted a holistic approach to fostering the entire digital ecosystem. Its Plan Vive Digital, launched in 2010 and renewed in 2014, addresses four areas: infrastructure and services (supply), and applications and users (demand). Other countries such as Chile, with its Agenda Digital Imagina Chile (2013-2020), Costa Rica, with its CRDigit@l (2015-2021), Mexico, with its México Digital (2013-2018), and Uruguay, with the Agenda Uruguay Digital 2020, have also made efforts to broader the focus of their national strategies to include demand-side issues.
One of the key issues frequently addressed in digital agendas involves expanding broadband infrastructure through NBPs, as universal access continues to prove a challenge in most countries around the world. In a competitive market, the private sector can often meet the majority of targets for broadband infrastructure, contents and applications development, but governments also play an important role in bridging gaps not covered by market forces. All OECD countries (bar Switzerland and Japan6) have established specific national goals for broadband deployment in their NBPs, innovation plans or digital agendas. Within these strategies, the majority of OECD countries have specific components to expand high-speed connectivity in rural and remote areas in their NBPs to ensure that people and communities living in these areas can participate in the digital economy.
Among several policy instruments, they can choose to subsidize national and rural broadband networks, promote municipal networks and design competitive tenders for private sector network deployment and management or implement open access arrangements. They can also carry out initiatives to reduce deployment costs,

The State of Broadband 2017 45
e.g. by improving access to information or infrastructure availability or fostering infrastructure-sharing, as well as establishing guidelines such as those for ‘dig once’ practices.
Rapid changes in technology and demand mean that today’s goals may be superseded by the date originally set for meeting their objectives. This is why it is important that any digital agenda or national broadband plan is forward-looking and re-assessed on a regular basis against measurable targets, in order to ensure the success of policy objectives such as serving people in areas of low population or with special needs as demand changes rapidly.
Digital strategies and comprehensive plans involve Communication Ministries as well as many other government bodies responsible for finance, public administration, industry, education, culture and labour, so a coordinating structure is often necessary. Mechanisms need to be established so decisions can be made, where the competence of different government bodies overlap. Clear responsibility for the overall strategy and adequate authority to make decisions are crucial to ensure success.
Source: OECD, “Broadband Policies for Latin America and the Caribbean: A Digital Economy Toolkit”.
Viewpoint 13: Broadband Development in the Kingdom of Saudi Arabia
In line with efforts to realize Saudi Arabia’s Vision 2030 and the National Transformation Program 2020 aiming to develop the vital ICT sector, bolster the digital infrastructure and provide high-speed fiber-optic broadband services to all urban areas in the Kingdom, a high-speed fibre-optic Broadband Initiative was launched in May 2017. CITC signed a number of agreements with the
national telecom operators aiming to provide governmental funding to expand the deployment of fiber-optic broadband services to houses and vital government facilities in all the urban areas of the Kingdom. The number of targeted houses in high-density urban areas is estimated at 405,000 houses, which will raise the percentage of coverage from 44% currently to 80% in 2020, while the number of targeted houses in the urban areas is 1,730,000, raising the percentage of coverage from 12% currently to 55% in 2020 at speeds not less than 100 MB/sec.
The Government of the Kingdom of Saudi Arabia considers access to Internet services for all segments of society as an essential element of its development strategy and as a contributor to the social, cultural, and national development. CITC awarded the first project for high-speed wireless broadband for rural areas in March 2017 to ensure the availability of high-speed broadband for rural areas through governmental funding to increase coverage of wireless broadband networks to 70% of housing in remote areas at speeds not less than 10 Mbps by end 2020. More projects will be awarded in the near future to cover more rural areas.
As a result, the Saudi ICT sector has shown strong growth. The total number of mobile subscriptions reached 44.5 million by Q1 2017, equivalent to 140% and 96% of the population are covered by 3G and 4G technology. Fixed broadband subscriptions reached 3.33 million subscriptions by Q1 2017, with a penetration rate of 45.5% of households. The total number of mobile broadband subscriptions reached around 25 million by the end Q1 2017, for all subscriptions representing a population penetration rate of 78.7%.
The mobile broadband market is gaining momentum, due to strong competition, healthy expansion in the use of smartphones and 4G roll-outs, and
Chapter 3

The State of Broadband 201746
varied data packages aimed at different user segments. The number of Internet users has increased rapidly from 41% in 2010 to reach 74.9% by Q1 2017, amounting to 24 million Internet users. The increase in the demand for Internet services and broadband is mainly due to social networking applications, video on demand (YouTube, Snapchat) and gaming.
Source: The Communications and Information Technology Commission (CITC) of the Kingdom of Saudi Arabia.
In Singapore, the Next-Generation Nationwide Broadband Network successfully revolutionized the fixed broadband market, creating a healthy competitive environment among ISPs and driving the prices of fixed broadband down. A 1Gbps fixed broadband plan cost as low as USD29 per month while a 10 Gbps fixed broadband cost USD137 per month. Singapore also has the world’s highest peak connection speed of 184.5Mbps7. Singapore continues to promote competition and innovation, such as developing a seamless, heterogeneous network, the introduction of a fourth mobile network operator, and waiving frequency fees for 5G trials.
The Philippines’ NBP was introduced by the President in 2016, aiming to extend the reach and access speeds by accelerating the roll-out of fixed (e.g., fibre-optic) and wireless broadband technologies. In November 2016, the Department of ICT opened a public consultation with stakeholders in the public and private sectors. The Plan aims to develop national infrastructure that is ‘open, pervasive, inclusive, affordable, and trusted’, while increasing Internet penetration, especially in remote areas, and aiming to stimulate economic growth through the digital empowerment of people8.
The National Broadcasting and Telecommunications Commission of Thailand released a statement in October 2016 to roll out a broadband Internet network in almost 4,000 villages at a cost of USD 325 million to promote broadband service access to remote areas. The South African Department of Telecommunications and Postal Services issued its National integrated white paper on ICT policy on September 2016. New Zealand is set
to extend broadband to rural areas as part of its strategy to provide 99% of the population with Internet coverage by 2020. Viewpoint 14 details Korea Telecom’s strategy to help create a GiGA Island in Bangladesh.
Viewpoint 14: Bangladesh GiGA Island Partnership for Enhancing Corporate Social Value
The Government of Bangladesh and International Organization for Migration (IOM) and KT worked together to launch the “Bangladesh GiGA Island” initiative on 27 April 2017. Needs assessment surveys and a network feasibility study were carried out to build partnerships and educate island residents.
“Today’s launch is one more step towards the Digital Bangladesh Vision 2021. With the launching of Digital Island, better communication of the island has been ensured with the rest of the world. So, the residents of this island will never remain neglected”, observed Sheikh Hasina, the Prime Minister of Bangladesh at the virtual inauguration. Bangladesh ‘GiGA Island’ is based on a partnership with the Government of Bangladesh and the operator, KT.
Aligned with Digital Bangladesh initiatives, the project has provided the following e-government services with ICT solutions: Teachers Portal, Tele-medicine, and Agriculture Information and Communication Center, and Integrated Pest/Crop Management. “What has been done on the Island of Moheshkhali, can be replicated in other hard-to-reach areas of the country” said the Prime Minister.
For education, a distance learning program has been implemented on a regular basis across 3 primary schools in GiGA Island teaching English provided by three teachers from the Jaago Foundation, a local NGO specialized in distance learning. Moheshkhali was suffering from staffing problems, although the government had built adequate schools and facilities. However,

The State of Broadband 2017 47
by making virtual bridge through broadband, students in island can receive high-quality education without unnecessary relocation, by means of interviews with school teachers via a ‘Teachers Portal’.
For health, the project introduced the portable handheld ultrasonic devices in four community clinics and the Upazila Health Complex, that allows specialist doctors in big metropoles such as Dhaka and Chittagong to diagnose complicated pregnancies and patients in real-time. This will help reduce the maternal mortality rate of 18 deaths per 10,000 people every year (which is above the national average of 17 deaths per 10,000 people), by alerting doctors to potential complications beforehand.
“If I can sell to Dhaka or another Upazila, I can earn more,” says Mr. Alam, who currently only sells his product at a local market twice a week. The project also aims to promote e-commerce by helping farmers connect directly with consumers in partnership with KOICA. Beetle leaf farmer Mohammed Gafun Alam, 40, believes he can increase his profit by 67% or an extra 100,000 taka a year by selling directly to retail customers via an e-commerce portal. He says that he is excited about starting training classes that will be provided by the Bangladesh government and its partners. Bangladesh government has initiatives called AICC and IPM, which help farmers get agricultural information and training.
The project aims to utilize broadband to provide quality social services in education, health and ecommerce, as well as in other areas that can make an improvement to the life of people. Further, the Bangladesh GiGA Island also demonstrates the best practice of PPP models between Governments and private operators that work towards creating CSV and achieving the SDGs.
Source: Korea Telecom (KT).
Over the last several years, the European Commission has been working on a number of proposals to establish the Digital Single Market in the European Union. Whilst one of the main proposals has been to overcome the fragmentation of the European Digital Market so that citizens and business can access the best goods, services and capital across the EU, shaping the policy has also the objective to maximize the growth potential of the digital economy. Many of the proposals address the challenges to the global digital economy and can serve as a strong point of reference for many who are starting to address the complexities of the digital economy and society, on the basis of a stable and predictable legal framework.
Within its plans to boost the Digital Single Market, the EU Commission has adopted a set of initiatives and legislative proposals to move forward with the European Gigabit Society. Alongside creating widespread and reliable 5G connections, the Commission states that by 2025 all schools, transport hubs, public service providers and ‘digitally-intensive’ enterprises should have access to Internet connections
Chapter 3
Box Figure: Distance Learning Class (left), Digital Health Training Session (right)
Source: Korea Telecom (KT).

The State of Broadband 201748
with download/upload speeds of 1 Gigabit of data per second. The EU target is 30 Mbps to 100% of households by 2020 – Denmark aims to go slightly further than this by providing 100 Mbps to 95% of households by 2020. Further, the EU introduced the concept of ex-ante conditionalities in "European Structural and Investment Funds Regulations 2014-2020", one of which (2.1) requests all Member States intending to use European funds for broadband deployment to have a NBP in place.
In many countries, the focus of many NBPs is now shifting away from issues dealing with the roll-out of nationwide networks to dealing with the consequences of massive connectivity and huge growth in traffic (including privacy, security, network neutrality and the relevance of digitization for health and education). Privacy and use of data generated by broadband for public good are also relevant in development and humanitarian action.
A growing number of countries are enacting regulations to protect privacy. The GSMA finds that “in some countries, providers of electronic communication services that are virtually identical to services provided by mobile operators are not subject to the same rules”. In some countries, regulations are limited to the protection of privacy in the context of data use for commercial purposes. Meanwhile, other countries have adopted principles-based models or broad consumer protection mandates to provide guidance and balance between digital development, data use for social good and privacy.
Some countries are focusing specifically on public and social priorities. For example, Madagascar has announced a public project to provide schools and hospitals with Internet broadband connection, also covering remote areas. The coverage is expected to be free of charge, or at least at low-cost, in order to achieve maximum outreach. Kazakh Telecom aims to connect 60 villages in Kazakhstan to fibre-optic network infrastructure by end 2017, increasing to over 200 settlements by 2020.
Viewpoint 15: Centre for Digital Innovation and Capacity-Building in the UAE
The Centre for Digital Innovation (CoDI) of the UAE Mobile Government was announced winner of the C4 category of Capacity Building at the prestigious WSIS Awards at the WSIS Forum 2015. The Center aims to drive innovation by providing capacity-building, quality assurance and consulting services as part of the Mobile Government Initiative. The Centre provides services for testing security and functionality of mobile applications for Government entities and it supports educational and academic organizations within the UAE by providing a portfolio of trainings to drive the evolution toward a knowledge-based society, making use of smart government. The programme contributes to a number of SDGs, notably SDG 4 (education), 16 (strong institutions & governance) and 17 (multi-stakeholder partnerships).
CoDI provides services and functions in four key areas:
• mLAB: mLAB, or the Mobile Application Laboratory, provides world-class testing of mobile applications developed by CoDI for UAE government entities. mLAB staff use in-house custom-developed tools to perform various tests, including evaluating security and privacy-related issues, hardware and operating system version-specific compatibility testing on a range of handsets, and real-time application performance and power consumption metrics.
• Innovation: Innovation is supported through provisioning, display and demonstration of emerging tools, techniques and technologies. Initiatives include the use of next-generation displays, 3D visualization technologies, video & data technologies to foster interactions between federal and local government entities, university students and technologists.

The State of Broadband 2017 49
• Training: CoDI provides training for government employees, the university community (students, faculty and staff) and job seekers to enable them to realize goals of smart government. The CoDI training programme builds on the successful mGovernment Mobile Training Programme, and provides instruction on relevant technical, management and leadership topics through classes, online instructor-led seminars and Internet-based self-paced learning.
• Consulting: CoDI Consulting services hinge on connecting government and industry experts with project managers and developers who are working to support the UAE’s mobile and smart government initiatives. The ultimate realization of the vision and mission of CoDI is through its role as an incubator. CoDI strives to help entities in the UAE to secure funding, to implement, deploy and support projects and applications through collaboration and mentoring to achieve the mGovernment goals and, ultimately, the Smart Government vision of the UAE leadership.
Source: The Telecoms Regulatory Authority (TRA) of the United Arab Emirates (UAE).
3.2 The Changing Face of ICT Regulation
Complementing progress in National Broadband Plans by Governments, regulators in many countries are engaged in large-scale revision and updating of their ICT regulation to take into account the latest technological developments. Regulators are subject to a number of different pressures and their work is characterized by trade-offs, compromise and striking the right balance between the interests of different parties. Regulators are grappling with considering whether digital sector-specific regulation is needed at all (let alone enforceable) and if so, developing the most appropriate kind of regulation. Regulators may have to learn when to be ‘hands-on’ or ‘hands-off’, depending on the different issues at stake.
ICT regulation has evolved globally over the past ten years and has been undergoing a steady transformation as countries have been transitioning to higher generations of regulation (see Figure 12 for the definition of each generation). The ITU Global ICT Regulatory Outlook 2017 has defined a scale of regulatory approaches that describes this transition. According to this report, G5 regulation or ‘collaborative regulation’ is considered the ultimate destination for regulation in a mature ICT market, where broadband is integrated into different vertical sectors.
Chapter 3
Figure 12: Generations of Telecom/ICT Regulation
Source: ITU Global ICT Regulatory Outlook 2017.

The State of Broadband 201750
Back in 2007, four out of five countries worldwide were either in G1 or G2 regulation. Only Belgium had achieved G4 regulation. A minority of just 20% of developed, mainly European countries, constituted the core of the G3 group. Nearly a decade on, this trend has been turned on its head with some 60% of the world’s countries now in G3 and G4 regulation. Fewer than one in six countries are still in G1 and one-quarter of all countries are in G2. G4 countries alone make up 28% out of the 189 countries covered. Countries from all regions have joined the race for better, more adaptive and market-wise ICT regulation, from Australia to Mexico and from Kenya to Rep. of Moldova to Saudi Arabia.
ICT regulation is under close review by many countries, which remains encouraging. No fewer than 52 regulators are now in the G4 category. Notwithstanding European level legislation, EU countries took 16 out of the top 25 spots in G4 regulation. 55% of countries have moved one generation up the ladder of ICT regulation while 15% have leaped generations in only nine years. Such developments are welcome and timely for those markets in need of guidance and safe passage through the stormy growth of the ICT sector.
On the other hand, we should note that for more than one-quarter of countries there has been no movement through regulatory generations since 2007. At the global level, however, the proportion of G1 and G2 countries has been reduced by half while 58% of countries now rank as G3 or G4, a three-fold increase since 2007 (see Figure 13, top chart).
With this in mind, the Broadband Commission Working Group has launched a Digitalization Scorecard project aiming to monitor progress in policy and regulatory frameworks promoting positive progress in digitalization across different sectors (Viewpoint 16).
Viewpoint 16: ‘Digitalization Scorecard’ Assessing Policy & Regulatory Readiness for Digitalization
Digital technology is today touching the lives of individuals and businesses
across the world. We are entering a social and economic revolution enabled by digital technologies, often underlined by the power of access to the Internet. But as digitalization advances, policy-makers and regulators are faced with an unfamiliar challenge: how can they realize the full benefits of digitalization by removing blockages and introducing initiatives to enable digital change?
In reality, digitalization is scaling quickly in some countries, but more slowly and unevenly in others. Policy-makers are grappling with common questions around how to balance and guide the path to digitalization. In a world where the experience of digitalization is new and as yet untested in many fields, there is scope for countries to observe what is happening in other countries, to implement good practices and to learn from each other.
With this in mind, at the suggestion of Mr. Rajeev Suri, CEO of Nokia, the Commission launched a digitalization scorecard to explore national differences in the progress of digitalization from a policy and regulatory perspective. The Working Group on Digitalization Scorecard, under the chairmanship of Nokia and with research support from PwC, prepared a pilot to assess policy and regulatory frameworks which encourage digitalization on an economy-wide basis.
The scorecard covers six countries, focusing on five sectors with high socio-economic impact (agriculture, education, healthcare, government and transport), as well as common digital foundations. The study sets out how each country is performing when it comes to policies and regulations to foster or limit digitalization for six countries, including: high-income countries (Finland and Singapore), middle-income countries (Colombia and Indonesia) and low-income countries (Kenya and Pakistan), which differ by geography and size of population. It assesses leadership and digital literacy, cybersecurity,

The State of Broadband 2017 51
Chapter 3
Figure 13: Evolution of ICT regulation, worldwide, 2007-2015
Source: ITU Global ICT Regulatory Outlook 2017.
G1: ≥ 0 <40 G2: ≥ 40 < 70 G3: ≥ 70 < 85 G4: ≥ 85 ≤ 100.
2007-2013: data for 186 countries; 2014: 187 countries; 2015: 189 countries.

The State of Broadband 201752
data protection, e-payment, and cloud services as horizontal enablers of digitalization. Key findings include:
1. Most countries will benefit from clear leadership and a digital champion: Governments should create a mechanism to establish cooperation across existing institutions. It is recommended to identify which are the best positioned entities (government departments or agencies) to champion digitalization and lead large-scale digital transformation projects.
2. Responsible data sharing should be enabled by adequate policy frameworks: Big data can help us find new cures for diseases, be better stewards of scarce resources and even optimize business processes, but this has to be enabled by adequate policy frameworks.
3. Public funding can kick-start digitalization: The study reveals the need in some cases for an initial amount of governmental funding to kick-start the digitalization progress.
4. National strategies can provide clarity on digitalization’s critical elements: National strategies (e.g., a national Digital Economy Strategy, Cyber-security Strategy or Smart Cities policy) are key.
5. Education and awareness raising are critical to implementing digitalization policies effectively: Governments can consider dedicated initiatives to address sector-specific needs, by e.g. raising the awareness of farmers about the benefits of digital solutions for agriculture, targeting education and/or awareness-building for healthcare ecosystem players.
6. There is no room for complacency in driving digitalization: even in countries high on the digitalization adoption curve, continued action is
needed to encourage digitalization initiatives.
The study seeks to encourage a critical revision of the policy and regulatory frameworks, to map where regulations may create obstacles to the digitalization of a country’s priority sectors – or where necessary policies and regulations are missing. The Working Group has undertaken this project to support countries in introducing enabling regulations sooner. It is hoped that countries will be able to embrace the positive aspects of the digital revolution, while putting in place safeguards and minimizing some of the downsides. It is hoped this project will spark further discussions and research in this area.
Source: Broadband Commission Working Group on the Digitalization Scorecard.
Against a background of profound and rapid change, the role of the ICT regulator is undergoing significant change. Not only is the role proving increasingly important across many different industry sectors but it is also expanding into previously unchartered territories at the forefront of the new and pervasive digital economy. Figure 14 shows that ICT regulators are becoming more involved in a greater number of domains, even as they collaborate more closely with other regulators in other sectors on cross-cutting issues (e.g. network security, privacy and data protection). In fact, regulators in other sectors are also entering into collaboration with ICT regulators (Figure 15).
5G is one issue which all regulators are currently facing, and dealing with, in various stages. 5G poses various technological opportunities and challenges in the diverse services it will underpin. Viewpoint 17 highlights the introduction of 5G in Switzerland.
Viewpoint 17: The Introduction of 5G in Switzerland – Opportunities and Challenges
Since the liberalization of its telecom market in 1998, Switzerland has enjoyed a buoyant telecom market conducive to

The State of Broadband 2017 53
Chapter 3
Figure 14: Expanding purview of the ICT regulator, 2007 and 2015
Source: ITU Global ICT Regulatory Outlook 2017.

The State of Broadband 201754
offering innovative services. In recent years, there have been significant investments in the expansion of networks, both fixed and mobile, giving Switzerland an excellent basis for the development of a smart society. It is now pivotal to thoroughly prepare and to actively monitor the forthcoming introduction of the new generation of mobile radio (5G).
On 20 April 2016, the Swiss Federal Council adopted its "Digital Switzerland" strategy, whereby the Swiss Government is seeking to support the ongoing digitization affecting all areas of our lives in order for Switzerland to seize the resulting opportunities and to deal with the associated challenges. In terms of infrastructure, the Government has set the goal of ensuring that ultra-high-speed broadband will be available in all Swiss municipalities by 2020. The expansion of mobile networks (5G), to be undertaken by the market players, and the frequency resources for 5G, to
be provided by the State, will play an important role in this endeavor.
In February 2015, in a report requested by Parliament, the Government outlined the basic conditions in relation to telecom legislation, building regulations and environmental standards for electromagnetic waves which are important for further expansion of the mobile networks. As a result, there is currently a debate on a revision of the Swiss Telecommunications Act, which will in particular establish the legal basis for spectrum trading and for the funding of a nationwide monitoring of electromagnetic waves. The timely provision of internationally harmonized frequency spectrum for the construction of 5G networks represents a particular challenge. Switzerland is participating actively in the ITU's intensive and long-term frequency allocation processes and is also working at the European and regional levels for the harmonized and
Figure 15: Regulators involved in the ICT Sector, 2015

The State of Broadband 2017 55
speedy availability of the necessary frequencies.
In Switzerland, responsibility for the allocation of frequencies for 5G lies with the independent regulator, the Federal Communications Commission. The allocation currently includes frequencies in the 700 MHz, 1.4 GHz and 3.4 - 3.8 GHz ranges and presupposes a transparent and comprehensive process in which interested parties both in Switzerland and abroad may participate. Compatibility calculations are also being carried out within the ITU framework in the 24.25 GHz to 86 GHz frequency bands in order to examine the extent to which these frequencies are suitable for 5G networks. The allocation process must meet the most stringent requirements for transparency and the rule of law in order to create complete trust among the participants, enabling the necessary investment for wide-ranging expansion of the new mobile radio networks.
To gain experience with the 5G standard at an early stage of the current allocation procedure, telecom companies need to carry out trials and technical tests. It is necessary to carry out the appropriate investigations, to be undertaken within a framework of trial licenses. The Swiss authorities are working together with all interested parties to assist them in a pragmatic manner. With the construction of 5G networks from 2020 onwards, Switzerland will continue its path of digitization and will adapt its well-developed telecom infrastructure to the very latest technologies. With 5G, a new ecosystem will emerge among
network operators, content providers, media corporations and OTT providers which will create new opportunities. For instance, it is expected that the 5G networks will be important for the future applications for the "Internet of Things". The Swiss government will monitor this development closely, since a broad acceptance of digitization will be key to successfully shaping the future.
Source: The Swiss Federal Office of Communications (OFCOM).
The issues which regulators currently face are evolving (Table 4). Competition, licensing and price regulation are of course amongst the main pillars of all generations of regulation and there are multiple patterns and nuances of established regulation in these areas. Nevertheless, new issues come into play and as markets evolve, necessitating further development and tuning. Even on the issue of competition, there is often debate on the principles to follow and the tools to use.
Recently, regulatory debates have centred on whether or not regulation should be limited to access bottlenecks in broadband networks or whether ex post competition law may prove adequate and sufficient for both traditional telecom operators and OTT players. However, networks remain so important, that their regulation is likely to remain a major focus and is unlikely to disappear. Some regulatory areas have been hotly debated for over a decade or more, with divergent patterns setting in. For example, spectrum trading has been embraced by a slowly-growing number of regulators while being vigorously opposed by others. Net neutrality is currently being re-examined. Table 4 presents topical issues and stages of regulatory intervention.
Chapter 3
Table 4: Topical Issues and Stages of Regulatory Intervention in 2015
Many ICT regulators have addressed
Some ICT regulators have addressed
Some ICT regulators are looking into
Most ICT regulators have not yet addressed
Competition Privacy & data protection OTTs/OSPs Autonomous driving carsLicensing Net neutrality e/m-applications BlockchainPrice regulation Spectrum trading Digital financial services Electronic currencies (e.g.,
bitcoin)Interconnection Structural separation Internet of Things Automated electronic tradingNumber portability ICT accessibility Cloud computing Counterfeiting
Source: ITU Global ICT Regulatory Outlook 2017. Note: This list is indicative and not exhaustive.

The State of Broadband 201756
With the rise of interactive multimedia services delivered over the Internet, some traditional service providers have throttled or degraded OTT content because they believe some of it may compete with their own content services (i.e. discrimination arising from vertical integration) or because the service provider is sharing revenue with other content services on its network. In response, a broad range of businesses, civil society organizations, and Internet consumer groups have advocated for net neutrality laws to preserve the free flow of information online.
Regulatory approaches to net neutrality need to take into account local conditions, particularly the level of retail competition to access the market. In competitive markets, mandating net neutrality may prove excessive: barriers to users switching between ISPs will be low, and ISPs may be less likely to discriminate against unaffiliated online content. However, in less competitive markets, regulatory intervention may be required. Such intervention can range from lighter-touch options – such as requirements for transparency or minimum quality of service – to more direct approaches, such as no-blocking or non-discrimination rules that apply to Internet traffic.
The US and the EU generally support principles of net neutrality (although their approaches have been very different), resulting in a higher proportion of countries with net neutrality regulations in place in the Americas and European regions than in others (Figure 16). However, in a number of countries, regulatory approaches to net neutrality are currently under review, in response to fast-moving market developments. Furthermore, EU wide rules on net neutrality entered into force in 2016, which ensure that the same provisions apply across Europe. With the development of the digital economy and on line platforms, public authorities face new challenges in terms of establishing level playing-fields for comparable digital services and platform-to-business relationships. Market concentration is another growing issue facing regulators, whereby only a handful of large platforms have influence over the terms set on the digital market.
Viewpoint 18: Connecting the Unconnected by Collaborating with Power Companies
Connecting the unconnected people is our ultimate goal. However, lower incomes and remote access for people who live in the rural areas can hamper
Figure 16: Net Neutrality Regulations, 2015
Source: ITU Global ICT Regulatory Outlook 2017.

The State of Broadband 2017 57
private sector players in the expansion of broadband into rural areas. PPPs with government financial aid can be a good measure to achieve ubiquitous and affordable broadband services. However, the large capex investments and regular annual opex may result in large financial burdens, both for governments and operators for rural areas.
Promoting infrastructure-sharing of utilities (such as road, railway, water and power companies) could save time and construction costs, enabling more accessible and affordable services. Power companies often have plenty of assets which can be adapted for telecommunications. There is often surplus capacity in Optical fibre composite overhead Ground Wire (OPGW) and All-Dielectric Self-Supporting (ADSS) cables along the transmission and distribution networks, which can be leased to telcos. They also have plenty of ducts, poles and site resources for broadband deployment in urban and rural areas.
Monetizing power companies’ existing network assets with relative low capex investment could make a huge contribution to broadband deployments. Governments should include power companies in their national broadband strategies to accelerate broadband deployments and connect unconnected areas.
Political willpower, regulatory measures on infrastructure sharing, as well as public funding on remote and non-profitable areas, have already attracted fixed and wireless carriers, as well as power companies investing heavily in broadband infrastructure. According to Huawei’s statistics, around 160 power companies in 65 countries have already started or intend to start investing in broadband. 7 out of the global top 10 power companies have launched broadband ventures.
To balance power supply and consumption efficiently, power
companies will further extend their fibre optic networks from the substation down to individual households to realize automated energy distribution, remote monitoring, and telemetry. This could give power companies capability to venture into traditional telco services (including broadband Internet, IoT and 4G/5G transport).
Compared with telcos, power companies have huge competitive advantages in wide network coverage, rich infrastructure and cost leadership in fibre deployment. The rich infrastructure enables the power company with less costly fiber deployment cost compared to telcos. According to our statistics, reusing the power company’s existing infrastructure could save up to 50% of capex investments in FTTH deployment, compared with a new build fiber optic network.
For example, Enel is the major power company in Italy which was the first to implement a large-scale roll-out of smart meters by using PLC and wireless technologies. In 2015, Enel established a new business entity, Open Fiber, following its responsibility under the European Digital Agenda 2020 to deploy FTTH in 250 remote cities in Italy. By reusing 60% of its existing infrastructure (including towers, cabinets, ducts and poles) in its fibre roll-out, Enel achieved 50% cost leadership compared to the incumbent in FTTH deployment, which helped win the NBN contract from the Italian government.
Various examples suggest that infrastructure sharing between telcos and power companies could save money. For example, Orange Poland saves 14% ODN investment and 12 months of lead time by fully sharing pipe, infrastructure, labor and deployment cost with the power company. Vodafone Ireland joint venture with ESB to provide 700,000 households with ultra-fast broadband service by leveraging ESB’s existing overhead and underground infrastructure. Norway Altibox achieved
Chapter 3

The State of Broadband 201758
30% cost savings on and 68% of FTTH market share by cooperating with 42 regional electricity companies.
Today, many countries in the developed world have already deregulated power companies and are allowing them to provide telecom services. However, in emerging markets, regulatory schemes may still restrain power companies from telecoms due to safety, bureaucracy and self-departmentalism. Governments may wish to consider starting an inter-ministerial dialogue to align their ICT policies and sharing their infrastructure resources to realize their digital vision.
Source: Huawei.
3.3 Affordability of Broadband
Public policy needs to actively promote affordable access to the Internet by establishing the right enabling environment. Fixed and mobile broadband services are becoming progressively more affordable in a large number of countries. By 2016, 106 countries had reached the Commission’s target of offering basic fixed-broadband services at <5% of monthly GNI per capita (including two LDCs) and 120 countries had achieved this target for mobile broadband (including three LDCs). However, 63 countries have yet to achieve the Commission’s target for fixed broadband, and 49 countries have yet to achieve it for mobile broadband (Figure 17).
Figure 17: Broadband sub-basket, 2016
Broadband sub-basket prices as a % of Gross National Income (GNI), for both fixed and mobile broadband.
Source: ITU World Telecommunication/ICT Indicators Database.
Table 5: Open Fiber field study on potential infrastructure re-use
Scenario Reuse of existing infrastructure Share of aerial Aerial reuse Share of
undergroundUnderground
reuseCluster B 55% 46% 100% 54% 16%Cluster C 56% 47% 100% 53% 17%Cluster D 67% 65% 100% 35% 7%
Note: Clusters A and B are the market success areas most likely to attract private investment for broadband, covering about 60% of the Italian population. Clusters C and D cover the population, mainly in rural areas with market failure, where State aid is likely required to build broadband infrastructure. Source: Analysys Mason, Enel.

The State of Broadband 2017 59
Mobile-broadband services have become more affordable than fixed-broadband services. By end 2015, average mobile broadband prices corresponded to 5.5% of global GNI per capita – or twice cheaper than fixed broadband.
In Singapore, while fibre broadband prices have dropped drastically, costing as low as USD29 per month for 1Gbps fibre broadband plans, there are various programmes in place to ensure that vulnerable segments of the community can enjoy the benefits of the Internet. For example, the Home Access Programme provides beneficiaries with a mobile computing device and a highly subsidized Internet connectivity plan for two years. The NEU PC Plus Programme enables school children or persons with disabilities from low-income households to own subsidized computing devices, and includes three years of free broadband access. Viewpoint 19 considers some of the factors affecting the cost of Internet access in Africa.
Viewpoint 19: Making Internet Access in Africa More Affordable
Making Internet access more affordable in Africa is a challenge, due to the high costs of satellite access and fibre optic cables. Countries along the African coast (including South Africa, Mauritania, Gabon, and Ghana) generally have cheaper Internet prices and benefit from the improved Internet connectivity provided by submarine cables along the East and West coasts of the African continent. According to the World Bank’s recent 2016 “Digital Dividends” report9, Internet access costs on average USD 206.61 per Mbit/s per month in coastal countries in Africa, compared to USD 438.82 per Mbit/s per month on average in landlocked countries, meaning that users in landlocked countries in Africa pay on average USD 232 more per month for fixed broadband access than those living in coastal areas.
Indeed, studies on the status of Internet provision in African countries reveal that the consumers most affected by high costs of Internet access are those in landlocked countries (including
Niger, Zambia, Malawi, Uganda, Central African Republic, Rwanda, Mali, Lesotho and Niger, among others). Countries such as Chad, Lesotho, Mali and Niger have some of the highest access costs. Comparatively, satellite access offers an alternative, especially for remote areas.
In South Africa, connectivity has established itself firmly as the third utility, alongside power and water and demand is increasing rapidly, as businesses move to using cloud-based services, intelligent software and communications10. In Uganda, consumer discussions initially focused on the comparative price of Internet access, but the explosion in gaming means that unlimited bundles are now popular. Africell, MTN Uganda, Smile Communications, Tangerine and Vodafone offer ‘unlimited’ Internet speeds; however, according to some online commentators, unlimited packages may effectively prove considerably more expensive11.
Rwanda has rolled out a high-speed Internet network that is capable of delivering download speeds of up to 100 Mbps, almost three times faster than those previously available. The Rwandan Government has also signed an agreement with Korea Telecom (KT) to deploy a 4G LTE network countrywide. Rwanda is aiming to extend the network to rural areas and is targeting 92% coverage of high-speed 4G broadband network in 201712.
Source: Dr. Speranza Ndege, Kenyatta University.
3.4 Gender Equality & the Gender Digital Divide
In March 2013, the Broadband Commission called for gender equality in access to broadband by 2020. Progress towards gender equality in Internet access has in fact stalled, and ITU estimates that the digital gender divide is actually widening, not narrowing. ITU estimated that the international digital gender divide stood at 11% fewer women than
Chapter 3

The State of Broadband 201760
men online in 2013 (as a % of the total pool of women/men), whereas by 2015, this has in fact moved slightly backwards – by 2015, 12% fewer women used the Internet than men worldwide, and this disparity is more pronounced in low- and lower-middle income countries.
A recent study conducted by the Economist Intelligence Unit (EIU) and Facebook13 also suggests that the Internet gender gap is growing. Disparities in gender access are largest in developing countries, especially in Africa. The EIU Index reveals that only 11.6% of women access the Internet in Africa, while 88% of them access the Internet in Europe. According to ONE, an anti-poverty advocacy group, if current trends continue, 71% of female Africans might still be offline in 2020, compared with 48% of men.
Women’s lower adoption rates result not just from a shortage of access but from a variety of social, economic, cultural infrastructure and content-related factors. Several initiatives are focusing on empowering women to use the Internet as a tool for economic growth and entrepreneurship. For example, Facebook launched #SheMeansBusiness in 2016. #SheMeansBusiness was created to inspire and empower women to start businesses – it offers training, resources and a community for women entrepreneurs. In a small number of countries, female use of the Internet actually exceeds male use of the Internet (Figure 18). Viewpoint 20 describes opportunities and actions to overcome the digital gender gap and the GSMA’s Connected Women programme. ITU and UN Women recently launched the EQUALS initiative.
Viewpoint 20: Bridging the Gender Gap in Internet and Broadband Access & Use
In an increasingly connected world, women are being left behind. Despite increases in Internet access, a digital gender gap persists. Urgent action is needed to realize the significant benefits that the Internet can bring for women, their communities and the broader economy.
Mobile technology has the power to transform lives. It can help empower women, making them more connected and safer, and providing access to information, services and life-enhancing opportunities, such as health information and guidance, financial services and employment opportunities, often for the first time. Mobile is also the dominant platform for Internet access in many parts of the world, with the mobile industry connecting billions of people to the Internet.
But while mobile connectivity is spreading quickly, it is not spreading equally. There remains a significant gender gap in mobile phone ownership and use. GSMA research has estimated that in low- and middle-income countries alone, there are an estimated 200 million fewer women than men who own a mobile phone, and that even when women do own a mobile device, they are less likely to use it for more sophisticated services such as the Internet, further widening the divide.
The digital gender gap is unlikely to close on its own. Its root causes are driven by a complex set of social, economic and cultural barriers. These obstacles can only be overcome with targeted intervention by all stakeholders. In March 2017, the Broadband Commission’s Working Group on the Digital Gender Divide, co-chaired by the GSMA and UNESCO, launched a report that outlines a set of practical actions that stakeholders can take to address the gender gap in Internet access and use14. The report includes examples of actions being taken by a number of members of the Working Group in the hope that others will be inspired to join these efforts.
To address the digital gender gap, there is a need for:

The State of Broadband 2017 61
• Sex-disaggregated data on Internet access and use to gain a better understanding of relevant contexts. Sex-disaggregated data is currently limited, despite such data
being critical to understanding and measuring the digital gender gap and informing policy and business choices which can help bridge the digital gap.
Chapter 3
Figure 18: Differences persist between Men and Women’s Internet Use
Difference between the percentage of female and male population using the Internet (percentage points)
Source: ITU, cited in World Bank’s Atlas of SDGs 2017: https:// openknowledge. worldbank. org/ handle/ 10986/ 26306.

The State of Broadband 201762
• The integration of a gender perspective in relevant policies and strategies. Strategies, policies, plans and budgets that explicitly address women’s needs, circumstances, capabilities and preferences are essential, if governments, businesses and other stakeholders are to tackle the digital gender gap effectively.
• A focus on addressing the barriers to women’s access to and use of the Internet. We need to address issues of gender equality and social norms, as well as focusing on accessibility; affordability; safety; usability and digital skills; and the availability of relevant content, applications and services.
• Coordinated action by many different stakeholders working together to address the digital gender gap.
Gender equality and women’s empowerment will be key to achieving the SDGs, and specifically SDG 5
(Gender Equality). Addressing the digital gender gap will support the achievement of these goals and will rely on the whole ecosystem working together and taking concrete and measurable action. Through the GSMA Connected Women Commitment Initiative15, mobile operators are making formal commitments with targets to reduce the gender gap in their mobile Internet and/or mobile money customer base across Africa, Asia and Latin America, driving an effort to accelerate both digital and financial inclusion for women. To date, Connected Women and its partners have delivered life-enhancing services to more than 17 million women.
It is not a simple task, but it is imperative that we meet the challenge head-on to ensure that women are not being left behind. Working together, we can make significant strides to address the digital gender gap, supporting the SDGs. When and where women thrive, whole societies, businesses and economies thrive.
Source: Mats Granryd, Director-General, GSMA.

63The State of Broadband 2017
1 https:// www. telegeography. com/ products/ commsupdate/ articles/ 2017/ 01/ 18/ china- outlines- plans- to- invest- usd174bn- in- infrastructure- by- end- 2018/? utm_ source= CommsUpdate& utm_ campaign= 4b96fc1c80- CommsUpdate+18+January+2017& utm_ medium= email& utm_ term= 0_ 0688983330- 4b96fc1c80- 11619241
2 https:// www. gov. uk/ government/ publications/ uk- digital- strategy3 5G Strategy for the UK, available from: https:// www. gov. uk/ government/ publications/ next- generation- mobile-
technologies- a- 5g- strategy- for- the- uk 4 “State of the Internet 2017” report, Akamai Technologies, available at: https:// www. akamai. com/ us/ en/
multimedia/ documents/ state- of- the- internet/ q1- 2017- state- of- the- internet- connectivity- report. pdf 5 https:// www. telegeography. com/ products/ commsupdate/ articles/ 2017/ 03/ 02/ govt- to- auction- spectrum-
annually- draws- up- policy- for- 5g- spectrum/? utm_ source= CommsUpdate& utm_ campaign= 8450ce3b27- CommsUpdate+02+March+2017& utm_ medium= email& utm_ term= 0_ 0688983330- 8450ce3b27- 11619241
6 Switzerland included broadband access within their universal service framework for the entire Swiss territory, originally of 2 Mbps, now 3 Mbps, and has decided not to set additional national goals. In Japan, 50% of households already have 100 Mbps and the remaining 50% at least 30 Mbps, and Japan has chosen not to set additional connectivity goals.
7 Akamai’s First Quarter 2017 State of the Internet Report released on 31 May 2017: https:// www. akamai. com/ us/ en/ about/ news/ press/ 2017- press/ akamai- releases- first- quarter- 2017- state- of- the- internet- connectivity- report. jsp
8 https:// www. telegeography. com/ products/ commsupdate/ articles/ 2017/ 03/ 09/ president- duterte- rubber- stamps- philippines- national- broadband- plan/? utm_ source= CommsUpdate& utm_ campaign= 540bd7fd09- CommsUpdate+09+March+2017& utm_ medium= email& utm_ term= 0_ 0688983330- 540bd7fd09- 11619241
9 Pages 212 and 213, “Digital Dividends”, World Development Report 2016, World Bank, available from: www. worldbank. org/ en/ publication/ wdr2016
10 “#BizTrends2017: Top bandwidth trends for 2017”, by Warren Bonheim, BozCommunity, 9 January 2017, available at: www. bizcommunity. com/ Article/ 196/ 726/ 155603. html
12 “Rwanda targets 92 percent high-speed Internet coverage in 2017”, New China, 8 January 2017, available at: http:// news. xinhuanet. com/ english/ 2017- 01/ 08/ c_ 135964571. htm
13 “The Inclusive Internet Index: Bridging Digital Divides”, EIU & Facebook (2017), available at: https:// theinclusiveinternet. eiu. com/ assets/ external/ downloads/ 3i- bridging- digital- divides. pdf
14 Broadband Commission Working Group Working Group on the Digital Gender Divide “Recommendations for action: bridging the gender gap in Internet and broadband access and use”, 2017, http:// broadbandcommission. org/ Documents/ publications/ WorkingGroupDigitalGenderDivide- report2017. pdf
15 https:// www. gsma. com/ mobilefordevelopment/ programmes/ connected- women/ the- commitment
Endnotes
http://broadbandcommission.org/Documents/publications/WorkingGroupDigitalGenderDivide-report2017.pdf

The State of Broadband 201764
Digital technologies, ICTs and broadband offer major opportunities to improve people’s lives, and enhance development outcomes. In June 2017, UN Global Pulse and GSMA launched a report on “The State of Mobile Data for Social Good” outlining the value of harnessing mobile data for social good. It highlights the current landscape, assesses the barriers to scale, and makes recommendations for ways forward (Viewpoint 21).
Viewpoint 21: Harnessing Mobile Data for Social Good
A digital data revolution is transforming various sectors ranging from healthcare, education to environment. Information about human behavior is now accessible in real-time. This is extremely beneficial for international development and humanitarian action, while the capacity to collect and analyze larger and more complex kinds of data is increasing. Use of mobile data derived from mobile devices has tremendous potential for achieving the SDGs. “The State of Mobile Data for Social Good” report shows the value of harnessing mobile data for humanitarian and development action.
The report reveals that efforts to date have been driven mainly by “true believers”, technologists, and researchers. The lack of adoption of mobile data insights by policy-
makers, the absence of clear privacy regulations, limited public awareness of the benefits of data use and risks of non-use are some of the barriers to scaling up the use of mobile data for social good. Mobile network operators hold data for nearly five billion unique mobile subscribers and eight billion connections. Using that data to improve the well-being of communities requires a concerted effort to meet the unique needs of all stakeholders and ensure privacy rights are respected, so the benefits to society outweigh the risks associated with data use.
Key Challenges
• Lack of a shared vision and cohesive implementation mechanism: Current efforts including pilot tests conducted in the field are not enough to lead to scaled adoption of mobile data solutions. What is needed is a higher-level vision and plan, such as a technology roadmap, to which these activities and solutions can be aligned.
• Lack of a common approach to data privacy and risk mitigation associated with data use: Protection of privacy in the world of big data and emerging technologies continues to be one of the most frequently cited challenges to the
4 Harnessing Broadband for Sustainable Development

wider use of mobile network data for social good. Understanding the threshold and having clear common guidance on the assessment of risks and harms for data is being explored by UN Global Pulse.
• Lack of technical capacity globally and in LMICs: using mobile data for social good requires unique technical skills and expertise that in some cases may be lacking globally and particularly in LMICs.
Recommendations
• Identify and build sustainable business models: Analyze pilot project business models to understand which projects have demonstrated return on investment and which have not.
• Address gaps within the data privacy and data protection landscape and mitigate risks: Invest in innovation projects on privacy and security engineering to develop new models for mitigating re-identification risks and addressing data breaches. Active participation of data advocates is critical. Collegial engagement and dialogue of data users, data providers and privacy
advocates is key. Revise current regulatory frameworks or develop new ones to address development and humanitarian challenges. Create a template for legal agreements between the Data Users and MNOs on how data should be accessed and handled, transferred or used.
• Build capacity: Develop local technology capacities and engagement with local experts. Improved coordination among countries to enable learning from best practices and to create cohesive strategies for working with multinational operators. The introduction of big data into existing development and humanitarian learning networks could promote understanding and minimize duplication of efforts.
• Create global tools for public good: Develop an open-source data handling toolkit with specifications for standard datasets, as well as open algorithms that support social good and generate key business insights, and scripts that enable the MNO to run the analysis in house.
Source: UN Global Pulse & GSMA, “The State of Mobile Data for Social Good”
The State of Broadband 2017 65

The State of Broadband 201766
4.1 Broadband for Improving Food Security and Ending Hunger
Broadband is changing the way we produce, distribute, manage food and feed people, while ICTs more broadly present unparalleled opportunities for rural people to access the services and information they need for development. Broadband technologies, along with the digital literacy skills to use them, enable people, groups and communities to create their own solutions, according to their local circumstances and traditions.
Broadband technologies provide useful tools to improve nutrition by enhancing agricultural systems, improving access to healthy diets, improving knowledge for food choices, increasing resilience of food systems to economic, climatic and human-made shocks, and responding to food-borne threats to consumers. However, it is important to remember that people – not technologies – must remain at the centre of development.
ICTs play something of a dual role with regard to keeping people where they are, versus the choice – or the decision – to migrate. On the one hand, greater access to ICTs and broadband are opening up people’s awareness to the opportunities that lie elsewhere, and changing people’s expectations about the future, and the risks and opportunities that lie elsewhere. On the other hand, smallholder farmers can use the Internet to diversify their activities and/or improve the productivity of their ancestral farm.
For example, in Tanzania, an IFAD project supports rural men and women with information via mobile, the Internet and email, while enabling them to communicate with processors, traders and consumers in the market chain. As a result, some smallholder farmers doubled or even quadrupled their market volume, demonstrating how responsive smallholder farmers can be, given greater certainty and assured of a fair price1. Digital technologies can help farmers, fishers, collectors, pastoralists, women, youth and traditional communities to be more productive, sustainable and resilient.
In Zambia, an information service designed by IFAD and the Zambia National Farmers Union provides accurate and up-to-date agricultural and market information covering the entire value chain. This enables smallholder producers to make informed decisions about what to grow, volumes required, storage, processing, marketing and investment opportunities. The Agricultural Market Information System (AMIS)2 is an inter-agency platform designed to enhance food market transparency and policy response for food security. AMIS assesses global food supplies (focusing on wheat, maize, rice and soybeans) and provides a platform to coordinate policy action in times of uncertainty in the major markets. By enhancing transparency and policy coordination, AMIS helps prevent unexpected price hikes and strengthen global food security.
In Myanmar, the mobile app 'Site Pyo’ provides farmers with up-to-date localized weather information and best practices for growing and maintaining specific crops, including seed quality control, land preparation, water management and harvesting. Farmers make up almost 80% of the workforce in Myanmar and Site Pyo helps to improve productivity and increase earnings, given the country’s high smartphone penetration rate. The app and its associated data are free and designed to remove barriers for the benefit of Myanmar’s farming communities. To date, Site Pyo has received over 260,000 downloads, a year after its launch on Peasant Day in Myanmar on 2 March 2016.
In Cambodia, smallholder farmers have been given software to analyze soil, determine fertilizer requirements, give advice on best seeds and deal with pests and diseases. The FAO has introduced a Digital Services Portfolio in Rwanda and Senegal to provide smallholder farmers with mobile apps and information on nutrition, market prices, animal health and weather forecasts.
FAO and IFAD are also using satellite imagery, GIS and earth observation to map land use, water resources, water scarcity, crop yields, environmental degradation, and improve the targeting of their work and relief efforts. FAO is working on a Global Information and Early Warning System (GIEWS) on Food

The State of Broadband 2017 67
& Agriculture, desert locust mapping and warning systems, water productivity, and the impact of climate change. In Yemen, IFAD is mapping vulnerability to climate change using GIS modelling, satellite observations and social vulnerability assessments to identify target areas, and plan for building retaining walls, water catchment ponds, dry wall terraces and other key infrastructure according to local risk levels and the needs of the rural population.
Global Pulse has worked with the World Food Programme (WFP) to assess the potential of using mobile phone data to develop real-time indicators of food security that can be used in regions where standard household surveys (or early warning indicators) are not always possible or available. Analysis of data from mobile airtime credit purchases (or “top-ups”) in an East African country showed high correlations between airtime credit purchases and survey results referring to consumption of several food items. These findings demonstrated that, under certain circumstances, airtime credit purchases could serve as a proxy indicator for food spending.
4.2 Broadband for Improving Health and Wellbeing
The case for adopting and integrating broadband into healthcare to improve human health and wellbeing has been evident for nearly two decades. Today, there has been considerable progress and growth in eHealth, with many countries poised to move from piecemeal implementation of eHealth and digital health towards moving eHealth to the centre of strategic health planning. Broadband can provide a foundation for future health systems, by delivering on national eHealth strategies, building capacity, engaging in collaborations and striving to ensure public ownership, trust and confidence in eHealth over the years to come.
Digital health is the use of broadband and ICTs for health purposes, and can include connecting up clinics and/or remote communities; training healthcare providers (e.g. by mlearning and e-learning); improving the quality of care through digital solutions;
introducing electronic medical records; improving data management and monitoring; or simply facilitating communications.
Broadband and Electronic Health Records (EHR) can transform healthcare systems, by making use of the greater information and real-time analysis and communications. Wisely used and widely applied, digital health can expand coverage through increased access to healthcare, improve the quality of care and efficiency of health systems, and empower patients to take more responsibility in the management of their own health.
The Broadband Commission Working Group on Health commissioned a report into digital health, which found that digital health has shown strong growth recently3. The number of mobile health products and services has doubled over the past five years in LMICs4, while there were more than 165,000 mobile applications for health services available by 20155. Meanwhile, the WHO reports that 73 of 116 (63%) of its Member States have defined national digital health strategies and corresponding plans to implement them, although close to 40% of countries have yet to develop a digital health strategy6. For example, Rwanda has introduced an eHealth Strategic Plan 2016-2020, which includes: Electronic Medical Records (EMR) and facility management systems; telemedicine; routine health management information and disease surveillance systems; and a data warehouse and information portal.
The Commission’s Working Group on Digital Health found that the most important priorities are to ensure effective government leadership and close cooperation between the ICT and health sectors in the implementation of digital health (Viewpoint 22). Viewpoint 23 describes how Korea Telecom (KT) is pioneering the use of roaming data for epidemic preparedness.
Viewpoint 22: A Call for Government Leadership and Cooperation between ICT and Health
The digital age is upon us, offering the potential to revolutionize how healthcare is delivered. Digital tools can increase
Chapter 4

The State of Broadband 201768
access to health, empower patients, and provide better health information and education for all. They can also facilitate the use of real-time data to ensure that surveillance systems are more action-oriented and prioritize limited resources. Although not many countries have yet analyzed the impact of digital health on their systems, Canada recently estimated that their investments in digital health generated savings of USD 15 billion since 2007.
Despite its promise, however, the digital health landscape today is highly fragmented. The result is a myriad of digital health projects and applications that rarely reach scale and can sometimes even strain the health system. One important step toward addressing the fragmentation is a national digital health strategy. These strategies are essential to facilitate standards for interoperability, regulations and policies to support digital health solutions as well as bring more coordination into the landscape.
To help solve these challenges and to uncover how we can truly harness the power of ICTs for health, we need a better understanding of the key elements involved. That is why, in February 2017, we published the report of the Working Group on Digital Health, “Digital Health: A Call for Government Leadership and Cooperation between ICT and Health”, based on case studies of eight countries. The report concludes that, with digital health solutions, we must address the priority health needs of the country; and to achieve this, we need committed senior leadership from government with sustained financial resources to ensure a strong national digital health strategy.
At the Novartis Foundation, we have observed first-hand the problem of fragmentation of digital health applications, and see a clear need for stronger country leadership as well collaboration between ICT and health policy-makers. One striking example of what we mean by ‘fragmentation’ is
that there are eleven different mobile health initiatives for maternal and child health funded by different institutions in Mali. Most of these institutions use their own tools and systems which are not interoperable with the current systems used by the national eHealth agency.
The report finds that the success of any national digital health strategy depends on effective leadership, and strong intragovernmental cooperation between the health and ICT sectors. The case studies demonstrate that a national ICT framework or plan, if built in coordination between health and ICT authorities (e.g. the Ministry of Health, Ministry of Communication, eGovernment agency), can enable alignment with common policies and ICT standards and thereby supports data interoperability across systems and programmes. In order for digital health to scale, investments and expertise are needed from both sides. Clearly defined governance mechanisms can help organize and guide stakeholders in implementing the strategy in this cross-sectoral work within a government. The report identifies three governance mechanisms that can guide implementation.
We hope that the shared experiences outlined in this report, from different countries and experts with differing perspectives, will help to achieve what is needed for digital health to realize its full potential and transform the way the unprecedented scope of global health needs are addressed. Progress is happening in digital health, and with that progress comes the prospect of realizing the potential of broadband and ICTs to achieve global health goals through the SDGs and beyond.
Source: Dr. Ann Aerts, Novartis Foundation.
Viewpoint 23: Preventing Global Epidemics with Broadband & ICTs
As the development of transportation enables us to travel farther and faster, infectious diseases have become a serious global concern. To prevent the

The State of Broadband 2017 69
entry and spread of infectious diseases, countries are establishing surveillance systems. However, infectious diseases are still causing massive casualties and huge economic loss.
In 2014, Western African countries reported 11,310 deaths caused by the Ebola virus. A year later, MERS epidemic broke out across 27 countries, causing a sizeable number of casualties. More frequent and unexpected outbreaks of epidemics raise a question about the functionality of current prevention systems of countries. According to “The Neglected Dimension of Global Security”, a potential global pandemic outbreak could cost more than USD 60 billion per year7. These global epidemic crises are a big challenge to achieving the UN’s SDG 3, “Good Health and Well-Being”, which seeks to assure healthy lives and to promote well-being for all. Medical and pharmaceutical companies are working to address SDG 3 through the use of ICTs.
To address this challenge, KT in collaboration with the Korea Centers for Disease Control and Prevention (KCDC) launched a system based on roaming and big data to identify individuals travelling to infectious countries. The location of subscribers who travel to a country prone to get a disease is reported back, based on their roaming data and alerted to KCDC. When these subscribers return to Rep. of Korea, they receive a SMS notice that they are required to report for potential quarantine control in accordance with the regulations. This fills a loophole in the current general quarantine system that cannot screen epidemic country-visited travelers who return home via a third country free of the disease. Also, citizens are informed of symptoms and measures to take in case of their appearance. This travel information is also sent to healthcare facilities for reference when symptomatic individuals visit the facilities.
Chapter 4
Box Figure: Key Observations from the Report
Source: Report of the Broadband Commission Working Group on Digital Health.

The State of Broadband 201770
On average 10,000 SMS alerts are sent daily on behalf of KCDC where 245 KT subscribers are screened, returning via third ‘clean’ countries after visiting epidemic prone countries, helping monitor roughly 90,000 infection risks per year. The information-sharing system fosters behavioral changes through customized and prompt alerts. Symptomatic individuals are more likely to report symptoms and visit clinics, when guided by the SMS alerts. The project has been well-received by the Korean public and the Government, improving awareness of epidemic risk and governance for risk management.
To achieve the UN’s SDGs and minimize potential risk caused by the panic of infectious diseases, KT is encouraging the participation of ICT companies at global events of relevance to the SDGs, including the 2016 United Nations Global Compact Leaders’ Summit, Mobile World Congress and the 2017 Business 20 Summit in Germany. Recently, on 17 May 2017, the project was introduced in the B20 Health Initiative policy paper. In addition, on 29 May 2017, KT and Safaricom in Kenya signed an MOU for preventing the spread of infectious diseases using roaming data, a first step for reducing epidemic risks.
Progress is happening in digital health, and with this progress comes the real prospect of realizing the potential of ICTs to achieve the global health goals of the SDGs. With the power of mobile broadband technologies, KT strongly believes that epidemic preventive measures can contribute to improving the global health condition. Their impact will multiply, if this gets adopted globally to prevent the epidemic spread. Knowing that the real success comes from a collaboration of other operators, government and international institutions, KT would like to move this and other initiatives forward collaboratively.
Source: Korea Telecom.
In terms of telemedicine, the Ghana Health Service telemedicine programme (supported by the Novartis Foundation) connects remote community healthcare workers with a teleconsultation service center at a referral facility through a mobile phone. A mobile health (mHealth) solution that uses simple SMS reminders to improve adherence to tuberculosis medication in Thailand demonstrated greater compliance among patients who receive reminders, compared to others8. Approximately, 70% of requests per year were resolved by a phone call, relieving the burden on further health services.
Box Figure: Use of Big Data in Pandemic Preparedness and Reaction & Global Expansion
Source: Korea Telecom.
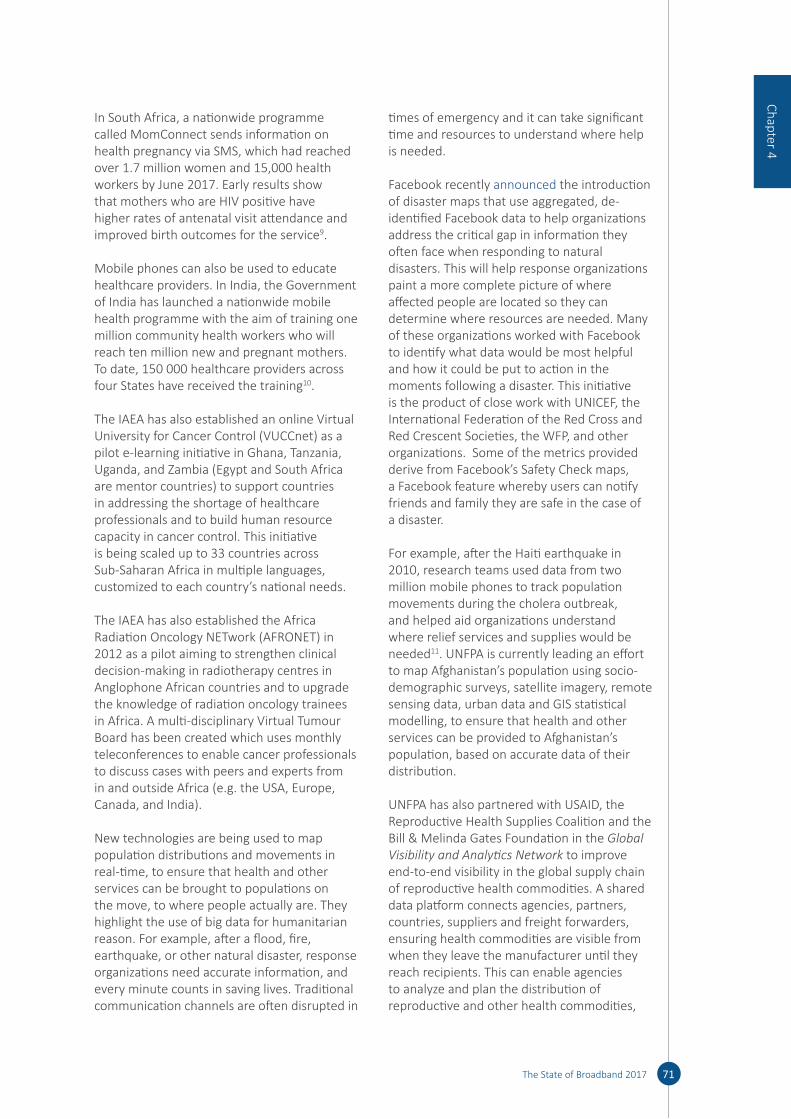
The State of Broadband 2017 71
In South Africa, a nationwide programme called MomConnect sends information on health pregnancy via SMS, which had reached over 1.7 million women and 15,000 health workers by June 2017. Early results show that mothers who are HIV positive have higher rates of antenatal visit attendance and improved birth outcomes for the service9.
Mobile phones can also be used to educate healthcare providers. In India, the Government of India has launched a nationwide mobile health programme with the aim of training one million community health workers who will reach ten million new and pregnant mothers. To date, 150 000 healthcare providers across four States have received the training10.
The IAEA has also established an online Virtual University for Cancer Control (VUCCnet) as a pilot e-learning initiative in Ghana, Tanzania, Uganda, and Zambia (Egypt and South Africa are mentor countries) to support countries in addressing the shortage of healthcare professionals and to build human resource capacity in cancer control. This initiative is being scaled up to 33 countries across Sub-Saharan Africa in multiple languages, customized to each country’s national needs.
The IAEA has also established the Africa Radiation Oncology NETwork (AFRONET) in 2012 as a pilot aiming to strengthen clinical decision-making in radiotherapy centres in Anglophone African countries and to upgrade the knowledge of radiation oncology trainees in Africa. A multi-disciplinary Virtual Tumour Board has been created which uses monthly teleconferences to enable cancer professionals to discuss cases with peers and experts from in and outside Africa (e.g. the USA, Europe, Canada, and India).
New technologies are being used to map population distributions and movements in real-time, to ensure that health and other services can be brought to populations on the move, to where people actually are. They highlight the use of big data for humanitarian reason. For example, after a flood, fire, earthquake, or other natural disaster, response organizations need accurate information, and every minute counts in saving lives. Traditional communication channels are often disrupted in
times of emergency and it can take significant time and resources to understand where help is needed.
Facebook recently announced the introduction of disaster maps that use aggregated, de-identified Facebook data to help organizations address the critical gap in information they often face when responding to natural disasters. This will help response organizations paint a more complete picture of where affected people are located so they can determine where resources are needed. Many of these organizations worked with Facebook to identify what data would be most helpful and how it could be put to action in the moments following a disaster. This initiative is the product of close work with UNICEF, the International Federation of the Red Cross and Red Crescent Societies, the WFP, and other organizations. Some of the metrics provided derive from Facebook’s Safety Check maps, a Facebook feature whereby users can notify friends and family they are safe in the case of a disaster.
For example, after the Haiti earthquake in 2010, research teams used data from two million mobile phones to track population movements during the cholera outbreak, and helped aid organizations understand where relief services and supplies would be needed11. UNFPA is currently leading an effort to map Afghanistan’s population using socio-demographic surveys, satellite imagery, remote sensing data, urban data and GIS statistical modelling, to ensure that health and other services can be provided to Afghanistan’s population, based on accurate data of their distribution.
UNFPA has also partnered with USAID, the Reproductive Health Supplies Coalition and the Bill & Melinda Gates Foundation in the Global Visibility and Analytics Network to improve end-to-end visibility in the global supply chain of reproductive health commodities. A shared data platform connects agencies, partners, countries, suppliers and freight forwarders, ensuring health commodities are visible from when they leave the manufacturer until they reach recipients. This can enable agencies to analyze and plan the distribution of reproductive and other health commodities,
Chapter 4

The State of Broadband 201772
avoiding shortfalls and stock-outs, and saving lives.
In 2017, Singapore launched the Smart Health TeleRehab to offer patients rehabilitation services at their convenience. Through wearable sensors and remote monitoring by therapists, patients can undergo rehabilitation exercises at a time and location of their choice. The system detects and measures motor movements with sensors and algorithms, enabling immediate feedback to patients on whether they have performed the exercises correctly. A video conferencing feature is also available to allow patients to consult therapists remotely and for therapists to review patients’ progress asynchronously via smart dashboards. A time and motion study showed that this solution led to productivity gains of more than 30%. This solution has been implemented by several health institutions and will be rolled out to hospitals by end-2017.
4.3 Broadband for Ensuring Inclusive and Quality Education for All
Education is both a human right and a force for transformation, empowering individuals, expanding their choices, bolstering health and productivity, strengthening societies and economies (Viewpoint 24). Broadband and other new technologies can be harnessed to reinforce education systems, bolster knowledge dissemination, widen access to information, advance quality and effective learning and to ensure more effective service provision.
As societies become increasingly digital, broadband and ICTs must be integrated into planning, curricula, teacher training and schools, not added onto curricula as an afterthought. SDG 4 – to ensure inclusive and equitable quality education and promote lifelong learning opportunities for all – is ambitious and comprehensive, requiring a transformation in approaches to education, drawing on all new sources of quality, relevance and innovation. Viewpoint 24 explores how broadband and ICTs can
be leveraged to achieve SDG 4 and ensure inclusive and quality education for all.
Viewpoint 24: Leveraging Broadband and ICTs to Achieve SDG 4, Ensure Inclusive and Quality Education for All and to Promote Lifelong Learning
The world is changing rapidly, driven by a digital revolution which we must ensure bridges all divides, strengthens inclusion, and leaves no one behind. In this respect, new technologies can be drivers and enablers for States progressing to achieve the 2030 Agenda for Sustainable Development – and specifically SDG 4 to “ensure inclusive and equitable quality education and promote lifelong learning opportunities for all”.
Education is a human right. Education is also a force for transformation, empowering individuals, bolstering health and productivity, strengthening societies and economies. We must support States and all relevant actors in making the most of ICTs as development multipliers, through new investment in access, skills and relevant content. Today, we must do everything to harness the power of new technologies to reinforce education systems, to bolster knowledge dissemination, to advance quality, equity and access to effective learning and to ensure more effective service provision. ICTs can play a pivotal role, in all countries including low-income countries, in achieving SDG 4.
ICTs can enable countries to close many gaps at a “leapfrog” pace. The increasingly powerful capacities and lower price of ICTs have enabled a rapid diffusion of digital devices and applications to broad segments of the population in developing countries. ICTs also have significantly reduced the cost of deploying innovative services across sectors. ICT-enabled cost-saving delivery models of service provision are already changing, if not disrupting, the education sector in high-income countries, and making innovative digital

The State of Broadband 2017 73
services possible for education systems in low-income countries. In addition, through broadband connectivity, social media and mobile applications, ICTs can mobilize new public awareness about the potential of digital innovations for achieving the SDGs, which, in turn, can help to accelerate the demand and readiness for ICT deployment.
The Power of ICTs to Achieve SDG 4
ICTs can dramatically expand access to knowledge, and offer unprecedented opportunities to reduce the long-existing learning divides, especially for low income countries. Access and inclusion are among the first multiplying benefits of new technologies.
Deepening engagement by policy-makers, the public and private sector will help make the most of the power of ICTs for inclusive access to quality education. The UNESCO 2012 Paris Declaration on Open Educational Resources (OERs) encourages governments to open-license public and taxpayer funded educational materials, in order to lower barriers of cost and access, as well as opportunities for adaptation and improvement. Governments have a special responsibility to ensure that key public education institutions are fully supported by high-quality ICT infrastructure. This is not to say that all girls and boys should own digital devices, but rather that they should have easy access to devices and Internet connections in their schools, local communities or in their homes. In this light, all education stakeholders should recognize enrolment in quality-assured online courses as an alternative or complementary mode to face-to-face programmes of study.
New technologies can also multiply the quality of learning. This requires new policies and resources at all levels. At best, this calls for education institutions and programmes to have access to textbooks and other learning materials, including online resources
and OERs, along with easily accessible ICT facilities, and sufficient numbers of qualified teachers. The benefits reach across the board. Strategy is essential. The education sector’s uptake of ICTs will not automatically result in the improvement of student performance, unless it is guided by effective strategies. Governments must transform existing practices by, for example, reforming curriculum and assessment, making purposeful deployment of ICT systems in educational institutions and incentivizing educators to employ new pedagogies.
The most significant way for effective policies to successfully integrate ICTs in education is through teacher training and professional development. The challenge is not only to prepare teachers to integrate ICTs in their pedagogy and to offer real-time support, but also to provide them with the incentives and the professional motivation to do so. We need to rethink the role of teachers and reform their training and professional development. In this, the UNESCO ICT Competency Framework for Teachers (ICT-CFT) promotes a competency-based approach to re-defining teacher qualification, and to providing teachers with system-wide support for the effective pedagogical use of ICT. In that regard, mobile technology can offer a cost-effective means for providing in-service support to teachers, notably in low-income countries.
Promoting lifelong learning, including higher education, is essential in a modern economy, and one for which ICTs can play an essential role, to bridge learning gaps and enable professional progression and mobility. ICTs can be used to deliver education and training, including TVET, in both formal and non-formal settings. In this way, ICTs can improve and diversify learning pathways, improve learning quality, and further reach vulnerable and underserved groups, including rural communities, women and girls, out-of-school youth and people with disabilities.
Chapter 4

The State of Broadband 201774
Online learning, including via open-licensed OER-based MOOCs, can enable students to gain free access to high-quality skills development opportunities and university courses. Training materials and social media-based online coaching are also accessible over tablets, laptops, smart phones and other devices. These multiple channels for training materials have radically transformed the ways in which continuing education services are provided. Mobile technology and self-directed learning can open up new options to train or retrain millions of youths, unemployed people and workers, as well as catalyze new pathways for lifelong learning.
Innovative ICT-based approaches in certification and assessment also provide tools to support flexible professional progression and mobility across workplaces and career stages, necessitating transparent quality assurance measures for online learning. Governments need to ensure that both girls and boys, women and men, have equitable access to high-quality ICT infrastructure. All of this will be important to recognising the knowledge, skills and competencies acquired through informal settings, and to building bridges between formal and non-formal learning. In summary, ICTs are widening a new horizon of opportunities to take forward SDG 4, and taking this forward requires political will, effective planning and committed resources for strong implementation. The future can be bright through ICTs in education, but it must be bright for all.
Source: Irina Bokova, Director-General of UNESCO and Vice-Chair of the Broadband Commission.
Expanding access and enhancing inclusion are the first priorities in harnessing the power of broadband. For example, in Bangladesh, ICTs have enabled students to access quality online teaching, even when qualified teachers may be scarce – the Jaago Foundation is working towards providing education to underprivileged children in rural areas. The project provides children with only limited
access to qualified teachers with free-of-cost high-quality study programmes delivered by quality teachers in urban areas through video-conferencing services.
In Senegal, nearly 10,000 girls and women have been reached through programmes using computer and mobile-based literacy through a partnership of UNESCO with P&G and the Ministry of Education. This successful programme has been extended to Nigeria, using traditional and e-learning courses to reach some 60,000 girls and women.
In the Republic of Moldova, GirlsGoIT teaches girls digital literacy and entrepreneurial skills and promotes positive role models through video. Similarly in Kenya and South Africa, 20 Mozilla Clubs for women and girls teach basic digital literacy skills in safe spaces. UN Women is developing a Virtual Skills School to offer learning pathways and a second chance to women and girls forced to leave formal education, to facilitate their re-integration into formal schooling, and enable them to progress into non-traditional sectors as either job seekers or job creators.
In Indonesia, “Indonesia Belajar” (Indonesia’s Learning) is a digital education programme which aims to use technology to help make education more available and accessible for children across Indonesia. Indonesia Belajar has been piloted across 65 schools of the Hasri Ainun Habibie ORBIT Foundation and CREATE Foundation’s CREATE CyberSchool. It has also trained 500 teachers with tools to increase digital literacy and higher quality education in partnership with the Ministry of Education and Culture of Indonesia.
In the Maldives, some 7% of students enrol for higher secondary education, with educators often unable to reach students living in the more remote communities across 200 islands. Launched in collaboration with the Ministry of Education in Maldives and powered by Microsoft in Education, Ooredoo Smart Campus is an end-to-end solution for distance education which enables educators to maintain their curriculums online. To date, the solution has helped Maldives Polytechnic to expand the reach of its free education beyond the four largest atolls to those remote communities
The State of Broadband 2017 75
who are often unable to leave home to pursue higher education. This year, over 100 students from some 90 islands will graduate from business and management courses.
UNESCO has successfully conducted projects in Mexico, Nigeria, Pakistan and Senegal, to advance and deliver teacher development through mobile phones. In Africa, UNESCO is harnessing technology for quality teacher training in eight countries through a China Funds-in-Trust project. This involves integrating ICT pedagogy in the curriculum and equipping teacher training institutes with ICTs. In Myanmar, UNESCO is working with the Ministry of Education to leverage growth in access to ICTs through strengthening pre-service teacher training, in a project supported by the Australian Government, to train ICT educators to teach in education colleges.
Another example of the power of broadband to promote inclusive and equitable quality education and lifelong learning opportunities is the Summit Learning Platform. In 2014, Facebook's engineers partnered with Summit Public Schools to develop the Platform, which brings a personalized approach to education that helps students reach their full potential. It enables “personalized learning” to give teachers the tools they need to customize instruction to meet students’ needs and interests, as well as the time and support to build strong relationships with students. The Summit Learning Platform is available for free. There are now over 100 schools in the U.S. participating in the Summit Learning Program during the 2016-17 school year.
In addition, mobile technology can offer flexible solutions to monitor the functioning of the education system in the rapidly-changing conditions that characterize emergency situations. In Jordan, OpenEMIS, an open source management information system developed by UNESCO, has been customized for collecting educational data on Syrian refugee children in schools and education centres in the Za’atari refugee camp. In Germany, the Kiron Open Higher Education organization has established a hub of openly licensed Massive Open Online Courses (MOOCs) from 23 partner universities to help refugees find courses matching their
background and needs, accompanied by a coaching service. Examples of how Singapore is leveraging technology to enrich the learning and teaching experience are presented in Viewpoint 25.
Viewpoint 25: Promoting Technologies in Education in Singapore
Singapore continuously explores the innovative use of emerging technologies to enrich the learning experience and enhance the teaching quality. This use of technologies in education is applied to the whole education continuum, from early childhood to adult learning. The Singapore Government has championed various programmes to encourage the adoption of technologies in day-to-day learning.
Technology in Schools
Singapore has envisioned that young learners may be enabled to personalize their learning experience to their own strength and preferences, and to address specific learning gaps and needs. By incorporating technologies into daily education, students experience how smart technologies may play a part in their daily life where the environment is able to learn about and adapt to the students’ needs, just as the students are able to continually learn about and augment their environment.
For example, Singapore initiated the IoT@School project to illustrate how students can use Big Data collected from the day-to-day environment. Two primary and three secondary schools were provided with IoT sensors and data-loggers connected to an online portal. The equipment allows students and teachers to gather continuous data about their environment, design investigations around it, and share findings with other schools. If scaled up, the information gathered could be used in smart-city planning.
Singapore also introduced the PlayMaker and Lab on Wheels to
Chapter 4
The State of Broadband 201776
build confidence in children and spark their interest in Science, Technology, Engineering and Math (STEM). The PlayMaker Programme offers child-friendly, technology-enabled toys that promote tactile and kinesthetic experiences. These technology-enabled toys allow children to explore and find creative solutions. Guided by adults, children can acquire abilities including logical thinking, reasoning, sequencing, estimation and inventive thinking. The tech-enabled toys also encourage children to work in small groups, developing their social and communication skills.
The IMDA Lab on Wheels was pioneered in November 2014, with one retrofitted bus travelling to primary schools (ages 7 to 12) to bring technology to their doorstep. Engaging workshops aim to bring technology closer and inspiring students to consider tech and media careers. In May 2016, the programme expanded to 4 buses to cater to overwhelming demands from secondary schools (ages 13 to 17). In addition to workshops, the school buses also promote makers’ mentality by allowing students to try their hands using the latest fabrication equipment on the bus. In addition to schools, the team has also conducted workshops at community spaces such as public housing and community centers to reach out to marginalized groups who might otherwise be unable to experience tech and media, such as home-schooled or underprivileged children, seniors and dialysis patients. Technologies showcased by the Lab included 3D modelling and design, social robots (e.g. Cosmo, Nao), plug and play electronics (Little Bits, Circuit Stickers), micro-controllers, drones and Virtual Reality (VR) glasses.
Technology in Further Learning
Cognizant that learning is a continuing activity, Singapore has also developed a learning initiative that intertwines education and work in ways that
strengthen and enrich both. Harnessing new technologies will make learning more agile, immersive and relevant to enable students who are entering into the workforce to learn on-demand and simulate the application of their new skills in real-time.
The “MyInternshipBuddy@WORK” (“MIB@WORK”) is a pilot programme on workplace-based learning using mobile technology, which provides a one-stop resource for students throughout their internships. The mobile application allows lecturers and company supervisors to contribute content for a more structured and deeper learning at the workplace. With its customized interface and features, and a weekly log for students to record their learning experiences, the application functions as a handy guide for students navigating their first steps into the working world. 850 students participated in the pilot over two semesters. A survey showed that the programme helped integrate interns into companies.
Source: IMDA Singapore.
4.4 Broadband for Protecting the Environment
It is only possible to achieve sustainable development on a healthy and sustainable planet – it is simply not possible to build a just and prosperous future for humanity on a degraded planet. Indeed, we may only really achieve truly ‘sustainable development’ when we start consuming the equivalent of the limits of Earth’s generative capacity – in 2012, humanity consumed the equivalent of 1.6 times the Earth’s biocapacity12.
Trends in the latest environmental indicators are alarming – globally, biodiversity is declining at an alarming rate, with a nearly 60% decline on average in wildlife across land, sea and freshwater in less than one generation since 1970. The most common environmental threats are loss and degradation of natural habitat, but unsustainable exploitation,

The State of Broadband 2017 77
invasive species and pollution are also major threats13.
The picture with regard to ocean health is equally alarming. The First World Ocean Assessment and UNESCO’s Intergovernmental Oceanographic Commission have noted that humankind’s stresses on the ocean have already triggered a massive decline in ocean health to date. We are fast approaching a critical point in ocean health, and we have to stop the detrimental practices of the ways in which we use the ocean, before this damage becomes irreversible. The world’s first ‘climate change refugees’ have been displaced due to rising sea levels in the Carteret Islands, Tuvalu, Kiribati and potentially soon, the Maldives.
Broadband can play a vital role in attempts to help preserve ocean health, the seas and marine ecosystem and resources. Satellite imagery and geospatial mapping techniques are being used to record sea level, to map the extent of the polar ice caps, the incidence and extent of oil spills and other pollution, and to monitor damage to coastal areas (e.g. due to floods or typhoons) or drought-afflicted areas, the retreat of wetlands and/or encroaching land use in deltas or river basins.
Combined with meteorological models and data on ocean temperature and currents, such mapping efforts are helping predict flooding and improve forecasting and warning systems of future major weather events. For tsunamis, a complex information system of seismic stations, Internet, satellite and mobile communications, special buoys and modeling has been built to issue tsunami warnings. And this is not just happening from the sky or at the surface – for example, a joint ITU-IOC-WMO Joint Task Force is developing a project to equip new communication cables on the ocean floor with sensors for data observation and seismic warnings.
Tracking technologies are being used to monitor shipping patterns and wildlife migration. Satellite imagery can also be combined with maps generated from the IoT, big data from automated buoys and the latest tagging and tracking technologies to monitor shipping patterns, traffic and routes in real-time, to note how these interact – and
interfere with – seasonal migration patterns of rare cetaceans (whales, dolphins, porpoises) and sharks. ICTs can be used to certify cargo activity, ships (and even crew) and to monitor illegal fishing activities, to help ships to consume less fuel, find routes that can help protect certain marine environments, and prevent accidents and collisions that can lead to pollution.
Sensor networks are being used to help build safe water management and sanitation systems throughout the broader water system, as well as improved irrigation systems (as agriculture accounts for up to 70% of water withdrawals) and for better decision-making. Sensors are being used to monitor river levels flow rates and pollution levels in rivers, while smart water management systems are helping make water consumption more efficient, reduce leakage, and monitor (and potentially reduce) pollution in rivers, lakes and canals. Viewpoint 26 describes one project by Ericsson in Malaysia to monitor and protect the mangroves using the IoT.
Viewpoint 26: Monitoring the Mangroves in Malaysia to Protect the Environment
With climate change, natural ecosystems are more vulnerable. In 2015, Ericsson began working with tech providers and NGOs to more efficiently reforest mangroves in Malaysia. About 50% of Malaysian mangroves have been destroyed due to unsustainable development, leaving coastal areas vulnerable to risks such as flooding and tsunamis. Ericsson’s analysis shows that, for every 1000 mangroves seedlings planted, only 400 will reach adulthood, due to pollution, fire, lack of water, illegal logging, etc. The Connected Mangroves project, the first of its kind in Malaysia, is designed with the objective of helping the community through advanced technology such as mobile, IoT and cloud technologies.
Real-time monitoring of vital parameters – such as ambient temperatures and humidity, water levels and soil moisture and salinity – allows communities to
Chapter 4

The State of Broadband 201778
take prompt action when an alarm is raised as a result of environmental or surrounding changes. This involves planting mangrove saplings with sensors that will monitor critical information such as soil and weather conditions, as well as water levels. The information is compiled and sent directly to the cloud where stakeholders – farmers, analysts, NGOs and the authorities – can access the data to gain a better understanding of the status of the seedlings.
This approach can help the agriculture sector or society in general. For instance, it can let farmers know the best time to fertilize or irrigate their crops or help them increase yields by studying crop behaviors under different conditions. Providing real-time fire alarms and surveillance for farms is another possibility. Furthermore, local authorities or national governments can use the information for early warning systems for flooding, tsunamis, plantation burning or weather conditions that can affect crops and communities.
Based on the initial pilot results, Ericsson expects an improvement of 50% of the mortality rate on seedlings planting. This implies that with connected mangrove solutions for every 1000 seedlings, 700 could reach their adulthood. In 2016, the project won the UN Framework Convention on Climate Change (UNFCCC) Momentum for Change
ICT Award, which honors initiatives contributing to climate resilience using ICT solutions.
Source: Ericsson.
Meanwhile, tracking technologies are being used for monitoring wildlife. UAVs for conservation applications with plans to rigorously test the technology in protected areas in southern Africa (including in Malawi, Namibia and Zimbabwe). Thermal imaging cameras by anti-poaching teams in protected areas in Lake Nakuru National Park and in the Maasai Mara Game Reserve are being used to track wildlife as well as to catch poachers, increasing the effectiveness of security teams by over 60%. Anti-poaching teams have also been able to achieve all this with smaller numbers of patrol teams. In Kenya, elephants are fitted with satellite tracking collars enabling researchers and conservationists alike to monitor individual elephant movements and chart habitat and landscape connectivity14.
Many companies are transforming their operations to align with SDG #7 and #13, with commitments on clean energy and action against climate change. For example, all of Facebook’s new data centres (including locations in including Sweden, Ireland, Iowa, Texas and New Mexico), are powered by 100% clean energy. Facebook has committed to eventually powering all of its operations with 100% clean energy, with a near-term target of 2018 to have 50% of its energy to come from clean sources.

79The State of Broadband 2017
1 Lightfoot, C. et al., “The First Mile Project in Tanzania”, Mountain Research and Development, 28(1):13-17. International Mountain Society, at: www. bioone. org/ doi/ full/ 10. 1659/ mrd. 0970
2 www. amis- outlook. org/ amis- about 3 “Digital Health: A Call for Government Leadership and Cooperation between ICT and Health”, report
of the Broadband Commission Working Group on Digital Health, February 2017, available from: www. broadbandcommission. org/ Documents/ publications/ WorkingGroupHealthReport- 2017. pdf
4 GSMA, The Mobile Economy 2016, www. gsma. com/ mobileeconomy/ 5 IMS Institute for Healthcare Informatics, “Patient Adoption of mHealth: Use, Evidence and Remaining Barriers
to Mainstream Acceptance”, 2015, www. imshealth. com/ files/ web/ IMSH%20 Institute/ Reports/ Patient%20 Adoption%20 of%20 mHealth/ IIHI_ Patient_ Adoption_ of_ mHealth. pdf
6 WHO Third Global Survey on eHealth (2015), www. who. int/ goe/ survey/ 2015survey/ en/ 7 The Neglected Dimension of Global Security (2016), PP1-27 https:// nam. edu/ wp- content/ uploads/ 2016/ 01/ Neglected- Dimension- of- Global- Security. pdf 8 www. stoptb. org/ assets/ documents/ resources/ publications/ acsm/ mHealth%20 to%20 Improve%20 TB%20 Care.
pdf 9 www. health. gov. za/ index. php/ mom- connect 10 www. bbc. co. uk/ mediacentre/ latestnews/ 2016/ bbc- media- action- free- mobile- health- education 11 L, Bengtsson L., et al, “Improved response to disasters and outbreaks by tracking population movements with
mobile phone network data: a post-earthquake geospatial study in Haiti.” PLoS Med. 2011 Aug;8(8):e1001083. doi: 10.1371/journal.pmed.1001083. Epub 2011 Aug 30.
12 WWF’s Living Planet Report, available at: wwf. panda. org/ about_ our_ earth/ all_ publications/ lpr_ 2016/ 13 WWF’s Living Planet Report, available at: wwf. panda. org/ about_ our_ earth/ all_ publications/ lpr_ 2016/
Endnotes

The State of Broadband 201780
On the basis of this report, the Broadband Commission believes that policy-makers may wish to consider addressing the following key measures as a means of promoting broadband as a foundation for sustainable development.
5.1 Review and update regulatory frameworks for broadband
Governments and regulators should review and update their regulatory frameworks on a regular basis to account for emerging issues and new technologies, benchmarking and comparisons with international best practices. Timely, consistent and well-enforced regulation developed in consultation with industry and other stakeholders may generally benefit operators, consumers and the domestic economy. Policy-makers should review and revise regulatory frameworks to encourage the development of broadband and ICTs. Today, regulatory frameworks are being updated to include IoT, data privacy and protection as extended Digital Agendas or strategies.
5.2 Develop and Enhance National Broadband Plans
Defining and regularly reviewing NBPs that include approaches for achieving
affordable broadband access can be helpful in aligning resources and policies within a country. Nowadays, given the move towards collaborative regulation as discussed in Chapter 3, it may be necessary for ICT regulators to engage in more cross-sectoral collaboration and break down the silos with other Ministries and other regulators to consult on issues of cross-cutting importance, such as consumer protection and data protection. NBPs should also ensure gender equality considerations are taken into account, from planning, to monitoring and evaluation, based on the “Recommendations for action: bridging the gender gap in Internet and broadband access and use” drafted by the Working Group on the Digital Gender Divide (2017). NBPs should also include consideration of investing in media literacy, skills and education, as well as support for local content.
5.3 Encourage Investment in Internet Infrastructure
Investment-friendly regulations can help incentivize investment, in full recognition of the benefits broadband availability for economic growth and a vibrant economy. Governments can promote competition to stimulate investment, and provide financial support for broadband investments through tax incentives, subsidized loans, universal service grants and PPPs.
5 Policy Recommendations
http://broadbandcommission.org/documents/publications/workinggroupdigitalgenderdivide-report2017.pdf
5.4 Benchmark Trends and Developments in Telecom and ICTs
Policy choices can be implemented and improved on the basis of reliable data and indicators on ICT developments in countries. Statistical indicators are also essential to assess the impact of broadband policies and to track progress towards broadband goals and targets, such as the SDGs. Indicators should be identified and data collected to monitor broadband infrastructure and access, prices and affordability, and usage of services. Data collected at the national level should be based on internationally agreed standards and definitions, such as those developed by ITU and the Partnership on Measuring ICT for Development ITU hosts an annual World Telecommunication/ICT Indicators Symposium for progress in the definition and collection of reliable and consistent data at the international level.
5.5 Consider Infrastructure-Sharing
Policy-makers may wish to consider open access approaches to infrastructure, including infrastructure-sharing. Examples of open access arrangements include Local Loop Unbundling (LLU), wholesale broadband access, ducts and submarine cables. Previous ITU research suggests that growth in services has happened most rapidly where regulatory enablers (e.g. industry consultations, infrastructure-sharing) have been put in place to leverage the latest innovations. Although various strategies for open access exist, it is vital that policy-makers ensure that access to new facilities is provided on fair, reasonable and equivalent terms. This can also include the implementation of ‘Dig Once’ policies.
The State of Broadband 2017 81

82 The State of Broadband 2017
Annex 1: Target 1 – List of National Broadband Policies
Economy Policy Available?
Year Policy Was Adopted Title/Details
Afghanistan yes 2015 ICT POLICY FOR AFGHANISTAN – A digital agenda for development and social change 2015-2024; General ICT Policy 2007
Albania yes 2013 National broadband plan 2013-2020
Algeria yes 2008 E-Algérie 2013
Andorra yes 2013 FTTH Full National Deployment 2013-2016
Angola yes 2010 White Book of Information and Communication Technologies: Livro branco das Tecnologias da Informação e Comunicação – LBTIC
Antigua & Barbuda yes 2012 GATE 2012/13
Argentina yes 2010 Plan Nacional de Telecomunicaciones - Argentina Conectada
Armenia yes 2008 Governmental Decree on Approving the Information Technology Sector Development Conception of the Republic of Armenia
Australia yes 2009 The National Broadband Network (NBN) 2009-2020
Austria yes 2013 Broadband strategy 2020 - Breit Bandstrategie bbs2020, 2013
Azerbaijan yes 2015 National Strategy on development of information society in Azerbaijan during 2014-2020; Optic-to-each-home 2013-2018; National Broadband Network Project l - Azerbaijan’s 2020
Bahamas yes 2014 Electronic Communications Sector Policy 2014
Bahrain yes 2010 National Broadband Network for the Kingdom of Bahrain
Bangladesh yes 2009 National Broadband Policy 2009 -2015; Broadband National Policy 2009; ‘Digital Bangladesh’ - Bangladesh’s ‘Vision 2021’
Barbados yes 2010 National Information and Communication Technologies Strategic Plan of Barbados 2010-2015
Belarus yes 2011 National programme on accelerated development of services in the field of information and communication technologies for 2011–2015
Belgium yes 2015 Plan for ultrafast internet 2015-2020 ; Digital Belgium – Plan for Ultrafast Internet in Belgium (2015-2020)
Belize yes 2011 ICT National Strategy
Benin yes 2016 Plan TIC Benin, eNNOV Benin 2021
Bhutan yes 2008 Broadband Master Plan
Bolivia no no
Bosnia and Herzegovina yes 2008 Decision On The Telecommunication Sector Policy Of Bosnia and Herzegovina For The Period 2008 – 2012
Botswana yes 2014 Botswana’s National Broadband Strategy 2014
Brazil yes 2014 National Broadband Plan 2.0 “Broadband for All” (Plano Nacional de Banda Laga – PNBL), Broadband Plan for Schools
Brunei Darussalam yes 2014 Brunei Darussalam National Broadband Policy 2014-2017; Strategic Plan 2008-2017
Bulgaria yes 2012 National Strategy for the Development of Broadband Access in the Republic of Bulgaria 2012-2015; National Broadband Infrastructure Plan for Next Generation Access; Roadmap for Implementation of National Broadband Infrastructure Plan for Next Generation Access
Burkina Faso yes 2016 National Plan for Economic and Social Development (PNDES) 2016-2020
Burundi yes 2011 Burundi/ ICT: National Projects for Broadband Connectivity Burundi Community Telecentre Network (BCTN)
Cambodia yes 2014 Cambodia’s ICT Master Plan 2020
Cameroon no no
Canada yes 2016 Innovation Agenda; 2016 Connecting Canadian Program (CCP) 2014-2019; Connect to Innovate (CTI)
Cape Verde yes 2016 Stratégie Nationale de la Large Bande 2016
Central African Rep. yes 2006 Politique, Stratégies et plan d'actions de l'édification de la Société de l'Information en République Centrafricaine
Chad yes 2007 Plan de développement des technologies de l’Information et de la Communication au Tchad or (PLAN NICI)
Chile yes 2017 Agenda Digital Imagina Chile, Agenda Digital 2020, Plan Nacional de Infraestructura de Telecomunicaciones 2015-2020, Fibre Optic Project (2017-2020)
China yes 2013 12th Five-Year Plan for Telecom Industry Development; “Broadband China” 2013
Colombia yes 2014 Vive Colombia Digital 2014 -2018; Plan Vive Digital
Comoros yes 2014 Loi N°14-031/AU du 17 Mars 2014, relative aux communications électroniques et Décret N°08-019/PR

The State of Broadband 2017 83
Economy Policy Available?
Year Policy Was Adopted Title/Details
Congo (Rep.) yes 2011 Projet de Couverture Nationale (PCN), Projet West Africa Cable System (WACS), Projet back bone national en fibre optique
Congo (Dem. Rep.) no no
Costa Rica yes 2015 Estrategia Nacional de Banda Ancha 2012-2017; Costa Rica Digital 2015-2021; Plan Nacional de Desarrollo de las Telecomunicaciones 2015-2021
Côte d'Ivoire yes 2016 Le Réseau National Haut Débit (RNHD) 2016. Objectifs Strategiques du Government de Côte dÍvore en Matiere de Telecommunications et de TIC 2010
Croatia yes 2016 Strategy for Broadband Development in the Republic of Croatia in the period from 2016 to 2020
Cuba planning
Cyprus yes 2012 Digital Strategy for Cyprus 2012-2020
Czech Republic yes 2016 State policy in electronic communication: Digital Czech republic v.2.0; National Plan for the Development of NGN (2016-2020)
D.P.R. Korea no no
Denmark yes 2010 Digital work programme by the Minister of Science, Technology and Innovation; Better Broadband and mobile coverage in Denmark (2013-2020)
Djibouti yes 2004 Plan d’action national pour l’exploitation des TIC en République
Dominica planning
Dominican Rep. yes 2016 Agenda Digital República Dominicana 2016-2020; Plan Estratégico 2013-2016
Ecuador yes 2011 Ministerial Agreement 035-2014; Plan Nacional de Desarollo de Banda Ancha 2011-2016; Estrategía Ecuador Digital 2.0
Egypt yes 2014 eMisr National Broadband Plan (revised in 2014 -2020)
El Salvador no / /
Equatorial Guinea yes 2012 Nuevas Tecnologias: national project aimed at the popularization of technologies Information and communication (TICGE) 2012-2020
Eritrea no / /
Estonia yes 2013 Digital Agenda 2020 for Estonia 2013-2020; EstWin project; Information Society Development Plan 2013
Ethiopia yes 2016 FDR Ethiopia ICT Policy (Draft) National Broadband Plan 2016
Fiji yes 2011 National Broadband Policy
Finland yes 2016 Broadband 2015 Project; Kainuu Information Society Strategy 2007-2015; Broadband Implementation Plan (2016-2019)
France yes 2013 France Très Haut Débit (2013-2022)
Gabon yes 2012 Plan strategique Gabon emergeant 2025
Gambia yes 2008 The Gambian ICT4D-2012 Plan
Georgia yes 2016 Georgian National Innovation Ecosystem (GENIE) 2016-2020
Germany yes 2014 Digital Agenda 2014-2017;Digital Strategie 2025 (Breitbandstrategie der Bundesregierung)
Ghana yes 2010 Broadband Wireless Access
Greece yes 2014 National NGA Plan 2014-2020; Strategy Digital Growth 2021
Grenada yes 2006 Information and Communication Technology (ICT); A Strategy And Action Plan for Grenada: 2006-2010
Guatemala yes 2016 Agenda Nación Digital “Tecnología contribuyendo al desarrollo económico y social de Guatemala”; Implementación del Plan Nacional de Conectividad y Banda Ancha “Nación Digital”
Guinea yes 2017 PNDES - PLAN NATIONAL DE DEVELOPPEMENT ECONOMIQUE ET SOCIAL 2016-2020
Guinea-Bissau no / /
Guyana yes 2016 E-Guyana 2011, Telecommunications (Amendment) Bill 2016
Haiti no / /
Honduras yes 2014 Agenda Digital Honduras 2014-2018, Resolución NROOS/IO
Hong Kong, China yes 2008 2008 Digital 21 Strategy - Moving Ahead
Hungary yes 2014 Digital Renewal Action Plan 2010-2014; National Infocommunication Strategy (2014-2020)
Iceland yes 2012 Telecom Policy Statement 2011-2014
India yes 2011 National Telecom Policy 2012 and National Optical Fibre Network Plan
Indonesia yes 2014 Indonesia Broadband Plan 2014-2019; RPI: PELUNCURAN RENCANA PITALEBAR INDONESIA (INDONESIA BROADBAND PLAN) 2014-2019
Annex 1

84 The State of Broadband 2017
Economy Policy Available?
Year Policy Was Adopted Title/Details
Iran (I.R.) yes 2017 Providing broadband service in rural area - 6th Plan Ministry of Information and Telecommunication; National Information Network and 6th development plan legislation, Regulation No. 156 approved by Regulatory Commission 2017
Iraq no / /
Ireland yes 2016 National Broadband Plan 2016-2020
Israel yes 2012 Digital Israel 2013; The Communication Initiative: fiber-based national broadband network 2012
Italy yes 2014 Strategia per la crescita digitale 2014-2020 (Ultra Broadband Strategic Plan); Italian Digital Agenda
Jamaica yes 2009 Information and Communications Technology – Sector Plan (2009-2030); National ICT Strategy
Japan yes 2014 Japan Revitalization Strategy; Declaration to be the World’s Most Advanced IT Nation; Revision of Competition and Consumer Policy for 2020
Jordan yes 2007 National ICT Strategy of Jordan
Kazakhstan yes 2010 Programme of ICT Development
Kenya yes 2013 National Broadband Strategy - Vision 2030; Connected Kenya 2017 Master Plan
Kiribati no / /
Korea (Rep.) yes 2009 Ultra Broadband Convergence Network
Kuwait yes 2015 National ICT Plan; KUWAIT MID-RANGE DEVELOPMENT PLAN 2015/2016 – 2019/2020; National Broadband Plan (ongoing by CITRA)
Kyrgyzstan yes 2013 National Strategy of sustainable development of Kyrgyz Republic 2013-2017
Lao P.D.R. no / /
Latvia yes 2013 Next generation broadband development strategy for year 2013-2020
Lebanon yes 2011 National ICT Strategy Action Plan 2011-2012
Lesotho yes 2014 Lesotho National Broadband Policy 2014--18
Liberia yes 2010 Policy for the Telecommunications and Information Communications Technology (ICT) 2010-2015
Libya no / /
Liechtenstein yes 2006 Communications Act - Law on Electronic Communication
Lithuania yes 2011 LITHUANIAN INFORMATION SOCIETY DEVELOPMENT PROGRAMME 2011–2019
Luxembourg yes 2010 Stratégie nationale pour les réseaux à “ultra-haut” débit - “L’ultra-haut” débit pour tous
Macao, China no / /
Madagascar yes 2014 Loi n° 2005-023 du 17 octobre 2005
Malawi yes 2013 National ICT Policy; National Wireless Broadband Plan
Malaysia yes 2010 National Broadband Initiative
Maldives no / /
Mali no / /
Malta yes 2014 Digital Malta – National Digital Strategy 2014-2020; Malta's Next Generation Broadband
Marshall Islands yes 2001 National ICT Policy; The Strategic Development Plan Framework 2003-2018
Mauritania no / /
Mauritius yes 2012 National Broadband Policy 2012 - 2020 (NBP2012)
Mexico yes 2013 Red pública compartida de telecomunicaciones - Criterios generales; Estrategia Digital Nacional 2013-2018; México Conectado Programme
Micronesia no / /
Moldova yes 2013 Digital Moldova 2020
Monaco no / /
Mongolia yes 2011 National program on Broadband Network 2015
Montenegro yes 2012 Strategy for the Development of Information Society 2012-2016; Montenegro - Digital Society
Morocco yes 2012 Plan national pour le développement du haut et très haut débit au Maroc
Mozambique yes 2006 National ICT Policy Implementation Strategy 2002 and 2006 - Digital Inclusion in Mozambique
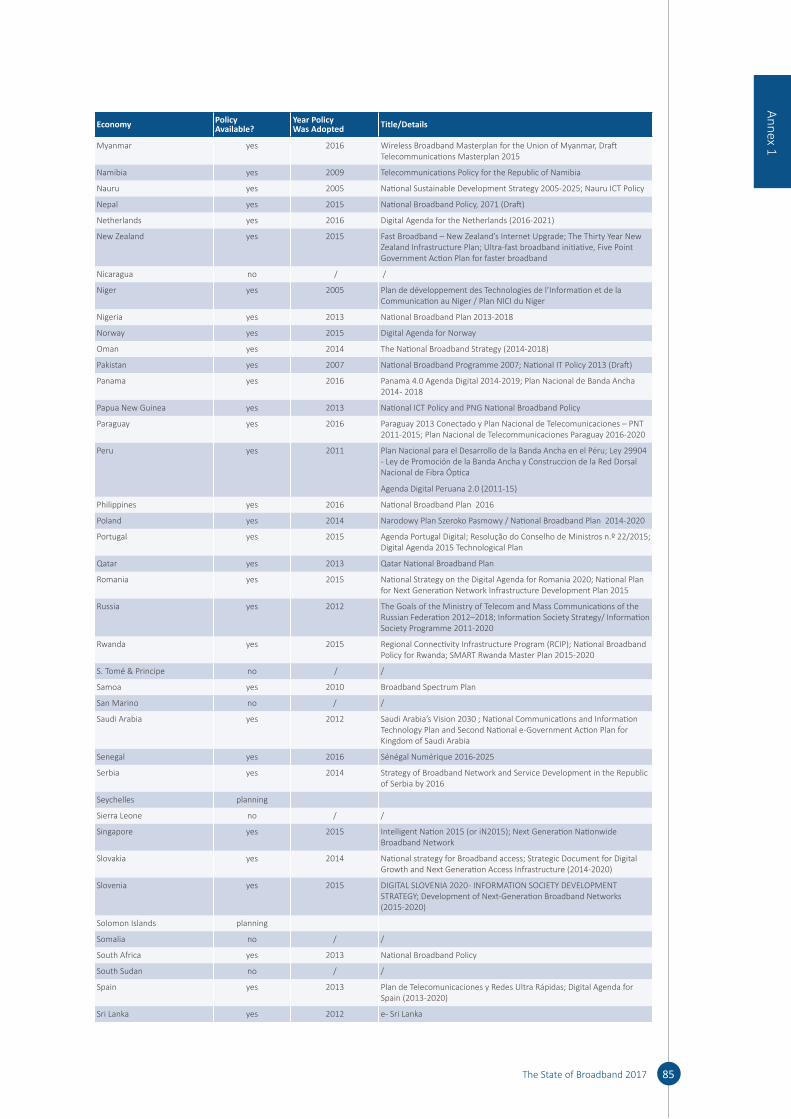
The State of Broadband 2017 85
Economy Policy Available?
Year Policy Was Adopted Title/Details
Myanmar yes 2016 Wireless Broadband Masterplan for the Union of Myanmar, Draft Telecommunications Masterplan 2015
Namibia yes 2009 Telecommunications Policy for the Republic of Namibia
Nauru yes 2005 National Sustainable Development Strategy 2005-2025; Nauru ICT Policy
Nepal yes 2015 National Broadband Policy, 2071 (Draft)
Netherlands yes 2016 Digital Agenda for the Netherlands (2016-2021)
New Zealand yes 2015 Fast Broadband – New Zealand’s Internet Upgrade; The Thirty Year New Zealand Infrastructure Plan; Ultra-fast broadband initiative, Five Point Government Action Plan for faster broadband
Nicaragua no / /
Niger yes 2005 Plan de développement des Technologies de l’Information et de la Communication au Niger / Plan NICI du Niger
Nigeria yes 2013 National Broadband Plan 2013-2018
Norway yes 2015 Digital Agenda for Norway
Oman yes 2014 The National Broadband Strategy (2014-2018)
Pakistan yes 2007 National Broadband Programme 2007; National IT Policy 2013 (Draft)
Panama yes 2016 Panama 4.0 Agenda Digital 2014-2019; Plan Nacional de Banda Ancha 2014 - 2018
Papua New Guinea yes 2013 National ICT Policy and PNG National Broadband Policy
Paraguay yes 2016 Paraguay 2013 Conectado y Plan Nacional de Telecomunicaciones – PNT 2011-2015; Plan Nacional de Telecommunicaciones Paraguay 2016-2020
Peru yes 2011 Plan Nacional para el Desarrollo de la Banda Ancha en el Péru; Ley 29904 - Ley de Promoción de la Banda Ancha y Construccion de la Red Dorsal Nacional de Fibra Óptica
Agenda Digital Peruana 2.0 (2011-15)
Philippines yes 2016 National Broadband Plan 2016
Poland yes 2014 Narodowy Plan Szeroko Pasmowy / National Broadband Plan 2014-2020
Portugal yes 2015 Agenda Portugal Digital; Resolução do Conselho de Ministros n.º 22/2015; Digital Agenda 2015 Technological Plan
Qatar yes 2013 Qatar National Broadband Plan
Romania yes 2015 National Strategy on the Digital Agenda for Romania 2020; National Plan for Next Generation Network Infrastructure Development Plan 2015
Russia yes 2012 The Goals of the Ministry of Telecom and Mass Communications of the Russian Federation 2012–2018; Information Society Strategy/ Information Society Programme 2011-2020
Rwanda yes 2015 Regional Connectivity Infrastructure Program (RCIP); National Broadband Policy for Rwanda; SMART Rwanda Master Plan 2015-2020
S. Tomé & Principe no / /
Samoa yes 2010 Broadband Spectrum Plan
San Marino no / /
Saudi Arabia yes 2012 Saudi Arabia’s Vision 2030 ; National Communications and Information Technology Plan and Second National e-Government Action Plan for Kingdom of Saudi Arabia
Senegal yes 2016 Sénégal Numérique 2016-2025
Serbia yes 2014 Strategy of Broadband Network and Service Development in the Republic of Serbia by 2016
Seychelles planning
Sierra Leone no / /
Singapore yes 2015 Intelligent Nation 2015 (or iN2015); Next Generation Nationwide Broadband Network
Slovakia yes 2014 National strategy for Broadband access; Strategic Document for Digital Growth and Next Generation Access Infrastructure (2014-2020)
Slovenia yes 2015 DIGITAL SLOVENIA 2020 - INFORMATION SOCIETY DEVELOPMENT STRATEGY; Development of Next-Generation Broadband Networks (2015-2020)
Solomon Islands planning
Somalia no / /
South Africa yes 2013 National Broadband Policy
South Sudan no / /
Spain yes 2013 Plan de Telecomunicaciones y Redes Ultra Rápidas; Digital Agenda for Spain (2013-2020)
Sri Lanka yes 2012 e- Sri Lanka
Annex 1

86 The State of Broadband 2017
Economy Policy Available?
Year Policy Was Adopted Title/Details
St. Kitts and Nevis yes 2006 National Information and Communications Technology (ICT) Strategic Plan
St. Lucia yes 2013 National ICT Strategy of St. Lucia 2010 – 2015; Saint Lucia National Broadband Policy and Plan 2013-2018
St. Vincent and the Grenadines yes 2010 St. Vincent & the Grenadines National ICT Strategy and Action Plan 2010-2015
Sudan yes 2012 Sudan’s National Strategic Development Plan 2012-2016; National Broadband Plan
Suriname no / /
Swaziland no / /
Sweden yes 2016 Digital Agenda for Sweden 2009-2020 ; Broadband Strategy for Sweden A Completely Connected Sweden by 2025 – a Broadband Strategy (2016-2025)
Switzerland yes 2016 La Stratégie “Suisse numérique” (2015-2019) Digital Switzerland Strategy
Syria no / /
Tajikistan no / /
Tanzania yes 2004 National ICT Policy 2003; National Information Communication and Technology Broadband Backbone (NICTBB)
TFYR Macedonia yes 2016 Short-term national ICT policy 2016-2017
Thailand yes 2010 The National Broadband Policy
Timor-Leste no / /
Togo yes 2017 Loi sur la société de l’information (LOSITO)
Tonga yes 2011 Tonga-Fiji Connectivity Project : Pacific Regional Connectivity Program (PRCP)
Trinidad & Tobago yes 2014 SMART TT Plan, National ICT Plan 2014-2018
Tunisia yes 2015 Tunisie Digitale 2018
Turkey yes 2016 Strategy of Transport and Communications, Target 2023, 2009- 2013 Strategic Ministerial Plan; 10th Council of Transport; National Broadband Strategy 2016
Turkmenistan no / /
Tuvalu no / /
Uganda yes 2009 Uganda Broadband Infrastructure Strategy National Position Paper
Ukraine no / /
United Arab Emirates yes 2008 TRA Initiative - ICT Fund for ICT sector development
United Kingdom yes 2016 The Digital Communications Infrastructure Strategy; Connectivity, Content and Consumers Britain’s Digital Platform for Growth; UK Next Generation Network Infrastructure Deployment Plan (2015-2020)
United States yes 2010 Connecting America: The National Broadband Plan Connecting America: The National Broadband Plan (2010-2020)
Uruguay yes 2011 Agenda Digital ADU 2011-2015
Uzbekistan no / /
Vanuatu yes 2013 National Information and Communications Policy
Vatican no / /
Venezuela yes 2012 Fiber Deployment Project - La Compañía Anónima Nacional Teléfonos de Venezuela (Cantv)
Viet Nam yes 2016 Programme for the development of the country’s high speed telecoms infrastructure
Yemen no / /
Zambia yes 2006 National Information and Communication Technology Policy/ ICT Policy
Zimbabwe yes 2005 National ICT Policy


88 The State of Broadband 2017
Annex 2: Fixed-Broadband Subscriptions per 100 inhabitants, 2016
Rank EconomyFixed-Broadband Subscriptions
per 100 inhabitants
1 Afghanistan 0.03
2 Albania 8.2
3 Algeria 6.9
4 Andorra 39.8
5 Angola 0.5
6 Antigua & Barbuda 10.0
7 Argentina 16.9
8 Armenia 10.1
9 Australia 30.4
10 Austria 29.4
11 Azerbaijan 18.6
12 Bahamas 22.0
13 Bahrain 16.8
14 Bangladesh 3.8
15 Barbados 30.1
16 Belarus 33.3
17 Belgium 38.0
18 Belize 6.2
19 Benin 0.8
20 Bhutan 3.9
21 Bolivia 2.6
22 Bosnia and Herzegovina
17.4
23 Botswana 2.8
24 Brazil 13.0
25 Brunei Darussalam 8.3
26 Bulgaria 23.3
27 Burkina Faso 0.05
28 Burundi 0.04
29 Cambodia 0.6
30 Cameroon 0.2
31 Canada 37.3
32 Cape Verde 3.0
33 Central African Republic
0.02
34 Chad 0.1
35 Chile 16.0
36 China 22.9
37 Colombia 11.8
38 Comoros 0.4
39 Congo (Dem. Rep.) 0.00
40 Congo (Rep.) n/a
41 Costa Rica 11.6
42 Côte d’Ivoire 0.6
43 Croatia 24.6
44 Cuba 0.1
45 Cyprus 33.0
46 Czech Republic 27.7
47 D.P.R. Korea n/a
48 Denmark 42.8
49 Djibouti 3.0
50 Dominica 21.2
51 Dominican Republic 6.5
52 Ecuador 9.7
Rank EconomyFixed-Broadband Subscriptions
per 100 inhabitants
53 Egypt 5.2
54 El Salvador 6.0
55 Equatorial Guinea 0.5
56 Eritrea 0.01
57 Estonia 31.1
58 Ethiopia 0.6
59 Fiji 1.4
60 Finland 31.2
61 France 42.4
62 Gabon 0.7
63 Gambia 0.2
64 Georgia 15.8
65 Germany 38.1
66 Ghana 0.3
67 Greece 32.5
68 Grenada 19.4
69 Guatemala 3.0
70 Guinea 0.01
71 Guinea-Bissau 0.04
72 Guyana 7.6
73 Haiti 0.01
74 Honduras 2.6
75 Hong Kong, China 35.5
76 Hungary 28.5
77 Iceland 37.6
78 India 1.4
79 Indonesia 1.9
80 Iran (I.R.) 11.6
81 Iraq n/a
82 Ireland 28.5
83 Israel 28.1
84 Italy 25.4
85 Jamaica 10.1
86 Japan 31.5
87 Jordan 5.8
88 Kazakhstan 13.7
89 Kenya 0.3
90 Kiribati 0.1
91 Korea (Rep.) 41.1
92 Kuwait 2.8
93 Kyrgyzstan 4.1
94 Lao P.D.R. 0.3
95 Latvia 25.6
96 Lebanon 25.6
97 Lesotho 0.1
98 Liberia 0.2
99 Libya 2.6
100 Liechtenstein 42.4
101 Lithuania 28.7
102 Luxembourg 36.7
103 Macao, China 30.0
104 Madagascar 0.1
105 Malawi 0.05

The State of Broadband 2017 89
Rank EconomyFixed-Broadband Subscriptions
per 100 inhabitants
106 Malaysia 8.7
107 Maldives 7.2
108 Mali 0.03
109 Malta 39.6
110 Marshall Islands 1.9
111 Mauritania 0.3
112 Mauritius 16.9
113 Mexico 12.7
114 Micronesia 3.0
115 Moldova 16.3
116 Monaco 48.2
117 Mongolia 7.6
118 Montenegro 18.5
119 Morocco 3.7
120 Mozambique 0.1
121 Myanmar 0.1
122 Namibia 2.2
123 Nauru n/a
124 Nepal 0.8
125 Netherlands 42.2
126 New Zealand 34.2
127 Nicaragua 2.8
128 Niger 0.1
129 Nigeria 0.01
130 Norway 40.4
131 Oman 6.2
132 Pakistan 0.9
133 Palestine* 6.9
134 Panama 9.5
135 Papua New Guinea 0.2
136 Paraguay 3.4
137 Peru 6.7
138 Philippines 5.5
139 Poland 19.2
140 Portugal 31.8
141 Qatar 10.8
142 Romania 20.7
143 Russian Federation 19.5
144 Rwanda 0.2
145 S. Tomé and Principe 0.7
146 Samoa 1.2
147 San Marino 37.6
148 Saudi Arabia 10.8
149 Senegal 0.6
150 Serbia 18.9
151 Seychelles 14.9
Rank EconomyFixed-Broadband Subscriptions
per 100 inhabitants
152 Sierra Leone n/a
153 Singapore 25.4
154 Slovakia 24.5
155 Slovenia 28.3
156 Solomon Islands 0.2
157 Somalia 0.8
158 South Africa 2.8
159 South Sudan 0.00
160 Spain 29.5
161 Sri Lanka 4.1
162 St. Kitts & Nevis 29.3
163 St. Lucia 15.9
164 St. Vincent & the Grenadines
20.0
165 Sudan 0.1
166 Suriname 12.9
167 Swaziland 0.5
168 Sweden 36.3
169 Switzerland 46.3
170 Syria 4.0
171 Tajikistan 0.1
172 Tanzania 0.3
173 TFYR Macedonia 17.9
174 Thailand 10.7
175 Timor-Leste 0.1
176 Togo 0.6
177 Tonga 2.8
178 Trinidad & Tobago 18.9
179 Tunisia 5.6
180 Turkey 13.6
181 Turkmenistan 0.1
182 Tuvalu 10.1
183 Uganda 0.3
184 Ukraine 12.0
185 United Arab Emirates 13.3
186 United Kingdom 39.2
187 United States 32.4
188 Uruguay 26.8
189 Uzbekistan 9.1
190 Vanuatu 1.6
191 Vatican n/a
192 Venezuela 8.2
193 Viet Nam 9.9
194 Yemen 1.6
195 Zambia 0.2
196 Zimbabwe 1.1
Notes: The table includes ITU Member States. * Palestine is not an ITU Member State; the status of Palestine in ITU is the subject of Res. 99 (Rev., Busan 2014) of the ITU Plenipotentiary Conference. n/a – not available. Source: ITU World Telecommunication/ICT Indicators Database.
Annex 2
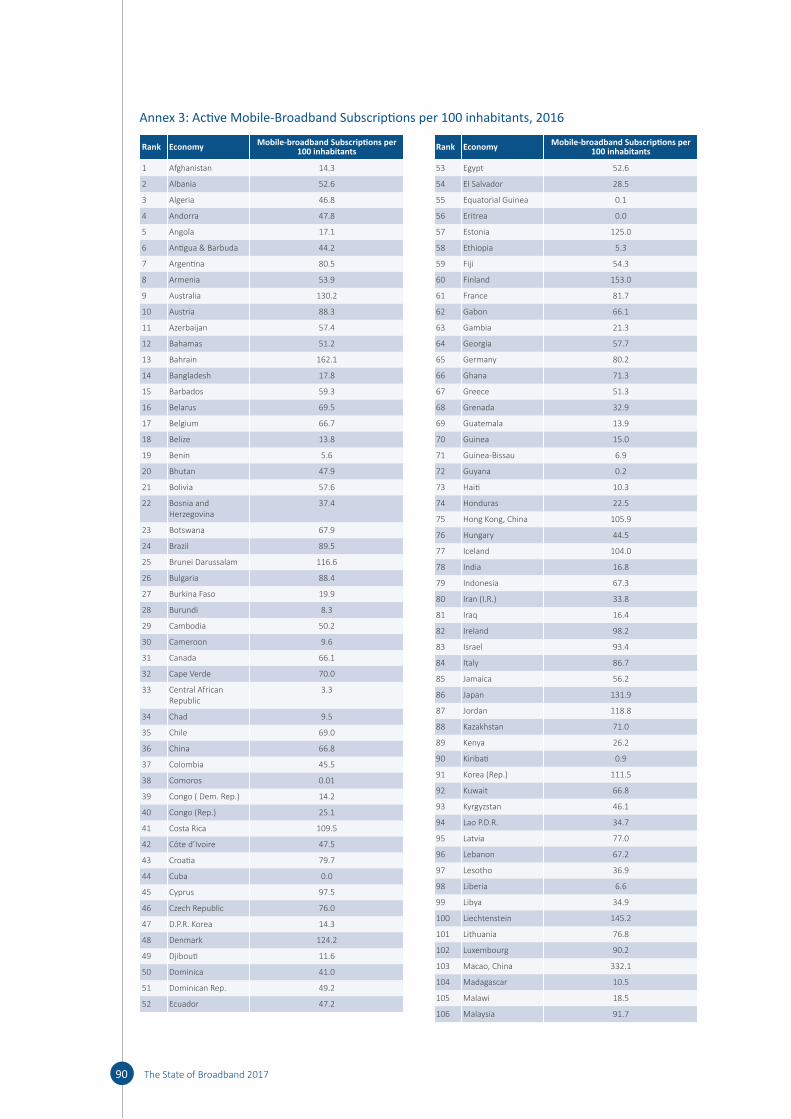
90 The State of Broadband 2017
Annex 3: Active Mobile-Broadband Subscriptions per 100 inhabitants, 2016
Rank Economy Mobile-broadband Subscriptions per 100 inhabitants
1 Afghanistan 14.3
2 Albania 52.6
3 Algeria 46.8
4 Andorra 47.8
5 Angola 17.1
6 Antigua & Barbuda 44.2
7 Argentina 80.5
8 Armenia 53.9
9 Australia 130.2
10 Austria 88.3
11 Azerbaijan 57.4
12 Bahamas 51.2
13 Bahrain 162.1
14 Bangladesh 17.8
15 Barbados 59.3
16 Belarus 69.5
17 Belgium 66.7
18 Belize 13.8
19 Benin 5.6
20 Bhutan 47.9
21 Bolivia 57.6
22 Bosnia and Herzegovina
37.4
23 Botswana 67.9
24 Brazil 89.5
25 Brunei Darussalam 116.6
26 Bulgaria 88.4
27 Burkina Faso 19.9
28 Burundi 8.3
29 Cambodia 50.2
30 Cameroon 9.6
31 Canada 66.1
32 Cape Verde 70.0
33 Central African Republic
3.3
34 Chad 9.5
35 Chile 69.0
36 China 66.8
37 Colombia 45.5
38 Comoros 0.01
39 Congo ( Dem. Rep.) 14.2
40 Congo (Rep.) 25.1
41 Costa Rica 109.5
42 Côte d’Ivoire 47.5
43 Croatia 79.7
44 Cuba 0.0
45 Cyprus 97.5
46 Czech Republic 76.0
47 D.P.R. Korea 14.3
48 Denmark 124.2
49 Djibouti 11.6
50 Dominica 41.0
51 Dominican Rep. 49.2
52 Ecuador 47.2
Rank Economy Mobile-broadband Subscriptions per 100 inhabitants
53 Egypt 52.6
54 El Salvador 28.5
55 Equatorial Guinea 0.1
56 Eritrea 0.0
57 Estonia 125.0
58 Ethiopia 5.3
59 Fiji 54.3
60 Finland 153.0
61 France 81.7
62 Gabon 66.1
63 Gambia 21.3
64 Georgia 57.7
65 Germany 80.2
66 Ghana 71.3
67 Greece 51.3
68 Grenada 32.9
69 Guatemala 13.9
70 Guinea 15.0
71 Guinea-Bissau 6.9
72 Guyana 0.2
73 Haiti 10.3
74 Honduras 22.5
75 Hong Kong, China 105.9
76 Hungary 44.5
77 Iceland 104.0
78 India 16.8
79 Indonesia 67.3
80 Iran (I.R.) 33.8
81 Iraq 16.4
82 Ireland 98.2
83 Israel 93.4
84 Italy 86.7
85 Jamaica 56.2
86 Japan 131.9
87 Jordan 118.8
88 Kazakhstan 71.0
89 Kenya 26.2
90 Kiribati 0.9
91 Korea (Rep.) 111.5
92 Kuwait 66.8
93 Kyrgyzstan 46.1
94 Lao P.D.R. 34.7
95 Latvia 77.0
96 Lebanon 67.2
97 Lesotho 36.9
98 Liberia 6.6
99 Libya 34.9
100 Liechtenstein 145.2
101 Lithuania 76.8
102 Luxembourg 90.2
103 Macao, China 332.1
104 Madagascar 10.5
105 Malawi 18.5
106 Malaysia 91.7

The State of Broadband 2017 91
Rank Economy Mobile-broadband Subscriptions per 100 inhabitants
107 Maldives 72.7
108 Mali 24.4
109 Malta 71.4
110 Marshall Islands 0.0
111 Mauritania 30.2
112 Mauritius 51.7
113 Mexico 58.8
114 Micronesia 0.0
115 Moldova 55.5
116 Monaco 64.8
117 Mongolia 82.0
118 Montenegro 60.7
119 Morocco 46.0
120 Mozambique 49.5
121 Myanmar 47.6
122 Namibia 66.1
123 Nauru 36.4
124 Nepal 30.8
125 Netherlands 87.8
126 New Zealand 101.3
127 Nicaragua 22.8
128 Niger 2.0
129 Nigeria 21.8
130 Norway 101.8
131 Oman 91.3
132 Pakistan 20.1
133 Palestine* 0.0
134 Panama 29.7
135 Papua New Guinea 9.2
136 Paraguay 41.7
137 Peru 62.0
138 Philippines 46.3
139 Poland 58.9
140 Portugal 61.1
141 Qatar 129.2
142 Romania 73.7
143 Russian Federation 75.0
144 Rwanda 27.0
145 S. Tomé and Principe 24.0
146 Samoa 26.6
147 San Marino 114.5
148 Saudi Arabia 78.5
149 Senegal 26.1
150 Serbia 67.4
151 Seychelles 22.6
Rank Economy Mobile-broadband Subscriptions per 100 inhabitants
152 Sierra Leone 23.4
153 Singapore 144.6
154 Slovakia 78.7
155 Slovenia 62.3
156 Solomon Islands 12.9
157 Somalia 2.4
158 South Africa 58.6
159 South Sudan 1.2
160 Spain 87.3
161 Sri Lanka 18.3
162 St. Kitts & Nevis 77.1
163 St. Lucia 37.0
164 St. Vincent & the Grenadines
49.4
165 Sudan 25.2
166 Suriname 69.6
167 Swaziland 13.0
168 Sweden 125.2
169 Switzerland 103.7
170 Syria 10.4
171 Tajikistan 18.1
172 Tanzania 9.2
173 TFYR Macedonia 59.0
174 Thailand 94.7
175 Timor-Leste 64.6
176 Togo 19.6
177 Tonga 56.0
178 Trinidad & Tobago 47.3
179 Tunisia 63.0
180 Turkey 66.8
181 Turkmenistan 14.2
182 Tuvalu 0.0
183 Uganda 33.7
184 Ukraine 22.6
185 United Arab Emirates 156.7
186 United Kingdom 91.4
187 United States 120.0
188 Uruguay 102.0
189 Uzbekistan 55.9
190 Vanuatu 22.3
191 Vatican n/a
192 Venezuela 44.6
193 Viet Nam 46.6
194 Yemen 6.0
195 Zambia 32.2
196 Zimbabwe 38.1
Notes: The table includes ITU Member States. * Palestine is not an ITU Member State; the status of Palestine in ITU is the subject of Res. 99 (Rev., Busan 2014) of the ITU Plenipotentiary Conference. n/a – not available. Source: ITU Telecom/ICT Indicators Database.
Annex 3

92 The State of Broadband 2017
Annex 4: Percentage of households with Internet, Developing Countries, 2015
Rank Economy % of households with Internet
1 Afghanistan 4.8
2 Algeria 34.7
3 Angola 10.0
4 Antigua & Barbuda 58.6
5 Argentina 63.8
6 Armenia 60.5
7 Azerbaijan 77.4
8 Bahamas 66.0
9 Bahrain 98.0
10 Bangladesh 14.5
11 Barbados 67.7
12 Belarus 62.5
13 Belize 30.2
14 Benin 6.6
15 Bhutan 33.0
16 Bolivia 26.6
17 Botswana 43.7
18 Brazil 52.4
19 Brunei Darussalam 75.0
20 Burkina Faso 10.6
21 Burundi 3.5
22 Cambodia 26.0
23 Cameroon 10.5
24 Cape Verde 62.0
25 Central African Republic
3.1
26 Chad 3.5
27 Chile 61.1
28 China 55.5
29 Colombia 45.8
30 Comoros 5.1
31 Congo (Dem. Rep.) 2.8
32 Congo (Rep.) 2.7
33 Costa Rica 64.8
34 Côte d’Ivoire 22.7
35 Cuba 7.5
36 Cyprus 74.4
37 D.P.R. Korea n/a
38 Djibouti 9.1
39 Dominica 60.0
40 Dominican Republic 26.2
41 Ecuador 36.0
42 Egypt 43.3
43 El Salvador 16.9
44 Equatorial Guinea 9.4
45 Eritrea 1.9
46 Ethiopia 15.4
47 Fiji 33.6
48 Gabon 34.4
49 Gambia 11.2
50 Georgia 49.8
51 Ghana 32.5
52 Grenada 44.7
53 Guatemala 20.5
54 Guinea 7.7
Rank Economy % of households with Internet
55 Guinea-Bissau 2.2
56 Guyana 28.2
57 Haiti 4.7
58 Honduras 24.6
59 Hong Kong, China 82.0
60 India 22.6
61 Indonesia 47.2
62 Iran (I.R.) 62.2
63 Iraq 20.1
64 Israel 75.7
65 Jamaica 36.7
66 Jordan 79.0
67 Kazakhstan 84.4
68 Kenya 22.3
69 Kiribati 6.9
70 Korea (Rep.) 99.2
71 Kuwait 77.7
72 Kyrgyzstan 18.8
73 Lao P.D.R. 18.7
74 Lebanon 77.7
75 Lesotho 27.9
76 Liberia 3.0
77 Libya 22.0
78 Macao, China 88.6
79 Madagascar 7.0
80 Malawi 11.5
81 Malaysia 76.9
82 Maldives 54.7
83 Mali 8.9
84 Marshall Islands 18.1
85 Mauritania 11.2
86 Mauritius 63.8
87 Mexico 47.0
88 Micronesia 31.4
89 Mongolia 23.6
90 Morocco 68.5
91 Mozambique 16.2
92 Myanmar 24.4
93 Namibia 29.5
94 Nauru n/a
95 Nepal 15.0
96 Nicaragua 16.2
97 Niger 3.1
98 Nigeria 15.2
99 Oman 86.1
100 Pakistan 22.1
101 Palestine* 56.5
102 Panama 53.9
103 Papua New Guinea 8.8
104 Paraguay 26.0
105 Peru 26.4
106 Philippines 39.1
107 Qatar 95.8
108 Rwanda 9.3

The State of Broadband 2017 93
Rank Economy % of households with Internet
109 S. Tome & Principe 20.0
110 Samoa 29.1
111 Saudi Arabia 94.6
112 Senegal 19.9
113 Seychelles 55.2
114 Sierra Leone 10.7
115 Singapore 91.1
116 Solomon Islands 8.5
117 Somalia n/a
118 South Africa 53.0
119 South Sudan 3.6
120 Sri Lanka 21.1
121 St. Kitts & Nevis 72.6
122 St. Lucia 43.1
123 St. Vincent and the Grenadines
51.0
124 Sudan 33.6
125 Suriname 42.4
126 Swaziland 24.0
127 Syria 43.6
128 Tajikistan 10.3
Rank Economy % of households with Internet
129 Tanzania 8.5
130 Thailand 59.8
131 Timor-Leste 23.9
132 Togo 7.7
133 Tonga 42.6
134 Trinidad & Tobago 70.9
135 Tunisia 37.5
136 Turkey 76.3
137 Turkmenistan 13.6
138 Tuvalu n/a
139 Uganda 8.9
140 United Arab Emirates 94.3
141 Uruguay 61.8
142 Uzbekistan 75.4
143 Vanuatu 29.5
144 Venezuela 34.0
145 Viet Nam 25.9
146 Yemen 5.9
147 Zambia 14.3
148 Zimbabwe 22.1
Notes: The table includes ITU Member States. * Palestine is not an ITU Member State; the status of Palestine in ITU is the subject of Res. 99 (Rev., Busan 2014) of the ITU Plenipotentiary Conference. n/a – not available. Source: ITU World Telecommunication/ICT Indicators Database.
Annex 4
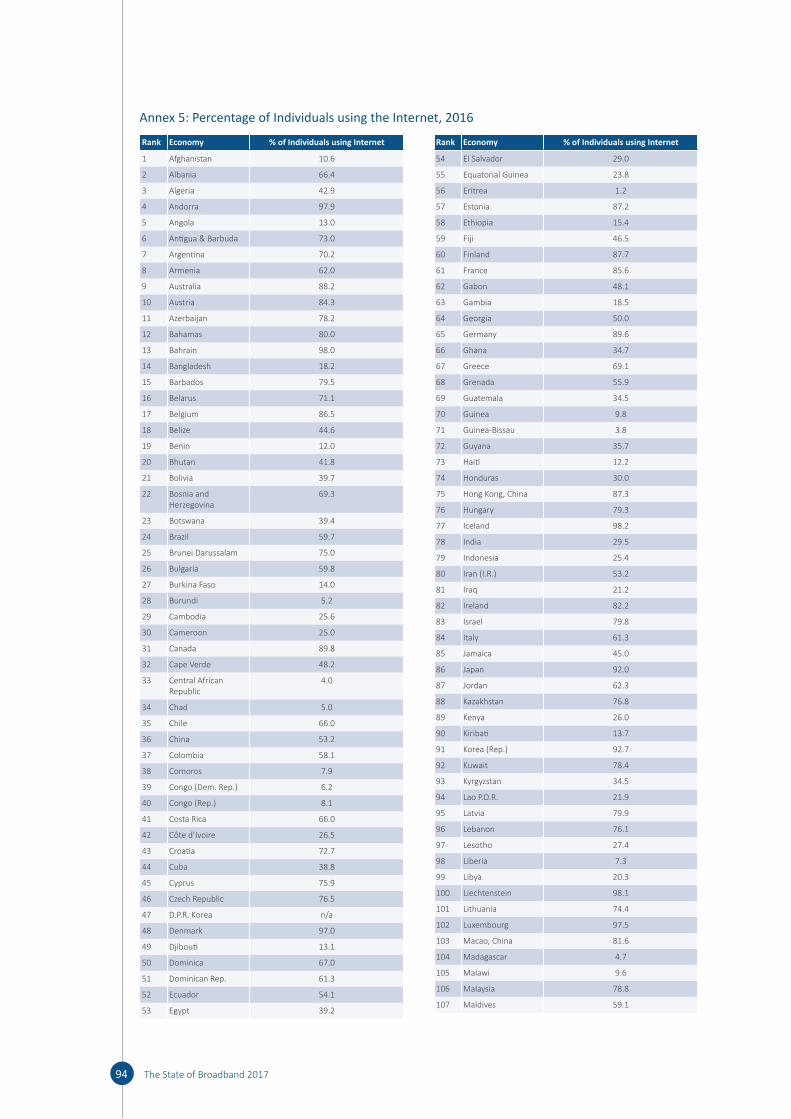
94 The State of Broadband 2017
Annex 5: Percentage of Individuals using the Internet, 2016
Rank Economy % of Individuals using Internet
1 Afghanistan 10.6
2 Albania 66.4
3 Algeria 42.9
4 Andorra 97.9
5 Angola 13.0
6 Antigua & Barbuda 73.0
7 Argentina 70.2
8 Armenia 62.0
9 Australia 88.2
10 Austria 84.3
11 Azerbaijan 78.2
12 Bahamas 80.0
13 Bahrain 98.0
14 Bangladesh 18.2
15 Barbados 79.5
16 Belarus 71.1
17 Belgium 86.5
18 Belize 44.6
19 Benin 12.0
20 Bhutan 41.8
21 Bolivia 39.7
22 Bosnia and Herzegovina
69.3
23 Botswana 39.4
24 Brazil 59.7
25 Brunei Darussalam 75.0
26 Bulgaria 59.8
27 Burkina Faso 14.0
28 Burundi 5.2
29 Cambodia 25.6
30 Cameroon 25.0
31 Canada 89.8
32 Cape Verde 48.2
33 Central African Republic
4.0
34 Chad 5.0
35 Chile 66.0
36 China 53.2
37 Colombia 58.1
38 Comoros 7.9
39 Congo (Dem. Rep.) 6.2
40 Congo (Rep.) 8.1
41 Costa Rica 66.0
42 Côte d’Ivoire 26.5
43 Croatia 72.7
44 Cuba 38.8
45 Cyprus 75.9
46 Czech Republic 76.5
47 D.P.R. Korea n/a
48 Denmark 97.0
49 Djibouti 13.1
50 Dominica 67.0
51 Dominican Rep. 61.3
52 Ecuador 54.1
53 Egypt 39.2
Rank Economy % of Individuals using Internet
54 El Salvador 29.0
55 Equatorial Guinea 23.8
56 Eritrea 1.2
57 Estonia 87.2
58 Ethiopia 15.4
59 Fiji 46.5
60 Finland 87.7
61 France 85.6
62 Gabon 48.1
63 Gambia 18.5
64 Georgia 50.0
65 Germany 89.6
66 Ghana 34.7
67 Greece 69.1
68 Grenada 55.9
69 Guatemala 34.5
70 Guinea 9.8
71 Guinea-Bissau 3.8
72 Guyana 35.7
73 Haiti 12.2
74 Honduras 30.0
75 Hong Kong, China 87.3
76 Hungary 79.3
77 Iceland 98.2
78 India 29.5
79 Indonesia 25.4
80 Iran (I.R.) 53.2
81 Iraq 21.2
82 Ireland 82.2
83 Israel 79.8
84 Italy 61.3
85 Jamaica 45.0
86 Japan 92.0
87 Jordan 62.3
88 Kazakhstan 76.8
89 Kenya 26.0
90 Kiribati 13.7
91 Korea (Rep.) 92.7
92 Kuwait 78.4
93 Kyrgyzstan 34.5
94 Lao P.D.R. 21.9
95 Latvia 79.9
96 Lebanon 76.1
97 Lesotho 27.4
98 Liberia 7.3
99 Libya 20.3
100 Liechtenstein 98.1
101 Lithuania 74.4
102 Luxembourg 97.5
103 Macao, China 81.6
104 Madagascar 4.7
105 Malawi 9.6
106 Malaysia 78.8
107 Maldives 59.1

The State of Broadband 2017 95
Rank Economy % of Individuals using Internet
108 Mali 11.1
109 Malta 77.3
110 Marshall Islands 29.8
111 Mauritania 18.0
112 Mauritius 53.2
113 Mexico 59.5
114 Micronesia 33.4
115 Moldova 71.0
116 Monaco 95.2
117 Mongolia 22.3
118 Montenegro 69.9
119 Morocco 58.3
120 Mozambique 17.5
121 Myanmar 25.1
122 Namibia 31.0
123 Nauru n/a
124 Nepal 19.7
125 Netherlands 90.4
126 New Zealand 88.5
127 Nicaragua 24.6
128 Niger 4.3
129 Nigeria 25.7
130 Norway 97.3
131 Oman 69.8
132 Pakistan 15.5
133 Palestine* 61.2
134 Panama 54.0
135 Papua New Guinea 9.6
136 Paraguay 51.3
137 Peru 45.5
138 Philippines 55.5
139 Poland 73.3
140 Portugal 70.4
141 Qatar 94.3
142 Romania 59.5
143 Russian Federation 76.4
144 Rwanda 20.0
145 S. Tomé and Principe 28.0
146 Samoa 29.4
147 San Marino n/a
148 Saudi Arabia 73.8
149 Senegal 25.7
150 Serbia 67.1
151 Seychelles 56.5
152 Sierra Leone 11.8
Rank Economy % of Individuals using Internet
153 Singapore 81.0
154 Slovakia 80.5
155 Slovenia 75.5
156 Solomon Islands 11.0
157 Somalia 1.9
158 South Africa 54.0
159 South Sudan 6.7
160 Spain 80.6
161 Sri Lanka 32.1
162 St. Kitts & Nevis 76.8
163 St. Lucia 46.7
164 St. Vincent & the Grenadines
55.6
165 Sudan 28.0
166 Suriname 45.4
167 Swaziland 28.6
168 Sweden 91.5
169 Switzerland 89.4
170 Syria 31.9
171 Tajikistan 20.5
172 Tanzania 13.0
173 TFYR Macedonia 72.2
174 Thailand 47.5
175 Timor-Leste 25.2
176 Togo 11.3
177 Tonga 40.0
178 Trinidad & Tobago 73.3
179 Tunisia 49.6
180 Turkey 58.3
181 Turkmenistan 18.0
182 Tuvalu 46.0
183 Uganda 21.9
184 Ukraine 52.5
185 United Arab Emirates 90.6
186 United Kingdom 94.8
187 United States 76.2
188 Uruguay 66.4
189 Uzbekistan 46.8
190 Vanuatu 24.0
191 Vatican n/a
192 Venezuela 60.0
193 Viet Nam 46.5
194 Yemen 24.6
195 Zambia 25.5
196 Zimbabwe 23.1
Notes: The table includes ITU Member States. * Palestine is not an ITU Member State; the status of Palestine in ITU is the subject of Res. 99 (Rev., Busan 2014) of the ITU Plenipotentiary Conference. n/a – not available. Source: ITU World Telecommunication/ICT Indicators Database.
Annex 5

96 The State of Broadband 2017
Annex 6: Percentage of Individuals using the Internet, Developing Countries, 2015
Rank Economy % of individuals using Internet
1 Afghanistan 10.6
2 Algeria 42.9
3 Angola 13.0
4 Antigua & Barbuda 73.0
5 Argentina 70.2
6 Armenia 62.0
7 Azerbaijan 78.2
8 Bahamas 80.0
9 Bahrain 98.0
10 Bangladesh 18.2
11 Barbados 79.5
12 Belarus 71.1
13 Belize 44.6
14 Benin 12.0
15 Bhutan 41.8
16 Bolivia 39.7
17 Botswana 39.4
18 Brazil 59.7
19 Brunei Darussalam 75.0
20 Burkina Faso 14.0
21 Burundi 5.2
22 Cambodia 25.6
23 Cameroon 25.0
24 Cape Verde 48.2
25 Central African Republic
4.0
26 Chad 5.0
27 Chile 66.0
28 China 53.2
29 Colombia 58.1
30 Comoros 7.9
31 Congo (Dem. Rep.) 6.2
32 Congo (Rep.) 8.1
33 Costa Rica 66.0
34 Côte d’Ivoire 26.5
35 Cuba 38.8
36 Cyprus 75.9
37 D.P.R. Korea n/a
38 Djibouti 13.1
39 Dominica 67.0
40 Dominican Republic 61.3
41 Ecuador 54.1
42 Egypt 39.2
43 El Salvador 29.0
44 Equatorial Guinea 23.8
45 Eritrea 1.2
46 Ethiopia 15.4
47 Fiji 46.5
48 Gabon 48.1
49 Gambia 18.5
50 Georgia 50.0
51 Ghana 34.7
52 Grenada 55.9
53 Guatemala 34.5
54 Guinea 9.8
Rank Economy % of individuals using Internet
55 Guinea-Bissau 3.8
56 Guyana 35.7
57 Haiti 12.2
58 Honduras 30.0
59 Hong Kong, China 87.3
60 India 29.5
61 Indonesia 25.4
62 Iran (I.R.) 53.2
63 Iraq 21.2
64 Israel 79.8
65 Jamaica 45.0
66 Jordan 62.3
67 Kazakhstan 76.8
68 Kenya 26.0
69 Kiribati 13.7
70 Korea (Rep.) 92.7
71 Kuwait 78.4
72 Kyrgyzstan 34.5
73 Lao P.D.R. 21.9
74 Lebanon 76.1
75 Lesotho 27.4
76 Liberia 7.3
77 Libya 20.3
78 Macao, China 81.6
79 Madagascar 4.7
80 Malawi 9.6
81 Malaysia 78.8
82 Maldives 59.1
83 Mali 11.1
84 Marshall Islands 29.8
85 Mauritania 18.0
86 Mauritius 53.2
87 Mexico 59.5
88 Micronesia 33.4
89 Mongolia 22.3
90 Morocco 58.3
91 Mozambique 17.5
92 Myanmar 25.1
93 Namibia 31.0
94 Nauru n/a
95 Nepal 19.7
96 Nicaragua 24.6
97 Niger 4.3
98 Nigeria 25.7
99 Oman 69.8
100 Pakistan 15.5
101 Palestine* 61.2
102 Panama 54.0
103 Papua New Guinea 9.6
104 Paraguay 51.3
105 Peru 45.5
106 Philippines 55.5
107 Qatar 94.3
108 Rwanda 20.0

The State of Broadband 2017 97
Rank Economy % of individuals using Internet
109 S. Tome & Principe 28.0
110 Samoa 29.4
111 Saudi Arabia 73.8
112 Senegal 25.7
113 Seychelles 56.5
114 Sierra Leone 11.8
115 Singapore 81.0
116 Solomon Islands 11.0
117 Somalia 1.9
118 South Africa 54.0
119 South Sudan 6.7
120 Sri Lanka 32.1
121 St. Kitts & Nevis 76.8
122 St. Lucia 46.7
123 St. Vincent and the Grenadines
55.6
124 Sudan 28.0
125 Suriname 45.4
126 Swaziland 28.6
127 Syria 31.9
128 Tajikistan 20.5
Rank Economy % of individuals using Internet
129 Tanzania 13.0
130 Thailand 47.5
131 Timor-Leste 25.2
132 Togo 11.3
133 Tonga 40.0
134 Trinidad & Tobago 73.3
135 Tunisia 49.6
136 Turkey 58.3
137 Turkmenistan 18.0
138 Tuvalu 46.0
139 Uganda 21.9
140 United Arab Emirates 90.6
141 Uruguay 66.4
142 Uzbekistan 46.8
143 Vanuatu 24.0
144 Venezuela 60.0
145 Viet Nam 46.5
146 Yemen 24.6
147 Zambia 25.5
148 Zimbabwe 23.1
Notes: The table includes ITU Member States. * Palestine is not an ITU Member State; the status of Palestine in ITU is the subject of Res. 99 (Rev., Busan 2014) of the ITU Plenipotentiary Conference. n/a – not available. Source: ITU World Telecommunication/ICT Indicators Database.
Annex 6
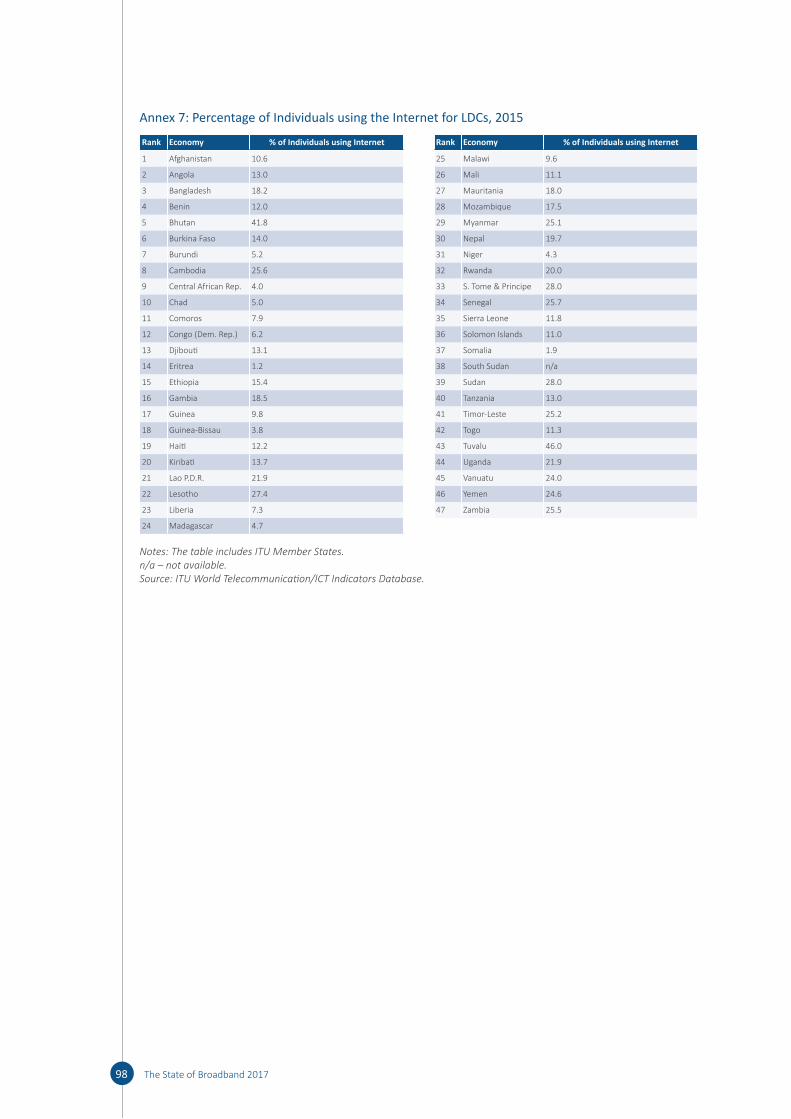
98 The State of Broadband 2017
Annex 7: Percentage of Individuals using the Internet for LDCs, 2015
Rank Economy % of Individuals using Internet
1 Afghanistan 10.6
2 Angola 13.0
3 Bangladesh 18.2
4 Benin 12.0
5 Bhutan 41.8
6 Burkina Faso 14.0
7 Burundi 5.2
8 Cambodia 25.6
9 Central African Rep. 4.0
10 Chad 5.0
11 Comoros 7.9
12 Congo (Dem. Rep.) 6.2
13 Djibouti 13.1
14 Eritrea 1.2
15 Ethiopia 15.4
16 Gambia 18.5
17 Guinea 9.8
18 Guinea-Bissau 3.8
19 Haiti 12.2
20 Kiribati 13.7
21 Lao P.D.R. 21.9
22 Lesotho 27.4
23 Liberia 7.3
24 Madagascar 4.7
Rank Economy % of Individuals using Internet
25 Malawi 9.6
26 Mali 11.1
27 Mauritania 18.0
28 Mozambique 17.5
29 Myanmar 25.1
30 Nepal 19.7
31 Niger 4.3
32 Rwanda 20.0
33 S. Tome & Principe 28.0
34 Senegal 25.7
35 Sierra Leone 11.8
36 Solomon Islands 11.0
37 Somalia 1.9
38 South Sudan n/a
39 Sudan 28.0
40 Tanzania 13.0
41 Timor-Leste 25.2
42 Togo 11.3
43 Tuvalu 46.0
44 Uganda 21.9
45 Vanuatu 24.0
46 Yemen 24.6
47 Zambia 25.5
Notes: The table includes ITU Member States. n/a – not available. Source: ITU World Telecommunication/ICT Indicators Database.

The State of Broadband 2017 99
List of Acronyms and Abbreviations
AI Artificial Intelligence
ADSL Asymmetric Digital Subscriber Line
AR Augmented Reality
ARPU Average Revenue Per User
CAGR Compound Annual Growth Rate
CITC Communications and Information Technology Commission of Saudi Arabia
CSV Corporate Social Value
DAU Daily Active Users
DSL Digital Subscriber Line
EHR Electronic Health Records
EIU Economist Intelligence Unit
EU European Union
FAO Food and Agricultural Organization
FTTB Fibre-To-The-Building
FTTH Fibre-To-The-Home
GCI Huawei’s Global Connectivity Index
GDP Gross Domestic Product
GIS Geospatial Information Systems
GNI Gross National Income
GSMA GSM Association
GSMAi GSMA Intelligence
HAPS High-Altitude Platform Station
HTS High Throughput Satellite
IAEA International Atomic Energy Agency
ICTs Information Communication Technologies
ICT4D ICT for Development
IDC International Data Corporation
IFAD International Fund for Agricultural Development
ILO International Labour Organization
IMT International Mobile Telecommunication
IOC International Oceanographic Commission of UNESCO
IOM International Organization for Migration
IoT Internet of Things
ISP Internet Service Provider

100 The State of Broadband 2017
IT Information Technology
ITU International Telecommunication Union
IXP Internet Exchange Point
LAN Local Access Network
LDCs Least Developed Countries
LEO Low-Earth Orbit satellites
LTE Long-Term Evolution
MAU Monthly Active Users
MDGs Millennium Development Goals
MEO Medium Earth Orbit satellite
MoI Means of Implementation
MOOCs Massive Open Online Courses
NBN National Broadband Network
NBP National Broadband Plan
NGN Next-Generation Network
NGO Non-Governmental Organization
NGSO Non-Geostationary Satellite Orbit
OECD Organisation for Economic Cooperation and Development
OERs Open Educational Resources
OSPs Online Service Providers
OTT Over The Top
PPP Public-Private Partnership
QoE Quality of Experience
QoS Quality of Service
RIAs Rich Interactive Applications
SDGs Sustainable Development Goals
SMEs Small- and Medium-Sized Enterprises
STEM Science, Technology, Engineering and Mathematics
UAV Unmanned Aerial Vehicle
UK United Kingdom of Great Britain and Northern Ireland
UN United Nations
UNCTAD United Nations Conference on Trade and Development
UNESCO United Nations Educational, Scientific and Cultural Organization
UNFPA United Nations Population Fund
US United States
USAID United States Aid agency

The State of Broadband 2017 101
VR Virtual Reality
WRC World Radiocommunication Conference
WMO World Meteorological Organization
2G Second-generation mobile
3G Third-generation mobile
4G Fourth-generation mobile
5G Fifth-generation mobile

broadbandcommission.org
The State of Broadband: Broadband catalyzing
sustainable developmentSeptember 2017
ISBN 978-92-61-25411-7
9 7 8 9 2 6 1 2 5 4 1 1 7