Thermodynamics of the Am Phi Boles - Anthophyllite-Ferroanthophyllite and the Ortho-clino Phase Loop

American Mineralogist, Volume 64, pages 294-303, 1979
The stability of anthophyllite in the presence of quartz
JosnpH V. CsnnNosry. JR. eNo Launrr KNepp Aurror
D epa rt ment. oJ' G eol ogical S ciencesUniuersity of Maine at Orono
Orono, Maine04473
Abstract
The dehydration reactions anthophyll ite : enstatite + quartz + fluid (l) and talc :anthophyllite + quartz + fluid (2) have been bracketed, with reversed experiments and PHzO= Ptotal. Smooth curves drawn through the bracketing data for reactions (l) and (2) passthrough the coordinates 2 kbar, 770";1.5 kbar,755"; I kbar,730"; 0.5 kbar,680. and 3 kbar,738 " ;2 kba r ,7 l l " ; 1 .5 kba r ,697o ; I kba r ,678 ' ; 0 .5 kba r ,655 'C , respec t i ve l y . Syn the t i cquartz, anthophyllite, enstatite, and talc were used as starting materials. Reversibility wasestablished by determining the relative growth or diminution (as judged by examining relativeintensities of X-ray reflections) of the high- with respect to the low-temperature assemblages.Both curves are consistent with the solubility data of Hemley et al. (1977b) at I kbar but arenot entirely compatible with the hydrothermal data of Greenwood (1963). Our experimentaldata indicate that the phase boundaries for reactions (l) and (2) intersect the phase boundaryfor the reaction (3) talc : 3 enstatite + quartz + Hro at low pressure (below 200 bars) andare, therefore, more consistent with the anthophyllite phase diagram proposed by Hemley elal. than with the diagram proposed by Greenwood.
Gibbs energy difference functions calculated using bracketing data for reactions (l), (2),and (4) talc i forsterite = 5 enstatite + HrO permit simultaneous evaluation of the freeenergies of formation of talc (-5513.69+4.69 kJ mol-r), enstatite (-1456.3g+ l.g3 kJ mol-r),and anthophyllite (- I 1,323.26+5.35 kJ mol-r) from the elements at 298K and I bar.
Introduction
Pure Mg-anthophyllite was first synthesized byBowen and Tuttle (1949, p. 450), who concluded that"anthophyllite has no stable range of existence in thepresence of water vapor." Using several combina-tions of natural and synthetic starting materials, Fyfe(1962) demonstrated that anthophyllite has a truestability field in the presence of excess water. Green-wood (1963) reversed four reactions involving Mg-anthophyllite and proposed a phase diagram whichcontained a stability field for anthophyllite. The sta-bility field was depicted as a relatively narrow band85'C wide which extended from low pressure toPHrO : 20 kbar. Greenwood (1971) later recalcu-lated the slope of the vapor conservative reaction (5)A : T -| 4E (see Table I for symbols and notations),showed that it was much steeper than previously
I Present address: Department of Geological Sciences, VirginiaPolytechnic Institute and State University, Blacksburg, Virginia24061.
Wo3-004X/79/0304-0294$02.00 2sq
reported, and modified the topology of the phasediagram he proposed in 1963. Greenwood's revisedtopology (Fig. 1) contained both possible enantio-morphic forms of the anthophyllite phase diagram,although he preferred the high-pressure portion.
Chernosky (1976) reversed the reactions (3) T : 3E+ Q + H,O and (4) T + F : 5E + H2O at waterpressures below 4 kbar and found that: (l) the reac-t ionsT : 3E + Q + HrO and A : 7E + Q + HrOintersect at the [F] invariant point near PHzO : 5kbar rather than at 20 kbar, provided that Green-wood's preferred slope for the anthophyllite-bearingreaction is taken at face value, and (2) the slopes forthe reactions T + F : 5E + H2O and (6) 9T + 4F :5,A. + 4HrO are inconsistent if Greenwood's pre-ferred topology is correct.
On the basis of mineral-aqueous-solution equi-libria performed at PH2O : I kbar, Hemley et al.(1977b) suggest that the low-pressure portion of thephase diagram (Fig. l), which shows the stabilityfield of anthophyllite expanding with increasing tem-

perature and pressure, is correct. Hemley et al. lo-cated the [Q] and [F] invariant points near 500 and200 bars PHrO respectively.
Because anthophyllite is a potential indicator ofpressure and temperature in some metamorphicrocks, we decided to reinvestigate the phase relationsabout the [F] invariant point. The reactions (l) A :7E + Q + H,O and (2) 7T : 3,{ + 4Q + 4H,O werereversed between 500 and 3000 bars PHrO in order todetermine the correct topology for the anthophyllitephase diagram. Tight brackets for these two reactionsin P-T space permit refinement of the free energies oftalc, enstatite, and anthophyllite calculated fromphase-equilibrium data by Zen and Chernosky(1976). Data upon which this paper is based havebeen presented orally (Chernosky and Knapp, 1977).
Experimental methods
Sl.arting material
Mixtures with bulk compositions corresponding toMgO'SiO, and 3MgO.4SiO, were made by drying,weighing, and mixing requisite proportions of MgO(Fisher, lot 787699) and SiOz glass (Corning lumpcullet 7940, lot 62221). MgO and SiOz glass werefired at 1000'C for three hours to drive off adsorbedwater. Enstatite and talc were synthesized directlyfrom the mixes whereas anthophyllite was synthe-sized using the "talc" mix. Examination of the syn-thetic products with a petrographic microscope andby X-ray diffraction revealed them to be entirely crys-talline.
Starting materials used to reverse each reactionwere prepared by mixing synthetic talc, enstatite, an-thophyllite, and quartz in the appropriate propor-tions and grinding by hand for one-half hour to en-sure homogeneity. The high-temperature assemblageconstituted 50 weight percent (excluding HrO) of thestarting material for both reactions. The dried solidphases were combined with excess distilled deionizedHrO and sealed in l.25cm-long gold capsules.
P rocedure
All experiments were performed in horizontally-mounted, cold-seal hydrothermal vessels (Tuttle,1949). Pressures were measured with factory-cali-brated, sixteen-inch Heise gauges assumed accurateto 10.1 percent of full scale (0-7000 and 0-4000bars). Because the Heise gauges were used as "pri-mary" standards, they were generally kept at roompressure, as suggested by the manufacturer; smallerdiameter, less accurate gauges were used for continu-
295
Table l . Symbols and notat ions
A a n t h o p h y l l i t e , M s r s i r 0 r r ( 0 t l ) ,
F f o r s t e r i t e , I ' l s 2 s i 0 4
E o r t h o e n s t a t i t e , l t g s i 0 3
T t a l c , M S r S i 4 0 , O ( 0 H ) ,
0 q u a r t z , S i 0 2
G ; s t a n d a r d G i b b s f r e e e n e r g y o f f o r m a t i o n ( 2 9 8 ' 1 5 K ,
I b a r ) o f a p h a s e f r o m t h e e l e m e n t s , i n J r c l - r
A G : G i b b s f r e e e n e r g y o f r e a c t i o n a t I b a r a n d 2 9 8 . 1 5 K
c * G i b b s f r e e e n e r g y o f H 2 0 a t T e a n d P e a c c o r d i n g t o
B u r n h a m e t a l . ' s ( 1 9 5 9 ) d a t a , c o n s i s t e n t w i t h t h e
s t a n d a r d s t a t e o f 2 9 8 . 1 5 K a n d I b a r
S ; s t a n d a r d e n t r o p y o f f o r m a t i o n ( 2 9 8 . 1 5 K , I b a r ) o f a
o h a s e f r m t h e e l m e n t s , i n J r c l - I d e g - r
O t f , , c h a n g e o f t h e e n t r o p y o f f o r m a t i o n o f t h e s o l i d p h a s e s
f o r a g i v e n r e a c t i o n
v vol ume
A V , v o l u m e c h a n g e o f t h e s o l i d P h a s e s f o r a g i v e n r e a c t i o n
T e , P e t h e t e m p e r a t u r e a n d p r e s s u r e a t w h i c h a n u n i v a r i a n t
r e a c t i o n i s a t e q u i I i b r i u m
I t h e r r c c h e m i c a l c a l o r i e o 4 . 1 8 4 0 j o u l e s
ous monitoring of "line" pressures, In order to con-serve valve stems and packings, pressures were notmonitored daily. Rather, pressures were carefullymonitored at the beginning of an experiment to guardagainst pressure leaks; once it was determined that avessel was leak-free, it was isolated for periods of upto a month between pressure checks. Small pressure
Fig. l . Schemat ic P-T diagram af ter Greenwood (1971),
showing the high- and low-pressure intersections of the vapor-
conservative reaction A = T + 4E with the [Q] and [F] invariantpoints. Reactions are numbered as in the text.
CHERNOSKY AND AUTIO: STABILITY OF ANTHOPHYLLITE
296
fluctuations due to temperature drift were unavoid-able, but experiments which experienced pressuredrops of greater than 50 bars were discarded. Pres-sures are believed accurate to * I percent ofthe statedvalue.
Because temperature drifted during the experi-ments, daily temperature readings were averaged andthe standard deviation of the temperature readingscafculated; temperature errors are reported as L2standard deviations about the mean and representerror due to temperature drift alone. Two othersources of error in temperature must be considered;namely, errors due to a temperature gradient along acapsule and those due to inaccurate thermocouples.Temperature gradients in the pressure vessels usedwere all less than I oC over a working distance of 3.0cm (temperature calibration performed at room pres-sure). Because bracketing experiments were per-formed in l.25cm-long sealed gold capsules, errordue to temperature gradients in the pressure vessels isassumed negligible. The temperature calibration foreach shielded thermocouple was checked after eachexperiment by heating the vessel to the temperatureof the experiment at a pressure of I bar and com-paring the measured temperature to that of a pre-viously standardized thermocouple placed inside thebomb. This procedure insures internal consistency intemperature readings among pressure vessels, cor-rects for the temperature difference between thecharge capsule and external measuring thermo-couple, and results in an accurate temperature for an
Table 2 Uni t -cel l parameters and volumes of synthet ic enstat i te,ta lc, and anthophyl l i te
enstatlte ta lc anthophyll ite
CHERNOSKY AND AUTIO: STABILITY OF ANTHOPHYLLITE
Fjgures in trEentheses represent the esti@tedsxandard deviaxion in terms of J.east units citedfor tlre value xo their ircdiate lefx; xhese uncer-taiaties wete calcuiated using the celT refinqent.prqram and represent precision onlg. Ce77 parile-Xers are expressed in angstroms.
Abbreviaxions: N = nunbq of teflections usedit utjt ce77 refinqenx; s = x-rag standard.
experiment, assuming that the standard thermo-couple was adequately calibrated. Corrections wereusually on the order of 0-5oC. Experiments werechecked for leaks both before and after hydrothermaltreatment by heating the charge capsules and check-ing for loss of HzO. Because quartz was generallyleached from experiments which leaked, such experi-ments were discarded.
The products of each experiment were examinedwith a petrographic microscope and by X-ray powderdiffraction. Because reaction rates at temperaturesnear the equilibrium curves were sluggish, completereaction was generally not obtained. Judgment as towhich assemblage is stable at a given pressure andtemperature was based on an examination of all ma-jor reflections for the phases of interest on a diffrac-tometer trace over the interval 5o to 40o N (CuKaradiation). A reaction was considered reversed if a 25percent change in the intensities of X-ray reflectionsrelative to those of the starting material could beobserved after the completion of an experiment. Mi-croscopic observation of the experimental productsrevealed distinct textural features (described in detaillater) which indicated reaction direction. Unfortu-nately, the sensitivity obtained using textural featuresto judge reaction direction was not significantlygreater than the sensitivity afforded by the X-raytechnique. Consequently, textural features were usedto confirm the X-ray results but were not used as thesole criteria for judging reaction direction.
Unit-cell parameters for synthetic phases used inthe starting material were calculated by refiningpower patterns obtained using an Enraf-NoniusFR552 Guinier camera and CuKa radiation; CaF,(Baker Lot 91548, a : 5.4620+0.00054), standard-ized against gem diamond (a : 3.567034, Robie elal., 1967), was used as an internal standard. Least-squares unit-cell refinements were performed with acomputer program written by Appleman and Evans(1973).
Results
Synthesis qnd characterization of phases
Enstatite (MgSiOs) was synthesized hydrother-mally at 815"C and PHrO : I kbar in five to sevendays from a mixture of MgO and SiOz glass. Crystalswere fine-grained (l0p), prismatic, and had parallelextinction. The X-ray pattern and unit-cell parame-ters (Table 2) compare favorably to the powder pat-tern of orthorhombic enstatite from the Bishopvillemeteorite (tsru powder pattern 7-216).
b
c
N
s
18. 236 ( 10)
8.822(3)
5 . 1 7 6 ( 1 )
832 .86 (43 )
19
CaF z
s . 2 9 t ( 6 )
9.169 (7 )
18. 982 (r6)
909.47 (L.28)
99" 4',
I4
CaF2
18 . s7 (4 )
17 .9L (4 )
s . 2s ( 1 )
1 7 4 8 . 0 ( 3 . 7 )
16
CaF,
CHERNOSKY AND AUTIO: STABILITY OF ANTHOPHYLL]TE
Talc [M93Si4O,'(OH)r] was synthesized hydro-thermally at 680"C, PH2O = 2 kbar in five to tendays. The synthetic product typically crystallized asaggregates of very fine-grained plates and containedless than 0.5 percent forsterite as an impurity, whichcould be due to leaching of silica from the startingmaterial or to the initial preparation of a startingmaterial deficient in SiOz. The powder pattern andunit-cell parameters of talc (Table 2) compare favor-ably with those of natural (esrru powder pattern l3-558) and synthet ic (Forbes, 1971) talc.
Anthophyllite IMgrSirOrr(OH)r] was synthesizedtogether with cristobalite, enstatite, talc, forsterite,and quartz by hydrothermally treating synthetic talcat 840oC, PH,O : 0.5 kbar for l2 hours. A mixtureof anthophyllite and quartz together with about 5percent talc was obtained by hydrothermally treatingthe products of the previous experiment at 735oC,PH,O : 3 kbar for 4l days. Anthophyllite synthe-sized in this manner occurred as extremely fine grainsintimately intergrown with talc, and as somewhatlarger (l0p) prismatic crystals having parallel ex-tinction. The X-ray powder pattern and unit-cell pa-rameters (refined assuming the anthophyllite spacegroup Pnma) correspond favorably to those of syn-thetic (Greenwood, 1963) and natural (Finger, 1970)anthophyllite. Because several new triple-chain min-erals created during the reaction of anthophyllite toform talc have recently been reported (Veblen andBurnham, 1975,19761' Veblen et al., 1977), we com-pared the powder patterns of synthetic anthophylliteto calculated powder patterns of jimthompsonite,clinojimthompsonite, and chesterite provided byD. R. Veblen. Reflections belonging to these phaseswere not observed in the synthetic anthophyllite weused as starting material. D. R. Veblen kindly exam-ined the starting material and the products of severalreversal experiments on both sides of each phaseboundary with a high-resolution transmission elec-tron microscope and observed isolated slabs of atriple-chain silicate parallel to 010 of anthophyllite.The percentage of triple-chain silicate varied (5-15percent by volume) from one grain to the next. Thetriple-chain silicate apparently forms when an-thophyllite is initially synthesized outside its stabilityfield from talc. X-ray reflections from the triple-chainsilicate were not observed because the isolated slabsare only one unit cell thick.
We assume that the presence of triple-chain impu-rities does not significantly affect the experimentalresults, because the ratio of anthophyllite to triple-chain silicate is the same after the completion of a
bracketing experiment as it is in the starting material.Interaction of triple-chain impurities with the fluidphase is probably minimized because dissolution ofanthophyllite during a bracketing experiment pre-sumably occurs along grain boundaries, and thetriple-chain impurities are located within anthophyl-lite grains.
Quartz (SiOr) was synthesized together with an-thophyllite with synthetic talc as a starting material.The positions of the major X-ray reflections of thesynthetic quartz compare favorably to those of natu-ral quartz from Lake Toxaway, North Carolina(,rsrrrr powder pattern 5-0a90); unfortunately, thenumber of reflections required for a unit-cell refine-ment was not observed in the synthetic product,which contained less than ll percent quartz.
The reaction A : 7E + Q + HrO
Starting material used for reversing reaction (l), A: 7E + Q + HrO, was obtained by mixing puresynthetic enstatite together with anthophyllite andquartz. The starting material contained a smallamount ((5 percent) of talc which, however, reactedaway in all but three experiments (Table 3, Experi-ments 5, 21 , and 24) located near the metastableextension ofthe phase boundary for reaction (3), T :
7E + Q + HrO. Petrographic examination of experi-mental products which showed definite reaction re-vealed that the dimensions of crystals belonging to
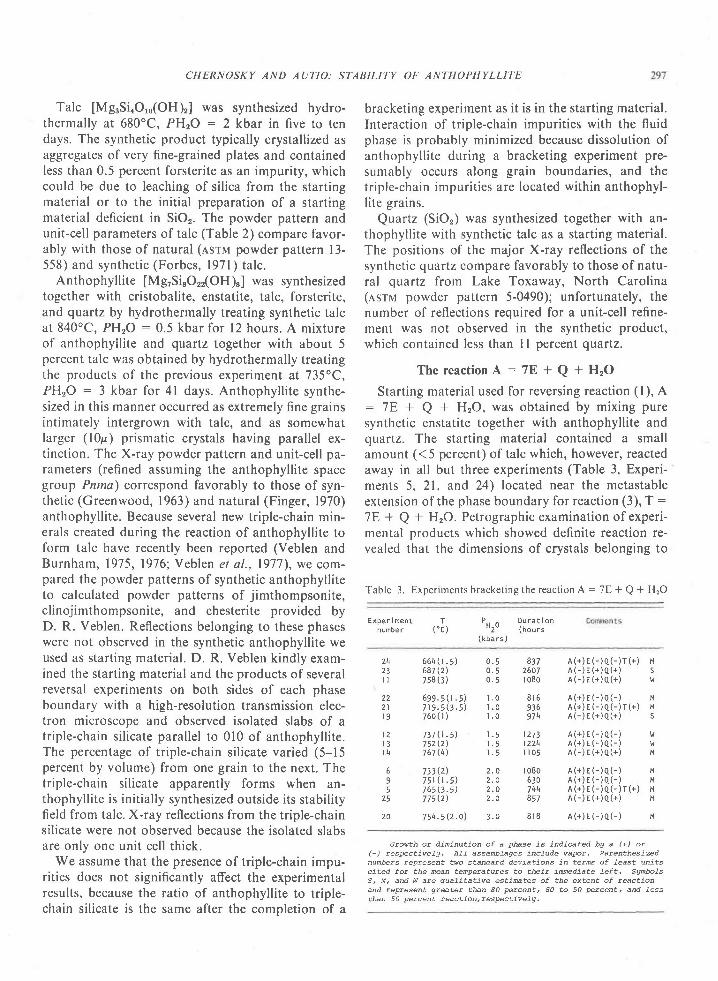
Table 3. Exper iments bracket ing the react ion A : 7E + Q + HrO
E x p e r i m e n tn u m D e r
P' H z o
(kba rs )
T( ' c )
D u r a t i o n( h o u r s
24
il
222 lr 9
t 2r 3r 4
695
25
20
5 6 4 ( t . 5 ) 0 . 5687 Q\ 0.5758 (3 ' 0 . 5
6 9 9 . 5 ( r . 5 ) r . 07 t 9 . 5 ( 3 . 5 ) r . 07 6 0 ( r ) r . 0
7 3 1 ( t . , t . 5752 (2 ) 1 .5767 (4 ) r . 5
133 (2 ) 2 .07 5 r 0 . 5 ) 2 . 07658 .5 ) 2 .0775(2' ) 2.0
754 .5Q .o ' , ) 3 . 0
A ( + ) E ( - ) q ( - ) r ( + ) t lA ( - ) E ( + ) a ( + ) sA ( - ) E ( + ) q ( + ) } /
A ( + ) E ( - ) a ( - ) MA ( + ) E ( - ) q ( - ) r ( + ) i lA ( - ) E ( + ) a ( + ) s
A ( + ) E ( - ) A ( - ) ! 'A ( + ) E ( - ) 0 ( - ) ! ' rA ( - ) E ( + ) a ( + ) H
91a
2607I 080
8 r 5
974
1273t224r t 0 5
| 080
7 t+\
8 r 8
A (+ )E ( - )A ( - ) r . rA ( + ) E ( - ) a ( - ) r 1A (+ )E ( - )a ( - ) r (+ ) r , , lA ( - ) E ( + ) Q ( + ) H
A(+ ) E ( - )A ( - ) H
Growxh or dininution of a phase is jndicated bg a (+) or(-) restrEctivefg. ALf assedbTages incLuile vatrbt. Patenthesizednumbers represent two standatd Cleviations jn terns of Jeast unitscited for the mean tenpqatutes xo their iMediate feft. Sgnboiss. M, and w are quaTitat ive est i@tes of the extent of react ionand tepresent gr@ter than 80 peEcent' 80 to 50 [Etcent, and fessthan 50 petcent teacxion' respect iveTg.
298 CHERNOSKY AND AUTIO: STABILITY OF ANTHOPHYLLITE
the stable assemblage increased, whereas crystals be-longing to the unstable assemblage had corrodedgrain boundaries. Several additional textural featureswere observed in experiments conducted on the high-temperature side of the phase boundary: (1) quartzoften recrystallized to the point where undulatoryextinction became evident, (2) fine quartz grains (2p)occurred as inclusions oriented parallel to the c axisof enstatite, and (3) very fine (0.5p) quartz grainswere observed to cluster about the periphery oflargerenstatite crystals, suggesting that a single anthophyl-lite grain had reacted to enstatite * quartz.
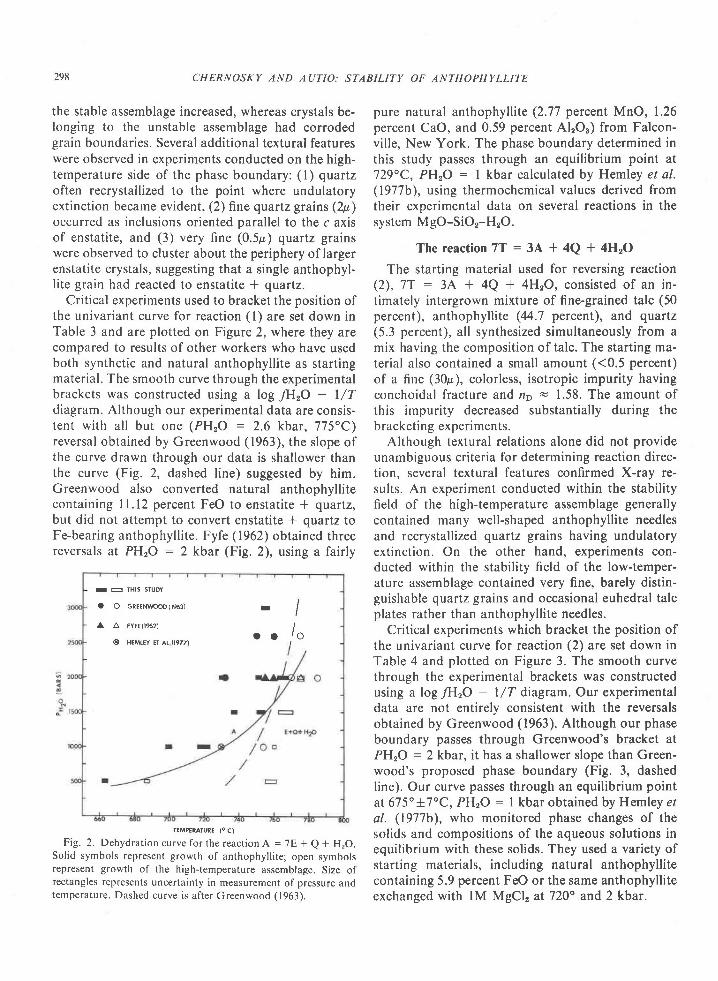
Critical experiments used to bracket the position ofthe univariant curve for reaction (l) are set down inTable 3 and are plotted on Figure 2, where they arecompared to results of other workers who have usedboth synthetic and natural anthophyllite as startingmaterial. The smooth curve through the experimentalbrackets was constructed using a log /HrO - l/Tdiagram. Although our experimental data are consis-tent with all but one (PH,O : 2.6 kbar. 775"C)reversal obtained by Greenwood (1963), the slope ofthe curve drawn through our data is shallower thanthe curve (Fig. 2, dashed line) suggested by him.Greenwood also converted natural anthophyllitecontaining ll.12 percent FeO to enstatite I quartz,but did not attempt to convert enstatite * quartz toFe-bearing anthophyllite. Fyfe (1962) obtained threereversals at PHrO : 2 kbar (Fig. 2), using a fairly
rErp€RAIUR[ (o c)
Fig. 2. Dehydrat ion curve for the react ion A = 7E + Q + H,O.Sol id symbols represent growth of anthophyl l i te; open symbolsrepresent growth of the high-temperature assemblage. Size ofrectangles represents uncertainty in measurement of pressure andtemperature. Dashed curve is af ter Greenwood (1963).
pure natural anthophyllite (2.77 percent MnO, 1.26percent CaO, and 0.59 percent ALO3) from Falcon-ville, New York. The phase boundary determined inthis study passes through an equilibrium point at729oC, PH2O : I kbar calculated by Hemley et al.(1977b), using thermochemical values derived fromtheir experimental data on several reactions in thesystem MgO-SiOz-HzO.
The reaction 7T = 34 + 4Q + 4HrO
The starting material used for reversing reaction(2), 7T : 3,{ + 4Q + 4HrO, consisted of an in-timately intergrown mixture of fine-grained talc (50percent), anthophyllite (44.7 percent), and quartz(5.3 percent), all synthesized simultaneously from amix having the composition of talc. The starting ma-terial also contained a small amount ((0.5 percent)of a fine (30p), colorless, isotropic impurity havingconchoidal fracture and ne - 1.58. The amount ofthis impurity decreased substantially during thebracketing experiments.
Although textural relations alone did not provideunambiguous criteria for determining reaction direc-tion, several textural features confirmed X-ray re-sults. An experiment conducted within the stabilityfield of the high-temperature assemblage generallycontained many well-shaped anthophyllite needlesand recrystallized quartz grains having undulatoryextinction. On the other hand, experiments con-ducted within the stability field of the low-temper-ature assemblage contained very fine, barely distin-guishable quartz grains and occasional euhedral talcplates rather than anthophyllite needles.
Critical experiments which bracket the position ofthe univariant curve for reaction (2) arc set down inTable 4 and plotted on Figure 3. The smooth curvethrough the experimental brackets was constructedusing a log/HrO - l/T diagram. Our experimentaldata are not entirely consistent with the reversalsobtained by Greenwood (1963). Although our phaseboundary passes through Greenwood's bracket atPH2O : 2 kbar, it has a shallower slope than Green-wood's proposed phase boundary (Fig. 3, dashedline). Our curve passes through an equilibrium pointat 675o t7oC, PH2O : I kbar obtained by Hemley elal. (1977b), who monitored phase changes of thesolids and compositions of the aqueous solutions inequilibrium with these solids. They used a variety ofstarting materials, including natural anthophyllitecontaining 5.9 percent FeO or the same anthophylliteexchanged with lM MgCl, at 720" and 2 kbar.
I E THIS STUDY
a O GREEN\iooD (l%3) II I
A A FyFE(tes2) I
€ HTMTEY Er ar (re77) o ' i
o

CHERNOSKY AND AUTIO: STABILITY OF ANTHOPHYLLITE 299
T he rmo ch e mi ca I c al cula t ions
Zen and, Chernosky (1976) calculated the freeenergies of talc, enstatite, and anthophyllite usingphase equilibrium data of Greenwood (1963) andChernosky (1976). Unfortunately, the uncertaintiesin the calculated free energies were rather large:+ 10.5 kJ mol-r for talc, * 17 kJ mol-r for anthophyl-lite, and +4 kJ mol-1 for enstatite. The bracketingdata obtained during this study have enabled us torefine the free energies ofthese phases and reduce theuncertainties of the calculated values.
The Gibbs free energy of formation of a phasefrom the elements at 298K. I bar can be calculatedfrom the P-I coordinates ofa phase boundary usingthe relation (Fisher and Zen, l97l\:
AG(Te,Pe) = 0 : AGl,"(298,1) - I#sAS9;jT
+ /l"A V"dP + G*(HrO)(Te,Pe)
The integrals .fASf,"d1' and !A,V"dP have been ap-proximated by the quantities A.S|,,AZ and AV"L,P,respectively. The uncertainty introduced by makingthese substitutions is small (Zen, 1969).
We have chosen to calculate the free energies oftalc, enstatite, and anthophyllite by simultaneouslyevaluating the Gibbs energy difference functions(Thompson, 1973) cKA) - 7Go^E),7GiG) -3cKA),and Gi(T) - 5G?(E), for the reactions A = 7E + Q +H2O,7T: 3 , { + 4Q + 4HrO, and T + F : 5E +HrO, respectively (Table 5). The uncertainty attachedto the difference functions calculated for each indi-vidual experiment (Table 5) was evaluated by com-bining, in the commonly accepted manner, the uncer-tainties associated with the free energies of eitherquartz or forsterite, the entropies and molar volumesof the solid phases, and the values for G*(HrO). Theuncertainty attached to the average value for eachdifference function (Table 5) was obtained by addingthe uncertainties in the primary thermochemical data(Table 6) to the uncertainties reflected in the finitewidth of each experimental bracket (Figs. 2 and 3).The "best" value for each difference function (G,)and its associated uncertainty (f,) were calculatedusing the relations:
G t : Z T - r G t w i / Z i l
and
Si: ( l /21=rw1)t /2
where g; is the uncertainty associated with Gi and, w1= l/C1..This procedure was used by Zen (1972) and
Table 4. Experiments bracketing the reaction 7T : 3A + 4Q +4H20
Expe r i mentnumDer
T( "c )
P, n Dura t ion Cmentsz (nours ,
( tbars )
I 5l 4l 0l 2
8
l 9
20t 7
7r 32 lt 6
t'lt'l
l l
t1r|t
!,
l.t
t,
6 1 3 ( 3 )630 (3 )647 8 .5 )6 7 7 ( t l
564 ( l )687 (3)7 t 4 ( 3 )
693(31701 (3 )
706 (lr)7 t 9 Q )
592(t)7zo ( \ l727 $)742(\l
0 . 5 1 0 6 r0 . 5 I 0 5 10.5 25\\0.5 to52
| . o 7 4 41 .0 872l . o 7 4 4
1 .5 t 826t . 5 1 3 9 9
z . v z l o v
2 . O l 0 l 4
3.0 7993 . 0 | 6 5 13.0 26883 .0 993
r (+ )A ( - )a ( - )r (+ )A ( - ) a ( - )T (+) A( - ) a ( - )r ( - )A (+ ) Q (+ )
r (+ )A ( - ) 0 ( - )r ( - )A(+) q(+)r ( - )A (+)q(+)
r (+ )A ( - ) q ( - )r ( - )A (+) 0(+)
r ( + )A ( - ) a ( - )r ( - )A (+) Q(+)
r ( + ) A ( - ) q ( - )r (+)A (- ) q(- )T (+ )A ( - )0 ( - )r ( - )A (+ ) Q (+ )
Growth ot itininution of a phase is indicated bg (+) or (-)tespectiveLy. e.ll. asssrD.lages incftfre vatrw. PatenthesizedDunbers repregent ttu standtd deviations jr teare of Teast @itscited fot the rean t4peratures to tteit imediaxe.left. ,9gnboisS, t, and W are qbl.itative esti@tes of tIE extenX of reaccao0and reptesent giteatet xhan 80 Eetcent, 80 to 50 petcent, ard -lesstIEn 50 lErcent teaction, reapativeLg.
has been lucidly explained by Bird and Anderson(1e73).
In order to evaluate the difference functions, oneonly needs the free energies of quartz and forsterite at298K, I bar, the molar volumes and entropies of the
TEMPERATURT ec)
Fig. 3. Dehydration curve for the reaction 7T : 3A + 4Q +4HrO. Solid symbols represent growth of talc; open symbolsrepresent growth of the high-temperature assemblage. Size ofrectangles represents uncertainty in measurement ofpressure andtemperature Dashed curve is after Greenwood (1963).
I t= IHIS SIUDY
A FYFC 0952)
a O GRECN\r/ooo (1963)
-+ HEMTEY rr Ar.(l9zz)

300 CHERNOSKY AND AUTIO: STABILITY OF ANTHOPHYLLITE
0 . 51 . 01 , 52 . O
0 . 51 . 0
2 . O3 . 0
0 . 51 . 02 . O3 . 04 . 0
Table 5. Gibbs energy di f ference funct ions for three equi l ibr ia inthe system MgO-SiO,-HrO
( r ) a = 7 8 + Q + H 2 O
c; (A) - 7c ; (E) = c ; (a ) + c* (H2o) + ^vs^p - ^ssar
P,kbar Lower temD. revelsaf Upper t@p. reversal
6870C -1729.74!0.97760 -1130.7510.95167 - r r29 .3110.95775 -Lr28.63!0,95
!728,59!O.79 kJ ml-lAverage 1 1 sEandard error:
(2) 7T = 3A + 4Q + 4H2o
7G;(r) - 3c;(A) = 4c;(a) + 4c*(n2o) + avs^p - assAr
P,kbar Lower teop. reversal Upper teDp, reversal
LGi - (Z-298)ASP," + (p- l)AV, + G*(H,O)? 0
Each linear inequality of the set is obtained from anexperimental reversal of the reaction A : 7E + Q +H,O (Table 3). The range of permissible ASf,, valueswhich satisfy the inequalit ies is 177.7 to 201.4 J mol-ldeg-l which corresponds to Si(A) values rangingfrom -2398 to -2422 J mol-1 deg-', respectively. Wehave adopted Mel'nik and Onoprienko's entropyvalue (-2411 J mol-1 deg-') for anthophyll ite be-cause it l ies within the middle of this permissiblerange of values, and have assigned to it an uncer-ta inty of i l2 J mol- r deg-r .
The calculated value for Gi(T) - 5GKE) (Table 5)is about I kJ smal ler than the value obta inedby Zenand Chernosky (1976), who replaced the integral
ILS?.dT by lASy,"AZ rather than by AS|,"A7"; themean value, ASr,", is obtained from entropy of forma-tion values for successive even-hundred-degree inter-vals. We did not use the approximation made by Zenand Chernosky because Si(A) is not known as afunction of temperature; in addition, our procedurerequires that all three difference functions be calcu-lated in the same manner. Simultaneous evaluationof the three difference functions (Table 5) yieldsthe following: Gi(A) : -11323.26+5.35, c?(E) :- 1 4 5 6 . 3 8 + 1 . 9 3 , a n d G K T ) : - 5 5 1 3 . 6 9 + 4 . 6 9 k Jmol-', where the errors are *2 standard deviations.The calculated free energies are in excellent agree-ment with those obtained by Zen and Chernosky
Table 6. Thermodynamic parameters of phases
G; (2e8 ,1 ) s ; ( 2e8 ,1 ) v (2e8 ,1 )-
- l _
- l - l
k J m o l -
J m o l - d e g -
J b a r ' g f '
Average 1 1 standard error:
( 3 ) T + F = 5 E + H 2 O
c;(r ) - 5c;(E) = -c i (F) + c*(H2o) + AvE^p - Ass^r
P,kbar Lower temp. reversal Upper temp. reversal
664"c -L rz7 .2 i !0 .98720 -1128.0110.96752 -1128. 3610.957 6 5 - 1 1 2 8 . 0 9 1 0 . 9 5
647 -462r .75 !L .96664 -4616.88 !1 . 94692 -4623.O7!r.93681 -4624.71 . !7 .92727 -4627.45 ! r .90
600 L769.92!r.)-0637 1768.9011. 09640 1770.38 i1 .08662 L769.30 ! I .O76 8 6 1 7 6 7 . 7 9 ! L . 0 7
6 7 7 - 4 6 3 6 , 8 4 r r . 9 5687 -4627.5O!r.93701 -4626,99!r.927r9 -4630.3011.917 4 2 - 4 6 3 3 . 5 7 1 1 . 9 0
- \626.07 !2 .3 \ kJ no l - I
62r 1767.78 !L .O9657 1767.05r r .086 6 3 1 7 6 8 . 4 5 ! r . 0 8692 7766.87 ! r .O7706 1766,24 !L .06
t l68 .2 l !0 .92 kJ rc1- rAverage J I gtandard error
Btacketing data fot teaction (3) is tt@ Chsnoskg 0.976).
solid phases (Table 6), and values for Gx(HrO), thestandard Gibbs free energy of water, tabulated byFisher and Zen ( 197 I ). The heat capacities of quartz,forsterite, and talc have been measured and the en-tropy values derived from these measurements areprobably of high quality. We assume that the entropyof clinoenstatite is a good approximation for ortho-enstat i te (Zen and Chernosky, 1976, p. l l58).
A major source of uncertainty is the entropy ofanthophyllite; the value used by Zen (1971) and byZen and Chernosky (1976) was calculated by Mel'nikand Onoprienko (1969) from Greenwood's (1963)phase equilibrium data for the reaction A : 7E + Q+ HrO. Although our bracketing data for this reac-tion are consistent with all but one of Greenwood'sreversals (Fig. 3), they more closely define the posi-tion of the equilibrium curve and hence provide auseful check on the entropy of anthophyllite.
We have used Gordon's (1973) method for obtain-ing the range of permissible AGf and ASf," valueswhich together satisfy a set of linear inequalities ofthe form:
Nunber in parentheses reters to source of daXa: (7) Robjeand waidbaun (1968); (2) zen (1972); (3) xhis studgi (4)Eenjngwag and Robie (vnpub. daxa); (5) Robie eX af. (7967); (6)z e n ( f 9 7 f ) .
*Vafue cotrected in accotdance with the revised vafue forthe heat of sofDt jon of qoartz.
+Vafue reters to cf inoenstaxi te.
Anthophyl l i teMsrsiror , (oH),
E n s t a t i t eMCSio3
F o r s t e r i t eMC2SiO4
Q u a r t zsio2
T a I cMg3si4oto (oH)
2
-71323.26 -24rrr s . 3 s ( 3 ) ! r 2 ( 3 )
- 1 4 5 6 . 3 8 - 2 9 L . 1 41 1 . 9 3 ( 3 ) 1 0 , 4 6 1 ( 2 )
-205r .70 -398.991 1 . 9 * ( 4 ) j 0 . 8 8 ( 2 )
-856.239 -182.49! L . 7 2 ( 1 ) r 0 . 0 8 ( 2 )
- 5 5 1 3 . 6 9 - r 2 7 3 . 0 8! 4 . 6 9 ( 3 ) 1 0 . 7 1 ( 2 )
2 6 . 4 4 6 ( 6 )
3 . r 4 7 6i 0 . 0 0 5 0 ( 5 )
4 . 3 7 8 61 0 . 0 0 2 9 ( s )
2 .26891 0 . 0 0 0 3 ( 5 )
1 3 . 6 2 5 21 0 . 0 2 5 9 ( s )
CHERNOSKY AND AUTIO: STABILITY OF ANTHOPHYLLITE
(1976), but the associated uncertainties are consid-erably smaller.
Free-energy values for anthophyllite (- I1344.ll.+7.1 I ) , ensrat i te (- 1460.63+2,51), and talc (-5524.60+3.77 kJ mol-') calculated by Hemley et al. (1977a)and Hemfey et al. (1977b) differ from those obtainedin this paper, despite excellent agreement among thephase equilibrium data. The discrepancy in the calcu-lated free energies of enstatite and anthophyllite isdirectly related to the free energy value used for talc.Hemley et al. (1977a) calculated Gi(T) from experi-mental data for the equilibrium
Mg3Sino'o (oH)' I
t^i*1,,.,(oH[ + 2H4sio4
at 200oC, I00 bars; in order to perform the calcu-lation, the free energies of HnSiOo and chrysoti le aswell as entropies and molar volumes of talc andchrysoti le and heat capacities of chrysoti le, talc, H2,Oz, and Si are required. Hemley et al. (1977b) usedvalues for @(T) and @(F) reported by Robie andWaldbaum (1968) to calculate Gl(A) and cKE).However, the value for Gl(F) contained in Robie andWaldbaum (1968) has been rev ised by Hemingwayand Robie (unpublished data) due to a revision in theenthalpy of so lut ion of a-quartz (Hemingway andRobie, 1977). Inasmuch as we used 28 exper imen-talfy-determined P-T coordinates and more recentancil lary thermochemical values, we believe our cal-culated free energies for talc, enstatite, and an-thophyll ite are more accurate.
Discussion
Cursory inspection of the phase boundaries forreact ions ( l ) , A : 7E + Q + H,O, and (2) , 7T : 3A+ 4Q + 4H2O, (Figs. 2 and 3) suggests that they wil lintersect and generate the [F] invariant point at awater pressure below 200 bars. Additional constrainton the locat ion of the [F] invar iant point is obta inedby including phase-equil ibrium data (Chernosky,1976) for reaction (3), T : 3E + Q + H,O. Providedthat the activit ies of all the phases participating in thereaction are unity and that steam is the only volati lespecies involved in the reaction, van't Hoffs equationreduces to:
(0 logf{j"6)0 | /T)"" : - (LH)r"/ 2.303R
This relation indicates that a dehydration boundarywill plot as a straight l ine on a log /HrO - l/Tdiagram if A^H at constant P" is constant (Orvil le andGreenwood, 1965). It is necessary to correct the slope
l/T(K)x lo 3
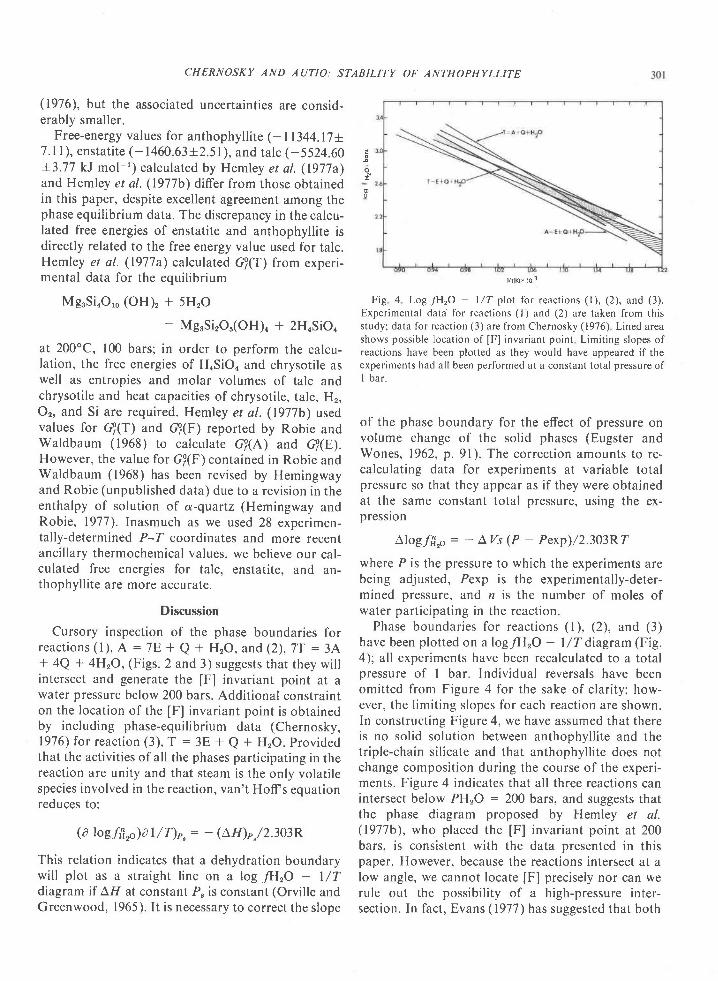
Fig 4 Log JH"O - l /T p lor for react ions ( l ) , (2) , and (3) .
Exper imental data for react ions ( l ) and (2) are taken f rom th isstudy; data for react ion (3) are f rom Chernosky (1976) L ined areashows possib le locat ion of IF] invar iant point L imi t ing s lopes ofreact ions have been plot ted as they would have appeared i f theexper iments had al l been performed at a constant tota l pressure ofI bar.
of the phase boundary for the effect of pressure onvolume change of the solid phases (Eugster andWones, 1962, p.9 l ) . The correct ion amounts to re-calculating data for experiments at variable totalpressure so that they appear as if they were obtainedat the same constant total pressure, using the ex-pression
Alogffi* : - A Vs (P - PexP)/2.303RT
where P is the pressure to which the experiments arebeing adjusted, Pexp is the experimentally-deter-mined pressure, and n is the number of moles ofwater participating in the reaction.
Phase boundar ies for react ions ( l ) , (2) , and (3)have been plotted on a logfi l"O - 1/T diagram (Fig.4); all experiments have been recalculated to a totalpressure of I bar. Individual reversals have beenomitted from Figure 4 for the sake of clarity; how-ever, the Iimiting slopes for each reaction are shown.In constructing Figure 4, we have assumed that thereis no solid solution between anthophyll ite and thetriple-chain sil icate and that anthophyll ite does notchange composition during the course of the experi-ments. Figure 4 indicates that all three reactions canintersect below PH,O : 200 bars, and suggests thatthe phase diagram proposed by Hemley et al.(1977b), who placed the [F] invariant point at 200bars, is consistent with the data presented in thispaper. However, because the reactions intersect at alow angle, we cannot locate IF] precisely nor can werule out the possibil i ty of a high-pressure inter-section. In fact, Evans (1977) has suggested that both
o
oo

CHERNOSKY AND AUTIO: STABILITY OF ANTHOPHYLLITE
the high- and low-pressure portions of the phase dia-gram as depicted in Figure I may exist.
Thus far, we have considered the triple-chain (TC)sil icate an impurity and have assumed that it does notaffect the location of the phase boundaries. The chiefreason for assuming no solid solution between the TCsil icate and anthophyll ite is that the structures ofthese two phases are different. We know, however,that the TC sil icate is not inert, since the ratio of TCsil icate to anthophyll ite remains nearly constant dur-ing the reversal experiments, even though anthophyl-l i te either grows or decomposes. It is diff icult to quan-titatively evaluate the effect of the TC silicate becauseits thermochemical parameters and its relationship tothe host anthophyl l i te are unknown.
One way to obtain quantitative information on theeffect of the TC sil icate in anthophyll ite is to considerthat there is solid solution between the two phases.Strictly speaking this approximation is incorrect.However, it is reasonable because (1) the structuresof the two phases are very similar, and (2) the ran-domly-distributed domains of the TC sil icate in an-thophyll ite are on the order of one unit cell thick.Although Veblen observed that the amount of TCsil icate varied (5 to l5 percent) from one anthophyl-l i te grain to the next, the average was about l0 per-cent. Assuming the presence of l0 percent j im-thompsonite, Mg,oSi,rOrr(OH)o, in anthophyll ite, theformula for the anthophyll ite-j imthompsonite solidsolution (ArJT,o) becomes Mgr.rSi..oO2r(OH)rr.When recast to preserve stoichiometry, reactions (l)and (2) become:
l 0 A , J T 1 o : 7 3 E + l l Q + l l H r O ( l a )
and
73T :30A,JT,. + 40Q + 40HrO (2a)
In order to evaluate the free energy of AroJTro, weneed its molar volume and entropy. Although thesequant i t ies are not known, the molar vo lume of the"sol id solut ion" should be c lose to the molar vo lumeof anthophyll ite. The error introduced by using themolar volume of the synthetic anthophyll ite (Table 2)used in the starting material is negligible. We havealso assumed that the entropy contribution of the TC" impur i ty" is wi th in the l imi ts ( -2411*12 J mol- ldeg-') calculated using experimental data for the re-action A : 7F. + Q + H,O. Although this assump-tion is highly suspect because configuration and mix-ing contributions to the entropy have been ignored,the error introduced is probably far smaller than theerror arising from the uncertainties in the freeenergies of the other phases involved in the reactions.
Using the approximations mentioned above,Gibbs energy difference functions, l0 GKATJT'')
73 GKE) and 73 GKT) 30 GP(A,JT''),were calculated. These values were combined withthose for GKT) - 5 GKE) (Table 5) and solved simul-taneously to yield: GKT) -5514.00+ 12.78,cKE) -1456.44+2.83, and GKA,JT'')- I1 ,785.67+ 15 .66 kJ mol - ' .
Although the calculated free energy of A*ITto istentative, it suggests that the addition of the com-ponent Mg,oSirrO3r(OH)n stabilizes pure Mg-an-thophyllite. The amount by which pure Mg-an-thophyllite is stabilized will undoubtedly change asmore accurate values for the molar volumes and en-tropies of the A-JT solid solutions become available;however, it is unlikely that the direction of change, atleast for Mg-rich compositions, will be affected, i.e.,our calculated free energy for pure Mg-anthophylliteis probably a "least stable" value.
Because our experimental work was conducted us-ing Fe-free phases as starting materials with waterpressure essentially equal to total pressure, it neces-sarily has limited direct application to natural rocks.The effects of decreasing PH2O relative to Pfluid orto Ptotal are well known (Thompson, 1955; Green-wood, l96l) and will not be discussed. The effect ofsubstituting Fe2+ for Mg on the phase boundariesconsidered in this paper is a topic ofcurrent debate.
Calculations by Evans and Trommsdorff (1974)assuming X'"(E) : 0.900, X'r(T) : 0.973+0.002,and Xyr(A) : 0.88+0.01 suggest that the equilibriumA : T * 4E will occur at a lower pressure or a highertemperature in the iron-free system by an amountgiven by AT = RryAS lnK o 200+95'C. Evans(1977) calculated that the temperature shift due to thesubstitution of l0 mole percent Fe for Mg in theother anthophyllite-bearing reactions should be small(-+ l0"C), because the volume and entropy changesare much greater for dehydration reactions than forvapor-conservative reactions. However, Sanford(1977) using different values for the enthalpies offormation of the phases involved, calculated that thesubstitution of Fe'+ for Mg by an amount commonlyobserved in natural occurrences is sufficient to lowerthe phase boundary for the reaction 9T + 4F : 5A +4HrO by l20o-l50oC, assuming PHrO : Ptotal .
Sanford's result is surprising in light of experimen-tal data for the reaction 7T = 3,A + 4Q + 4H2O,obtained by Hemley et al. (1977b) using as startingmaterials both natural anthophyllite containing 5.9percent FeO and the same anthophyllite in which theiron had been exchanged for Mg. Hemley et al.(1977b,p.362) stated that "No systematic differences

CHERNOSKY AND AUT]O.' STABILITY OF ANTHOPHYLLITE 103
were noted in the use of natural us. synthetic orexchanged us. unexchanged materials." Clearly, addi-tional experimental work on the stabil ity of Fe-bear-ing anthophyll ite wil l be extremely useful in resolvingthis probleni.
AcknowledgmentsThis research was supported by NSF grant EAR74- 13393 A0l to
J. V. Chernosky. We thank D. R. Veblen for examining the prod-ucts of several exper iments wi th h igh-resolut ion t ransmission elec-t ron microscopy Discussions of anthophyl l i te phase re lat ions wi thB. W Evans, J. J . Hemley, H. J. Greenwood, and E-an Zenhavebeen st imulat ing Percept ive reviews by H. J. Greenwood, T MGordon, T J. B. Hol land, and E-an Zen are great ly appreciated.
References
Appleman, D. E. and H. T. Evans, Jr . (1973) Job 9214 Indexingand least squares refinement of powder diffraction d,ata Natl.Tech. Inf. Seru, U.S. Depr Commerce, Springfield, Virginia,Document PB-216 188.
Bird, G. W. and G. M. Anderson (1973) The f ree energy offormat ion of magnesian cordier i te and phlogopi te Am. J. Sci ,273, 84-91
Bowen, N. L and O. F. Tut t le (1949)The system MgO-SiOr-HrO.Geol Soc. Am Bull.,60, 439-460.
Burnham, C. W., J R. Hol laway and N. F Davis (1969) Ther-modynamic properties ofwater to 1000"C and 10,000 bars. Geol.Soc. Am Spec. Pap 132.
Chernosky, J. V. , Jr . (1976) The stabi l i ty f ie ld of anthophyl l i te-Areevaluat ion based on new exper imental data. Am Mineral . ,6 l ,l l 4 5 - 1 1 5 5
- and L. A. Knapp (1977) The stabi l i ty of anrhophyl l i te p lusquartz. Geot. Soc Am. Abstructs with Programs,9,927.
Eugster , H. P and D. R. Wones (1962) Stabi l i ty re lat ions of theferruginous biot i te, anni te. J Petro l . , 3,82-125.
Evans, B W (1977) Metamorphism of Alp ine per idot i te and ser-pentinite. Ann. Reu. Eart.h Planet. Sci., 5, 397-447
- and V. Trommsdorf f (1974) Stabi l i ty of enstat i te * ta lc, andCO2-metasomat ism of metaper idot i te, Val d 'Efra, Lepont ineAlps. Am. J. Sci , 274, 2'74-296.
Finger, L. W. (1970) Ref inement of the crystal s t ructure of an-thophyflite Carnegie Inst. Ll/ash. Year Book,68, 283-288.
Fisher, J. R and E-an Zen (1971) Thermodynamic calculat ionsfrom hydrothermal phase equilibrium data and the free energyol H,O Am. J. Sci . 270. 297-314
Forbes, W. C. (1971) I ron content of ta lc in the systemMgrSinO,o(OH),-Fe.SioO,o(OH')2. J Geol., 79, 63-74
Fyfe, W. S. (1962) On the re lat ive stabi l i t ies of ta lc, anthophyl l i teand enstat i te. Am. J 5ci . .270. l5 l -154.
Gordon, T M. (1973) Determinat ion of internal ly consistent ther-modynamic data f rom phase equi l ibr ium exper iments. J. Geol ,81, t99-208
Greenwood, H J. (1961) The system NaAlSi ,Ou-HrO-argon: tota lpressure and water pressure in metamorphism. J Geophys. Res ,66, 3923-3946
- (1963) The synthesis and stabi l i ty f ie ld ofanthophyl l i te. " /P e t r o l . . 4 . 3 l 7 - 3 5 1 .
- (1971) Anthophyl l i te. Correct ions and comments on i tsstabi l i ty Am. J. Sci , 270, l5 l - t54.
Hemingway, B. S. and R. A Robie (1977) Enthalp ies of format ionof low alb i te (NaAlSi ,O,) , g ibbsi te (AI(OH)3), and NaAlO,;
revised values for AH!,r r r and AG!,z" . of some aluminosi l icateminerals. J Res U S. Geol .Suru. ,5,413-429
Hemley, J. J . , J . W. Montoya, C. L. Chr ist and P. B. Hostet ler(1977a) Mineral equi l ibr ia in the MgO-SiO,-H,O system: l .Talc-chrysotile-forsterite-brucite stability relations. A m. J. S ci.,277. 35t .
D. R. Shaw and R. W Luce (1977b) Mineraleql i l ibr ia in the MgO-SiO,-H,O system: I I Talc-ant igor i te-forster i te-anthophyl l i te-enstat i te stabi l i ty re lat ions and somegeologic implications in the system Am J. Sci , 277, 353-383
Mel 'n ik, Yu P and V L Onopr ienko (1969) Termodinamiches-kiye svoystva antofillita. In Konstitutsiya i Suoystua Mineralou,Vol . 3 (Thermodynamic propert ies of anthophyl l i te, In C ons t i tu-t.ion and Properties of Minerals, Vol 3), p. 46-55 Akad. NaukUk r . SSR, K iev
Orvi l le , P. M and H. J. Greenwood (1965) Determinat ion of AHof reaction from experimental pressure-temperature curves. Am.J . Sc i . 263 .678 -683 .
Robie, R. A. , P. M. Bethke and K. M. Beardsley (1967) SelectedX-ray crystal lographic data, molar volumes, and densi t ies ofmineraf s and related substances. U.S Geol Suru. Bull 1248
- and D R Waldbaum (1968) Thermodynamic propert ies ofminerals and re lated substances at 298.15'K (25.0 'C) and oneatmosphere (1.013 bars) pressure and at h igher temperatures.U.S. Geol. Suru. Bull. 1259.
Sanford, R F. (1977) The coexistence ofant igor i te and anthophyl-lite in uftramafic rocks (abstr.). Geol. Soc. Am. Abstracts withPrograms, 9, I I 54-l 155.
Thompson, A. B. (1973) Analc ime: f ree energy f rom hydrothermaldata Impl icat ions for phase equi l ibr ia and thermodynamicquantities for phases in NaAlOz-SiOz-HzO. Am. Mineral., 58,277-286
Thompson, J B, Jr (1955) The thermodynamic basis for themineral facies concept. Am. J. Sci., 253, 65-103
Tutt le, O. F. ( 1949) Two pressure vessels for s i l icate-water studies.Geol. Soc. Am. Bull.. 60. 1727-1729.
Veblen, D. R. and C. W. Burnham (1975) Tr ip le-chain biopyr i -boles: newly d iscovered intermediate products of the retrogradeanthophyl l i te- ta lc t ransformat ion, Chester , Vt . (abstr . ) . Trans.Am. Geophys. Union, 56, l0'76
- and - ( 1976) Biopyr iboles f rom Chester , Vermont: thefirst mixed-chain silicates (abstr.). Geol. Soc. Am Abstructs wit.hPrograms, S, | |53.
- , P. R Buseck and C. W. Burnham (1977) Asbest i formchain s i l icates: new minerals and structural groups. Science, 198,3 59-365
Zen, E-an (1969) Free energy of format ion of pyrophyl l i te f romhydrothermal data: values, d iscrepancies and impl icat ions. ,42.Mineral , 54, 1592-1606.
- (1971) Comments on the thermodynamic constants andhydrothermal stabi l i ty re lat ions of anthophyl l i te Am. J. Sci ,270. t36-150.
- (1972) Gibbs free energy, enthalpy and entropy of ten rock-forming minerals: calculat ions, d iscrepancies, impl icat ions lnMineral.. 57 . 524-553
- and J V Chernosky, Jr . (1976) Correlated f ree energyvalues of a nthophyl l i te, bruci te, c l inochrysot i le, enstat i te, forste-r i te, quartz and ta lc. Am. Mineral , 61, 1156-1166.
Manuscript receiued, May 10, 1978:accepted for publicarion, July 19, 1978