The Socio-Economic Integration of Migrantsuctpb21/reports/Final_report_CLG_06_2011.pdfThe...
135
The Socio-Economic Integration of Migrants Christian Dustmann and Tommaso Frattini 1 The Socio-Economic Integration of Migrants Final Report June 2011 Christian Dustmann and Tommaso Frattini EPolicy Ltd. and Centre for Research and Analysis of Migration (CReAM) This report has been commissioned by the Department for Communities and Local Government (CLG), within the research programme “Socio-Economic Integration of Migrants”.
Transcript of The Socio-Economic Integration of Migrantsuctpb21/reports/Final_report_CLG_06_2011.pdfThe...

The Socio-Economic Integration of Migrants
Christian Dustmann and Tommaso Frattini 1
The Socio-Economic Integration of Migrants
Final Report
June 2011
Christian Dustmann and Tommaso Frattini
EPolicy Ltd. and Centre for Research and Analysis of Migration (CReAM)
This report has been commissioned by the Department for Communities and Local
Government (CLG), within the research programme “Socio-Economic Integration of
Migrants”.

The Socio-Economic Integration of Migrants
Christian Dustmann and Tommaso Frattini 2
Contents Executive Summary ................................................................................................................... 4
1. Introduction and Background .......................................................................................... 15
2. Data Sources .................................................................................................................... 19
2.1 The UK Labour Force Survey ................................................................................... 19
2.2 The Citizenship Survey ............................................................................................. 20
2.3 The European Union Labour Force Survey (EULFS) .............................................. 20
2.4 Programme for International Student Assessment (PISA) database ......................... 21
3. Background: Immigrants in the UK ................................................................................. 22
4. Integration and Performance of First Generation Immigrants in the UK ........................ 24
4.1 Economic integration ................................................................................................ 24
4.1.1 Education ........................................................................................................... 24
4.1.2 Employment ....................................................................................................... 28
4.1.3 Wages ................................................................................................................. 31
4.2 Economic Integration over Time ............................................................................... 33
4.2.1 Education ........................................................................................................... 34
4.2.2 Employment ....................................................................................................... 35
4.2.3 Wages ................................................................................................................. 35
4.3 Non-Economic Integration ........................................................................................ 36
4.3.1 Fluency in English ............................................................................................. 36
4.3.2 Belonging ........................................................................................................... 39
4.3.3 Civic Participation ............................................................................................. 41
5. Dynastic Aspects: Integration and Performance of Second Generation Immigrants ...... 44
5.1 Economic integration of native-born minorities ....................................................... 44
5.1.1 Education ........................................................................................................... 44
5.1.2 Employment ....................................................................................................... 45
5.1.3 Wages ................................................................................................................. 46
5.2 Inter-generational aspects of immigrants’ economic Integration .............................. 47
5.2.1 Education ........................................................................................................... 48
5.2.2 Employment ....................................................................................................... 49
5.3 Non-economic integration of immigrants’ descendents ............................................ 49
The Socio-Economic Integration of Migrants
Christian Dustmann and Tommaso Frattini 3
5.3.1 Marriage behaviour ............................................................................................ 49
5.3.2 Civic integration................................................................................................. 51
6. International Comparisons ............................................................................................... 55
6.1 Immigrants’ economic integration in Europe: a comparative analysis ..................... 55
6.2 Educational achievement of immigrants’ children: a cross-country perspective ...... 58
7. Conclusion ....................................................................................................................... 60
References ................................................................................................................................ 64
Figures...................................................................................................................................... 70
Tables ....................................................................................................................................... 76
Tables Appendix .................................................................................................................... 124
The Socio-Economic Integration of Migrants
Christian Dustmann and Tommaso Frattini 4
Executive Summary
Education:
Based the age at which individuals leave full time education, we compute the native-
immigrant education gap for all immigrants, and we break down immigrants by
countries of origin. We do this at three points in time (1993-94, 2000-01, and 2008-
09). For all these three periods, and for all immigrant groups, immigrants in the UK
leave full-time education significantly later than natives. Further, over time the
overall educational gap between immigrants and natives (measured as the age at
which individuals leave full time education) appears to increase slightly: In 1993-94
the average immigrant left full time education 1.2 years later than the average native,
while the gap increases to 1.5 years in 2000-2001 and to 1.8 years in 2008-09.
Controlling for differences in the age structure of the immigrant population does not
significantly affect these findings.
• There is substantial heterogeneity in education gaps between immigrants from
different origins. For instance, in 2008-09 the most highly educated immigrant group,
relative to natives, were Eastern European immigrants, who left full time education on
average 2.6 years later than UK natives. The smallest gap in school-leaving age is
between immigrants from the Indian Sub-Continent, who left school about 1 year
later.
• The gap in years of education between immigrants and natives is higher for immigrant
men than for immigrant women, but the gap for women increases faster over the last
three decades, suggesting that immigrant women tend to become relatively more
educated.
• When distinguishing immigrants by ethnic origin, Black African immigrants are the

The Socio-Economic Integration of Migrants
Christian Dustmann and Tommaso Frattini 5
most highly educated, relative to white natives, and for all years. On the other hand
Pakistanis and Bangladeshis have the lowest relative education levels. This is mainly
driven by women, who are less educated than white British born women for any year
we consider.
• There is considerable heterogeneity in immigrant-native education gaps across UK
regions. In 2008-09, Scotland and the North East are the regions with the highest
education differentials: immigrants in these regions have left full time education on
average 2.4 and 2.7 years later than natives, respectively, while the West Midlands
experience the lowest differences.
Employment
• Immigrants have - despite their higher educational achievements - a lower
employment rate than natives: in both 1993-94 and 2000-01 immigrants’ employment
rate is 10.5 percentage points lower than that of natives. In 2008-09 this gap has
reduced to 2.7 percentage points. The most disadvantaged groups are immigrants
from the Indian Sub-Continent and the Middle East, while the employment rate of
immigrants from Oceania is higher than natives’ for all years. Eastern European
immigrants’ employment rate is 10.6 percentage points higher than natives’ in 2008-
09.
• The immigrant-native employment gap is larger for women than for men. White
immigrants have the lowest employment gap relative to natives, while Pakistani and
Bangladeshi women exhibit the largest gaps, in the order of 50 percentage points,
which remains stable over time. Immigrants of Black-Caribbean ethnicity are unique
in that they are the only group for which the employment gap (in favour of natives) is
The Socio-Economic Integration of Migrants
Christian Dustmann and Tommaso Frattini 6
larger for men.
Wages
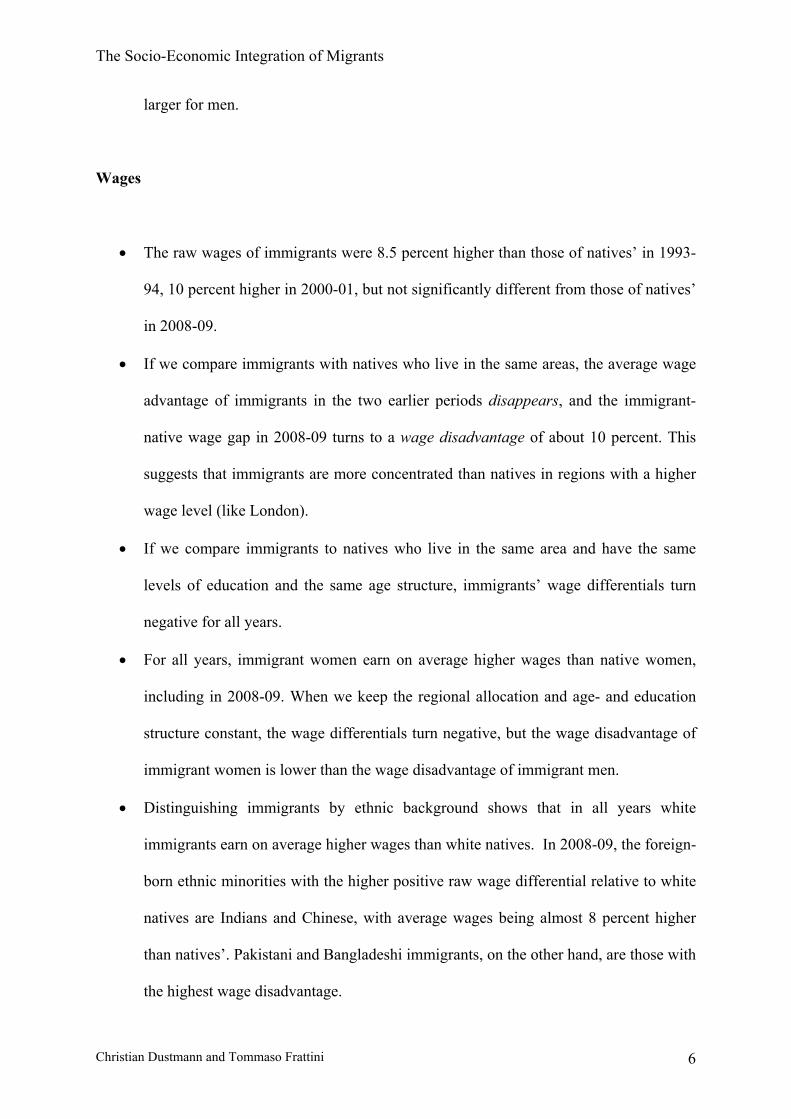
• The raw wages of immigrants were 8.5 percent higher than those of natives’ in 1993-
94, 10 percent higher in 2000-01, but not significantly different from those of natives’
in 2008-09.
• If we compare immigrants with natives who live in the same areas, the average wage
advantage of immigrants in the two earlier periods disappears, and the immigrant-
native wage gap in 2008-09 turns to a wage disadvantage of about 10 percent. This
suggests that immigrants are more concentrated than natives in regions with a higher
wage level (like London).
• If we compare immigrants to natives who live in the same area and have the same
levels of education and the same age structure, immigrants’ wage differentials turn
negative for all years.
• For all years, immigrant women earn on average higher wages than native women,
including in 2008-09. When we keep the regional allocation and age- and education
structure constant, the wage differentials turn negative, but the wage disadvantage of
immigrant women is lower than the wage disadvantage of immigrant men.
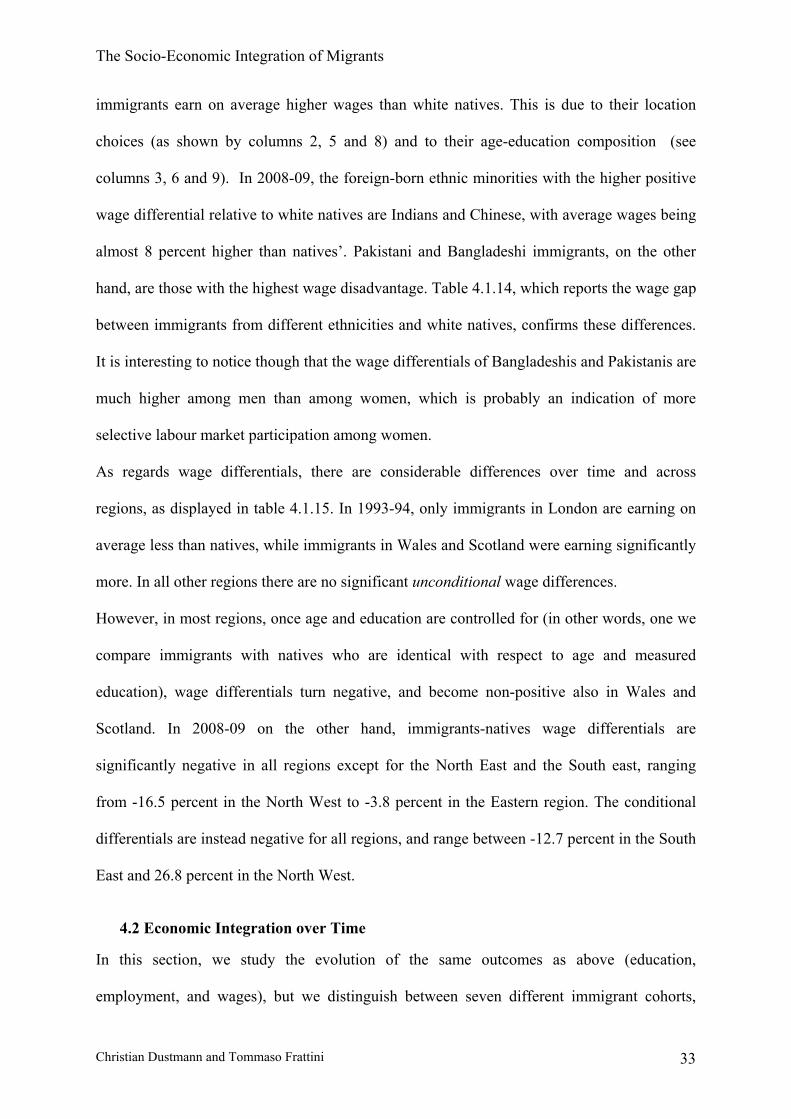
• Distinguishing immigrants by ethnic background shows that in all years white
immigrants earn on average higher wages than white natives. In 2008-09, the foreign-
born ethnic minorities with the higher positive raw wage differential relative to white
natives are Indians and Chinese, with average wages being almost 8 percent higher
than natives’. Pakistani and Bangladeshi immigrants, on the other hand, are those with
the highest wage disadvantage.

The Socio-Economic Integration of Migrants
Christian Dustmann and Tommaso Frattini 7
• The wage disadvantages of Bangladeshis and Pakistanis relative to white natives are
higher among men than among women, which is probably an indication of more
selective labour market participation among women.
Differences by Entry Cohorts
• Breaking the data down by entry cohorts shows that at any point in time, the more
recent immigrant cohorts are more educated than earlier cohorts. Further, the
education gap with natives (which is positive from the perspective of immigrants)
decreases with time in the UK, which could be explained by the more educated
immigrants of each cohort re-emigrating after some years spent in the UK.
• The immigrant-native employment gap (which is negative from the perspective of
immigrants) tends to close with time in the UK for all cohorts, both when observable
characteristics are not controlled for, and when they are. Yet, the conditional
employment gaps are negative for all cohorts, even after many years since migration.
• No clear patterns emerge for wages. The raw differentials for the 1980/83 cohorts
decrease over time, while for other cohorts this is not the case. As of 2008-09, the
earliest cohorts have positive wage differentials that tend to decrease for more recent
cohorts, and become negative for the 2004/07 cohort.
Language
• On average immigrants are 18 percentage points less likely than natives to be
proficient in reading in the English language, and 19.5 percentage points less likely to
be proficient in writing in the English language.

The Socio-Economic Integration of Migrants
Christian Dustmann and Tommaso Frattini 8
• Comparing immigrants and natives with the same level of education, this gap
diminishes only slightly to, respectively, 15 and 17 percentage points.
• Large differences exist between different areas of origin. Immigrants from most
English-speaking countries, like Jamaica, Oceania and Canada have the same level of
writing and reading fluency than British natives. Among the remaining groups, those
with the highest conditional and unconditional gap relative to natives are Pakistani
and Bangladeshi immigrants. For both groups the gap is above 20 percentage points in
reading as well as writing.
Social Indicators: Belonging
• The proportion of individuals who express a very strong feeling to belong to Britain is
14 percentage points higher among natives than among immigrants.
• Part of this difference is explained by differences in composition: after conditioning
on age and education, this gap reduces to 11 percentage points.
• Women have on average lower feelings to belong to Britain than men. Interestingly,
after conditioning on age and education, there are no significant immigrant-native
differences in belonging for men, while there remain considerable differences for
women.
• Immigrants from Ireland, India, Jamaica, and the Rest of New Commonwealth are not
different from natives in their feelings of belonging to Britain, irrespective of gender.
This holds for comparisons conditional, and unconditional on background
characteristics (like age and education).
• Immigrants from Pakistan, Bangladesh, and the Eastern African New Commonwealth
have stronger feelings of belonging to Britain than native –born British. For Pakistani
The Socio-Economic Integration of Migrants
Christian Dustmann and Tommaso Frattini 9
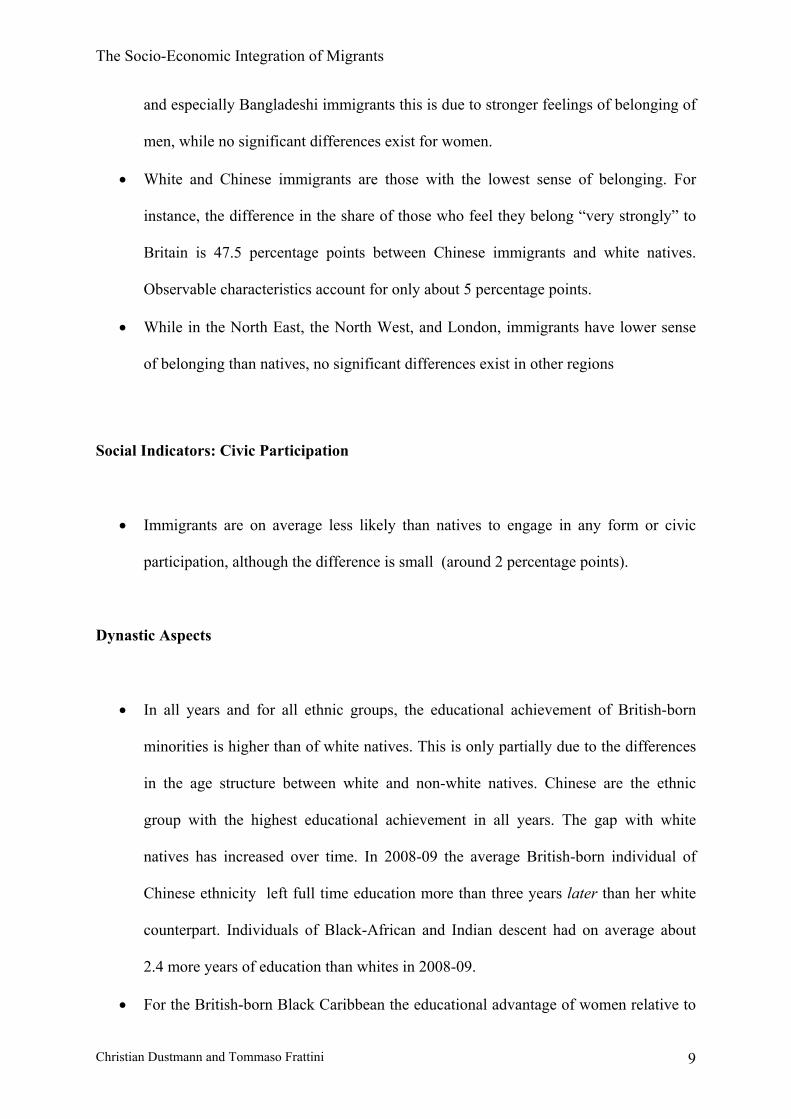
and especially Bangladeshi immigrants this is due to stronger feelings of belonging of
men, while no significant differences exist for women.
• White and Chinese immigrants are those with the lowest sense of belonging. For
instance, the difference in the share of those who feel they belong “very strongly” to
Britain is 47.5 percentage points between Chinese immigrants and white natives.
Observable characteristics account for only about 5 percentage points.
• While in the North East, the North West, and London, immigrants have lower sense
of belonging than natives, no significant differences exist in other regions
Social Indicators: Civic Participation
• Immigrants are on average less likely than natives to engage in any form or civic
participation, although the difference is small (around 2 percentage points).
Dynastic Aspects
• In all years and for all ethnic groups, the educational achievement of British-born
minorities is higher than of white natives. This is only partially due to the differences
in the age structure between white and non-white natives. Chinese are the ethnic
group with the highest educational achievement in all years. The gap with white
natives has increased over time. In 2008-09 the average British-born individual of
Chinese ethnicity left full time education more than three years later than her white
counterpart. Individuals of Black-African and Indian descent had on average about
2.4 more years of education than whites in 2008-09.
• For the British-born Black Caribbean the educational advantage of women relative to
The Socio-Economic Integration of Migrants
Christian Dustmann and Tommaso Frattini 10
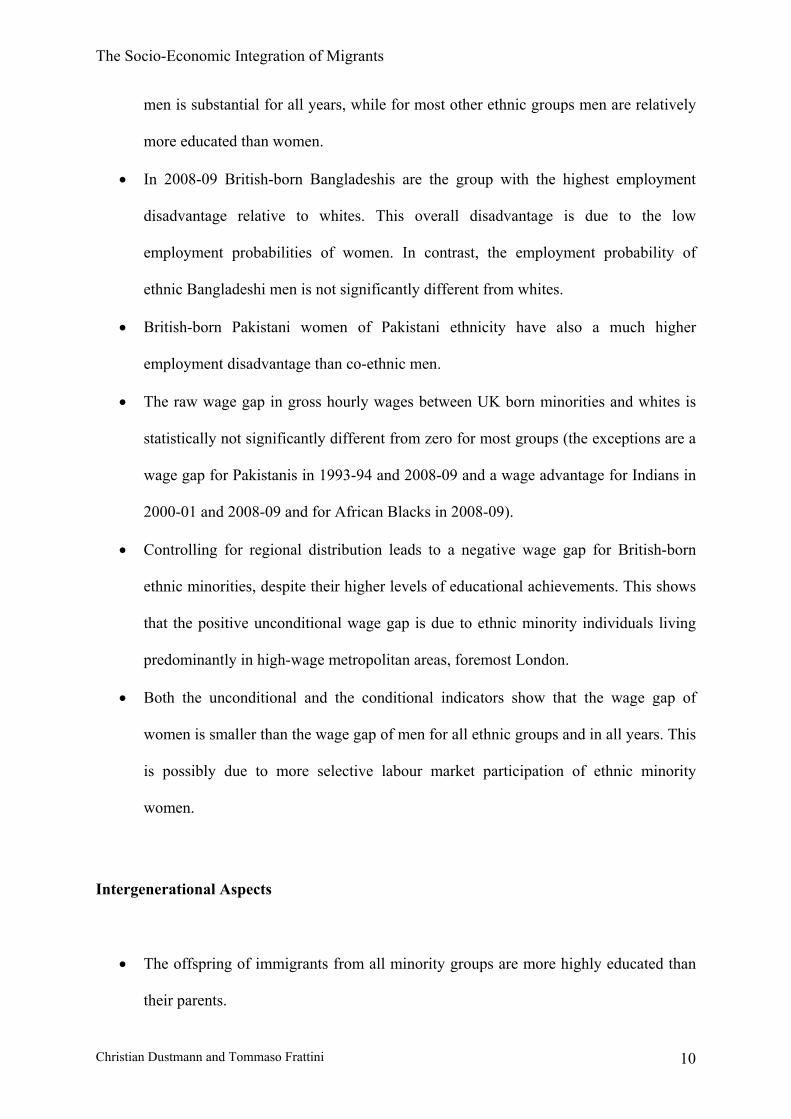
men is substantial for all years, while for most other ethnic groups men are relatively
more educated than women.
• In 2008-09 British-born Bangladeshis are the group with the highest employment
disadvantage relative to whites. This overall disadvantage is due to the low
employment probabilities of women. In contrast, the employment probability of
ethnic Bangladeshi men is not significantly different from whites.
• British-born Pakistani women of Pakistani ethnicity have also a much higher
employment disadvantage than co-ethnic men.
• The raw wage gap in gross hourly wages between UK born minorities and whites is
statistically not significantly different from zero for most groups (the exceptions are a
wage gap for Pakistanis in 1993-94 and 2008-09 and a wage advantage for Indians in
2000-01 and 2008-09 and for African Blacks in 2008-09).
• Controlling for regional distribution leads to a negative wage gap for British-born
ethnic minorities, despite their higher levels of educational achievements. This shows
that the positive unconditional wage gap is due to ethnic minority individuals living
predominantly in high-wage metropolitan areas, foremost London.
• Both the unconditional and the conditional indicators show that the wage gap of
women is smaller than the wage gap of men for all ethnic groups and in all years. This
is possibly due to more selective labour market participation of ethnic minority
women.
Intergenerational Aspects
• The offspring of immigrants from all minority groups are more highly educated than
their parents.

The Socio-Economic Integration of Migrants
Christian Dustmann and Tommaso Frattini 11
• UK-born minorities have on average a higher educational level than their white peers.
• The children of ethnic minorities have on average a higher employment rate than the
parent generation.
• Breaking these numbers down by ethnic groups shows that while the employment rate
of Caribbean immigrants born between 1933 and 1964 (and observed in 1979-1988)
was higher than that of white natives of the same cohort, the employment probability
of their UK-born descendants (observed in 2000-10) is lower than that of comparable
white native peers, but still higher than that of native born individuals of Pakistani and
Bangladeshi origin.
• Pakistanis and Bangladeshis of both the first and second generation have the lowest
employment rates, but this is largely due to the low labour market participation of
women from these communities.
Marriage, UK born minorities
• There is substantial heterogeneity between ethnic groups, and between genders within
the same ethnic group, in terms of marriage (or co-habiting) behaviour. Men and
women of Chinese background are those with the lowest share of intra-ethnic
marriages: 61% of UK-born Chinese men are married to (or co-habit with) a non-
ethnically Chinese partner, and the rate is even higher for women at 72%. Native born
Black Caribbean men have also low rates of endogamy, with 63% of them having a
non-Caribbean partner.
• Pakistani and Bangladeshi are by far the ethnic group with the highest endogamy rate,
which is particularly high among women of Bangladeshi background. Over 85% of
ethnic Pakistani men and women have a partner of the same ethnicity, while among

The Socio-Economic Integration of Migrants
Christian Dustmann and Tommaso Frattini 12
the Bangladeshi minority this share is 74% among men and 93% among women.
• A substantial fraction of ethnically Pakistani or Bangladeshi UK natives have a
partner that is a first generation immigrant from that country: 58% of British born
ethnically Pakistani men and 56% of British born ethnically Bangladeshi men have a
partner that is born in, respectively, Pakistan and Bangladesh. Among second and
higher generation Pakistani women, 66% have a Pakistani-born partner, while among
second and higher generation Bangladeshi women, this share rises to 83%.
Language, UK born minorities
• There is no overall difference in (self-assessed) reading and writing proficiency
between second generation immigrants and natives, conditional or unconditional on
age and education.
• Individuals of Indian and Pakistani descent have a higher likelihood than natives to
classify themselves as having a very good reading proficiency, and the difference
survives age and education controls. For writing, it is only individuals of Indian
descent who on average have a statistically significant higher (self-reported)
proficiency than natives.
Belonging and Civic Participation, UK born minorities
• There is no overall difference in responses to the question of how strongly individuals
feel to belong to Britain between second generation immigrants and natives.
• There is substantial heterogeneity among different ethnicities. While second
generation Black Caribbean are significantly less likely than white natives to feel they

The Socio-Economic Integration of Migrants
Christian Dustmann and Tommaso Frattini 13
belong to Britain, second generation Pakistanis are more likely than white natives to
feel strongly to belong to Britain. The analysis by gender shows that, in both cases, it
is women who drive the results, while no significant differences exist among second
generation men.
• There are no significant differences in civic participation between British born
minorities and White British born, neither overall nor by gender.
International Comparison: Employment
• In terms of its share of immigrants in the population, the UK ranges on rank 6 in the
group of 15 EU countries (old EU, excluding Luxembourg and including Norway).
• The employment disadvantage of immigrants in the UK is smaller than in most other
Central and Northern European countries.
• In almost all countries the conditional employment gap is larger than the
unconditional gap, which indicates that immigrants tend to be younger and with a
more favourable education structure than natives, and to settle in regions with higher
average employment rates.
• Immigrants and natives in the UK are less segregated across occupations than in most
other countries (except Finland, Portugal and Ireland). According to our estimates, in
the UK 10 percent of immigrants would have to change jobs to equalize the
occupational distribution of immigrants and natives. In comparison, in Germany this
share is 19 percent, and in France 12.2 percent.
International Comparison: Education of the Children of Immigrants

The Socio-Economic Integration of Migrants
Christian Dustmann and Tommaso Frattini 14
• Comparing PISA test score for 2006, in all countries, except for Australia, children of
immigrants born abroad (1.5 generation) at age 15 have lower reading scores than
their native peers. In the UK the gap is about 2.5 times larger than in Canada, but
smaller than in all other countries, and in particular lower than in all other European
countries.
• Once we control for the language spoken at home, test score disadvantage disappears
in the UK, Canada, Germany and the US, while it is substantially reduced in all other
countries, except for Spain.
• Controlling, in addition, for parental educational and occupational background, and
for family wealth, further reduces the gap for all countries.
• Those who are born in the host country (“Second generation”), on the other hand, are
less disadvantaged in all countries. Only in Germany and France the reading
achievement gap between second generation and native kids is significantly negative,
while it is positive in Australia.
• Controlling for language spoken at home and for family background, the gap
disappears in all countries. Moreover, in the UK (as well as in Australia and Canada)
second generation immigrants outperform the children of native-born parents after
controlling for differences in backgrounds.

The Socio-Economic Integration of Migrants
Christian Dustmann and Tommaso Frattini 15
1. Introduction and Background
Integration is a multi-facet concept, and the extent to which minority and immigrant groups
are integrated into a country, and perform in its economy, can be measured along different
dimensions (economic and non-economic) and according to different metrics (distance from
the native population or the majority group conditional/unconditional on education and other
observable characteristics)1. Each of these dimensions answers different questions. In the
following, we will discuss the various concepts that exist. We will then discuss how we will
operationalise these in our research, given the available data sources. In what follows we
refer to “immigrants” as individuals who are born in a country outside the UK.
The static perspective: Performance and integration of immigrants, benchmarked against the
native born population, can be measured at a particular point in time, e.g. in a particular year.
Such a “snapshot” compares indicators of economic performance in e.g. a particular year, for
respective resident populations. It would for instance compare the employment rate of
Britain’s different foreign born populations with the employment rate of the native born
population. Such comparisons are informative and, give appropriate answers to many policy
questions. For instance, for the question “How does Britain’s foreign born population
compare with the native born population in terms of average wages, wage dispersion, and
employment, for the years after 1990”, such analysis provides the answer. Technically, and
denoting the particular outcome of interest by y, the group of interest by the index j, and the
reference group (e.g. natives) by the index k, this amounts to computing E(yj)- E(yk), where E
is an expectations operator.
1 See e.g. Home Office (2004).
The Socio-Economic Integration of Migrants
Christian Dustmann and Tommaso Frattini 16
The conditional perspective: Performance of individuals and populations differs according to
their demographic and socio-economic characteristics. For instance, a particular immigrant
population may differ from the native-born population (and from other immigrant
populations) in terms of age- and education composition. We can then compute the difference
between two groups if they had the same demographic composition, or we can keep a subset
of characteristics constant. This answers questions like “What is the difference in wages
between immigrant group j and natives if immigrants had the same observable characteristics
than natives”. To answer that question requires construction of a “counterfactual”, as the
population means of outcomes of group j are typically not observed for the same set of
characteristics. Construction of this counterfactual is usually done by regression analysis. In
our notation above, and denoting the vector of demographic characteristics by X, this
“conditional” difference amounts to E(yj|Xk)- E(yk|Xk)2.
The dynamic perspective: Performance of immigrant groups changes over their life cycle. It
depends importantly on their initial skills, the way these skills are applicable to the host
country labour market, the pace at which these skills are transformed into host country
specific skills, and additional skills are acquired. It also depends on the “quality” and
“ability” of immigrant populations. While for instance immigrant populations tend to
underperform upon entry, due to initial difficulties to make optimal use of their skills (which
may for instance be due to language difficulties), immigrants usually overcome this initial
disadvantage. The speed of this “adjustment” process (again taking native individuals as a
reference group) may differ across immigrant populations, due to different incentives to
2 Studies like Blackaby et al. (2002), Heath et al. (2000), Heath and Cheung (2006), Heath and Yu (2005), and
Wadsworth (2003) address this with a focus on ethnic minorities rather than on immigrants.
The Socio-Economic Integration of Migrants
Christian Dustmann and Tommaso Frattini 17
acquire skills, or due to differences in the initial “ability” pool. Thus, the “dynamic” view
allows comparisons of immigrants with natives at different stages of their migration cycle. It
allows answering questions like “How do immigrants of group j compare with natives with
the same set of observable characteristics over their migration cycle”. 3
Again, the computation of the life cycle performance of immigrant groups is typically not
directly attainable from the data (as this would require information on complete migration
cycles of immigrant groups), and is thus based on construction of life cycle profiles, where
estimates are obtained by regression analysis. However, to answer questions about life cycle
comparisons in the absence of detailed life cycle information is more demanding and requires
(sometimes strong) assumptions. Most important is here the view one takes about return
migration. For instance, Dustmann and Weiss (2007) show that at least 30% of UK
immigrants leave the UK within the first 5 years after arrival. If this process of “return
migration” is selective, then this has serious consequences for the computation of life cycle
profiles of immigrants that are based on repeated cross-sectional data (like the British Labour
Force Survey). This may lead to serious miss-measurement in the construction of life cycle
profiles. Almost the entire literature ignores this problem.4
The dynastic perspective: Performance (and integration) of immigrant populations is a long-
term process that spans multiple generations. For instance, due to intergenerational
immobility, it is unlikely that the children of a particular immigrant group perform equally
well to native born peers if the particular immigrant group is lower educated, and low
3 A large literature in Economics is computing life cycle profiles of immigrant earnings. See, for instance,
Chiswick (1978), Borjas (1985, 1995), Friedberg (1992), Hu (2000), Lofstrom (2002), Long (1980), Lubotsky
(2007). 4 An early paper that discusses this problem, and shows (for the case of Germany) its relevance for estimation, is
Dustmann (1993). See the Appendix in Dustmann (2000) for details.
The Socio-Economic Integration of Migrants
Christian Dustmann and Tommaso Frattini 18
achieving in the labour market. The question is then whether, the children of immigrants
improve relative to their native born peers with the same parental background. Although there
has been some important progress in the literature on the dynastic aspects of immigrant
performance and integration, there are still many open questions.5 Even less is known about
intergenerational aspects of social integration, like the intergenerational transmission of
identity with home- and host country.6
5 See for instance Card et al. (2000) who find that children of immigrants tend to have higher education and
wages than children of natives. Borjas (2006) finds that on average the second generation of immigrants earns 5
to 10% more than their ancestors. Other studies on intergenerational mobility in immigrant communities
include, Chiswick (1977), Carliner (1980), Borjas (1992, 1993, 1994), Trejo (2003) and Smith (2003, 2006) for
the US, Chiswick and Miller (1988), Sweetman and Dicks (1999), Aydemir et al. (2009) for Canada, Chiswick
et al. (2005) for Australia, Cohen and Haberfeld (1998) and Deutsch et al. (2006) for Israel. Work for Europe
includes Gang and Zimmermann (2000), Riphahn (2003, 2005) for Germany, Husted et al. (2001) for Denmark,
Ours and Veenman (2003), Veenman and Ours (2004) for the Netherlands, and Rooth and Ekberg (2003),
Hammarstedt and Palme (2006) for Sweden, and Blackaby et al. (2005), Dustmann and Theodoropoulos (2010),
Dustmann, Frattini and Theodoropoulos (2011), Platt (2005, 2007) for the UK. Heath and McMahon (2005)
study social mobility of ethnic minorities in the UK. Algan et al (2010) perform a comparative study for France,
Germany, and the UK. 6 We are only aware of one study, Casey and Dustmann (2010)

The Socio-Economic Integration of Migrants
Christian Dustmann and Tommaso Frattini 19
2. Data Sources
For the analysis in this report, we will be using different micro-data sources, which we briefly
describe in this section. There are four main data sources we use in this analysis: the UK
Labour Forces Survey, the Citizenship Survey, the EU Labour Force Survey, and PISA.
2.1 The UK Labour Force Survey
The Labour Force Survey (LFS) is a sample survey of households living at private addresses
in Great Britain/UK. Its purpose is to provide information on the UK labour market that can
then be used to develop, manage, evaluate and report on labour market policies. It is
conducted by the Office for National Statistics. Other than the Census, the LFS is the only
comprehensive source of information about all aspects of the labour market. As from 1992
the LFS data are collected and published quarterly. Between 1984 and 1991 the survey was
carried out yearly. Between 1973 and 1983 it was carried out biannually. The 1973 data are
not publicly available. Also, the 1975 and 1977 waves did not collect data on ethnicity, and
are therefore not suitable for the current project. The current quarterly LFS has been running
in Northern Ireland since December 1994. From 1984 to 1994 the Northern Ireland LFS was
carried out annually and from 1973 to 1983 bi-annually. The ethnicity question was
introduced in the Northern Ireland LFS in 1997. Since 1992 the sample size is about 60,000
household in GB in every quarter, representing about 0.2% of the population. The LFS
collects information on respondents' personal circumstances (including ethnicity, nationality,
country of birth, and year of arrival in the UK if applicable) and their labour market status
during a reference period of one to four weeks immediately prior to the interview. As of the
first quarter 2010 the LFS should also include an “immigration route” question, which would
allow us to differentiate immigrants according also to their entry route (e.g. asylum seekers,
work, study, family reunification).

The Socio-Economic Integration of Migrants
Christian Dustmann and Tommaso Frattini 20
2.2 The Citizenship Survey
The Citizenship Survey is a household survey of adults (aged 16 and over) in England and
Wales. It asks for views on a range of topics, including participation in voluntary activity and
charitable giving. It was originally called the Home Office Citizenship Survey, and carried
out biannually in 2001, 2003 and 2005. Since 2007, the survey has moved to a continuous
design, and changed its name to Citizenship Survey. Each wave surveys 10,000 adults, with
an additional boost sample of 5,000 people from minority ethnic groups. The latest survey
year currently available is 2007.
The Citizenship Survey provides information about identity and social networks, views about
the local area, participation in local decision–making, feelings of trust and influence,
participation in volunteering and civic activities, perceptions of racial and religious prejudice.
It also has demographic (including country of birth or both parents and ethnicity) and
employment information.
2.3 The European Union Labour Force Survey (EULFS)
The European Union Labour Force Survey (EULFS) is conducted in the 27 Member States of
the European Union and 2 countries of the European Free Trade Association (EFTA). It is a
large quarterly household sample survey of people aged 15 and over as well as on persons
outside the labour force. In all of the countries providing quarterly data the quarterly sample
is spread uniformly over all weeks of the quarter. The national statistical institutes are
responsible for selecting the sample, preparing the questionnaires, conducting the direct
interviews among households, and forwarding the results to Eurostat in accordance with the
common coding scheme.
The data collection covers in total the years 1983 to 2008 (to be released in December 2009),
though not all countries are included in all years. The Labour Force Surveys are conducted by
the National Statistical Institutes across Europe and are centrally processed by Eurostat.

The Socio-Economic Integration of Migrants
Christian Dustmann and Tommaso Frattini 21
In spring 2002, the LFS sample size across the EU was about 1.500 thousands of individuals.
Every year since 1999 the EULFS is augmented with an annually changing “ad-hoc module”.
In 2008, the ad-hoc module was on “Labour market situation of migrants and their immediate
descendants”, providing information on - among other things - parents’ country of birth and
reasons for entering the host country. Unfortunately, the current release of the EU LFS does
not contain the 2008 ad-hoc module yet, and neither has information on wages.
2.4 Programme for International Student Assessment (PISA) database
PISA is an internationally standardised assessment that was jointly developed by
participating economies and administered to 15-year-olds in schools. Four assessments have
so far been carried out (in 2000, 2003, 2006 and 2009). Data for the 4th assessment (2009)
were not yet available when this report was written. Tests are typically administered to
between 4,500 and 10,000 students in each country. In 2006, 57 countries participated in the
assessment. Beside test scores in reading, mathematics, and science, the PISA data have also
information on parents’ and children’s country of birth, as well as on a number of household
and school variables. In our analysis, we use 2006 PISA scores.

The Socio-Economic Integration of Migrants
Christian Dustmann and Tommaso Frattini 22
3. Background: Immigrants in the UK
Throughout this report we define “immigrants” as “foreign born”, unless otherwise specified.
Immigrants constitute a sizable fraction of the total working age population in the UK, and
their share has been growing over the last twenty years.
Table 3.1 shows, in row 1, that in 1993-94 immigrants represented 6.9% of the total working
age population, while their share has increased to 7.9% in 2000-01, and to 11.4% in 2008-09.
The composition of the foreign born population in the UK has also changed considerably
over time, as reported in rows 2-10. While in 1993-94 immigrants from Western Europe
made up over one third of the total immigrant population, their share has decreased over time,
and reached 22% in 2008-09. At the same time, the share of Eastern European immigrants
has dramatically increased, from 3% in 1993-94, to 3.6% in 2000-01, and 13.1% in 2008-09,
after the EU Eastern enlargement of 2004. As regards other areas of origin, the share of
immigrants from the Americas has slightly declined (from 11.7% in the early years to 9% in
2008-09), while the share of African immigrants has increased, from 14.8% in 1993-94 to
18.9% of the immigrant population in 2008-09. Similarly, the share of immigrants from the
Indian Sub-Continent has been decreasing, from 20.7% in 1993-94 to 18.6% in 2008-09,
while the share of East Asian immigrants has at the same time gone from 8.7% to 10.9%.
Immigrants and natives have, over the entire period, markedly different regional distributions,
as we show in Table 3.2. The most striking difference between immigrants and natives is the
share residing in London: while the share of natives living in London was just above 10% in
1993-94 and 2000-01, and just below 10% in 2008-09, 40% of working age immigrants were
living in London in 1993-94, 43.3% in 2000-01, and 38.7% in 2008-09. Although immigrants
are always disproportionately more concentrated in London than natives, there is some
evidence of an increased dispersion in more recent years.

The Socio-Economic Integration of Migrants
Christian Dustmann and Tommaso Frattini 23
In this report we do not only analyse immigrants, but also their British born descendants. In
particular, we analyse in detail the economic and non-economic integration of individuals of
non-white ethnicity born in the UK, and who are therefore the offspring of non-white
immigrants. Table 3.3 shows that the ethnic diversity of the British-born population has
increased over the last twenty years. In 1993-94 over 97% of the British born working age
population was white, while in 2000-01 whites constitute 96.1% of all natives, and in 2008-
09, their share has reduced to 94.2%. Most of the non-white natives are (averaged over all
years), of Black-Caribbean, Indian, or Pakistani descent. In recent years, Indian and Pakistani
British born represent each over 1% of the British-born working age population.
The regional distribution of native minorities, which we report in Table 3.4, is similar to that
of immigrants: in 2008-09, 9.2% of white natives, but 42.2% of non-white natives was living
in London. As in the case of immigrants, there is some evidence of an increased dispersion of
ethnic minorities across UK regions over time: While in 1993-94, 46.3% of non-white natives
lived in London, this number increased to 49.1 % in 2000/01, but decreased to 42.2 % in
2008/09.

The Socio-Economic Integration of Migrants
Christian Dustmann and Tommaso Frattini 24
4. Integration and Performance of First Generation Immigrants in the UK
We now describe and analyse the economic and non-economic integration and performance
of first generation immigrants in the UK.
We will use regression analysis to develop static and conditional indicators of immigrant
performance in the UK. We will look at both economic and non-economic outcomes, at
different points in time. All our analyses use as a benchmark the performance of natives. Our
indicators can therefore be interpreted as the gap between immigrants and natives for that
specific outcome.
4.1 Economic integration
To analyse the economic performance of immigrants, we consider the following outcomes:
• Educational attainment
• Employment7
• Wages
For each of these outcomes we construct overall indicators, as well as indicators broken down
by gender, countries of origin, region of residence in the UK. We analyse three points in time,
1993-1994, 2000-2001 and 2008-09.
4.1.1 Education
Comparing the education of immigrants and natives is not always straightforward because of
differences in education systems across countries. The UK LFS classifies all educational 7 We have also analysed unemployment and labour market participation. As these two outcomes draw a very
similar picture to that emerging from analysis of employment, we do not report them here for the sake of
brevity.
The Socio-Economic Integration of Migrants
Christian Dustmann and Tommaso Frattini 25
qualifications obtained abroad as “other qualifications”, so that the highest qualifications
achieved cannot be exactly compared between immigrants and natives, in particular when
immigrants come from countries with different education systems (see the Appendix of
Manacorda, Manning and Wadsworth (2011) for a discussion).
In order to assess the immigrant-native gap in educational attainments, we therefore use the
LFS information on the age at which individuals left full time education. One possible
problem is that individuals in different countries may start education at slightly different ages,
so that the age at which full time education is concluded may give slightly different
indications for different populations about the total number of years of education obtained.
We ignore that problem here. Based on this information, Figure 4.1.1 summarises the native
immigrant-gap for the age at which individuals left full time education, for all immigrants
(leftmost columns), and when we break down immigrants by countries of origin, at three
points in time: 1993-94, 2000-01, and 2008-09. For all the three periods we consider,
immigrants in the UK are significantly better educated than natives. Further, over time the
educational gap between immigrants and natives appears to increase slightly. The largest
differences are for immigrants from Eastern Europe and the Middle East, while the smallest
differences are for individuals from the Indian sub-continent. This finding is quite
remarkable, as immigrants in many other European countries are lower educated than natives
– see our analysis in Section 6.
Some of the differences in education could be explained by immigrants and natives having a
different age composition. Thus, if overall educational attainment increases over time, one
reason for the high level of education in the immigrant population may simply be that
immigrants are younger on average. In Table 4.1.1 we report in even columns the data on
which Figure 4.1.1 is based (the unconditional education gap), and in odd columns the
conditional indicator whereby we keep the age composition of the immigrant and the native

The Socio-Economic Integration of Migrants
Christian Dustmann and Tommaso Frattini 26
population constant (we use regression analysis to compute these). We report the standard
errors in parenthesis, and we star the coefficients according to their significance level, where
the null hypothesis is that the respective coefficient equals zero. One, two or three stars mean
that this hypothesis can be rejected at the 5, 1 or 0.1 percent level.
In 1993-94 the average immigrant left full time education 1.2 years later than the average
native, while the gap increases to 1.5 in 2000-2001 and to 1.8 in 2008-09. Controlling for the
age structure of the immigrant population does not affect the results, except in 2008-09. In
this latter period, accounting for differences in the age structure between immigrants and
natives reduces the gap to 1.6 years.
There is also substantial heterogeneity in education gaps across immigrants from different
origins, as rows 2 to 10 demonstrate. In 2008-09 the most highly educated immigrant group,
relative to natives, were Eastern European immigrants: they left full time education on
average 2.6 years later than UK natives, or 2.2 years later when we control for the age
structure. Remarkably, the smallest gap in school-leaving age is between immigrants from the
Indian Sub-continent and UK natives: 1 year in 2008-09, up from 0.09 years in 1993-94 and
0.3 years in 2000-01. The gap in age at which individuals left full time education tends to
close over time for Eastern European and Middle Eastern immigrants, which may reflect
changes in the composition of these immigrant groups. Important to note is however that the
age at which individuals left full time education is for no immigrant group smaller than for
the white native born. Thus, we can conclude from these numbers that immigrants to the UK
are, and have been over the last two decades, well educated, and possibly have higher
educational attainments than natives in the same age groups.
Table 4.1.2 shows that the gap in years of education is higher for immigrant men than for
immigrant women, but that the gap for women has increased faster over the last three
decades. This suggests that immigrant women tend to become relatively more educated.

The Socio-Economic Integration of Migrants
Christian Dustmann and Tommaso Frattini 27
Considering again different countries of origin reveals that Western European women in the
initial periods, and Eastern European women in all periods have a higher educational
advantage relative to natives than men. Conversely, the educational gap between women
from the Indian Sub-Continent and native women is negative in the initial years, although it
closes over time: while in 1993-94 the average woman from the Indian Sub-Continent has 0.9
less years of education than native women, in 2008-09 the gap turns positive, at 0.3 years.
In Table 4.1.3 we use a different classification. Instead of country origin groups, we
distinguish immigrants by ethnic origin and report the educational gap between (first-
generation) immigrants of these different ethnic groups and white natives. Some clear
differences emerge across different ethnicities. Black African immigrants are the most highly
educated, relative to white natives This is the case for all years we consider, although the gap
is decreasing over time. Conversely, the positive education gap between white immigrants
and white natives has increased by slightly less than one year between 1993-94 and 2008-09.
Likewise, the gap for ethnic Chinese immigrants has increased by more than one year over
the same time period.
Interesting is the education gap between white UK natives and immigrants from India,
Pakistan, and Bangladesh. While Indians in 2008-09 have left full time education on average
2.1 years later than natives (up from 1.4 in 2003-04), Pakistanis and Bangladeshis perform
less well. The gap in educational achievement for Pakistani immigrants is closing over time:
from having one year less of schooling than white natives in 1993-94, to -0.6 years in 2000-
01, to not being significantly different in 2008-09. However, accounting for the differences in
age structure increases the educational disadvantage of ethnic Pakistanis, which becomes
negative and statistically significant also in 2008-09, suggesting that it is mainly younger
The Socio-Economic Integration of Migrants
Christian Dustmann and Tommaso Frattini 28
individuals who from these groups who have changed the balance in relative educational
attainment. The gap reduces over time for ethnic Bangladeshis as well, although less rapidly
than for Pakistanis: in 2008-09 ethnic Bangladeshis had on average 0.2 years less education
than white UK natives; the gap increases to a disadvantage of 0.5 years when we account for
differences in the age structure.
Table 4.1.4 shows that the gap in educational achievements of Bangladeshis and Pakistanis is
due to the lower educational level of women in these communities. Although this gap is
reducing over time, in 2008-09, Pakistani women had about one year less education than
white native women, while the gap is 0.8 years for Bangladeshi women. Conversely, men
from these ethnic groups have a positive education gap, compared to white British born men.
Interestingly, there is considerable heterogeneity in immigrant-native education gaps across
UK regions, as Table 4.1.5 shows. In 2008-09, Scotland and the North East are the regions
with the highest education differentials: immigrants in these regions have left full time
education on average 2.4 and 2.7 years later than natives, respectively. On the other hand, in
the West Midlands and in London the educational gap is less than one year. The West
Midlands have experienced a considerable growth in the relative immigrant-native
qualification: in 1993-94 the education gap was -0.25, it was not statistically significant in
2000-01, and turns to positive in 2008-09.
4.1.2 Employment
We now turn to the differences in employment rates (defined as the ratio of individuals with a
job over individuals in the working age population, excluding those in full time education)
between immigrants and natives. As before, we first construct static indicators of
employment, which can be interpreted as the percentage point difference in the employment
The Socio-Economic Integration of Migrants
Christian Dustmann and Tommaso Frattini 29
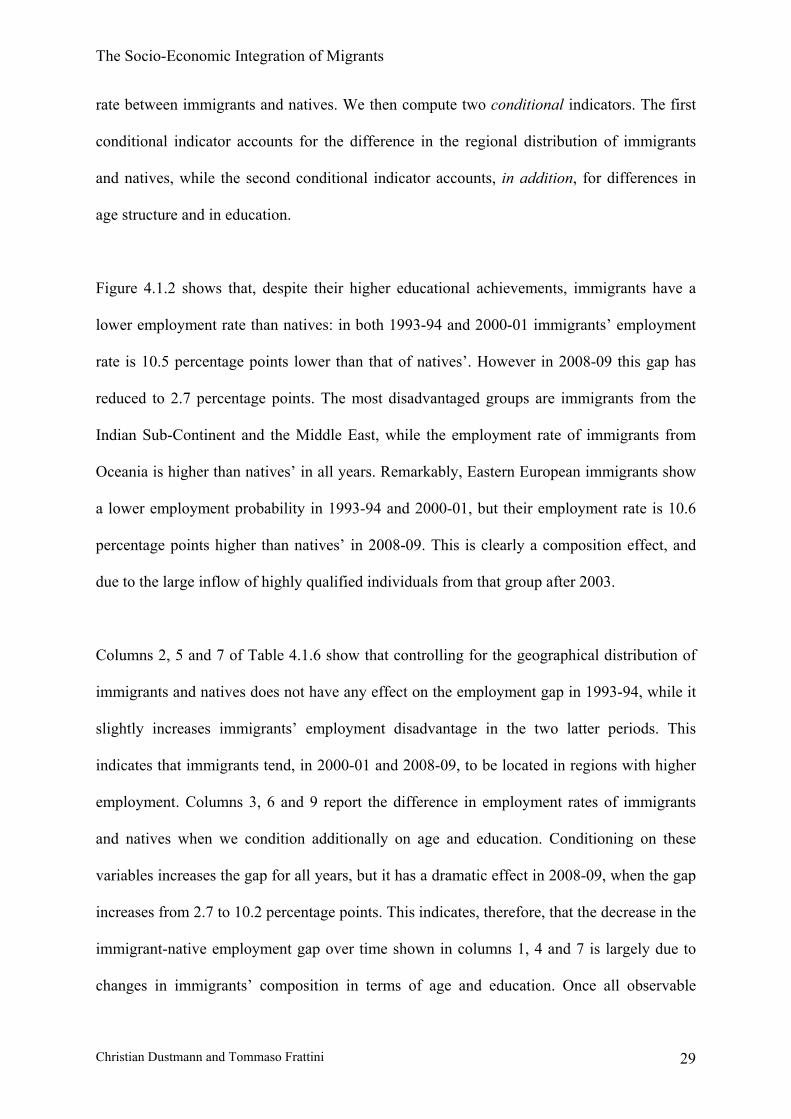
rate between immigrants and natives. We then compute two conditional indicators. The first
conditional indicator accounts for the difference in the regional distribution of immigrants
and natives, while the second conditional indicator accounts, in addition, for differences in
age structure and in education.
Figure 4.1.2 shows that, despite their higher educational achievements, immigrants have a
lower employment rate than natives: in both 1993-94 and 2000-01 immigrants’ employment
rate is 10.5 percentage points lower than that of natives’. However in 2008-09 this gap has
reduced to 2.7 percentage points. The most disadvantaged groups are immigrants from the
Indian Sub-Continent and the Middle East, while the employment rate of immigrants from
Oceania is higher than natives’ in all years. Remarkably, Eastern European immigrants show
a lower employment probability in 1993-94 and 2000-01, but their employment rate is 10.6
percentage points higher than natives’ in 2008-09. This is clearly a composition effect, and
due to the large inflow of highly qualified individuals from that group after 2003.
Columns 2, 5 and 7 of Table 4.1.6 show that controlling for the geographical distribution of
immigrants and natives does not have any effect on the employment gap in 1993-94, while it
slightly increases immigrants’ employment disadvantage in the two latter periods. This
indicates that immigrants tend, in 2000-01 and 2008-09, to be located in regions with higher
employment. Columns 3, 6 and 9 report the difference in employment rates of immigrants
and natives when we condition additionally on age and education. Conditioning on these
variables increases the gap for all years, but it has a dramatic effect in 2008-09, when the gap
increases from 2.7 to 10.2 percentage points. This indicates, therefore, that the decrease in the
immigrant-native employment gap over time shown in columns 1, 4 and 7 is largely due to
changes in immigrants’ composition in terms of age and education. Once all observable
The Socio-Economic Integration of Migrants
Christian Dustmann and Tommaso Frattini 30
characteristics are conditioned out, no immigrant group displays any employment advantage
with respect to natives (the only exception is Oceania in 2000-01). On the contrary,
immigrants from all countries of origin are less likely to be employed than natives who live in
the same region and have the same age and education (again, with the only exception of
immigrants from Oceania).
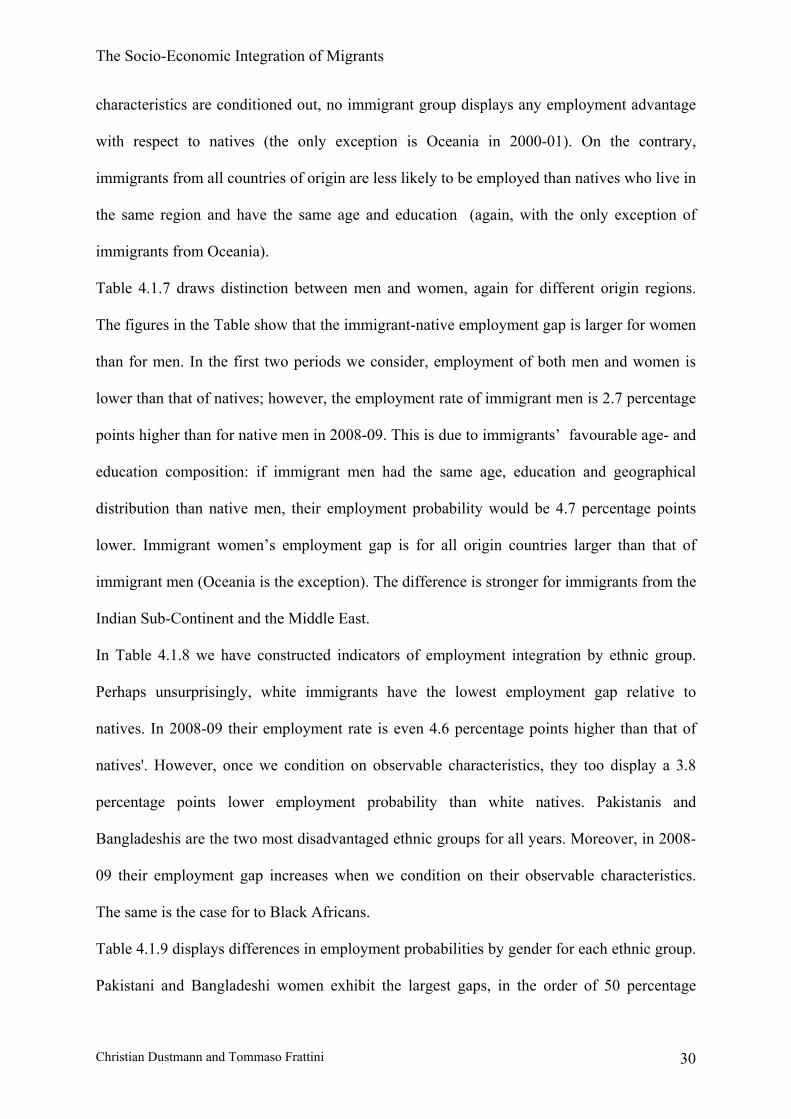
Table 4.1.7 draws distinction between men and women, again for different origin regions.
The figures in the Table show that the immigrant-native employment gap is larger for women
than for men. In the first two periods we consider, employment of both men and women is
lower than that of natives; however, the employment rate of immigrant men is 2.7 percentage
points higher than for native men in 2008-09. This is due to immigrants’ favourable age- and
education composition: if immigrant men had the same age, education and geographical
distribution than native men, their employment probability would be 4.7 percentage points
lower. Immigrant women’s employment gap is for all origin countries larger than that of
immigrant men (Oceania is the exception). The difference is stronger for immigrants from the
Indian Sub-Continent and the Middle East.
In Table 4.1.8 we have constructed indicators of employment integration by ethnic group.
Perhaps unsurprisingly, white immigrants have the lowest employment gap relative to
natives. In 2008-09 their employment rate is even 4.6 percentage points higher than that of
natives'. However, once we condition on observable characteristics, they too display a 3.8
percentage points lower employment probability than white natives. Pakistanis and
Bangladeshis are the two most disadvantaged ethnic groups for all years. Moreover, in 2008-
09 their employment gap increases when we condition on their observable characteristics.
The same is the case for to Black Africans.
Table 4.1.9 displays differences in employment probabilities by gender for each ethnic group.
Pakistani and Bangladeshi women exhibit the largest gaps, in the order of 50 percentage
The Socio-Economic Integration of Migrants
Christian Dustmann and Tommaso Frattini 31
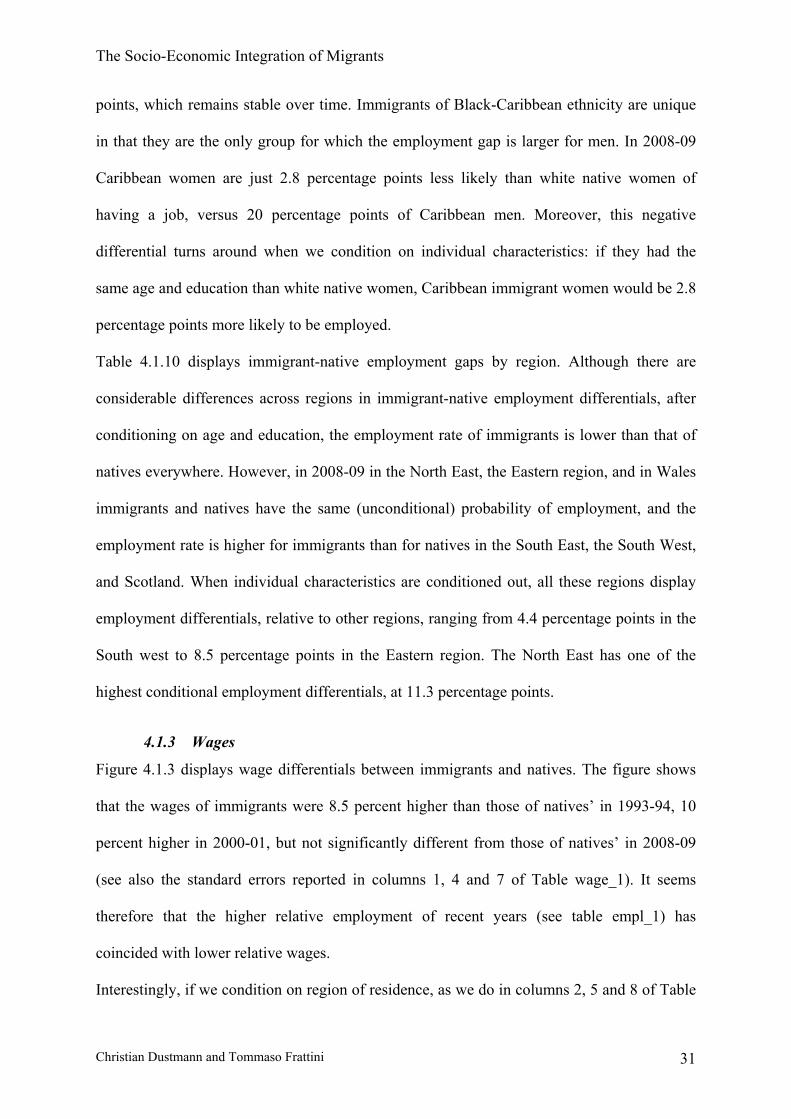
points, which remains stable over time. Immigrants of Black-Caribbean ethnicity are unique
in that they are the only group for which the employment gap is larger for men. In 2008-09
Caribbean women are just 2.8 percentage points less likely than white native women of
having a job, versus 20 percentage points of Caribbean men. Moreover, this negative
differential turns around when we condition on individual characteristics: if they had the
same age and education than white native women, Caribbean immigrant women would be 2.8
percentage points more likely to be employed.
Table 4.1.10 displays immigrant-native employment gaps by region. Although there are
considerable differences across regions in immigrant-native employment differentials, after
conditioning on age and education, the employment rate of immigrants is lower than that of
natives everywhere. However, in 2008-09 in the North East, the Eastern region, and in Wales
immigrants and natives have the same (unconditional) probability of employment, and the
employment rate is higher for immigrants than for natives in the South East, the South West,
and Scotland. When individual characteristics are conditioned out, all these regions display
employment differentials, relative to other regions, ranging from 4.4 percentage points in the
South west to 8.5 percentage points in the Eastern region. The North East has one of the
highest conditional employment differentials, at 11.3 percentage points.
4.1.3 Wages
Figure 4.1.3 displays wage differentials between immigrants and natives. The figure shows
that the wages of immigrants were 8.5 percent higher than those of natives’ in 1993-94, 10
percent higher in 2000-01, but not significantly different from those of natives’ in 2008-09
(see also the standard errors reported in columns 1, 4 and 7 of Table wage_1). It seems
therefore that the higher relative employment of recent years (see table empl_1) has
coincided with lower relative wages.
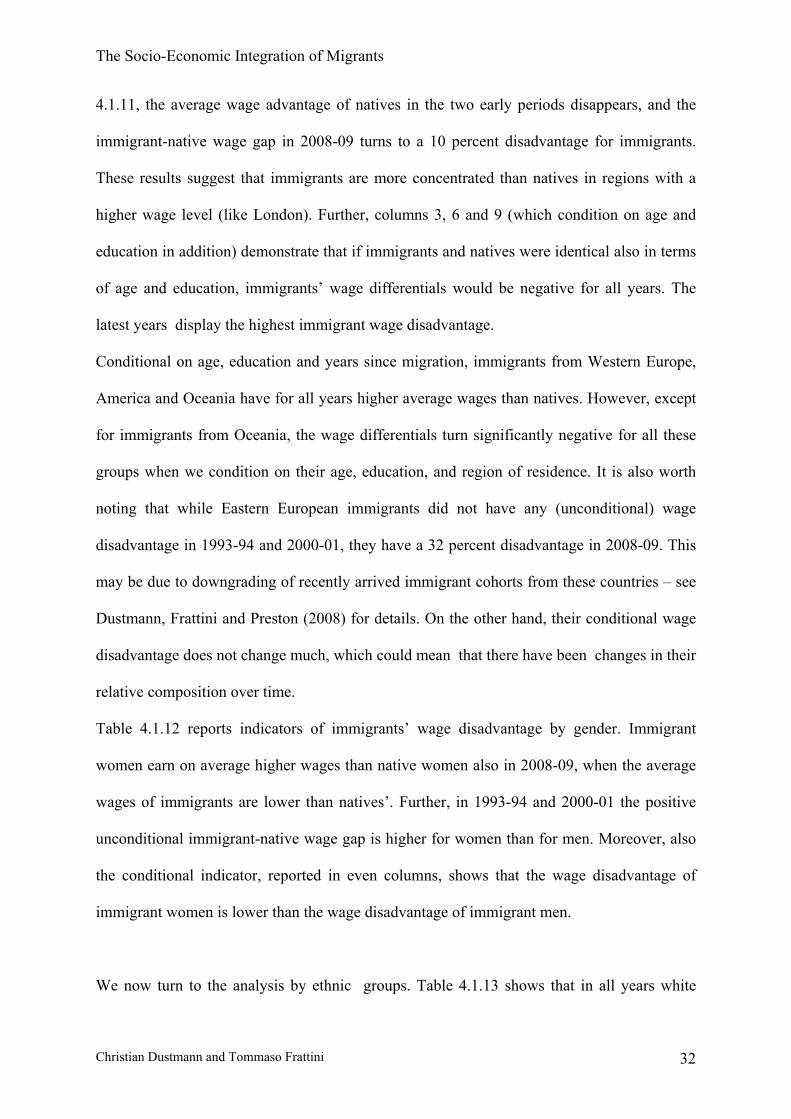
Interestingly, if we condition on region of residence, as we do in columns 2, 5 and 8 of Table
The Socio-Economic Integration of Migrants
Christian Dustmann and Tommaso Frattini 32
4.1.11, the average wage advantage of natives in the two early periods disappears, and the
immigrant-native wage gap in 2008-09 turns to a 10 percent disadvantage for immigrants.
These results suggest that immigrants are more concentrated than natives in regions with a
higher wage level (like London). Further, columns 3, 6 and 9 (which condition on age and
education in addition) demonstrate that if immigrants and natives were identical also in terms
of age and education, immigrants’ wage differentials would be negative for all years. The
latest years display the highest immigrant wage disadvantage.
Conditional on age, education and years since migration, immigrants from Western Europe,
America and Oceania have for all years higher average wages than natives. However, except
for immigrants from Oceania, the wage differentials turn significantly negative for all these
groups when we condition on their age, education, and region of residence. It is also worth
noting that while Eastern European immigrants did not have any (unconditional) wage
disadvantage in 1993-94 and 2000-01, they have a 32 percent disadvantage in 2008-09. This
may be due to downgrading of recently arrived immigrant cohorts from these countries – see
Dustmann, Frattini and Preston (2008) for details. On the other hand, their conditional wage
disadvantage does not change much, which could mean that there have been changes in their
relative composition over time.
Table 4.1.12 reports indicators of immigrants’ wage disadvantage by gender. Immigrant
women earn on average higher wages than native women also in 2008-09, when the average
wages of immigrants are lower than natives’. Further, in 1993-94 and 2000-01 the positive
unconditional immigrant-native wage gap is higher for women than for men. Moreover, also
the conditional indicator, reported in even columns, shows that the wage disadvantage of
immigrant women is lower than the wage disadvantage of immigrant men.
We now turn to the analysis by ethnic groups. Table 4.1.13 shows that in all years white
The Socio-Economic Integration of Migrants
Christian Dustmann and Tommaso Frattini 33
immigrants earn on average higher wages than white natives. This is due to their location
choices (as shown by columns 2, 5 and 8) and to their age-education composition (see
columns 3, 6 and 9). In 2008-09, the foreign-born ethnic minorities with the higher positive
wage differential relative to white natives are Indians and Chinese, with average wages being
almost 8 percent higher than natives’. Pakistani and Bangladeshi immigrants, on the other
hand, are those with the highest wage disadvantage. Table 4.1.14, which reports the wage gap
between immigrants from different ethnicities and white natives, confirms these differences.
It is interesting to notice though that the wage differentials of Bangladeshis and Pakistanis are
much higher among men than among women, which is probably an indication of more
selective labour market participation among women.
As regards wage differentials, there are considerable differences over time and across
regions, as displayed in table 4.1.15. In 1993-94, only immigrants in London are earning on
average less than natives, while immigrants in Wales and Scotland were earning significantly
more. In all other regions there are no significant unconditional wage differences.
However, in most regions, once age and education are controlled for (in other words, one we
compare immigrants with natives who are identical with respect to age and measured
education), wage differentials turn negative, and become non-positive also in Wales and
Scotland. In 2008-09 on the other hand, immigrants-natives wage differentials are
significantly negative in all regions except for the North East and the South east, ranging
from -16.5 percent in the North West to -3.8 percent in the Eastern region. The conditional
differentials are instead negative for all regions, and range between -12.7 percent in the South
East and 26.8 percent in the North West.
4.2 Economic Integration over Time
In this section, we study the evolution of the same outcomes as above (education,
employment, and wages), but we distinguish between seven different immigrant cohorts,
The Socio-Economic Integration of Migrants
Christian Dustmann and Tommaso Frattini 34
defined on the basis of their years of first arrival in the UK: 1980/1983, 1984/1987,
1988/1991, 1992/1995, 1996/1999, 2000/2003, and 2004/2007. In the previous section, our
analysis showed how immigrant populations compared to UK born individuals at three
different points in time. We now follow the same cohorts over time, which adds a dynamic
component, as it allows assessing the way immigrant cohorts improve during their migration
history in the UK. Of course, based on the data we have available, we are not able to assess
changes in cohort outcomes due to out-migration (see Dustmann and Weiss 2007 for an
assessment). However, the estimates we provide are – in our view – important from a policy
perspective, as they speak to the question “how does the performance of those immigrants
who stay in the UK, and who arrive in year Y, change over time?” Our analysis also allows
assessing the differences in immigrant quality (or selective out-migration), as we compare
immigrant cohorts that arrived at different time periods. As before, our reference point will
always be the native populations. And – again as before – we provide raw differentials, and
differentials conditional on a set of observable characteristics, like age and education.
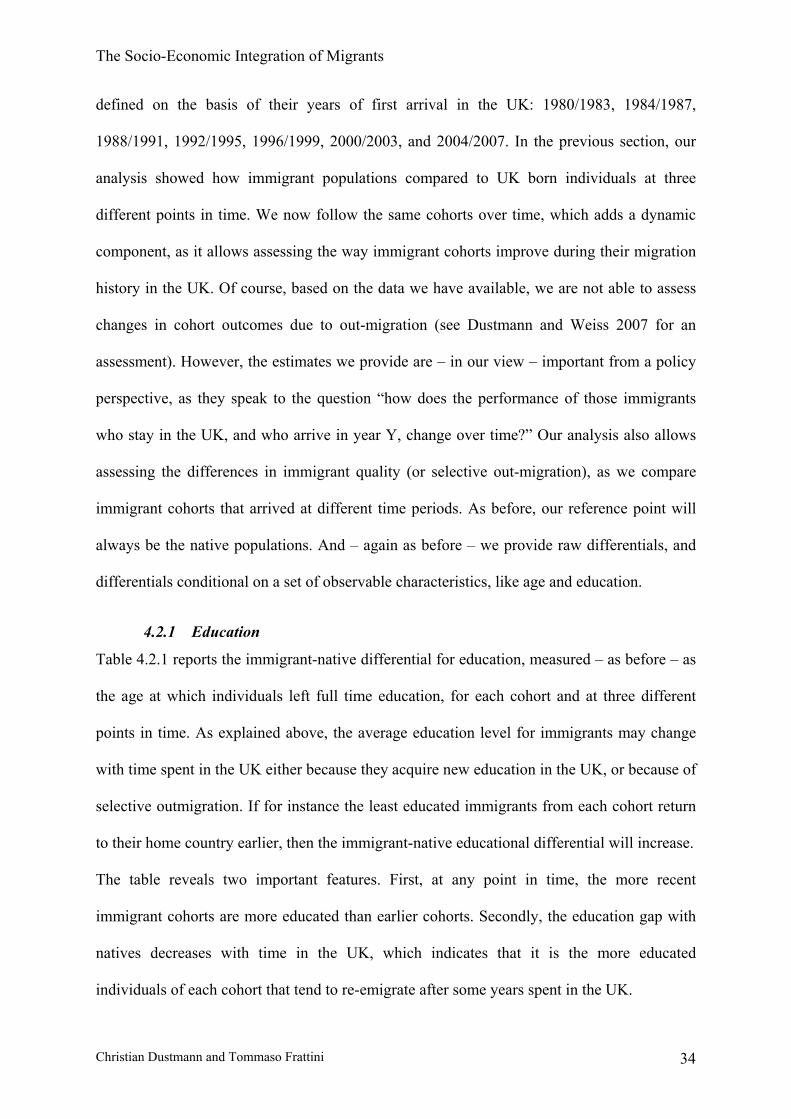
4.2.1 Education
Table 4.2.1 reports the immigrant-native differential for education, measured – as before – as
the age at which individuals left full time education, for each cohort and at three different
points in time. As explained above, the average education level for immigrants may change
with time spent in the UK either because they acquire new education in the UK, or because of
selective outmigration. If for instance the least educated immigrants from each cohort return
to their home country earlier, then the immigrant-native educational differential will increase.
The table reveals two important features. First, at any point in time, the more recent
immigrant cohorts are more educated than earlier cohorts. Secondly, the education gap with
natives decreases with time in the UK, which indicates that it is the more educated
individuals of each cohort that tend to re-emigrate after some years spent in the UK.
The Socio-Economic Integration of Migrants
Christian Dustmann and Tommaso Frattini 35
This positively selected outmigration is visible for all origin groups except for immigrants
from Oceania, as we show in Table A1 in the Appendix. In the case of immigrants from
Oceania, the educational gap with natives increases over time.
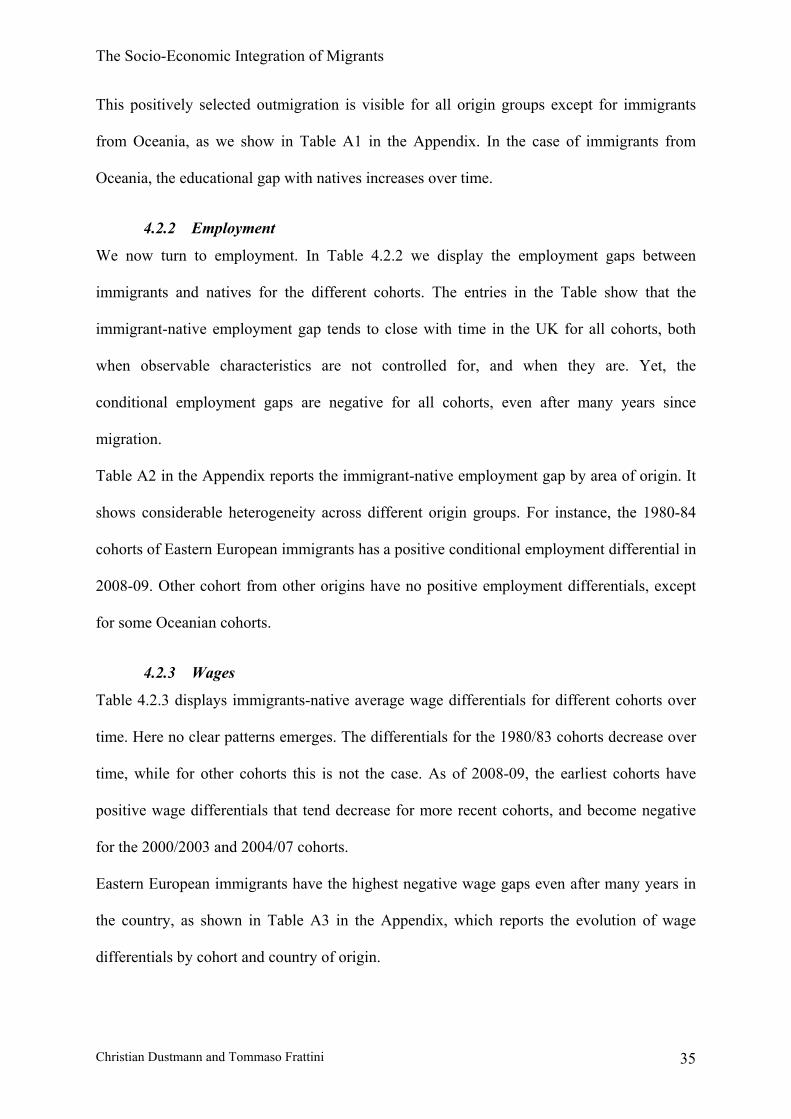
4.2.2 Employment
We now turn to employment. In Table 4.2.2 we display the employment gaps between
immigrants and natives for the different cohorts. The entries in the Table show that the
immigrant-native employment gap tends to close with time in the UK for all cohorts, both
when observable characteristics are not controlled for, and when they are. Yet, the
conditional employment gaps are negative for all cohorts, even after many years since
migration.
Table A2 in the Appendix reports the immigrant-native employment gap by area of origin. It
shows considerable heterogeneity across different origin groups. For instance, the 1980-84
cohorts of Eastern European immigrants has a positive conditional employment differential in
2008-09. Other cohort from other origins have no positive employment differentials, except
for some Oceanian cohorts.
4.2.3 Wages
Table 4.2.3 displays immigrants-native average wage differentials for different cohorts over
time. Here no clear patterns emerges. The differentials for the 1980/83 cohorts decrease over
time, while for other cohorts this is not the case. As of 2008-09, the earliest cohorts have
positive wage differentials that tend decrease for more recent cohorts, and become negative
for the 2000/2003 and 2004/07 cohorts.
Eastern European immigrants have the highest negative wage gaps even after many years in
the country, as shown in Table A3 in the Appendix, which reports the evolution of wage
differentials by cohort and country of origin.
The Socio-Economic Integration of Migrants
Christian Dustmann and Tommaso Frattini 36
4.3 Non-Economic Integration
In this section we analyse the “non-economic” integration of first-generation immigrants in
the UK, based on the pooled 2007 and 2008 Citizenship Surveys. We study the non-economic
integration of immigrants in terms of:
• Fluency in English
• Belonging
• Civic participation
We form slightly different origin groups, as the Citizenship Survey reports country of origin
differently from the LFS.
4.3.1 Fluency in English
The Citizenship Survey contains information on self-reported English fluency in speaking,
writing and reading, classified as "poor", "below average", "fairly good" and "very good".
We have reclassified all variables to be dichotomous, comparing those who report a “very
good” ability in speaking, reading or writing English versus all the other categories.
Unfortunately, there is no information on speaking ability for natives. We therefore compute
our indicators of integration for writing and reading fluency only. We should also emphasise
that self-reported language measures are not objectively measured indications of language
proficiency, and contain at least two sources of measurement error, as discussed in Dustmann
and van Soest (2002). First, simple reporting error. Dustmann and van Soest demonstrate that
this error can be substantial in self-reported language outcome variables. Secondly, individual
specific differences in scales, whereby different individuals consider different levels of
proficiency as necessary to be classified as for instance “very good”. We ignore these issues
in our analysis below.
Table 4.3.1 reports the gaps in reading and writing fluency between immigrants and natives.

The Socio-Economic Integration of Migrants
Christian Dustmann and Tommaso Frattini 37
The first row reports the average gap for all immigrants, while rows 2 to 10 report the gap for
immigrants from different origin countries. On average immigrants are 18 percentage points
less likely than natives to be proficient in reading (column 1) and 19.5 percentage points less
likely to be proficient in writing. When we condition on age and education (columns 2 and 4)
this gap diminishes only slightly to, respectively, 15 and 17 percentage points. Obviously,
large differences exist between different areas of origin. Immigrants from most English-
speaking countries, like Jamaica, Oceania and Canada have the same level of writing and
reading fluency than British natives. Irish immigrants have an unconditional reading
advantage relative to natives, which increases once we account for the differences in
education and age structure. Moreover, once observable characteristics are controlled for,
Irish immigrants also display a higher average writing fluency. As said above, this may be
due to their better proficiency in writing and reading, or differences in the scales of language
proficiency assessment between the two groups. Among the remaining groups, those with
the highest conditional and unconditional gap relative to natives are Pakistani and
Bangladeshi immigrants. For both groups the gap is above 20 percentage points in reading as
well as writing. Moreover, the conditional gap is smaller than the unconditional, indicating
that they are on average less educated than natives.
We investigate gender differences in Table 4.3.2, which shows that in both reading and
writing the unconditional gap of immigrant women relative to native women is higher than
the gap among men: The reading (writing) gap is 19.5 (22) percentage points among women
and 17 (17) percentage points among men. However, this is largely due to the lower average
level of education of women: the conditional reading gap is in fact smaller for women (15
percentage points) than for men (16 percentage points), while the difference in the
conditional writing gap between men and women is less than two percentage points (17.4

The Socio-Economic Integration of Migrants
Christian Dustmann and Tommaso Frattini 38
versus 16). There is substantial gender heterogeneity in reading and writing gaps even within
areas of origin. Women from Ireland and from Oceania and Canada display higher average
reading ability than native women, even after conditioning on age and education, while no
significant differences exist for men from the same countries. As regards writing proficiency,
it is only Irish women who have an advantage over British natives. In all other origin groups,
women’s gap are on average higher (or equal) than men’s, although conditioning on age and
education tends to reduce gender differences. Gender differences are particularly large among
Pakistani and East African immigrants.
Table 4.3.3 reports average differences in reading and writing fluency between white natives
and immigrants of different ethnicities. The only ethnic group that does not have any
disadvantage with respect to white natives are the Black-Caribbean, consistent with results of
Table 4.3.1. Immigrants from all other ethnicities instead display significant gaps in reading
and writing fluency relative to white natives. In particular, Chinese immigrants appear to be
the most disadvantaged group, with an unconditional gap of 37 percentage points in reading
and 43 percentage points in writing. The gap reduces to, respectively, 31.5 and 38 percentage
points, when we condition on age and education.
Table 4.3.4 reports results by ethnicity and gender. Black Caribbean men have on average an
unconditional advantage in reading proficiency relative to white native men, but their
advantage disappears when we condition on observable characteristics. Conversely, they also
have an advantage in writing fluency over white natives, which increases slightly when age
and education are controlled for. Black Caribbean women, instead, do not display any
significant differences from white native women.
Looking at regional differences, Wales is the region with least differences between
The Socio-Economic Integration of Migrants
Christian Dustmann and Tommaso Frattini 39
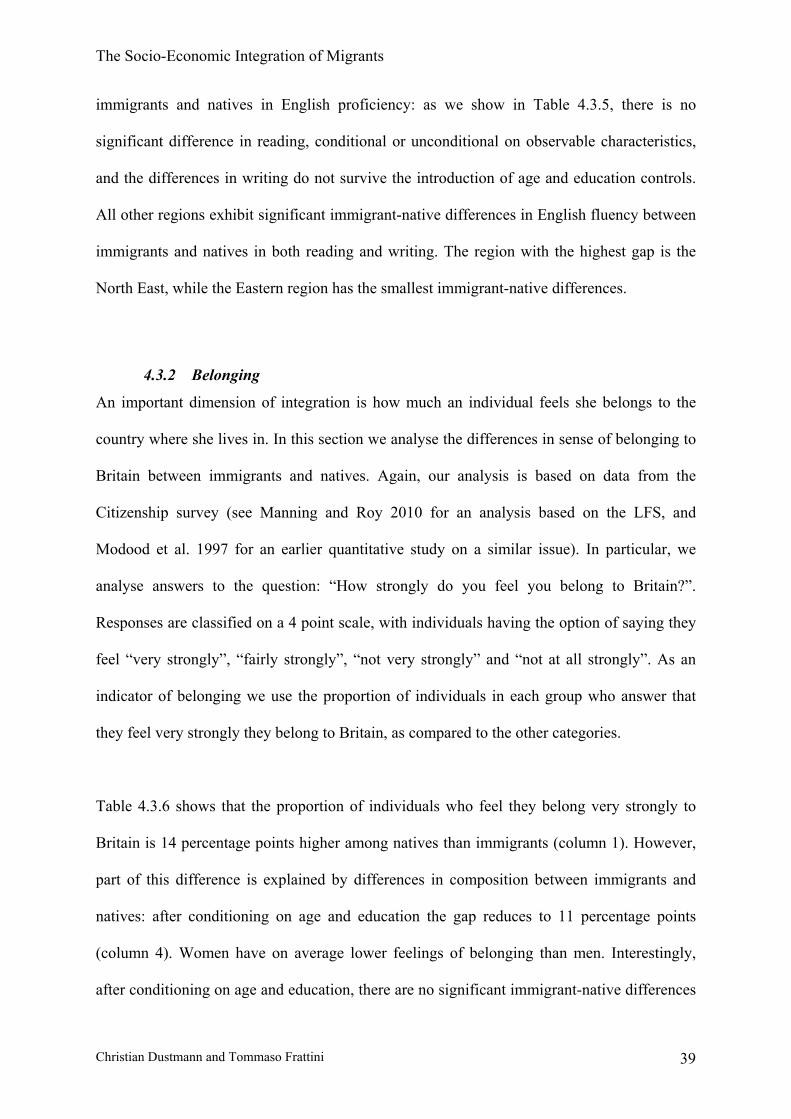
immigrants and natives in English proficiency: as we show in Table 4.3.5, there is no
significant difference in reading, conditional or unconditional on observable characteristics,
and the differences in writing do not survive the introduction of age and education controls.
All other regions exhibit significant immigrant-native differences in English fluency between
immigrants and natives in both reading and writing. The region with the highest gap is the
North East, while the Eastern region has the smallest immigrant-native differences.
4.3.2 Belonging
An important dimension of integration is how much an individual feels she belongs to the
country where she lives in. In this section we analyse the differences in sense of belonging to
Britain between immigrants and natives. Again, our analysis is based on data from the
Citizenship survey (see Manning and Roy 2010 for an analysis based on the LFS, and
Modood et al. 1997 for an earlier quantitative study on a similar issue). In particular, we
analyse answers to the question: “How strongly do you feel you belong to Britain?”.
Responses are classified on a 4 point scale, with individuals having the option of saying they
feel “very strongly”, “fairly strongly”, “not very strongly” and “not at all strongly”. As an
indicator of belonging we use the proportion of individuals in each group who answer that
they feel very strongly they belong to Britain, as compared to the other categories.
Table 4.3.6 shows that the proportion of individuals who feel they belong very strongly to
Britain is 14 percentage points higher among natives than immigrants (column 1). However,
part of this difference is explained by differences in composition between immigrants and
natives: after conditioning on age and education the gap reduces to 11 percentage points
(column 4). Women have on average lower feelings of belonging than men. Interestingly,
after conditioning on age and education, there are no significant immigrant-native differences
The Socio-Economic Integration of Migrants
Christian Dustmann and Tommaso Frattini 40
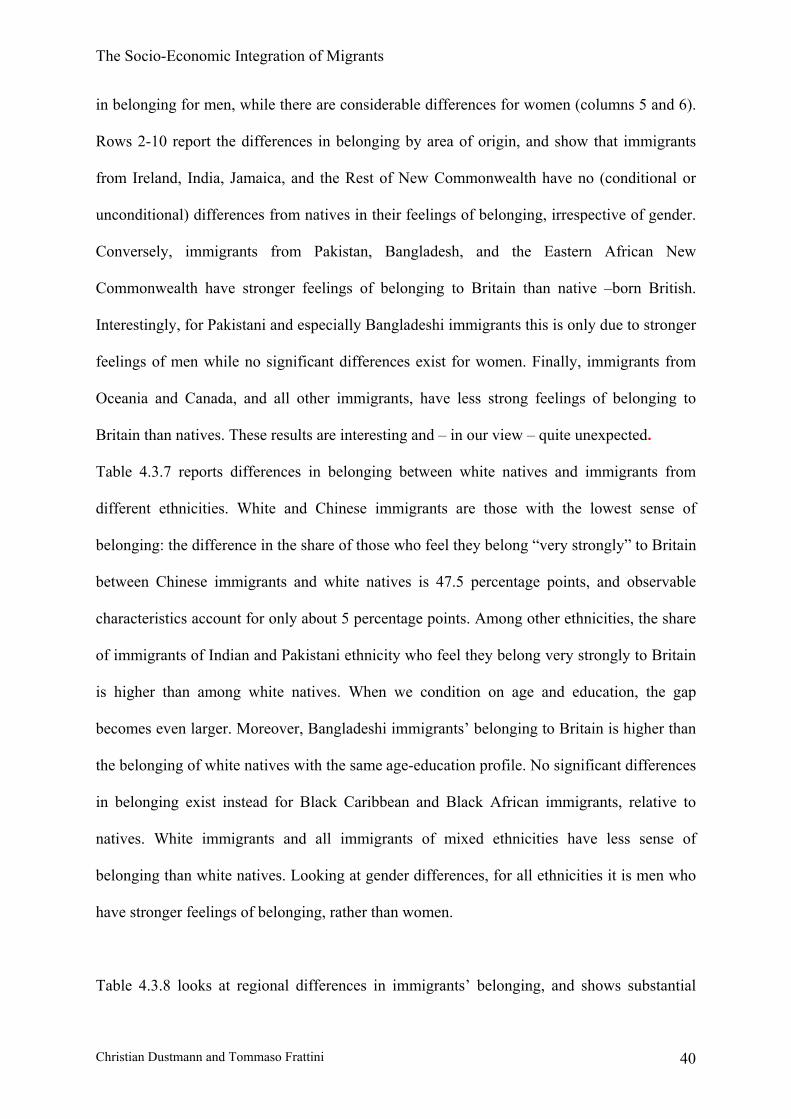
in belonging for men, while there are considerable differences for women (columns 5 and 6).
Rows 2-10 report the differences in belonging by area of origin, and show that immigrants
from Ireland, India, Jamaica, and the Rest of New Commonwealth have no (conditional or
unconditional) differences from natives in their feelings of belonging, irrespective of gender.
Conversely, immigrants from Pakistan, Bangladesh, and the Eastern African New
Commonwealth have stronger feelings of belonging to Britain than native –born British.
Interestingly, for Pakistani and especially Bangladeshi immigrants this is only due to stronger
feelings of men while no significant differences exist for women. Finally, immigrants from
Oceania and Canada, and all other immigrants, have less strong feelings of belonging to
Britain than natives. These results are interesting and – in our view – quite unexpected.
Table 4.3.7 reports differences in belonging between white natives and immigrants from
different ethnicities. White and Chinese immigrants are those with the lowest sense of
belonging: the difference in the share of those who feel they belong “very strongly” to Britain
between Chinese immigrants and white natives is 47.5 percentage points, and observable
characteristics account for only about 5 percentage points. Among other ethnicities, the share
of immigrants of Indian and Pakistani ethnicity who feel they belong very strongly to Britain
is higher than among white natives. When we condition on age and education, the gap
becomes even larger. Moreover, Bangladeshi immigrants’ belonging to Britain is higher than
the belonging of white natives with the same age-education profile. No significant differences
in belonging exist instead for Black Caribbean and Black African immigrants, relative to
natives. White immigrants and all immigrants of mixed ethnicities have less sense of
belonging than white natives. Looking at gender differences, for all ethnicities it is men who
have stronger feelings of belonging, rather than women.
Table 4.3.8 looks at regional differences in immigrants’ belonging, and shows substantial
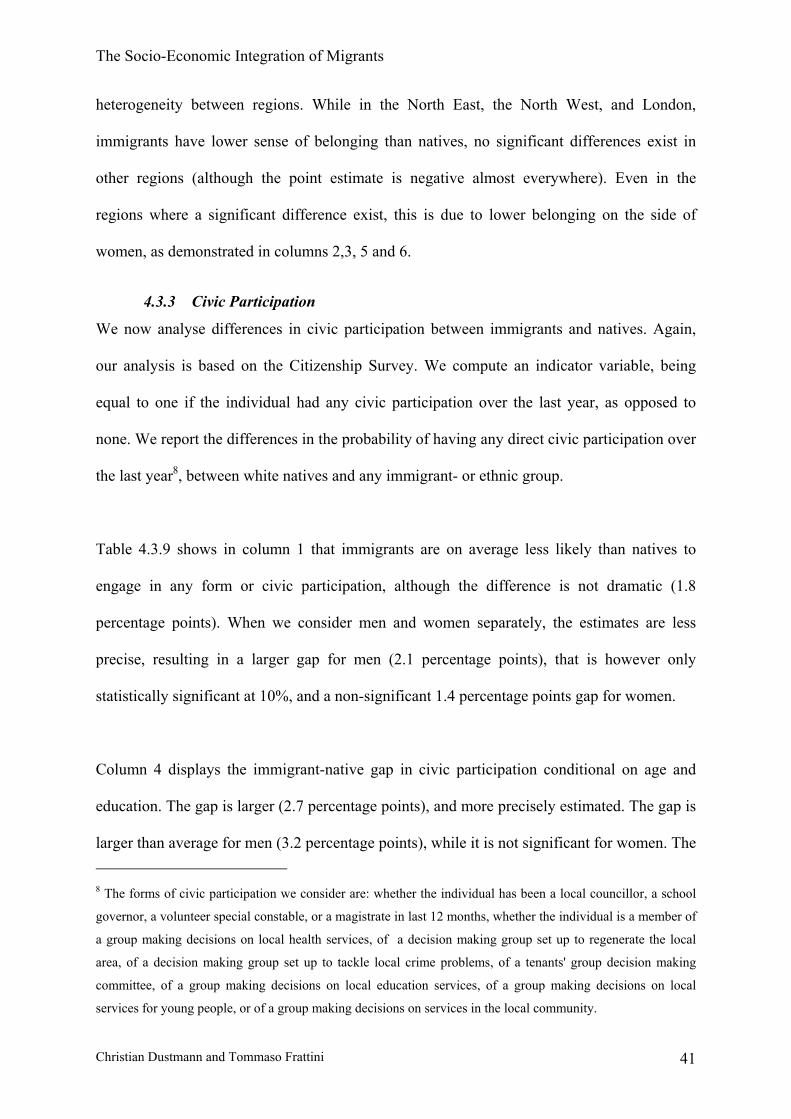
The Socio-Economic Integration of Migrants
Christian Dustmann and Tommaso Frattini 41
heterogeneity between regions. While in the North East, the North West, and London,
immigrants have lower sense of belonging than natives, no significant differences exist in
other regions (although the point estimate is negative almost everywhere). Even in the
regions where a significant difference exist, this is due to lower belonging on the side of
women, as demonstrated in columns 2,3, 5 and 6.
4.3.3 Civic Participation
We now analyse differences in civic participation between immigrants and natives. Again,
our analysis is based on the Citizenship Survey. We compute an indicator variable, being
equal to one if the individual had any civic participation over the last year, as opposed to
none. We report the differences in the probability of having any direct civic participation over
the last year8, between white natives and any immigrant- or ethnic group.
Table 4.3.9 shows in column 1 that immigrants are on average less likely than natives to
engage in any form or civic participation, although the difference is not dramatic (1.8
percentage points). When we consider men and women separately, the estimates are less
precise, resulting in a larger gap for men (2.1 percentage points), that is however only
statistically significant at 10%, and a non-significant 1.4 percentage points gap for women.
Column 4 displays the immigrant-native gap in civic participation conditional on age and
education. The gap is larger (2.7 percentage points), and more precisely estimated. The gap is
larger than average for men (3.2 percentage points), while it is not significant for women. The 8 The forms of civic participation we consider are: whether the individual has been a local councillor, a school
governor, a volunteer special constable, or a magistrate in last 12 months, whether the individual is a member of
a group making decisions on local health services, of a decision making group set up to regenerate the local
area, of a decision making group set up to tackle local crime problems, of a tenants' group decision making
committee, of a group making decisions on local education services, of a group making decisions on local
services for young people, or of a group making decisions on services in the local community.
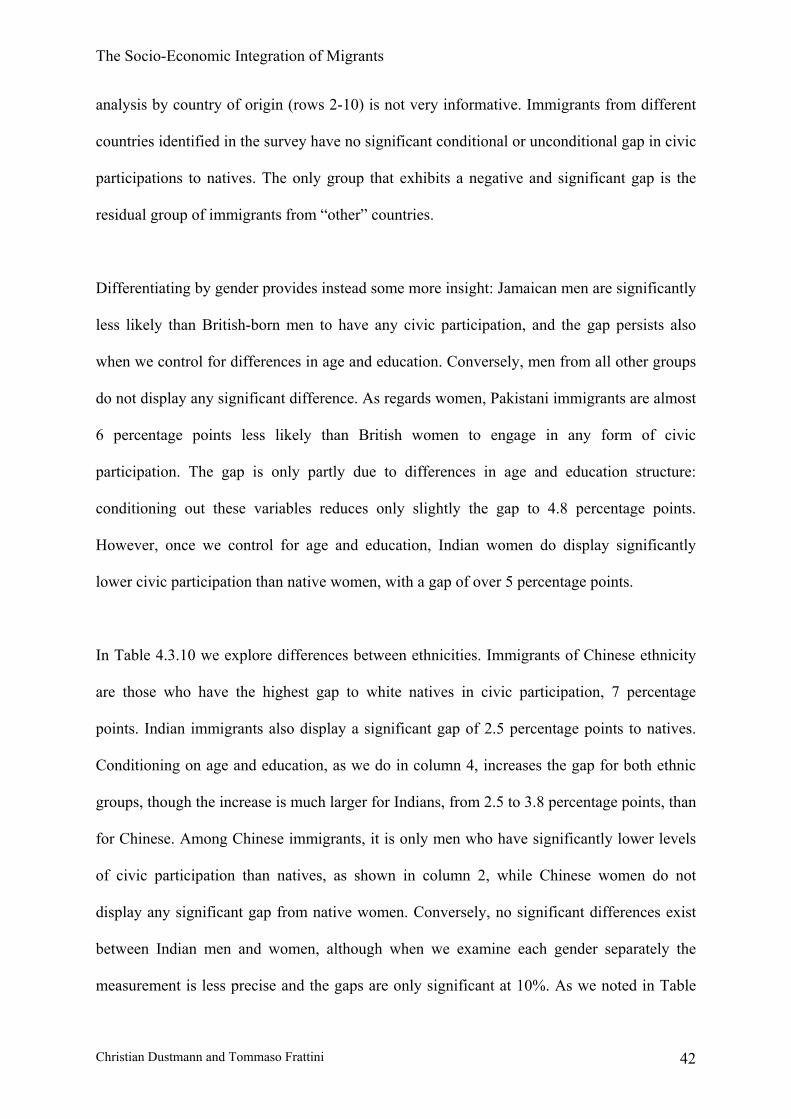
The Socio-Economic Integration of Migrants
Christian Dustmann and Tommaso Frattini 42
analysis by country of origin (rows 2-10) is not very informative. Immigrants from different
countries identified in the survey have no significant conditional or unconditional gap in civic
participations to natives. The only group that exhibits a negative and significant gap is the
residual group of immigrants from “other” countries.
Differentiating by gender provides instead some more insight: Jamaican men are significantly
less likely than British-born men to have any civic participation, and the gap persists also
when we control for differences in age and education. Conversely, men from all other groups
do not display any significant difference. As regards women, Pakistani immigrants are almost
6 percentage points less likely than British women to engage in any form of civic
participation. The gap is only partly due to differences in age and education structure:
conditioning out these variables reduces only slightly the gap to 4.8 percentage points.
However, once we control for age and education, Indian women do display significantly
lower civic participation than native women, with a gap of over 5 percentage points.
In Table 4.3.10 we explore differences between ethnicities. Immigrants of Chinese ethnicity
are those who have the highest gap to white natives in civic participation, 7 percentage
points. Indian immigrants also display a significant gap of 2.5 percentage points to natives.
Conditioning on age and education, as we do in column 4, increases the gap for both ethnic
groups, though the increase is much larger for Indians, from 2.5 to 3.8 percentage points, than
for Chinese. Among Chinese immigrants, it is only men who have significantly lower levels
of civic participation than natives, as shown in column 2, while Chinese women do not
display any significant gap from native women. Conversely, no significant differences exist
between Indian men and women, although when we examine each gender separately the
measurement is less precise and the gaps are only significant at 10%. As we noted in Table

The Socio-Economic Integration of Migrants
Christian Dustmann and Tommaso Frattini 43
4.3.9, moreover, Pakistani women have significantly lower levels of civic participation than
white native women. Notice also that Black-Caribbean women have an unconditional higher
probability than white native women to engage in some form of civic participation. When age
and education are conditioned out, however, the Black-Caribbean women’s advantage
disappears.
While in most regions immigrants and natives have similar behaviour in terms of civic
participation, in the Eastern region, London, and Wales there is a significant gap in the
proportion of immigrants and natives who engage in some form of civic participation.
Conditioning the probability of civic participation on age and education does not affect the
results. The regional patterns of gaps in civic participation is to some extent different across
genders, as displayed in Table 4.3.11: immigrant men have a gap relative to natives in the
Eastern region, London, and the South West, while immigrant women have a significantly
lower probability of civic participation relative to natives only in London and (to a lesser
extent) in Wales. The conditional gaps are very similar to the unconditional ones, with the
only exception of the gap for immigrant men in Wales, which becomes statistically
significant when age and education are controlled for.

The Socio-Economic Integration of Migrants
Christian Dustmann and Tommaso Frattini 44
5. Dynastic Aspects: Integration and Performance of Second Generation
Immigrants
Integration of foreign born individuals is a long term process. In the previous section we
considered indicators of performance and integration of foreign born individuals only. In this
section we focus on the descendents of immigrants, by developing indicators of dynastic
performance.
To study the intergenerational aspects of the performance of immigrant communities, one
would ideally require longitudinal data on immigrants and their children, where children are
observed at later stages of their life cycle. Such data exists for some countries (see e.g.
Dustmann (2008) for an analysis for Germany), but not for the UK. Specifically, the
Citizenship Survey does not go back long enough in time to allow intergenerational
comparisons, while the LFS has a longer time span, but it does not have information on
parents’ country of birth. We will therefore devise an indirect way of identifying second
generation immigrants in the LFS, relying on the information on ethnicity. Information on
ethnicity is the only way to identify descendents of immigrants in the LFS. Thus, our analysis
is restricted to native-born individuals of ethnic minority origin. One can argue that these are
the most interesting groups if it comes to dynastic aspects of integration and performance of
immigrants. As we show in Table 3.3, ethnic minorities in 2008-09 represent 5.8% of the
native born population.9
5.1 Economic integration of native-born minorities
5.1.1 Education
We report in table 5.1 the differences in educational achievement (expressed as years of
9 Individuals of ethnic minority origin constitute 53 percent of the immigrant population.
The Socio-Economic Integration of Migrants
Christian Dustmann and Tommaso Frattini 45
education) between native born individuals of different ethnicities and white natives. Note
that – other than before – in this case, the numbers are comparable, as all individuals are
born in the UK, and have thus been exposed to the same education system. In all years and
for all ethnic groups, the educational achievement of British-born minorities is higher than of
white natives. This is only partially due to the differences in the age structure between white
and non-white natives. Columns 2, 4 and 6 show that even when we condition on the age
structure, minority members have more years of full time education than natives. The few
exceptions are individuals of Caribbean descent in 2000-01 and 2008-09, ethnic Pakistanis in
1993-94 and ethnic Bangladeshis in 2000-01. Chinese are the ethnic group with the highest
educational achievement in all years, and the gap with white natives has increased over time:
in 2008-09 the average British-born individual of Chinese ethnicity had left full time
education more than three years later her white counterpart. Individuals of Black-African and
Indian descent had also in 2008-09 on average about 2.4 more years of education than whites.
An analysis by gender, reported in Table 5.2, highlights significant differences between
ethnic groups. For most minority groups, men have a larger educational advantage relative to
natives than women. The exceptions are Chinese, in the years before 2008-09, and the Black-
Caribbean. The case of the Black Caribbean is particularly interesting as the educational
advantage of women relative to men is substantial in all years. In 2008-09 Black-Caribbean
men’s average education is not statistically different from that of white natives, when we
control for age composition. Yet, even after accounting for differences in age composition,
Black-Caribbean women have on average 1/3 of a year more schooling than white native
women.
5.1.2 Employment
The higher educational achievement of British-born ethnic minorities is not reflected by
higher employment probabilities. Table 5.3 reports the differences in employment
The Socio-Economic Integration of Migrants
Christian Dustmann and Tommaso Frattini 46
probabilities for working age individuals not in full time education, between native-born
ethnic minorities and whites. With the exception of the Chinese, all ethnic minority groups
display a lower probability of employment than whites (when age, education and regional
distribution are controlled for), although the gap is closing over time. For instance native-
born individuals of Caribbean ancestry were in 1993-94 15 percentage points less likely than
whites to have a job, while in 2000-01, the gap has reduced to 7.3 percentage points, and
there is no statistically significant difference in 2008-09. However, when we compare ethnic
Caribbean and whites with the same geographical distribution, education level, and age
structure, the gap increases to 17 percentage points in 1993-94, 11 percentage points in 2000-
01 and 12 percentage points in 2008-09. A similar pattern is visible for the other ethnic
groups, except for the Chinese. Bangladeshis are in 2008-09 the group with the highest
employment gap relative to whites.
Table 5.4 reports employment gaps by gender for each ethnic group. The entries in the Table
show that the employment disadvantage of ethnic Bangladeshis is due to the low employment
probabilities of women. In contrast, the employment probability of ethnic Bangladeshi men is
not significantly different from whites, and only 5 percentage points lower if we control for
age, education, and regional distribution. Pakistani women have also a much higher
employment gap than Pakistani men, while for all other groups the conditional gaps are very
similar between men and women.
5.1.3 Wages
In table 5.5 we report the average gap in gross hourly wages between UK born minorities and
whites. Columns 1, 4 and 7 show that for all years the unconditional gap in average wages is
statistically not significantly different from zero for most groups (the exceptions are the
negative gap for Pakistanis in 1993-94 and 2008-09 and the positive gap for Indians in 2000-
The Socio-Economic Integration of Migrants
Christian Dustmann and Tommaso Frattini 47
01 and 2008-09 and for African Blacks in 2008-09). However, controlling for regional
distribution, as we do in columns 2, 5 and 8, turns the gap negative for all ethnic minorities.
This shows that the wage advantage these groups have over natives is due to ethnic minority
individuals living predominantly in high-wage metropolitan areas, foremost London, as we
discuss in section 3.
Conditioning on regional distribution in 2008-09 drives the wage advantage of the Black-
African group to zero, and increases the wage disadvantage of individuals of Caribbean
descent to 10 percent.
In columns 3, 6 and 9 we report results where we condition not only the regional distribution,
but also the age and education structure. In 2008-09, the inclusion of these additional controls
leads to a negative wage gaps for all minority groups, including the Chinese, with the
exception of the Indians and the Bangladeshis.
Table 5.6 reports indicators of wage integration by gender. Both the unconditional and the
conditional indicators show that the wage gap of women is smaller than the wage gap of men
for all ethnic groups and in all years. This is possibly due to more selective labour market
participation of ethnic minority women.
5.2 Inter-generational aspects of immigrants’ economic Integration
In this section, we relate immigrant minorities born in the UK to their parent generation.
Since we do not have information on parents’ country of birth in the LFS, we construct the
relationships between UK born immigrants and their children by matching respective birth
cohorts.. Our methodology is based on, and extends, Dustmann and Theodoropoulos (2010).
The idea is as follows. We construct for the years 1979-1988 (we need to pool LFS waves to
obtain sufficiently large samples) the labour market outcomes for the cohort of foreign born
ethnic minority individuals and white natives who are born between 1933-1964. For years

The Socio-Economic Integration of Migrants
Christian Dustmann and Tommaso Frattini 48
2000-2010, we observe the same outcomes for UK-born ethnic minority individuals and their
white peers who are born between 1963 and 1975, and whose “parent generation” we observe
in the 1979-1988 survey. Comparison of the distance in outcomes between these groups
(white natives and various ethnic minority groups, as well as individuals in the parents’ and
in the children’s generation within groups) allows us to obtain measures of the
intergenerational progress of different groups. This provides an additional “indicator” for
performance.
The analysis in this case will be limited to education and employment, as no wage
information is available in the LFS before 1992.
5.2.1 Education
Figure 5.1 plots on the vertical axis the average age at which individuals in the “parent
generation” (as described above) left full time education. The horizontal axis carries the
average age at which individuals in the “children generation” left full time education. The
grey lines through each dot denote the 95% confidence interval.
Entries for each group are below the diagonal line, which denotes equality of education level
between parents and children generation. This indicates that children of all groups are more
highly educated than their parents, and reflects a secular trend of increase in education. All
the dots in the figure are on the right of the vertical scattered line, which crosses the “whites”
dot. Thus, UK-born minorities have on average a higher educational level than their white
peers. Conversely, only the African, Chinese, and Indian entries are above the horizontal
scattered line, indicating the average education of the white parent generation. Caribbean,
Pakistani, and Bangladeshi immigrants from the earlier generation had a lower educational
level than white natives. Interestingly, although children of all minority groups outperform
white natives in their educational outcomes, there is a strong intra-community
intergenerational correlation in education. Children of Chinese, Indian, and African

The Socio-Economic Integration of Migrants
Christian Dustmann and Tommaso Frattini 49
backgrounds have on average higher education than children from Caribbean, Pakistani, and
Bangladeshi backgrounds.
5.2.2 Employment
As we note earlier, the higher educational achievements of ethnic minorities does not
correspond a higher probability of employment. Figure 5.2 plots for each ethnic group the
employment rate of the parent generation versus the employment rate of the children
generation. The figure is constructed in the same way of Figure 5.1.
Dots below the 45 degrees line indicate that the children generation has a higher employment
rate than the parent generation. This is the case for all ethnic groups, except for the
descendants of Black Caribbean immigrants. While the employment rate of Caribbean
immigrants born between 1933 and 1964 (and observed in 1979-1988) was higher than that
of white natives of the same cohort, the employment probability of their UK-born
descendants (observed in 2000-10) is lower than that of comparable white native peers, and
but still higher than that of native born individuals of Pakistani and Bangladeshi origin.
Pakistanis and Bangladeshis of both cohorts have the lowest employment rates, but this is
largely due to the extremely low labour market participation of women from these
communities.
5.3 Non-economic integration of immigrants’ descendents
5.3.1 Marriage behaviour
One important dimension of integration is the degree of interethnic marriages for each ethnic
group of individuals who are born in the UK. In this section we study the marriage behaviour
of UK-born ethnic minorities10. We use the LFS, which we pool for the years 1992-2010 to
10 See Dustmann and Fabbri 2005 for an analysis of marriage behaviour of ethnic minority individuals in the
UK.

The Socio-Economic Integration of Migrants
Christian Dustmann and Tommaso Frattini 50
obtain a large enough sample. Although having the advantage of increasing the sample size,
this prevents us for studying the evolution over time of interethnic marriages. We consider as
“married” both legally married as well as cohabiting couples.
The interethnic marriage behaviour of ethnic minority men and women is summarised in
Figure 5.3 and Figure 5.4, respectively. The figures show substantial heterogeneity between
ethnic groups, and between genders within the same ethnic group. Men and women of
Chinese background are those with the lowest share of intra-ethnic marriages: 61% of UK-
born Chinese men are married to a non-ethnically Chinese woman, and the rate is even higher
for women at 72%. Native born Black Caribbean men have also low rates of endogamy, with
63% of them having a non-Caribbean partner. Conversely, only 44% of British native
married Black Caribbean women have a non-Caribbean partner. A similar gender pattern is
apparent for the Black-African minority, although over 60% of men and women with an
African background have a partner of the same ethnicity. Pakistani and Bangladeshi are by
far the ethnic group with the highest endogamy rate, which is particularly high among women
of Bangladeshi background. Over 85% of ethnic Pakistani men and women who are married
have a partner of the same ethnicity, while among the Bangladeshi minority this share is 74%
among men and 93% among women. Moreover, a substantial fraction of UK natives that are
ethnically Pakistani or Bangladeshi have a partner who is not born in the UK, but a first
generation immigrant from that respective country: 58% of married British born ethnically
Pakistani men and 56% of British born ethnically Bangladeshi men have a partner who is
born in, respectively, Pakistan and Bangladesh. Among second and higher generation
Pakistani women, this percentage is even higher: 66% of UK born married women of
Pakistani origin have a Pakistani-born partner, while among second and higher generation
Bangladeshi women, this share rises to 83%.
The Socio-Economic Integration of Migrants
Christian Dustmann and Tommaso Frattini 51
5.3.2 Civic integration
The Citizenship Survey has information on parents’ country of birth, which allows direct
identification of second generation immigrants. We use that information in this sectionto
analyse the non-economic integration of second-generation immigrants relative to natives,
based on their fluency in English, their sense of belonging to Britain, and their civic
participation.
5.3.2.1 Fluency in English
Table 5.7 shows that there is no difference in (self-assessed) reading and writing proficiency
between second generation immigrants and natives, conditional or unconditional on age and
education. This is not surprising, as we are assessing responses of adult individuals who were
born and raised in the UK, and hence we would expect their fluency in English to be the same
as the descendants of natives. However, when we explore ethnic differences (rows 2-10), it
turns out that individuals of Indian and Pakistani descent have a higher likelihood than
natives to classify themselves as having a very good reading proficiency, and the difference
survives age and education controls. As regards writing, instead, it is only individuals of
Indian descent who on average claim to have a statistically significant higher proficiency than
natives.
Table 5.8 looks at gender differences, and shows that second generation immigrant men have
significantly higher probability than natives to claim they have a very good writing
proficiency, while no differences exist for reading. However, this advantage is entirely
attributable to the favourable age and education structure of second generation men, as
demonstrated by the conditional results in column 4, which show no significant difference.
The analysis by separate ethnic groups shows that second generation Indian men are more
likely to claim a high reading and writing proficiency, but this is totally explained by their
age and education structure. Vice versa, the advantage of second generation Pakistani men

The Socio-Economic Integration of Migrants
Christian Dustmann and Tommaso Frattini 52
increases when we control for age and education. Among women, second generation Indians
have consistently higher self-assessed reading and writing proficiency, both conditional and
unconditional on observable characteristics. Second generation Chinese women also appear
to have a higher confidence in their reading and writing skills than native women.
We explore regional differences in Table 5.9. The results show that second generation
immigrants in the North East, the East Midlands, the west Midlands, and Wales have a higher
probability than natives to rank themselves as having a very good reading and writing
proficiency. Controlling for age and education has only minor effects on the estimates.11
5.3.2.2 Belonging
Do second generation immigrants feel they belong to Britain as much as the descendants of
native-born citizens? The results in the first row of Table 5.10 suggest a positive answer,
indicating no difference in responses to the question of how strongly individuals feel they
belong to Britain between second generation immigrants and natives. Rows 2 to 10 indicate
however that there is substantial heterogeneity among different ethnicities. On the one hand,
second generation Black Caribbean are significantly less likely than white natives to feel they
belong to Britain. Differences in age and education structure explain only about a third of the
gap. On the other hand, second generation Pakistanis are more likely than white natives to
feel strongly they belong to Britain, and the gap almost doubles when we condition out
differences in composition. The analysis by gender shows that, in both cases, it is women
who drive the results, while no significant differences exist among second generation men,
and after we control for age and education.
There is not much regional heterogeneity in feelings of belonging of second generation
immigrants, as we show in Table 5.11. London is the only region where a significant
11 The sample size in some regions is very small, so these estimates should be interpreted with some caution.

The Socio-Economic Integration of Migrants
Christian Dustmann and Tommaso Frattini 53
difference in the sense of belonging exists between second generation immigrants and
natives. However, the gap is explained by differences in composition of the second
generation and native population, and disappears when we control for age and education.
Looking across gender groups, second generation immigrant men do not display significant
differences from native men anywhere, although in London the unconditional gap is
significant at 10%. Conversely, Second generation women in the North East are significantly
less likely than native women to have strong feeling of belonging to Britain.
5.3.2.3 Civic participation
Table 5.12 displays differences in civic participation (defined as in section 4.3.3) between
second generation immigrants and natives, and shows that that there are no significant
differences in civic participation, neither overall (columns 1 and 4) nor by gender (column
2,3 and 5,6). However, some differences exist for second generation immigrants of specific
backgrounds. The descendants of white and of Chinese immigrants display significant lower
probabilities of engaging in any form of civic participation than white natives. The gap is
about twice as large for Chinese second generation immigrants than for Whites, and survives
the introduction of age and education controls. However, while in the case of White second
generation immigrants the gap is entirely due to the lower civic participation of men, among
Chinese second generation immigrants there are almost no gender differences. Conversely,
second generation Caribbean immigrant have higher probability of civic participation than
natives, and this is attributable to the higher civic participation of Caribbean women only.
As regards regional differences, reported in Table 5.13, second generation immigrants in the
North East are significantly less likely than natives to engage in any form of civic
participation, and this applies to both men and women. In the East Midlands and the South
West, instead, there are no overall differences, although second generation immigrant men do
display a significant gap in probability of civic participation relative to natives. Similarly, in

The Socio-Economic Integration of Migrants
Christian Dustmann and Tommaso Frattini 54
Wales there are no overall differences, but second generation immigrant women have
significantly lower probability of civic participation than native women.

The Socio-Economic Integration of Migrants
Christian Dustmann and Tommaso Frattini 55
6. International Comparisons
6.1 Immigrants’ economic integration in Europe: a comparative analysis
In this section we put the evidence we report for the UK in an international context. We draw
on the EU Labour Force Survey (EULFS), pooling the years 2006-2008, to study the relative
performance of immigrants and natives in different EU countries, and put the UK situation in
a comparative European perspective. It is important to note that the definition of
“Immigrants” (which in our study follows the definition in the Anglo-Saxon literature, as an
individual who is foreign born) follows the national convention in the EULFS. While in most
countries, the EULFS reports country of birth, and we use that variable to identify
immigrants, in the case of Germany only nationality is available. Therefore “immigrants” will
be defined as “foreign born” in all countries expect for Germany, where they will be defined
as “foreign nationals”. This is important to keep in mind when assessing the international
comparisons.
Table 6.1 reports the share of immigrants in the total population in different EU countries,
broken down by countries of origin, and overall, pooling the years 2006-2008. The share of
immigrants in the UK is lower than in many other EU countries; in fact, the UK ranges sixth
in terms of its share of immigrant population in the group of 15 EU countries
Table 6.2 reports the immigrant-native employment rate differential in different EU
countries, both overall and broken down by gender. Column 1 reports the unconditional gap,
while column 2 controls for region of residence within the country and age, and column 3
controls additionally for education. The gap in the UK is smaller than in Germany, France,
Sweden, and the Netherlands for instance. In Southern European countries and in Ireland,
instead, the employment differential is positive: immigrants have a higher employment
probability than natives. What is more, this is not due to differences in gender composition,

The Socio-Economic Integration of Migrants
Christian Dustmann and Tommaso Frattini 56
as employment advantages are present for both men and women. Conditioning on age and on
region of residence (to account for the possibility that immigrants settle in regions with
higher employment rates), as we do in column 2, turns the coefficient negative in all
countries, except for Greece, and increases the size of the employment gap in countries where
immigrants already had an employment disadvantage. This indicates that immigrants tend to
be younger and/or to settle in regions with higher average employment rates.
Finally, controlling for the educational composition of the immigrant and native workforce
tends to slightly reduce the employment gap in all countries. It is also worth noting that in
almost all countries the conditional gap of column 3 is larger than the unconditional gap of
column 1, which indicates that immigrants tend to be younger and with a more favourable
education structure than natives, and to settle in regions with higher average employment
rates.
We do not have wage information in the EULFS, therefore we cannot compare the wage gap
between immigrants and natives across EU countries. Rather, we analyse the differences
between immigrants and natives in labour market performance looking at the differences in
their occupational distribution.
Table 6.3 reports the Duncan dissimilarity index for the distribution of immigrants and
natives across occupations, corrected to account for sampling error (see Carrington and
Troske 1997 and Hellerstein and Neumark 2008). The index can be interpreted as the
percentage of immigrants that should change occupation for immigrants and natives to have
the same occupational distribution. Therefore, the higher the index, the more dissimilar is the
occupational distribution of immigrants and natives.
The first column of Table 6.3 reports the overall index. The entries show that the UK value is
lower than that for most other countries (except Finland, Portugal and Ireland), which

The Socio-Economic Integration of Migrants
Christian Dustmann and Tommaso Frattini 57
suggests that segregation is lower. The Duncan index can be easily interpreted: It indicates
that in the UK 10 percent of immigrants would have to change jobs to equalize the
occupational distribution of immigrants and natives. In Germany, this share is 19 percent, and
in France 12.2 percent.
One reason for the differences in the occupational distribution of immigrants and natives
might simply be due to differences in the composition of the two populations, e.g. due to
different education structures. To address this, we divide the population in three education
groups based on the ISCED (International Standard Classification of Education)
classification, and compute the Duncan dissimilarity index within each group12.
We report the results in columns 2 to 4. The index is lower for low education groups, while it
increases with the level of education. The exception is again the UK. However, note that the
educational classification of immigrants in the UK in the EULFS may be problematic, as it is
based on highest qualification achieved, while the UK LFS in principle records all foreign
qualifications as “other qualifications” (see the discussion in the Appendix of Manacorda et
al. (2011)). The last column reports an average of the values of the Duncan index in each
education group, weighted by the share of each group in the total population. This gives a
measure of occupational dissimilarity conditional on the educational composition of
immigrants and natives in each country.
In Figure 6.1 we plot the share of immigrants in each country with tertiary education (ISCED
levels 5 and 6) on the horizontal axis, versus the Duncan index of dissimilarity for the
occupational distribution of immigrants and natives on the vertical axis. The results show a
12 As we have noted above, the classification of immigrants’ education based on highest qualification achieved
may be problematic, and we typically use years of education as an indicator of schooling. However, the EULFS
does not have any information on years of education, therefore we are forced to use highest qualification
achieved as a measure of education.

The Socio-Economic Integration of Migrants
Christian Dustmann and Tommaso Frattini 58
strong negative correlation between immigrants’ education and occupational dissimilarity:
the line plotted through the dots has a statistically significant slope of -0.25. This indicates
that in countries where immigrants are more highly educated their occupational distribution is
also more similar to that of natives.
As immigrants spend more time in the host country, and acquire country-specific human
capital, their occupational distribution becomes more similar to that of natives. This is shown
in Figure 6.2, which plots the Duncan index in five countries against time spent in the
country. In all countries, except for Germany, the value of the index decreases over time.
Regardless of which cohort is considered, however, the UK is the country with the lowest
occupational dissimilarity between immigrants and natives.
6.2 Educational achievement of immigrants’ children: a cross-country perspective
The numbers above indicate that immigrants’ labour market integration in the UK compares
favourably relative to other EU countries. We now investigate the UK standing in terms of
the relative educational achievements of the children of immigrants. We use the OECD PISA
2006 data to investigate the schooling achievements of the children of immigrants in the UK
relative to other OECD countries (see Dustmann, Frattini and Lanzara 2011 for a broader
analysis). We distinguish between two groups: First, children who are born abroad, but attend
school in the host country. We refer to these as “1.5 generation”. Secondly, children who are
born in the host country; we refer to those as “second generation”.
Table 6.4 reports the conditional and unconditional gaps in reading and maths test scores for
1.5 and second generation immigrants relative to natives for the UK, Germany, France,
Spain, Italy, the US, Canada, and Australia.
Panel A reports results for reading tests scores, and shows (column I) that in all countries,
except for Australia, 1.5 generation immigrants at age 15 have lower reading scores than their
native peers. In the UK the gap is about 2.5 times larger than in Canada, but smaller than in

The Socio-Economic Integration of Migrants
Christian Dustmann and Tommaso Frattini 59
all other countries. Italy is the country where immigrant children have the worst performance
at school.
In the next columns we condition on background characteristics. Column II shows that most
of these gaps are disappear once we control for the language spoken at home. Controlling for
this, the gap becomes statistically insignificant in the UK, Canada, Germany and the US,
while it is substantially reduced in all other countries, except for Spain. Controlling, in
addition, for parental educational and occupational background, and for family wealth,
further reduces the gap for all countries.
Those who are born in the home country (“Second generation”), on the other hand, are less
disadvantaged in all countries. Only in Germany and France the achievement gap between
second generation and native kids is significantly negative, while it is positive in Australia.
Controlling for language spoken at home and for family background, the gap disappears in all
countries. Moreover, in the UK (as well as in Australia and Canada) second generation
immigrants outperform the children of native-born parents after controlling for differences in
backgrounds.
Maths score results paint a similar picture. In this case, though, no significant differences
emerge between 1.5 or second generation immigrants and native test scores in the UK,
conditional or unconditional on family characteristics.
We have plotted in Figure 6.3 gaps in maths scores for 1.5 generation immigrants (on the
horizontal axis) versus gaps for second generation immigrants (on the vertical axis). The
graph shows clearly a positive correlation between gaps for 1.5 and second generation
immigrants. Moreover, conditioning on family characteristics reduces the gap for both
generations in all countries, as shown in Figure 6.4.
The Socio-Economic Integration of Migrants
Christian Dustmann and Tommaso Frattini 60
7. Conclusion
In this report, we provide a comprehensive analysis of indicators of integration and of
differences between native born whites and immigrants and their descendants for the UK.
Our analysis covers different dimensions. The first dimension is the different indicators that
we investigate. First, we consider economic indicators. Economic indicators comprise
educational achievements, employment, and wages. Second, we consider non-economic
indicators of similarity. These comprise language skills, civic integration, and identity with
Britishness, and marriage behaviour. We do this for all immigrants, for breakdowns of
immigrants from different origin countries, and for immigrants of different ethnicities.
A second dimension refers to the way we compute differences in these indicators. First, we
compare immigrant and native populations who are resident in the UK at different points in
time. We compute these comparisons as differences in raw numbers, and differences
conditional on characteristics which characterise individuals. The first answers simple
questions like “What is the difference in employment between immigrants and natives who
are resident in the UK in 2009/2010?”. The second answers questions like “What is the
difference in employment between immigrants and natives who are resident in the UK in
2009/2010, if immigrants and natives had the same regional distribution and the same age-
and education structure”. Both are important and policy relevant.
Second, we distinguish the differences along different sub-dimensions: By country of origin,
by ethnicity, and where immigrants settle in the UK.
Third, we consider more “dynamic” measures of integration. Here we follow a particular
entry cohort over time in the UK, and display their changes in economic outcomes. Finally,
we investigate the next generations, the offspring of immigrants. This is important to assess

The Socio-Economic Integration of Migrants
Christian Dustmann and Tommaso Frattini 61
the long term integration of Britain’s immigrant groups, and to isolate possible sources of
problems with respect to how various groups can be supported in the next generation.
All this provides us with a comprehensive picture about the integration of immigrant
populations and their children in the British labour market and society. To put this in an
international context, and to establish where the UK has deficits, or is doing better than other
countries, we provide analysis on some of the key economic indicators of immigrant
populations in other European countries, as well as in the US, Canada and Australia. These
indicators relate to employment and education differentials, to occupational segregation, and
(for the second generation) to comparisons of differences in school tests between natives and
immigrants across different countries.We believe that this comprehensive work is a useful
tool to provide factual evidence to the debate about migration in the UK, and helps to devise
politics that are improving the integration of Britain’s immigrant- and minority populations.
Our report provides many interesting and surprising results, with the most important ones
summarised in the Executive Summary. One outstanding feature of immigration to Britain is
the sustained high level of education of immigrant populations, relative to the native born
white population. We conclude in our analysis that immigrants to the UK are, and have been
over the last two decades, well educated, and in most cases achieved higher educational
attainments than natives in the same age groups. This is quite outstanding in an international
comparison: Here the UK stands out as the European country with the best educated
immigrant population. These educational advantages of first generation immigrants carry
over to the next generation, with immigrant children in the UK being among the highest
achieving (in terms of education) across European countries.
Our work is much in line with recent work by Dustmann, Machin and Schoenberg (2010)
which draws a positive picture about the achievements of British ethnic minority children at
the various stages in the UK public school system. Our report illustrates – in line with these
The Socio-Economic Integration of Migrants
Christian Dustmann and Tommaso Frattini 62
findings - that British born ethnic minority children exhibit on average higher levels of
education than children of white native born parents. However, we also point out large
heterogeneity across different origin and ethnic groups, with individuals of Indian and
Chinese background, and who are born in the UK, performing strongest.
Despite the relatively high levels of education, immigrants in the UK exhibit lower
employment rates than natives. The most disadvantaged groups are immigrants from the
Indian Sub-Continent and the Middle East, while the employment rate of immigrants from
Oceania is higher than natives’ for all years. On the other hand, immigrants earn in the first
two periods we consider (1993-1994, 2000-2001) higher wages than natives, and this is the
case for both males and females. In the last years, 2008-2009, the raw differential turns
negative for males, but remains positive for females. However, this advantage disappears in
each of the years considered when controlling for regional allocation, education and age
structure. Likewise, we find that ethnic minority individuals born in the UK are earning
higher wages than their native peers; however, if we control for regional allocation, education
and age structure, this advantage turns into a disadvantage. Thus, the higher wages minority
individuals obtain are due to the fact that they live predominantly in high-wage London, and
are better educated.
There are large language differences between immigrants and natives in reading and writing
proficiency. The lowest levels of reading and writing proficiency are exhibited by Pakistani
and Bangladeshi immigrants. There is no overall difference in (self-assessed) reading and
writing proficiency between second generation immigrants and natives, conditional or
unconditional on age and education.

The Socio-Economic Integration of Migrants
Christian Dustmann and Tommaso Frattini 63
Interesting is also that, while overall the proportion of individuals who feel they belong very
strongly to Britain is 14 percentage points higher among natives than immigrants, immigrants
from Pakistan, Bangladesh, and the Eastern African New Commonwealth have stronger
feelings of belonging to Britain than native –born British. Some of these groups - Pakistanis
and Bangladeshis – are at the same time seriously disadvantaged in the labour market.
Overall, our report draws a fairly positive picture about Britain’s immigrant and ethnic
minority populations, in particular in comparison with other countries. However, there are
also some worrying features, like for instance the lower wages of British born minority
individuals when compared to British born whites with the same age structure, regional
allocation and education. It is important in our view to understand why these differences
exist. Further, there are some particularities among some of Britain’s immigrant groups, like
the fairly low labour market involvement of Pakistani and Bangladeshi women, which is
particularly surprising for those who are born in the UK. Again, some reasons may lay in the
marriage pattern, where a high fraction of these women and men – although born in the UK -
are married to non-British born men and women of the same ethnic group. This may lead to
exacerbate individual disadvantage on the level of the family, as has been emphasised by
Dustmann and Fabbri (2005). Again, additional work into these aspects should shed further
light on these issues. Also surprising is the high feeling of belonging to Britain for exactly
those groups that are more disadvantaged in the labour market, like the Bangladeshis and the
Pakistanis.

The Socio-Economic Integration of Migrants
Christian Dustmann and Tommaso Frattini 64
References
Algan, Y, C. Dustmann, A. Glitz and A. Manning, (2010) The Economic Situation of
First- and Second-Generation Immigrants in France, Germany, and the UK , Economic
Journal, 120(542), F4-F30.
Aydemir, A., Chen, W.H., Corak, M. (2009) Intergenerational Earnings Mobility among
the Children of Canadian Immigrants, The Review of Economics and Statistics, 91 (2), pp.
377-397
Blackaby, D., Leslie, D., Murphy, P. and O’Leary, N. (2002) White/ethnic minority
earnings and employment differentials in Britain: evidence from the LFS, Oxford Economic
Papers, 54, 270-97.
Blackaby, D., Leslie, D., Murphy, P. and O’Leary, N. (2005) Born in Britain: How are
native ethnic minorities faring in the British labour market?, Economics Letters, 88, 370-75.
Borjas, G.J. (1985), “Assimilation, Changes in Cohort Quality, and the Earnings of
Immigrants”, Journal of Labor Economics, 3, pp. 463-89
Borjas, G.J. (1992) Ethnic capital and intergenerational mobility, Quarterly Journal of
Economics, 107, 123-50.
Borjas, G.J. (1993) The intergenerational mobility of immigrants, Journal of Labor
Economics, 11, 113-35.
Borjas, G.J. (1994) Long-run convergence of ethnic skill differentials: the children and
grandchildren of the great migration, Industrial and Labor Relations Review, 47, 553-73.
Borjas, G.J. (1995) Assimilation and Changes in Cohort Quality Revisited: What Happened
to Immigrant Earnings in the 1980s?, Journal of Labor Economics, 13 (2), pp. 201-245
Borjas, G.J. (2006) Making it in America: Social Mobility in the Immigrant Population,

The Socio-Economic Integration of Migrants
Christian Dustmann and Tommaso Frattini 65
NBER Working Papers No 12088.
Card, D., DiNardo, J.E. and Estes, E. (2000) The more things change: immigrants and the
children of immigrants in the 1940s, the 1970s, and the 1990s, in G. Borjas editor, Issues in
the Economics of Immigration, University of Chicago Press, Chicago.
Carliner, G. (1980) Wages, earnings and hours of first, second and third generation
American males, Economic Inquiry, 18, 87-102.
Carrington, W.J. and K.R. Troske (1997) On measuring segregation in samples with small
units, Journal of Business and Economic Statistics, 15(4), pp. 402-409.
Casey, T. And C. Dustmann (2009), Immigrants’ identity, Economic Outcomes, and the
Transmission of Identity across Generations, Economic Journal, 120(542), F31-F51.
Chiswick, B.R. (1977) Sons of immigrants: are they at an earnings disadvantage?, American
Economic Review (Papers and Proceedings), 67, 376-80.
Chiswick, B.R. (1978), “The Effects of Americanization on the Earnings of Foreign-Born
Men”, Journal of Political Economy, 86, 897-921.
Chiswick, B.R. and P. Miller (1988), Earnings in Canada: The roles of immigrant
generation, French ethnicity and language, in: T.P. Schultz, Editor, Research in population
economics, vol. 6, JAI Press Inc, Greenwich, Connecticut, pp. 183–228
Chiswick, B.R., Y.L. Lee, and P.W. Miller (2005), Family matters: the role of the family in
immigrants' destination language acquisition, Journal of Population Economics, 18 (4), pp.
631–647
Cohen Y. and Y. Haberfeld (1998) Second-generation Jewish immigrants in Israel: have the
ethnic gaps in schooling and earnings declined?, Ethnic and Racial Studies, 21 (3), pp. 507-
528(22)
Deutsch, J., Epstein, G.S., and Lecker, T. (2006) Multi-generation model of immigrant
earnings: theory and application, Research in Labor Economics (The Economics of
Immigration and Social Diversity), 24, pp. 217–34.

The Socio-Economic Integration of Migrants
Christian Dustmann and Tommaso Frattini 66
Dustmann, C. (1993) Earnings Adjustment of Temporary Migrants, Journal of Population
Economics, 6, pp. 153-168.
Dustmann, C. (2000) Temporary Migration and Economic Assimilation, Swedish Economic
Policy Review, 7, 213-244, 2000.
Dustmann, C. (2008) Intergenerational Mobility and Return Migration: Comparing sons of
foreign and native born fathers, Journal of Human Resources, Vol. 43, pp. 660-687.
Dustmann, C. and F. Fabbri (2005) Gender and Ethnicity Married Immigrants in Britain,
Oxford Review of Economic Policy, Vol. 21, pp 462-481
Dustmann, C., Frattini, T. and G. Lanzara (2011) Educational Achievement of Second
Generation Immigrants: An International Comparison, Economic Policy, forthcoming.
Dustmann, C., Frattini, T. and I. Preston (2008) The Effect of Immigration along the
Distribution of Wages, CReAM Discussion Paper No.03/08.
Dustmann, C., Frattini, T. and N. Theodoroupolos (2011) “Ethnicity and second
generation immigrants in Britain”, chapter 15 in P. Gregg and J. Wadsworth (eds.) “The
Labour Market in Winter: the state of working Britain 2010”, Oxford University Press.
Dustmann, C., Machin, S. and U. Schönberg (2010), Ethnicity and Educational
Achievement in Compulsory Schooling, The Economic Journal, 120, pp. F272–F297
Dustmann, C. and N. Theodoropoulos (2010), Ethnic minority immigrants and their
children in Britain, Oxford Economic Papers, 62, pp. 209–233.
Dustmann, C. and A. van Soest (2002) Language and the Earnings of Immigrants,
Industrial and Labor Relations Review, Vol. 55, No. 3, pp. 473-492.
Dustmann, C. and Y. Weiss (2007) Return Migration: Theory and Empirical Evidence for
the UK, British Journal of Industrial Economics, Vol. 45 Issue 2, pp. 236-256
Friedberg, R.M. (1992) The labor market Assimilation of Immigrants in the United States:
The Role of Age at Arrival, Brown University Working Paper
The Socio-Economic Integration of Migrants
Christian Dustmann and Tommaso Frattini 67
Gang, I.N. and Zimmermann, K. (2000) Is child like parent? Educational attainment and
ethnic origin, Journal of Human Resources, 35, pp. 550-69.
Hammarstedt, M. and M. Palme (2006), Intergenerational Mobility, Human Capital
Transmission and the Earnings of Second-Generation Immigrants in Sweden, IZA Discussion
Paper No. 1943
Heath, A.F and Cheung, S.Y. (2006) Ethnic penalties in the labour market: employers and
discrimination, Department for Work and Pensions, Research Report No. 341, London.
Heath, A.F and McMahon, D. (2005) Social mobility of ethnic minorities, in Loury, G.,
Modood, T. and Teles, S. Social mobility and public policy: Comparing the US and the UK,
Cambridge University Press, Cambridge.
Heath, A.F, McMahon, D. and Roberts, J. (2000) Ethnic differences in the labour market:
a comparison of the Sample of Anonymised Records and Labour Force Survey, Journal of
the Royal Statistical Society, Series A (Statistics in Society), 163, 341-61.
Hellerstein, J. and D. Neumark (2008), “Workplace Segregation in the United States: Race,
Ethnicity, and Skill”, Review of Economics and Statistics, 90(3), pp. 459-477.
Home Office (2004), Indicators of Integration
Hu, W.Y. (2000) Immigrant Earnings Assimilation: Estimates from Longitudinal Data,
American Economic Review Papers and Proceedings, 90, pp. 368–72.
Husted, L., H. S. Nielsen, M. Rosholm and N. Smith (2001), Employment and Wage
Assimilation of Male First Generation Immigrants in Denmark. The earnings of first
generation immigrants in Denmark. International Journal of Manpower, 22, (1-2), pp. 39-68.
Lofstrom, M. (2002), Labor market assimilation and the self-employment decision of
The Socio-Economic Integration of Migrants
Christian Dustmann and Tommaso Frattini 68
immigrant entrepreneurs, Journal of Population Economics, 15, pp. 83-114
Long, J.E. (1980) The Effect of Americanization on Earnings: Some Evidence for Women,
Journal of Political Economy, 88(3), pp620-629.
Lubotsky, D. (2007) Chutes or Ladders? A Longitudinal Analysis of Immigrant Earnings,
Journal of Political Economy, 115 (5), pp. 820-867
Manacorda, M., Manning, A. and J. Wadsworth (2011) The Impact of Immigration on the
Structure of Male Wages: Theory and Evidence from Britain, Journal of the European
Economic Association, forthcoming.
Manning, A., and S. Roy (2010) Culture Clash or Culture Club? National Identity in Britain,
Economic Journal, 120(542), pp. F72-F100.
Modood, T., Berthoud, R., Lakey, J., Nazroo, J., Smith, P., Virdee, S., Beishon, S. (1997)
Ethnic Minorities in Britain: Diversity and Disadvantage, London: Policy Studies Institute.
Platt, L. (2005). The intergenerational social mobility of minority ethnic groups, Sociology,
39, 445-61.
Platt, L. (2007) Making education count: the effects of ethnicity and qualifications on
intergenerational social class mobility, The Sociological Review, 55, pp. 485-508.
Riphahn, R.T. (2003) Cohort Effects in the Educational Attainment of Second Generation
Immigrants in Germany: An Analysis of Census Data, Journal of Population Economics
16(4), pp. 711-737
Riphahn, R.T. (2005) Are there Diverging Time Trends in the Educational Attainment of
Nationals and Second Generation Immigrants?, Jahrbücher für Nationalökonomie und
Statistik, 225(3), pp. 325-346
Rooth, D.O. and J. Ekberg (2003) Unemployment and earnings for second generation

The Socio-Economic Integration of Migrants
Christian Dustmann and Tommaso Frattini 69
immigrants in Sweden. Ethnic background and parent composition, Journal of Population
Economics, 16, pp. 787–814
Smith, J. P. (2003) Assimilation across the generations, American Economic Review, 93 (2),
pp. 315–19.
Smith, J.P. (2006) Immigrants and the Labor Market, Journal of Labor Economics, 24 (2),
pp. 203-233.
Sweetman, A. and G. Dicks (1999), Education and Ethnicity in Canada. An
Intergenerational Perspective, Journal of Human Resources, 34(4), pp. 668-696
Trejo, S. (2003) Intergenerational Progress of Mexican-Origin Workers in the U.S. Labor
Market, Journal of Human Resources, 38 (3), pp. 467-489.
Van Ours, J.C. and Veenman, J.M.C. (2003). The educational attainment of second-
generation immigrants in the Netherlands. Journal of Population Economics, 16(4), pp. 739-
754
Veenman, J.M.C., and van Ours, J.C. (2004). From parent to child; early labor market
experiences of second-generation immigrants in the Netherlands. De Economist, 152(4), pp.
473-490
Wadsworth, J. (2003) The labour market performance of ethnic minorities, in R. Dickens, P.
Gregg and J. Wadsworth (eds.), The labour market under new labour: The state of working
Britain, Palgrave Macmillan, New York.

The Socio-Economic Integration of Migrants
Christian Dustmann and Tommaso Frattini 70
Figures
Figure 4.1: Immigrant-natives education gap
The figure reports average gap in years of education between immigrants and natives. Source: LFS, various years Figure 4.2: Immigrants-natives employment gap
The figure reports average percentage points gap in employment probabilities between immigrants and natives. Source: LFS, various years
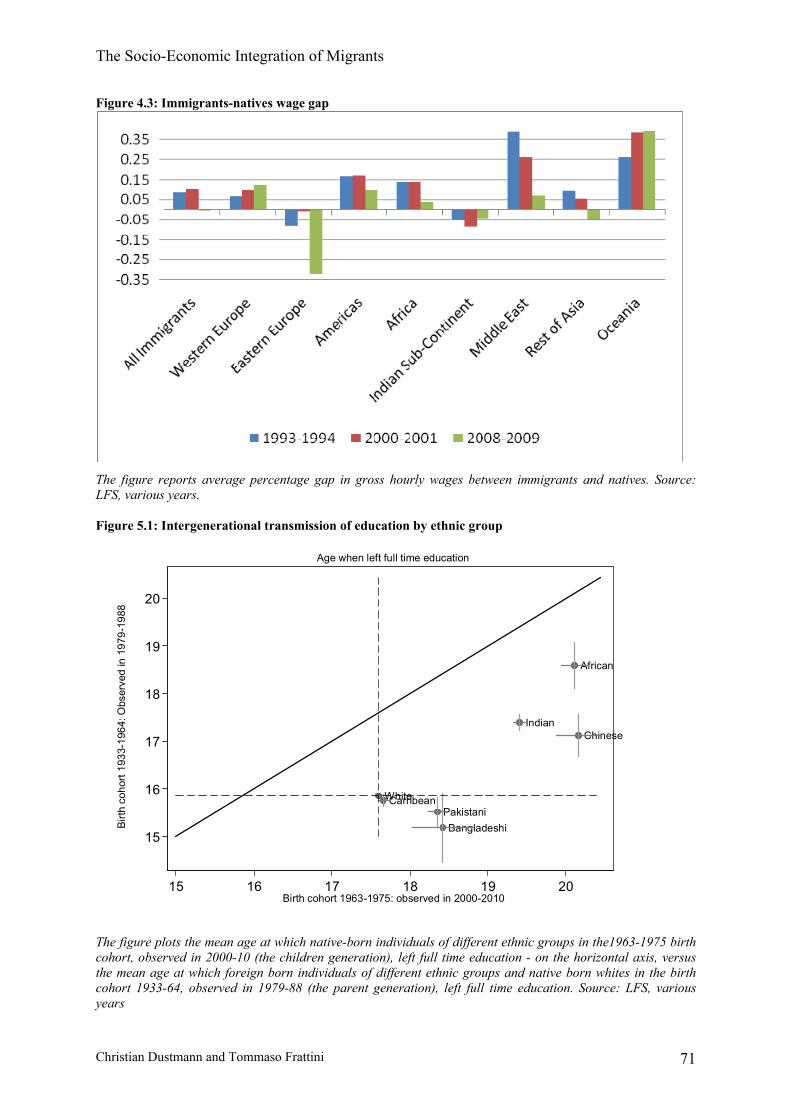
The Socio-Economic Integration of Migrants
Christian Dustmann and Tommaso Frattini 71
Figure 4.3: Immigrants-natives wage gap
The figure reports average percentage gap in gross hourly wages between immigrants and natives. Source: LFS, various years. Figure 5.1: Intergenerational transmission of education by ethnic group
WhiteCarribean
African
Indian
PakistaniBangladeshi
Chinese
15
16
17
18
19
20
Birt
h co
hort
1933
-196
4: O
bser
ved
in 1
979-
1988
15 16 17 18 19 20Birth cohort 1963-1975: observed in 2000-2010
Age when left full time education
The figure plots the mean age at which native-born individuals of different ethnic groups in the1963-1975 birth cohort, observed in 2000-10 (the children generation), left full time education - on the horizontal axis, versus the mean age at which foreign born individuals of different ethnic groups and native born whites in the birth cohort 1933-64, observed in 1979-88 (the parent generation), left full time education. Source: LFS, various years
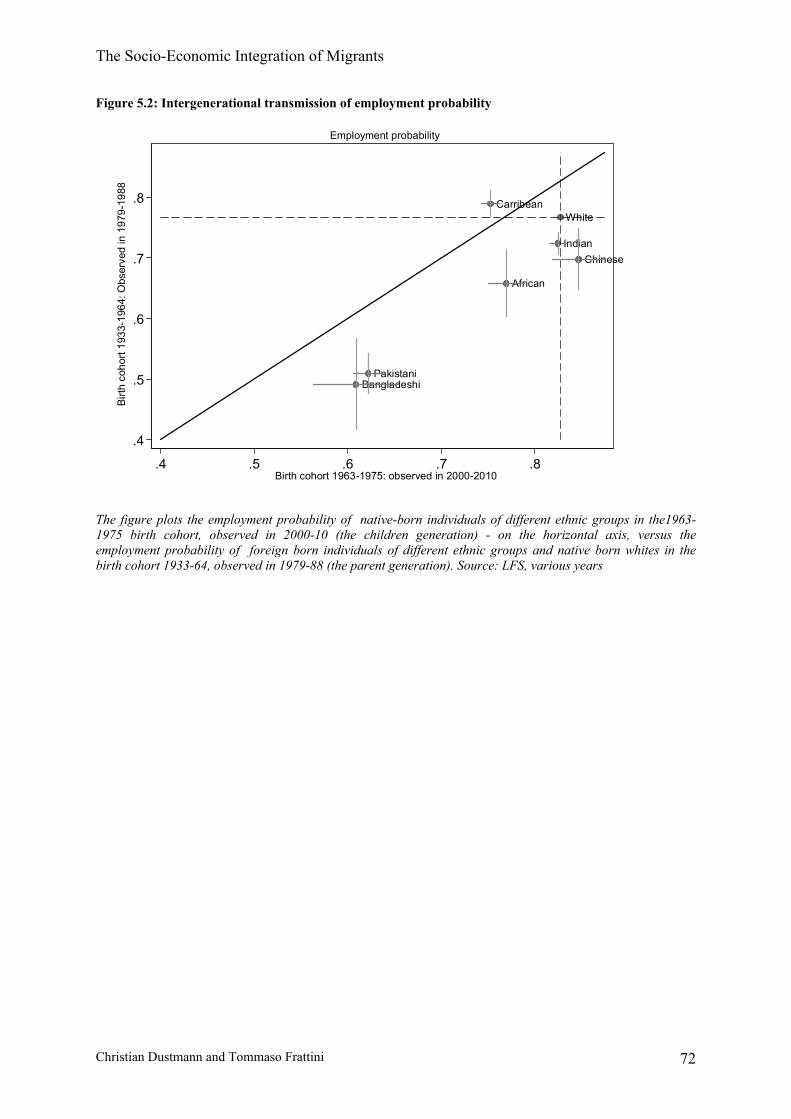
The Socio-Economic Integration of Migrants
Christian Dustmann and Tommaso Frattini 72
Figure 5.2: Intergenerational transmission of employment probability
WhiteCarribean
African
Indian
PakistaniBangladeshi
Chinese
.4
.5
.6
.7
.8
Birt
h co
hort
1933
-196
4: O
bser
ved
in 1
979-
1988
.4 .5 .6 .7 .8Birth cohort 1963-1975: observed in 2000-2010
Employment probability
The figure plots the employment probability of native-born individuals of different ethnic groups in the1963-1975 birth cohort, observed in 2000-10 (the children generation) - on the horizontal axis, versus the employment probability of foreign born individuals of different ethnic groups and native born whites in the birth cohort 1933-64, observed in 1979-88 (the parent generation). Source: LFS, various years
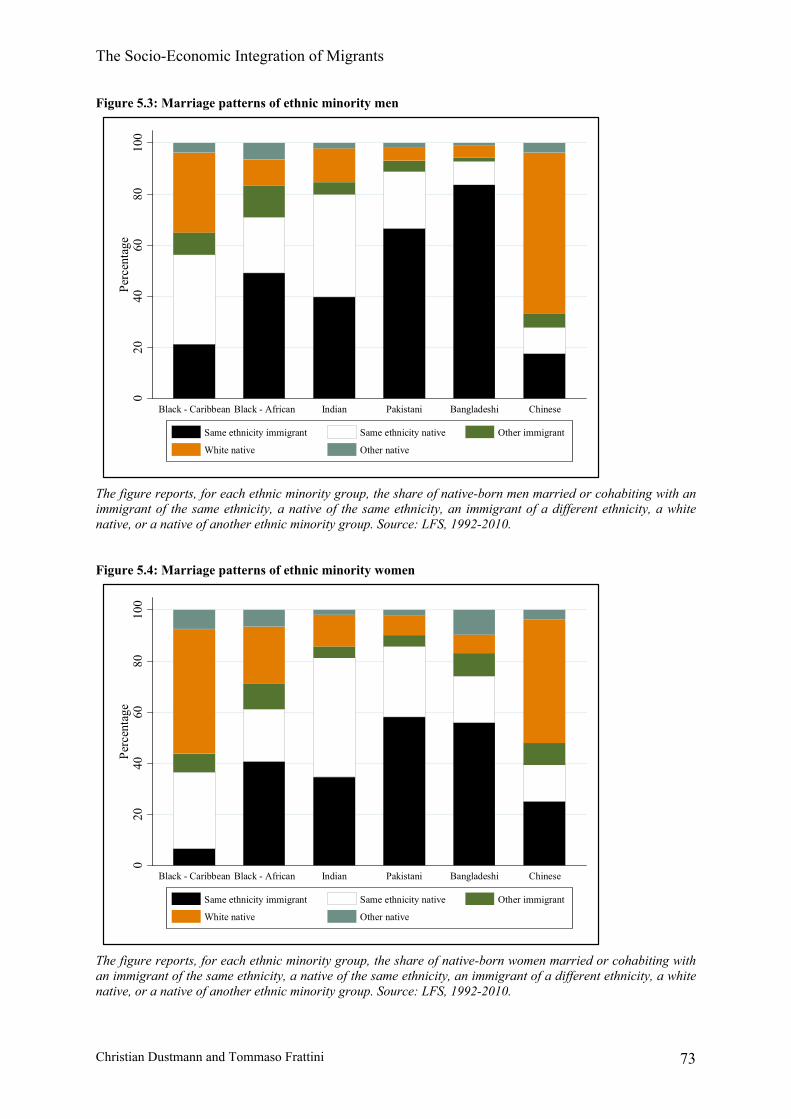
The Socio-Economic Integration of Migrants
Christian Dustmann and Tommaso Frattini 73
Figure 5.3: Marriage patterns of ethnic minority men
020
4060
8010
0Pe
rcen
tage
Black - Caribbean Black - African Indian Pakistani Bangladeshi Chinese
Same ethnicity immigrant Same ethnicity native Other immigrant
White native Other native
The figure reports, for each ethnic minority group, the share of native-born men married or cohabiting with an immigrant of the same ethnicity, a native of the same ethnicity, an immigrant of a different ethnicity, a white native, or a native of another ethnic minority group. Source: LFS, 1992-2010. Figure 5.4: Marriage patterns of ethnic minority women
020
4060
8010
0Pe
rcen
tage
Black - Caribbean Black - African Indian Pakistani Bangladeshi Chinese
Same ethnicity immigrant Same ethnicity native Other immigrant
White native Other native
The figure reports, for each ethnic minority group, the share of native-born women married or cohabiting with an immigrant of the same ethnicity, a native of the same ethnicity, an immigrant of a different ethnicity, a white native, or a native of another ethnic minority group. Source: LFS, 1992-2010.
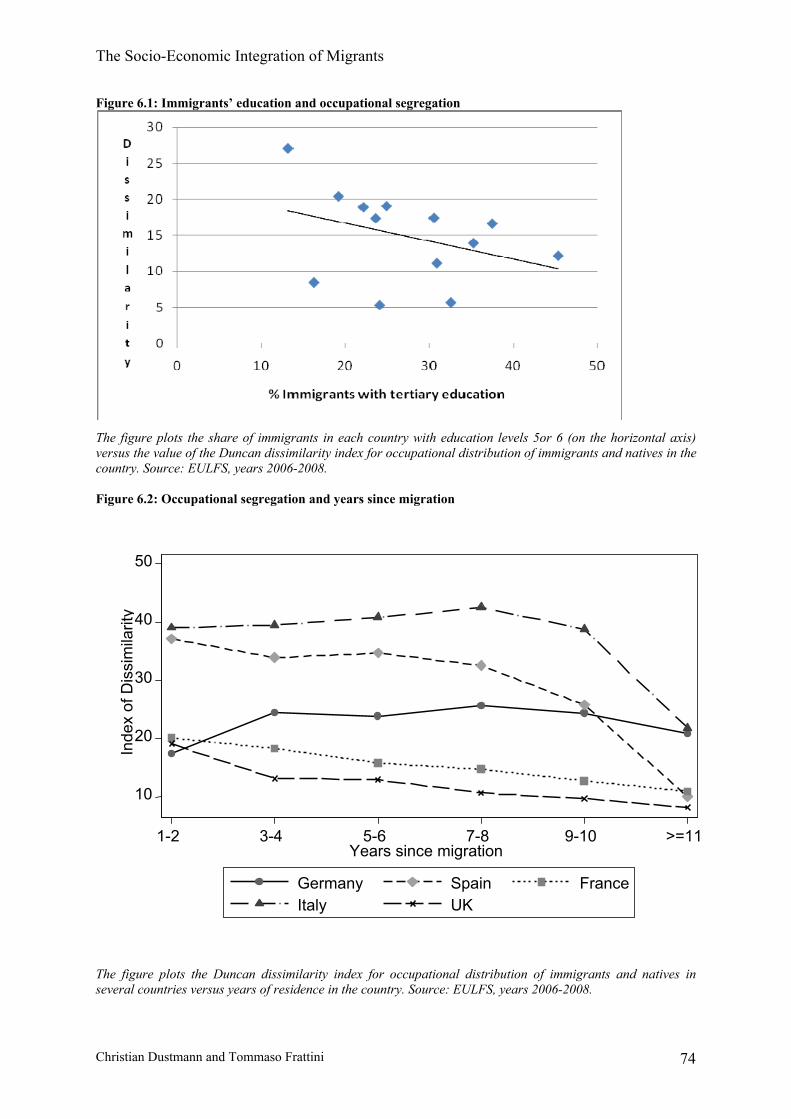
The Socio-Economic Integration of Migrants
Christian Dustmann and Tommaso Frattini 74
Figure 6.1: Immigrants’ education and occupational segregation
The figure plots the share of immigrants in each country with education levels 5or 6 (on the horizontal axis) versus the value of the Duncan dissimilarity index for occupational distribution of immigrants and natives in the country. Source: EULFS, years 2006-2008. Figure 6.2: Occupational segregation and years since migration
The figure plots the Duncan dissimilarity index for occupational distribution of immigrants and natives in several countries versus years of residence in the country. Source: EULFS, years 2006-2008.
10
20
30
40
50
Inde
x of
Dis
sim
ilarit
y
1-2 3-4 5-6 7-8 9-10 >=11Years since migration
Germany Spain France Italy UK

The Socio-Economic Integration of Migrants
Christian Dustmann and Tommaso Frattini 75
The figure plots the unconditional gap in mathematics test scores between 1.5 immigrants (born abroad and emigrated before age 15) and natives versus the gap in mathematics test score between second generation immigrants (born in the host country from foreign-born parents) in different countries. Source: PISA 2006.
The figure plots the gap in mathematics test scoresconditional on language spoken at home, parental education and occupation and wealth between 1.5 immigrants (born abroad and emigrated before age 15) and natives versus the gap in mathematics test score between second generation immigrants (born in the host country from foreign-born parents) in different countries. Source: PISA 2006.
Australia
Austria
Belgium
Canada
Switzerland Germany
Denmark
Spain
France
UK
Greece
Italy
Netherlands
Norway
New Zealand
PortugalSweden
US
-100
-80
-60
-40
-20
0
20
40
Sec
ond-
Gen
erat
ion
-100 -80 -60 -40 -20 0 20 401.5 Generation
Figure 6.3: Unconditional maths test score gaps of immigrants relative to natives
Australia
AustriaBelgium
Canada
Switzerland
GermanyDenmark
Spain
France
UKGreece
Italy
Netherlands
Norway
New Zealand
Portugal
Sweden
US
-100
-80
-60
-40
-20
0
20
40
Sec
ond-
Gen
erat
ion
-100 -80 -60 -40 -20 0 20 40 1.5 Generation
Figure 6.4: Maths test score gaps of immigrants relative to natives conditional on family background

The Socio-Economic Integration of Migrants
Christian Dustmann and Tommaso Frattini 76
Tables
Table 3.1: Share of immigrants in working age population 1993‐1994 2000‐2001 2008‐2009 All Immigrants 6.88 7.88 11.37 Western Europe 33.85 31.31 22.02 Eastern Europe 2.97 3.59 13.11 Americas 11.77 11.68 8.97 Africa 14.76 17.43 18.88 Indian Sub‐Continent 20.70 19.23 18.64 Middle East 2.87 3.17 3.29 Rest of Asia 8.72 9.01 10.90 Oceania 2.99 3.47 2.72 Other 1.37 1.12 1.47 The table reports in the first line the share of immigrants in working age population in years 1994‐94 pooled, 2000‐01 pooled, and 2008‐09 pooled. Lines 2‐10 reports the share of immigrants from each area of origin in the total working age foreign‐born population for each period.
Source: LFS, several years.
Table 3.2: Regional distribution of immigrants and natives 1993‐1994 2000‐2001 2008‐2009 Natives Immigrants Natives Immigrants Natives Immigrants
North East 4.87 1.34 4.70 1.38 4.62 1.87 North West 12.51 7.89 12.30 6.27 12.08 7.45 Yorks & Humbers. 9.08 5.55 8.97 5.20 9.12 5.88 East Midlands 7.40 5.19 7.51 4.77 7.70 5.44 West Midlands 9.40 8.97 9.31 8.23 9.17 8.29 Eastern 9.34 7.49 9.56 7.56 9.78 8.07 London 10.18 39.97 10.12 43.31 9.59 38.66 South East 13.73 12.71 14.03 12.73 14.17 12.79 South West 8.66 4.92 8.86 5.08 9.20 4.89 Wales 5.38 1.94 5.37 1.80 5.41 1.94 Scotland 9.45 4.02 9.28 3.68 9.15 4.71 The table reports the distribution of working age (16‐64) natives and immigrants across Government Office Regions in years 1993‐94 pooled, 2000‐01 pooled, and 2008‐09 pooled. Source: LFS, several years.

The Socio-Economic Integration of Migrants
Christian Dustmann and Tommaso Frattini 77
Table 3.3: Ethnic composition of native population 1993‐94 2000‐01 2008‐09 White 97.14 96.14 94.24 Black ‐ Caribbean 0.55 0.65 0.77 Black ‐ African 0.17 0.30 0.55 Indian 0.71 0.81 1.03 Pakistani 0.52 0.72 1.09 Bangladeshi 0.13 0.22 0.39 Chinese 0.07 0.09 0.13 Other ‐ mixed 0.71 1.06 1.82 The table reports the ethnic composition of the working age (16‐64) native British population in years 1994‐94 pooled, 2000‐01 pooled, and 2008‐09 pooled. Source: LFS, several years.
Table 3.4: Regional distribution of white and non-white natives 1993‐1994 2000‐2001 2008‐2009 White Minority White Minority White Minority North East 4.84 1.07 4.70 1.04 4.64 1.74 North West 12.41 8.66 12.19 7.16 11.97 8.22 Yorks & Humbers. 8.93 7.28 8.80 7.03 8.95 7.15 East Midlands 7.35 5.59 7.47 5.07 7.63 5.93 West Midlands 9.11 13.73 8.94 12.89 8.64 12.58 Eastern 9.47 5.03 9.73 5.19 9.95 6.68 London 10.16 46.27 9.90 49.13 9.21 42.21 South East 14.05 7.18 14.46 7.07 14.63 9.07 South West 8.78 2.10 9.05 2.29 9.48 2.58 Wales 5.39 1.16 5.39 1.24 5.49 1.27 Scotland 9.51 1.93 9.38 1.89 9.41 2.57 The table reports the distribution of working age (16‐64) white natives and ethnic minority natives across Government Office Regions in years 1993‐94 pooled, 2000‐01 pooled, ands 2008‐09 pooled. Source: LFS, several years.

The Socio-Economic Integration of Migrants
Christian Dustmann and Tommaso Frattini 78
Table 4.1.1: Immigrants-natives education gap 1993‐1994 2000‐2001 2008‐2009 (1) (2) (3) (4) (5) (6) All Immigrants 1.197*** 1.200*** 1.506*** 1.465*** 1.770*** 1.577*** (0.017) (0.017) (0.018) (0.018) (0.017) (0.017) Western Europe 0.525*** 0.615*** 1.082*** 1.093*** 1.376*** 1.308*** (0.018) (0.018) (0.021) (0.020) (0.024) (0.023) Eastern Europe 3.128*** 3.488*** 2.804*** 2.680*** 2.644*** 2.214*** (0.076) (0.074) (0.065) (0.063) (0.029) (0.028) Americas 1.565*** 1.644*** 1.907*** 1.967*** 2.078*** 2.002*** (0.030) (0.029) (0.033) (0.032) (0.036) (0.035) Africa 2.260*** 2.110*** 2.291*** 2.172*** 1.918*** 1.731*** (0.025) (0.025) (0.025) (0.025) (0.024) (0.024) Indian Sub‐Continent 0.086*** 0.091*** 0.341*** 0.304*** 1.011*** 0.849*** (0.022) (0.021) (0.025) (0.024) (0.024) (0.024) Middle East 4.307*** 4.218*** 3.438*** 3.353*** 2.227*** 1.971*** (0.061) (0.059) (0.062) (0.061) (0.060) (0.059) Rest of Asia 2.396*** 2.258*** 2.091*** 2.002*** 2.142*** 1.898*** (0.033) (0.033) (0.036) (0.036) (0.033) (0.032) Oceania 2.227*** 2.040*** 2.238*** 2.031*** 2.542*** 2.243*** (0.058) (0.056) (0.056) (0.055) (0.062) (0.060) Other ‐0.043 0.164* ‐0.258* ‐0.026 ‐0.029 0.017 (0.083) (0.081) (0.109) (0.107) (0.093) (0.090) Year & Quarter dummies Yes Yes Yes Yes Yes Yes Age controls No Yes No Yes No Yes N 695715 695715 602302 602302 553780 553780 The table reports the average difference (in years) in the age at which individuals left full time education between immigrant and natives for all immigrants pooled (row 1), and immigrants from different origin countries (rows 2‐10). Each difference is the coefficient in a regression of years of education on an immigrant dummy (row 1), or on country of origin dummies (rows 2‐10). Robust standard errors are in parenthesis. All regression include interactions of Year and Quarters fixed effects. Age controls are age and age squared. * denotes significance at 5%, ** denotes significance at 1%, *** denotes significance at 0.1%

The Socio-Economic Integration of Migrants
Christian Dustmann and Tommaso Frattini 79
Table 4.1.2: Immigrants-natives education gap, by gender 1993‐1994 2000‐2001 2008‐2009 (1) (2) (3) (4) (5) (6) Men Women Men Women Men Women Men Women Men Women Men Women
All immigrants
1.587*** 0.831*** 1.600*** 0.827*** 1.809*** 1.221*** 1.772*** 1.175*** 2.051*** 1.509*** 1.872*** 1.302***
(0.026) (0.023) (0.025) (0.023) (0.027) (0.025) (0.027) (0.024) (0.025) (0.023) (0.024) (0.022)
Western Europe
0.453*** 0.589*** 0.545*** 0.687*** 0.946*** 1.209*** 0.962*** 1.220*** 1.434*** 1.327*** 1.360*** 1.265***
(0.028) (0.023) (0.027) (0.023) (0.031) (0.027) (0.031) (0.027) (0.036) (0.031) (0.035) (0.030)
Eastern Europe
2.868*** 3.349*** 3.453*** 3.548*** 2.753*** 2.841*** 2.707*** 2.664*** 2.338*** 2.940*** 1.968*** 2.445***
(0.119) (0.096) (0.116) (0.093) (0.110) (0.078) (0.108) (0.076) (0.043) (0.038) (0.042) (0.037)
Americas 1.476*** 1.642*** 1.584*** 1.707*** 1.864*** 1.944*** 1.917*** 2.025*** 2.079*** 2.086*** 1.994*** 2.015***
(0.046) (0.037) (0.045) (0.036) (0.052) (0.042) (0.051) (0.041) (0.057) (0.046) (0.056) (0.045)
Africa 2.899*** 1.582*** 2.728*** 1.443*** 2.831*** 1.754*** 2.719*** 1.618*** 2.626*** 1.255*** 2.454*** 1.051***
(0.037) (0.034) (0.036) (0.033) (0.038) (0.034) (0.037) (0.033) (0.036) (0.032) (0.036) (0.031)
Indian Sub‐Continent
1.019*** ‐0.860*** 1.060*** ‐0.897*** 1.255*** ‐0.605*** 1.234*** ‐0.670*** 1.678*** 0.327*** 1.523*** 0.154***
(0.032) (0.029) (0.032) (0.028) (0.036) (0.033) (0.036) (0.033) (0.036) (0.033) (0.035) (0.032)
Middle East 5.196*** 2.985*** 5.093*** 2.882*** 4.000*** 2.604*** 3.896*** 2.536*** 2.333*** 2.031*** 2.121*** 1.722***
(0.083) (0.089) (0.081) (0.086) (0.085) (0.093) (0.083) (0.090) (0.080) (0.093) (0.078) (0.090)
Rest of Asia 3.033*** 1.875*** 2.884*** 1.753*** 2.401*** 1.835*** 2.293*** 1.768*** 2.428*** 1.921*** 2.212*** 1.647***
(0.053) (0.042) (0.052) (0.041) (0.056) (0.047) (0.055) (0.045) (0.051) (0.042) (0.050) (0.040)
Oceania 2.565*** 1.978*** 2.375*** 1.796*** 2.338*** 2.129*** 2.149*** 1.886*** 2.783*** 2.279*** 2.493*** 1.980***
(0.094) (0.071) (0.091) (0.069) (0.081) (0.077) (0.080) (0.075) (0.089) (0.085) (0.088) (0.082)
Other ‐0.270* 0.16 0.001 0.330** ‐0.323 ‐0.197 ‐0.063 0.021 ‐0.139 0.063 ‐0.16 0.179
(0.128) (0.106) (0.124) (0.103) (0.165) (0.142) (0.162) (0.139) (0.147) (0.117) (0.144) (0.113)
Year & Quarter dummies
Yes Yes Yes Yes Yes Yes Yes Yes Yes Yes Yes Yes
Age controls No No Yes Yes No No Yes Yes No No Yes Yes
N 350867 344848 350867 344848 300664 301638 300664 301638 264396 289384 264396 289384
The table reports the average difference (in years) in the age at which individuals left full time education between immigrant and natives for all immigrants pooled (row 1), and immigrants from different origin countries (rows 2‐10), by gender. Each difference is the coefficient in a regression of years of education on an immigrant dummy (row 1), or on country of origin dummies (rows 2‐10). Separate regressions have been run for men and women. Robust standard errors are in parenthesis. All regression include interactions of Year and Quarters fixed effects. Age controls are age and age squared. * denotes significance at 5%, ** denotes significance at 1%, *** denotes significance at 0.1%

The Socio-Economic Integration of Migrants
Christian Dustmann and Tommaso Frattini 80
Table 4.1.3: Minority Immigrants- White natives education gap 1993‐1994 2000‐2001 2008‐2009
(1) (2) (3) (4) (5) (6)
White immigrants 1.362*** 1.403*** 1.799*** 1.762*** 2.119*** 1.917*** (0.014) (0.014) (0.017) (0.016) (0.016) (0.015)
Black ‐ Caribbean ‐0.223*** 0.038 ‐0.323*** ‐0.073 ‐0.257*** ‐0.04 (0.040) (0.039) (0.054) (0.053) (0.060) (0.059)
Black ‐ African 2.894*** 2.688*** 2.468*** 2.265*** 2.201*** 1.913*** (0.047) (0.046) (0.046) (0.045) (0.037) (0.037)
Indian 1.382*** 1.337*** 1.664*** 1.687*** 2.099*** 2.009*** (0.026) (0.025) (0.032) (0.032) (0.031) (0.030)
Pakistani ‐0.993*** ‐1.092*** ‐0.571*** ‐0.716*** ‐0.041 ‐0.239*** (0.036) (0.035) (0.043) (0.042) (0.040) (0.039)
Bangladeshi ‐1.034*** ‐1.137*** ‐0.483*** ‐0.679*** ‐0.214*** ‐0.547*** (0.059) (0.057) (0.063) (0.061) (0.061) (0.059)
Chinese 1.795*** 1.642*** 1.852*** 1.774*** 2.845*** 2.618*** (0.059) (0.057) (0.076) (0.074) (0.065) (0.063)
Other ‐ mixed 2.850*** 2.737*** 2.393*** 2.290*** 1.890*** 1.623*** (0.036) (0.035) (0.035) (0.035) (0.025) (0.024)
Year & Quarter dummies Yes Yes Yes Yes Yes Yes
Age controls No Yes No Yes No Yes N 687548 687548 518892 518892 539601 539601 The table reports the average difference (in years) in the age at which individuals left full time education between immigrants from different ethnic groups and white natives. Each difference is the coefficient in a regression of years of education on an immigrant dummy interacted with dummies for ethnic groups. Robust standard errors are in parenthesis. All regression include interactions of Year and Quarters fixed effects. Age controls are age and age squared. * denotes significance at 5%, ** denotes significance at 1%, *** denotes significance at 0.1%
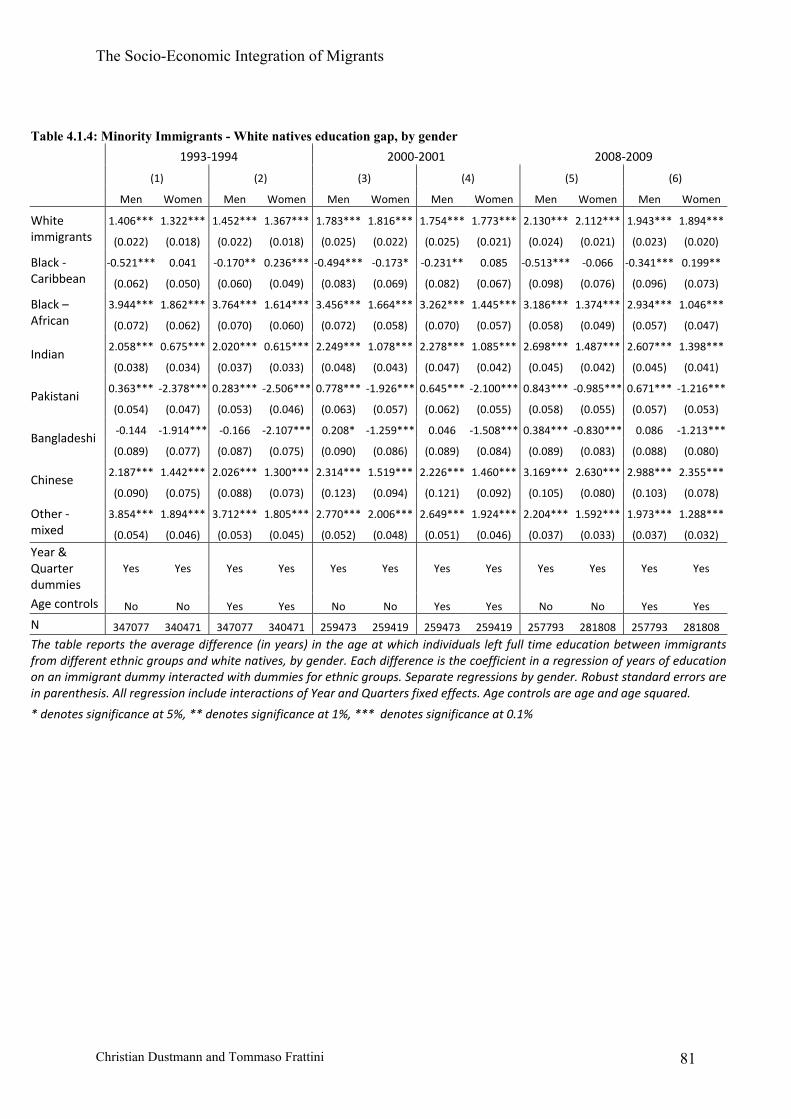
The Socio-Economic Integration of Migrants
Christian Dustmann and Tommaso Frattini 81
Table 4.1.4: Minority Immigrants - White natives education gap, by gender 1993‐1994 2000‐2001 2008‐2009 (1) (2) (3) (4) (5) (6)
Men Women Men Women Men Women Men Women Men Women Men Women
White immigrants
1.406*** 1.322*** 1.452*** 1.367*** 1.783*** 1.816*** 1.754*** 1.773*** 2.130*** 2.112*** 1.943*** 1.894***
(0.022) (0.018) (0.022) (0.018) (0.025) (0.022) (0.025) (0.021) (0.024) (0.021) (0.023) (0.020)
Black ‐ Caribbean
‐0.521*** 0.041 ‐0.170** 0.236*** ‐0.494*** ‐0.173* ‐0.231** 0.085 ‐0.513*** ‐0.066 ‐0.341*** 0.199**
(0.062) (0.050) (0.060) (0.049) (0.083) (0.069) (0.082) (0.067) (0.098) (0.076) (0.096) (0.073)
Black – African
3.944*** 1.862*** 3.764*** 1.614*** 3.456*** 1.664*** 3.262*** 1.445*** 3.186*** 1.374*** 2.934*** 1.046***
(0.072) (0.062) (0.070) (0.060) (0.072) (0.058) (0.070) (0.057) (0.058) (0.049) (0.057) (0.047)
Indian 2.058*** 0.675*** 2.020*** 0.615*** 2.249*** 1.078*** 2.278*** 1.085*** 2.698*** 1.487*** 2.607*** 1.398***
(0.038) (0.034) (0.037) (0.033) (0.048) (0.043) (0.047) (0.042) (0.045) (0.042) (0.045) (0.041)
Pakistani 0.363*** ‐2.378*** 0.283*** ‐2.506*** 0.778*** ‐1.926*** 0.645*** ‐2.100*** 0.843*** ‐0.985*** 0.671*** ‐1.216***
(0.054) (0.047) (0.053) (0.046) (0.063) (0.057) (0.062) (0.055) (0.058) (0.055) (0.057) (0.053)
Bangladeshi ‐0.144 ‐1.914*** ‐0.166 ‐2.107*** 0.208* ‐1.259*** 0.046 ‐1.508*** 0.384*** ‐0.830*** 0.086 ‐1.213***
(0.089) (0.077) (0.087) (0.075) (0.090) (0.086) (0.089) (0.084) (0.089) (0.083) (0.088) (0.080)
Chinese 2.187*** 1.442*** 2.026*** 1.300*** 2.314*** 1.519*** 2.226*** 1.460*** 3.169*** 2.630*** 2.988*** 2.355***
(0.090) (0.075) (0.088) (0.073) (0.123) (0.094) (0.121) (0.092) (0.105) (0.080) (0.103) (0.078)
Other ‐ mixed
3.854*** 1.894*** 3.712*** 1.805*** 2.770*** 2.006*** 2.649*** 1.924*** 2.204*** 1.592*** 1.973*** 1.288***
(0.054) (0.046) (0.053) (0.045) (0.052) (0.048) (0.051) (0.046) (0.037) (0.033) (0.037) (0.032)
Year & Quarter dummies
Yes Yes Yes Yes Yes Yes Yes Yes Yes Yes Yes Yes
Age controls No No Yes Yes No No Yes Yes No No Yes Yes
N 347077 340471 347077 340471 259473 259419 259473 259419 257793 281808 257793 281808
The table reports the average difference (in years) in the age at which individuals left full time education between immigrants from different ethnic groups and white natives, by gender. Each difference is the coefficient in a regression of years of education on an immigrant dummy interacted with dummies for ethnic groups. Separate regressions by gender. Robust standard errors are in parenthesis. All regression include interactions of Year and Quarters fixed effects. Age controls are age and age squared.
* denotes significance at 5%, ** denotes significance at 1%, *** denotes significance at 0.1%

The Socio-Economic Integration of Migrants
Christian Dustmann and Tommaso Frattini 82
Table 4.1.5: Immigrants-natives education gap by region 1993‐1994 2000‐2001 2008‐2009
(1) (2) (3) (4) (5) (6)
North East 1.454*** 1.355*** 2.019*** 1.894*** 2.730*** 2.511*** (0.160) (0.158) (0.135) (0.135) (0.121) (0.118)
North West 0.617*** 0.636*** 0.945*** 0.928*** 1.271*** 1.069*** (0.066) (0.064) (0.077) (0.076) (0.056) (0.054)
Yorks & Humbers.
0.145 0.151 0.504*** 0.457*** 1.202*** 1.007*** (0.079) (0.078) (0.090) (0.089) (0.065) (0.063)
East Midlands 0.951*** 0.958*** 1.037*** 1.036*** 1.514*** 1.333*** (0.060) (0.059) (0.070) (0.069) (0.060) (0.059)
West Midlands ‐0.249*** ‐0.198*** 0.094 0.130 0.864*** 0.721***
(0.060) (0.059) (0.068) (0.067) (0.057) (0.056)
Eastern 1.395*** 1.398*** 1.606*** 1.572*** 1.971*** 1.798*** (0.058) (0.057) (0.057) (0.056) (0.050) (0.049)
London 0.994*** 1.048*** 0.865*** 0.881*** 0.952*** 0.886*** (0.029) (0.029) (0.031) (0.031) (0.035) (0.034)
South East 1.301*** 1.288*** 1.763*** 1.727*** 1.853*** 1.676*** (0.044) (0.043) (0.046) (0.045) (0.040) (0.039)
South West 1.075*** 1.079*** 1.531*** 1.506*** 1.862*** 1.628*** (0.064) (0.063) (0.066) (0.065) (0.061) (0.060)
Wales 1.440*** 1.422*** 2.308*** 2.256*** 1.633*** 1.442*** (0.129) (0.126) (0.135) (0.133) (0.093) (0.090)
Scotland 1.847*** 1.778*** 2.198*** 2.114*** 2.393*** 2.097*** (0.082) (0.080) (0.087) (0.086) (0.063) (0.062)
Year & Quarter dummies
Yes Yes Yes Yes Yes Yes
Age controls No Yes No Yes No Yes
N 695715 695715 602302 602302 553780 553780
The table reports the average difference (in years) in the age at which individuals left full time education between immigrants and natives in each Government Office Region. Each difference is the coefficient in a regression of years at which individuals left full time education on an immigrant dummy interacted with region dummies. All regression include interactions of Year and Quarters fixed effects and regional dummies. Age controls are age and age squared. * denotes significance at 5%, ** denotes significance at 1%, *** denotes significance at 0.1%

The Socio-Economic Integration of Migrants
Christian Dustmann and Tommaso Frattini 83
Table 4.1.6: Immigrants-natives employment gap 1993‐1994 2000‐2001 2008‐2009
(1) (2) (3) (4) (5) (6) (7) (8) (9)
All Immigrants
‐0.105*** ‐0.105*** ‐0.135*** ‐0.105*** ‐0.111*** ‐0.140*** ‐0.027*** ‐0.034*** ‐0.102***(0.002) (0.002) (0.002) (0.002) (0.002) (0.002) (0.002) (0.002) (0.002)
Western Europe
‐0.053*** ‐0.055*** ‐0.066*** ‐0.050*** ‐0.058*** ‐0.073*** ‐0.006 ‐0.014*** ‐0.046***(0.003) (0.003) (0.003) (0.003) (0.003) (0.003) (0.004) (0.004) (0.003)
Eastern Europe
‐0.074*** ‐0.074*** ‐0.111*** ‐0.189*** ‐0.195*** ‐0.239*** 0.106*** 0.101*** ‐0.009* (0.014) (0.014) (0.014) (0.010) (0.010) (0.010) (0.005) (0.005) (0.004)
Americas ‐0.066*** ‐0.066*** ‐0.096*** ‐0.071*** ‐0.078*** ‐0.109*** ‐0.013* ‐0.021*** ‐0.067***
(0.005) (0.005) (0.005) (0.005) (0.005) (0.005) (0.006) (0.006) (0.005)
Africa ‐0.080*** ‐0.079*** ‐0.133*** ‐0.070*** ‐0.077*** ‐0.125*** ‐0.034*** ‐0.043*** ‐0.118***
(0.005) (0.005) (0.005) (0.004) (0.004) (0.004) (0.004) (0.004) (0.004)
Indian Sub‐Continent
‐0.231*** ‐0.228*** ‐0.249*** ‐0.239*** ‐0.240*** ‐0.258*** ‐0.152*** ‐0.153*** ‐0.211***(0.004) (0.004) (0.004) (0.004) (0.004) (0.004) (0.004) (0.004) (0.004)
Middle East
‐0.180*** ‐0.174*** ‐0.253*** ‐0.209*** ‐0.212*** ‐0.272*** ‐0.223*** ‐0.226*** ‐0.313***(0.011) (0.011) (0.011) (0.010) (0.010) (0.010) (0.010) (0.010) (0.009)
Rest of Asia ‐0.105*** ‐0.105*** ‐0.164*** ‐0.105*** ‐0.111*** ‐0.158*** 0.008 ‐0.001 ‐0.098***
(0.006) (0.006) (0.006) (0.006) (0.006) (0.006) (0.005) (0.005) (0.005)
Oceania 0.059*** 0.055*** 0.009 0.081*** 0.073*** 0.026** 0.135*** 0.124*** 0.012 (0.010) (0.010) (0.010) (0.009) (0.009) (0.009) (0.010) (0.010) (0.009)
Other ‐0.167*** ‐0.164*** ‐0.154*** ‐0.147*** ‐0.152*** ‐0.130*** ‐0.089*** ‐0.095*** ‐0.080***
(0.015) (0.015) (0.015) (0.017) (0.017) (0.017) (0.015) (0.015) (0.013) Year & Quarter dummies
Yes Yes Yes Yes Yes Yes Yes Yes Yes
Region dummies
No Yes Yes No Yes Yes No Yes Yes
Age & educ controls
No No Yes No No Yes No No Yes
N 695715 695715 695715 602302 602302 602302 553780 553780 553780 The table reports the average difference in employment probability between immigrants and natives for all immigrantspooled (row 1), and immigrants from different origin countries (rows 2‐10). Each difference is the coefficient in a regression of a dummy for employment status on an immigrant dummy (row 1), or on country of origin dummies (rows 2‐10). Robust standard errors are in parenthesis. All regression include interactions of Year and Quarters fixed effects. Agecontrols are age and age squared. Education controls are dummies for three education levels. * denotes significance at 5%, ** denotes significance at 1%, *** denotes significance at 0.1%
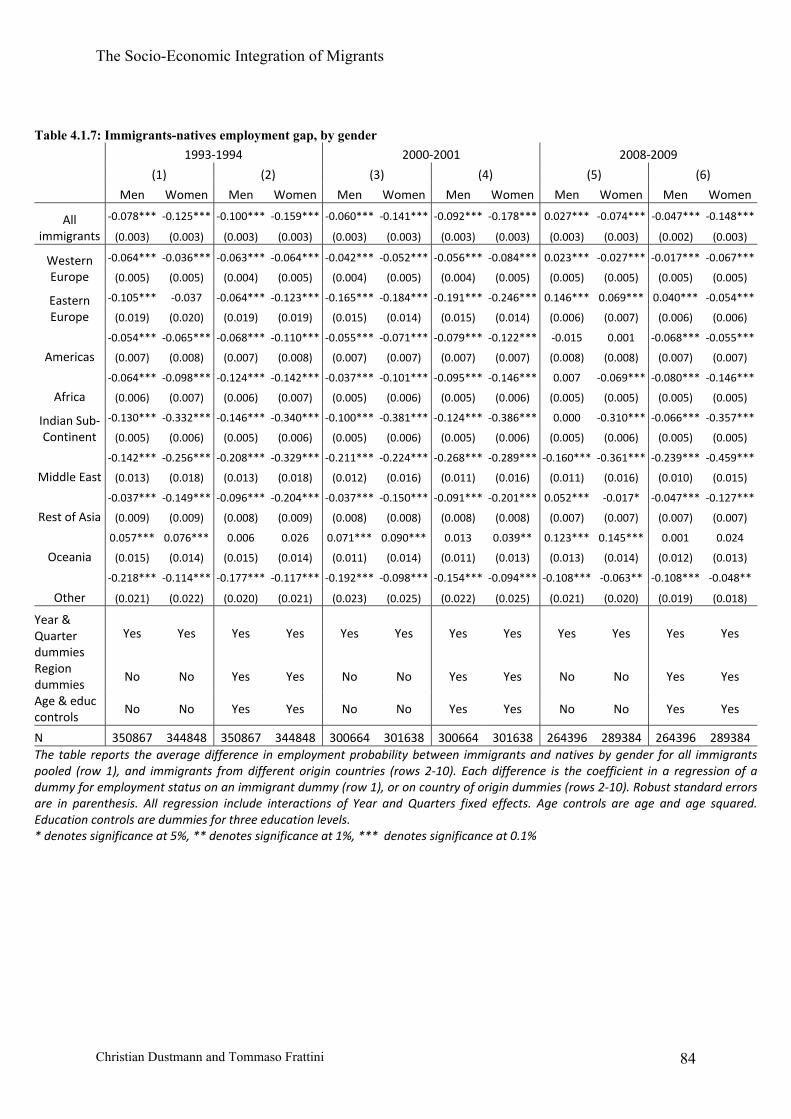
The Socio-Economic Integration of Migrants
Christian Dustmann and Tommaso Frattini 84
Table 4.1.7: Immigrants-natives employment gap, by gender 1993‐1994 2000‐2001 2008‐2009
(1) (2) (3) (4) (5) (6)
Men Women Men Women Men Women Men Women Men Women Men Women
All immigrants
‐0.078*** ‐0.125*** ‐0.100*** ‐0.159*** ‐0.060*** ‐0.141*** ‐0.092*** ‐0.178*** 0.027*** ‐0.074*** ‐0.047*** ‐0.148***
(0.003) (0.003) (0.003) (0.003) (0.003) (0.003) (0.003) (0.003) (0.003) (0.003) (0.002) (0.003)
Western Europe
‐0.064*** ‐0.036*** ‐0.063*** ‐0.064*** ‐0.042*** ‐0.052*** ‐0.056*** ‐0.084*** 0.023*** ‐0.027*** ‐0.017*** ‐0.067***
(0.005) (0.005) (0.004) (0.005) (0.004) (0.005) (0.004) (0.005) (0.005) (0.005) (0.005) (0.005)
Eastern Europe
‐0.105*** ‐0.037 ‐0.064*** ‐0.123*** ‐0.165*** ‐0.184*** ‐0.191*** ‐0.246*** 0.146*** 0.069*** 0.040*** ‐0.054***
(0.019) (0.020) (0.019) (0.019) (0.015) (0.014) (0.015) (0.014) (0.006) (0.007) (0.006) (0.006)
Americas
‐0.054*** ‐0.065*** ‐0.068*** ‐0.110*** ‐0.055*** ‐0.071*** ‐0.079*** ‐0.122*** ‐0.015 0.001 ‐0.068*** ‐0.055***
(0.007) (0.008) (0.007) (0.008) (0.007) (0.007) (0.007) (0.007) (0.008) (0.008) (0.007) (0.007)
Africa
‐0.064*** ‐0.098*** ‐0.124*** ‐0.142*** ‐0.037*** ‐0.101*** ‐0.095*** ‐0.146*** 0.007 ‐0.069*** ‐0.080*** ‐0.146***
(0.006) (0.007) (0.006) (0.007) (0.005) (0.006) (0.005) (0.006) (0.005) (0.005) (0.005) (0.005)
Indian Sub‐Continent
‐0.130*** ‐0.332*** ‐0.146*** ‐0.340*** ‐0.100*** ‐0.381*** ‐0.124*** ‐0.386*** 0.000 ‐0.310*** ‐0.066*** ‐0.357***
(0.005) (0.006) (0.005) (0.006) (0.005) (0.006) (0.005) (0.006) (0.005) (0.006) (0.005) (0.005)
Middle East
‐0.142*** ‐0.256*** ‐0.208*** ‐0.329*** ‐0.211*** ‐0.224*** ‐0.268*** ‐0.289*** ‐0.160*** ‐0.361*** ‐0.239*** ‐0.459***
(0.013) (0.018) (0.013) (0.018) (0.012) (0.016) (0.011) (0.016) (0.011) (0.016) (0.010) (0.015)
Rest of Asia
‐0.037*** ‐0.149*** ‐0.096*** ‐0.204*** ‐0.037*** ‐0.150*** ‐0.091*** ‐0.201*** 0.052*** ‐0.017* ‐0.047*** ‐0.127***
(0.009) (0.009) (0.008) (0.009) (0.008) (0.008) (0.008) (0.008) (0.007) (0.007) (0.007) (0.007)
Oceania
0.057*** 0.076*** 0.006 0.026 0.071*** 0.090*** 0.013 0.039** 0.123*** 0.145*** 0.001 0.024
(0.015) (0.014) (0.015) (0.014) (0.011) (0.014) (0.011) (0.013) (0.013) (0.014) (0.012) (0.013)
Other
‐0.218*** ‐0.114*** ‐0.177*** ‐0.117*** ‐0.192*** ‐0.098*** ‐0.154*** ‐0.094*** ‐0.108*** ‐0.063** ‐0.108*** ‐0.048**
(0.021) (0.022) (0.020) (0.021) (0.023) (0.025) (0.022) (0.025) (0.021) (0.020) (0.019) (0.018)
Year & Quarter dummies
Yes Yes Yes Yes Yes Yes Yes Yes Yes Yes Yes Yes
Region dummies
No No Yes Yes No No Yes Yes No No Yes Yes
Age & educ controls
No No Yes Yes No No Yes Yes No No Yes Yes
N 350867 344848 350867 344848 300664 301638 300664 301638 264396 289384 264396 289384 The table reports the average difference in employment probability between immigrants and natives by gender for all immigrants pooled (row 1), and immigrants from different origin countries (rows 2‐10). Each difference is the coefficient in a regression of a dummy for employment status on an immigrant dummy (row 1), or on country of origin dummies (rows 2‐10). Robust standard errors are in parenthesis. All regression include interactions of Year and Quarters fixed effects. Age controls are age and age squared.Education controls are dummies for three education levels. * denotes significance at 5%, ** denotes significance at 1%, *** denotes significance at 0.1%

The Socio-Economic Integration of Migrants
Christian Dustmann and Tommaso Frattini 85
Table 4.1.8: Minority Immigrants- White natives employment gap 1993‐1994 2000‐2001 2008‐2009 (1) (2) (3) (4) (5) (6) (7) (8) (9)
White immigrants
‐0.035*** ‐0.041*** ‐0.068*** ‐0.034*** ‐0.046*** ‐0.077*** 0.046*** 0.036*** ‐0.038***(0.003) (0.003) (0.003) (0.003) (0.003) (0.003) (0.003) (0.003) (0.002)
Black ‐ Caribbean
‐0.120*** ‐0.122*** ‐0.107*** ‐0.120*** ‐0.129*** ‐0.105*** ‐0.111*** ‐0.119*** ‐0.054***(0.007) (0.007) (0.007) (0.009) (0.009) (0.008) (0.010) (0.010) (0.009)
Black ‐ African
‐0.279*** ‐0.278*** ‐0.335*** ‐0.186*** ‐0.196*** ‐0.243*** ‐0.101*** ‐0.111*** ‐0.205***(0.009) (0.009) (0.009) (0.007) (0.007) (0.007) (0.006) (0.006) (0.006)
Indian ‐0.076*** ‐0.079*** ‐0.118*** ‐0.084*** ‐0.092*** ‐0.127*** ‐0.029*** ‐0.036*** ‐0.098***
(0.005) (0.005) (0.005) (0.005) (0.005) (0.005) (0.005) (0.005) (0.005)
Pakistani ‐0.358*** ‐0.355*** ‐0.371*** ‐0.337*** ‐0.335*** ‐0.355*** ‐0.247*** ‐0.243*** ‐0.305***
(0.007) (0.007) (0.006) (0.007) (0.007) (0.007) (0.006) (0.006) (0.006)
Bangladeshi ‐0.433*** ‐0.432*** ‐0.426*** ‐0.388*** ‐0.393*** ‐0.393*** ‐0.258*** ‐0.263*** ‐0.334***
(0.011) (0.011) (0.011) (0.010) (0.010) (0.010) (0.010) (0.010) (0.009)
Chinese ‐0.111*** ‐0.111*** ‐0.167*** ‐0.135*** ‐0.142*** ‐0.188*** ‐0.003 ‐0.008 ‐0.105***
(0.011) (0.011) (0.010) (0.012) (0.012) (0.012) (0.010) (0.010) (0.009)
Other ‐ mixed ‐0.163*** ‐0.165*** ‐0.227*** ‐0.166*** ‐0.177*** ‐0.221*** ‐0.057*** ‐0.067*** ‐0.160***
(0.006) (0.006) (0.006) (0.006) (0.006) (0.006) (0.004) (0.004) (0.004) Year & Quarter dummies
Yes Yes Yes Yes Yes Yes Yes Yes Yes
Region dummies
No Yes Yes No Yes Yes No Yes Yes
Age & educ controls
No No Yes No No Yes No No Yes
N 687548 687548 687548 518892 518892 518892 539601 539601 539601 The table reports the average difference in employment probability between minority immigrants and natives for all immigrantspooled (row 1), and immigrants from different origin countries (rows 2‐10). Each difference is the coefficient in a regression ofyears of education on an immigrant dummy (row 1), or on country of origin dummies (rows 2‐10). Robust standard errors are inparenthesis. All regression include interactions of Year and Quarters fixed effects. Age controls are age and age squared.Education controls are dummies for three education levels. * denotes significance at 5%, ** denotes significance at 1%, *** denotes significance at 0.1%
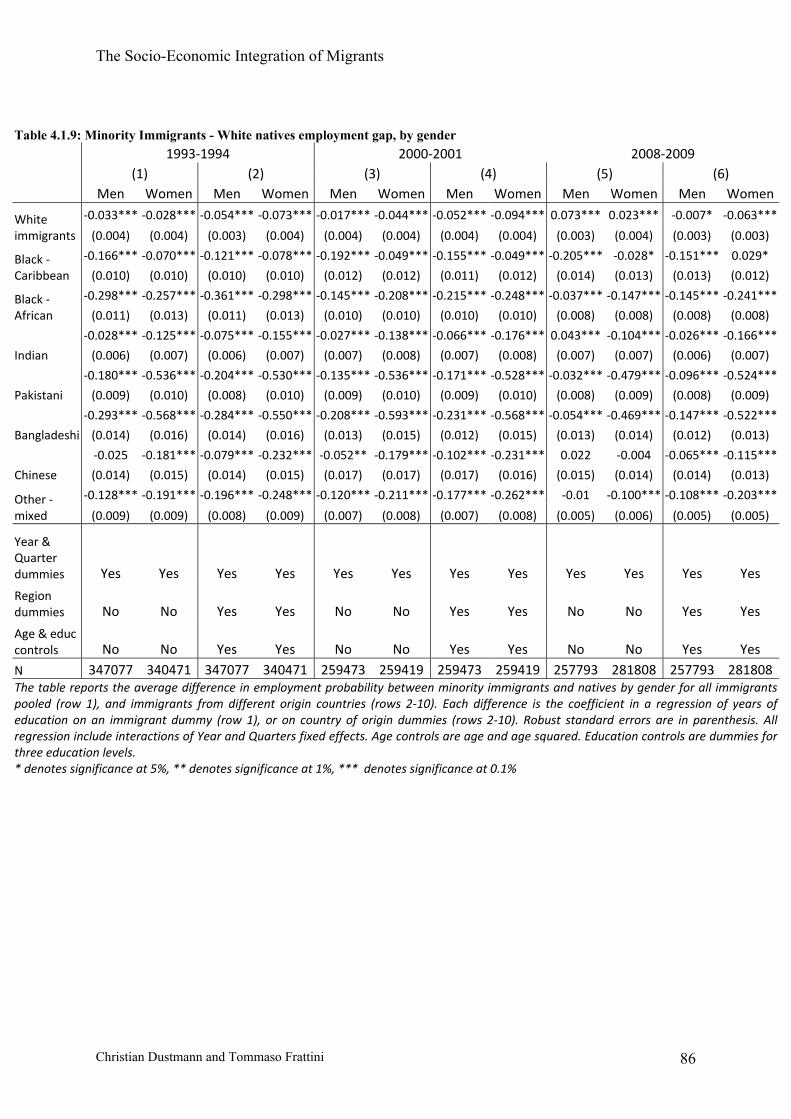
The Socio-Economic Integration of Migrants
Christian Dustmann and Tommaso Frattini 86
Table 4.1.9: Minority Immigrants - White natives employment gap, by gender 1993‐1994 2000‐2001 2008‐2009 (1) (2) (3) (4) (5) (6) Men Women Men Women Men Women Men Women Men Women Men Women
White immigrants
‐0.033*** ‐0.028*** ‐0.054*** ‐0.073*** ‐0.017*** ‐0.044*** ‐0.052*** ‐0.094*** 0.073*** 0.023*** ‐0.007* ‐0.063***
(0.004) (0.004) (0.003) (0.004) (0.004) (0.004) (0.004) (0.004) (0.003) (0.004) (0.003) (0.003)
Black ‐ Caribbean
‐0.166*** ‐0.070*** ‐0.121*** ‐0.078*** ‐0.192*** ‐0.049*** ‐0.155*** ‐0.049*** ‐0.205*** ‐0.028* ‐0.151*** 0.029*
(0.010) (0.010) (0.010) (0.010) (0.012) (0.012) (0.011) (0.012) (0.014) (0.013) (0.013) (0.012)
Black ‐ African
‐0.298*** ‐0.257*** ‐0.361*** ‐0.298*** ‐0.145*** ‐0.208*** ‐0.215*** ‐0.248*** ‐0.037*** ‐0.147*** ‐0.145*** ‐0.241***
(0.011) (0.013) (0.011) (0.013) (0.010) (0.010) (0.010) (0.010) (0.008) (0.008) (0.008) (0.008)
Indian
‐0.028*** ‐0.125*** ‐0.075*** ‐0.155*** ‐0.027*** ‐0.138*** ‐0.066*** ‐0.176*** 0.043*** ‐0.104*** ‐0.026*** ‐0.166***
(0.006) (0.007) (0.006) (0.007) (0.007) (0.008) (0.007) (0.008) (0.007) (0.007) (0.006) (0.007)
Pakistani
‐0.180*** ‐0.536*** ‐0.204*** ‐0.530*** ‐0.135*** ‐0.536*** ‐0.171*** ‐0.528*** ‐0.032*** ‐0.479*** ‐0.096*** ‐0.524***
(0.009) (0.010) (0.008) (0.010) (0.009) (0.010) (0.009) (0.010) (0.008) (0.009) (0.008) (0.009)
Bangladeshi
‐0.293*** ‐0.568*** ‐0.284*** ‐0.550*** ‐0.208*** ‐0.593*** ‐0.231*** ‐0.568*** ‐0.054*** ‐0.469*** ‐0.147*** ‐0.522***
(0.014) (0.016) (0.014) (0.016) (0.013) (0.015) (0.012) (0.015) (0.013) (0.014) (0.012) (0.013)
Chinese
‐0.025 ‐0.181*** ‐0.079*** ‐0.232*** ‐0.052** ‐0.179*** ‐0.102*** ‐0.231*** 0.022 ‐0.004 ‐0.065*** ‐0.115***
(0.014) (0.015) (0.014) (0.015) (0.017) (0.017) (0.017) (0.016) (0.015) (0.014) (0.014) (0.013)
Other ‐ mixed
‐0.128*** ‐0.191*** ‐0.196*** ‐0.248*** ‐0.120*** ‐0.211*** ‐0.177*** ‐0.262*** ‐0.01 ‐0.100*** ‐0.108*** ‐0.203***
(0.009) (0.009) (0.008) (0.009) (0.007) (0.008) (0.007) (0.008) (0.005) (0.006) (0.005) (0.005)
Year & Quarter dummies Yes Yes Yes Yes Yes Yes Yes Yes Yes Yes Yes Yes
Region dummies No No Yes Yes No No Yes Yes No No Yes Yes
Age & educ controls No No Yes Yes No No Yes Yes No No Yes Yes N 347077 340471 347077 340471 259473 259419 259473 259419 257793 281808 257793 281808The table reports the average difference in employment probability between minority immigrants and natives by gender for all immigrants pooled (row 1), and immigrants from different origin countries (rows 2‐10). Each difference is the coefficient in a regression of years of education on an immigrant dummy (row 1), or on country of origin dummies (rows 2‐10). Robust standard errors are in parenthesis. All regression include interactions of Year and Quarters fixed effects. Age controls are age and age squared. Education controls are dummies for three education levels. * denotes significance at 5%, ** denotes significance at 1%, *** denotes significance at 0.1%

The Socio-Economic Integration of Migrants
Christian Dustmann and Tommaso Frattini 87
Table 4.1.10: Immigrants-natives employment gap by region 1993‐1994 2000‐2001 2008‐2009
(1) (2) (3) (4) (5) (6) North East ‐0.033 ‐0.077*** ‐0.032 ‐0.078*** ‐0.005 ‐0.113***
(0.018) (0.018) (0.017) (0.017) (0.013) (0.012) North West ‐0.157*** ‐0.184*** ‐0.118*** ‐0.147*** ‐0.046*** ‐0.125***
(0.008) (0.008) (0.009) (0.009) (0.007) (0.007) Yorks & Humbers. ‐0.168*** ‐0.188*** ‐0.157*** ‐0.186*** ‐0.074*** ‐0.149***
(0.009) (0.009) (0.009) (0.009) (0.008) (0.007) East Midlands ‐0.106*** ‐0.134*** ‐0.089*** ‐0.118*** ‐0.029*** ‐0.103***
(0.009) (0.009) (0.009) (0.009) (0.008) (0.007) West Midlands ‐0.161*** ‐0.178*** ‐0.193*** ‐0.211*** ‐0.107*** ‐0.168***
(0.007) (0.007) (0.008) (0.008) (0.007) (0.007) Eastern ‐0.056*** ‐0.093*** ‐0.065*** ‐0.105*** ‐0.001 ‐0.085***
(0.007) (0.007) (0.007) (0.007) (0.006) (0.006) London ‐0.116*** ‐0.144*** ‐0.141*** ‐0.163*** ‐0.069*** ‐0.107***
(0.004) (0.004) (0.004) (0.004) (0.004) (0.004) South East ‐0.063*** ‐0.098*** ‐0.061*** ‐0.100*** 0.023*** ‐0.056***
(0.006) (0.006) (0.005) (0.005) (0.005) (0.004) South West ‐0.033*** ‐0.062*** ‐0.058*** ‐0.094*** 0.050*** ‐0.044***
(0.009) (0.009) (0.008) (0.008) (0.007) (0.007) Wales ‐0.049** ‐0.084*** ‐0.005 ‐0.054*** 0.011 ‐0.063***
(0.015) (0.015) (0.016) (0.015) (0.013) (0.012) Scotland ‐0.065*** ‐0.110*** ‐0.029** ‐0.076*** 0.023** ‐0.083***
(0.010) (0.010) (0.010) (0.010) (0.008) (0.008)
Year & Quarter dummies Yes Yes Yes Yes Yes Yes Region dummies Yes Yes Yes Yes Yes Yes
Age controls No Yes No Yes No Yes N 695715 695715 602302 602302 553780 553780 The table reports the average difference in employment probability between immigrants and natives in each Government Office Region. Each difference is the coefficient in a regression of a dummy variable for employment status on an immigrant dummy interacted with region dummies. All regression include interactions of Year and Quarters fixed effects and regional dummies. Age controls are age and age squared. * denotes significance at 5%, ** denotes significance at 1%, *** denotes significance at 0.1%
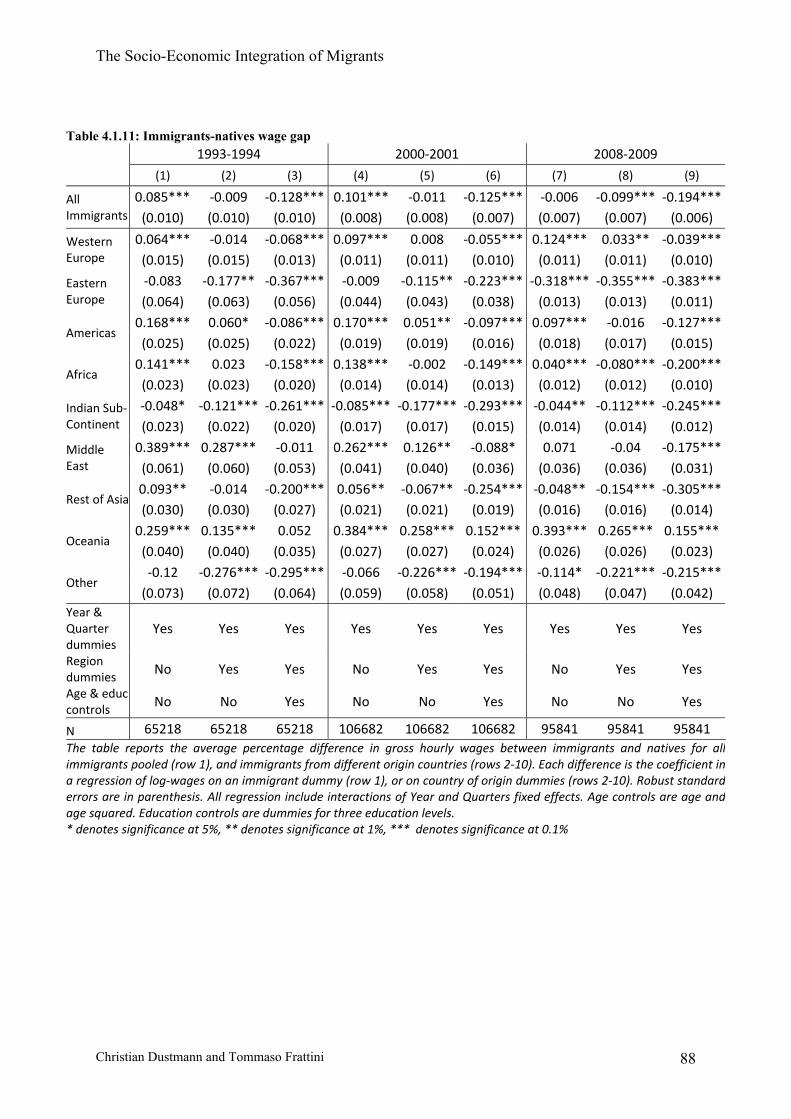
The Socio-Economic Integration of Migrants
Christian Dustmann and Tommaso Frattini 88
Table 4.1.11: Immigrants-natives wage gap 1993‐1994 2000‐2001 2008‐2009
(1) (2) (3) (4) (5) (6) (7) (8) (9)
All Immigrants
0.085*** ‐0.009 ‐0.128*** 0.101*** ‐0.011 ‐0.125*** ‐0.006 ‐0.099*** ‐0.194***(0.010) (0.010) (0.010) (0.008) (0.008) (0.007) (0.007) (0.007) (0.006)
Western Europe
0.064*** ‐0.014 ‐0.068*** 0.097*** 0.008 ‐0.055*** 0.124*** 0.033** ‐0.039***(0.015) (0.015) (0.013) (0.011) (0.011) (0.010) (0.011) (0.011) (0.010)
Eastern Europe
‐0.083 ‐0.177** ‐0.367*** ‐0.009 ‐0.115** ‐0.223*** ‐0.318*** ‐0.355*** ‐0.383***(0.064) (0.063) (0.056) (0.044) (0.043) (0.038) (0.013) (0.013) (0.011)
Americas 0.168*** 0.060* ‐0.086*** 0.170*** 0.051** ‐0.097*** 0.097*** ‐0.016 ‐0.127***(0.025) (0.025) (0.022) (0.019) (0.019) (0.016) (0.018) (0.017) (0.015)
Africa 0.141*** 0.023 ‐0.158*** 0.138*** ‐0.002 ‐0.149*** 0.040*** ‐0.080*** ‐0.200***(0.023) (0.023) (0.020) (0.014) (0.014) (0.013) (0.012) (0.012) (0.010)
Indian Sub‐Continent
‐0.048* ‐0.121*** ‐0.261*** ‐0.085*** ‐0.177*** ‐0.293*** ‐0.044** ‐0.112*** ‐0.245***(0.023) (0.022) (0.020) (0.017) (0.017) (0.015) (0.014) (0.014) (0.012)
Middle East
0.389*** 0.287*** ‐0.011 0.262*** 0.126** ‐0.088* 0.071 ‐0.04 ‐0.175***(0.061) (0.060) (0.053) (0.041) (0.040) (0.036) (0.036) (0.036) (0.031)
Rest of Asia 0.093** ‐0.014 ‐0.200*** 0.056** ‐0.067** ‐0.254*** ‐0.048** ‐0.154*** ‐0.305***(0.030) (0.030) (0.027) (0.021) (0.021) (0.019) (0.016) (0.016) (0.014)
Oceania 0.259*** 0.135*** 0.052 0.384*** 0.258*** 0.152*** 0.393*** 0.265*** 0.155***(0.040) (0.040) (0.035) (0.027) (0.027) (0.024) (0.026) (0.026) (0.023)
Other ‐0.12 ‐0.276*** ‐0.295*** ‐0.066 ‐0.226*** ‐0.194*** ‐0.114* ‐0.221*** ‐0.215***
(0.073) (0.072) (0.064) (0.059) (0.058) (0.051) (0.048) (0.047) (0.042) Year & Quarter dummies
Yes Yes Yes Yes Yes Yes Yes Yes Yes
Region dummies
No Yes Yes No Yes Yes No Yes Yes
Age & educ controls
No No Yes No No Yes No No Yes
N 65218 65218 65218 106682 106682 106682 95841 95841 95841 The table reports the average percentage difference in gross hourly wages between immigrants and natives for allimmigrants pooled (row 1), and immigrants from different origin countries (rows 2‐10). Each difference is the coefficient in a regression of log‐wages on an immigrant dummy (row 1), or on country of origin dummies (rows 2‐10). Robust standard errors are in parenthesis. All regression include interactions of Year and Quarters fixed effects. Age controls are age and age squared. Education controls are dummies for three education levels. * denotes significance at 5%, ** denotes significance at 1%, *** denotes significance at 0.1%

The Socio-Economic Integration of Migrants
Christian Dustmann and Tommaso Frattini 89
Table 4.1.12: Immigrants-natives wage gap, by gender 1993‐1994 2000‐2001 2008‐2009 (1) (2) (3) (4) (5) (6) Men Women Men Women Men Women Men Women Men Women Men Women
All imm.
0.046** 0.135*** ‐0.161*** ‐0.087*** 0.057*** 0.148*** ‐0.163***‐0.088***‐0.046*** 0.028*** ‐0.233***‐0.164***
(0.015) (0.014) (0.014) (0.013) (0.012) (0.010) (0.011) (0.009) (0.010) (0.009) (0.009) (0.008)
Western Europe
0.048* 0.111*** ‐0.065*** ‐0.038* 0.066*** 0.143*** ‐0.063*** ‐0.037** 0.109*** 0.140*** ‐0.047** ‐0.030*
(0.023) (0.019) (0.019) (0.016) (0.017) (0.014) (0.014) (0.013) (0.017) (0.014) (0.015) (0.013)
Eastern Europe
‐0.061 ‐0.093 ‐0.229** ‐0.487*** 0.094 ‐0.009 ‐0.134* ‐0.240***‐0.368*** ‐0.271*** ‐0.403***‐0.381***
(0.093) (0.082) (0.079) (0.071) (0.076) (0.050) (0.064) (0.044) (0.019) (0.017) (0.016) (0.015)
Americas
0.149*** 0.211*** ‐0.098** ‐0.061* 0.134*** 0.225*** ‐0.130*** ‐0.046* 0.126*** 0.093*** ‐0.112***‐0.123***
(0.038) (0.032) (0.032) (0.028) (0.029) (0.023) (0.024) (0.020) (0.028) (0.022) (0.024) (0.019)
Africa
0.119*** 0.165*** ‐0.180*** ‐0.140*** 0.132*** 0.139*** ‐0.165***‐0.142*** ‐0.01 0.080*** ‐0.271***‐0.135***
(0.032) (0.030) (0.028) (0.026) (0.021) (0.019) (0.018) (0.017) (0.017) (0.016) (0.015) (0.014)
Indian Sub‐Continent
‐0.140*** 0.028 ‐0.354*** ‐0.186*** ‐0.168*** ‐0.028 ‐0.379***‐0.229***‐0.113*** 0.003 ‐0.309***‐0.203***
(0.030) (0.033) (0.025) (0.029) (0.022) (0.026) (0.019) (0.023) (0.019) (0.021) (0.016) (0.018)
Middle East
0.288*** 0.457*** ‐0.078 0.017 0.164** 0.365*** ‐0.149** ‐0.022 ‐0.023 0.155* ‐0.248*** ‐0.113
(0.075) (0.099) (0.064) (0.086) (0.059) (0.054) (0.050) (0.047) (0.044) (0.069) (0.038) (0.060)
Rest of Asia
0.088* 0.117** ‐0.222*** ‐0.158*** 0.002 0.125*** ‐0.316***‐0.172***‐0.092*** 0.002 ‐0.363***‐0.242***
(0.045) (0.039) (0.038) (0.034) (0.032) (0.027) (0.027) (0.023) (0.024) (0.020) (0.021) (0.017)
Oceania
0.236*** 0.307*** 0.044 0.083 0.354*** 0.413*** 0.133*** 0.166*** 0.421*** 0.355*** 0.183*** 0.109***
(0.060) (0.050) (0.051) (0.044) (0.039) (0.036) (0.033) (0.031) (0.039) (0.035) (0.033) (0.030)
Other
‐0.389*** 0.15 ‐0.553*** ‐0.029 ‐0.098 ‐0.023 ‐0.215** ‐0.177** ‐0.217** ‐0.008 ‐0.187** ‐0.211***
(0.108) (0.093) (0.092) (0.081) (0.088) (0.074) (0.074) (0.064) (0.077) (0.059) (0.065) (0.051)
Year & Quarter dummies
Yes Yes Yes Yes Yes Yes Yes Yes Yes Yes Yes Yes
Region dummies
No No Yes Yes No No Yes Yes No No Yes Yes
Age & educ controls
No No Yes Yes No No Yes Yes No No Yes Yes
N 32236 32982 32236 32982 52064 54618 52064 54618 45745 50096 45745 50096 The table reports the average percentage difference in gross hourly wages by gender between immigrants and natives for all immigrants pooled (row 1), and immigrants from different origin countries (rows 2‐10). Each difference is the coefficient in a regression of log‐wages on an immigrant dummy (row 1), or on country of origin dummies (rows 2‐10). Robust standard errors are inparenthesis. All regression include interactions of Year and Quarters fixed effects. Age controls are age and age squared. Education controls are dummies for three education levels. * denotes significance at 5%, ** denotes significance at 1%, *** denotes significance at 0.1%
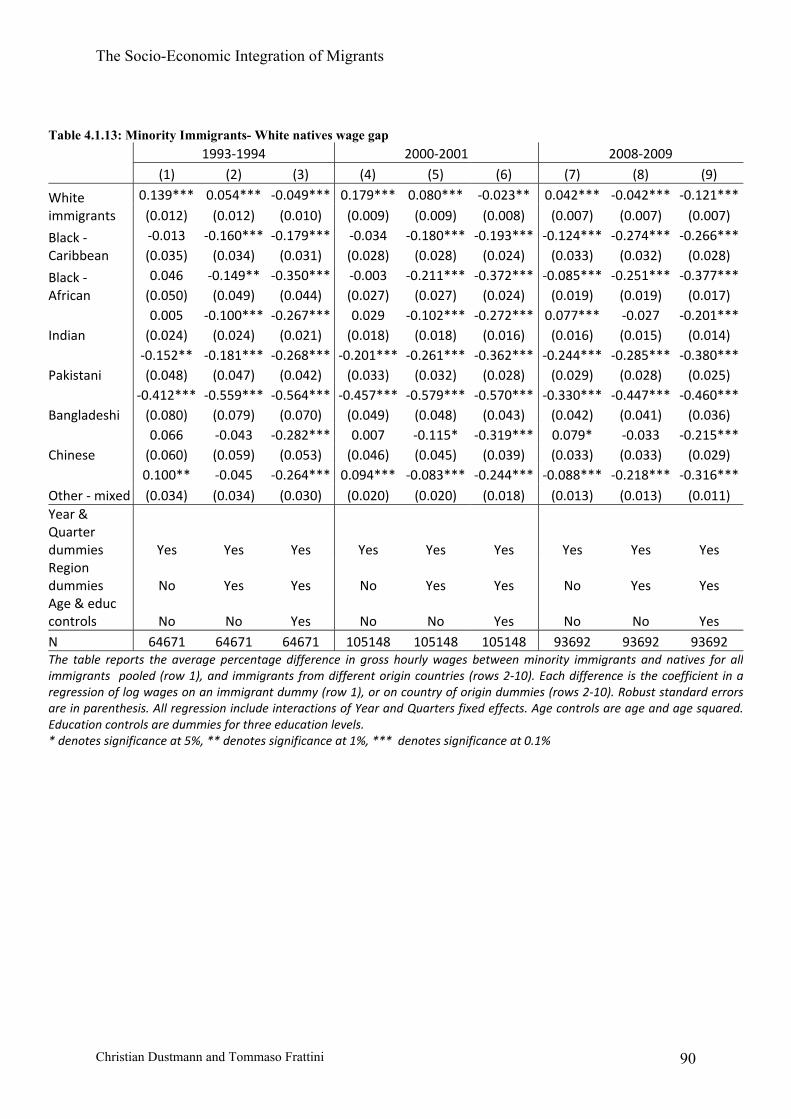
The Socio-Economic Integration of Migrants
Christian Dustmann and Tommaso Frattini 90
Table 4.1.13: Minority Immigrants- White natives wage gap 1993‐1994 2000‐2001 2008‐2009 (1) (2) (3) (4) (5) (6) (7) (8) (9)
White immigrants
0.139*** 0.054*** ‐0.049*** 0.179*** 0.080*** ‐0.023** 0.042*** ‐0.042*** ‐0.121***(0.012) (0.012) (0.010) (0.009) (0.009) (0.008) (0.007) (0.007) (0.007)
Black ‐ Caribbean
‐0.013 ‐0.160*** ‐0.179*** ‐0.034 ‐0.180*** ‐0.193*** ‐0.124*** ‐0.274*** ‐0.266***(0.035) (0.034) (0.031) (0.028) (0.028) (0.024) (0.033) (0.032) (0.028)
Black ‐ African
0.046 ‐0.149** ‐0.350*** ‐0.003 ‐0.211*** ‐0.372*** ‐0.085*** ‐0.251*** ‐0.377***(0.050) (0.049) (0.044) (0.027) (0.027) (0.024) (0.019) (0.019) (0.017)
Indian 0.005 ‐0.100*** ‐0.267*** 0.029 ‐0.102*** ‐0.272*** 0.077*** ‐0.027 ‐0.201***
(0.024) (0.024) (0.021) (0.018) (0.018) (0.016) (0.016) (0.015) (0.014)
Pakistani ‐0.152** ‐0.181*** ‐0.268*** ‐0.201*** ‐0.261*** ‐0.362*** ‐0.244*** ‐0.285*** ‐0.380***(0.048) (0.047) (0.042) (0.033) (0.032) (0.028) (0.029) (0.028) (0.025)
Bangladeshi ‐0.412*** ‐0.559*** ‐0.564*** ‐0.457*** ‐0.579*** ‐0.570*** ‐0.330*** ‐0.447*** ‐0.460***
(0.080) (0.079) (0.070) (0.049) (0.048) (0.043) (0.042) (0.041) (0.036)
Chinese 0.066 ‐0.043 ‐0.282*** 0.007 ‐0.115* ‐0.319*** 0.079* ‐0.033 ‐0.215***
(0.060) (0.059) (0.053) (0.046) (0.045) (0.039) (0.033) (0.033) (0.029)
Other ‐ mixed 0.100** ‐0.045 ‐0.264*** 0.094*** ‐0.083*** ‐0.244*** ‐0.088*** ‐0.218*** ‐0.316***(0.034) (0.034) (0.030) (0.020) (0.020) (0.018) (0.013) (0.013) (0.011)
Year & Quarter dummies Yes Yes Yes Yes Yes Yes Yes Yes Yes Region dummies No Yes Yes No Yes Yes No Yes Yes Age & educ controls No No Yes No No Yes No No Yes N 64671 64671 64671 105148 105148 105148 93692 93692 93692 The table reports the average percentage difference in gross hourly wages between minority immigrants and natives for allimmigrants pooled (row 1), and immigrants from different origin countries (rows 2‐10). Each difference is the coefficient in a regression of log wages on an immigrant dummy (row 1), or on country of origin dummies (rows 2‐10). Robust standard errors are in parenthesis. All regression include interactions of Year and Quarters fixed effects. Age controls are age and age squared. Education controls are dummies for three education levels. * denotes significance at 5%, ** denotes significance at 1%, *** denotes significance at 0.1%
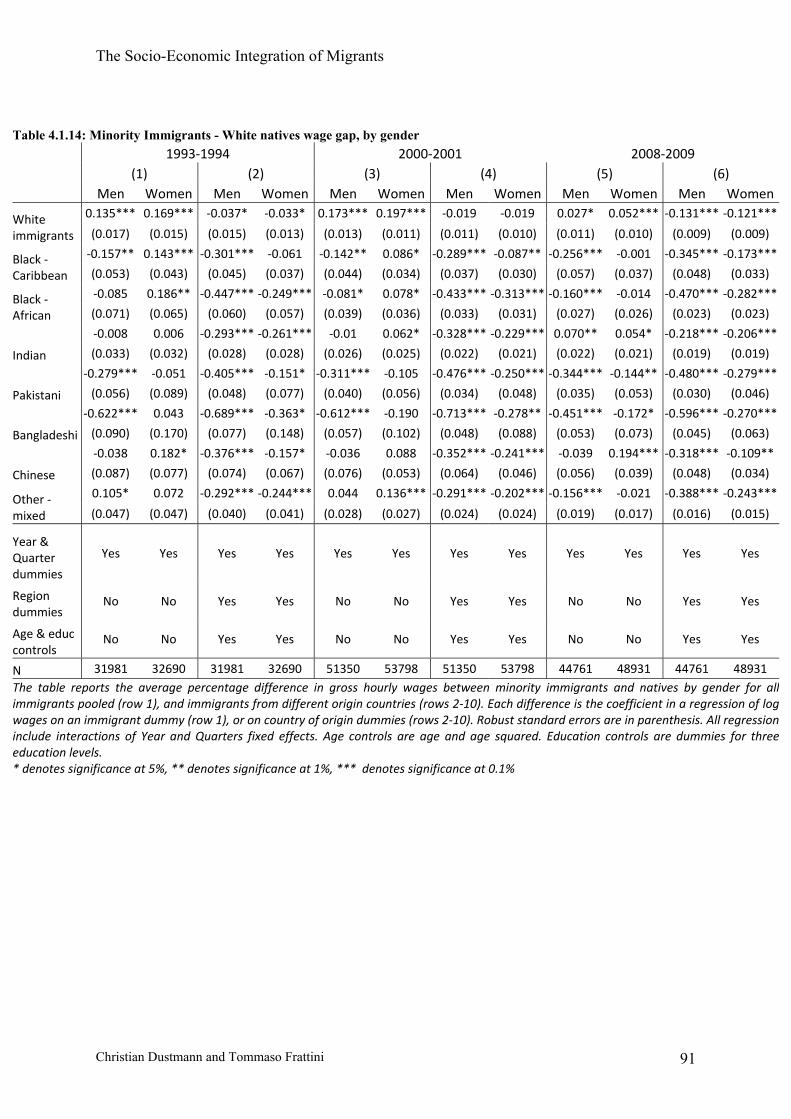
The Socio-Economic Integration of Migrants
Christian Dustmann and Tommaso Frattini 91
Table 4.1.14: Minority Immigrants - White natives wage gap, by gender 1993‐1994 2000‐2001 2008‐2009 (1) (2) (3) (4) (5) (6) Men Women Men Women Men Women Men Women Men Women Men Women
White immigrants
0.135*** 0.169*** ‐0.037* ‐0.033* 0.173*** 0.197*** ‐0.019 ‐0.019 0.027* 0.052*** ‐0.131*** ‐0.121***
(0.017) (0.015) (0.015) (0.013) (0.013) (0.011) (0.011) (0.010) (0.011) (0.010) (0.009) (0.009)
Black ‐ Caribbean
‐0.157** 0.143*** ‐0.301*** ‐0.061 ‐0.142** 0.086* ‐0.289*** ‐0.087** ‐0.256*** ‐0.001 ‐0.345*** ‐0.173***
(0.053) (0.043) (0.045) (0.037) (0.044) (0.034) (0.037) (0.030) (0.057) (0.037) (0.048) (0.033)
Black ‐ African
‐0.085 0.186** ‐0.447*** ‐0.249*** ‐0.081* 0.078* ‐0.433*** ‐0.313*** ‐0.160*** ‐0.014 ‐0.470*** ‐0.282***
(0.071) (0.065) (0.060) (0.057) (0.039) (0.036) (0.033) (0.031) (0.027) (0.026) (0.023) (0.023)
Indian
‐0.008 0.006 ‐0.293*** ‐0.261*** ‐0.01 0.062* ‐0.328*** ‐0.229*** 0.070** 0.054* ‐0.218*** ‐0.206***
(0.033) (0.032) (0.028) (0.028) (0.026) (0.025) (0.022) (0.021) (0.022) (0.021) (0.019) (0.019)
Pakistani
‐0.279*** ‐0.051 ‐0.405*** ‐0.151* ‐0.311*** ‐0.105 ‐0.476*** ‐0.250*** ‐0.344*** ‐0.144** ‐0.480*** ‐0.279***
(0.056) (0.089) (0.048) (0.077) (0.040) (0.056) (0.034) (0.048) (0.035) (0.053) (0.030) (0.046)
Bangladeshi
‐0.622*** 0.043 ‐0.689*** ‐0.363* ‐0.612*** ‐0.190 ‐0.713*** ‐0.278** ‐0.451*** ‐0.172* ‐0.596*** ‐0.270***
(0.090) (0.170) (0.077) (0.148) (0.057) (0.102) (0.048) (0.088) (0.053) (0.073) (0.045) (0.063)
Chinese
‐0.038 0.182* ‐0.376*** ‐0.157* ‐0.036 0.088 ‐0.352*** ‐0.241*** ‐0.039 0.194*** ‐0.318*** ‐0.109**
(0.087) (0.077) (0.074) (0.067) (0.076) (0.053) (0.064) (0.046) (0.056) (0.039) (0.048) (0.034)
Other ‐ mixed
0.105* 0.072 ‐0.292*** ‐0.244*** 0.044 0.136*** ‐0.291*** ‐0.202*** ‐0.156*** ‐0.021 ‐0.388*** ‐0.243***
(0.047) (0.047) (0.040) (0.041) (0.028) (0.027) (0.024) (0.024) (0.019) (0.017) (0.016) (0.015)
Year & Quarter dummies
Yes Yes Yes Yes Yes Yes Yes Yes Yes Yes Yes Yes
Region dummies
No No Yes Yes No No Yes Yes No No Yes Yes
Age & educ controls
No No Yes Yes No No Yes Yes No No Yes Yes
N 31981 32690 31981 32690 51350 53798 51350 53798 44761 48931 44761 48931 The table reports the average percentage difference in gross hourly wages between minority immigrants and natives by gender for all immigrants pooled (row 1), and immigrants from different origin countries (rows 2‐10). Each difference is the coefficient in a regression of log wages on an immigrant dummy (row 1), or on country of origin dummies (rows 2‐10). Robust standard errors are in parenthesis. All regression include interactions of Year and Quarters fixed effects. Age controls are age and age squared. Education controls are dummies for three education levels. * denotes significance at 5%, ** denotes significance at 1%, *** denotes significance at 0.1%

The Socio-Economic Integration of Migrants
Christian Dustmann and Tommaso Frattini 92
Table 4.1.15: Immigrants-natives wage gap by region 1993‐1994 2000‐2001 2008‐2009
(1) (2) (3) (4) (5) (6) North East ‐0.066 ‐0.225* ‐0.056 ‐0.157** 0.026 ‐0.162***
(0.097) (0.090) (0.067) (0.059) (0.037) (0.033) North West ‐0.017 ‐0.128** 0.022 ‐0.106*** ‐0.165*** ‐0.268***
(0.042) (0.039) (0.029) (0.026) (0.021) (0.019) Yorks & Humbers. 0.001 ‐0.120*** 0.013 ‐0.115*** ‐0.136*** ‐0.232***
(0.041) (0.036) (0.035) (0.031) (0.021) (0.020) East Midlands 0.045 ‐0.088* ‐0.021 ‐0.128*** ‐0.133*** ‐0.218***
(0.041) (0.036) (0.030) (0.028) (0.020) (0.018) West Midlands ‐0.050 ‐0.138*** ‐0.021 ‐0.133*** ‐0.118*** ‐0.213***
(0.031) (0.029) (0.028) (0.025) (0.022) (0.020) Eastern 0.044 ‐0.096** 0.079** ‐0.064** ‐0.038* ‐0.157***
(0.032) (0.030) (0.027) (0.024) (0.019) (0.017) London ‐0.077*** ‐0.202*** ‐0.114*** ‐0.200*** ‐0.149*** ‐0.220***
(0.018) (0.017) (0.014) (0.013) (0.015) (0.013) South East 0.038 ‐0.060* 0.093*** ‐0.043* ‐0.024 ‐0.127***
(0.026) (0.024) (0.019) (0.017) (0.016) (0.014) South West 0.051 ‐0.065 0.083** ‐0.049 ‐0.046* ‐0.156***
(0.041) (0.039) (0.028) (0.026) (0.022) (0.021) Wales 0.234** 0.094 0.099 ‐0.052 ‐0.126*** ‐0.221***
(0.072) (0.062) (0.058) (0.049) (0.036) (0.034) Scotland 0.115* ‐0.016 0.150*** ‐0.016 ‐0.055* ‐0.156***
(0.051) (0.046) (0.032) (0.028) (0.024) (0.021)
Year & Quarter dummies Yes Yes Yes Yes Yes Yes Region dummies Yes Yes Yes Yes Yes Yes Age & educ controls
No Yes No Yes No Yes
N 65218 65218 106682 106682 95841 95841 The table reports the average percentage difference in gross hourly wages between immigrants and natives in each Government Office Region. Each difference is the coefficient in a regression of log‐wages on an immigrant dummy interacted with region dummies. All regression include interactions of Year and Quarters fixed effects and regional dummies. Age controls are age and age squared. . Education controls are dummies for three education levels. * denotes significance at 5%, ** denotes significance at 1%, *** denotes significance at 0.1%
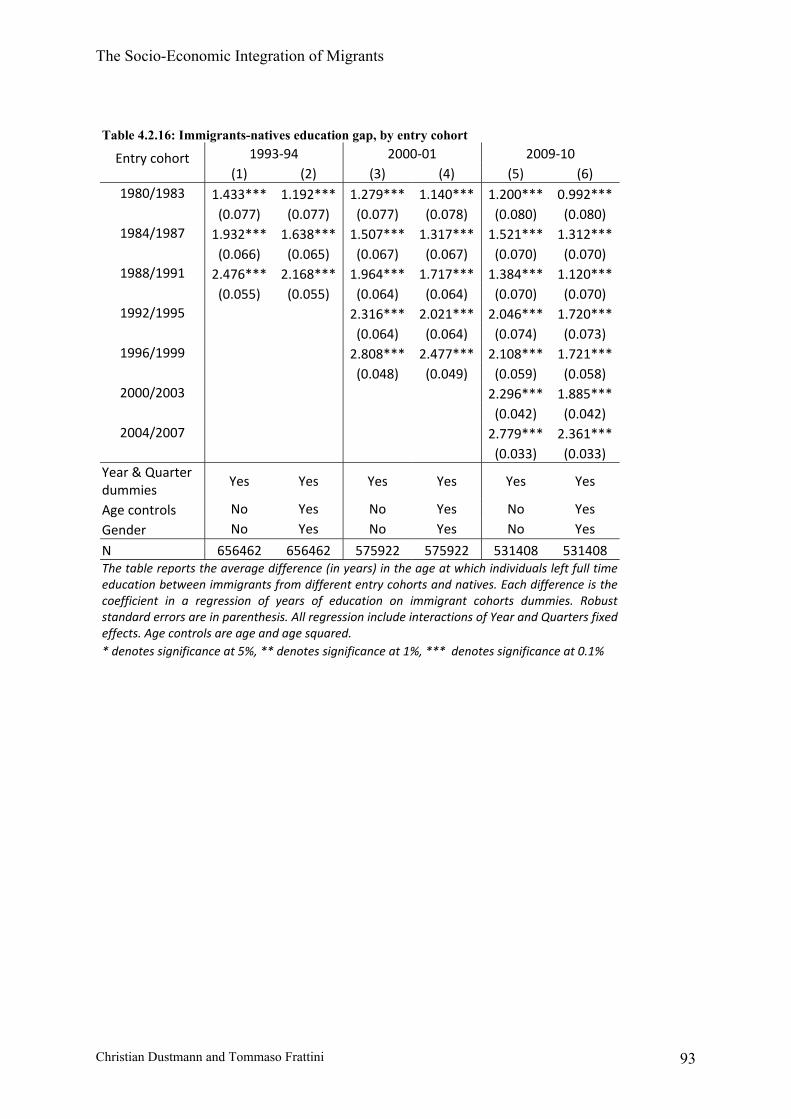
The Socio-Economic Integration of Migrants
Christian Dustmann and Tommaso Frattini 93
Table 4.2.16: Immigrants-natives education gap, by entry cohort
Entry cohort 1993‐94 2000‐01 2009‐10 (1) (2) (3) (4) (5) (6)
1980/1983 1.433*** 1.192*** 1.279*** 1.140*** 1.200*** 0.992*** (0.077) (0.077) (0.077) (0.078) (0.080) (0.080)
1984/1987 1.932*** 1.638*** 1.507*** 1.317*** 1.521*** 1.312*** (0.066) (0.065) (0.067) (0.067) (0.070) (0.070)
1988/1991 2.476*** 2.168*** 1.964*** 1.717*** 1.384*** 1.120*** (0.055) (0.055) (0.064) (0.064) (0.070) (0.070)
1992/1995 2.316*** 2.021*** 2.046*** 1.720*** (0.064) (0.064) (0.074) (0.073)
1996/1999 2.808*** 2.477*** 2.108*** 1.721*** (0.048) (0.049) (0.059) (0.058)
2000/2003 2.296*** 1.885*** (0.042) (0.042)
2004/2007 2.779*** 2.361*** (0.033) (0.033)
Year & Quarter dummies
Yes Yes Yes Yes Yes Yes
Age controls No Yes No Yes No Yes
Gender No Yes No Yes No Yes
N 656462 656462 575922 575922 531408 531408 The table reports the average difference (in years) in the age at which individuals left full time education between immigrants from different entry cohorts and natives. Each difference is the coefficient in a regression of years of education on immigrant cohorts dummies. Robust standard errors are in parenthesis. All regression include interactions of Year and Quarters fixed effects. Age controls are age and age squared. * denotes significance at 5%, ** denotes significance at 1%, *** denotes significance at 0.1%

The Socio-Economic Integration of Migrants
Christian Dustmann and Tommaso Frattini 94
Table 4.2.2: Immigrants-natives employment gap, by entry cohort 1993‐94 1993‐94 2000‐01 2000‐01 2009‐10 2009‐10 1980/1983 ‐0.178*** ‐0.210*** ‐0.115*** ‐0.144*** ‐0.016 ‐0.106***
(0.009) (0.008) (0.009) (0.008) (0.009) (0.009)
1984/1987 ‐0.146*** ‐0.187*** ‐0.092*** ‐0.130*** 0.006 ‐0.083***
(0.008) (0.007) (0.008) (0.007) (0.008) (0.008)
1988/1991 ‐0.203*** ‐0.246*** ‐0.122*** ‐0.175*** ‐0.042*** ‐0.134***
(0.007) (0.006) (0.007) (0.007) (0.008) (0.007)
1992/1995 ‐0.155*** ‐0.207*** ‐0.041*** ‐0.163***
(0.007) (0.007) (0.008) (0.007)
1996/1999 ‐0.155*** ‐0.219*** ‐0.009 ‐0.143***
(0.006) (0.005) (0.006) (0.006)
2000/2003 0.013** ‐0.122***
(0.004) (0.004)
2004/2007 0.038*** ‐0.085***
(0.004) (0.004) Year & Quarter dummies
Yes Yes Yes Yes Yes Yes
Region dummies No Yes No Yes No Yes
Age & educ controls No Yes No Yes No Yes
Gender No Yes No Yes No Yes
N 656462 656462 575922 575922 531408 531408 The table reports the average difference in employment probability between immigrants from different entry cohorts and natives. Each difference is the coefficient in a regression of a dummy for employment status on immigrant cohorts dummies. Robust standard errors are in parenthesis. All regression include interactions of Year and Quarters fixed effects. Age controls are age and age squared. Education controls are dummies for three education levels. * denotes significance at 5%, ** denotes significance at 1%, *** denotes significance at 0.1%

The Socio-Economic Integration of Migrants
Christian Dustmann and Tommaso Frattini 95
Table 4.2.3: Immigrants-natives wage gap, by entry cohort 1993‐94 1993‐94 2000‐01 2000‐01 2009‐10 2009‐10 1980/1983 0.031 ‐0.225*** ‐0.010 ‐0.171*** 0.119*** ‐0.119*** (0.045) (0.042) (0.028) (0.027) (0.030) (0.027) 1984/1987 0.092* ‐0.165*** 0.057 ‐0.192*** 0.095** ‐0.123*** (0.038) (0.034) (0.030) (0.026) (0.029) (0.025) 1988/1991 0.114*** ‐0.166*** 0.107*** ‐0.223*** 0.036 ‐0.176*** (0.033) (0.031) (0.026) (0.025) (0.026) (0.023) 1992/1995 0.036 ‐0.243*** 0.088** ‐0.185*** (0.027) (0.025) (0.029) (0.026) 1996/1999 0.109*** ‐0.150*** 0.077*** ‐0.178*** (0.023) (0.020) (0.021) (0.019) 2000/2003 ‐0.002 ‐0.229*** (0.015) (0.014) 2004/2007 ‐0.169*** ‐0.324*** (0.012) (0.010) Year & Quarter dummies Yes Yes Yes Yes Yes Yes Region dummies No Yes No Yes No Yes Age & educ controls No Yes No Yes No Yes Gender No Yes No Yes No Yes N 62233 62233 102860 102860 92842 92842 The table reports the average percentage difference gross hourly wages between immigrants from different entry cohorts and natives. Each difference is the coefficient in a regression of log wages for employment status on immigrant cohorts dummies. Robust standard errors are in parenthesis. All regression include interactions of Year and Quarters fixed effects. Age controls are age and age squared. Education controls are dummies for three education levels. * denotes significance at 5%, ** denotes significance at 1%, *** denotes significance at 0.1%

The Socio-Economic Integration of Migrants
Christian Dustmann and Tommaso Frattini 96
Table 4.3.1: Immigrants-Natives reading and writing gaps Reading Writing
(1) (2) (3) (4)
All immigrants ‐0.180*** ‐0.152*** ‐0.195*** ‐0.166*** (0.017) (0.014) (0.017) (0.015) Ireland 0.043** 0.033 0.063*** 0.052* (0.015) (0.024) (0.015) (0.025) India ‐0.140*** ‐0.135*** ‐0.129*** ‐0.126*** (0.021) (0.020) (0.021) (0.021) Pakistan ‐0.272*** ‐0.238*** ‐0.302*** ‐0.267*** (0.036) (0.034) (0.036) (0.034) Bangladesh ‐0.221*** ‐0.186*** ‐0.233*** ‐0.196*** (0.051) (0.047) (0.053) (0.048) Jamaica ‐0.004 0.022 0.016 0.042 (0.026) (0.031) (0.026) (0.032) East African New CW ‐0.083** ‐0.082** ‐0.089** ‐0.091** (0.027) (0.026) (0.030) (0.029) Rest of New CW ‐0.045* ‐0.058** ‐0.037 ‐0.054** (0.019) (0.020) (0.020) (0.021) Oceania and Canada 0.025 0.018 0.033 0.022 (0.038) (0.039) (0.039) (0.041) Other ‐0.245*** ‐0.204*** ‐0.271*** ‐0.229*** (0.025) (0.022) (0.026) (0.023) year & quarter dummies Yes Yes Yes Yes Region dummies No Yes No Yes Age & educ controls No Yes No Yes N 9442 9442 9442 9442 The table reports the average percentage points difference in reading (cols.1‐2) and writing (cols. 3‐4) proficiency between immigrants and natives for all immigrants pooled (row 1) and immigrants from different origin countries (rows 2‐10). Each difference is the coefficient in a regression of a dummy for English fluency on an immigrant dummy (row 1), or on country of origin dummies (rows 2‐10). Robust standard errors are in parenthesis. All regression include interactions of Year and Quarters fixed effects. Age controls are age and age squared.
* denotes significance at 5%, ** denotes significance at 1%, *** denotes significance at 0.1%
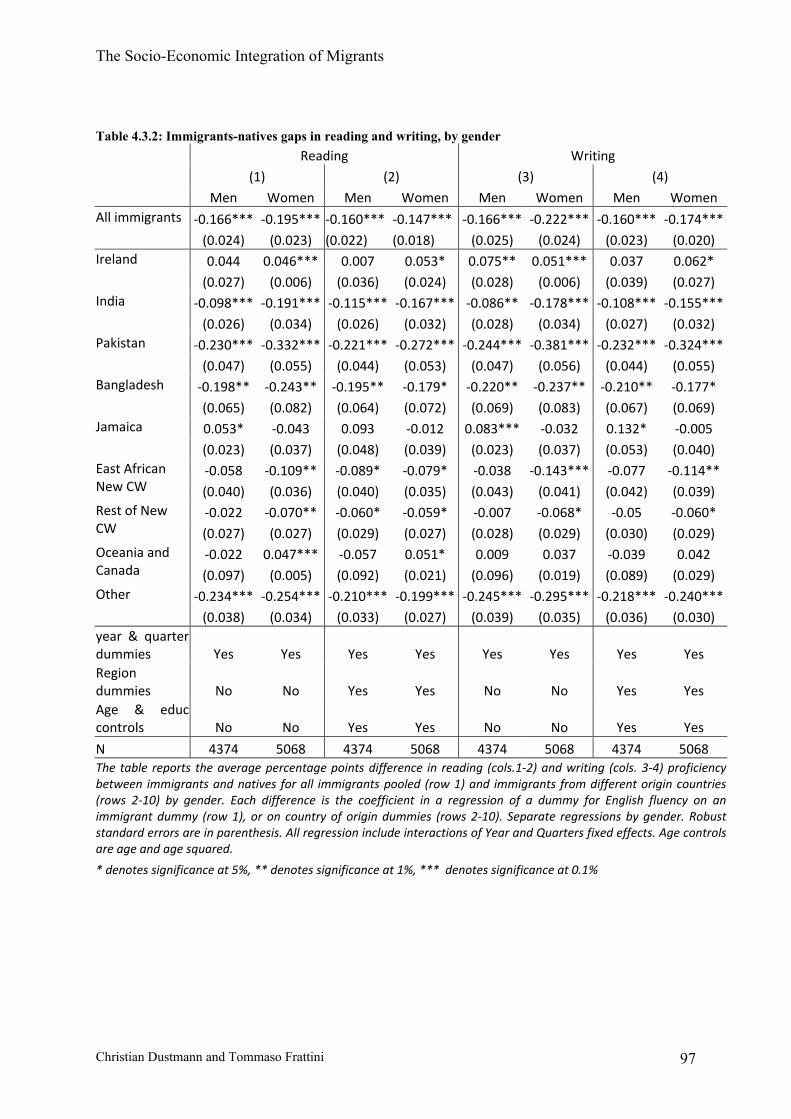
The Socio-Economic Integration of Migrants
Christian Dustmann and Tommaso Frattini 97
Table 4.3.2: Immigrants-natives gaps in reading and writing, by gender Reading Writing
(1) (2) (3) (4) Men Women Men Women Men Women Men Women All immigrants ‐0.166*** ‐0.195*** ‐0.160*** ‐0.147*** ‐0.166*** ‐0.222*** ‐0.160*** ‐0.174*** (0.024) (0.023) (0.022) (0.018) (0.025) (0.024) (0.023) (0.020) Ireland 0.044 0.046*** 0.007 0.053* 0.075** 0.051*** 0.037 0.062* (0.027) (0.006) (0.036) (0.024) (0.028) (0.006) (0.039) (0.027) India ‐0.098*** ‐0.191*** ‐0.115*** ‐0.167*** ‐0.086** ‐0.178*** ‐0.108*** ‐0.155*** (0.026) (0.034) (0.026) (0.032) (0.028) (0.034) (0.027) (0.032) Pakistan ‐0.230*** ‐0.332*** ‐0.221*** ‐0.272*** ‐0.244*** ‐0.381*** ‐0.232*** ‐0.324*** (0.047) (0.055) (0.044) (0.053) (0.047) (0.056) (0.044) (0.055) Bangladesh ‐0.198** ‐0.243** ‐0.195** ‐0.179* ‐0.220** ‐0.237** ‐0.210** ‐0.177* (0.065) (0.082) (0.064) (0.072) (0.069) (0.083) (0.067) (0.069) Jamaica 0.053* ‐0.043 0.093 ‐0.012 0.083*** ‐0.032 0.132* ‐0.005 (0.023) (0.037) (0.048) (0.039) (0.023) (0.037) (0.053) (0.040) East African New CW
‐0.058 ‐0.109** ‐0.089* ‐0.079* ‐0.038 ‐0.143*** ‐0.077 ‐0.114**
(0.040) (0.036) (0.040) (0.035) (0.043) (0.041) (0.042) (0.039) Rest of New CW
‐0.022 ‐0.070** ‐0.060* ‐0.059* ‐0.007 ‐0.068* ‐0.05 ‐0.060*
(0.027) (0.027) (0.029) (0.027) (0.028) (0.029) (0.030) (0.029) Oceania and Canada
‐0.022 0.047*** ‐0.057 0.051* 0.009 0.037 ‐0.039 0.042
(0.097) (0.005) (0.092) (0.021) (0.096) (0.019) (0.089) (0.029) Other ‐0.234*** ‐0.254*** ‐0.210*** ‐0.199*** ‐0.245*** ‐0.295*** ‐0.218*** ‐0.240*** (0.038) (0.034) (0.033) (0.027) (0.039) (0.035) (0.036) (0.030) year & quarter dummies Yes Yes Yes Yes Yes Yes Yes Yes Region dummies No No Yes Yes No No Yes Yes Age & educ controls No No Yes Yes No No Yes Yes
N 4374 5068 4374 5068 4374 5068 4374 5068 The table reports the average percentage points difference in reading (cols.1‐2) and writing (cols. 3‐4) proficiency between immigrants and natives for all immigrants pooled (row 1) and immigrants from different origin countries (rows 2‐10) by gender. Each difference is the coefficient in a regression of a dummy for English fluency on an immigrant dummy (row 1), or on country of origin dummies (rows 2‐10). Separate regressions by gender. Robust standard errors are in parenthesis. All regression include interactions of Year and Quarters fixed effects. Age controls are age and age squared.
* denotes significance at 5%, ** denotes significance at 1%, *** denotes significance at 0.1%
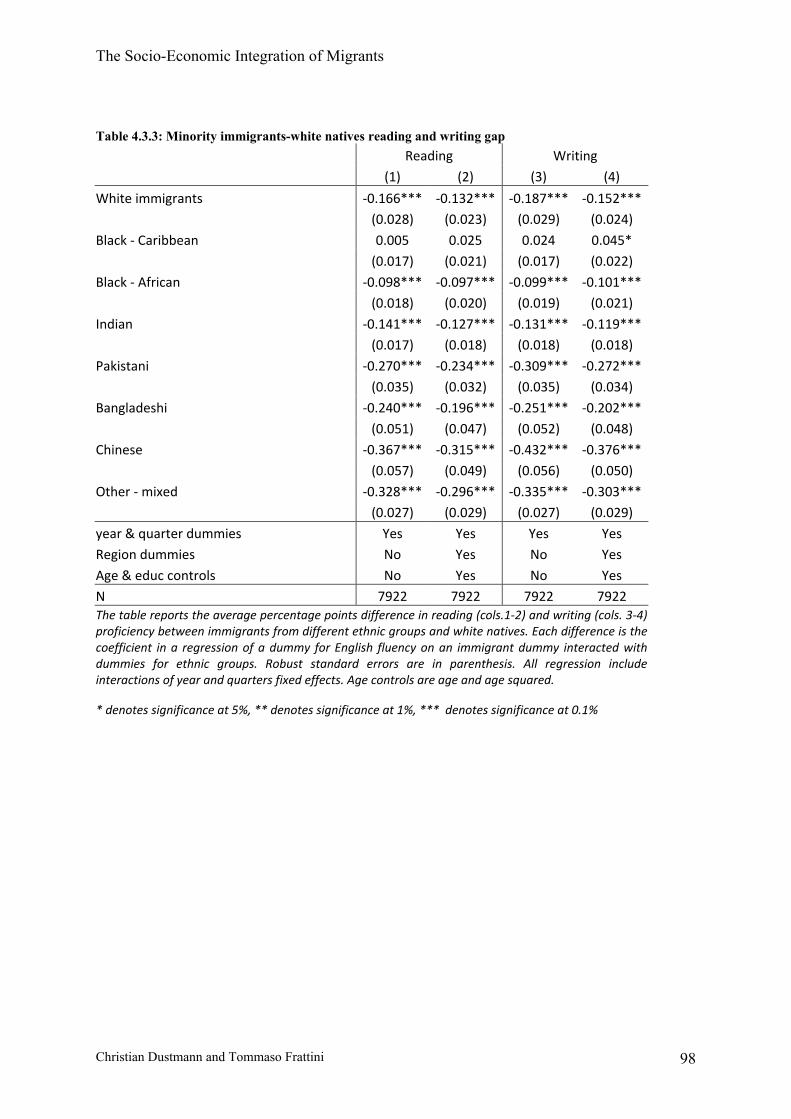
The Socio-Economic Integration of Migrants
Christian Dustmann and Tommaso Frattini 98
Table 4.3.3: Minority immigrants-white natives reading and writing gap Reading Writing
(1) (2) (3) (4)
White immigrants ‐0.166*** ‐0.132*** ‐0.187*** ‐0.152*** (0.028) (0.023) (0.029) (0.024)
Black ‐ Caribbean 0.005 0.025 0.024 0.045* (0.017) (0.021) (0.017) (0.022)
Black ‐ African ‐0.098*** ‐0.097*** ‐0.099*** ‐0.101*** (0.018) (0.020) (0.019) (0.021)
Indian ‐0.141*** ‐0.127*** ‐0.131*** ‐0.119*** (0.017) (0.018) (0.018) (0.018)
Pakistani ‐0.270*** ‐0.234*** ‐0.309*** ‐0.272*** (0.035) (0.032) (0.035) (0.034)
Bangladeshi ‐0.240*** ‐0.196*** ‐0.251*** ‐0.202*** (0.051) (0.047) (0.052) (0.048)
Chinese ‐0.367*** ‐0.315*** ‐0.432*** ‐0.376*** (0.057) (0.049) (0.056) (0.050)
Other ‐ mixed ‐0.328*** ‐0.296*** ‐0.335*** ‐0.303*** (0.027) (0.029) (0.027) (0.029)
year & quarter dummies Yes Yes Yes Yes Region dummies No Yes No Yes
Age & educ controls No Yes No Yes N 7922 7922 7922 7922 The table reports the average percentage points difference in reading (cols.1‐2) and writing (cols. 3‐4) proficiency between immigrants from different ethnic groups and white natives. Each difference is the coefficient in a regression of a dummy for English fluency on an immigrant dummy interacted with dummies for ethnic groups. Robust standard errors are in parenthesis. All regression include interactions of year and quarters fixed effects. Age controls are age and age squared.
* denotes significance at 5%, ** denotes significance at 1%, *** denotes significance at 0.1%

The Socio-Economic Integration of Migrants
Christian Dustmann and Tommaso Frattini 99
Table 4.3.4: Minority immigrants-white natives reading and writing gap Reading Writing
(1) (2) (3) (4) Men Women Men Women Men Women Men Women
White immigrants ‐0.158*** ‐0.174*** ‐0.146*** ‐0.124*** ‐0.160*** ‐0.212*** ‐0.147*** ‐0.160***
(0.043) (0.037) (0.037) (0.027) (0.045) (0.038) (0.039) (0.030) Black ‐ Caribbean 0.053** ‐0.032 0.057 0.004 0.085*** ‐0.026 0.096** 0.01
(0.018) (0.025) (0.031) (0.029) (0.018) (0.026) (0.034) (0.030) Black ‐ African ‐0.057* ‐0.146*** ‐0.091*** ‐0.108*** ‐0.046 ‐0.160*** ‐0.081** ‐0.126***
(0.024) (0.026) (0.027) (0.029) (0.026) (0.028) (0.030) (0.031) Indian ‐0.101*** ‐0.188*** ‐0.115*** ‐0.149*** ‐0.085*** ‐0.184*** ‐0.101*** ‐0.145***
(0.023) (0.026) (0.024) (0.027) (0.024) (0.027) (0.025) (0.027) Pakistani ‐0.227*** ‐0.331*** ‐0.220*** ‐0.265*** ‐0.251*** ‐0.388*** ‐0.240*** ‐0.324***
(0.045) (0.053) (0.042) (0.052) (0.046) (0.055) (0.044) (0.054) Bangladeshi ‐0.204** ‐0.279*** ‐0.199** ‐0.197** ‐0.225** ‐0.273*** ‐0.210** ‐0.193**
(0.065) (0.081) (0.064) (0.072) (0.069) (0.082) (0.068) (0.069) Chinese ‐0.359*** ‐0.375*** ‐0.288*** ‐0.338*** ‐0.451*** ‐0.411*** ‐0.368*** ‐0.374***
(0.091) (0.068) (0.076) (0.061) (0.088) (0.069) (0.076) (0.065) Other ‐ mixed ‐0.350*** ‐0.302*** ‐0.342*** ‐0.244*** ‐0.346*** ‐0.321*** ‐0.336*** ‐0.265***
(0.040) (0.034) (0.041) (0.038) (0.040) (0.034) (0.042) (0.037) year & quarter dummies Yes Yes Yes Yes Yes Yes Yes Yes Region dummies No No Yes Yes No No Yes Yes Age & educ controls No No Yes Yes No No Yes Yes
N 3672 4250 3672 4250 3672 4250 3672 4250 The table reports the average percentage points difference in reading (cols.1‐2) and writing (cols. 3‐4) proficiency between immigrants from different ethnic groups and white natives, by gender. Each difference is the coefficient in a regression of a dummy for English fluency on an immigrant dummy interacted with dummies for ethnic groups. Robust standard errors are in parenthesis. Separate regressions by gender. All regressions include interactions of year and quarters fixed effects. Age controls are age and age squared. * denotes significance at 5%, ** denotes significance at 1%, *** denotes significance at 0.1%

The Socio-Economic Integration of Migrants
Christian Dustmann and Tommaso Frattini 100
Table 4.3.5: Immigrants-Natives reading and writing gap, by region Reading Writing (1) (2) (3) (4)
North East ‐0.337*** ‐0.305*** ‐0.339*** ‐0.308*** (0.097) (0.083) (0.098) (0.083) North West ‐0.252*** ‐0.212*** ‐0.285*** ‐0.242*** (0.061) (0.056) (0.061) (0.056) Yorks & Humbers. ‐0.161** ‐0.151** ‐0.164** ‐0.154** (0.058) (0.056) (0.061) (0.058) East Midlands ‐0.200** ‐0.157** ‐0.220** ‐0.176** (0.066) (0.055) (0.067) (0.057) West Midlands ‐0.144** ‐0.135** ‐0.109* ‐0.102* (0.050) (0.043) (0.051) (0.043) Eastern ‐0.112* ‐0.074 ‐0.104* ‐0.063 (0.047) (0.042) (0.047) (0.042) London ‐0.215*** ‐0.173*** ‐0.250*** ‐0.204*** (0.027) (0.022) (0.029) (0.025) South East ‐0.135*** ‐0.115** ‐0.141*** ‐0.120** (0.040) (0.038) (0.040) (0.038) South West ‐0.230* ‐0.148 ‐0.212* ‐0.124 (0.107) (0.081) (0.107) (0.079) Wales ‐0.159 ‐0.086 ‐0.303* ‐0.224 (0.118) (0.125) (0.137) (0.139) year & quarter dummies Yes Yes Yes Yes Region dummies Yes Yes Yes Yes Age & educ controls No Yes No Yes N 9442 9442 9442 9442 The table reports the average percentage points difference in reading (cols.1‐2) and writing (cols. 3‐4) between immigrants and natives in each Government Office Region. Each difference is the coefficient in a regression of a dummy for English fluency on an immigrant dummy interacted with region dummies. All regressions include interactions of Year and Quarters fixed effects and regional dummies. Age controls are age and age squared. * denotes significance at 5%, ** denotes significance at 1%, *** denotes significance at 0.1%
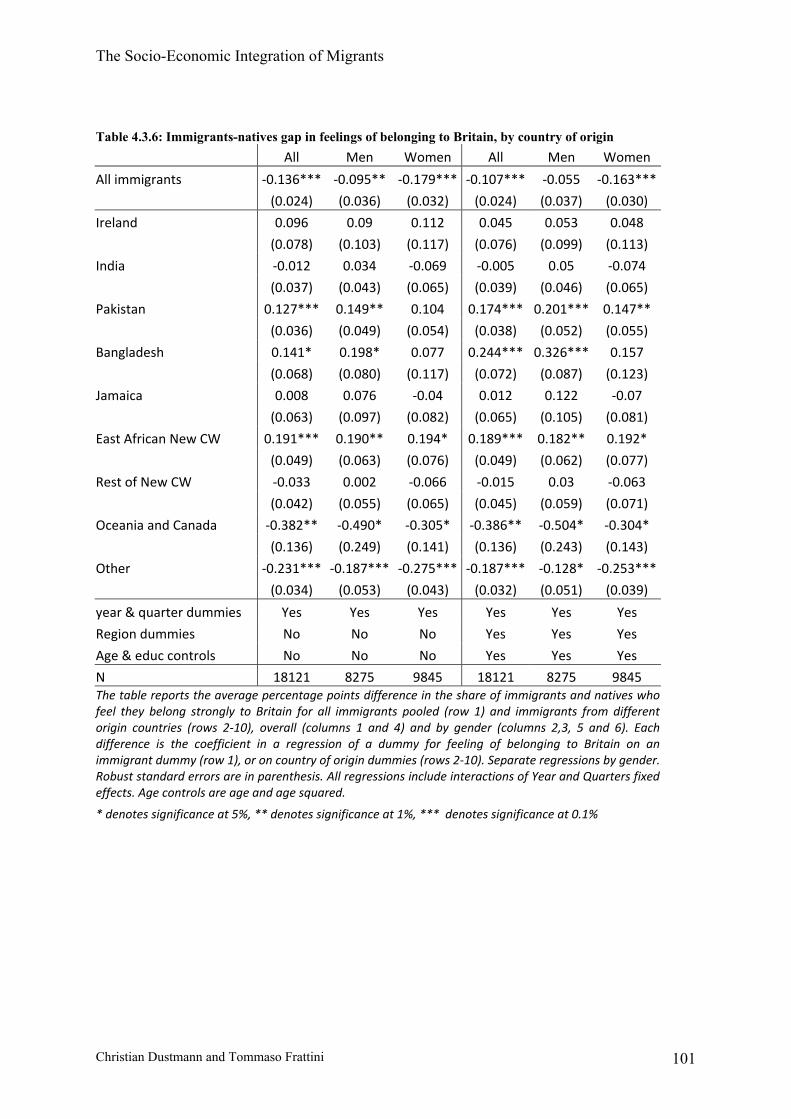
The Socio-Economic Integration of Migrants
Christian Dustmann and Tommaso Frattini 101
Table 4.3.6: Immigrants-natives gap in feelings of belonging to Britain, by country of origin All Men Women All Men Women
All immigrants ‐0.136*** ‐0.095** ‐0.179*** ‐0.107*** ‐0.055 ‐0.163***
(0.024) (0.036) (0.032) (0.024) (0.037) (0.030)
Ireland 0.096 0.09 0.112 0.045 0.053 0.048
(0.078) (0.103) (0.117) (0.076) (0.099) (0.113)
India ‐0.012 0.034 ‐0.069 ‐0.005 0.05 ‐0.074
(0.037) (0.043) (0.065) (0.039) (0.046) (0.065)
Pakistan 0.127*** 0.149** 0.104 0.174*** 0.201*** 0.147**
(0.036) (0.049) (0.054) (0.038) (0.052) (0.055)
Bangladesh 0.141* 0.198* 0.077 0.244*** 0.326*** 0.157
(0.068) (0.080) (0.117) (0.072) (0.087) (0.123)
Jamaica 0.008 0.076 ‐0.04 0.012 0.122 ‐0.07
(0.063) (0.097) (0.082) (0.065) (0.105) (0.081)
East African New CW 0.191*** 0.190** 0.194* 0.189*** 0.182** 0.192*
(0.049) (0.063) (0.076) (0.049) (0.062) (0.077)
Rest of New CW ‐0.033 0.002 ‐0.066 ‐0.015 0.03 ‐0.063
(0.042) (0.055) (0.065) (0.045) (0.059) (0.071)
Oceania and Canada ‐0.382** ‐0.490* ‐0.305* ‐0.386** ‐0.504* ‐0.304*
(0.136) (0.249) (0.141) (0.136) (0.243) (0.143)
Other ‐0.231*** ‐0.187*** ‐0.275*** ‐0.187*** ‐0.128* ‐0.253***
(0.034) (0.053) (0.043) (0.032) (0.051) (0.039)
year & quarter dummies Yes Yes Yes Yes Yes Yes
Region dummies No No No Yes Yes Yes
Age & educ controls No No No Yes Yes Yes
N 18121 8275 9845 18121 8275 9845 The table reports the average percentage points difference in the share of immigrants and natives who feel they belong strongly to Britain for all immigrants pooled (row 1) and immigrants from different origin countries (rows 2‐10), overall (columns 1 and 4) and by gender (columns 2,3, 5 and 6). Each difference is the coefficient in a regression of a dummy for feeling of belonging to Britain on an immigrant dummy (row 1), or on country of origin dummies (rows 2‐10). Separate regressions by gender. Robust standard errors are in parenthesis. All regressions include interactions of Year and Quarters fixed effects. Age controls are age and age squared.
* denotes significance at 5%, ** denotes significance at 1%, *** denotes significance at 0.1%

The Socio-Economic Integration of Migrants
Christian Dustmann and Tommaso Frattini 102
Table 4.3.7: Immigrants- white natives gap in feelings of belonging to Britain, by ethnicity and gender All Men Women All Men Women
White immigrants ‐0.214*** ‐0.186** ‐0.242*** ‐0.185*** ‐0.144* ‐0.229***
(0.038) (0.059) (0.049) (0.036) (0.057) (0.044) Black ‐ Caribbean ‐0.072 0.009 ‐0.131 ‐0.064 0.057 ‐0.155*
(0.051) (0.074) (0.069) (0.054) (0.080) (0.072) Black ‐ African ‐0.054 ‐0.004 ‐0.107* ‐0.002 0.05 ‐0.061
(0.034) (0.051) (0.045) (0.038) (0.056) (0.052) Indian 0.068** 0.085* 0.055 0.088** 0.112** 0.067
(0.026) (0.036) (0.037) (0.029) (0.041) (0.042) Pakistani 0.118** 0.142** 0.092 0.167*** 0.193*** 0.144**
(0.036) (0.048) (0.053) (0.038) (0.052) (0.056) Bangladeshi 0.126 0.187* 0.054 0.239*** 0.323*** 0.147
(0.067) (0.078) (0.116) (0.071) (0.086) (0.123) Chinese ‐0.475*** ‐0.486*** ‐0.473*** ‐0.421*** ‐0.391*** ‐0.453***
(0.070) (0.099) (0.097) (0.070) (0.102) (0.098) Other ‐ mixed ‐0.143*** ‐0.095 ‐0.193*** ‐0.088* ‐0.02 ‐0.158**
(0.038) (0.062) (0.043) (0.042) (0.067) (0.048) year & quarter dummies Yes Yes Yes Yes Yes Yes
Region dummies No No No Yes Yes Yes Age & educ controls No No No Yes Yes Yes
N 15276 7041 8234 15276 7041 8234 The table reports the average percentage points difference in the share of immigrants and natives who feel they belong strongly to Britain for immigrants of different ethnicities, overall (columns 1 and 4) and by gender (columns 2,3, 5 and 6). Each difference is the coefficient in a regression of a dummy for feeling of belonging to Britain on an immigrant dummy interacted with ethnicity dummies. Separate regressions by gender. Robust standard errors are in parenthesis. All regressions include interactions of Year and Quarters fixed effects. Age controls are age and age squared. * denotes significance at 5%, ** denotes significance at 1%, *** denotes significance at 0.1%

The Socio-Economic Integration of Migrants
Christian Dustmann and Tommaso Frattini 103
Table 4.3.8: Immigrants- natives gap in feelings of belonging to Britain, by region All Men Women All Men Women
North East ‐0.374* ‐0.255 ‐0.523 ‐0.352* ‐0.235 ‐0.499
(0.170) (0.213) (0.275) (0.167) (0.205) (0.278)
North West ‐0.233* ‐0.237 ‐0.232* ‐0.208* ‐0.221 ‐0.210*
(0.092) (0.145) (0.110) (0.089) (0.140) (0.107)
Yorks & Humbers. ‐0.159 ‐0.231 ‐0.074 ‐0.138 ‐0.202 ‐0.069
(0.091) (0.141) (0.105) (0.089) (0.134) (0.110)
East Midlands ‐0.063 ‐0.171 0.05 ‐0.034 ‐0.132 0.065
(0.100) (0.159) (0.092) (0.089) (0.135) (0.088)
West Midlands ‐0.056 0.102 ‐0.222 ‐0.045 0.119 ‐0.214
(0.079) (0.100) (0.115) (0.079) (0.099) (0.113)
Eastern ‐0.052 0.056 ‐0.153 ‐0.036 0.059 ‐0.132
(0.077) (0.120) (0.098) (0.076) (0.118) (0.099)
London ‐0.156*** ‐0.06 ‐0.255*** ‐0.135** ‐0.042 ‐0.236***
(0.046) (0.066) (0.064) (0.043) (0.061) (0.059)
South East ‐0.088 ‐0.064 ‐0.119 ‐0.087 ‐0.043 ‐0.140*
(0.059) (0.096) (0.066) (0.058) (0.096) (0.063)
South West ‐0.125 ‐0.096 ‐0.149 ‐0.089 ‐0.02 ‐0.139
(0.098) (0.153) (0.124) (0.094) (0.148) (0.118)
Wales 0.12 0.126 0.117 0.113 0.059 0.139
(0.141) (0.247) (0.168) (0.135) (0.241) (0.154)
year & quarter dummies Yes Yes Yes Yes Yes Yes
Region dummies Yes Yes Yes Yes Yes Yes
Age & educ controls No No No Yes Yes Yes
N 18121 8275 9845 18121 8275 9845 The table reports the average percentage points difference in the share of immigrants and natives who feel they belong strongly to Britain in each Government Office Region. Each difference is the coefficient in a regression of a dummy for feeling of belonging to Britain on an immigrant dummy interacted with region dummies. Separate regressions by gender. Robust standard errors are in parenthesis. All regressions include interactions of Year and Quarters fixed effects. Age controls are age and age squared. * denotes significance at 5%, ** denotes significance at 1%, *** denotes significance at 0.1%

The Socio-Economic Integration of Migrants
Christian Dustmann and Tommaso Frattini 104
Table 4.3.9: Immigrants-natives gap in civic participation, by country of origin and gender All Men Women All Men Women
All immigrants ‐0.018* ‐0.021 ‐0.014 ‐0.027** ‐0.032* ‐0.021
(0.008) (0.011) (0.011) (0.009) (0.013) (0.013)
Ireland 0.043 0.033 0.055 0.01 0.004 0.018
(0.045) (0.056) (0.074) (0.046) (0.057) (0.075)
India ‐0.01 0.006 ‐0.034 ‐0.029 ‐0.013 ‐0.053**
(0.018) (0.028) (0.019) (0.019) (0.029) (0.019)
Pakistan ‐0.023 ‐0.006 ‐0.057*** ‐0.023 ‐0.011 ‐0.048**
(0.015) (0.021) (0.016) (0.015) (0.022) (0.018)
Bangladesh 0.011 0.008 0.014 0.024 0.011 0.041
(0.026) (0.035) (0.037) (0.027) (0.037) (0.039)
Jamaica ‐0.001 ‐0.060* 0.029 ‐0.015 ‐0.063* 0.005
(0.024) (0.029) (0.033) (0.024) (0.031) (0.033)
East African New CW 0.013 0.02 0.004 ‐0.004 0.005 ‐0.012
(0.023) (0.037) (0.028) (0.024) (0.037) (0.030)
Rest of New CW 0 ‐0.018 0.021 ‐0.013 ‐0.031 0.008
(0.025) (0.019) (0.050) (0.025) (0.021) (0.047)
Oceania and Canada 0.031 ‐0.007 0.061 0.008 ‐0.037 0.047
(0.049) (0.073) (0.065) (0.049) (0.074) (0.065)
Other ‐0.034*** ‐0.038** ‐0.029* ‐0.039*** ‐0.045** ‐0.033*
(0.009) (0.014) (0.013) (0.011) (0.016) (0.014)
year & quarter dummies Yes Yes Yes Yes Yes Yes
Region dummies No No No Yes Yes Yes
Age & educ controls No No No Yes Yes Yes
N 18266 8333 9932 18266 8333 9932 The table reports the average percentage points difference in the share of immigrants and natives who have or have had during the last 12 months any form of civic participation for all immigrants pooled (row 1) and immigrants from different origin countries (rows 2‐10), overall (columns 1 and 4) and by gender (columns 2,3, 5 and 6). Each difference is the coefficient in a regression of a dummy for civic participation on an immigrant dummy (row 1), or on country of origin dummies (rows 2‐10). Separate regressions by gender. Robust standard errors are in parenthesis. All regressions include interactions of year and quarters fixed effects. Age controls are age and age squared. * denotes significance at 5%, ** denotes significance at 1%, *** denotes significance at 0.1%

The Socio-Economic Integration of Migrants
Christian Dustmann and Tommaso Frattini 105
Table 4.3.10: Immigrants- white natives gap in civic participation, by ethnicity and gender All Men Women All Men Women
White immigrants ‐0.017 ‐0.023 ‐0.01 ‐0.025 ‐0.034 ‐0.015
(0.012) (0.018) (0.017) (0.013) (0.019) (0.018)
Black ‐ Caribbean 0.025 ‐0.024 0.056* 0.013 ‐0.028 0.037
(0.020) (0.032) (0.026) (0.021) (0.032) (0.027)
Black ‐ African 0.001 0.006 ‐0.005 ‐0.004 ‐0.004 ‐0.004
(0.012) (0.019) (0.015) (0.014) (0.021) (0.018)
Indian ‐0.025* ‐0.025 ‐0.027 ‐0.038** ‐0.039* ‐0.039*
(0.010) (0.014) (0.015) (0.012) (0.017) (0.016)
Pakistani ‐0.027 ‐0.011 ‐0.056*** ‐0.025 ‐0.016 ‐0.043*
(0.014) (0.020) (0.016) (0.015) (0.021) (0.017)
Bangladeshi 0.02 0.004 0.041 0.038 0.009 0.075
(0.026) (0.034) (0.040) (0.027) (0.036) (0.041)
Chinese ‐0.070*** ‐0.101*** ‐0.045 ‐0.072*** ‐0.104*** ‐0.052
(0.017) (0.011) (0.030) (0.018) (0.015) (0.030)
Other ‐ mixed ‐0.027** ‐0.012 ‐0.044*** ‐0.031** ‐0.02 ‐0.044**
(0.010) (0.016) (0.012) (0.012) (0.018) (0.014)
year & quarter dummies Yes Yes Yes Yes Yes Yes
Region dummies No No No Yes Yes Yes
Age & educ controls No No No Yes Yes Yes
N 15389 7090 8298 15389 7090 8298 The table reports the average percentage points difference in the share of immigrants and natives who have or have had within the last 12 months any form of civic participation for immigrants of different ethnicities, overall (columns 1 and 4) and by gender (columns 2,3, 5 and 6). Each difference is the coefficient in a regression of a dummy for civic participation on an immigrant dummy interacted with ethnicity dummies. Separate regressions by gender. Robust standard errors are in parenthesis. All regression include interactions of Year and Quarters fixed effects. Age controls are age and age squared. * denotes significance at 5%, ** denotes significance at 1%, *** denotes significance at 0.1%
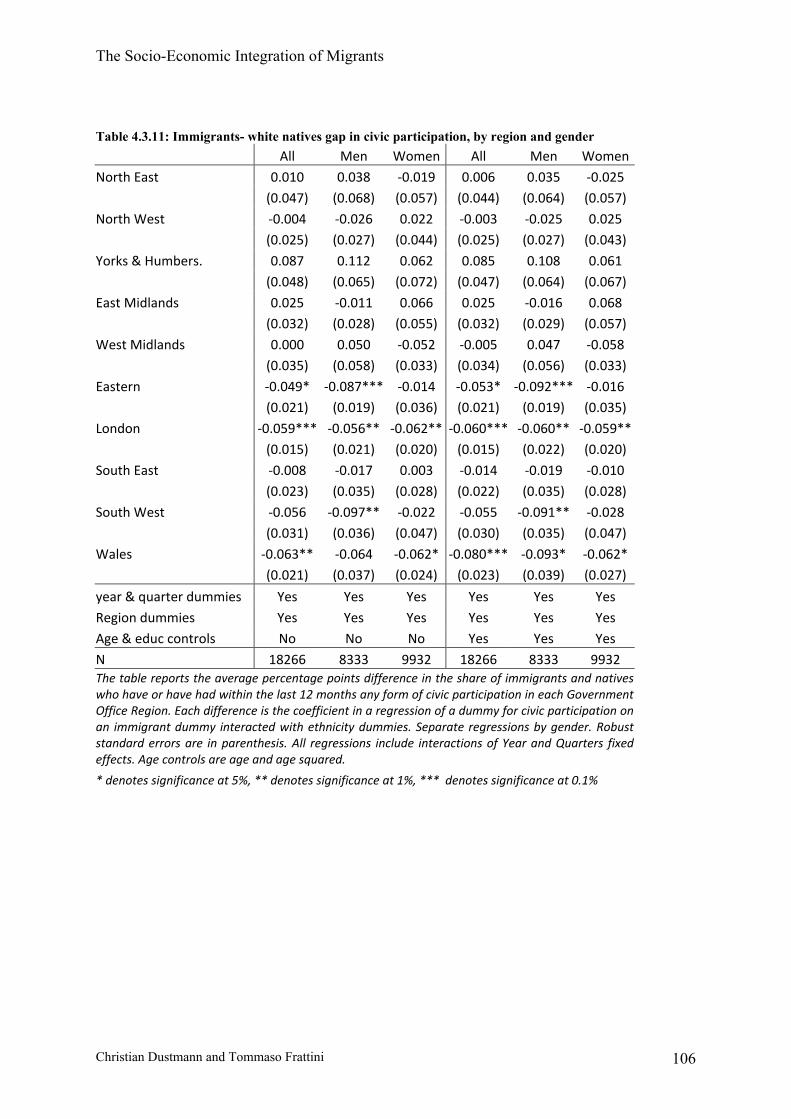
The Socio-Economic Integration of Migrants
Christian Dustmann and Tommaso Frattini 106
Table 4.3.11: Immigrants- white natives gap in civic participation, by region and gender All Men Women All Men Women
North East 0.010 0.038 ‐0.019 0.006 0.035 ‐0.025 (0.047) (0.068) (0.057) (0.044) (0.064) (0.057)
North West ‐0.004 ‐0.026 0.022 ‐0.003 ‐0.025 0.025 (0.025) (0.027) (0.044) (0.025) (0.027) (0.043)
Yorks & Humbers. 0.087 0.112 0.062 0.085 0.108 0.061 (0.048) (0.065) (0.072) (0.047) (0.064) (0.067)
East Midlands 0.025 ‐0.011 0.066 0.025 ‐0.016 0.068 (0.032) (0.028) (0.055) (0.032) (0.029) (0.057)
West Midlands 0.000 0.050 ‐0.052 ‐0.005 0.047 ‐0.058 (0.035) (0.058) (0.033) (0.034) (0.056) (0.033)
Eastern ‐0.049* ‐0.087*** ‐0.014 ‐0.053* ‐0.092*** ‐0.016 (0.021) (0.019) (0.036) (0.021) (0.019) (0.035)
London ‐0.059*** ‐0.056** ‐0.062** ‐0.060*** ‐0.060** ‐0.059** (0.015) (0.021) (0.020) (0.015) (0.022) (0.020)
South East ‐0.008 ‐0.017 0.003 ‐0.014 ‐0.019 ‐0.010 (0.023) (0.035) (0.028) (0.022) (0.035) (0.028)
South West ‐0.056 ‐0.097** ‐0.022 ‐0.055 ‐0.091** ‐0.028 (0.031) (0.036) (0.047) (0.030) (0.035) (0.047)
Wales ‐0.063** ‐0.064 ‐0.062* ‐0.080*** ‐0.093* ‐0.062* (0.021) (0.037) (0.024) (0.023) (0.039) (0.027)
year & quarter dummies Yes Yes Yes Yes Yes Yes
Region dummies Yes Yes Yes Yes Yes Yes Age & educ controls No No No Yes Yes Yes
N 18266 8333 9932 18266 8333 9932 The table reports the average percentage points difference in the share of immigrants and natives who have or have had within the last 12 months any form of civic participation in each Government Office Region. Each difference is the coefficient in a regression of a dummy for civic participation on an immigrant dummy interacted with ethnicity dummies. Separate regressions by gender. Robust standard errors are in parenthesis. All regressions include interactions of Year and Quarters fixed effects. Age controls are age and age squared.
* denotes significance at 5%, ** denotes significance at 1%, *** denotes significance at 0.1%

The Socio-Economic Integration of Migrants
Christian Dustmann and Tommaso Frattini 107
Table 5.1: Minority - White natives education gap 1993‐1994 2000‐2001 2008‐2009 (1) (2) (3) (4) (5) (6) Ethnic Minority 1.055*** 0.669*** 1.217*** 0.847*** 1.331*** 0.926*** (0.029) (0.029) (0.032) (0.032) (0.028) (0.028) Black ‐ Caribbean 0.692*** 0.294*** 0.447*** 0.097 0.473*** 0.102 (0.040) (0.040) (0.051) (0.050) (0.053) (0.053) Black ‐ African 2.370*** 1.993*** 2.946*** 2.588*** 2.474*** 2.078*** (0.134) (0.135) (0.149) (0.149) (0.151) (0.150) Indian 1.660*** 1.264*** 2.057*** 1.644*** 2.359*** 1.903*** (0.067) (0.067) (0.067) (0.066) (0.056) (0.056) Pakistani 0.554*** 0.157 1.064*** 0.660*** 0.955*** 0.502*** (0.093) (0.093) (0.088) (0.087) (0.063) (0.063) Bangladeshi 1.357*** 0.978*** 0.447* 0.012 1.454*** 1.013*** (0.218) (0.216) (0.174) (0.175) (0.156) (0.155) Chinese 1.948*** 1.612*** 2.503*** 2.229*** 3.314*** 2.885*** (0.245) (0.242) (0.219) (0.209) (0.184) (0.182) Other ‐ mixed 0.875*** 0.516*** 0.924*** 0.590*** 0.956*** 0.608*** (0.058) (0.058) (0.063) (0.063) (0.051) (0.050) Year & Quarter dummies
Yes Yes Yes Yes Yes Yes
Age controls No Yes No Yes No Yes
N 639596 639596 481821 481821 486680 486680 The table reports the average difference (in years) in the age at which individuals left full time education between non‐white and white natives (row 1), and between natives from different ethnic groups and white natives. Each difference is the coefficient in a regression of years of education on dummies for ethnic groups, for natives only. Robust standard errors are in parenthesis. All regressions include interactions of year and quarters fixed effects. Age controls are age and age squared. * denotes significance at 5%, ** denotes significance at 1%, *** denotes significance at 0.1%

The Socio-Economic Integration of Migrants
Christian Dustmann and Tommaso Frattini 108
Table 5.2: Minority - White natives education gap, by gender 1993‐1994 2000‐2001 2008‐2009
(1) (2) (3) (4) (5) (6)
Men Women Men Women Men Women Men Women Men Women Men Women
Ethnic Minority
1.084*** 1.028*** 0.708*** 0.634*** 1.369***1.078***1.021***0.688***1.419*** 1.248***1.080***0.774***(0.043) (0.039) (0.043) (0.039) (0.049) (0.042) (0.049) (0.042) (0.042) (0.038) (0.041) (0.037)
Black ‐ Caribbean
0.501*** 0.858*** 0.101 0.463*** 0.487*** 0.413*** 0.137 0.064 0.186* 0.729*** ‐0.138 0.309***
(0.061) (0.052) (0.060) (0.052) (0.080) (0.065) (0.079) (0.064) (0.080) (0.071) (0.079) (0.071)
Black ‐ African
2.585*** 2.169*** 2.216*** 1.783*** 3.188*** 2.732*** 2.850*** 2.338*** 2.738*** 2.269*** 2.371*** 1.840***
(0.207) (0.171) (0.210) (0.171) (0.238) (0.186) (0.237) (0.186) (0.239) (0.191) (0.238) (0.189)
Indian 1.744*** 1.565*** 1.367*** 1.146*** 2.173*** 1.938*** 1.788*** 1.497*** 2.459*** 2.236*** 2.076*** 1.705***
(0.097) (0.091) (0.096) (0.091) (0.098) (0.090) (0.098) (0.089) (0.079) (0.080) (0.078) (0.079)
Pakistani 1.105*** 0.010 0.734*** ‐0.415** 1.566*** 0.611*** 1.216*** 0.152 1.338*** 0.574*** 0.970*** 0.028
(0.123) (0.136) (0.123) (0.135) (0.141) (0.105) (0.140) (0.105) (0.093) (0.084) (0.093) (0.084)
Bangladeshi 1.815*** 1.074*** 1.478*** 0.678** 0.968*** ‐0.082 0.610* ‐0.589** 1.839*** 1.121*** 1.497*** 0.576**
(0.394) (0.250) (0.386) (0.248) (0.284) (0.181) (0.281) (0.184) (0.250) (0.191) (0.247) (0.190)
Chinese 1.760*** 2.200*** 1.461*** 1.835*** 1.980*** 3.077*** 1.741*** 2.757*** 3.344*** 3.268*** 3.013*** 2.734***
(0.300) (0.405) (0.290) (0.408) (0.310) (0.297) (0.297) (0.283) (0.249) (0.271) (0.245) (0.268)
Other ‐ mixed 0.780*** 0.955*** 0.431*** 0.591*** 0.952*** 0.901*** 0.637*** 0.554*** 0.924*** 0.988*** 0.649*** 0.564***
(0.085) (0.080) (0.084) (0.080) (0.094) (0.086) (0.093) (0.085) (0.075) (0.070) (0.074) (0.069)
Year & Quarter dummies
Yes Yes Yes Yes Yes Yes Yes Yes Yes Yes Yes Yes
Age controls No No Yes Yes No No Yes Yes No No Yes Yes
N 324219 315377 324219 315377 241904 239917 241904 239917 233541 253139 233541 253139 The table reports the average difference (in years) in the age at which individuals left full time education between non‐white and white natives (row 1), and between natives from different ethnic groups and white natives., by gender. Each difference is the coefficient in a regression of years of education on dummies for ethnic groups for natives only. Separate regressions by gender. Robust standard errors are in parenthesis. All regression include interactions of Year and Quarters fixed effects. Age controls are age and age squared.
* denotes significance at 5%, ** denotes significance at 1%, *** denotes significance at 0.1%
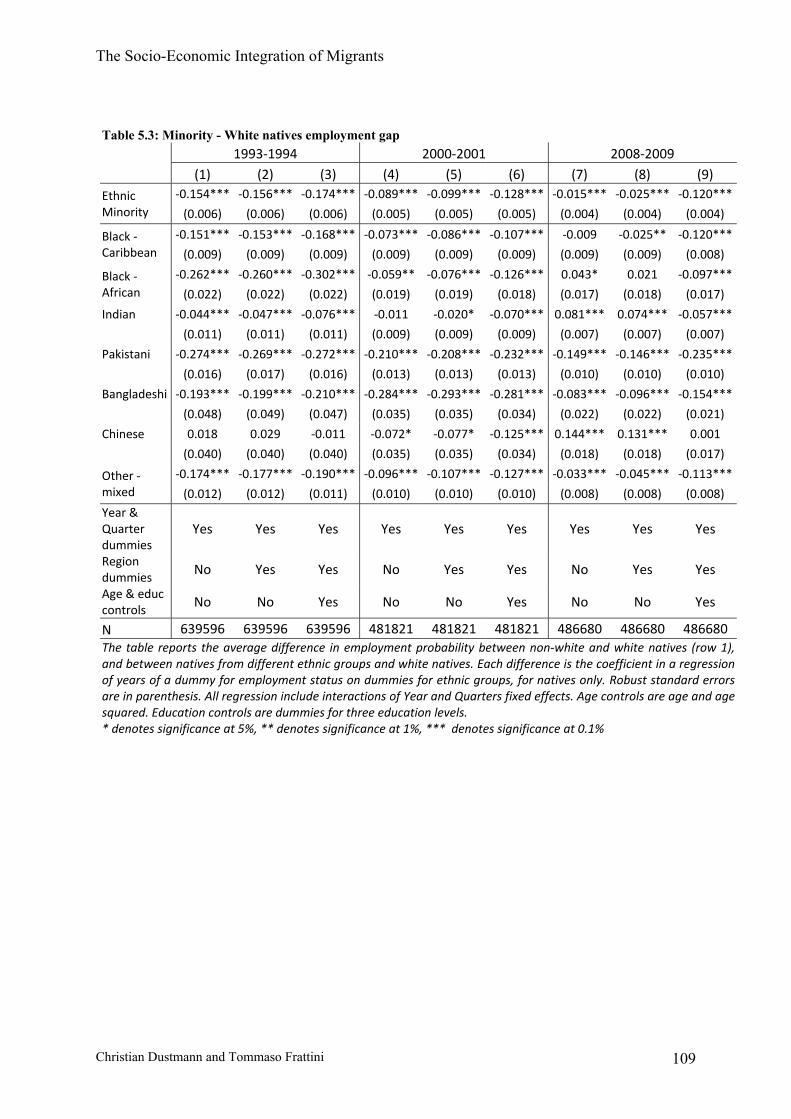
The Socio-Economic Integration of Migrants
Christian Dustmann and Tommaso Frattini 109
Table 5.3: Minority - White natives employment gap 1993‐1994 2000‐2001 2008‐2009 (1) (2) (3) (4) (5) (6) (7) (8) (9) Ethnic Minority
‐0.154*** ‐0.156*** ‐0.174*** ‐0.089*** ‐0.099*** ‐0.128*** ‐0.015*** ‐0.025*** ‐0.120***
(0.006) (0.006) (0.006) (0.005) (0.005) (0.005) (0.004) (0.004) (0.004)
Black ‐ Caribbean
‐0.151*** ‐0.153*** ‐0.168*** ‐0.073*** ‐0.086*** ‐0.107*** ‐0.009 ‐0.025** ‐0.120***
(0.009) (0.009) (0.009) (0.009) (0.009) (0.009) (0.009) (0.009) (0.008)
Black ‐ African
‐0.262*** ‐0.260*** ‐0.302*** ‐0.059** ‐0.076*** ‐0.126*** 0.043* 0.021 ‐0.097***
(0.022) (0.022) (0.022) (0.019) (0.019) (0.018) (0.017) (0.018) (0.017)
Indian ‐0.044*** ‐0.047*** ‐0.076*** ‐0.011 ‐0.020* ‐0.070*** 0.081*** 0.074*** ‐0.057***
(0.011) (0.011) (0.011) (0.009) (0.009) (0.009) (0.007) (0.007) (0.007)
Pakistani ‐0.274*** ‐0.269*** ‐0.272*** ‐0.210*** ‐0.208*** ‐0.232*** ‐0.149*** ‐0.146*** ‐0.235***
(0.016) (0.017) (0.016) (0.013) (0.013) (0.013) (0.010) (0.010) (0.010)
Bangladeshi ‐0.193*** ‐0.199*** ‐0.210*** ‐0.284*** ‐0.293*** ‐0.281*** ‐0.083*** ‐0.096*** ‐0.154***
(0.048) (0.049) (0.047) (0.035) (0.035) (0.034) (0.022) (0.022) (0.021)
Chinese 0.018 0.029 ‐0.011 ‐0.072* ‐0.077* ‐0.125*** 0.144*** 0.131*** 0.001
(0.040) (0.040) (0.040) (0.035) (0.035) (0.034) (0.018) (0.018) (0.017)
Other ‐ mixed
‐0.174*** ‐0.177*** ‐0.190*** ‐0.096*** ‐0.107*** ‐0.127*** ‐0.033*** ‐0.045*** ‐0.113***
(0.012) (0.012) (0.011) (0.010) (0.010) (0.010) (0.008) (0.008) (0.008) Year & Quarter dummies
Yes Yes Yes Yes Yes Yes Yes Yes Yes
Region dummies
No Yes Yes No Yes Yes No Yes Yes
Age & educ controls
No No Yes No No Yes No No Yes
N 639596 639596 639596 481821 481821 481821 486680 486680 486680 The table reports the average difference in employment probability between non‐white and white natives (row 1), and between natives from different ethnic groups and white natives. Each difference is the coefficient in a regression of years of a dummy for employment status on dummies for ethnic groups, for natives only. Robust standard errorsare in parenthesis. All regression include interactions of Year and Quarters fixed effects. Age controls are age and age squared. Education controls are dummies for three education levels. * denotes significance at 5%, ** denotes significance at 1%, *** denotes significance at 0.1%
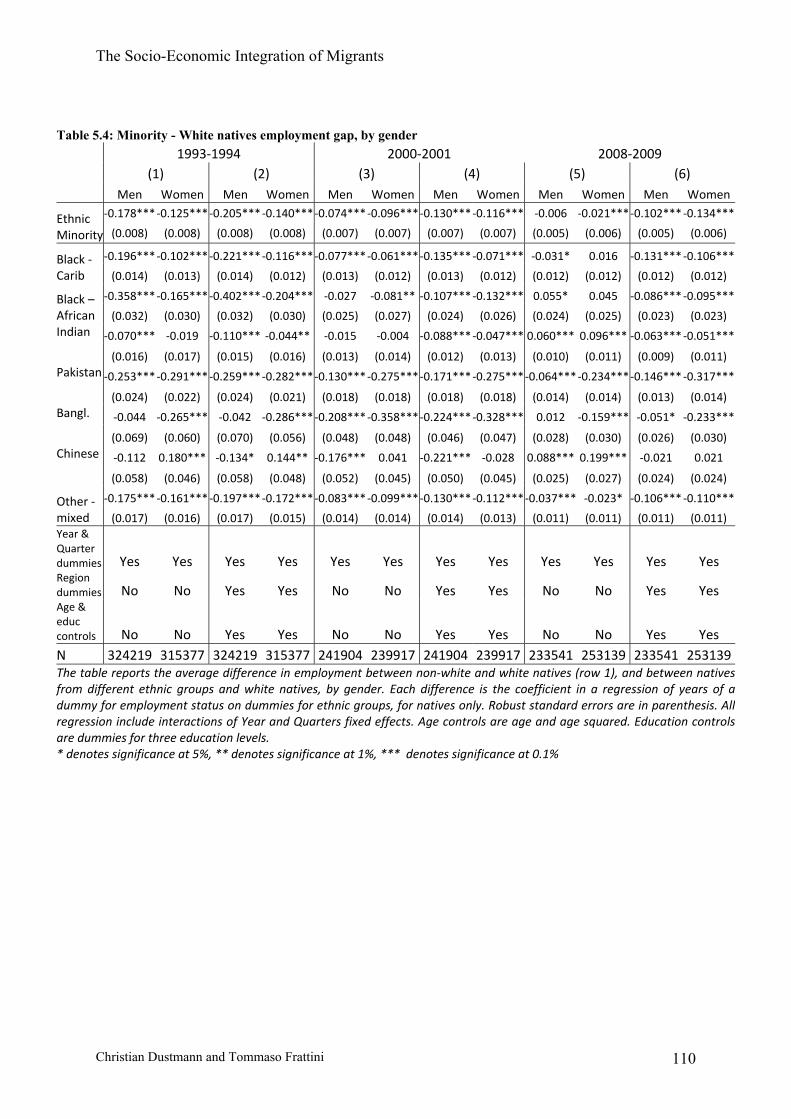
The Socio-Economic Integration of Migrants
Christian Dustmann and Tommaso Frattini 110
Table 5.4: Minority - White natives employment gap, by gender 1993‐1994 2000‐2001 2008‐2009 (1) (2) (3) (4) (5) (6) Men Women Men Women Men Women Men Women Men Women Men Women
Ethnic Minority
‐0.178*** ‐0.125*** ‐0.205*** ‐0.140*** ‐0.074*** ‐0.096***‐0.130*** ‐0.116*** ‐0.006 ‐0.021*** ‐0.102*** ‐0.134***
(0.008) (0.008) (0.008) (0.008) (0.007) (0.007) (0.007) (0.007) (0.005) (0.006) (0.005) (0.006)
Black ‐ Carib
‐0.196*** ‐0.102*** ‐0.221*** ‐0.116*** ‐0.077*** ‐0.061***‐0.135*** ‐0.071*** ‐0.031* 0.016 ‐0.131*** ‐0.106***
(0.014) (0.013) (0.014) (0.012) (0.013) (0.012) (0.013) (0.012) (0.012) (0.012) (0.012) (0.012)
Black – African
‐0.358*** ‐0.165*** ‐0.402*** ‐0.204*** ‐0.027 ‐0.081** ‐0.107*** ‐0.132*** 0.055* 0.045 ‐0.086*** ‐0.095***
(0.032) (0.030) (0.032) (0.030) (0.025) (0.027) (0.024) (0.026) (0.024) (0.025) (0.023) (0.023) Indian
‐0.070*** ‐0.019 ‐0.110*** ‐0.044** ‐0.015 ‐0.004 ‐0.088*** ‐0.047*** 0.060*** 0.096*** ‐0.063*** ‐0.051***
(0.016) (0.017) (0.015) (0.016) (0.013) (0.014) (0.012) (0.013) (0.010) (0.011) (0.009) (0.011) Pakistan
‐0.253*** ‐0.291*** ‐0.259*** ‐0.282*** ‐0.130*** ‐0.275***‐0.171*** ‐0.275***‐0.064*** ‐0.234*** ‐0.146*** ‐0.317***
(0.024) (0.022) (0.024) (0.021) (0.018) (0.018) (0.018) (0.018) (0.014) (0.014) (0.013) (0.014) Bangl.
‐0.044 ‐0.265*** ‐0.042 ‐0.286*** ‐0.208*** ‐0.358***‐0.224*** ‐0.328*** 0.012 ‐0.159*** ‐0.051* ‐0.233***
(0.069) (0.060) (0.070) (0.056) (0.048) (0.048) (0.046) (0.047) (0.028) (0.030) (0.026) (0.030) Chinese
‐0.112 0.180*** ‐0.134* 0.144** ‐0.176*** 0.041 ‐0.221*** ‐0.028 0.088*** 0.199*** ‐0.021 0.021
(0.058) (0.046) (0.058) (0.048) (0.052) (0.045) (0.050) (0.045) (0.025) (0.027) (0.024) (0.024)
Other ‐ mixed
‐0.175*** ‐0.161*** ‐0.197*** ‐0.172*** ‐0.083*** ‐0.099***‐0.130*** ‐0.112***‐0.037*** ‐0.023* ‐0.106*** ‐0.110***
(0.017) (0.016) (0.017) (0.015) (0.014) (0.014) (0.014) (0.013) (0.011) (0.011) (0.011) (0.011) Year & Quarter dummies Yes Yes Yes Yes Yes Yes Yes Yes Yes Yes Yes Yes Region dummies No No Yes Yes No No Yes Yes No No Yes Yes Age & educ controls No No Yes Yes No No Yes Yes No No Yes Yes N 324219 315377 324219 315377 241904 239917 241904 239917 233541 253139 233541 253139The table reports the average difference in employment between non‐white and white natives (row 1), and between natives from different ethnic groups and white natives, by gender. Each difference is the coefficient in a regression of years of adummy for employment status on dummies for ethnic groups, for natives only. Robust standard errors are in parenthesis. Allregression include interactions of Year and Quarters fixed effects. Age controls are age and age squared. Education controlsare dummies for three education levels. * denotes significance at 5%, ** denotes significance at 1%, *** denotes significance at 0.1%
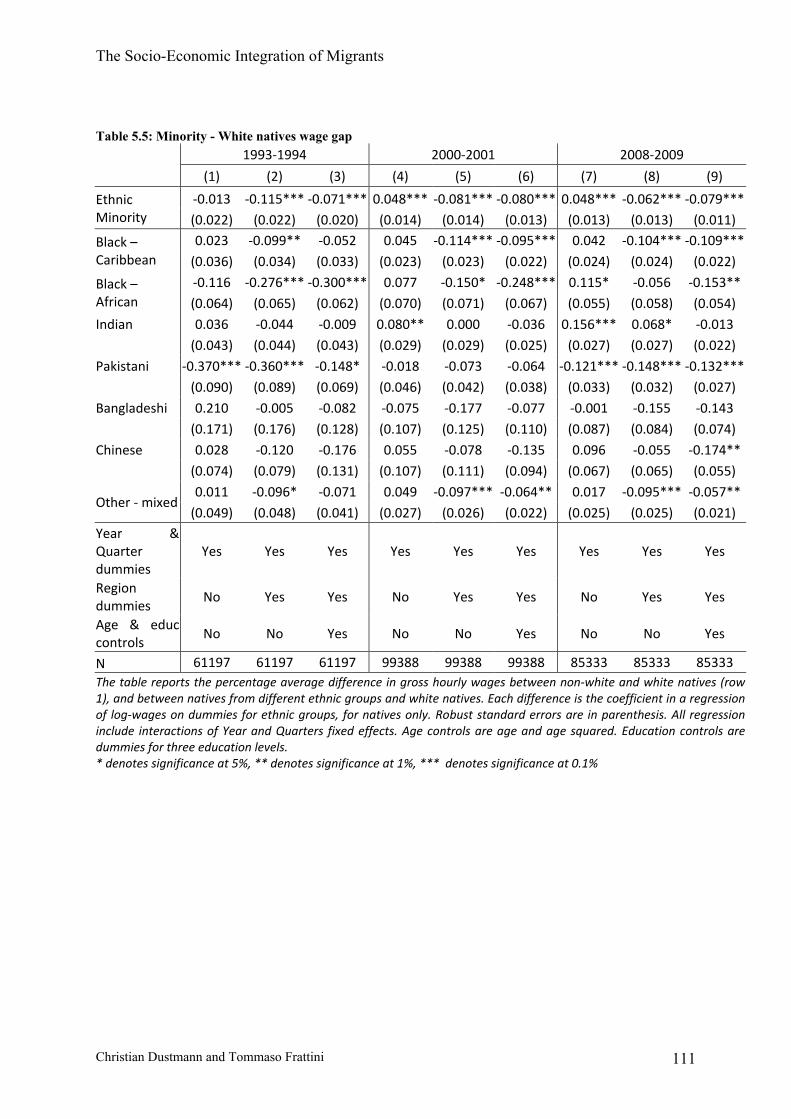
The Socio-Economic Integration of Migrants
Christian Dustmann and Tommaso Frattini 111
Table 5.5: Minority - White natives wage gap 1993‐1994 2000‐2001 2008‐2009
(1) (2) (3) (4) (5) (6) (7) (8) (9)
Ethnic Minority
‐0.013 ‐0.115*** ‐0.071*** 0.048*** ‐0.081*** ‐0.080*** 0.048*** ‐0.062*** ‐0.079***(0.022) (0.022) (0.020) (0.014) (0.014) (0.013) (0.013) (0.013) (0.011)
Black – Caribbean
0.023 ‐0.099** ‐0.052 0.045 ‐0.114*** ‐0.095*** 0.042 ‐0.104*** ‐0.109***
(0.036) (0.034) (0.033) (0.023) (0.023) (0.022) (0.024) (0.024) (0.022)
Black – African
‐0.116 ‐0.276*** ‐0.300*** 0.077 ‐0.150* ‐0.248*** 0.115* ‐0.056 ‐0.153**
(0.064) (0.065) (0.062) (0.070) (0.071) (0.067) (0.055) (0.058) (0.054) Indian 0.036 ‐0.044 ‐0.009 0.080** 0.000 ‐0.036 0.156*** 0.068* ‐0.013
(0.043) (0.044) (0.043) (0.029) (0.029) (0.025) (0.027) (0.027) (0.022) Pakistani ‐0.370*** ‐0.360*** ‐0.148* ‐0.018 ‐0.073 ‐0.064 ‐0.121*** ‐0.148*** ‐0.132***
(0.090) (0.089) (0.069) (0.046) (0.042) (0.038) (0.033) (0.032) (0.027) Bangladeshi 0.210 ‐0.005 ‐0.082 ‐0.075 ‐0.177 ‐0.077 ‐0.001 ‐0.155 ‐0.143
(0.171) (0.176) (0.128) (0.107) (0.125) (0.110) (0.087) (0.084) (0.074) Chinese 0.028 ‐0.120 ‐0.176 0.055 ‐0.078 ‐0.135 0.096 ‐0.055 ‐0.174**
(0.074) (0.079) (0.131) (0.107) (0.111) (0.094) (0.067) (0.065) (0.055)
Other ‐ mixed 0.011 ‐0.096* ‐0.071 0.049 ‐0.097*** ‐0.064** 0.017 ‐0.095*** ‐0.057**
(0.049) (0.048) (0.041) (0.027) (0.026) (0.022) (0.025) (0.025) (0.021) Year & Quarter dummies
Yes Yes Yes Yes Yes Yes Yes Yes Yes
Region dummies
No Yes Yes No Yes Yes No Yes Yes
Age & educ controls
No No Yes No No Yes No No Yes
N 61197 61197 61197 99388 99388 99388 85333 85333 85333 The table reports the percentage average difference in gross hourly wages between non‐white and white natives (row 1), and between natives from different ethnic groups and white natives. Each difference is the coefficient in a regression of log‐wages on dummies for ethnic groups, for natives only. Robust standard errors are in parenthesis. All regression include interactions of Year and Quarters fixed effects. Age controls are age and age squared. Education controls are dummies for three education levels. * denotes significance at 5%, ** denotes significance at 1%, *** denotes significance at 0.1%
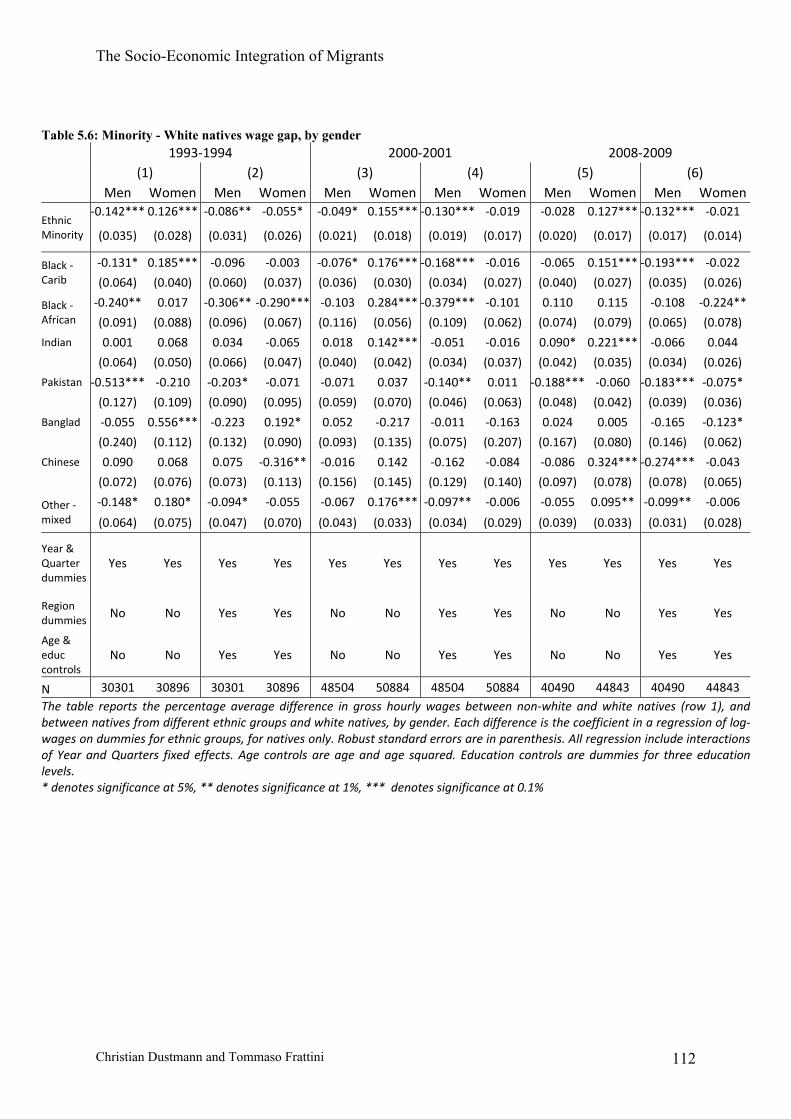
The Socio-Economic Integration of Migrants
Christian Dustmann and Tommaso Frattini 112
Table 5.6: Minority - White natives wage gap, by gender 1993‐1994 2000‐2001 2008‐2009
(1) (2) (3) (4) (5) (6)
Men Women Men Women Men Women Men Women Men Women Men Women
Ethnic Minority
‐0.142*** 0.126*** ‐0.086** ‐0.055* ‐0.049* 0.155*** ‐0.130*** ‐0.019 ‐0.028 0.127*** ‐0.132*** ‐0.021
(0.035) (0.028) (0.031) (0.026) (0.021) (0.018) (0.019) (0.017) (0.020) (0.017) (0.017) (0.014)
Black ‐ Carib
‐0.131* 0.185*** ‐0.096 ‐0.003 ‐0.076* 0.176*** ‐0.168*** ‐0.016 ‐0.065 0.151*** ‐0.193*** ‐0.022
(0.064) (0.040) (0.060) (0.037) (0.036) (0.030) (0.034) (0.027) (0.040) (0.027) (0.035) (0.026)
Black ‐ African
‐0.240** 0.017 ‐0.306** ‐0.290*** ‐0.103 0.284*** ‐0.379*** ‐0.101 0.110 0.115 ‐0.108 ‐0.224**
(0.091) (0.088) (0.096) (0.067) (0.116) (0.056) (0.109) (0.062) (0.074) (0.079) (0.065) (0.078)
Indian 0.001 0.068 0.034 ‐0.065 0.018 0.142*** ‐0.051 ‐0.016 0.090* 0.221*** ‐0.066 0.044
(0.064) (0.050) (0.066) (0.047) (0.040) (0.042) (0.034) (0.037) (0.042) (0.035) (0.034) (0.026)
Pakistan ‐0.513*** ‐0.210 ‐0.203* ‐0.071 ‐0.071 0.037 ‐0.140** 0.011 ‐0.188*** ‐0.060 ‐0.183*** ‐0.075*
(0.127) (0.109) (0.090) (0.095) (0.059) (0.070) (0.046) (0.063) (0.048) (0.042) (0.039) (0.036)
Banglad ‐0.055 0.556*** ‐0.223 0.192* 0.052 ‐0.217 ‐0.011 ‐0.163 0.024 0.005 ‐0.165 ‐0.123*
(0.240) (0.112) (0.132) (0.090) (0.093) (0.135) (0.075) (0.207) (0.167) (0.080) (0.146) (0.062)
Chinese 0.090 0.068 0.075 ‐0.316** ‐0.016 0.142 ‐0.162 ‐0.084 ‐0.086 0.324*** ‐0.274*** ‐0.043
(0.072) (0.076) (0.073) (0.113) (0.156) (0.145) (0.129) (0.140) (0.097) (0.078) (0.078) (0.065)
Other ‐ mixed
‐0.148* 0.180* ‐0.094* ‐0.055 ‐0.067 0.176*** ‐0.097** ‐0.006 ‐0.055 0.095** ‐0.099** ‐0.006
(0.064) (0.075) (0.047) (0.070) (0.043) (0.033) (0.034) (0.029) (0.039) (0.033) (0.031) (0.028)
Year & Quarter dummies
Yes Yes Yes Yes Yes Yes Yes Yes Yes Yes Yes Yes
Region dummies
No No Yes Yes No No Yes Yes No No Yes Yes
Age & educ controls
No No Yes Yes No No Yes Yes No No Yes Yes
N 30301 30896 30301 30896 48504 50884 48504 50884 40490 44843 40490 44843 The table reports the percentage average difference in gross hourly wages between non‐white and white natives (row 1), and between natives from different ethnic groups and white natives, by gender. Each difference is the coefficient in a regression of log‐wages on dummies for ethnic groups, for natives only. Robust standard errors are in parenthesis. All regression include interactions of Year and Quarters fixed effects. Age controls are age and age squared. Education controls are dummies for three education levels. * denotes significance at 5%, ** denotes significance at 1%, *** denotes significance at 0.1%

The Socio-Economic Integration of Migrants
Christian Dustmann and Tommaso Frattini 113
Table 5.7: Second generation immigrants-natives reading and writing gaps, by parental ethnicity Reading Writing (1) (2) (3) (4) Second generation immigrants 0.019 0.014 0.023 0.014 (0.011) (0.012) (0.012) (0.013) White immigrants parents 0.016 0.005 0.022 0.005 (0.025) (0.025) (0.027) (0.027) Black – Caribbean parents 0.013 ‐0.003 0.012 ‐0.013 (0.017) (0.018) (0.020) (0.021) Black – African parents 0.004 ‐0.008 0.009 ‐0.011 (0.027) (0.029) (0.029) (0.032) Indian parents 0.033** 0.030* 0.045*** 0.041** (0.011) (0.013) (0.012) (0.015) Pakistani parents 0.036** 0.053*** 0.015 0.035 (0.012) (0.014) (0.023) (0.025) Bangladeshi parents ‐0.04 ‐0.04 ‐0.02 ‐0.021 (0.050) (0.051) (0.050) (0.051) Chinese parents ‐0.025 ‐0.032 ‐0.006 ‐0.014 (0.074) (0.080) (0.074) (0.083) Other – mixed immigrant parents 0.022 0.017 0.042 0.034 (0.033) (0.034) (0.033) (0.035) year & quarter dummies Yes Yes Yes Yes Region dummies No Yes No Yes Age & educ controls No Yes No Yes N (upper panel) 6358 6358 6358 6358 N (lower panel) 5923 5923 5923 5923 The table reports the average percentage points difference in reading (cols.1‐2) and writing (cols. 3‐4) proficiency between second generation immigrants and natives for all immigrants pooled (row 1) and immigrants from different ethnic origins and white natives (rows 2‐10). Each difference is the coefficient in a regression of a dummy for English fluency on a second generation immigrant dummy (row 1), or on a second generation immigrant dummy interacted with ethnicity dummies (rows 2‐10). The sample is composed of UK born individuals only. Robust standard errors are in parenthesis. All regressions include interactions of Year and Quarters fixed effects. Age controls are age and age squared. * denotes significance at 5%, ** denotes significance at 1%, *** denotes significance at 0.1%

The Socio-Economic Integration of Migrants
Christian Dustmann and Tommaso Frattini 114
Table 5.8: Second generation immigrants-natives reading and writing gaps, by parental ethnicity and gender Reading Writing (1) (2) (3) (4) Men Women Men Women Men Women Men Women Second generation immigrants
0.024 0.016 0.015 0.018 0.040* 0.008 0.027 0.006
(0.015) (0.016) (0.018) (0.016) (0.017) (0.018) (0.020) (0.018)
White immigrants
0.026 0.007 0.01 0.004 0.045 ‐0.001 0.019 ‐0.007 (0.032) (0.038) (0.034) (0.038) (0.034) (0.041) (0.038) (0.040)
Black ‐ Caribbean
0.021 0.003 ‐0.001 ‐0.002 0.021 ‐0.001 ‐0.013 ‐0.013 (0.031) (0.018) (0.033) (0.019) (0.038) (0.019) (0.040) (0.021)
Black ‐ African 0.01 0.01 ‐0.016 0.017 0.023 0.008 ‐0.008 0.007 (0.040) (0.024) (0.045) (0.028) (0.043) (0.026) (0.050) (0.030) Indian 0.038* 0.035*** 0.028 0.038** 0.053** 0.048*** 0.041 0.047*** (0.017) (0.011) (0.022) (0.014) (0.020) (0.010) (0.026) (0.014) Pakistani 0.051** 0.02 0.068** 0.042* 0.058* ‐0.029 0.082** ‐0.009 (0.018) (0.014) (0.022) (0.018) (0.023) (0.040) (0.028) (0.042) Bangladeshi ‐0.054 ‐0.011 ‐0.059 ‐0.002 ‐0.024 ‐0.002 ‐0.026 0.001 (0.081) (0.042) (0.084) (0.043) (0.080) (0.042) (0.084) (0.044) Chinese ‐0.034 0.051*** ‐0.047 0.044** ‐0.004 0.059*** ‐0.012 0.039* (0.098) (0.007) (0.110) (0.016) (0.098) (0.008) (0.117) (0.019) Other ‐ mixed 0.01 0.046*** 0.007 0.040*** 0.039 0.056*** 0.036 0.043*** (0.058) (0.005) (0.062) (0.010) (0.058) (0.005) (0.064) (0.010) year & quarter dummies
Yes Yes Yes Yes Yes Yes Yes Yes
Region dummies
No No Yes Yes No No Yes Yes
Age & educ controls
No No Yes Yes No No Yes Yes
N (upper panel) 2909 3449 2909 3449 2909 3449 2909 3449 N (lower panel) 2704 3219 2704 3219 2704 3219 2704 3219 The table reports the average percentage points difference in reading (cols.1‐2) and writing (cols. 3‐4) proficiency between second generation immigrants and natives for all immigrants pooled (row 1) and immigrants from different ethnic backgrounds (rows 2‐10) by gender. Each difference is the coefficient in a regression of a dummy for English fluency on a second‐generation immigrant dummy (row 1), or on a second‐generation dummy interacted with ethnicity dummies (rows 2‐10). Separate regressions by gender. The sample is composed of UK‐born individuals only. Robust standard errors are in parenthesis. All regression include interactions of Year and Quarters fixed effects. Age controls are age and age squared.
* denotes significance at 5%, ** denotes significance at 1%, *** denotes significance at 0.1%
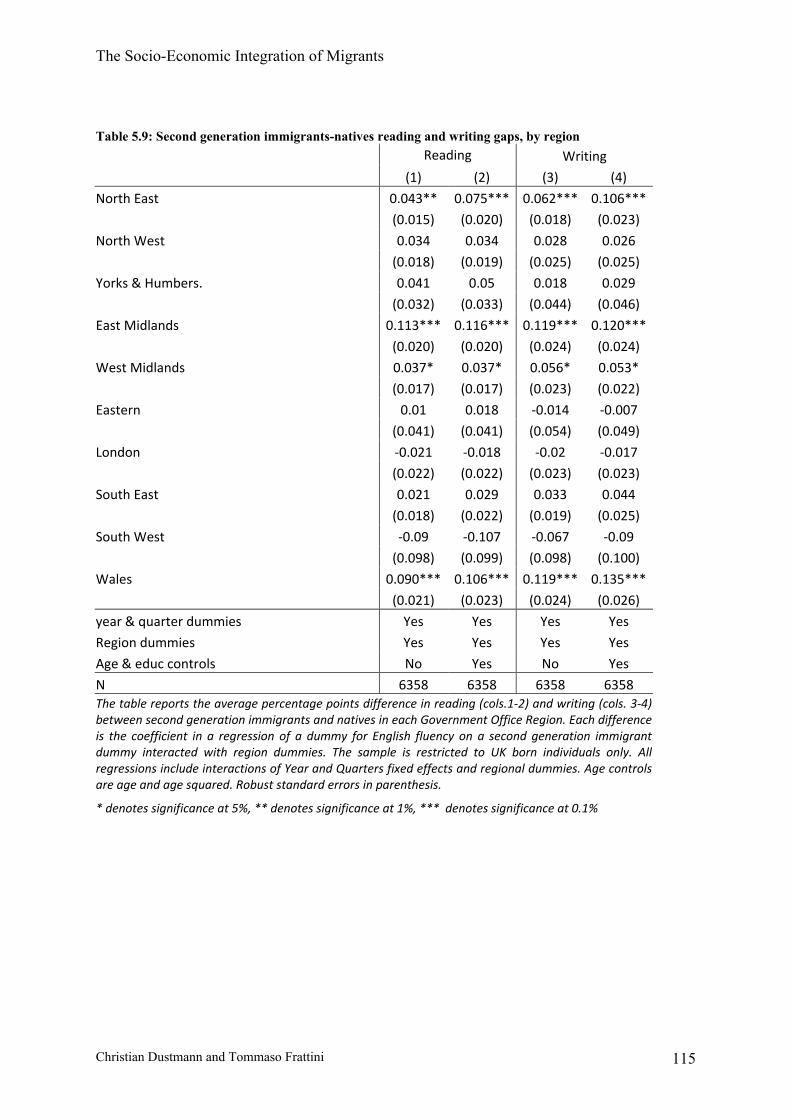
The Socio-Economic Integration of Migrants
Christian Dustmann and Tommaso Frattini 115
Table 5.9: Second generation immigrants-natives reading and writing gaps, by region Reading Writing
(1) (2) (3) (4)
North East 0.043** 0.075*** 0.062*** 0.106***
(0.015) (0.020) (0.018) (0.023)
North West 0.034 0.034 0.028 0.026
(0.018) (0.019) (0.025) (0.025)
Yorks & Humbers. 0.041 0.05 0.018 0.029
(0.032) (0.033) (0.044) (0.046)
East Midlands 0.113*** 0.116*** 0.119*** 0.120***
(0.020) (0.020) (0.024) (0.024)
West Midlands 0.037* 0.037* 0.056* 0.053*
(0.017) (0.017) (0.023) (0.022)
Eastern 0.01 0.018 ‐0.014 ‐0.007
(0.041) (0.041) (0.054) (0.049)
London ‐0.021 ‐0.018 ‐0.02 ‐0.017
(0.022) (0.022) (0.023) (0.023)
South East 0.021 0.029 0.033 0.044
(0.018) (0.022) (0.019) (0.025)
South West ‐0.09 ‐0.107 ‐0.067 ‐0.09
(0.098) (0.099) (0.098) (0.100)
Wales 0.090*** 0.106*** 0.119*** 0.135***
(0.021) (0.023) (0.024) (0.026)
year & quarter dummies Yes Yes Yes Yes
Region dummies Yes Yes Yes Yes
Age & educ controls No Yes No Yes
N 6358 6358 6358 6358 The table reports the average percentage points difference in reading (cols.1‐2) and writing (cols. 3‐4) between second generation immigrants and natives in each Government Office Region. Each difference is the coefficient in a regression of a dummy for English fluency on a second generation immigrant dummy interacted with region dummies. The sample is restricted to UK born individuals only. All regressions include interactions of Year and Quarters fixed effects and regional dummies. Age controls are age and age squared. Robust standard errors in parenthesis.
* denotes significance at 5%, ** denotes significance at 1%, *** denotes significance at 0.1%

The Socio-Economic Integration of Migrants
Christian Dustmann and Tommaso Frattini 116
Table 5.10: Second generation immigrants-natives gap in feelings of belonging to Britain, by parental origin and gender. All Men Women All Men Women
Second generation immigrants ‐0.031 ‐0.054 ‐0.006 0.005 0 0.015 (0.033) (0.052) (0.038) (0.033) (0.051) (0.041)
White immigrants ‐0.044 ‐0.1 0.01 ‐0.048 ‐0.095 0
(0.077) (0.125) (0.082) (0.074) (0.116) (0.083) Black ‐ Caribbean ‐0.156*** ‐0.156* ‐0.162*** ‐0.100* ‐0.071 ‐0.133*
(0.039) (0.064) (0.048) (0.044) (0.069) (0.056) Black ‐ African ‐0.063 0.09 ‐0.232** 0.013 0.202 ‐0.189*
(0.065) (0.096) (0.081) (0.071) (0.106) (0.087) Indian 0.009 0.021 0.005 0.075 0.102 0.057
(0.037) (0.050) (0.054) (0.040) (0.055) (0.058) Pakistani 0.088* 0.003 0.193*** 0.154*** 0.09 0.241***
(0.039) (0.055) (0.049) (0.041) (0.060) (0.051) Bangladeshi 0.019 0.048 ‐0.004 0.124 0.2 0.054
(0.084) (0.112) (0.126) (0.088) (0.117) (0.130) Chinese ‐0.129 ‐0.161 ‐0.004 ‐0.101 ‐0.114 ‐0.009
(0.097) (0.127) (0.122) (0.099) (0.131) (0.126) Other ‐ mixed ‐0.123 ‐0.151 ‐0.096 ‐0.056 ‐0.037 ‐0.071
(0.067) (0.093) (0.093) (0.070) (0.095) (0.098)
year & quarter dummies Yes Yes Yes Yes Yes Yes Region dummies No No No Yes Yes Yes
Age & educ controls No No No Yes Yes Yes N (top panel) 12297 5517 6779 12297 5517 6779
N (bottom panel) 11570 5191 6378 11570 5191 6378 The table reports the average percentage points difference in the share of second generation immigrants and natives who feel they belong strongly to Britain for all second generation immigrants pooled (row 1) and for second generation immigrants of different ethnicities (rows 2‐10), overall (columns 1 and 4) and by gender (columns 2,3, 5 and 6). Each difference is the coefficient in a regression of a dummy for feeling of belonging to Britain on a second generation immigrant dummy interacted, and on a second generation immigrant dummy interacted with ethnicity dummies. Regressions are run on the sample of UK born only. Separate regressions by gender. Robust standard errors are in parenthesis. All regressions include interactions of year and quarters fixed effects. Age controls are age and age squared.
* denotes significance at 5%, ** denotes significance at 1%, *** denotes significance at 0.1%
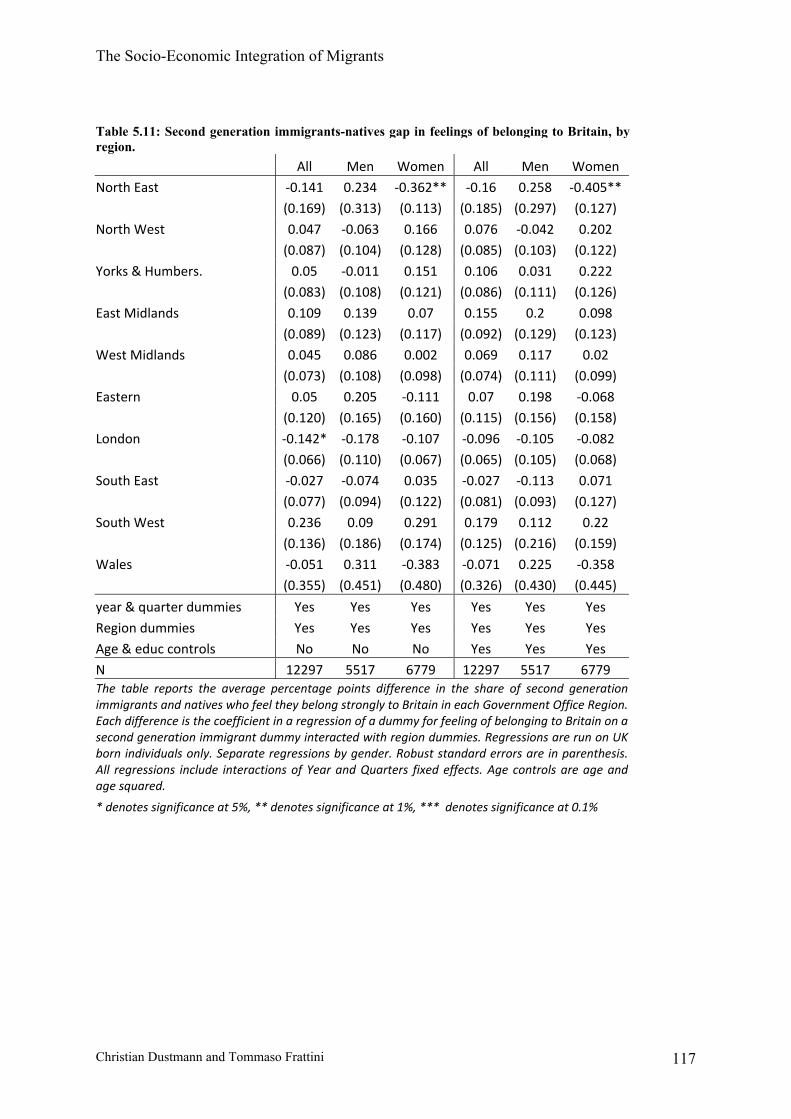
The Socio-Economic Integration of Migrants
Christian Dustmann and Tommaso Frattini 117
Table 5.11: Second generation immigrants-natives gap in feelings of belonging to Britain, by region. All Men Women All Men Women
North East ‐0.141 0.234 ‐0.362** ‐0.16 0.258 ‐0.405** (0.169) (0.313) (0.113) (0.185) (0.297) (0.127)
North West 0.047 ‐0.063 0.166 0.076 ‐0.042 0.202 (0.087) (0.104) (0.128) (0.085) (0.103) (0.122)
Yorks & Humbers. 0.05 ‐0.011 0.151 0.106 0.031 0.222 (0.083) (0.108) (0.121) (0.086) (0.111) (0.126)
East Midlands 0.109 0.139 0.07 0.155 0.2 0.098 (0.089) (0.123) (0.117) (0.092) (0.129) (0.123)
West Midlands 0.045 0.086 0.002 0.069 0.117 0.02 (0.073) (0.108) (0.098) (0.074) (0.111) (0.099)
Eastern 0.05 0.205 ‐0.111 0.07 0.198 ‐0.068 (0.120) (0.165) (0.160) (0.115) (0.156) (0.158)
London ‐0.142* ‐0.178 ‐0.107 ‐0.096 ‐0.105 ‐0.082 (0.066) (0.110) (0.067) (0.065) (0.105) (0.068)
South East ‐0.027 ‐0.074 0.035 ‐0.027 ‐0.113 0.071 (0.077) (0.094) (0.122) (0.081) (0.093) (0.127)
South West 0.236 0.09 0.291 0.179 0.112 0.22 (0.136) (0.186) (0.174) (0.125) (0.216) (0.159)
Wales ‐0.051 0.311 ‐0.383 ‐0.071 0.225 ‐0.358 (0.355) (0.451) (0.480) (0.326) (0.430) (0.445)
year & quarter dummies Yes Yes Yes Yes Yes Yes
Region dummies Yes Yes Yes Yes Yes Yes Age & educ controls No No No Yes Yes Yes
N 12297 5517 6779 12297 5517 6779 The table reports the average percentage points difference in the share of second generation immigrants and natives who feel they belong strongly to Britain in each Government Office Region. Each difference is the coefficient in a regression of a dummy for feeling of belonging to Britain on a second generation immigrant dummy interacted with region dummies. Regressions are run on UK born individuals only. Separate regressions by gender. Robust standard errors are in parenthesis. All regressions include interactions of Year and Quarters fixed effects. Age controls are age and age squared.
* denotes significance at 5%, ** denotes significance at 1%, *** denotes significance at 0.1%
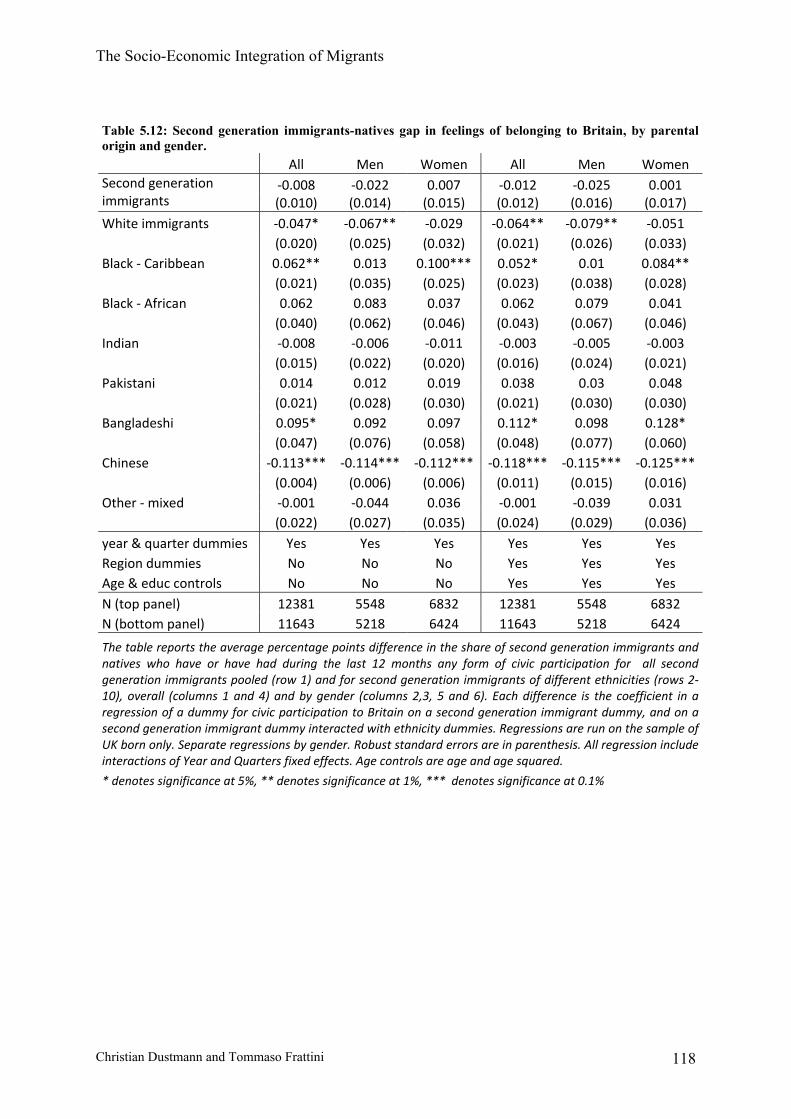
The Socio-Economic Integration of Migrants
Christian Dustmann and Tommaso Frattini 118
Table 5.12: Second generation immigrants-natives gap in feelings of belonging to Britain, by parental origin and gender. All Men Women All Men Women Second generation immigrants
‐0.008 ‐0.022 0.007 ‐0.012 ‐0.025 0.001 (0.010) (0.014) (0.015) (0.012) (0.016) (0.017)
White immigrants ‐0.047* ‐0.067** ‐0.029 ‐0.064** ‐0.079** ‐0.051 (0.020) (0.025) (0.032) (0.021) (0.026) (0.033) Black ‐ Caribbean 0.062** 0.013 0.100*** 0.052* 0.01 0.084** (0.021) (0.035) (0.025) (0.023) (0.038) (0.028) Black ‐ African 0.062 0.083 0.037 0.062 0.079 0.041 (0.040) (0.062) (0.046) (0.043) (0.067) (0.046) Indian ‐0.008 ‐0.006 ‐0.011 ‐0.003 ‐0.005 ‐0.003 (0.015) (0.022) (0.020) (0.016) (0.024) (0.021) Pakistani 0.014 0.012 0.019 0.038 0.03 0.048 (0.021) (0.028) (0.030) (0.021) (0.030) (0.030) Bangladeshi 0.095* 0.092 0.097 0.112* 0.098 0.128* (0.047) (0.076) (0.058) (0.048) (0.077) (0.060) Chinese ‐0.113*** ‐0.114*** ‐0.112*** ‐0.118*** ‐0.115*** ‐0.125*** (0.004) (0.006) (0.006) (0.011) (0.015) (0.016) Other ‐ mixed ‐0.001 ‐0.044 0.036 ‐0.001 ‐0.039 0.031 (0.022) (0.027) (0.035) (0.024) (0.029) (0.036) year & quarter dummies Yes Yes Yes Yes Yes Yes Region dummies No No No Yes Yes Yes Age & educ controls No No No Yes Yes Yes N (top panel) 12381 5548 6832 12381 5548 6832 N (bottom panel) 11643 5218 6424 11643 5218 6424
The table reports the average percentage points difference in the share of second generation immigrants and natives who have or have had during the last 12 months any form of civic participation for all second generation immigrants pooled (row 1) and for second generation immigrants of different ethnicities (rows 2‐10), overall (columns 1 and 4) and by gender (columns 2,3, 5 and 6). Each difference is the coefficient in a regression of a dummy for civic participation to Britain on a second generation immigrant dummy, and on a second generation immigrant dummy interacted with ethnicity dummies. Regressions are run on the sample of UK born only. Separate regressions by gender. Robust standard errors are in parenthesis. All regression include interactions of Year and Quarters fixed effects. Age controls are age and age squared.
* denotes significance at 5%, ** denotes significance at 1%, *** denotes significance at 0.1%
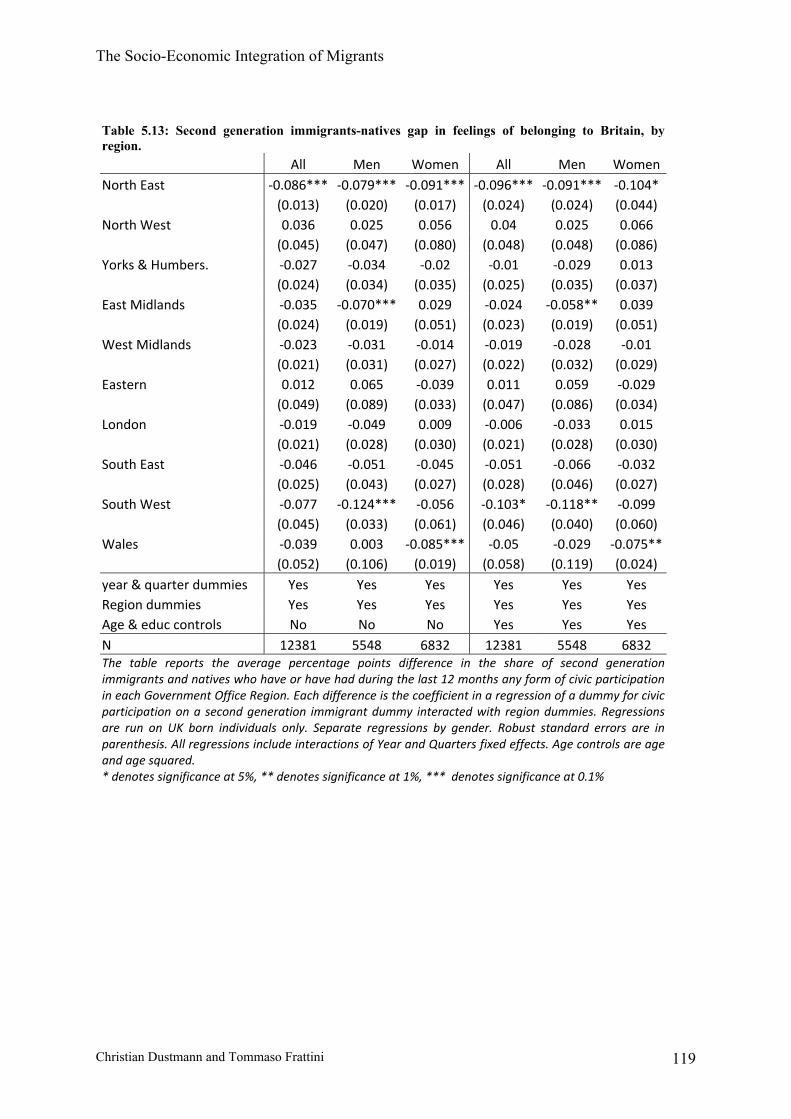
The Socio-Economic Integration of Migrants
Christian Dustmann and Tommaso Frattini 119
Table 5.13: Second generation immigrants-natives gap in feelings of belonging to Britain, by region. All Men Women All Men WomenNorth East ‐0.086*** ‐0.079*** ‐0.091*** ‐0.096*** ‐0.091*** ‐0.104* (0.013) (0.020) (0.017) (0.024) (0.024) (0.044) North West 0.036 0.025 0.056 0.04 0.025 0.066 (0.045) (0.047) (0.080) (0.048) (0.048) (0.086) Yorks & Humbers. ‐0.027 ‐0.034 ‐0.02 ‐0.01 ‐0.029 0.013 (0.024) (0.034) (0.035) (0.025) (0.035) (0.037) East Midlands ‐0.035 ‐0.070*** 0.029 ‐0.024 ‐0.058** 0.039 (0.024) (0.019) (0.051) (0.023) (0.019) (0.051) West Midlands ‐0.023 ‐0.031 ‐0.014 ‐0.019 ‐0.028 ‐0.01 (0.021) (0.031) (0.027) (0.022) (0.032) (0.029) Eastern 0.012 0.065 ‐0.039 0.011 0.059 ‐0.029 (0.049) (0.089) (0.033) (0.047) (0.086) (0.034) London ‐0.019 ‐0.049 0.009 ‐0.006 ‐0.033 0.015 (0.021) (0.028) (0.030) (0.021) (0.028) (0.030) South East ‐0.046 ‐0.051 ‐0.045 ‐0.051 ‐0.066 ‐0.032 (0.025) (0.043) (0.027) (0.028) (0.046) (0.027) South West ‐0.077 ‐0.124*** ‐0.056 ‐0.103* ‐0.118** ‐0.099 (0.045) (0.033) (0.061) (0.046) (0.040) (0.060) Wales ‐0.039 0.003 ‐0.085*** ‐0.05 ‐0.029 ‐0.075** (0.052) (0.106) (0.019) (0.058) (0.119) (0.024) year & quarter dummies Yes Yes Yes Yes Yes Yes Region dummies Yes Yes Yes Yes Yes Yes Age & educ controls No No No Yes Yes Yes N 12381 5548 6832 12381 5548 6832 The table reports the average percentage points difference in the share of second generation immigrants and natives who have or have had during the last 12 months any form of civic participation in each Government Office Region. Each difference is the coefficient in a regression of a dummy for civic participation on a second generation immigrant dummy interacted with region dummies. Regressions are run on UK born individuals only. Separate regressions by gender. Robust standard errors are in parenthesis. All regressions include interactions of Year and Quarters fixed effects. Age controls are age and age squared. * denotes significance at 5%, ** denotes significance at 1%, *** denotes significance at 0.1%
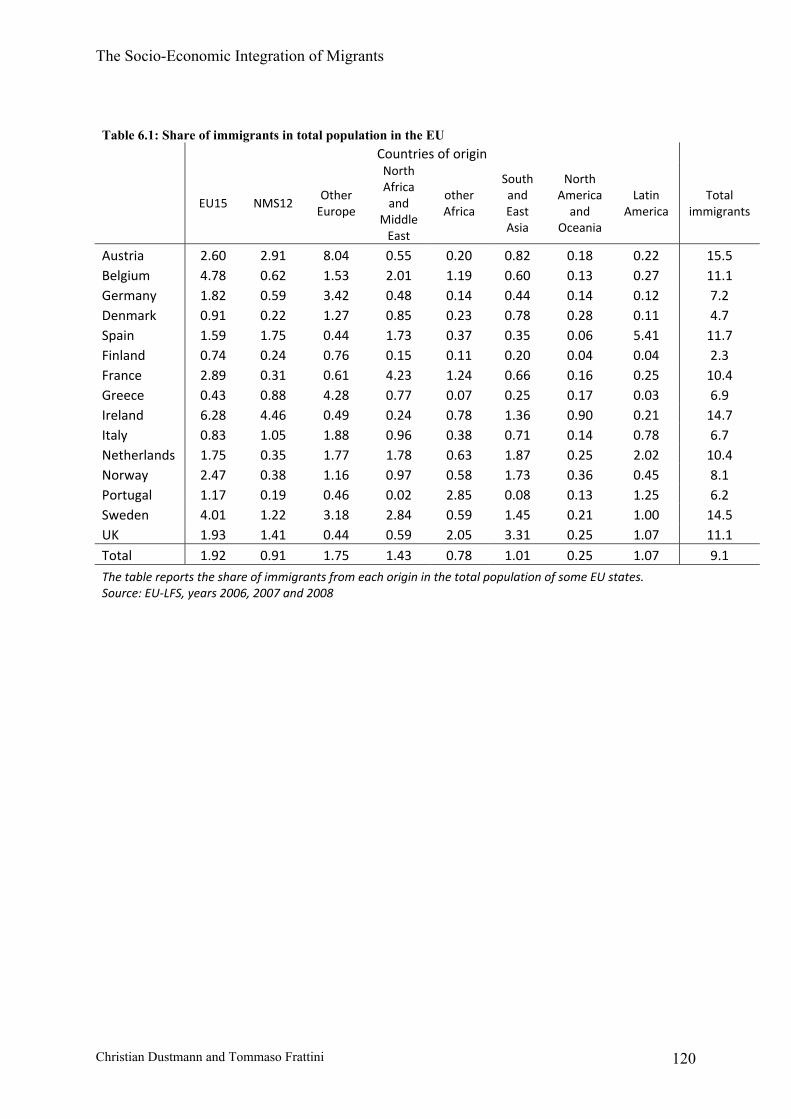
The Socio-Economic Integration of Migrants
Christian Dustmann and Tommaso Frattini 120
Table 6.1: Share of immigrants in total population in the EU Countries of origin
EU15 NMS12 Other
Europe
North Africa and
Middle East
other Africa
South and East Asia
North America
and Oceania
Latin America
Total immigrants
Austria 2.60 2.91 8.04 0.55 0.20 0.82 0.18 0.22 15.5 Belgium 4.78 0.62 1.53 2.01 1.19 0.60 0.13 0.27 11.1 Germany 1.82 0.59 3.42 0.48 0.14 0.44 0.14 0.12 7.2 Denmark 0.91 0.22 1.27 0.85 0.23 0.78 0.28 0.11 4.7 Spain 1.59 1.75 0.44 1.73 0.37 0.35 0.06 5.41 11.7 Finland 0.74 0.24 0.76 0.15 0.11 0.20 0.04 0.04 2.3 France 2.89 0.31 0.61 4.23 1.24 0.66 0.16 0.25 10.4 Greece 0.43 0.88 4.28 0.77 0.07 0.25 0.17 0.03 6.9 Ireland 6.28 4.46 0.49 0.24 0.78 1.36 0.90 0.21 14.7 Italy 0.83 1.05 1.88 0.96 0.38 0.71 0.14 0.78 6.7 Netherlands 1.75 0.35 1.77 1.78 0.63 1.87 0.25 2.02 10.4 Norway 2.47 0.38 1.16 0.97 0.58 1.73 0.36 0.45 8.1 Portugal 1.17 0.19 0.46 0.02 2.85 0.08 0.13 1.25 6.2 Sweden 4.01 1.22 3.18 2.84 0.59 1.45 0.21 1.00 14.5 UK 1.93 1.41 0.44 0.59 2.05 3.31 0.25 1.07 11.1 Total 1.92 0.91 1.75 1.43 0.78 1.01 0.25 1.07 9.1
The table reports the share of immigrants from each origin in the total population of some EU states. Source: EU‐LFS, years 2006, 2007 and 2008

The Socio-Economic Integration of Migrants
Christian Dustmann and Tommaso Frattini 121
Table 6.2: Immigrant-native employment rate differentials (1) (2) (3) All Men Women All Men Women All Men Women Austria ‐0.083*** ‐0.049*** ‐0.107*** ‐0.111*** ‐0.071*** ‐0.141*** ‐0.087*** ‐0.052*** ‐0.121*** (0.000) (0.000) (0.000) (0.000) (0.000) (0.000) (0.000) (0.000) (0.000) Belgium ‐0.119*** ‐0.076*** ‐0.156*** ‐0.145*** ‐0.101*** ‐0.185*** ‐0.119*** ‐0.084*** ‐0.146*** (0.000) (0.000) (0.000) (0.000) (0.000) (0.000) (0.000) (0.000) (0.000) Germany ‐0.097*** ‐0.058*** ‐0.131*** ‐0.122*** ‐0.088*** ‐0.153*** ‐0.083*** ‐0.055*** ‐0.114*** (0.000) (0.000) (0.000) (0.000) (0.000) (0.000) (0.000) (0.000) (0.000) Denmark ‐0.127*** ‐0.107*** ‐0.141*** ‐0.159*** ‐0.129*** ‐0.181*** ‐0.148*** ‐0.124*** ‐0.165*** (0.000) (0.000) (0.000) (0.000) (0.000) (0.000) (0.000) (0.000) (0.000) Spain 0.036*** 0.027*** 0.054*** ‐0.020*** ‐0.012*** ‐0.021*** ‐0.010*** ‐0.008*** ‐0.003***
(0.000) (0.000) (0.000) (0.000) (0.000) (0.000) (0.000) (0.000) (0.000) Finland ‐0.075*** ‐0.022*** ‐0.125*** ‐0.117*** ‐0.064*** ‐0.165*** ‐0.098*** ‐0.050*** ‐0.138*** (0.000) (0.000) (0.000) (0.000) (0.000) (0.000) (0.000) (0.000) (0.000) France ‐0.067*** ‐0.020*** ‐0.109*** ‐0.114*** ‐0.059*** ‐0.163*** ‐0.093*** ‐0.043*** ‐0.136*** (0.000) (0.000) (0.000) (0.000) (0.000) (0.000) (0.000) (0.000) (0.000) Greece 0.059*** 0.103*** 0.019*** 0.015*** 0.074*** ‐0.035*** 0.029*** 0.075*** ‐0.015*** (0.000) (0.000) (0.000) (0.000) (0.000) (0.000) (0.000) (0.000) (0.000) Ireland 0.033*** 0.039*** 0.024*** ‐0.024*** ‐0.017*** ‐0.038*** ‐0.046*** ‐0.038*** ‐0.061*** (0.000) (0.000) (0.000) (0.000) (0.000) (0.000) (0.000) (0.000) (0.000) Italy 0.073*** 0.121*** 0.043*** ‐0.024*** 0.035*** ‐0.063*** ‐0.014*** 0.041*** ‐0.048*** (0.000) (0.000) (0.000) (0.000) (0.000) (0.000) (0.000) (0.000) (0.000) Netherlands ‐0.145*** ‐0.117*** ‐0.165*** ‐0.184*** ‐0.149*** ‐0.211*** ‐0.168*** ‐0.140*** ‐0.189*** (0.000) (0.000) (0.000) (0.000) (0.000) (0.000) (0.000) (0.000) (0.000) Norway ‐0.070*** ‐0.055*** ‐0.081*** ‐0.103*** ‐0.083*** ‐0.121*** ‐0.088*** ‐0.072*** ‐0.100*** (0.000) (0.000) (0.000) (0.000) (0.000) (0.000) (0.000) (0.000) (0.000) Portugal 0.055*** 0.055*** 0.059*** ‐0.005*** 0.009*** ‐0.015*** ‐0.006*** 0.013*** ‐0.021*** (0.000) (0.000) (0.000) (0.000) (0.000) (0.000) (0.000) (0.000) (0.000) Sweden ‐0.134*** ‐0.106*** ‐0.156*** ‐0.175*** ‐0.142*** ‐0.201*** ‐0.162*** ‐0.136*** ‐0.176*** (0.000) (0.000) (0.000) (0.000) (0.000) (0.000) (0.000) (0.000) (0.000) UK ‐0.065*** ‐0.007*** ‐0.120*** ‐0.087*** ‐0.044*** ‐0.128*** ‐0.089*** ‐0.047*** ‐0.128*** (0.000) (0.000) (0.000) (0.000) (0.000) (0.000) (0.000) (0.000) (0.000) Time and region No Yes Yes Age No Yes Yes Education No No Yes Observations 4563672 2238709 2324963 4563672 2238709 2324963 4563672 2238709 2324963 The table reports the differences in employment rate between immigrants and natives in each EU country. Standard errors in parentheses. * denotes significance at 5%, ** denotes significance at 1%, *** denotes significance at 0.1%
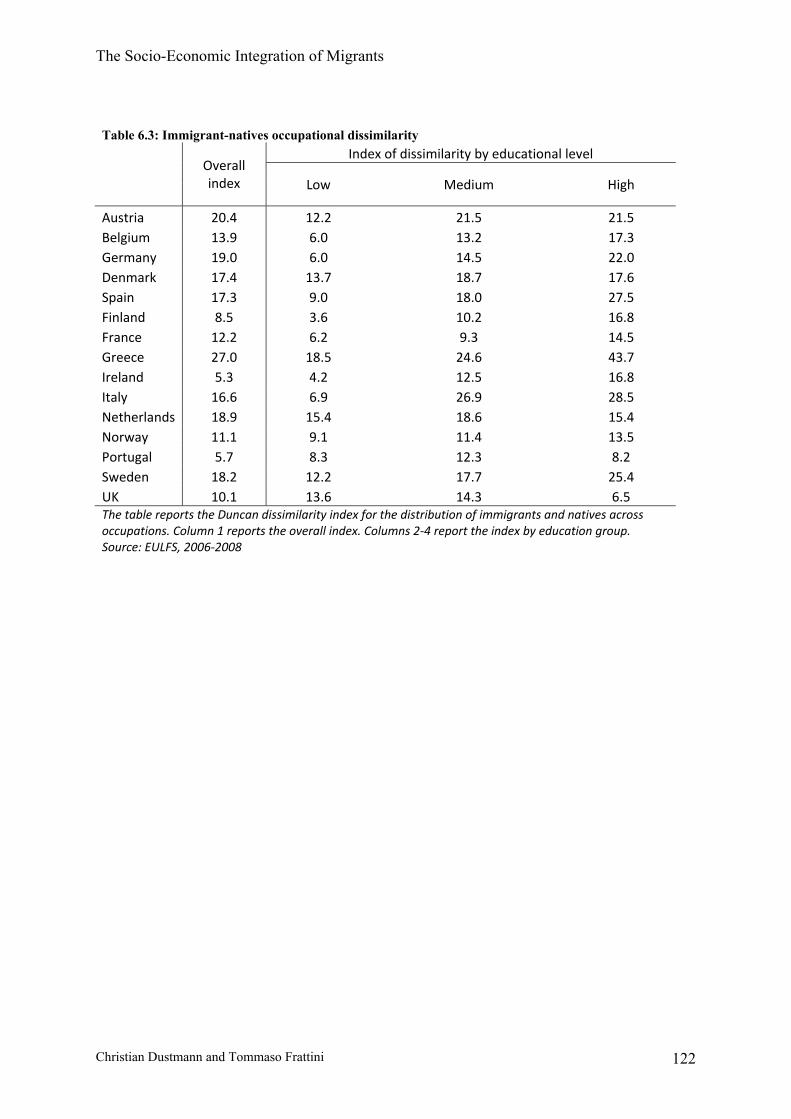
The Socio-Economic Integration of Migrants
Christian Dustmann and Tommaso Frattini 122
Table 6.3: Immigrant-natives occupational dissimilarity
Overall index
Index of dissimilarity by educational level
Low Medium High
Austria 20.4 12.2 21.5 21.5 Belgium 13.9 6.0 13.2 17.3 Germany 19.0 6.0 14.5 22.0 Denmark 17.4 13.7 18.7 17.6 Spain 17.3 9.0 18.0 27.5 Finland 8.5 3.6 10.2 16.8 France 12.2 6.2 9.3 14.5 Greece 27.0 18.5 24.6 43.7 Ireland 5.3 4.2 12.5 16.8 Italy 16.6 6.9 26.9 28.5 Netherlands 18.9 15.4 18.6 15.4 Norway 11.1 9.1 11.4 13.5 Portugal 5.7 8.3 12.3 8.2 Sweden 18.2 12.2 17.7 25.4 UK 10.1 13.6 14.3 6.5 The table reports the Duncan dissimilarity index for the distribution of immigrants and natives across occupations. Column 1 reports the overall index. Columns 2‐4 report the index by education group. Source: EULFS, 2006‐2008
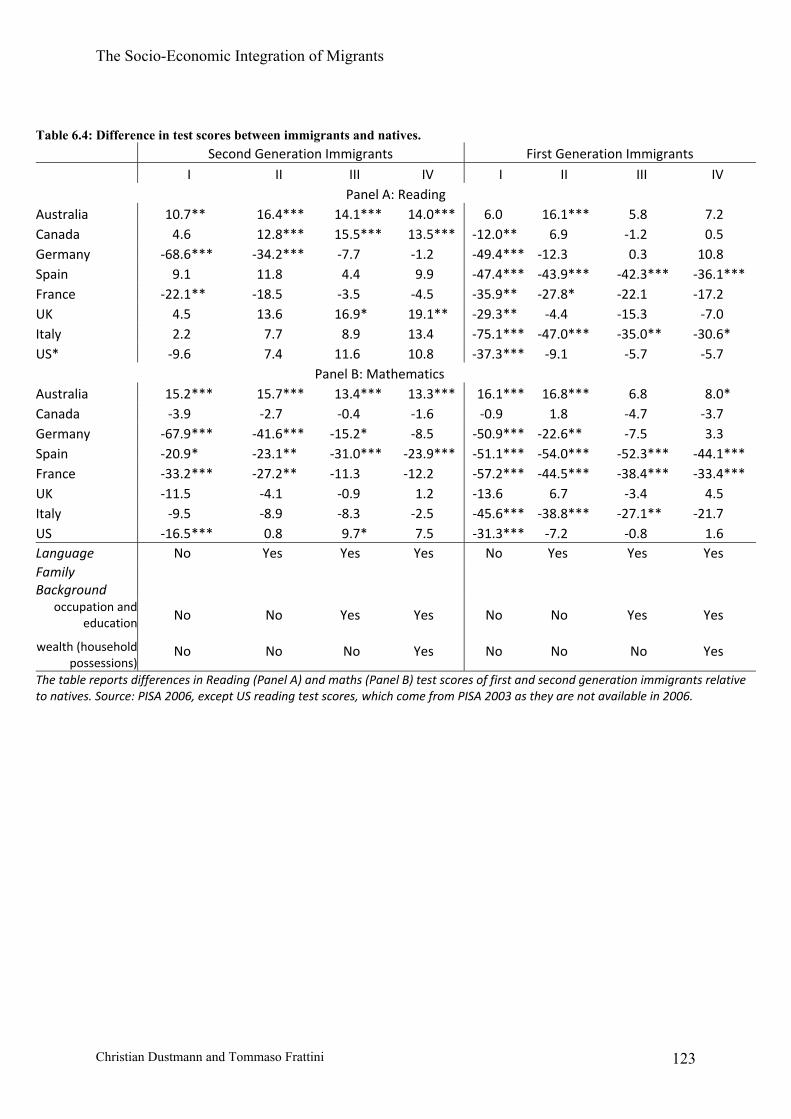
The Socio-Economic Integration of Migrants
Christian Dustmann and Tommaso Frattini 123
Table 6.4: Difference in test scores between immigrants and natives. Second Generation Immigrants First Generation Immigrants I II III IV I II III IV
Panel A: Reading Australia 10.7** 16.4 *** 14.1*** 14.0*** 6.0 16.1*** 5.8 7.2 Canada 4.6 12.8 *** 15.5*** 13.5*** ‐12.0** 6.9 ‐1.2 0.5 Germany ‐68.6*** ‐34.2 *** ‐7.7 ‐1.2 ‐49.4*** ‐12.3 0.3 10.8 Spain 9.1 11.8 4.4 9.9 ‐47.4*** ‐43.9*** ‐42.3*** ‐36.1*** France ‐22.1** ‐18.5 ‐3.5 ‐4.5 ‐35.9** ‐27.8* ‐22.1 ‐17.2 UK 4.5 13.6 16.9* 19.1** ‐29.3** ‐4.4 ‐15.3 ‐7.0 Italy 2.2 7.7 8.9 13.4 ‐75.1*** ‐47.0*** ‐35.0** ‐30.6* US* ‐9.6 7.4 11.6 10.8 ‐37.3*** ‐9.1 ‐5.7 ‐5.7
Panel B: Mathematics Australia 15.2*** 15.7 *** 13.4*** 13.3*** 16.1*** 16.8*** 6.8 8.0* Canada ‐3.9 ‐2.7 ‐0.4 ‐1.6 ‐0.9 1.8 ‐4.7 ‐3.7 Germany ‐67.9*** ‐41.6 *** ‐15.2* ‐8.5 ‐50.9*** ‐22.6** ‐7.5 3.3 Spain ‐20.9* ‐23.1 ** ‐31.0*** ‐23.9*** ‐51.1*** ‐54.0*** ‐52.3*** ‐44.1*** France ‐33.2*** ‐27.2 ** ‐11.3 ‐12.2 ‐57.2*** ‐44.5*** ‐38.4*** ‐33.4*** UK ‐11.5 ‐4.1 ‐0.9 1.2 ‐13.6 6.7 ‐3.4 4.5 Italy ‐9.5 ‐8.9 ‐8.3 ‐2.5 ‐45.6*** ‐38.8*** ‐27.1** ‐21.7 US ‐16.5*** 0.8 9.7* 7.5 ‐31.3*** ‐7.2 ‐0.8 1.6 Language No Yes Yes Yes No Yes Yes Yes Family Background
occupation and education
No No Yes Yes No No Yes Yes
wealth (household possessions)
No No No Yes No No No Yes
The table reports differences in Reading (Panel A) and maths (Panel B) test scores of first and second generation immigrants relative to natives. Source: PISA 2006, except US reading test scores, which come from PISA 2003 as they are not available in 2006.

The Socio-Economic Integration of Migrants
Christian Dustmann and Tommaso Frattini 124
Tables Appendix
Table A1: Immigrants-natives education gap, by entry cohort & country of origin 1993‐94 1993‐94 2000‐01 2000‐01 2009‐10 2009‐10
Cohort 1980‐1983 Western Europe 1.685*** 1.424*** 1.004*** 0.807*** 0.842*** 0.615*** (0.145) (0.146) (0.131) (0.132) (0.131) (0.131)
Cohort 1980‐1983 Eastern Europe 4.068*** 3.924*** 4.191*** 4.299*** 3.470*** 3.344*** (0.380) (0.367) (0.596) (0.587) (0.475) (0.487)
Cohort 1980‐1983 Americas 3.444*** 3.291*** 2.947*** 2.950*** 2.167*** 1.993*** (0.234) (0.232) (0.237) (0.246) (0.247) (0.237)
Cohort 1980‐1983 Africa 2.412*** 2.159*** 2.374*** 2.201*** 2.299*** 2.113*** (0.167) (0.163) (0.162) (0.162) (0.165) (0.164)
Cohort 1980‐1983 Indian Sub‐Continent ‐0.086 ‐0.355** ‐0.189 ‐0.361* ‐0.231 ‐0.429** (0.133) (0.132) (0.142) (0.142) (0.163) (0.161)
Cohort 1980‐1983 Middle East 4.940*** 4.899*** 4.205*** 4.185*** 3.027*** 2.726*** (0.378) (0.379) (0.358) (0.351) (0.349) (0.344)
Cohort 1980‐1983 Rest of Asia 1.020*** 0.794** 1.075*** 1.017*** 2.022*** 1.802*** (0.268) (0.261) (0.261) (0.259) (0.249) (0.245)
Cohort 1980‐1983 Oceania 1.384*** 1.099*** 2.049*** 1.808*** 2.252*** 2.043*** (0.240) (0.240) (0.307) (0.319) (0.435) (0.445)
Cohort 1984‐1987 Western Europe 1.873*** 1.526*** 1.054*** 0.825*** 1.220*** 0.966*** (0.113) (0.113) (0.130) (0.129) (0.117) (0.119)
Cohort 1984‐1987 Eastern Europe 5.054*** 4.853*** 1.478** 1.535** 2.946*** 3.045*** (0.349) (0.340) (0.486) (0.478) (0.516) (0.509)
Cohort 1984‐1987 Americas 3.715*** 3.484*** 2.887*** 2.839*** 2.287*** 2.113*** (0.178) (0.177) (0.213) (0.217) (0.216) (0.222)
Cohort 1984‐1987 Africa 2.538*** 2.260*** 2.384*** 2.208*** 2.239*** 2.023*** (0.131) (0.130) (0.126) (0.126) (0.131) (0.130)
Cohort 1984‐1987 Indian Sub‐Continent ‐0.254 ‐0.543*** ‐0.224 ‐0.444** 0.085 ‐0.156 (0.141) (0.140) (0.137) (0.136) (0.150) (0.149)
Cohort 1984‐1987 Middle East 3.900*** 3.575*** 3.647*** 3.436*** 2.647*** 2.488*** (0.378) (0.376) (0.295) (0.301) (0.591) (0.582)
Cohort 1984‐1987 Rest of Asia 3.345*** 3.080*** 2.595*** 2.441*** 2.678*** 2.570*** (0.180) (0.181) (0.181) (0.180) (0.225) (0.220)
Cohort 1984‐1987 Oceania 2.541*** 2.251*** 2.291*** 2.007*** 3.086*** 2.936*** (0.225) (0.223) (0.356) (0.357) (0.342) (0.364)
Continues on next page

The Socio-Economic Integration of Migrants
Christian Dustmann and Tommaso Frattini 125
Continues from previous page 1993‐94 1993‐94 2000‐01 2000‐01 2009‐10 2009‐10
Cohort 1988‐1991 Western Europe 2.183*** 1.833*** 1.658*** 1.382*** 1.326*** 1.029***
(0.102) (0.102) (0.117) (0.118) (0.123) (0.123) Cohort 1988‐1991 Eastern Europe 4.977*** 4.766*** 5.392*** 5.251*** 4.538*** 4.488***
(0.221) (0.221) (0.417) (0.407) (0.402) (0.374) Cohort 1988‐1991 Americas 3.263*** 2.981*** 3.117*** 2.969*** 2.230*** 2.000***
(0.132) (0.131) (0.180) (0.183) (0.203) (0.204) Cohort 1988‐1991 Africa 2.721*** 2.386*** 2.643*** 2.381*** 2.386*** 2.125***
(0.120) (0.119) (0.130) (0.130) (0.151) (0.152) Cohort 1988‐1991 Indian Sub‐Continent 0.422** 0.163 0.255 ‐0.035 ‐0.675*** ‐0.984***
(0.148) (0.145) (0.140) (0.139) (0.149) (0.147) Cohort 1988‐1991 Middle East 5.047*** 4.745*** 3.258*** 3.097*** 1.137* 1.066*
(0.273) (0.277) (0.405) (0.409) (0.465) (0.479) Cohort 1988‐1991 Rest of Asia 3.598*** 3.322*** 2.797*** 2.590*** 2.201*** 1.982***
(0.146) (0.147) (0.173) (0.170) (0.204) (0.205) Cohort 1988‐1991 Oceania 2.923*** 2.558*** 1.782*** 1.561*** 2.060*** 1.758***
(0.180) (0.182) (0.194) (0.198) (0.272) (0.270) Cohort 1992‐1995 Western Europe 2.302*** 1.971*** 2.698*** 2.325***
(0.120) (0.120) (0.135) (0.134) Cohort 1992‐1995 Eastern Europe 3.126*** 2.817*** 4.235*** 3.897***
(0.243) (0.245) (0.272) (0.274) Cohort 1992‐1995 Americas 3.435*** 3.232*** 1.945*** 1.707***
(0.167) (0.169) (0.238) (0.237) Cohort 1992‐1995 Africa 2.492*** 2.162*** 2.198*** 1.896***
(0.134) (0.134) (0.170) (0.170) Cohort 1992‐1995 Indian Sub‐Continent 1.261*** 0.919*** 0.223 ‐0.143
(0.162) (0.162) (0.171) (0.171) Cohort 1992‐1995 Middle East 2.435*** 2.286*** 2.315*** 2.010***
(0.441) (0.441) (0.350) (0.348) Cohort 1992‐1995 Rest of Asia 2.004*** 1.851*** 2.229*** 2.008***
(0.190) (0.188) (0.197) (0.195) Cohort 1992‐1995 Oceania 2.464*** 2.217*** 2.338*** 1.919***
(0.230) (0.235) (0.280) (0.278) Continues on next page
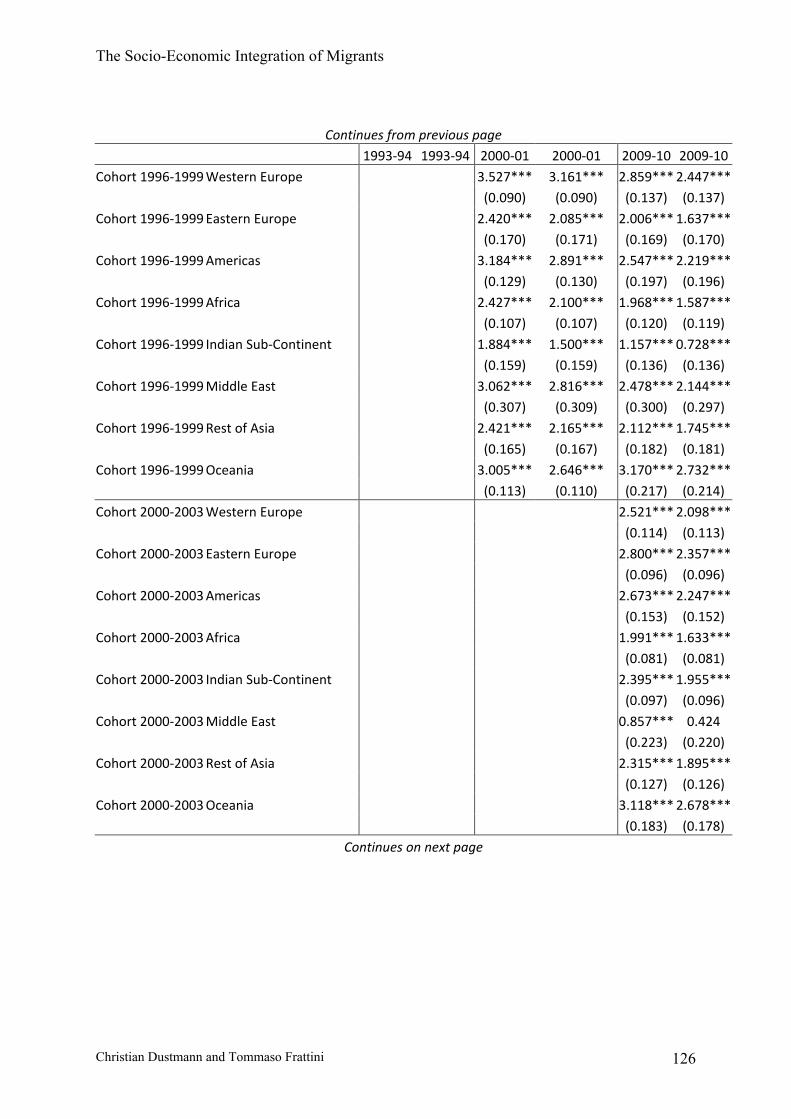
The Socio-Economic Integration of Migrants
Christian Dustmann and Tommaso Frattini 126
Continues from previous page 1993‐94 1993‐94 2000‐01 2000‐01 2009‐10 2009‐10
Cohort 1996‐1999 Western Europe 3.527*** 3.161*** 2.859*** 2.447*** (0.090) (0.090) (0.137) (0.137)
Cohort 1996‐1999 Eastern Europe 2.420*** 2.085*** 2.006*** 1.637*** (0.170) (0.171) (0.169) (0.170)
Cohort 1996‐1999 Americas 3.184*** 2.891*** 2.547*** 2.219*** (0.129) (0.130) (0.197) (0.196)
Cohort 1996‐1999 Africa 2.427*** 2.100*** 1.968*** 1.587*** (0.107) (0.107) (0.120) (0.119)
Cohort 1996‐1999 Indian Sub‐Continent 1.884*** 1.500*** 1.157*** 0.728*** (0.159) (0.159) (0.136) (0.136)
Cohort 1996‐1999 Middle East 3.062*** 2.816*** 2.478*** 2.144*** (0.307) (0.309) (0.300) (0.297)
Cohort 1996‐1999 Rest of Asia 2.421*** 2.165*** 2.112*** 1.745*** (0.165) (0.167) (0.182) (0.181)
Cohort 1996‐1999 Oceania 3.005*** 2.646*** 3.170*** 2.732*** (0.113) (0.110) (0.217) (0.214)
Cohort 2000‐2003 Western Europe 2.521*** 2.098*** (0.114) (0.113)
Cohort 2000‐2003 Eastern Europe 2.800*** 2.357*** (0.096) (0.096)
Cohort 2000‐2003 Americas 2.673*** 2.247*** (0.153) (0.152)
Cohort 2000‐2003 Africa 1.991*** 1.633*** (0.081) (0.081)
Cohort 2000‐2003 Indian Sub‐Continent 2.395*** 1.955*** (0.097) (0.096)
Cohort 2000‐2003 Middle East 0.857*** 0.424 (0.223) (0.220)
Cohort 2000‐2003 Rest of Asia 2.315*** 1.895*** (0.127) (0.126)
Cohort 2000‐2003 Oceania 3.118*** 2.678*** (0.183) (0.178)
Continues on next page

The Socio-Economic Integration of Migrants
Christian Dustmann and Tommaso Frattini 127
Continues from previous page 1993‐94 1993‐94 2000‐01 2000‐01 2009‐10 2009‐10
Cohort 2004‐2007 Western Europe 3.859*** 3.436*** (0.105) (0.103)
Cohort 2004‐2007 Eastern Europe 2.613*** 2.179*** (0.041) (0.041)
Cohort 2004‐2007 Americas 3.511*** 3.106*** (0.123) (0.122)
Cohort 2004‐2007 Africa 2.090*** 1.727*** (0.103) (0.101)
Cohort 2004‐2007 Indian Sub‐Continent 3.017*** 2.582*** (0.089) (0.088)
Cohort 2004‐2007 Middle East 2.188*** 1.745*** (0.354) (0.352)
Cohort 2004‐2007 Rest of Asia 2.513*** 2.102*** (0.118) (0.117)
Cohort 2004‐2007 Oceania 2.986*** 2.557*** (0.139) (0.137)
Year & Quarter dummies Yes Yes Yes Yes Yes Yes Age controls No Yes No Yes No Yes
Gender No Yes No Yes No Yes N 656462 656462 575922 575922 531408 531408The table reports the average difference (in years) in the age at which individuals left full time education between immigrants from different entry cohorts and countries of origin and natives. Each difference is the coefficient in a regression of years of education on immigrant cohorts dummies interacted with country of origin dummies. Robust standard errors are in parenthesis. All regression include interactions of Year and Quarters fixed effects. Age controls are age and age squared. * denotes significance at 5%, ** denotes significance at 1%, *** denotes significance at 0.1%
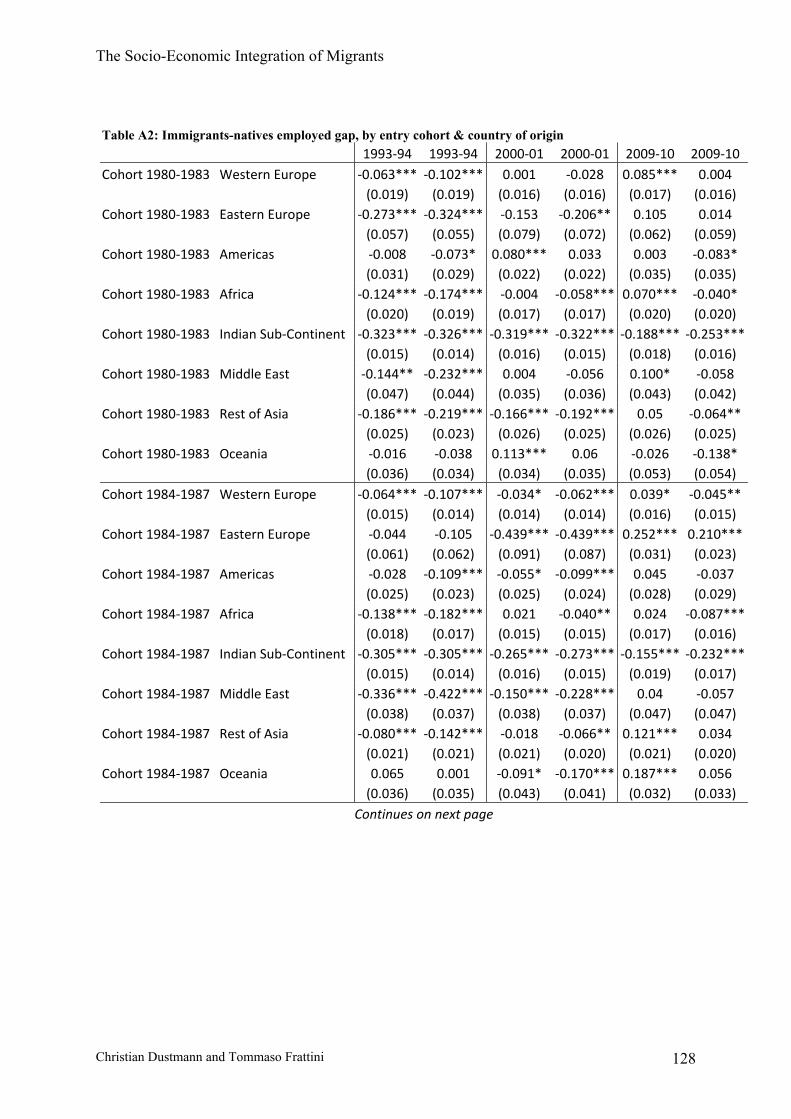
The Socio-Economic Integration of Migrants
Christian Dustmann and Tommaso Frattini 128
Table A2: Immigrants-natives employed gap, by entry cohort & country of origin 1993‐94 1993‐94 2000‐01 2000‐01 2009‐10 2009‐10 Cohort 1980‐1983 Western Europe ‐0.063*** ‐0.102*** 0.001 ‐0.028 0.085*** 0.004 (0.019) (0.019) (0.016) (0.016) (0.017) (0.016) Cohort 1980‐1983 Eastern Europe ‐0.273*** ‐0.324*** ‐0.153 ‐0.206** 0.105 0.014 (0.057) (0.055) (0.079) (0.072) (0.062) (0.059) Cohort 1980‐1983 Americas ‐0.008 ‐0.073* 0.080*** 0.033 0.003 ‐0.083* (0.031) (0.029) (0.022) (0.022) (0.035) (0.035) Cohort 1980‐1983 Africa ‐0.124*** ‐0.174*** ‐0.004 ‐0.058*** 0.070*** ‐0.040* (0.020) (0.019) (0.017) (0.017) (0.020) (0.020) Cohort 1980‐1983 Indian Sub‐Continent ‐0.323*** ‐0.326*** ‐0.319*** ‐0.322*** ‐0.188*** ‐0.253*** (0.015) (0.014) (0.016) (0.015) (0.018) (0.016) Cohort 1980‐1983 Middle East ‐0.144** ‐0.232*** 0.004 ‐0.056 0.100* ‐0.058 (0.047) (0.044) (0.035) (0.036) (0.043) (0.042) Cohort 1980‐1983 Rest of Asia ‐0.186*** ‐0.219*** ‐0.166*** ‐0.192*** 0.05 ‐0.064** (0.025) (0.023) (0.026) (0.025) (0.026) (0.025) Cohort 1980‐1983 Oceania ‐0.016 ‐0.038 0.113*** 0.06 ‐0.026 ‐0.138* (0.036) (0.034) (0.034) (0.035) (0.053) (0.054) Cohort 1984‐1987 Western Europe ‐0.064*** ‐0.107*** ‐0.034* ‐0.062*** 0.039* ‐0.045** (0.015) (0.014) (0.014) (0.014) (0.016) (0.015) Cohort 1984‐1987 Eastern Europe ‐0.044 ‐0.105 ‐0.439*** ‐0.439*** 0.252*** 0.210*** (0.061) (0.062) (0.091) (0.087) (0.031) (0.023) Cohort 1984‐1987 Americas ‐0.028 ‐0.109*** ‐0.055* ‐0.099*** 0.045 ‐0.037 (0.025) (0.023) (0.025) (0.024) (0.028) (0.029) Cohort 1984‐1987 Africa ‐0.138*** ‐0.182*** 0.021 ‐0.040** 0.024 ‐0.087*** (0.018) (0.017) (0.015) (0.015) (0.017) (0.016) Cohort 1984‐1987 Indian Sub‐Continent ‐0.305*** ‐0.305*** ‐0.265*** ‐0.273*** ‐0.155*** ‐0.232*** (0.015) (0.014) (0.016) (0.015) (0.019) (0.017) Cohort 1984‐1987 Middle East ‐0.336*** ‐0.422*** ‐0.150*** ‐0.228*** 0.04 ‐0.057 (0.038) (0.037) (0.038) (0.037) (0.047) (0.047) Cohort 1984‐1987 Rest of Asia ‐0.080*** ‐0.142*** ‐0.018 ‐0.066** 0.121*** 0.034 (0.021) (0.021) (0.021) (0.020) (0.021) (0.020) Cohort 1984‐1987 Oceania 0.065 0.001 ‐0.091* ‐0.170*** 0.187*** 0.056 (0.036) (0.035) (0.043) (0.041) (0.032) (0.033)
Continues on next page
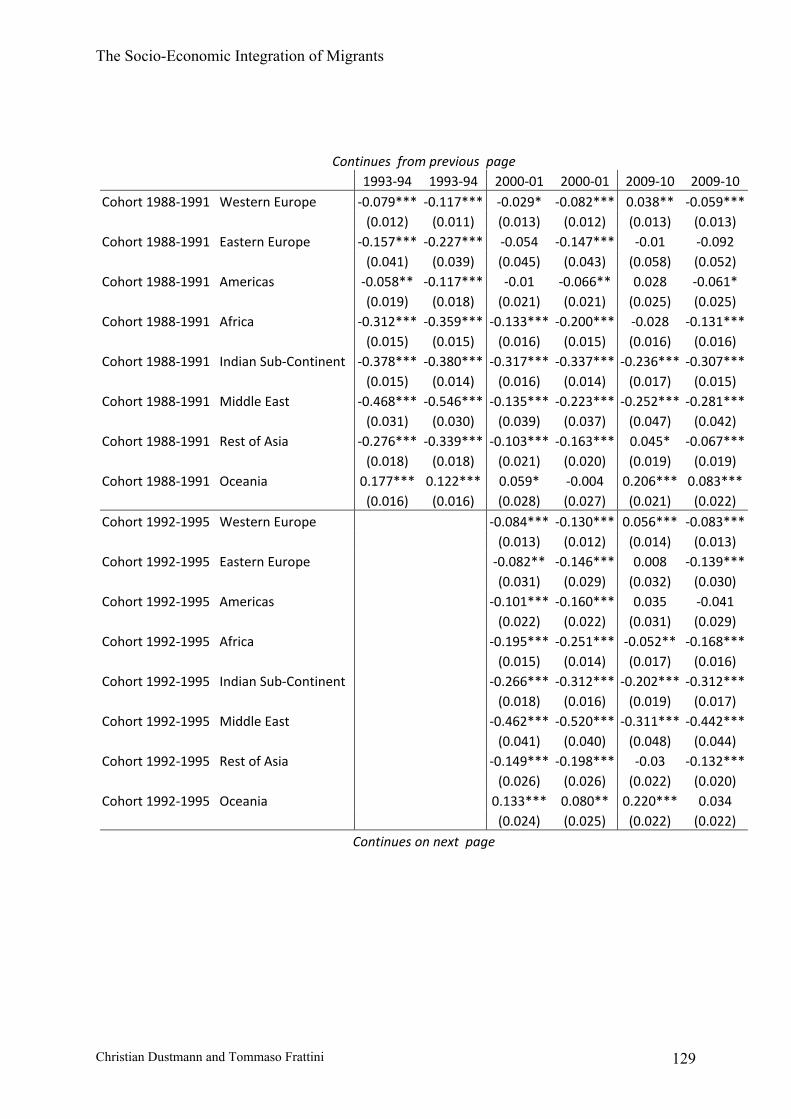
The Socio-Economic Integration of Migrants
Christian Dustmann and Tommaso Frattini 129
Continues from previous page 1993‐94 1993‐94 2000‐01 2000‐01 2009‐10 2009‐10 Cohort 1988‐1991 Western Europe ‐0.079*** ‐0.117*** ‐0.029* ‐0.082*** 0.038** ‐0.059*** (0.012) (0.011) (0.013) (0.012) (0.013) (0.013) Cohort 1988‐1991 Eastern Europe ‐0.157*** ‐0.227*** ‐0.054 ‐0.147*** ‐0.01 ‐0.092 (0.041) (0.039) (0.045) (0.043) (0.058) (0.052) Cohort 1988‐1991 Americas ‐0.058** ‐0.117*** ‐0.01 ‐0.066** 0.028 ‐0.061* (0.019) (0.018) (0.021) (0.021) (0.025) (0.025) Cohort 1988‐1991 Africa ‐0.312*** ‐0.359*** ‐0.133*** ‐0.200*** ‐0.028 ‐0.131*** (0.015) (0.015) (0.016) (0.015) (0.016) (0.016) Cohort 1988‐1991 Indian Sub‐Continent ‐0.378*** ‐0.380*** ‐0.317*** ‐0.337*** ‐0.236*** ‐0.307*** (0.015) (0.014) (0.016) (0.014) (0.017) (0.015) Cohort 1988‐1991 Middle East ‐0.468*** ‐0.546*** ‐0.135*** ‐0.223*** ‐0.252*** ‐0.281*** (0.031) (0.030) (0.039) (0.037) (0.047) (0.042) Cohort 1988‐1991 Rest of Asia ‐0.276*** ‐0.339*** ‐0.103*** ‐0.163*** 0.045* ‐0.067*** (0.018) (0.018) (0.021) (0.020) (0.019) (0.019) Cohort 1988‐1991 Oceania 0.177*** 0.122*** 0.059* ‐0.004 0.206*** 0.083*** (0.016) (0.016) (0.028) (0.027) (0.021) (0.022) Cohort 1992‐1995 Western Europe ‐0.084*** ‐0.130*** 0.056*** ‐0.083*** (0.013) (0.012) (0.014) (0.013) Cohort 1992‐1995 Eastern Europe ‐0.082** ‐0.146*** 0.008 ‐0.139*** (0.031) (0.029) (0.032) (0.030) Cohort 1992‐1995 Americas ‐0.101*** ‐0.160*** 0.035 ‐0.041 (0.022) (0.022) (0.031) (0.029) Cohort 1992‐1995 Africa ‐0.195*** ‐0.251*** ‐0.052** ‐0.168*** (0.015) (0.014) (0.017) (0.016) Cohort 1992‐1995 Indian Sub‐Continent ‐0.266*** ‐0.312*** ‐0.202*** ‐0.312*** (0.018) (0.016) (0.019) (0.017) Cohort 1992‐1995 Middle East ‐0.462*** ‐0.520*** ‐0.311*** ‐0.442*** (0.041) (0.040) (0.048) (0.044) Cohort 1992‐1995 Rest of Asia ‐0.149*** ‐0.198*** ‐0.03 ‐0.132*** (0.026) (0.026) (0.022) (0.020) Cohort 1992‐1995 Oceania 0.133*** 0.080** 0.220*** 0.034 (0.024) (0.025) (0.022) (0.022)
Continues on next page
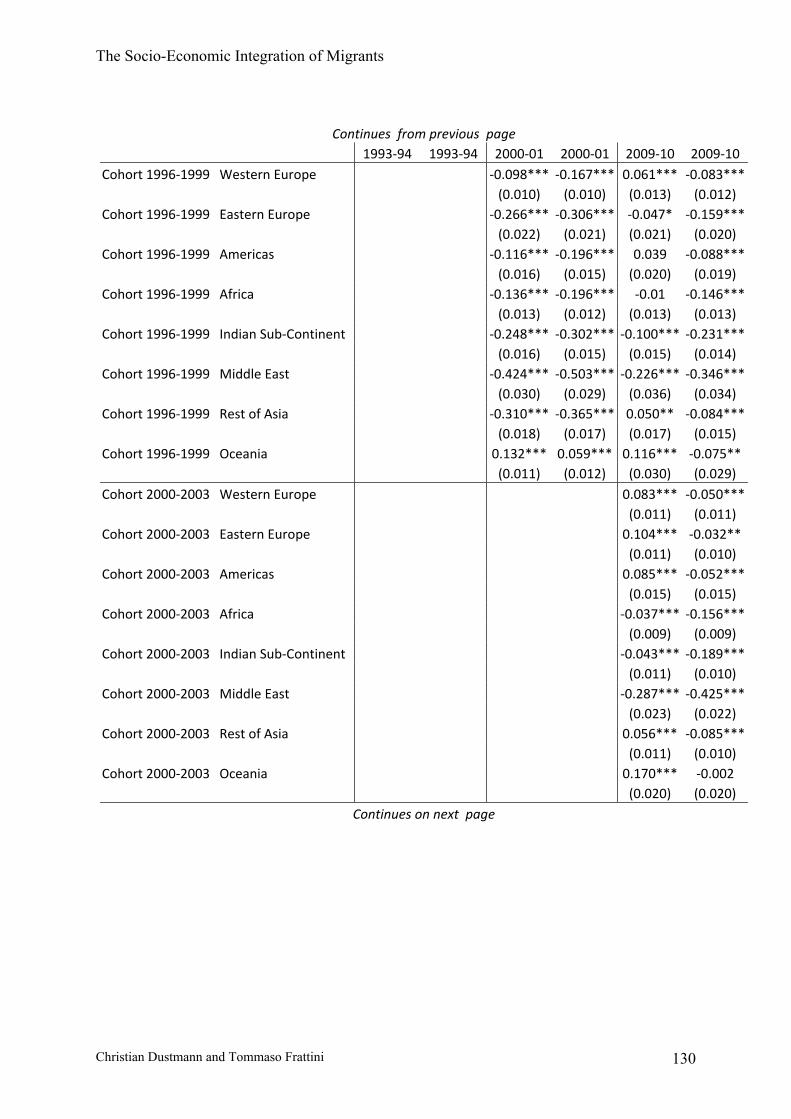
The Socio-Economic Integration of Migrants
Christian Dustmann and Tommaso Frattini 130
Continues from previous page 1993‐94 1993‐94 2000‐01 2000‐01 2009‐10 2009‐10 Cohort 1996‐1999 Western Europe ‐0.098*** ‐0.167*** 0.061*** ‐0.083*** (0.010) (0.010) (0.013) (0.012) Cohort 1996‐1999 Eastern Europe ‐0.266*** ‐0.306*** ‐0.047* ‐0.159*** (0.022) (0.021) (0.021) (0.020) Cohort 1996‐1999 Americas ‐0.116*** ‐0.196*** 0.039 ‐0.088*** (0.016) (0.015) (0.020) (0.019) Cohort 1996‐1999 Africa ‐0.136*** ‐0.196*** ‐0.01 ‐0.146*** (0.013) (0.012) (0.013) (0.013) Cohort 1996‐1999 Indian Sub‐Continent ‐0.248*** ‐0.302*** ‐0.100*** ‐0.231*** (0.016) (0.015) (0.015) (0.014) Cohort 1996‐1999 Middle East ‐0.424*** ‐0.503*** ‐0.226*** ‐0.346*** (0.030) (0.029) (0.036) (0.034) Cohort 1996‐1999 Rest of Asia ‐0.310*** ‐0.365*** 0.050** ‐0.084*** (0.018) (0.017) (0.017) (0.015) Cohort 1996‐1999 Oceania 0.132*** 0.059*** 0.116*** ‐0.075** (0.011) (0.012) (0.030) (0.029) Cohort 2000‐2003 Western Europe 0.083*** ‐0.050*** (0.011) (0.011) Cohort 2000‐2003 Eastern Europe 0.104*** ‐0.032** (0.011) (0.010) Cohort 2000‐2003 Americas 0.085*** ‐0.052*** (0.015) (0.015) Cohort 2000‐2003 Africa ‐0.037*** ‐0.156*** (0.009) (0.009) Cohort 2000‐2003 Indian Sub‐Continent ‐0.043*** ‐0.189*** (0.011) (0.010) Cohort 2000‐2003 Middle East ‐0.287*** ‐0.425*** (0.023) (0.022) Cohort 2000‐2003 Rest of Asia 0.056*** ‐0.085*** (0.011) (0.010) Cohort 2000‐2003 Oceania 0.170*** ‐0.002 (0.020) (0.020)
Continues on next page
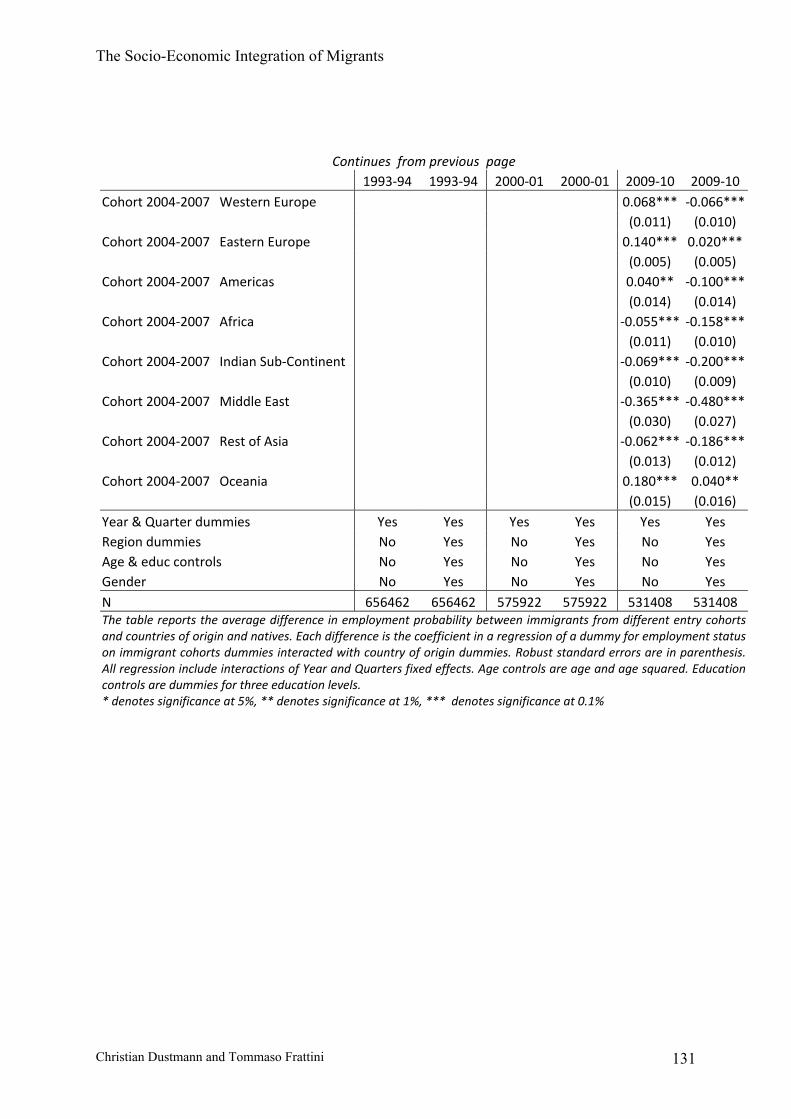
The Socio-Economic Integration of Migrants
Christian Dustmann and Tommaso Frattini 131
Continues from previous page 1993‐94 1993‐94 2000‐01 2000‐01 2009‐10 2009‐10 Cohort 2004‐2007 Western Europe 0.068*** ‐0.066*** (0.011) (0.010) Cohort 2004‐2007 Eastern Europe 0.140*** 0.020*** (0.005) (0.005) Cohort 2004‐2007 Americas 0.040** ‐0.100*** (0.014) (0.014) Cohort 2004‐2007 Africa ‐0.055*** ‐0.158*** (0.011) (0.010) Cohort 2004‐2007 Indian Sub‐Continent ‐0.069*** ‐0.200*** (0.010) (0.009) Cohort 2004‐2007 Middle East ‐0.365*** ‐0.480*** (0.030) (0.027) Cohort 2004‐2007 Rest of Asia ‐0.062*** ‐0.186*** (0.013) (0.012) Cohort 2004‐2007 Oceania 0.180*** 0.040** (0.015) (0.016) Year & Quarter dummies Yes Yes Yes Yes Yes Yes Region dummies No Yes No Yes No Yes Age & educ controls No Yes No Yes No Yes Gender No Yes No Yes No Yes N 656462 656462 575922 575922 531408 531408 The table reports the average difference in employment probability between immigrants from different entry cohorts and countries of origin and natives. Each difference is the coefficient in a regression of a dummy for employment statuson immigrant cohorts dummies interacted with country of origin dummies. Robust standard errors are in parenthesis. All regression include interactions of Year and Quarters fixed effects. Age controls are age and age squared. Education controls are dummies for three education levels. * denotes significance at 5%, ** denotes significance at 1%, *** denotes significance at 0.1%

The Socio-Economic Integration of Migrants
Christian Dustmann and Tommaso Frattini 132
Table A3: Immigrants-natives wage gap, by entry cohort & country of origin 1993‐94 1993‐94 2000‐01 2000‐01 2009‐10 2009‐10 Cohort 1980‐1983 Western Europe 0.079 ‐0.091 0.019 ‐0.011 0.079 ‐0.023 (0.088) (0.073) (0.050) (0.045) (0.050) (0.041) Cohort 1980‐1983 Eastern Europe ‐0.127 ‐0.630*** 0.722*** 0.269*** 0.039 ‐0.373* (0.105) (0.109) (0.005) (0.007) (0.166) (0.179) Cohort 1980‐1983 Americas 0.196 ‐0.221* 0.128 ‐0.109 0.235** ‐0.025 (0.133) (0.104) (0.082) (0.086) (0.080) (0.056) Cohort 1980‐1983 Africa 0.080 ‐0.273* 0.019 ‐0.213*** 0.138* ‐0.197** (0.120) (0.123) (0.053) (0.049) (0.069) (0.064) Cohort 1980‐1983 Indian Sub‐
Continent ‐0.248*** ‐0.322*** ‐0.174** ‐0.316*** ‐0.031 ‐0.270***
(0.074) (0.084) (0.054) (0.058) (0.077) (0.071) Cohort 1980‐1983 Middle East 0.473 ‐0.105 ‐0.013 ‐0.296* 0.233* ‐0.021 (0.340) (0.286) (0.181) (0.146) (0.105) (0.129) Cohort 1980‐1983 Rest of Asia 0.092 ‐0.321* ‐0.043 ‐0.345*** 0.171* ‐0.127 (0.132) (0.126) (0.117) (0.097) (0.084) (0.073) Cohort 1980‐1983 Oceania 0.122 ‐0.001 0.405* 0.225 0.470* 0.18 (0.146) (0.099) (0.171) (0.116) (0.191) (0.124) Cohort 1980‐1983 Other 0.959*** 0.385*** ‐0.125 0.113 0.062 ‐0.028 (0.007) (0.010) (0.120) (0.155) (0.124) (0.112) Cohort 1984‐1987 Western Europe 0.289*** 0.088 0.132* ‐0.008 0.138** 0.042 (0.066) (0.052) (0.058) (0.043) (0.053) (0.037) Cohort 1984‐1987 Eastern Europe ‐0.404 ‐0.848*** 0.667*** 0.094*** ‐0.469*** ‐0.640*** (0.258) (0.155) (0.005) (0.008) (0.101) (0.117) Cohort 1984‐1987 Americas 0.310** ‐0.068 ‐0.001 ‐0.294*** 0.154* ‐0.069 (0.111) (0.095) (0.073) (0.071) (0.073) (0.075) Cohort 1984‐1987 Africa 0.072 ‐0.165* 0.084 ‐0.224*** 0.105 ‐0.210*** (0.078) (0.068) (0.054) (0.056) (0.054) (0.049) Cohort 1984‐1987 Indian Sub‐
Continent ‐0.310*** ‐0.472*** ‐0.219** ‐0.463*** 0.002 ‐0.261***
(0.083) (0.078) (0.074) (0.068) (0.082) (0.076) Cohort 1984‐1987 Middle East 0.346 ‐0.22 0.198 ‐0.163 0.097 ‐0.268* (0.240) (0.236) (0.133) (0.131) (0.128) (0.133) Cohort 1984‐1987 Rest of Asia ‐0.102 ‐0.469*** 0.102 ‐0.228*** ‐0.052 ‐0.305*** (0.089) (0.086) (0.067) (0.064) (0.082) (0.082) Cohort 1984‐1987 Oceania 0.540*** 0.236 0.348 0.096 0.463* 0.204 (0.131) (0.150) (0.199) (0.127) (0.201) (0.153) Cohort 1984‐1987 Other ‐0.168*** ‐0.062*** ‐0.348*** ‐0.770*** ‐0.366** ‐0.567*** (0.007) (0.008) (0.082) (0.199) (0.116) (0.125)
Continues on next page

The Socio-Economic Integration of Migrants
Christian Dustmann and Tommaso Frattini 133
Continues from previous page 1993‐94 1993‐94 2000‐01 2000‐01 2009‐10 2009‐10 Cohort 1988‐1991 Western Europe 0.113* ‐0.065 0.223*** ‐0.02 0.088 ‐0.042 (0.053) (0.048) (0.039) (0.035) (0.050) (0.043) Cohort 1988‐1991 Eastern Europe 0.088 ‐0.428** 0.193 ‐0.275* 0.090 ‐0.319** (0.200) (0.160) (0.179) (0.130) (0.132) (0.110) Cohort 1988‐1991 Americas 0.380*** ‐0.019 0.297** ‐0.099 ‐0.091 ‐0.246** (0.099) (0.093) (0.095) (0.081) (0.094) (0.078) Cohort 1988‐1991 Africa 0.041 ‐0.399*** 0.107* ‐0.305*** 0.124** ‐0.211*** (0.076) (0.092) (0.050) (0.051) (0.044) (0.044) Cohort 1988‐1991 Indian Sub‐
Continent ‐0.443*** ‐0.545*** ‐0.276*** ‐0.595*** ‐0.209*** ‐0.307***
(0.091) (0.091) (0.075) (0.070) (0.053) (0.049) Cohort 1988‐1991 Middle East 0.365 ‐0.14 ‐0.054 ‐0.537** ‐0.206 ‐0.485** (0.212) (0.220) (0.165) (0.168) (0.146) (0.152) Cohort 1988‐1991 Rest of Asia 0.086 ‐0.219** 0.121* ‐0.255*** 0.068 ‐0.217** (0.102) (0.080) (0.059) (0.058) (0.080) (0.074) Cohort 1988‐1991 Oceania 0.318*** 0.014 0.099 ‐0.102 0.308** 0.228** (0.074) (0.069) (0.121) (0.104) (0.118) (0.078) Cohort 1988‐1991 Other 0.066 ‐0.123*** 0.402*** ‐0.031*** 0.066*** 0.322*** (0.108) (0.032) (0.005) (0.008) (0.005) (0.007) Cohort 1992‐1995 Western Europe 0.069 ‐0.149*** 0.287*** ‐0.014 (0.044) (0.039) (0.054) (0.044) Cohort 1992‐1995 Eastern Europe 0.087 ‐0.142 0.124 ‐0.124 (0.080) (0.089) (0.104) (0.105) Cohort 1992‐1995 Americas 0.214* ‐0.138 0.03 ‐0.157* (0.087) (0.072) (0.096) (0.068) Cohort 1992‐1995 Africa 0.028 ‐0.320*** 0.019 ‐0.297*** (0.056) (0.055) (0.056) (0.058) Cohort 1992‐1995 Indian Sub‐
Continent ‐0.308*** ‐0.539*** ‐0.292*** ‐0.487***
(0.079) (0.073) (0.077) (0.072) Cohort 1992‐1995 Middle East 0.561 0.055 0.756** 0.254 (0.315) (0.371) (0.237) (0.178) Cohort 1992‐1995 Rest of Asia ‐0.151* ‐0.475*** ‐0.033 ‐0.290*** (0.061) (0.067) (0.063) (0.053) Cohort 1992‐1995 Oceania 0.620*** 0.404*** 0.326* 0.078 (0.135) (0.093) (0.135) (0.118) Cohort 1992‐1995 Other 0.411*** 0.215*** ‐0.221 ‐0.121 (0.005) (0.008) (0.197) (0.207)
Continues on next page

The Socio-Economic Integration of Migrants
Christian Dustmann and Tommaso Frattini 134
Continues from previous page 1993‐94 1993‐94 2000‐01 2000‐01 2009‐10 2009‐10 Cohort 1996‐1999 Western Europe 0.166*** ‐0.091** 0.224*** ‐0.025 (0.037) (0.032) (0.045) (0.038) Cohort 1996‐1999 Eastern Europe ‐0.114 ‐0.259** ‐0.029 ‐0.228*** (0.113) (0.097) (0.065) (0.056) Cohort 1996‐1999 Americas 0.320*** ‐0.02 ‐0.009 ‐0.265*** (0.091) (0.076) (0.064) (0.056) Cohort 1996‐1999 Africa 0.014 ‐0.207*** 0.108** ‐0.153*** (0.038) (0.038) (0.041) (0.038) Cohort 1996‐1999 Indian Sub‐
Continent ‐0.367*** ‐0.566*** ‐0.107* ‐0.347***
(0.068) (0.062) (0.055) (0.045) Cohort 1996‐1999 Middle East 0.293 0.038 0.009 ‐0.27 (0.222) (0.170) (0.112) (0.154) Cohort 1996‐1999 Rest of Asia ‐0.08 ‐0.413*** ‐0.097 ‐0.324*** (0.089) (0.078) (0.051) (0.053) Cohort 1996‐1999 Oceania 0.515*** 0.177*** 0.633*** 0.271*** (0.058) (0.050) (0.085) (0.058) Cohort 1996‐1999 Other ‐0.480*** ‐0.364*** ‐0.195 ‐0.448* (0.116) (0.088) (0.156) (0.176) Cohort 2000‐2003 Western Europe 0.059 ‐0.132*** (0.042) (0.038) Cohort 2000‐2003 Eastern Europe ‐0.086 ‐0.297*** (0.046) (0.042) Cohort 2000‐2003 Americas 0.101 ‐0.120** (0.060) (0.046) Cohort 2000‐2003 Africa ‐0.001 ‐0.202*** (0.022) (0.023) Cohort 2000‐2003 Indian Sub‐
Continent 0.034 ‐0.262***
(0.039) (0.034) Cohort 2000‐2003 Middle East ‐0.233*** ‐0.438*** (0.065) (0.068) Cohort 2000‐2003 Rest of Asia ‐0.136*** ‐0.379*** (0.033) (0.035) Cohort 2000‐2003 Oceania 0.436*** 0.142 (0.091) (0.075) Cohort 2000‐2003 Other ‐0.271*** ‐0.227*** (0.078) (0.066)
Continues on next page
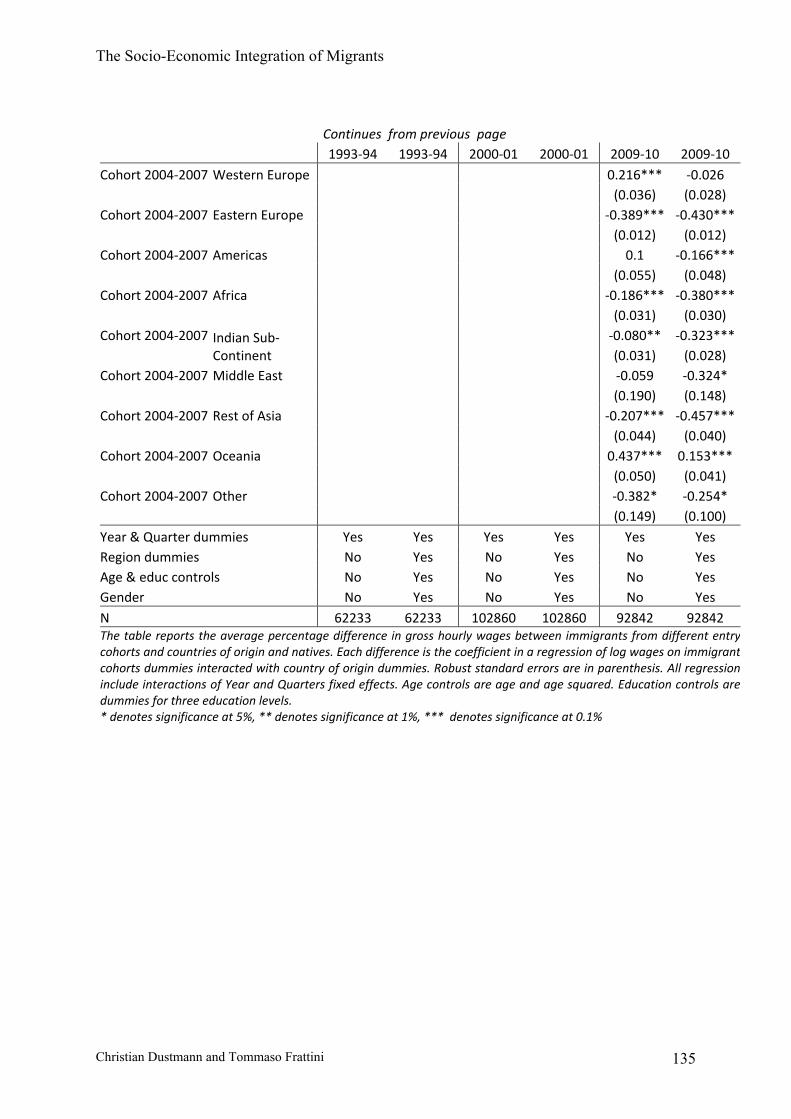
The Socio-Economic Integration of Migrants
Christian Dustmann and Tommaso Frattini 135
Continues from previous page 1993‐94 1993‐94 2000‐01 2000‐01 2009‐10 2009‐10 Cohort 2004‐2007 Western Europe 0.216*** ‐0.026 (0.036) (0.028) Cohort 2004‐2007 Eastern Europe ‐0.389*** ‐0.430*** (0.012) (0.012) Cohort 2004‐2007 Americas 0.1 ‐0.166*** (0.055) (0.048) Cohort 2004‐2007 Africa ‐0.186*** ‐0.380*** (0.031) (0.030) Cohort 2004‐2007 Indian Sub‐
Continent ‐0.080** ‐0.323***
(0.031) (0.028) Cohort 2004‐2007 Middle East ‐0.059 ‐0.324* (0.190) (0.148) Cohort 2004‐2007 Rest of Asia ‐0.207*** ‐0.457*** (0.044) (0.040) Cohort 2004‐2007 Oceania 0.437*** 0.153*** (0.050) (0.041) Cohort 2004‐2007 Other ‐0.382* ‐0.254* (0.149) (0.100) Year & Quarter dummies Yes Yes Yes Yes Yes Yes Region dummies No Yes No Yes No Yes Age & educ controls No Yes No Yes No Yes Gender No Yes No Yes No Yes N 62233 62233 102860 102860 92842 92842 The table reports the average percentage difference in gross hourly wages between immigrants from different entry cohorts and countries of origin and natives. Each difference is the coefficient in a regression of log wages on immigrant cohorts dummies interacted with country of origin dummies. Robust standard errors are in parenthesis. All regressioninclude interactions of Year and Quarters fixed effects. Age controls are age and age squared. Education controls are dummies for three education levels. * denotes significance at 5%, ** denotes significance at 1%, *** denotes significance at 0.1%