The Societal Value of NOAA’s Digital Coast
73
The Societal Value of the Digital Coast A The Societal Value of NOAA’s Digital Coast Final Report to the NOAA National Ocean Service Office of Coastal Management Kathryne Cleary, Alan Krupnick, and Seth Villaneuva, with Alexandra Thompson Report 21-03 February 2021
Transcript of The Societal Value of NOAA’s Digital Coast
The Societal Value of the Digital Coast A
The Societal Value of NOAA’s Digital CoastFinal Report to the NOAA National Ocean Service Office of Coastal Management
Kathryne Cleary, Alan Krupnick, and Seth Villaneuva, with Alexandra Thompson
Report 21-03 February 2021
Resources for the Future i
About the Authors Kathryne Cleary is a senior research associate at Resources for the Future. Her work at RFF focuses primarily on electricity policy with the Future of Power Initiative and includes work on carbon pricing, electricity market design, and electrification. Outside of her work on electricity, Cleary has worked on economic studies on the value of information. Cleary holds an MEM with a focus on energy policy from the Yale School of the Environment and a BA in economics and environmental policy from Boston University.
Alan Krupnick is a senior fellow at Resources for the Future. Krupnick’s research focuses on analyzing environmental and energy issues, in particular, the benefits, costs and design of pollution and energy policies, both in the United States and abroad. Krupnick’s portfolio includes oil and gas issues, the value of information agenda covered by our VALUABLES initiative with NASA, and policies to bring down industrial emissions of greenhouse gases.
Seth Villanueva is research analyst at Resources for the Future. He graduated from UC Santa Barbara in 2019 with a BA in economics and a minor in mathematics. At UCSB, Seth worked as a Gretler Research Fellow under Professor Olivier Deschenes to study economic outcomes related to the scaling of wind power generation. Seth’s current projects at RFF focus on the valuation of climate models and resource management services, as well as the maintaining of RFF’s annual Global Energy Outlook report.
Alexandra Thompson is senior research associate and GIS research coordinator at Resources for the Future. Thompson brings a distinctive skillset to RFF through her training in urban and regional planning. Her graduate work on local ecosystem service provision through an intersection of traditional planning, environmental economics, and spatial analysis gives her a unique perspective on problem solving through research. Her work seeks to improve the understanding of complex environmental problems through the creative use and analysis of spatial data. Thompson’s current research includes the valuation of remotely sensed data, impacts of oil and gas development on water use, invasive species monitoring and control, cross-boundary management of environmental challenges, sea level rise impacts, and more.

The Societal Value of the Digital Coast ii
Acknowledgements We would like to thank first the sponsors and our partners and reviewers from the Office for Coastal Management at NOAA: Nicholas (Miki) Schmidt, division chief, Science and Geospatial Services; Kate Quigley, economist and our project manager; Lori Cary-Kothera, who gave us the website data that Alex analyzed; and Jeff Adkins, economist. In connection with the case studies, we thank Chase Glisson and Morgan Pitts from the Jackson County Utility Authority, who were so generous with their time and knowledge in helping us research the Jackson, Mississippi, case study, and the many, many Digital Coast users and contributors from Hawaii to New Jersey to Florida and elsewhere who helped us understand the contributions that the Digital Coast makes to their professional lives. At RFF, we thank Margaret Walls for her good counsel.
Cover photo: Mike Phillips / Shutterstock
About RFFResources for the Future (RFF) is an independent, nonprofit research institution in Washington, DC. Its mission is to improve environmental, energy, and natural resource decisions through impartial economic research and policy engagement. RFF is committed to being the most widely trusted source of research insights and policy solutions leading to a healthy environment and a thriving economy.
The views expressed here are those of the individual authors and may differ from those of other RFF experts, its officers, or its directors.
Sharing Our WorkOur work is available for sharing and adaptation under an Attribution-NonCommercial-NoDerivatives 4.0 International (CC BY-NC-ND 4.0) license. You can copy and redistribute our material in any medium or format; you must give appropriate credit, provide a link to the license, and indicate if changes were made, and you may not apply additional restrictions. You may do so in any reasonable manner, but not in any way that suggests the licensor endorses you or your use. You may not use the material for commercial purposes. If you remix, transform, or build upon the material, you may not distribute the modified material. For more information, visit https://creativecommons.org/licenses/by-nc-nd/4.0/.
Resources for the Future iii
AbstractThe Digital Coast is a platform run by NOAA’s Office for Coastal Management (OCM) that is composed of thousands of datasets, tools, trainings, and stories related to improving coastal management. The Digital Coast is publicly funded, which makes it difficult to value. This report employs valuation techniques to estimate the value the platform affords its users in the form of improved decisions regarding coastal management and to estimate the program’s benefits versus its costs of operation. We highlight the various categories of typical uses of the Digital Coast platform, perform a literature review of how these might contribute to societal benefits, conduct website analytics to provide a breakdown of various tools and datasets by category and partner type, and perform two case studies. Our first case study looks at the use of two Digital Coast products in Jackson, Mississippi, to relocate wastewater treatment plants to higher ground based on future flood risks. We estimate that this onetime use of Digital Coast resources yielded societal benefits of $1.1 million to $2.2 million in 2014$. Given that Digital Coast resources, particularly the Sea Level Rise Viewer, are used thousands of times annually, we estimate that the true benefits of the platform are many times higher than illustrated by this case study. Our second case study estimates participants’ expected willingness to pay for two trainings available to the private sector through the Digital Coast program. We find that individual trainings are worth approximately $27 to $146 per participant per hour. Extrapolating this to all the in-person trainings offered by the Digital Coast Academy yields estimated societal benefits of $1.8 million to $9.7 million annually.

The Societal Value of the Digital Coast iv
Contents1. Introduction 1
2. The Value of Information 4
2.1. How to Assess the Value of Information 5
3. Categorization of the Uses of the Digital Coast 8
3.1. Long-Term Planning for Reducing Coastal Vulnerability 11
3.2. Emergency Planning 13
3.3. Conservation 13
4. Web Content Analysis 18
4.1. Methods 19
4.1.1. Datasets 19
4.1.2. Tools 20
4.2. Results 20
4.2.1. 4.2.1 Datasets 20
4.2.2. Tools 22
4.3. Discussion 31
4.3.1. Recommendation 31
5. Case Study Selection 32
5.1. Criteria for Case Study Choices 32
5.1.1. Process 33
5.1.2. Methods 33
6. Case Studies 36
6.1. Jackson County (Mississippi) Utility Authority Case Study 36
6.1.1. Background 36
6.1.2. Use of Digital Coast Products 38
6.1.3. Counterfactual 38
6.1.4. Attribution 39
6.1.5. Estimation of Benefits 39
6.1.6. Limitations 48
6.1.7. Conclusion 49
6.2. Digital Coast Academy 49
6.2.1. Background 49
6.2.2. Digital Coast Academy Training Cases 50
6.2.3. Extrapolation 57

Resources for the Future v
7. Case Studies Not Selected 60
7.1. Kauai (Sea Grant Kauai) 60
7.1.1. Use of Digital Coast Products 60
7.1.2. Issues with the Case 61
7.2. Rutgers Institute of Marine and Coastal Sciences, New Jersey 61
7.2.1. Use of Digital Coast Products 62
7.2.2. Issues with the Case 62
7.3. CRS Case, Stetson University, Florida 62
7.3.1. Use of Digital Coast Products 62
7.3.2. Issues with the Case 62
7.4. Ocean County, New Jersey 63
7.4.1. Use of Digital Coast Products 63
7.4.2. Issues with the Case 63
7.5. Private Sector Case Study (The Dewberry Companies) 63
7.5.1. Use of Digital Coast Products 63
7.5.2. Issues with the Case 63
8. Conclusions 65
8.1. Main Findings 65
8.2. Recommendations 65
The Societal Value of the Digital Coast 1
1. IntroductionGovernment programs are increasingly under scrutiny to prove their value in order to justify their funding and maximize the societal value of investments. Since government-run programs provide resources and tools that are public goods and are generally available for free, they typically lack traditional methods for assessing product value used by private companies, such as a price on the product. Instead, one way to estimate the value of a government program is through assessing the value of information (VOI) it provides. Such an assessment requires knowledge of the uses to which it is put, the benefit of those uses, and the counterfactual: what would happen to the activities if the program in question were no longer available.
The National Oceanic and Atmospheric Administration’s (NOAA’s) Office for Coastal Management (OCM) manages the Digital Coast, a website comprising thousands of open-access datasets, interactive and downloadable tools, literature, and online and in-person trainings, all focused on providing coastal communities with necessary resources for coastal management. The Digital Coast’s most popular resources pertain to sea level rise, flood exposure, risk communication, and historical hurricane tracking. The website provides many examples, or stories, of how its resources have helped coastal communities assess topics of concern, such as coastal flooding risks, preparing for future storms, and areas vulnerable to sea level rise.
The Digital Coast owes much of its success to a partnership of nine nongovernmental membership organizations whose input ensures the relevance of the initiative. Collectively, this group of organizations has expertise in a wide range of policy and technical issues. The Digital Coast provides an effective platform for these groups to work together to address coastal issues. The nine partners are as follows:
• American Planning Association
• Association of State Floodplain Managers
• Coastal States Organization
• National Association of Counties
• National Estuarine Research Reserve Association
• National Oceanic and Atmospheric Administration
• National States Geographic Information Council
• The Nature Conservancy
• Urban Land Institute
Hundreds of other partners also contribute content, including state government agencies, federal agencies, private companies, city governments, academic institutions, tribal groups, nongovernmental organizations, and counties.
The uses and corresponding benefits of the Digital Coast are vast and can be difficult to assess because everything on the site is available for free to the public. Without a price tag, the user’s willingness to pay for such a product is not directly known.
Resources for the Future 2
However, it is possible to assign monetary value to some of the benefits provided by the Digital Coast through the use of techniques developed in the VOI literature. Placing a monetary value on the use of Digital Coast resources will help lawmakers measure this value against the program’s cost and assess its overall net societal value.
This study serves as a follow-up to and extension of previous valuation studies completed by NOAA’s OCM in 2009, 2012, and 2015 to assess the benefits of the Digital Coast. Those studies were based on surveys that measured benefits to users against costs of the program. Over time, the benefits have grown with increased usage of the site and its resources.
The more recent study (OCM 2015) focused on two benefits: efficiency gains and effectiveness gains. “Efficiency gains” refers to the benefits that the Digital Coast provides by enabling users to do the same work more efficiently, such as through time savings. “Effectiveness gains” are defined as better decisionmaking and outcomes for addressing coastal issues as a result of the use of the Digital Coast. The study did not attempt to quantify this latter category, but rather included some qualitative descriptions of example benefits.
The study relied on survey-based data from users on their time savings associated with the usage of the Digital Coast resources and from website usage data (e.g., number of downloads and site visits) to quantify the benefits from efficiency gains. The survey was conducted by the National States Geographic Information Council on governmental, nongovernmental, and private sector users of the Digital Coast and contained questions on the users’ profiles, how they apply the Digital Coast’s materials, and how they would perform their jobs without the website and its resources.
From the survey data, the study determined a monetary value for each use of the Digital Coast by multiplying the reported time saved by the average user’s hourly wage. This product was multiplied by the number of uses obtained from website data to quantify aggregate time savings provided by the Digital Coast platform. The study found that from FY2009 to FY2013, the Digital Coast provided over $30 million in benefits from efficiency improvement associated with data downloads, tool uses, web services, and avoiding duplicative efforts. It also found that in FY2013, the platform generated benefits of $3.3 million from time savings.
This report focuses on what the earlier study referred to as effectiveness gains, which are essentially improvements in societal outcomes as a result of the Digital Coast resources, and which the previous study described but did not attempt to quantify. We will advance the previous study by estimating some of the benefits of these effectiveness gains that Digital Coast resources provide to decisionmakers through case study analyses.
This report is organized as follows. Section 2 provides the theory for performing value of information analyses. Section 3 presents a taxonomy of the benefits of the Digital Coast by use, source, and the corresponding possible benefits from each use, including benefits to human health, environmental health, and property. Section 4 provides the results of our quantitative analysis of Digital Coast website usage, which

The Societal Value of the Digital Coast 3
extends analysis typically performed by Digital Coast staff and suggests how our findings can be used to estimate benefits of the Digital Coast products. Section 5 presents our criteria for choosing case studies. Section 6 develops two case studies, one studying the use of two Digital Coast products—the Sea Level Rise Viewer and the Coastal Flood Exposure Mapper—to guide planning to relocate three wastewater treatment facilities that sustained much hurricane damage to safer areas, and the other valuing the extensive program of trainings that Digital Coast staff provide for free to future users of its products. Section 7 details case studies that were explored but not ultimately chosen because of a variety of issues. However, these examples identify ways the Digital Coast is frequently used and could lead to meaningful changes in the platform’s products and protocols. Section 8 summarizes the report and concludes with recommendations for adding to the Digital Coast’s value.
Reference
OCM. 2015. Projected Benefits and Costs of the Digital Coast. April. https://coast.noaa.gov/data/digitalcoast/pdf/benefits-costs.pdf.

Resources for the Future 4
2. The Value of InformationThe Digital Coast provides governmental, nongovernmental, and private sector groups with information through available data, tools, and other online resources. This information can be valuable, particularly if it influences the decisionmaking process.
In this study, we use an economic valuation technique referred to as the value of information (VOI).1 The VOI methodology has been used in many applications, such as estimating the benefits of using satellite information to detect algal blooms (Stroming et al. 2020) or estimating the cost-effectiveness of satellites for the purpose of wildfire response (Bernknopf et al. 2019). This method relies, at its foundation, on an understanding of what constitutes value.
“Value,” in economic terms, refers to things that benefit the user in some way. In a market, the value of products is typically considered to be the price of the good—for example, a sandwich that costs $10 is worth at least $10 to the person who chooses to purchase it. Thus the price of the good or service typically serves as a simple way to assess its value.
While the value of market goods is easily understood, the value for nonmarket goods, or those that do not have a price but provide users with benefits, are not as easily valued. Together, the market value of a good plus its nonmarket value constitutes its “societal value,” hence the title of this report. To estimate the value of nonmarket goods, economists are able to use various valuation techniques, described as “revealed preference” and “stated preference.” This value is typically expressed in monetary terms as a way to make clear comparisons among products and with product costs.
One example of a nonmarket good is information. Government agencies such as NOAA generate a wide range and great volume of information that is used by local and state governments, universities, nonprofits, the public, and even other federal government agencies.
The tools, data, and trainings available through the Digital Coast provide users with information to help address coastal management issues. While informative, these resources are not in themselves considered “valuable” by these standards. However, information is considered valuable if it leads to a change in decisionmaking or the decisionmaking process (e.g., its speed) that results in better outcomes for people and the environment.
Having reliable and readily available information can be valuable in many diverse contexts, including planning for sea level rise, protecting coastal habitats, and assessing the impacts of coastal natural disasters such as hurricanes. These uses can lead to a variety of benefits to society, including a reduction in property damage
1 This concept of VOI can be traced historically to Hirshleifer and Riley (1979) and McCall (1982). For more information on VOI methodology, see Laxminarayan and Macauley (2012).
The Societal Value of the Digital Coast 5
and loss of life in the event an emergency occurs. Measuring the magnitude of these improvements to societal outcomes—lives saved, for example—is one way that governments can understand and communicate the benefits of their work.
The information provided by the resources available through the Digital Coast has many benefits. Most of these cases involve improvements in the decisionmaking process, such as reducing the time it takes to come to a decision because a particular tool is familiar and easy to use, which enables the benefits of those decisions to be realized sooner, or giving the decisionmaker more confidence in making a decision because OCM’s tools are reliable and updated frequently.
Additionally, information provided by government programs can still be useful and valuable (although perhaps hard to quantify) even if it does not lead to a change in decisions, particularly if it is used for research purposes.
2.1. How to Assess the Value of InformationMeasuring the impacts of the VOI is termed an “impact assessment.” This is a quantitative study that investigates how people use improved information to make decisions and quantify how these decisions improve socioeconomically meaningful outcomes. The ones that pertain to or are directly about the Digital Coast are reviewed in section 3.
The VOI compares outcomes in two different states of the world: a state in which action is taken based on one set of information and a different state in which action is taken using better information. Uncertainty is present in the possible outcomes. The difference in socioeconomically meaningful outcomes between the two states represents the value of the information.
Note that the VOI approach relies partly on the premise that information can influence decisionmaking; information is meaningful in the presence of uncertainty and valuable when something is at stake in a decision. It is also important to note that additional or better information may be valuable even if it does not lead to a different choice on the part of a decisionmaker. This is especially true if the decisionmaker exhibits risk aversion, a reluctance to accept a set of choices with an uncertain payoff rather than another set of choices with a more certain, but possibly lower, expected payoff. If decisionmakers are risk averse, they will have an ex ante willingness to pay for information in order to reduce the uncertainty associated with the decision.
The impact assessment process adopted here is based on a “theory of change” approach, which describes the causal logic of how and why a particular project will reach its intended outcomes. For a Digital Coast project, describing a theory of change involves identifying how the availability of project outputs (e.g., data products, models, information systems, decision-support tools) may change the actions taken by a decisionmaker who uses those project outputs relative to the case in which the project outputs are not available or are available with greater uncertainty (Figure 1).
Resources for the Future 6
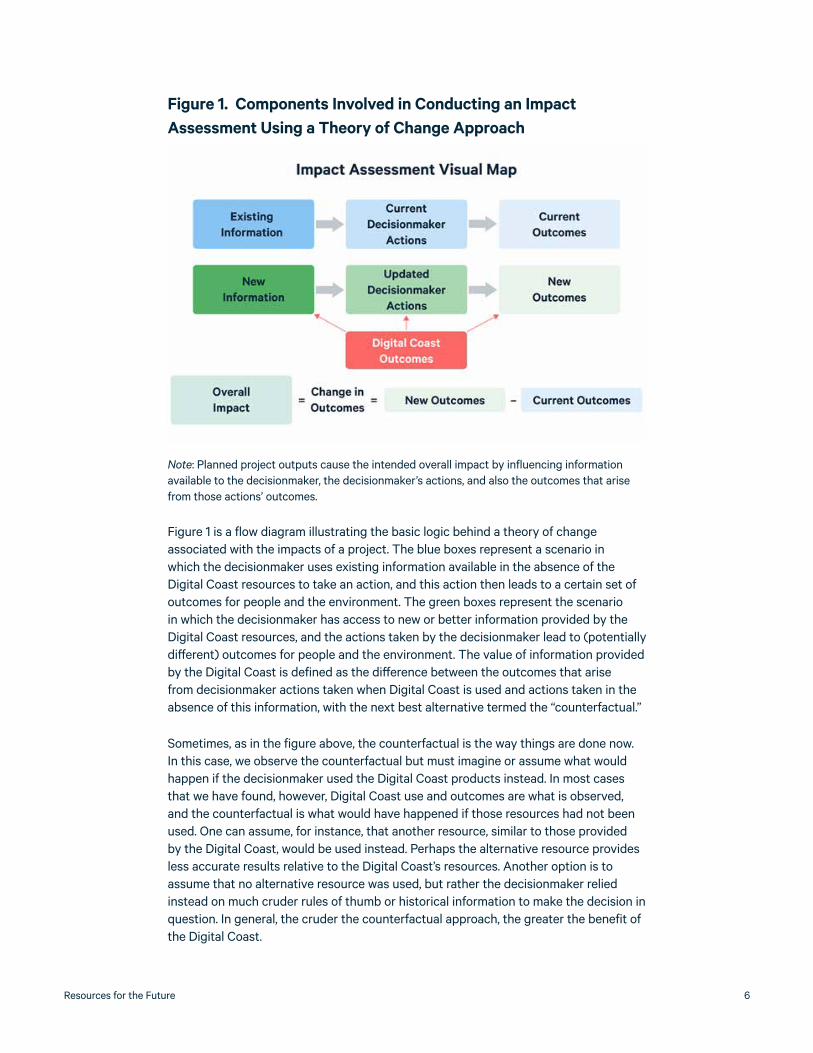
Figure 1 is a flow diagram illustrating the basic logic behind a theory of change associated with the impacts of a project. The blue boxes represent a scenario in which the decisionmaker uses existing information available in the absence of the Digital Coast resources to take an action, and this action then leads to a certain set of outcomes for people and the environment. The green boxes represent the scenario in which the decisionmaker has access to new or better information provided by the Digital Coast resources, and the actions taken by the decisionmaker lead to (potentially different) outcomes for people and the environment. The value of information provided by the Digital Coast is defined as the difference between the outcomes that arise from decisionmaker actions taken when Digital Coast is used and actions taken in the absence of this information, with the next best alternative termed the “counterfactual.”
Sometimes, as in the figure above, the counterfactual is the way things are done now. In this case, we observe the counterfactual but must imagine or assume what would happen if the decisionmaker used the Digital Coast products instead. In most cases that we have found, however, Digital Coast use and outcomes are what is observed, and the counterfactual is what would have happened if those resources had not been used. One can assume, for instance, that another resource, similar to those provided by the Digital Coast, would be used instead. Perhaps the alternative resource provides less accurate results relative to the Digital Coast’s resources. Another option is to assume that no alternative resource was used, but rather the decisionmaker relied instead on much cruder rules of thumb or historical information to make the decision in question. In general, the cruder the counterfactual approach, the greater the benefit of the Digital Coast.
Figure 1. Components Involved in Conducting an Impact Assessment Using a Theory of Change Approach
Note: Planned project outputs cause the intended overall impact by influencing information available to the decisionmaker, the decisionmaker’s actions, and also the outcomes that arise from those actions’ outcomes.
The Societal Value of the Digital Coast 7
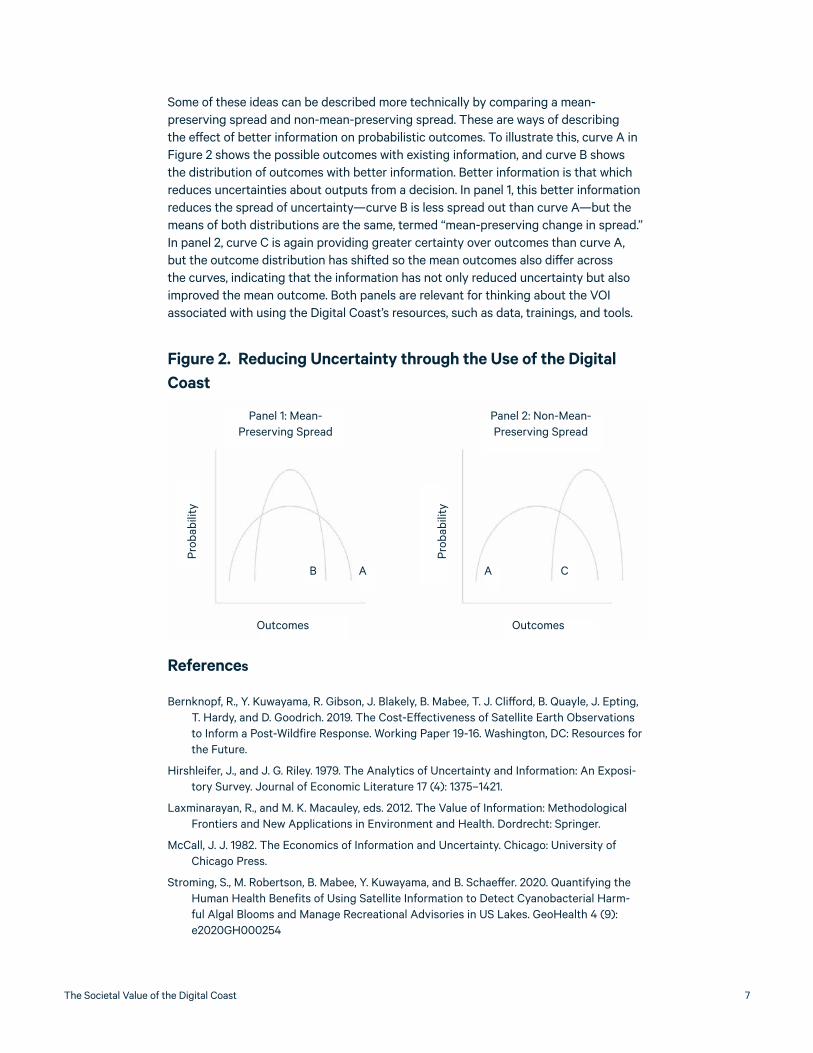
Some of these ideas can be described more technically by comparing a mean-preserving spread and non-mean-preserving spread. These are ways of describing the effect of better information on probabilistic outcomes. To illustrate this, curve A in Figure 2 shows the possible outcomes with existing information, and curve B shows the distribution of outcomes with better information. Better information is that which reduces uncertainties about outputs from a decision. In panel 1, this better information reduces the spread of uncertainty—curve B is less spread out than curve A—but the means of both distributions are the same, termed “mean-preserving change in spread.” In panel 2, curve C is again providing greater certainty over outcomes than curve A, but the outcome distribution has shifted so the mean outcomes also differ across the curves, indicating that the information has not only reduced uncertainty but also improved the mean outcome. Both panels are relevant for thinking about the VOI associated with using the Digital Coast’s resources, such as data, trainings, and tools.
References
Bernknopf, R., Y. Kuwayama, R. Gibson, J. Blakely, B. Mabee, T. J. Clifford, B. Quayle, J. Epting, T. Hardy, and D. Goodrich. 2019. The Cost-Effectiveness of Satellite Earth Observations to Inform a Post-Wildfire Response. Working Paper 19-16. Washington, DC: Resources for the Future.
Hirshleifer, J., and J. G. Riley. 1979. The Analytics of Uncertainty and Information: An Exposi-tory Survey. Journal of Economic Literature 17 (4): 1375–1421.
Laxminarayan, R., and M. K. Macauley, eds. 2012. The Value of Information: Methodological Frontiers and New Applications in Environment and Health. Dordrecht: Springer.
McCall, J. J. 1982. The Economics of Information and Uncertainty. Chicago: University of Chicago Press.
Stroming, S., M. Robertson, B. Mabee, Y. Kuwayama, and B. Schaeffer. 2020. Quantifying the Human Health Benefits of Using Satellite Information to Detect Cyanobacterial Harm-ful Algal Blooms and Manage Recreational Advisories in US Lakes. GeoHealth 4 (9): e2020GH000254
Figure 2. Reducing Uncertainty through the Use of the Digital Coast
Panel 1: Mean-Preserving Spread
Panel 2: Non-Mean-Preserving Spread
B A A C
Outcomes Outcomes
Prob
abili
ty
Prob
abili
ty

Resources for the Future 8
3. Categorization of the Uses of the Digital CoastOur team has assembled Table 1 to summarize the Digital Coast’s uses and to categorize the associated benefits and costs to society. The source material is the Digital Coast website, in particular an analysis of the many stories that describe specific uses of Digital Coast resources. The first column covers the overarching ways in which Digital Coast resources are used, such as for long-term planning or emergency planning associated with tsunamis. The second column lists the specific uses within these categories, such as long-term resilience planning. The remaining columns show the various benefits and costs to society that result from these applications. An X indicates that a particular use of Digital Coast products can lead to the benefit or cost listed at the top of the column. While long-term planning efforts will likely produce significant benefits in the future, as indicated in the table, they also require time and effort from local government officials in the interim, which takes resources away from other local needs. For this reason, an X in parentheses represents the opportunity cost associated with these planning efforts.
The Digital Coast consists of thousands of available tools, data sources, and trainings. All these resources provide valuable information, but for the purposes of this analysis, we focus exclusively on the general uses of these materials rather than the specific resources. This approach is feasible because many of the tools, trainings, and data are used together. For example, the city of Charleston, South Carolina, participated in the NOAA-run Coastal Inundation Mapping training and developed a flooding and sea level rise strategy for the city with the aid of the Sea Level Rise Viewer and Coastal Flood Exposure Mapper tools. This plan, if followed by physical, economic, or legal changes on the ground, leads to benefits related to human health, mitigation costs avoided, and property damage avoided by preparing for sea level rise faster than without these products or developing a better plan (in terms of either cost savings or better protection).
Benefits (and costs) are always measured against the counterfactual. Depending on the counterfactual, use of Digital Coast products may lead to outcomes that would be mean-preserving relative to the next best alternative (the counterfactual) or non-mean-preserving.
In some cases, alternative tools from other sources could exist that we would need to account for when calculating the benefits that the Digital Coast resources provide. The Charleston example describes the benefits associated with resilience planning from the use of Digital Coast’s tools. In the absence of the Digital Coast, however, the counterfactual could be that Charleston city planners used alternative tools provided by other sources, such as the EarthTime Sea Level Rise Tool, which could be more or less informative relative to the Sea Level Rise Viewer. In the event that the use of an alternative tool were the counterfactual, and if this alternative tool produced similar quality results, some benefits of the Digital Coast could be negligible because the user is not better off using the DC product. If the alternative tool were more difficult

The Societal Value of the Digital Coast 9
Table 1. Uses and Benefits/Costs of the Digital Coast Resources
Use Category Specific UseMitigation
Costs Avoided
Time Saved
Human Health
Environmental PropertyEconomic
Development
Long-Term Planning
Modifying Zoning Requirements
X ( X ) X X
Resilience Planning
X ( X ) X X X
Monitoring (Short-Term)
Tides and Water Levels
X Xa
Emergency Planning
Tsunamis X Xb
Assessment of Impacts
Natural Disasters X X
Water Quality Impacts from Climate Change and Runoff
X X
Conservation
Wildlife X Xc
Habitat X Xd
Project Development Planning
Offshore Renewable Energy Development
X X
Education Trainings X
DiscoverabilityPortal for Other Resources
X
a Preventing damage to marine vessels. b Preventing damage to automobiles and boats. c Coral reefs can reduce property damages from storm surge. d Green infrastructure can reduce damages from storm surge.

Resources for the Future 10
to find and use, however, that would mean the Digital Coast provides benefits related to time savings. If it produced lower quality or less complete results than the Digital Coast’s tools, that could lead to poorer planning efforts. For example, the tool might fail to identify the potential vulnerability of a neighborhood due to sea level rise and thus lead the city to underprepare for the future, which would mean that the Digital Coast provides some additional benefits with respect to avoiding property and human health effects. Or the alternative tool might misidentify an area of vulnerability that may not be in danger, which would lead the city to overprepare for sea level rise. Thus the city could save on mitigation costs if a Digital Coast resource improves planning accuracy relative to an alternative tool.
Assuming the counterfactual is that no alternative tools are used and no interventions are made, the use of the Digital Coast in this case would be non-mean-preserving because the information that the Digital Coast provides could lead to better decisionmaking regarding future sea level rise and thus result in a shift in possible outcomes from curve A to curve C, as indicated in Figure 2. For example, the use of Digital Coast resources could allow the city to better prepare for the future by building sea walls, which would reduce the expected damages associated with a given amount of sea level rise.
Of course, a reasonable counterfactual could be that the town would eventually reach the same conclusion and choose to build sea walls (i.e., mean-preserving), but that the Digital Coast resources allowed decisionmakers to make these changes earlier in time than they would have otherwise. In that case, this scenario could still have associated benefits for mitigation costs avoided, human health, and property for the years “saved.” For example, if a municipality uses the Digital Coast resources to inform their planning process and decides to construct a sea wall three years earlier than it would have without the Digital Coast, then benefits would exist for the duration of those three years in which they had additional protection against flooding and storm surges.
Some uses of the Digital Coast, as indicated in Table 1, do not produce direct market benefits (e.g., avoided costs) but can still provide nonmarket environmental benefits. For example, many of the Digital Coast’s resources inform decisions for conservation efforts along the coasts. If the information provided by these tools helps preserve habitats and ensures local survival of a species, then the use of these resources has environmental benefits, as indicated by an X in this column of the table. Monetization of the benefits associated with these conservation efforts can be informed through the appropriate valuation literature.
Notably, many of the resources available through the Digital Coast are not operated by NOAA but rather available through partner organizations. In these cases, most of the benefits resulting from the use of these materials cannot be attributed to the Digital Coast. However, as a centralized, government-run online platform, the Digital Coast provides value through “discoverability,” as the aggregation of resources in one place makes them easier for coastal decisionmakers to find. A likely counterfactual for these cases is that the resources would still exist, but that fewer users would find and use them or take a longer time to find them because they are not centrally available. Thus the Digital Coast still can provide benefits related to time savings and use.
The Societal Value of the Digital Coast 11
Another important concept to consider in determining the benefits from the uses of the Digital Coast is where these benefits lie along the value chain associated with the information provided. For example, the Digital Coast is often used retrospectively to assess the impacts of a natural disaster and to identify areas of vulnerability. A retrospective analysis itself does not immediately lead to benefits, since it does not directly lead to a change in decisionmaking. Decisionmakers could, however, take advantage of the information provided by such an analysis to make better decisions in the future when preparing for similar natural disasters. This preparation could lead to benefits, but it is one step removed from the original use of the Digital Coast. In Table 1, we assume that reports of this nature assist in making better decisions and thus eventually lead to societal benefits, which is why the impact assessments from natural disasters are assumed to have benefits for human health and property.
Developing the appropriate counterfactual for each scenario requires extensive research and understanding. In creating Table 1, we have assumed that the counterfactual for each scenario has no alternative resource, and that outcomes are worse (not mean-preserving) without the Digital Coast resources. In practice, the true counterfactuals might vary, which could change some of the Xs listed.
The following subsections delve into a bit of detail on many of the use categories identified in the table to provide a better understanding of how important these uses might be in a VOI context.
3.1. Long-Term Planning for Reducing Coastal VulnerabilityThe Digital Coast platform provides several tools and datasets for improving long-term planning decisions regarding coastal management. For example, a frequently used tool is the Sea Level Rise Viewer, which enables users to estimate the impacts of various levels of sea level rise on their communities.
Therefore, use of Digital Coast tools and resources can improve outcomes for coastal infrastructure that could face severe impacts from climate change, including induced sea level rise, storm surge, and flooding. Infrastructure adaptation costs are only expected to rise over time, with one study estimating total costs of $254.1 billion (2011$) through 2100 for shoreline protection and nourishment along the entire continental US coastline for 67 centimeters of sea level rise (Neumann et al. 2011; Sussman et al. 2014). Community resilience planning to address these growing issues is improved by access to high-resolution land cover and land elevation data, such as the lidar data available through the Digital Coast (Loftis et al. 2018). Digital Coast digital elevation model data have also been used to evaluate sea level rise threats to energy infrastructure, with a study in Texas finding that 90 percent of Gulf of Mexico petroleum capacity, just less than half of total US capacity, is within a 2-kilometer flood buffer from the advanced coastline under 4- and 6-foot sea level rise scenarios (Dismukes and Narra 2018). Further, under 2- and 4-foot sea level rise scenarios, approximately 13 percent of US Gulf of Mexico natural gas capacity is at risk

Resources for the Future 12
of inundation (Dismukes and Narra 2018). The Digital Coast’s Sea Level Rise Viewer and ground elevation data have also been used to identify coastal hazard risk to infrastructure such as power generation plants, railways, airports, and nuclear plants (Willis et al. 2016).
Tools and data available through the Digital Coast can assist sustainable development aimed at limiting future infrastructure risk. Linhoss and colleagues (2015) used the Digital Coast’s Sea Level Affecting Marshes Model to investigate the impact that wetland migration is expected to have on developed land along a 62-kilometer stretch of northeastern Florida coastline. The authors found that within the study area, land cover change and flooding will affect approximately $177 million worth of property.
The Digital Coast includes numerous tools and datasets that cover historical flood events and areas currently or projected to be at risk of flooding. One popular example for the identification of communities and settlements at risk of coastal flooding is the Coastal Flood Exposure Mapper, which provides publicly accessible flood rating information. Expanded information on flood risk constitutes a decrease in uncertainty to consumers and could be expected to improve consumer welfare through property prices that more accurately account for environmental risks. A small but growing body of research has demonstrated the impact that publicly available flood incidence and risk information can have on property values. Initial results from Australia have shown that average property prices decrease as much as 7 percent as a result of flood zone designation, and that consumers respond more severely to actual flooding incidence than to flood risk (Rajapaska et al. 2016). Gibson and colleagues (2019) found that prices of properties that were not damaged by Hurricane Sandy but have since been included in floodplain maps have decreased by about 18 percent.
Digital Coast lidar data have been used for a variety of emergency planning topics that include sea level rise and coastal flooding (OCM 2020d,f,g). These data have been employed extensively in digital elevation models (DEMs) to study sea level rise (SLR) and its expected impacts (Kulp and Strauss 2019). Researchers have relied on Digital Coast lidar data to study the statics and dynamics of coastal geology and geomorphologic and hydrologic change (Mitasova et al. 2011; Richards et al. 2018). For example, Digital Coast DEMs topographical data have been used to assess SLR-driven groundwater inundation risk and mitigation strategy in California (Hoover et al. 2017). Cooper and colleagues (2013) used lidar data from NOAA’s Coastal Services Center (a precursor to the OCM) and the US Army Corps of Engineers to estimate the socioeconomic impacts of not increasing coastal resilience under multiple scenarios of SLR in Maui, Hawaii, finding that the census-designated places of Kahului and Lahaina could see $18.7 million and $57.5 million land and building value impacts in a best-case SLR scenario of 0.75 meter rise, and $296 million and $394 million under a worst-case scenario of 1.9 meter rise, respectively.
The Digital Coast also provides training and guides for strategies involving natural infrastructure, a source of coastal resilience that has drawn increasing interest in recent years (Sutton-Grier et al. 2015). Natural infrastructure can have substantial cost-effectiveness, with Gulf Coast wetland and reef restoration having the potential to generate $7 in benefit per dollar spent (Reguero et al. 2018).

The Societal Value of the Digital Coast 13
3.2. Emergency PlanningDigital Coast data and tools can aid in emergency planning. For tsunami awareness and preparation, for example, the Digital Coast hosts the Tsunami Aware tool and further connects users to NOAA’s National Centers for Environmental Information (NCEI) and colocated World Data Service (WDS) for Geophysics through the Digital Coast Tsunami Data and Information portal. Dunbar and colleagues (2009) outline the ways in which NCEI/WDS provides support to tsunami forecasting, warning, education, research, and mitigation efforts. The authors cite the publicly accessible NCEI/WDS archive of global historical tsunami, earthquake, and volcanic eruption data, coastal water level data, and other auxiliary resources as essential for tsunami preparation work. This database has expanded with greater inclusion of post-tsunami survey data to the benefit of tsunami modeling (Arcos et al. 2019). Digital Coast data have also been directly used for assessment of tsunami and sea level rise risk to archaeological sites along the US coast, with one analysis from Hawaii finding significant risk to Hawaiian sites from a tsunami greater than that caused by the 2011 Tohoku earthquake (Johnson et al. 2015).
3.3. ConservationA core area of focus on the Digital Coast is data and information for the conservation of coastal ecosystems and resources. Conservation researchers have emphasized the need for scientific research and information-driven efforts at the ecosystem level that can be used at both small and large scales to improve long-term coastal management, for which the Digital Coast largely fits the role (Sherman 2000).
The Digital Coast has been used to identify the costs and trade-offs of shoreline armoring (OCM 2020c). Shoreline armoring and alteration are linked with significant loss and diminished resilience of sandy beach ecosystems (Kittinger and Ayers 2010). Economic research has shown that beach loss and land value changes in coastal communities pose a significant risk to local tourism revenue, with economic and socioeconomic growth being dampened because of reduced beach space and subsequent reduced rental rates (Alexandrakis et al. 2015). One US analysis has found that 1 meter of prevented sandy beach erosion increased oceanfront and inlet-front property values by $233 for the average property (Landry et al. 2003). But another study found substantially lower benefits: 5 miles of beach preservation had net benefits of only $4.45 per household (Huang et al. 2007).
Researchers have recognized the Digital Coast Sea Level Rise Viewer, Sea Level Affecting Marshes Model, and lidar data as important instruments for the conservation of estuarine areas with cobenefits that aid in the mitigation of climate change impacts (Flitcroft et al. 2018). The Estuary Data Mapper available on the Digital Coast has been used to assess the accuracy of varying satellite resolutions in measuring estuary water quality for the entire continental United States and for determining gaps in sensory coverage by noncommercial satellites (Schaeffer and Myer 2020). These tools have also been used to assist in the conservation and restoration of coastal wetlands, valuable ecosystems that provide many ecological benefits directly or indirectly to humans, including water filtration, fishery production, and sea level rise

Resources for the Future 14
impact protection for coastal communities. In Louisiana, marshes were estimated to generate water filtration capitalized cost savings in the range of $785 to $15,000 per acre compared with municipal water treatment (Breaux et al. 1995). Wetlands are also a large source of “blue carbon,” or aquatic carbon sequestered, with one Delaware-based study estimating a carbon sequestration value of $42,000 per acre of wetland per year (Carr et al. 2018). The same study found that the present value of expected losses in sequestration value could reach $2.16 billion for Delaware wetlands based on current wetland area erosion rates (Carr et al. 2018). Other benefits of coastal wetland and other ecosystem conservation include positive psychological and physiological effects on humans (Sutton-Grier and Sandifer 2019).
Case studies on the Digital Coast website outline the important role that coastal sand dunes play in protecting shorelines from flooding (OCM 2019, 2020h). These case studies sketch out the processes and resources used to execute successful dune restoration projects. Valuation work by Sigren and colleagues (2018) in the wake of Hurricane Ike in 2008 estimated the value of avoided property damage because of dunes to be $8,200 per homeowner, which totaled $8 million for the Texas coast study area. Further, the authors examined storm frequency over the prior 115 years in the study area and came to a value for vegetated dunes of $86,000 per hectare per year.
The Digital Coast has been used in multiple instances for the preservation of coastal seagrass beds (OCM 2020b,c). Seagrass provides an essential service to coastal fisheries and increases fish population density and growth, with analyses from Spain and Australia estimating benefits of seagrass to fisheries of over $1,000 per hectare (McArthur and Boland 2006; Tuya et al. 2014; Watson et al. 1993). When this vegetation is lost, the cost can be between $9,000 and $680,000 per hectare to restore or create new beds (Spurgeon 1999). Spurgeon (1999) also recognizes the multifaceted benefits of mangrove preservation and restoration, valued to exceed $9,000 (1997$) per hectare per year.
Coral reef conservation efforts have been improved through the application of Digital Coast tools such as OpenNSPECT, reducing coral damage stemming from water and sediment runoff (OCM 2020a,e). Reefs provide a wide range of benefits to coastlines, from tourism, diving, fishing, coastal protection, and nonuse value (defined as the amount people would be willing to pay for protection or improvement just for the knowledge that these resources were improved, over and above what they would pay for the enjoyment or economic rewards for use). In Hawaii alone, coral reefs provide $1.7 billion (2007$) in value annually, with $356 million coming from recreation and tourism to the state (Brander and van Beukering 2013; Cesar and van Beukering 2004). The value of ecosystem services that coral reefs provide to all US territories exceeds $3.4 billion (2007$) per year, meaning that even slight improvements to reef preservation efforts as a result of Digital Coast resources stand to generate large economic value domestically (Brander and van Beukering 2013).

The Societal Value of the Digital Coast 15
References
Alexandrakis, G., C. Manasakis, and N. A. Kampanis. 2015. Valuating the Effects of Beach Erosion to Tourism Revenue: A Management Perspective. Ocean & Coastal Management 111:1–11.
Arcos, N. P., P. K. Dunbar, K. J. Stroker, and L. S. L. Kong. 2019. The Impact of Post-Tsunami Surveys on the NCEI/WDS Global Historical Tsunami Database. Pure and Applied Geo-physics 176 (7): 2809–29.
Brander, L., and P. van Beukering. 2013. The Total Economic Value of US Coral Reefs: A Re-view of the Literature. Silver Spring, MD: NOAA Coral Reef Conservation Program.
Breaux, A., S. Farber, and J. Day. 1995. Using Natural Coastal Wetlands Systems for Wastewa-ter Treatment: An Economic Benefit Analysis. Journal of Environmental Management 44 (3): 285–91.
Carr, E. W., Y. Shirazi, G. R. Parsons, P. Hoagland, and C. K. Sommerfield. 2018. Modeling the Economic Value of Blue Carbon in Delaware Estuary Wetlands: Historic Estimates and Future Projections. Journal of Environmental Management 206:40–50.
Cesar, H. S. J., and P. van Beukering. 2004. Economic Valuation of the Coral Reefs of Hawai’i. Pacific Science 58 (2): 231–42.
Cooper, H. M., Q. Chen, C. H. Fletcher, and M. M. Barbee. 2013. Assessing Vulnerability Due to Sea-Level Rise in Maui, Hawai‘i Using LiDAR Remote Sensing and GIS. Climatic Change 116 (3–4): 547–63.
Dismukes, D. E., and S. Narra. 2018. Sea-Level Rise and Coastal Inundation: A Case Study of the Gulf Coast Energy Infrastructure. Natural Resources 9 (4): 150–74.
Dunbar, P. K., K. J. Stroker, V. R. Brocko, J. D. Varner, S. J. McLean, L. A. Taylor, B. W. Eakins, K. S. Carignan, and R. R. Warnken. 2009. Long-Term Tsunami Data Archive Supports Tsu-nami Forecast, Warning, Research, and Mitigation. In Tsunami Science Four Years after the 2004 Indian Ocean Tsunami, edited by P. R. Cummins, K. Satake, and L. S. L. Kong, 2275–91. Basel: Birkhäuser.
Flitcroft, R., P. Clinton, and K. Christiansen. 2018. Adding to the Toolbox for Tidal-Inundation Mapping in Estuarine Areas. Journal of Coastal Conservation 22 (4): 745–53.
Gibson, M., J. T. Mullins, and A. Hill. 2019. Climate Risk and Beliefs: Evidence from New York Floodplains. Williams College. February. https://web.williams.edu/Economics/wp/Gib-sonMullinsHill_ClimateRisk.pdf.
Hoover, D. J., K. O. Odigie, P. W. Swarzenski, and P. Barnard. 2017. Sea-Level Rise and Coastal Groundwater Inundation and Shoaling at Select Sites in California, USA. Journal of Hy-drology: Regional Studies 11:234–49.
Huang, J.-C., P. J. Poor, and M. Q. Zhao. 2007. Economic Valuation of Beach Erosion Control. Marine Resource Economics 22 (3): 221–38.
Johnson, A., L. Marrack, and S. Dolan. 2015. Threats to Coastal Archaeological Sites and the Effects of Future Climate Change: Impacts of the 2011 Tsunami and an Assessment of Future Sea-Level Rise at Hōnaunau, Hawai’I. Journal of Island and Coastal Archaeology 10 (2): 232–52.
Kittinger, J. N., and A. L. Ayers. 2010. Shoreline Armoring, Risk Management, and Coastal Resilience under Rising Seas. Coastal Management 38 (6): 634–53.
Kulp, S. A., and B. H. Strauss. 2019. New Elevation Data Triple Estimates of Global Vulnerability to Sea-Level Rise and Coastal Flooding. Nature Communications 10 (1): 1–12.

Resources for the Future 16
Landry, C. E., A. G. Keeler, and W. Kriesel. 2003. An Economic Evaluation of Beach Erosion Management Alternatives. Marine Resource Economics 18 (2): 105–27.
Linhoss, A. C., G. Kiker, M. Shirley, and K. Frank. 2015. Sea-Level Rise, Inundation, and Marsh Migration: Simulating Impacts on Developed Lands and Environmental Systems. Journal of Coastal Research 31 (1): 36–46.
Loftis, J. D., M. Mitchell, L. Atkinson, B. Hamlington, T. R. Allen, D. Forrest, T. Updyke, N. Tahvildari, D. Bekaert, and M. Bushnell. 2018. Integrated Ocean, Earth, and Atmospheric Observations for Resilience Planning in Hampton Roads, Virginia. Marine Technology Society Journal 52 (2): 68–83.
McArthur, L. C., and J. W. Boland. 2006. The Economic Contribution of Seagrass to Secondary Production in South Australia. Ecological Modelling 196 (1–2): 163–72.
Mitasova, H., E. Hardin, M. J. Starek, R. S. Harmon, and M. F. Overton. 2011. Landscape Dynam-ics from LiDAR Data Time Series. Paper presented at Geomorphometry 2011, Redlands, CA, May.
Neumann, J., D. Hudgens, J. Herter, and J. Martinich. 2011. The Economics of Adaptation along Developed Coastlines. Wiley Interdisciplinary Reviews: Climate Change 2 (1): 89–98.
OCM (Office of Coastal Management). 2019. Dune Restoration Increases Flood Protection and Access for Community.” NOAA OCM: Digital Coast. December 19. https://coast.noaa.gov/digitalcoast/training/cardiff-state-beach.html.
———. 2020a. Applying Green Infrastructure to Stem Runoff and Safeguard Corals in Puerto Rico. NOAA OCM: Digital Coast. April 30. https://coast.noaa.gov/digitalcoast/stories/playa-tamarindo.html.
———. 2020b. Assessing and Managing Prop Scar Damage to Seagrass in Texas. NOAA OCM: Digital Coast. May 7. https://coast.noaa.gov/digitalcoast/stories/propscars.html.
———. 2020c. Assessing Seagrass Vulnerability along Florida’s Gulf Coast. NOAA OCM: Digi-tal Coast. May 1. https://coast.noaa.gov/digitalcoast/stories/seagrass.html.
———. 2020d. Increasing Resilience in the San Francisco Bay Area through the Adapting to Rise Tides Program. NOAA OCM: Digital Coast. July 15. https://coast.noaa.gov/digital-coast/stories/rising-tides.html.
———. 2020e. Protecting Hawaiian Corals by Prioritizing Land Conservation Efforts. NOAA OCM: Digital Coast. April 23. https://coast.noaa.gov/digitalcoast/stories/hawaiian-cor-als.html.
———. 2020f. Using Lidar to Determine Bluff Recession Rates for Lake Erie. NOAA OCM: Digital Coast. April 28. https://coast.noaa.gov/digitalcoast/stories/lakeerie.html.
———. 2020g. Using Lidar to Plan for Sea Level Rise in Oregon. NOAA OCM: Digital Coast. July 15. https://coast.noaa.gov/digitalcoast/stories/oregon-dikes.html.
———. 2020h. Using Novel Approaches to Create Resilient Dune Systems Following Hurri-cane Maria. NOAA OCM: Digital Coast. March 6. https://coast.noaa.gov/digitalcoast/training/puerto-rico.html.
Rajapaksa, D., C. Wilson, S. Managi, V. Hoang, and B. Lee. 2016. Flood Risk Information, Actual Floods and Property Values: A Quasi‐experimental Analysis. Economic Record 92: 52–67.
Reguero, B. G., M. W. Beck, D. N. Bresch, J. Calil, and I. Meliane. 2018. Comparing the Cost Ef-fectiveness of Nature-Based and Coastal Adaptation: A Case Study from the Gulf Coast of the United States. PloS One 13 (4): e0192132.
The Societal Value of the Digital Coast 17
Richards, D., A. Milewski, and B. Gregory. 2018. Assessment of Southeastern Coastal Environ-ments Using Unmanned Aerial Vehicles (UAVs) and LiDAR. American Geophysical Union Fall Meeting Abstracts, G51C-0495.
Schaeffer, B. A., and M. H. Myer. 2020. Resolvable Estuaries for Satellite Derived Water Quality within the Continental United States. Remote Sensing Letters 11 (6): 535–44.
Sherman, K. 2000. Why Regional Coastal Monitoring for Assessment of Ecosystem Health? Ecosystem Health 6 (3): 205–16.
Sigren, J. M., J. Figlus, W. Highfield, R. A. Feagin, and A. R. Armitage. 2018. The Effects of Coastal Dune Volume and Vegetation on Storm-Induced Property Damage: Analysis from Hurricane Ike. Journal of Coastal Research 34 (1): 164–73.
Spurgeon, J. 1999. The Socio-Economic Costs and Benefits of Coastal Habitat Rehabilitation and Creation. Marine Pollution Bulletin 37 (8–12): 373–82.
Sussman, F., N. Krishnan, K. Maher, R. Miller, C. Mack, P. Stewart, K. Shouse, and B. Perkins. 2014. Climate Change Adaptation Cost in the US: What Do We Know? Climate Policy 14 (2): 242–82.
Sutton-Grier, A. E., and P. A. Sandifer. 2019. Conservation of Wetlands and Other Coastal Eco-systems: A Commentary on Their Value to Protect Biodiversity, Reduce Disaster Impacts, and Promote Human Health and Well-Being. Wetlands 39 (6): 1295–1302.
Sutton-Grier, A. E., K. Wowk, and H. Bamford. 2015. Future of Our Coasts: The Potential for Natural and Hybrid Infrastructure to Enhance the Resilience of Our Coastal Communi-ties, Economies and Ecosystems. Environmental Science & Policy 51:137–48.
Tuya, F., R. Haroun, and F. Espino. 2014. Economic Assessment of Ecosystem Services: Mon-etary Value of Seagrass Meadows for Coastal Fisheries. Ocean & Coastal Management 96:181–87.
Watson, R. A., R. G. Coles, and W. J. L. Long. 1993. Simulation Estimates of Annual Yield and Landed Value for Commercial Penaeid Prawns from a Tropical Seagrass Habitat, North-ern Queensland, Australia. Marine and Freshwater Research 44 (1): 211–19.
Willis, H. H., A. Narayanan, J. R. Fischbach, E. Molina-Perez, C. Stelzner, K. Loa, and L. Kend-rick. 2016. Current and Future Exposure of Infrastructure in the United States to Natural Hazards. Santa Monica, CA: RAND.

Resources for the Future 18
4. Web Content AnalysisThe Digital Coast is a resource hub for a wide range of coastal geospatial applications, cataloging tools and datasets from a variety of sources, including NOAA. Resources included on the website meet a set of criteria to ensure quality and consistency. With an emphasis on “actionable information,” these criteria include application specificity (a clear use), maintenance standards, authoritative data, open access (no use restrictions or prohibitive licensing), and broad geographic applicability. This section provides information on the tools and datasets available through the Digital Coast website, including the breadth of topics covered and the breakdown of OCM versus non-OCM products.
The Digital Coast Partnership, which helps provide insight on their members’ data, information, and training needs, consists of eight national organizations in addition to NOAA. The missions of these organizations include the management and restoration of coastal habitats and communities. Additionally, approximately 800 contributing Digital Coast partners provide datasets or tools developed independently or with other organizations.
This section considers four ways that the Digital Coast provides value. One source of value is as a data and tools hub: the Digital Coast serves as a one-stop shop for curated tools and data positioned to address key coastal issues, saving users time and money in meeting their analytical needs. The inclusion of a larger number of tools and datasets yields higher overall value, as long as they are well organized. Without a survey exploring the value users place on this hub function, however, we can only describe the size of the hub and its characteristics.
A second, related source of value is ease of use. The easier a tool or dataset is to use, the more time and money it saves. We describe the different platforms for using Digital Coast products in section 4.2.2.
A third source of value is the breadth of topics considered. The broader the number of issues and metrics covered in the Digital Coast, the more opportunity there is for what economists term “network externalities”: while looking for data and tools to address one issue, users are exposed to ancillary products that may enhance their overall understanding of the issue at hand. Again, we cannot value this benefit without a survey, but we can describe the topical breadth of the Digital Coast.
A similar idea, the fourth source of value, concerns the geographic dimension. A user may come to the site with a narrow geographic focus and realize through exposure to other products with broader or adjacent geographies that their consideration will enhance the analysis to be conducted.
The extent to which these sources of value can be attributed to the Digital Coast is uncertain, however. With a budget of $5 million annually, the Digital Coast team works to develop its own tools and datasets, acquire others, organize the site, conduct trainings, and initiate additional activities that create user value, as we discuss

The Societal Value of the Digital Coast 19
elsewhere in this report. When comparing estimated value provided with its budget, we need to be careful about attributing value to the Digital Coast versus to the tools and datasets provided by others. In this context, the Digital Coast platform provides value in the form of time savings to users in locating the desired tools or datasets by serving as a hub for other resources. However, the value that the resources provide to users on the ground cannot be attributed to the Digital Coast directly. While we cannot make precise calculations of attribution shares, we can describe the distribution of datasets and tools on the site by agency.
4.1. MethodsWe evaluated the inventories of datasets and tools available on the Digital Coast website using information associated with each item. Consistent organization and layout of the website facilitated this analysis. We were interested in how datasets and tools were categorized, as well as the composition of contributors. We collected information from the Digital Coast website in January and February 2020, copying it from the website in bulk and formatting it using Microsoft Word and Excel. Data were analyzed using STATA.
We categorized each dataset and tool by the makeup of its contributors using five provider groups, listed below.
1. OCM only: The only dataset provider is NOAA’s Office for Coastal Management (OCM).
2. OCM with partners: The dataset has multiple providers, including OCM. Partners can include other NOAA agencies.
3. NOAA only: The only dataset provider is a NOAA office other than OCM.
4. NOAA with partners: The dataset has multiple providers, including a NOAA office other than OCM.
5. Non-NOAA: The dataset is provided by one or more organizations other than a NOAA office.
In addition, we identified partner types for each dataset and tool provided by a partner other than, or in combination with, NOAA. These types are nongovernmental organizations (NGO), private, federal, county, state, city, academia, and tribal. Partner types were collected from the Digital Coast Contributing Partners page on February 20, 2020.
4.1.1. Datasets
We organized and examined datasets across three variables: provider group, partner type, and dataset type. The Digital Coast website allows users to filter datasets by dataset type, non–mutually exclusive categories to assist in filtering and identifying datasets: elevation; imagery; land cover; ocean uses and planning areas; economic and demographic; marine habitat and species; boundaries; weather, climate, and hazards; water quality; shoreline and surface water; infrastructure; and oceanographic.
Resources for the Future 20
4.1.2. Tools
In addition to provider group and partner type, we identified six variables across which to evaluate tools: geography, tool type, data type, focus area, platform, and user time commitment. We modified the geography variable shown on the tool web page to focus on scope within the United States rather than specific regions but collected other variables as-is from the web page. The tool type variable categories (analysis, reporting, visualization, learning) describe a tool’s purpose and are not mutually exclusive. The data type variable categories (benthic, socioeconomic, elevation, weather, imagery, jurisdictions, land cover, ocean uses planning) describe the tool’s underlying data and also are not mutually exclusive. Focus area categories (coastal conservation, climate adaptation, coastal economy, coastal hazards, community resilience, green infrastructure, land use planning, ocean planning, and water quality) allow users to filter tools by topic area and are not mutually exclusive. The platform variable describes the hardware required to run the tool: web-based tools run on a browser, desktop tools require specific software, and mobile tools can run on small electronic devices. Finally, the Digital Coast lists user time commitment estimates for each tool: 15, 30, 45, or 60 minutes. This variable approximates tool time intensity and interface complexity.
4.2. Results
4.2.1. Datasets
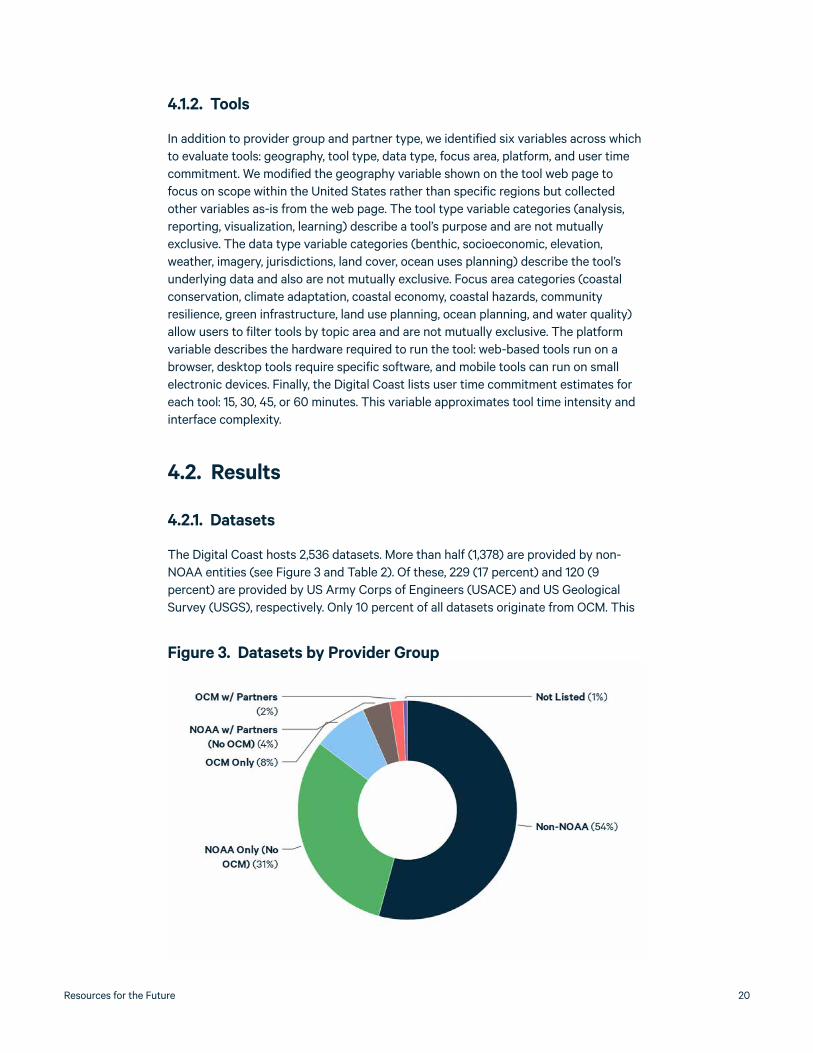
The Digital Coast hosts 2,536 datasets. More than half (1,378) are provided by non-NOAA entities (see Figure 3 and Table 2). Of these, 229 (17 percent) and 120 (9 percent) are provided by US Army Corps of Engineers (USACE) and US Geological Survey (USGS), respectively. Only 10 percent of all datasets originate from OCM. This
Figure 3. Datasets by Provider Group

The Societal Value of the Digital Coast 21
is a positive value because so many agencies have contributed to the Digital Coast hub, but attribution of this value to the Digital Coast team is limited because so many of the products originate outside of the team.
Figure 4 shows the heavily skewed breadth of dataset type by provider group. Of all datasets, 1,146 (41 percent) and 881 (32 percent) are of elevation and imagery, respectively, together accounting for nearly three-quarters of all datasets. These data types tend to be large in terms of data storage and small in terms of geographic scope, accounting for their relative abundance. As shown in Figure 4, most of the non-NOAA datasets are of elevation. About a third of all datasets are provided by NOAA offices other than OCM, with no outside partners. Figure 4 shows that 624 (71 percent) of these are imagery datasets. The primary source of imagery datasets is NOAA’s National Geodetic Survey (NGS), providing 595 (68 percent).
Figure 4. Datasets by Provider Group and Dataset Type
200
Elevation Imagery LandCover
Ocean Uses,
Planning
Econ.,Demo-graphic
MarineHabitat,Species
Bound-aries
Weather,Climate,
Haz.
Water Qual.
Shoreline,SurfaceWater
Infra. Oceano-graphic
16 0 0 0 0 0 0 0 0 0 0 0
958 187 31 128 105 64 47 18 5 7 7 0
45 41 0 9 0 1 0 12 11 1 0 1
90 624 19 28 1 26 7 15 0 6 0 3
13 1 0 0 46 1 0 1 0 0 0 0
24 28 128 0 1 3 3 8 2 3 0 0
400
600
800
1,000
Non-NOAA
NOAA w/Partners (No OCM)
NOAA Only (No OCM)
OCM w/Partners
OCM Only
Not Listed
Resources for the Future 22
The OCM is the source of 258 (10 percent) of all datasets. Most of these (196, 76 percent) are provided by the OCM only, with no partners. The majority (128, 65 percent) of datasets provided by the OCM alone are of land cover. The OCM is the primary source of land cover data in the Digital Coast, providing various products of the OCM’s Coastal Change Analysis Program (C-CAP).
As a high-resolution land cover product covering all US coasts, the C-CAP is important for evaluating and planning coastal land use change. It has a well-documented methodology, contains highly detailed wetland classes, and is comparable across regions. It is particularly powerful when used in conjunction with other products that do not necessarily originate from the OCM, such as for sea level rise impacts to wetlands along California’s coast with the non-NOAA tool Our Coast, Our Future flood map. By providing access to both resources on one platform, the Digital Coast can facilitate such an analysis and leverage the benefits generated.
Nearly 80 percent of all datasets fall under three data types: elevation, imagery, and land cover. Given the importance of elevation and imagery information for both coastal management and emergency preparedness and response, the Digital Coast provides an important service by offering user-friendly access to these datasets, which generally are hosted by federal entities other than OCM, such as USACE, USGS, and NOAA’s NGS. The Data Access Viewer is an online map interface enabling exploration of all three of these data types, increasing the likelihood of network synergies between non-NOAA data sources of elevation and imagery and OCM’s C-CAP. While other data types are easily toggled in the main dataset search interface, thereby affording users easy navigation between them, they are not as geospatially linked to each other as the three main data types in the Data Access Viewer.
Regarding partnerships, only 151 (6 percent) of all datasets on the Digital Coast come from collaborations between NOAA offices and outside organizations. Of the 136 datasets with an identifiable number of partners (listed partners are not coalitions or plural “agencies”), 85 (63 percent) consist of a NOAA office plus one partner, while 46 (34 percent) consist of a NOAA office plus two partners. Within the 62 datasets provided by OCM with partners, 17 individual partners participate 83 times across datasets (Table 2).
The OCM most frequently partners with other federal agencies to provide datasets. Most of the partnerships are with demographic or statistical federal agencies that are sources of geospatial boundaries and tables associated with various coastal community demographic data items (46 of the 62 datasets [74 percent] are of the economic and demographic dataset type). This reengineering of raw demographic data from sources outside of OCM to suit the needs of coastal managers facilitates their applications to socioeconomic concerns in coastal regions, adding value attributable to the Digital Coast.

The Societal Value of the Digital Coast 23
Table 2. Participating Partners of OCM-Provided Datasets
Participating Partner Partner Type CountPercentage of
Datasets
US Census Bureau Federal 26 31
Bureau of Economic Analysis Federal 13 16
Bureau of Labor Statistics Federal 13 16
US Geological Survey Federal 12 14
Cook County, Georgia County 2 2
Georgia Department of Natural Resources State 2 2
Tift County, Georgia County 2 2
City of Valdosta, Georgia City 2 2
California Coastal Conservancy State 2 2
Apalachicola Bay National Estuarine Research Reserve State 2 2
Guam Government Federal 1 1
US Department of Agriculture Federal 1 1
NOAA National Marine Sanctuary Program Federal 1 1
National Aeronautics and Space Administration Federal 1 1
NOAA National Climatic Data Center Federal 1 1
NOAA National Weather Service Federal 1 1
US Department of Agriculture National Cooperative Soil Survey Federal 1 1
Total 83 100
Resources for the Future 24
4.2.2. Tools
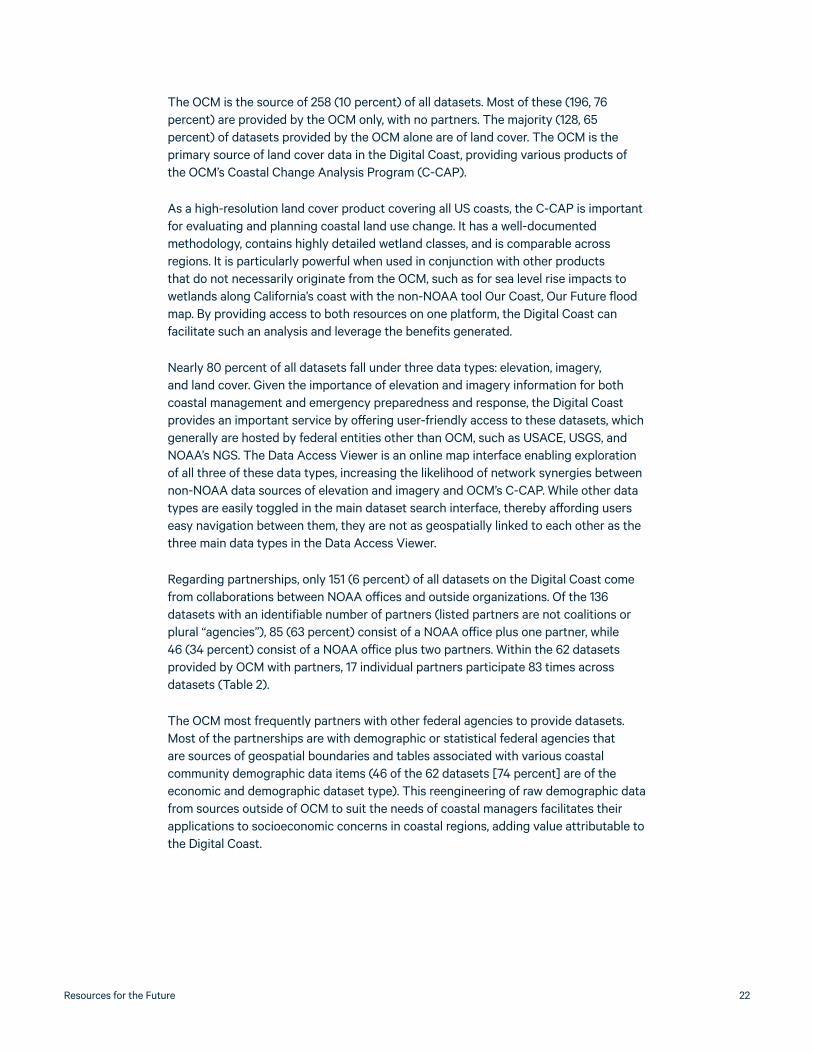
The Digital Coast provides access to and information about 70 tools, which are evenly split between those from NOAA and non-NOAA entities (Figure 5). Again, we observe that the Digital Coast is harmonizing access to its own tools with access to vetted tools from other entities, which affords users a different but complementary set of benefits. Digital Coast tools are developed to meet needs not adequately addressed with existing tools.
Of the tools provided by entities other than NOAA (35), 37 percent (13) are from the US Environmental Protection Agency (EPA; 7), USGS (5), or both (1). The remaining tools (22) come from a diverse suite of entities, including nongovernmental organizations (NGOs) (9), federal agencies (7), academia (4), and private organizations (2).
Half (35) of the tools are provided by NOAA. About a third (22/70, 31 percent) of all tools are from OCM; these are split about evenly between tools from OCM only (12) and tools from OCM with partners (10). While this represents a greater share than with datasets, which is only 10% (258/2,536), there is the same implication that the attribution of value from tools to the Digital Coast is limited to this minority subset.
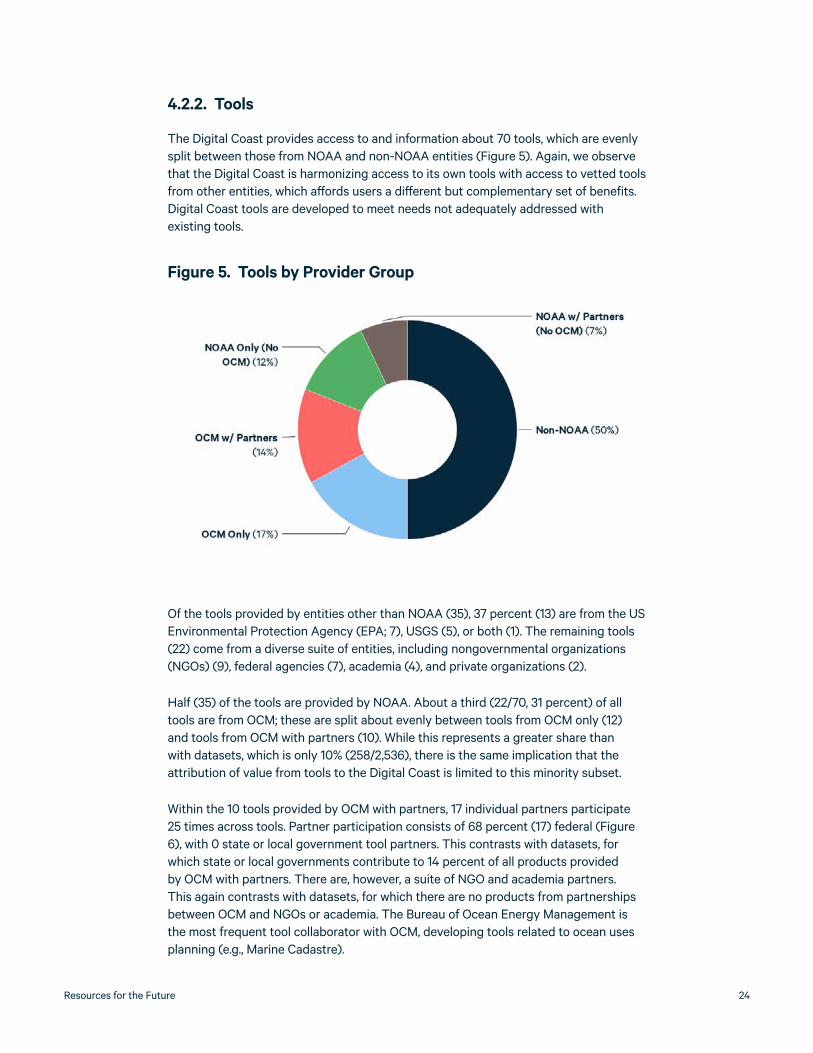
Within the 10 tools provided by OCM with partners, 17 individual partners participate 25 times across tools. Partner participation consists of 68 percent (17) federal (Figure 6), with 0 state or local government tool partners. This contrasts with datasets, for which state or local governments contribute to 14 percent of all products provided by OCM with partners. There are, however, a suite of NGO and academia partners. This again contrasts with datasets, for which there are no products from partnerships between OCM and NGOs or academia. The Bureau of Ocean Energy Management is the most frequent tool collaborator with OCM, developing tools related to ocean uses planning (e.g., Marine Cadastre).
Figure 5. Tools by Provider Group
The Societal Value of the Digital Coast 25
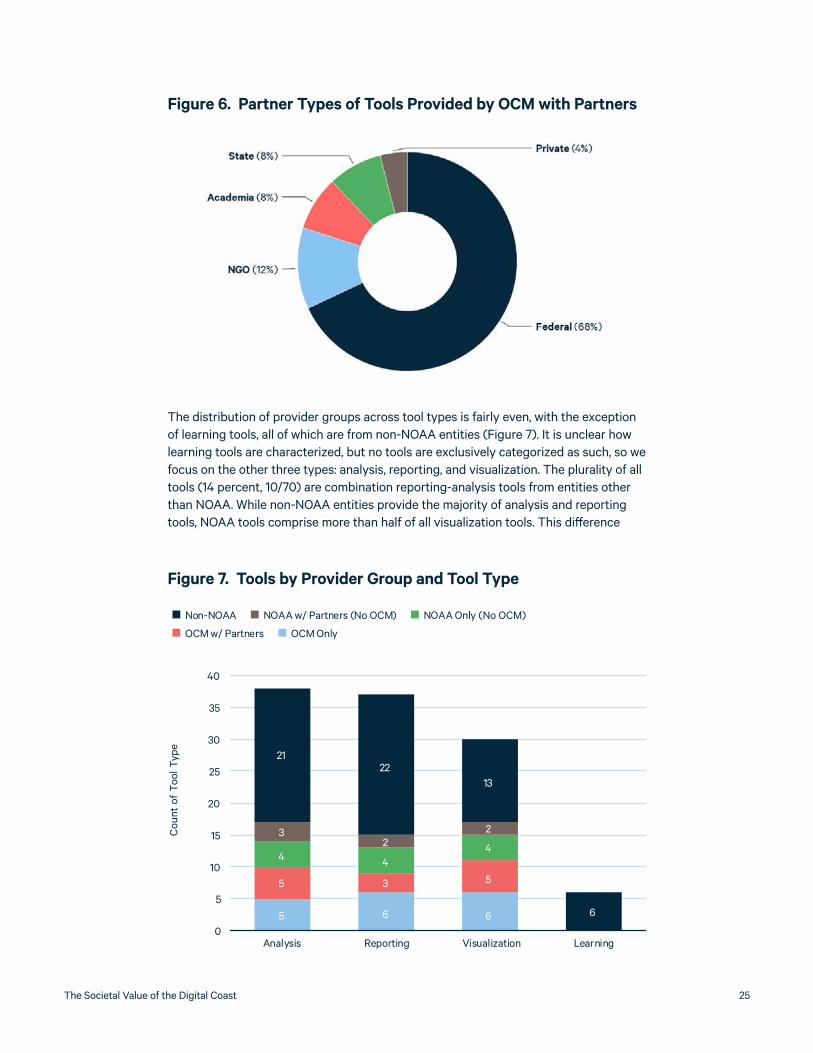
The distribution of provider groups across tool types is fairly even, with the exception of learning tools, all of which are from non-NOAA entities (Figure 7). It is unclear how learning tools are characterized, but no tools are exclusively categorized as such, so we focus on the other three types: analysis, reporting, and visualization. The plurality of all tools (14 percent, 10/70) are combination reporting-analysis tools from entities other than NOAA. While non-NOAA entities provide the majority of analysis and reporting tools, NOAA tools comprise more than half of all visualization tools. This difference
Figure 6. Partner Types of Tools Provided by OCM with Partners
Figure 7. Tools by Provider Group and Tool Type
0
5
10
15
20
25
30
35
40
Analysis Reporting Visualization Learning
2122
13
6
32
2
4 44
5 3 5
5 6 6
Cou
nt o
f To
ol T
ype
Non-NOAA NOAA w/ Partners (No OCM) NOAA Only (No OCM)
OCM w/ Partners OCM Only

Resources for the Future 26
Figure 8. Tools by Provider Group and Data Type
0
5
10
15
20
25
30
Land C
over
Elevati
on
Socioec
on.
Benth
ic
Weath
er
Ocean U
ses
Planning
Imag
ery
Jurisdict
ions
19
10
16
7
9 4
5
4
2
1
1
1
1
4
4
3
2
1
1 6
1
2
1
61
1
75 5
2 2
Cou
nt o
f Dat
a Ty
pe
Non-NOAA NOAA w/ Partners (No OCM) NOAA Only (No OCM)
OCM w/ Partners OCM Only
Figure 9. Tools by Provider Group and Focus Area
0
5
10
15
20
25
30
35
1416 16 18
11
1010
5
9
41
2
1
15 4
3 34
3 2
24
34
1
2
16
15
75
85
35
2 3
Cou
nt o
f Foc
us A
rea
CoastalCons.
CoastalHazards
Comm.Resilience
OceanPlanning
WaterQuality
GreenInfra.
Land UsePlanning
CoastalEconomy
ClimateAdapt.
Non-NOAA NOAA w/ Partners (No OCM) NOAA Only (No OCM)
OCM w/ Partners OCM Only
The Societal Value of the Digital Coast 27
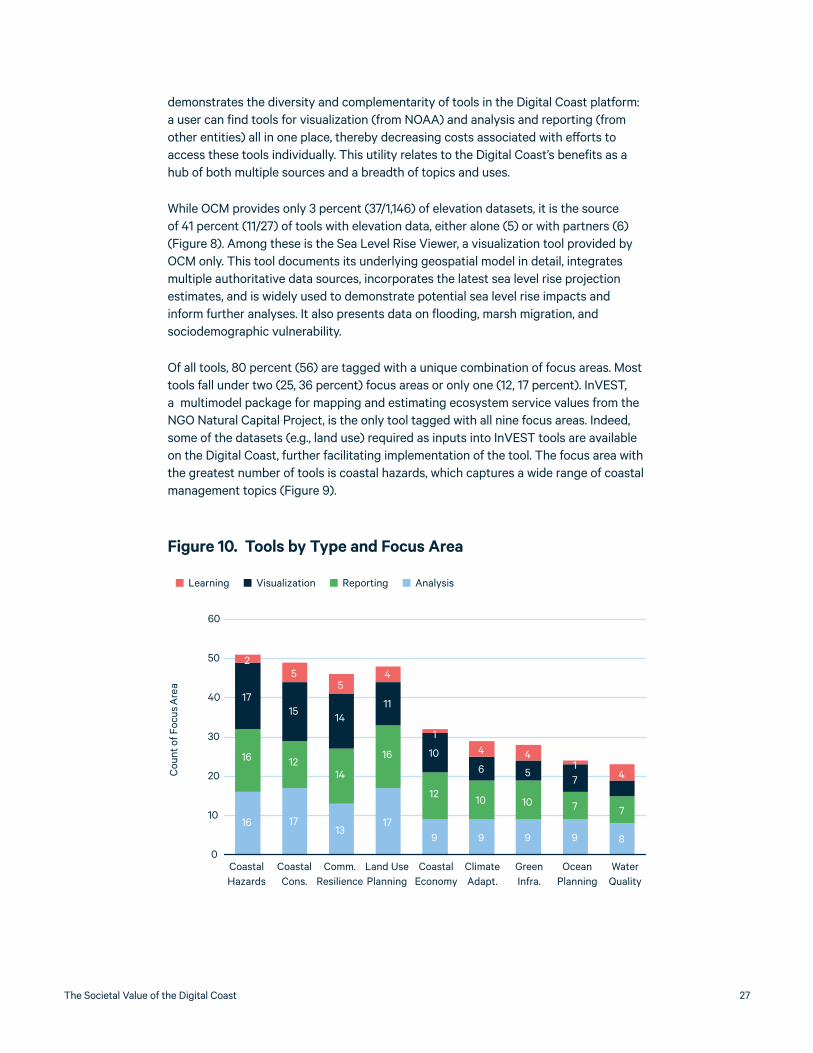
demonstrates the diversity and complementarity of tools in the Digital Coast platform: a user can find tools for visualization (from NOAA) and analysis and reporting (from other entities) all in one place, thereby decreasing costs associated with efforts to access these tools individually. This utility relates to the Digital Coast’s benefits as a hub of both multiple sources and a breadth of topics and uses.
While OCM provides only 3 percent (37/1,146) of elevation datasets, it is the source of 41 percent (11/27) of tools with elevation data, either alone (5) or with partners (6) (Figure 8). Among these is the Sea Level Rise Viewer, a visualization tool provided by OCM only. This tool documents its underlying geospatial model in detail, integrates multiple authoritative data sources, incorporates the latest sea level rise projection estimates, and is widely used to demonstrate potential sea level rise impacts and inform further analyses. It also presents data on flooding, marsh migration, and sociodemographic vulnerability.
Of all tools, 80 percent (56) are tagged with a unique combination of focus areas. Most tools fall under two (25, 36 percent) focus areas or only one (12, 17 percent). InVEST, a multimodel package for mapping and estimating ecosystem service values from the NGO Natural Capital Project, is the only tool tagged with all nine focus areas. Indeed, some of the datasets (e.g., land use) required as inputs into InVEST tools are available on the Digital Coast, further facilitating implementation of the tool. The focus area with the greatest number of tools is coastal hazards, which captures a wide range of coastal management topics (Figure 9).
Figure 10. Tools by Type and Focus Area
0
10
20
30
40
50
60
25
54
14 4
14
1715
1411
106 5
74
16 1214
16
12 10 10 7 716 17
1317
9 9 9 9 8
Cou
nt o
f Foc
us A
rea
Learning Visualization Reporting Analysis
CoastalCons.
CoastalHazards
Comm.Resilience
OceanPlanning
WaterQuality
GreenInfra.
Land UsePlanning
CoastalEconomy
ClimateAdapt.

Resources for the Future 28
Figure 11. Tool Platforms by Provider Group
0
5
10
15
20
25
30
35
40
45
50
Web Desktop Mobile
3
2
6
2
8
29
3
Cou
nt o
f D
ata
Plat
form
22
12
1
Non-NOAA NOAA w/ Partners (No OCM) NOAA Only (No OCM)
OCM w/ Partners OCM Only
Figure 12. Tool Time Commitment Requirement by Provider Group
0
5
10
15
20
25
30
35
40
About 15 min About 30 min About 45 min About 60 min
15
10
8
2
2
3
5
21
6
3 19
1 1 1
Cou
nt o
f Ti
me
Com
mit
men
t
Non-NOAA NOAA w/ Partners (No OCM) NOAA Only (No OCM)
OCM w/ Partners OCM Only

The Societal Value of the Digital Coast 29
The distribution of tool types across focus areas (Figure 10) demonstrates an even availability of tools for each possible combination of focus area and tool type, exposing users to a diverse range of use cases along the planning process. The Digital Coast provides opportunity for ancillary applications within the same issue or vice versa, demonstrating the breadth of topics value.
We find that the majority of tools are web-based (Figure 11). While NOAA offices and partners provide the greatest number of web-based tools, non-NOAA offices tend to submit tools that require desktop platform software. This distribution supports a range of users with varying technical needs and capabilities.
Table 3. Mean User Time Commitment by Platform
PlatformMean Time
Commitment (min.)Count
Percentage of All Tools
Desktop 40 21 30
Web 19 48 69
Mobile 30 1 1
Overall 26 70 100
Figure 13. US Geography Tools

Resources for the Future 30
More than half of all tools (37, 53 percent) require the minimum user time commitment of 15 minutes. Tools provided by NOAA and partners account for 59 percent (22) of these (Figure 12). As might be expected, web tools require less user time commitment, about half that of desktop tools, on average (Table 3).
By offering a suite of tools with varying ease-of-use levels, the Digital Coast lowers barriers for users with limited time, expertise, and technical capacity to explore issues, while also offering advanced solutions for users with more resources. Web-based tools with relatively low user time commitments serve as minimal-cost avenues for issue and data exploration, the scoping phase of a planning problem. These tend to be NOAA-provided tools (60 percent, 21/35) but also include many non-NOAA tools. Another advantage of this ease-of-use distribution is that after users have scoped planning problems with easy-to-use tools, they can identify more robust tools addressing the same issue and take advantage of the related tools links, all on the Digital Coast website.
Regarding geography tools, 84 percent (59) are at the national scale, which is consistent with the Digital Coast’s content criteria preferring large-area coverage (Figure 13). Half of these (53 percent, 31) are from NOAA offices, while tools focusing on the Gulf of Mexico and east and west coasts tend to come from non-NOAA entities (Figure 14). Tools covering the Great Lakes are evenly split between NOAA and other organizations. Except for one (Gulf TREE, which is on desktop), all subnational regional tools are web tools from a range of provider groups.
Figure 14. Tools by Provider Group and US Geography
0
5
10
15
20
25
30
35
Coastal,National
National GreatLakes
Gulf ofMexico
Coastal,East
Coastal,West
PacificIslands
11
17
22
12
2
2
1
6
1
1
7
21
8
3 1
Cou
nt o
f To
ols
by G
eogr
aphy
Non-NOAA NOAA w/ Partners (No OCM) NOAA Only (No OCM)
OCM w/ Partners OCM Only
The Societal Value of the Digital Coast 31
Although the Digital Coast’s criteria allow for state and local tools that are “applicable to other geographies,” we find only one state-level tool (Our Cast, Our Future flood map in California) among the 11 subnational tools. This relatively small supply of subnational tools limits the potential for planners to explore and identify uses for state-specific tools. For example, Oregon’s Estuary Planning Tool (which is not a Digital Coast tool) could complement, inform, or substitute for the Estuary Data Mapper (EPA) or the West Coast Estuaries Explorer (Pacific Marine and Estuarine Fish Habitat Partnership). The Oregon tool is a relatively easy-to-use web-based tool with a mix of state and national-level estuary and planning data, while the EPA tool is a more time-intensive desktop platform and the West Coast Estuaries Explorer omits relevant land use planning data. Although there is likely some overlap among these three tools, they appear to meet different sets of user needs.
4.3. DiscussionThis evaluation has demonstrated that the Digital Coast provides users streamlined access to datasets and tools covering a wide range of uses, technicality, and sources. The Digital Coast team’s evaluation of datasets and tools in meeting criteria for inclusion on the website saves users valuable time not only in searching for these resources but also in authenticating their relevance and quality.
While the proportion of datasets and tools actually developed by partnerships between NOAA and non-NOAA entities is small, the practical effort required to screen and organize information for non-NOAA datasets and tools implies that all those from non-NOAA entities presented through the Digital Coast reflect a coordinated collaboration facilitated by the platform. This organization generates benefits from use of the dataset that are additional to the dataset by itself.
4.3.1. Recommendation
The significant scope and depth of datasets and tools available on the Digital Coast website makes it a powerful resource for coastal managers. Allowing sorting by variables such as focus area or data type facilitates the search for relevant items. However, the disjointed search interface may make it challenging for some users to identify a cohesive set of items to address a specific question. The topics pages organize datasets, tools, communication guidance, stories, and training by specific issues. Integrating items into coherent subject areas assists in comprehension and practical application in specific places and contexts.
We believe the model set by the topics pages could be leveraged to further facilitate use of Digital Coast resources by coastal managers. The Digital Coast could offer an illustrative, interactive, and expanded version of the topics page. Such an interface would give planners a place to start, providing both a road map and analytical components in one place. An interactive illustration of the coastal management problem, not unlike the USGS water cycle diagram for students, could demonstrate the interconnectedness of coastal issues and help users visualize and identify the
Resources for the Future 32
independent planning problems facing their communities. Individual ecosystem services and other topics could be expanded, with relevant Digital Coast resources linked in an interactive pop-up.
This interface could also incorporate guidance from the Coastal Planning Advisor. While it is no longer available, we believe its content outlining decisionmaking procedures relevant to coastal planning problems could still serve Digital Coast users.
Organizing items in such a way could potentially allow the Digital Coast to broaden its criteria for relevant items. For example, the Digital Coast generally favors datasets and tools that have a broad geographic scope. But by outlining problems in greater detail, links to regional or local data sources and tools could be incorporated without encumbering the existing library.

The Societal Value of the Digital Coast 33
5. Case Study Selection With so many products, datasets, and trainings available on the Digital Coast website, it is not possible to comprehensively evaluate all the benefits to society that they provide. However, by employing a case study approach to go deep into the use of a few popular products, such as the Sea Level Rise Viewer, we can get a sense of how large the benefits of certain common uses of the Digital Coast are.
This section details our methodology in searching for and ultimately choosing two case studies. We present the case studies in section 6, and then in section 7, we discuss some case study candidates that were not ultimately chosen but provide insights about how the Digital Coast resources are frequently used.
5.1. Criteria for Case Study ChoicesWe tried to find cases that met as many of the following criteria as possible, while recognizing that these criteria represent an ideal case study and that most cases would likely not meet all these conditions:
• The case should be either a locationally distinct community, with clear geographic boundaries for direct impacts, or a business entity.
• The community or business should use specific Digital Coast products to undergird its activities.
• The case should highlight popular Digital Coast products, both to lend an outsize importance to the case study and to aid in generalizability. Relatedly, the reason the products were used needs to be compelling. For instance, we found that many communities are using the Sea Level Rise Viewer and the maps it produces to facilitate planning processes, such as vulnerability assessments, in preparation for expected rising oceans as a result of climate change.
• A clear line of causation should exist between the use of the products and changes in outcomes on the ground, such as building seawalls, changing zoning requirements, and reducing the Federal Emergency Management Agency (FEMA) Community Rating System class for defining flood insurance premiums. Importantly, this change on the ground could be either historical or expected. It was difficult to find case study examples where change had already occurred, but in some cases change was close enough to implementation that we felt confident we could catalog the likely impacts.
• The case should be “clean,” where attribution from the Digital Coast product to its value would be reasonably clear and compelling.
• The community or business should have a willing point person familiar with all aspects of the case.
• A written record should exist of at least some of the steps from use of the Digital Coast product to change on the ground.
• We also considered cases in which the outcomes were ultimately the same but the timeline of action was expedited.
Resources for the Future 34
5.1.1. Process
To choose cases to develop, we worked hand in hand with OCM’s Digital Coast staff, who have deep and broad familiarity with the use of the platform’s products. This familiarity comes from many venues, including the stories that users post on the website; workshops, conferences, and trainings held by the Digital Coast office; and regular communication with both users and contributing partners to the tools. We examined statistics drawn from the Digital Coast’s 2015 “Projected Benefits and Costs of the Digital Coast” report and website downloads and trainings for reported usage to identify its most popular products.
Next, OCM provided us with a list of several candidates for case studies, compiled by office staff. We followed up on this list by interviewing representatives with knowledge of the application of Digital Coast products to effect change and then making a determination about the likelihood of a particular potential case yielding the information we would need to do a clean case study.
After narrowing down the list, we followed up with NOAA’s contacts for each case to conduct a preliminary interview call. While many cases seemed promising, ultimately we ran into issues with most and were unable to pursue them. The most common issue was a lack of clear attribution of changes in decisionmaking as a result of the use of Digital Coast products. Since most tools provided by the Digital Coast are planning tools, many of the uses we observed were for planning purposes but had not yet resulted in changes on the ground, thus rendering a case study unusable for our purposes. We worked with OCM to explore other options and ultimately decided on the two cases highlighted in section 6.
5.1.2. Methods
Once we selected specific case studies, we analyzed each case regarding the following issues. Notably, these methods apply to the first case study on a direct use of Digital Coast products. The trainings case study was conducted slightly differently, as its purpose was to estimate the market value of the trainings by comparing them with other trainings on the market.
1. Causal Chain/Flow Chart
The first step was to develop a causal chain of events or milestones linking the original use of the Digital Coast product to change on the ground. This flow chart helped us attribute responsibility for the changes to the Digital Coast product and describe the progression of events leading to the product’s social value.
2. Attribution
Attributing value to a Digital Coast product is generally highly complex and resolvable only based on the judgment of people involved in the case. Imagine that the Sea Level Rise Viewer is used at community meetings to build support for creation of a general development plan or vulnerability assessment, prior

The Societal Value of the Digital Coast 35
to zoning changes, and the infrastructure investments that result from the plan’s implementation. Surely, many more inputs to this process than the viewer itself led to these on-the-ground outcomes. In this situation, what percentage of the value of those outcomes (say, in terms of reducing risks of damage to a community’s housing stock, streets, and the like) is attributable to the Digital Coast product being used at the beginning of the process?
In economic and system dynamics, there is no analytical solution to this problem. Therefore, for each case, we relied on interviews and expert judgment to make decisions about a reasonable attribution to the use of Digital Coast products.
3. Counterfactual
As discussed in section 2, defining the counterfactual is a key element in the VOI analysis. The benefit of a Digital Coast product is only measurable against how some alternative product or process would have been used and delivered change in outcomes if the Digital Coast product were unavailable. In practice, we would ask the local representative what would have happened had the Digital Coast product not been available and defined that as the counterfactual. The counterfactual is imprecise and typically based on users’ opinions. Consequently, we tried to vary our counterfactual assumptions to account for uncertainty.
4. Valuation
Section 2 provided an extensive discussion on valuing information. Here we just quickly review the valuation issues pertinent to the case studies. There are several general pathways to create value covered by the possible case studies.
a. Time Savings
If Digital Coast products advance processes that lead to an expedited implementation of value-creating outcomes, then the time saved can be addressed in two ways. The first is simply the time the staff and other participants save by using a faster process, typically valued at the wage rate. The second is the value of the ultimate outcomes occurring sooner. If the ultimate outcome were a flood wall and it is built six months sooner than it otherwise would have been because of a planning process speeded by using a Digital Coast product, the benefit is the value of the expected damages avoided because the wall went in more quickly.
b. Administrative Savings
Some benefits are realized through administrative processes that carry their own values. For instance, insurance premiums under FEMA’s floodplain management system are determined administratively. If Digital Coast products help move a community to a lower class, insurance premiums are lower. This lower premium is surely somewhat related to lower damage risks and, to that extent, carries a social welfare benefit that is not merely an administrative value.
Resources for the Future 36
c. Better Outcomes
Valuing outcomes was discussed extensively in section 2.
d. Scaling/Generalizing
All case study analyses suffer from a generalizability problem. Since the values came from a specific case study, it was never immediately clear how applicable such estimates would be to other situations (i.e., other communities and other businesses) where the specifics are different.
In our case studies, we endeavor to apply our results more broadly by creating unit values of information and then transferring the unit. The units can be defined in any number of ways to facilitate transfers. In the community case, larger communities, in terms of population or housing structures, would feature higher total benefits from any given flood control measures (assuming the measures themselves would not need to be scaled to the larger community). Thus a dollars-per-person or dollars-per-housing unit metric might work well to scale to other communities. Such metrics would be applied to other communities that we know used Digital Coast products and could have similar outcomes to the studied community.
References
OCM. 2015. Projected Benefits and Costs of the Digital Coast. April. https://coast.noaa.gov/data/digitalcoast/pdf/benefits-costs.pdf.

The Societal Value of the Digital Coast 37
6. Case StudiesThis section presents our findings from the two case studies that we conducted. The first case was highlighted in the stories section of the Digital Coast website regarding the Jackson County (Mississippi) Utility Authority using the platform’s Sea Level Rise Viewer and Coastal Flood Exposure Mapper to guide decisions on relocating and consolidating three wastewater treatment plants in order to avoid future flooding impacts from storm surge.
The second case study looks in depth at two in-person trainings from the Digital Coast Academy, Building Risk Communication Skills and Planning and Facilitating Collaborative Meetings, and compares each with similar private sector trainings to estimate the market value of each course. Then we extrapolate our findings to estimate a value for all the in-person courses offered by the Digital Coast Academy.
6.1. Jackson County (Mississippi) Utility Authority Case Study
6.1.1. Background
In 2005, Hurricane Katrina made landfall in New Orleans as a category 4 storm and caused damage to the nearby coastal areas of Mississippi, including moderate to severe damage to three wastewater treatment plants in Jackson County. These three plants, together with another that had minimal damage from Katrina, are all part of the Mississippi Gulf Coast Regional Wastewater Authority and together are responsible for treating 13 million gallons of wastewater daily (permitted for up to 24 million gallons per day), serving five cities including 80 percent of Jackson County’s population.
Our case study focuses on the three plants that suffered damages to mechanical and electrical equipment, instrumentation, and buildings. The greatest impact was to the Pascagoula/Moss Point Regional Wastewater Treatment Plant (P/MP), the closest of the three plants to the coast. Its facilities experienced severe flooding and were inundated with 8 feet of water, which damaged mechanical and electrical equipment and the structure and architecture of the building (MGCRWA 2005; JCUA 2012). The Escatawpa Wastewater Treatment Plant also experienced severe flooding that damaged mechanical and electrical equipment and caused some architectural damage, though not as severe as that to the P/MP. The Gautier Regional Wastewater Treatment Plant, though farthest from the coast relative to the other two plants, similarly suffered structural damages due to flooding and storm surge, though only a fraction of those incurred by the P/MP and Escatawpa. Table 4 shows the monetary damages to the three plants at the time of the hurricane and then adjusted for inflation to 2020$.
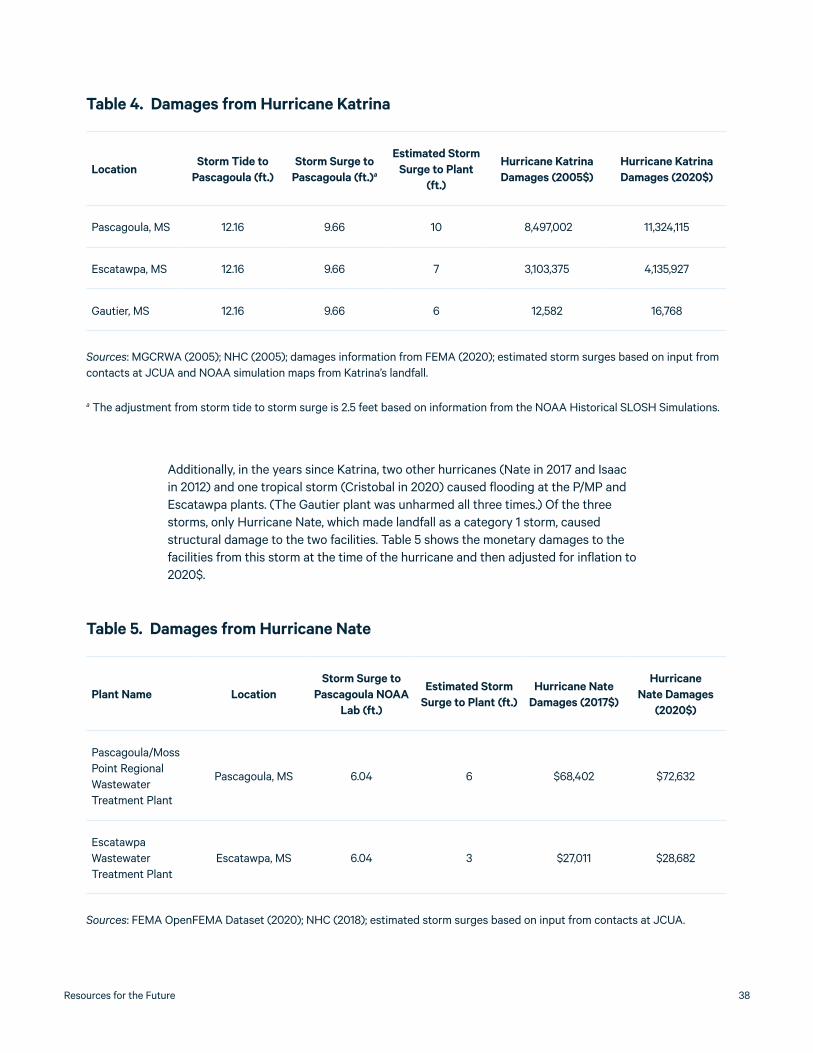
Resources for the Future 38
Additionally, in the years since Katrina, two other hurricanes (Nate in 2017 and Isaac in 2012) and one tropical storm (Cristobal in 2020) caused flooding at the P/MP and Escatawpa plants. (The Gautier plant was unharmed all three times.) Of the three storms, only Hurricane Nate, which made landfall as a category 1 storm, caused structural damage to the two facilities. Table 5 shows the monetary damages to the facilities from this storm at the time of the hurricane and then adjusted for inflation to 2020$.
Table 4. Damages from Hurricane Katrina
LocationStorm Tide to
Pascagoula (ft.)Storm Surge to
Pascagoula (ft.)a
Estimated Storm Surge to Plant
(ft.)
Hurricane Katrina Damages (2005$)
Hurricane Katrina Damages (2020$)
Pascagoula, MS 12.16 9.66 10 8,497,002 11,324,115
Escatawpa, MS 12.16 9.66 7 3,103,375 4,135,927
Gautier, MS 12.16 9.66 6 12,582 16,768
Sources: MGCRWA (2005); NHC (2005); damages information from FEMA (2020); estimated storm surges based on input from contacts at JCUA and NOAA simulation maps from Katrina’s landfall.
a The adjustment from storm tide to storm surge is 2.5 feet based on information from the NOAA Historical SLOSH Simulations.
Table 5. Damages from Hurricane Nate
Plant Name LocationStorm Surge to
Pascagoula NOAA Lab (ft.)
Estimated Storm Surge to Plant (ft.)
Hurricane Nate Damages (2017$)
Hurricane Nate Damages
(2020$)
Pascagoula/Moss Point Regional Wastewater Treatment Plant
Pascagoula, MS 6.04 6 $68,402 $72,632
Escatawpa Wastewater Treatment Plant
Escatawpa, MS 6.04 3 $27,011 $28,682
Sources: FEMA OpenFEMA Dataset (2020); NHC (2018); estimated storm surges based on input from contacts at JCUA.

The Societal Value of the Digital Coast 39
The facilities were repaired and became operational again after both hurricanes. However, the Jackson County Utility Authority (JCUA) conducted an analysis following the Katrina recovery and concluded that it made sense to relocate and consolidate the plants, for two reasons. First, the plants (particularly P/MP and Escatawpa) are located in areas vulnerable to future flooding (within a 100-year floodplain), and thus JCUA decided they should be relocated to an elevated area above the floodplain to avoid damages from storm surge in the future (EJCCWRF 2020). Second, one of the plants in the wastewater treatment system withdraws water from the Pascagoula River, which faces drought conditions. The JCUA seeks to end this practice when the new facility is operational (EJCCWRF 2019).
After the analysis, JCUA began the planning process for the relocation and consolidation of the P/MP, Escatawpa, and Gautier plants into a new facility, called the East Jackson County Consolidated Water Reclamation Facility, to be located in a lower-risk area at an elevation above the 100-year floodplain. A feasibility study for relocating the facilities was conducted in 2013, and official design planning for the new facility began in October 2018. The new location is not yet finalized, but all the sites under consideration meet the expectations for low flooding risk (which will further be reduced by surrounding the plant with a berm). The new plant is expected to be commercially operational by 2030 and is designed to operate for a minimum of 30 years, thus expected to be in operation until at least 2060 and likely beyond that.
6.1.2. Use of Digital Coast Products
In 2014, during the early stages of the relocation process, JCUA staff used two NOAA/Digital Coast products—the Sea Level Rise Viewer and the Coastal Flood Exposure Mapper—to identify low-risk potential sites for the new plant. Together, these tools identified sites that had minimal risk from storm surge, flooding, and sea level rise to help ensure a safe long-term location for the new plant. To minimize any potential risk to the new facility, JCUA staff used worst-case scenario assumptions, such as the 10-foot scenario as an input into NOAA’s Sea Level Rise Viewer to plan for and minimize any impacts from sea level rise. Given information provided by the Digital Coast products on sites that have minimal risks, the final site choice will depend on other criteria, such as proximity to stakeholders, permitted discharge location, and industrial reuse infrastructure.
6.1.3. Counterfactual
JCUA staff reported in interviews that without the availability of the Digital Coast products early in the process of relocating the plants, they likely would have had to enlist outside professional help to identify low-risk sites. Doing so would have required “more time, expertise, and software costs” to make decisions regarding a new site. However, they believed that they would have been able to identify a new site for the wastewater treatment plant that minimized risk of flooding, sea level rise, and storm surge from hurricanes.

Resources for the Future 40
The outcomes of both the counterfactual and the Digital Coast scenario thus result in the relocation and consolidation of three plants to a lower-risk area. The difference in outcomes is the difference between these outcomes occurring sooner (under the Digital Coast scenario) and occurring later (under the counterfactual scenario) due to the need to enlist outside help to gather the same information provided quickly and easily by the Digital Coast tools.
While it is impossible to determine how much more time would have been required had the Digital Coast tools not been available, the JCUA staff estimated that use of these tools saved approximately one to two years in planning efforts, thus enabling the planning process to begin about one to two years earlier, which we assume will likely lead to the new plant being built one to two years earlier than it would have been without the Digital Coast products.
Depending on available funding, the new plant is set to be operational by the year 2030. Under the counterfactual scenario, in which the plant’s planning and development process is delayed by one to two years, we assume that the three plants (P/MP, Escatawpa, and Gautier) remain in their original locations for the year 2030 or the years 2030 and 2031 due to delays in the planning and funding process. For that period of time, these plants are at risk for damages from storm surge and flooding under the counterfactual scenario but not under the Digital Coast scenario. Thus the benefits of the Digital Coast products can be described as the avoided damages resulting from relocating the plants one to two years sooner under the Digital Coast scenario relative to the counterfactual.
6.1.4. Attribution
As described in section 6.1.2, the JCUA staff used two tools available on the Digital Coast site to inform early stage planning efforts for the new plant’s location. According to contacts at JCUA, the use of these tools was instrumental in contributing to the planning process and ultimately expediting the timeline for the plants’ relocation. Because these were the only tools used for this purpose, we believe it is reasonable to assume that the benefits of expediting the timeline for relocating the plants can be attributed entirely to the use of the Digital Coast products because of the associated time savings.
6.1.5. Estimation of Benefits
The benefits of using the Digital Coast products in this case are estimated to be the estimated avoided damages under the counterfactual scenario in which the three plants remain in their original location for 2030–31. The damages that these plants primarily face by remaining in their current location are those from storm surge due to hurricanes, which would cause significant flooding and structural and physical damage to the plants. These three plants incurred millions of dollars of damage during Hurricane Katrina and thousands during Hurricane Nate (see Tables 4 and 5). By remaining in the same location, these plants are at higher risk of flooding during hurricanes and associated repair costs to the facilities. Additionally, because of climate

The Societal Value of the Digital Coast 41
Table 6. Storms Hitting the Mississippi Coastline between 1900 and 2019
Storm Year Category
Unnamed 1901 1
Unnamed 1906 3
Unnamed 1911 1
Unnamed 1912 1
Unnamed 1916 3
Unnamed 1926 4
Unnamed 1932 1
Ethel 1960 2
Camille 1969 5
Frederic 1979 4
Elena 1985 3
George 1998 3
Katrina 2005 4
Cindy 2005 1
Ida 2009 1
Nate 2017 1
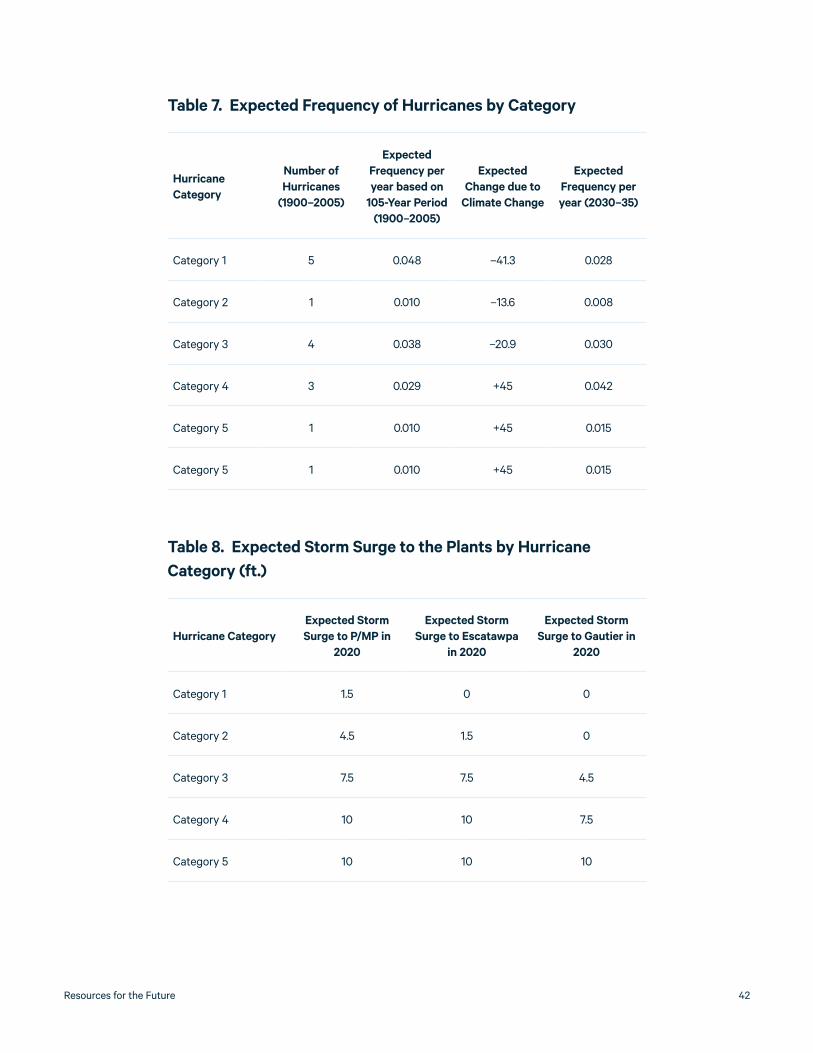
Resources for the Future 42
Table 7. Expected Frequency of Hurricanes by Category
Hurricane Category
Number of Hurricanes
(1900–2005)
Expected Frequency per year based on
105-Year Period (1900–2005)
Expected Change due to
Climate Change
Expected Frequency per year (2030–35)
Category 1 5 0.048 –41.3 0.028
Category 2 1 0.010 –13.6 0.008
Category 3 4 0.038 –20.9 0.030
Category 4 3 0.029 +45 0.042
Category 5 1 0.010 +45 0.015
Category 5 1 0.010 +45 0.015
Table 8. Expected Storm Surge to the Plants by Hurricane Category (ft.)
Hurricane CategoryExpected Storm Surge to P/MP in
2020
Expected Storm Surge to Escatawpa
in 2020
Expected Storm Surge to Gautier in
2020
Category 1 1.5 0 0
Category 2 4.5 1.5 0
Category 3 7.5 7.5 4.5
Category 4 10 10 7.5
Category 5 10 10 10

The Societal Value of the Digital Coast 43
change, the risk of flooding increases incrementally each year due to rising sea levels and higher intensity of hurricanes, which could lead to higher storm surges and more frequent flooding as time goes on.
To estimate the expected damages from the plants remaining in their current locations for 2030–31, we used historical data to estimate the probability that a hurricane of a given intensity would make landfall on the Mississippi coastline each year. To do this, we collected data from the National Hurricane Center’s hurricane strike dataset from 1900 to 2019. During this time, 16 hurricanes struck the Mississippi coastline. These hurricanes and their intensity are listed in Table 6.
This historical record served as a baseline for estimating the number of storms expected to hit the Pascagoula region in 2030 and 2031. To account for climate change and an anticipated increase in the frequency of hurricanes over time, we consulted a 2013 study by Knutson and colleagues, who estimate the change in frequency of hurricanes by the early to mid-21st century (2016–35) using the Representative Concentration Pathway (RCP) 4.5 scenario relative to the baseline period of 1986 to 2005. The authors find that by 2035, the probabilities of category 1, 2, and 3 hurricanes occurring are expected to decrease by 41 percent, 14 percent, and 21 percent, respectively, while the probability of more severe category 4 and 5 storms is expected to increase by 45 percent relative to the baseline period. Our estimates are presented in Table 7. We use these in estimating expected damages to the plants in 2030–31.
Figure 15. Expected Storm Surge to the Pascagoula/Moss Point Plant for a Category 1 Storm
Source: NOAA Coastal Flood Mapper

Resources for the Future 44
Notably, these percentage increases are based on estimates for the early 21st century (2016–35) relative to a late 20th century baseline. However, during the baseline period of 1986 to 2005, only four storms hit the Pascagoula area, and they did not represent all storm types. To get a better estimate of the number of storms that occur, we used the total of storms that hit the Pascagoula area from 1900 to 2005 as a representative baseline instead.
Each hurricane category produces a different expected level of storm surge, and thus the associated damages differ. We used NOAA’s Coastal Flood Exposure Mapper to estimate the expected storm surge under each category for each of the three facilities based on their location. Ideally, we would use real data on storm surge from previous hurricanes that have hit these areas specifically. Unfortunately, data are not available for these specific locations. Therefore, using the Coastal Flood Exposure Mapper is a next best alternative. The NOAA Coastal Flood Exposure Mapper provides a map of expected storm surge by location given an input of storm category. The map displays expected storm surge by colors, which represent a range in feet (Figure 15).
Table 9. Expected Storm Surge by Hurricane Category in 2030–31 (ft.)
Hurricane Category Pascagoula/Moss Escatawpa Gautier
Category 1 1.6 0 0
Category 2 4.7 1.6 0
Category 3 7.8 7.8 4.7
Category 4 10.4 10.4 7.8
Category 5 10.4 10.4 10.4

The Societal Value of the Digital Coast 45
To simplify our calculations, we used the midpoint of the range in each scenario. Table 8 shows the three plants’ expected levels of storm surge for each hurricane category if a hurricane were to hit in the present day (2020).
Next, we modify these expected storm surges to reflect impacts from climate change on storm surge from different hurricane categories. In addition to causing more frequent hurricanes, climate change will cause them to become more intense, with rising sea levels and increases in storm surge. Thus we must adjust our 2020 estimates to appropriately estimate storm surge to the existing plants in 2030–31, accounting for sea level rise.
To do so, we rely on results from Balaguru and colleagues (2016), who estimate the expected rise in storm surge for hurricanes hitting the Gulf Coast and Florida coastline using the RCP 4.5 scenario by the end of the century (2081–2100) relative to the end of last century (1981–2000). Using an assumed median sea level rise and mean increase in storm intensity, the authors model five historic hurricanes from the late 20th century under a baseline scenario and climate change scenario to compare the expected storm surges. Of the five hurricanes they model, we focus on those that affected Mississippi: Frederic (1979), Opal (1995), and Erin (1995).
For these assumptions of median sea level rise and mean storm intensity under the RCP 4.5 scenario, Balaguru and colleagues find each of these hurricanes to have an increase in storm surge of 35.6, 25.5, and 43.9 percent, respectively, by the end of the 21st century relative to the end of the 20th century. For our purposes, we use the average of these three findings and assume that the storm surge for each hurricane increases by roughly 35 percent by the end of the 21st century.
To estimate the expected storm surges in 2030–31, we assume that hurricane intensity increases linearly (in percentage) each year throughout the century. With our estimates
Figure 16. Pascagoula/Moss Point Plant Damage Response Curve
2 4 6 8 10 12 14
Storm Surge (ft.)
4
8
12
16M
Expe
cted
Dam
ages
(203
0$ M
illio
ns)
0
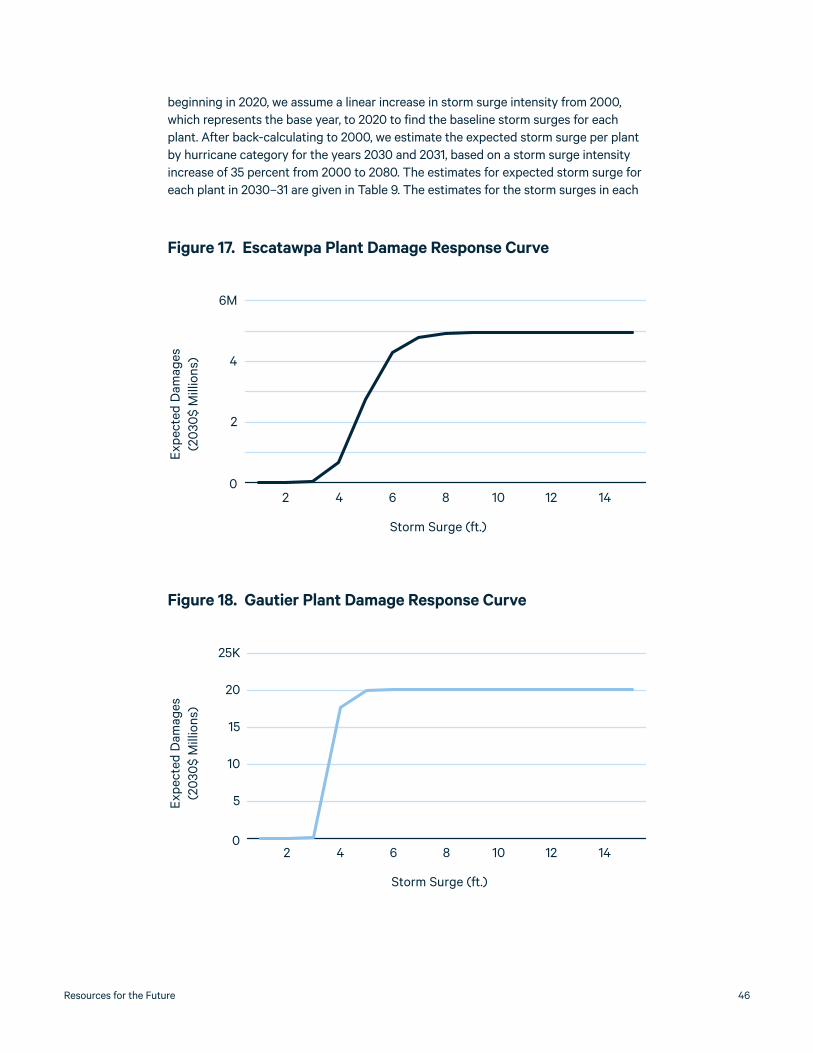
Resources for the Future 46
beginning in 2020, we assume a linear increase in storm surge intensity from 2000, which represents the base year, to 2020 to find the baseline storm surges for each plant. After back-calculating to 2000, we estimate the expected storm surge per plant by hurricane category for the years 2030 and 2031, based on a storm surge intensity increase of 35 percent from 2000 to 2080. The estimates for expected storm surge for each plant in 2030–31 are given in Table 9. The estimates for the storm surges in each
Figure 17. Escatawpa Plant Damage Response Curve
2 4 6 8 10 12 14
Storm Surge (ft.)
2
4
6M
0
Expe
cted
Dam
ages
(203
0$ M
illio
ns)
Figure 18. Gautier Plant Damage Response Curve
5
10
15
20
25K
2 4 6 8 10 12 140
Storm Surge (ft.)
Expe
cted
Dam
ages
(203
0$ M
illio
ns)
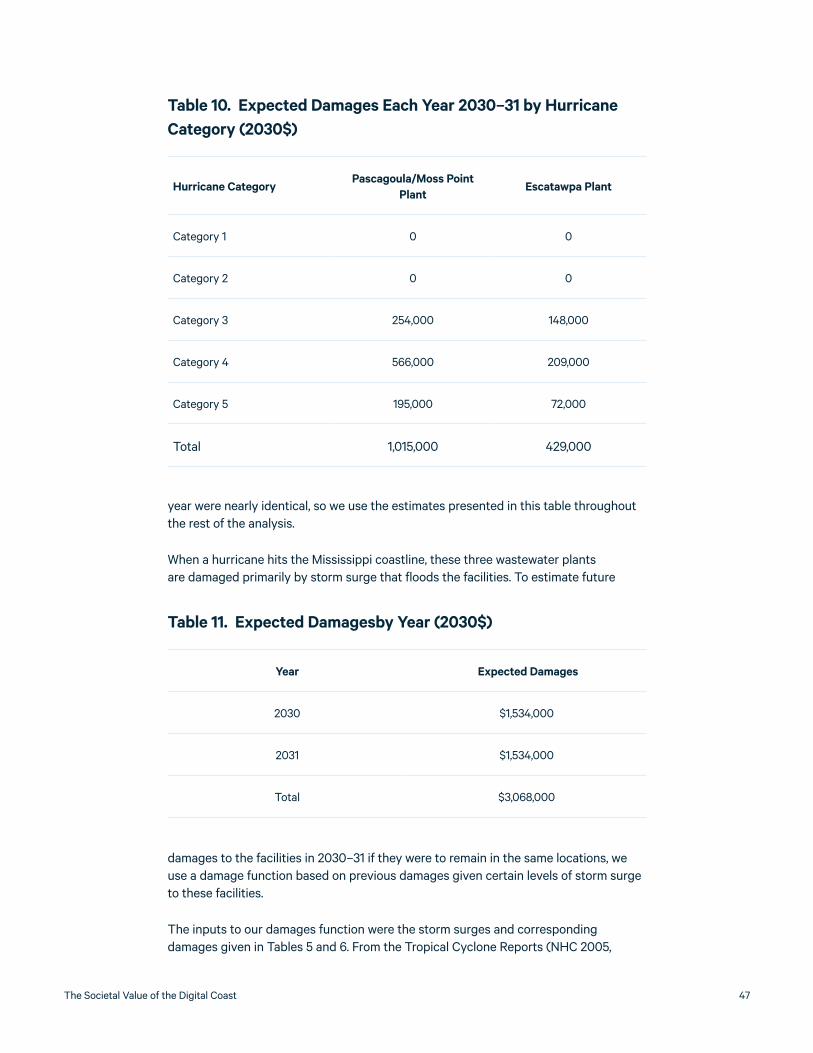
The Societal Value of the Digital Coast 47
year were nearly identical, so we use the estimates presented in this table throughout the rest of the analysis.
When a hurricane hits the Mississippi coastline, these three wastewater plants are damaged primarily by storm surge that floods the facilities. To estimate future
damages to the facilities in 2030–31 if they were to remain in the same locations, we use a damage function based on previous damages given certain levels of storm surge to these facilities.
The inputs to our damages function were the storm surges and corresponding damages given in Tables 5 and 6. From the Tropical Cyclone Reports (NHC 2005,
Table 10. Expected Damages Each Year 2030–31 by Hurricane Category (2030$)
Hurricane CategoryPascagoula/Moss Point
PlantEscatawpa Plant
Category 1 0 0
Category 2 0 0
Category 3 254,000 148,000
Category 4 566,000 209,000
Category 5 195,000 72,000
Total 1,015,000 429,000
Table 11. Expected Damagesby Year (2030$)
Year Expected Damages
2030 $1,534,000
2031 $1,534,000
Total $3,068,000
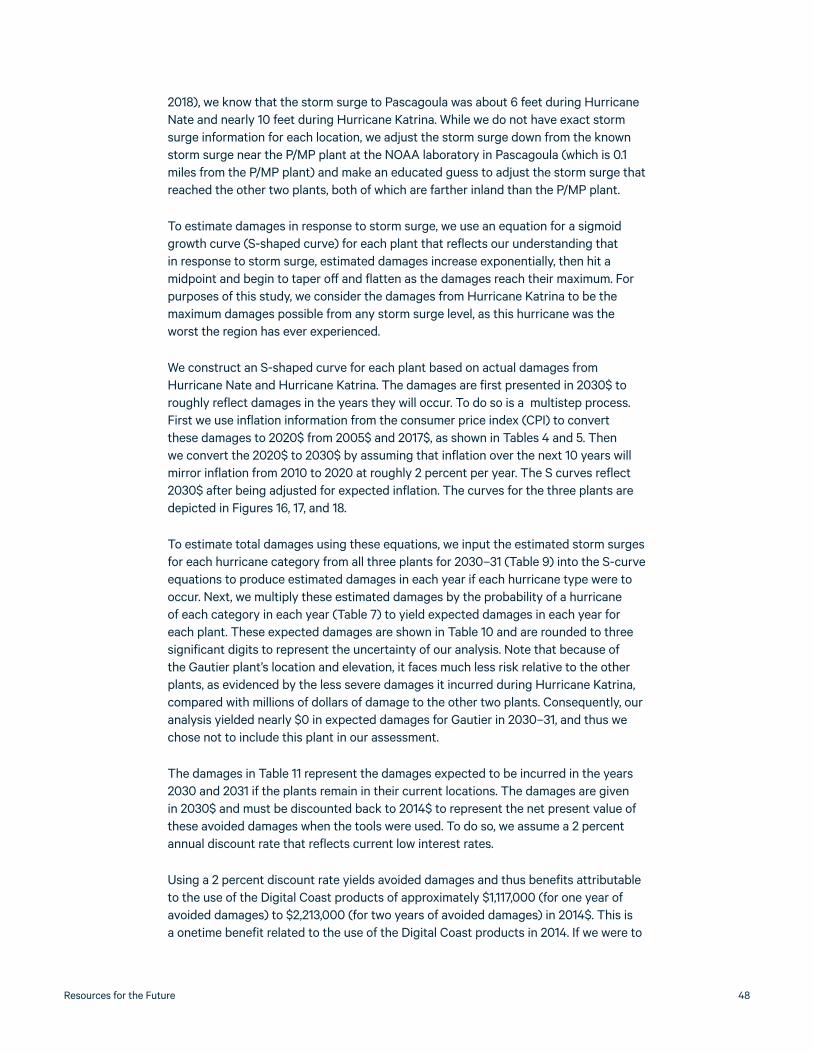
Resources for the Future 48
2018), we know that the storm surge to Pascagoula was about 6 feet during Hurricane Nate and nearly 10 feet during Hurricane Katrina. While we do not have exact storm surge information for each location, we adjust the storm surge down from the known storm surge near the P/MP plant at the NOAA laboratory in Pascagoula (which is 0.1 miles from the P/MP plant) and make an educated guess to adjust the storm surge that reached the other two plants, both of which are farther inland than the P/MP plant.
To estimate damages in response to storm surge, we use an equation for a sigmoid growth curve (S-shaped curve) for each plant that reflects our understanding that in response to storm surge, estimated damages increase exponentially, then hit a midpoint and begin to taper off and flatten as the damages reach their maximum. For purposes of this study, we consider the damages from Hurricane Katrina to be the maximum damages possible from any storm surge level, as this hurricane was the worst the region has ever experienced.
We construct an S-shaped curve for each plant based on actual damages from Hurricane Nate and Hurricane Katrina. The damages are first presented in 2030$ to roughly reflect damages in the years they will occur. To do so is a multistep process. First we use inflation information from the consumer price index (CPI) to convert these damages to 2020$ from 2005$ and 2017$, as shown in Tables 4 and 5. Then we convert the 2020$ to 2030$ by assuming that inflation over the next 10 years will mirror inflation from 2010 to 2020 at roughly 2 percent per year. The S curves reflect 2030$ after being adjusted for expected inflation. The curves for the three plants are depicted in Figures 16, 17, and 18.
To estimate total damages using these equations, we input the estimated storm surges for each hurricane category from all three plants for 2030–31 (Table 9) into the S-curve equations to produce estimated damages in each year if each hurricane type were to occur. Next, we multiply these estimated damages by the probability of a hurricane of each category in each year (Table 7) to yield expected damages in each year for each plant. These expected damages are shown in Table 10 and are rounded to three significant digits to represent the uncertainty of our analysis. Note that because of the Gautier plant’s location and elevation, it faces much less risk relative to the other plants, as evidenced by the less severe damages it incurred during Hurricane Katrina, compared with millions of dollars of damage to the other two plants. Consequently, our analysis yielded nearly $0 in expected damages for Gautier in 2030–31, and thus we chose not to include this plant in our assessment.
The damages in Table 11 represent the damages expected to be incurred in the years 2030 and 2031 if the plants remain in their current locations. The damages are given in 2030$ and must be discounted back to 2014$ to represent the net present value of these avoided damages when the tools were used. To do so, we assume a 2 percent annual discount rate that reflects current low interest rates.
Using a 2 percent discount rate yields avoided damages and thus benefits attributable to the use of the Digital Coast products of approximately $1,117,000 (for one year of avoided damages) to $2,213,000 (for two years of avoided damages) in 2014$. This is a onetime benefit related to the use of the Digital Coast products in 2014. If we were to
The Societal Value of the Digital Coast 49
compare this benefit with the costs associated with making these products available, it would be a comparison in that year.
6.1.6. Limitations
This analysis has some limitations and uncertainties, and thus these numbers represent only rough estimates of the benefits provided by the use of the Digital Coast products in this case. First, the annual hurricane risk was based on the number of hurricanes that hit the Mississippi coastline over the 20th century and up until 2005. While this is useful as a rough estimate, past experience is not a predictor of the future. Where hurricanes make landfall is virtually random, and even if the frequency of certain types of hurricanes increases due to climate change, it is not certain that these hurricanes will affect the Pascagoula region at their historic frequency. It is possible that more or fewer hurricanes could make landfall near Pascagoula in the future by chance alone. Thus we feel that while imprecise, the historical record serves as a reasonable baseline for understanding the risks this region faces with respect to hurricane frequency.
Second, the storm surge estimates are based on information from NOAA’s Coastal Flood Exposure Mapper, but they do not account for the potential variation in storm surge depending on where the hurricane makes landfall. For example, Hurricane Nate in 2017 was technically a category 1 hurricane and produced 6 feet of storm surge to the P/MP plant; however, the NOAA tool predicts 0 feet of storm surge at the P/MP plant’s location from a category 1 hurricane. Thus the storm surges related to a given hurricane category are very uncertain.
These factors result in uncertainty in these estimated benefits. However, we have reason to believe that the actual benefits of using the Digital Coast products in this case are probably higher. For one thing, we used the damages that were submitted to FEMA, but our contacts at JCUA indicated that the damages from Hurricane Katrina to the P/MP plant were underreported and were closer to $15 million, nearly double the $8 million reported to FEMA. Additionally, our analysis focused exclusively on physical damage to the plants and not the societal and environmental impacts of wastewater treatment plants being out of commission for some time, such as the effects of poorer water quality on the local community’s health and on fish and other river life. Such damages were outside the scope of this study, but their inclusion in this analysis likely would have led to much higher damages and consequently a much higher societal value attributable to the Digital Coast products.
6.1.7. Conclusion
Despite the uncertainties, this analysis provides a rough estimate of the benefits possible from just one use of Digital Coast products. In this case, the Digital Coast products were instrumental in saving the JCUA stakeholders time and money associated with the relocation project. These tools ultimately sped up the timeline and likely will lead to the plants being relocated one to two years earlier than they would have been without these resources.

Resources for the Future 50
Notably, our contacts at JCUA told us that the Digital Coast products were instrumental in allowing this relocation project to move forward. This was because the easily created and readily available maps provided through the Digital Coast better enabled users to convey the rationale for moving the plants. Our contacts reported that it is entirely possible that the relocation project would not have moved forward without the use of the Digital Coast products. This counterfactual would have been more difficult to support and would have required a more detailed analysis of the societal benefits of moving the plants entirely to higher ground, and such an analysis was outside of our scope. However, using that counterfactual probably would have yielded higher benefits attributable to the Digital Coast. Therefore, we further emphasize that the estimate given above is likely low relative to the true benefits of using the Digital Coast products for this purpose.
6.2. Digital Coast Academy
6.2.1. Background
The Office of Coastal Management provides a number of training courses for coastal management teams through the Digital Coast that are aimed at improving resource management and working group skills. The Digital Coast Academy has 171 different training and learning options. Examples of course topics include risk communication, tutorials for the Sea Level Rise Viewer and ArcGIS, and creating community adaptation plans.
Digital Coast courses are offered either online or in-person. The in-person courses are held on-site at the organization requesting the course. Digital Coast instructors travel to the training group and do so at no cost to the organization other than lunch expenses, when applicable. Because these courses are essentially free to participating organizations, it is difficult to assess their value.
One method for determining the economic value of a product is a customer’s willingness to pay for it. In a market, willingness to pay (WTP) is reflected by the price consumers face because those who choose to make the purchase must consider the product’s value to be at or above the price they pay for it. In the absence of a price for a product or service, economists can assess value through a variety of methods, including surveys that directly ask people about their willingness to pay for a product. However, surveys can be challenging for revealing true WTP because responses may be biased or dishonest. An alternative method is to find a similar product that does have a market price and use its price to estimate a market value for the product in question. This is the method we have chosen for assessing the value of some of Digital Coast’s trainings.
In collaboration with OCM, we have identified several private sector trainings that are very similar to those offered by the Digital Coast Academy. The cost of a private sector training is representative of the societal benefits of the training because it reflects a customer’s WTP for the benefits the training provides. Therefore, we can use the

The Societal Value of the Digital Coast 51
costs of these trainings to estimate the societal benefits that Digital Coast trainings provide, as long as the public and private sector trainings are reasonably similar to one another in content covered and expected outcomes for participants, as well as in other attributes that might affect WTP.
After reviewing possible OCM/private sector pairs of candidates, we chose two trainings for this case study: Building Risk Communication Skills and Planning and Facilitating Collaborative Meetings. The first compares closely to the Harvard University T. H. Chan School of Public Health’s Applied Risk Communication for the
21st Century and the second to Business Training Works’ Collaborative Thinking Skills: Driving Teams towards Better Results.
While these trainings are similar in content, we must note some key limitations of the
Table 12. Comparison of Risk Trainings
Topic OCM Harvard
Understanding factors that influence risk perception for individuals based on social science research
X X
Development of a risk communication strategy based on behavioral and social science research
X X
Tools for better understanding the intended audience X X
Crafting an effective message tailored to specific audiences X X
Methods for delivering a message effectively X X
Message delivery in times of crisis versus noncrisis X
Evaluating risk communication efforts X
Tailoring messages for different platforms, such as social media and news media
X
Focus on coastal risks X
Focus on public health risks X

Resources for the Future 52
OCM trainings that could explain why participants may choose the paid trainings over OCM’s. First, OCM’s focus is on coastal management, while both of these trainings have a broader focus that could attract a wider audience. Second, OCM’s trainings have logistical limitations. Both require a minimum of 25 participants to hold a training but do not permit more than 35 or 36 participants total, which affords little flexibility for individuals or larger groups to participate in these trainings. Finally, OCM is limited by funding to conduct the trainings, which restricts the number that can be held per year.
6.2.2. Digital Coast Academy Training Cases
Case 1: Risk Communication Trainings: OCM vs. Harvard
The Digital Coast Academy offers an in-person, one-day course titled Building Risk Communication Skills, which helps participants improve communication skills regarding risk faced by communities. The day is divided into sessions that focus on different aspects of risk communication, including defining goals, how people respond to risk given social science research, and risk communication essentials, such as how to communicate effectively, connect with an audience through deeper understanding, and then apply these techniques to hypothetical examples. Overall, the course teaches participants how to recognize different audiences’ values, learn effective risk communication skills, and ultimately develop effective strategies. The course is interactive, with several individual and group exercises on risk communication over the course of the day. The risks discussed are specifically coastal hazards.
The Harvard T. H. Chan School of Public Health offers a similar course titled Applied Risk Communication for the 21st Century, which takes place over three days consisting of 15.5 hours of instruction at the Harvard Longwood Campus in Boston. This class covers myriad topics, with 11 modules including Behavioral Economics, Emotions and Communication of Risk, Technologies of Surveillance of Risk, and Competing Risks and
Table 13. Building Risk Communication Skills Participants by Fiscal Year
Fiscal Year Number of Participants
2017 24
2018 120
2019 180
2020 67

The Societal Value of the Digital Coast 53
Benefits and Communication of Risk. Common themes of the program are preemptively addressing concerns, managing the emotional responses of an audience, and tailoring messages to groups such as constituents, news media, and social media followers. Harvard encourages a broad audience to take the course, including professionals from the private sector, government agencies, and nonprofit organizations, specifically naming emergency preparedness and government relations officials who are a primary group likely to be interested in the Digital Coast class.
While the Digital Coast training is shorter in comparison, being taught over the course of one day (7 hours total), there is substantial overlap in the topics covered by each course, with most of the topics discussed in the Digital Coast course appearing in Harvard’s agenda. Both classes have a key focus on understanding an audience’s perception of risk and formulating responses that address the concerns of that particular audience. Overall, the purpose of both courses is to help participants develop effective risk communication strategies based on expertise and proven principles from the social science and risk communication literature. The topics covered by each course are given in Table 12.
Notably, the Harvard training includes more content than the OCM training does, which is to be expected since the Harvard training is roughly twice as long in duration. Other notable differences are the type of risk discussed and the scope of communication. Harvard’s training is given through the Harvard T. H. Chan School of Public Health, and thus the focus is on risks to public health, whereas OCM’s course focuses exclusively on local coastal hazards. Thus communication training is targeted to local residents for OCM’s course, while Harvard’s communication training includes audiences of different sizes and types. Because Harvard’s course focuses on larger-scale risks, the communication tactics discussed are geared toward a larger audience, such as a national audience on television.
Despite the differences in scope and focus, which influence the examples discussed throughout the two courses, the fundamental concepts of risk communication given throughout each course are similar enough that a participant would likely gain similarly valuable insights from taking either course. The trainings both focus on essentials of risk communication that are applicable under both circumstances, and therefore the comparison between the two is valid. Furthermore, because the scope of the Harvard class is broader than OCM’s and not the other way around, participants would likely gain the same skills from the Harvard class that they would from OCM’s training, but within a broader context.
Estimation of Benefits
The Harvard training costs $2,375 per participant for 15.5 hours of instruction, spread over three days. This includes lunch and breakfast, while the Digital Coast training does not, and therefore these costs must be subtracted from the total tuition. If we assume the average cost per person is $15 for a catered breakfast and $20 for lunch, for a total of three days, then the total is reduced by $105 to $2,270 per person. When divided by the 15.5 hours, the cost of attending the training is $146 per hour per person.
Resources for the Future 54
Using this per-hour value, we can estimate how much the Digital Coast training would cost if participants had to pay for it. The Digital Coast training is seven hours long, and if we multiply these seven hours by the hourly value, the total cost per participant is approximately $1,025. To estimate the value of this training in a given year, we multiply this per-participant value by the average number of people who take this training annually. Table 13 shows the number of people who participated in the Building Risk Communication Skills training since its inception in FY2017 according to OCM.
We chose to exclude the FY2020 participants because the year was not yet over at the time of our analysis and the number is skewed due to COVID-19. Additionally, we exclude FY2017 participants because the program was introduced that year, so this number represents only partial-year participation. Thus we use the average of the FY2018 and FY2019 fiscal years, which is 150 people, to account for year-to-year fluctuations. We then multiply the per-participant cost of $1,025 by an average of 150 participants per year to yield a value of $153,750 per year for the Building Risk Communication Skills training.
Using a per-hour value estimate is reasonable for comparing the Harvard training and the Digital Coast training, since the two are different lengths. However, this method assumes that the marginal benefit of each additional hour of instruction is equal across all hours. It is possible that instead, the training has diminishing marginal returns for participants, which would mean that the first few hours of training during the first day are more valuable than the other two days. This would imply that if the Harvard training were shortened to the first seven hours (to equal the duration of the OCM training), the cost would be cut by less than half, since the value these first seven hours provide is higher than the remaining 7.5 hours. Thus our estimate is conservative on this point.
Other factors may work in the opposite direction. First is the status of Harvard University. If training is a signaling device to one’s coworkers, family, friends, and current and future employers, the Harvard training could confer additional value relative to a government training program. Relatedly, the participant may feel that the training would be of higher quality because Harvard University professors would be leading it relative to an OCM training led by a government employee. On the other hand, some participants may feel that the government employee might understand them better and have more practical experience than a scientist who might focus on research. Note that as employers generally pay for their employees’ training, it is their preference that matters more than the employees’. But we see no reason why these two points would not apply equally to the employer and the participant.
Another important advantage of Harvard’s course could be the networking benefits that OCM’s course does not have because participants are from the same organization and OCM comes to them. If these connections add value to Harvard’s course, then the valuation of OCM’s course could be overstated.
On the other hand, the OCM training could have higher value for some participants because it is customizable in a sense; only members of the same organization participate in the training, thus allowing the trainers to tailor the experience to the
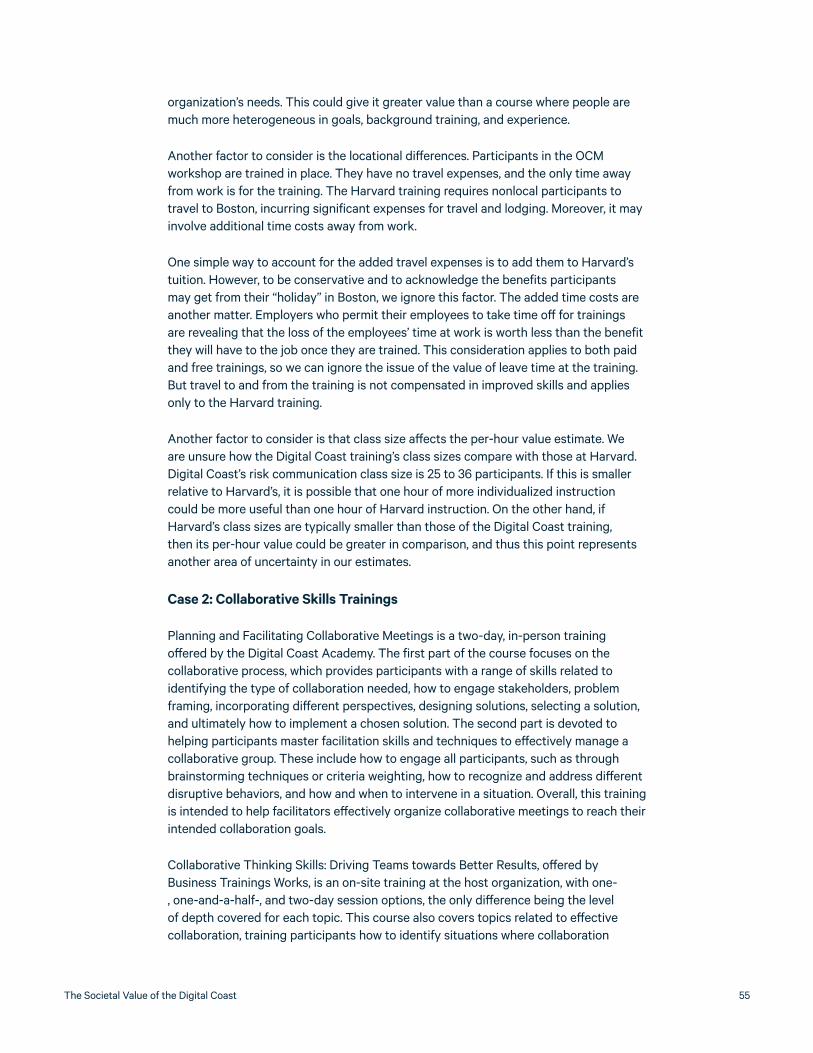
The Societal Value of the Digital Coast 55
organization’s needs. This could give it greater value than a course where people are much more heterogeneous in goals, background training, and experience.
Another factor to consider is the locational differences. Participants in the OCM workshop are trained in place. They have no travel expenses, and the only time away from work is for the training. The Harvard training requires nonlocal participants to travel to Boston, incurring significant expenses for travel and lodging. Moreover, it may involve additional time costs away from work.
One simple way to account for the added travel expenses is to add them to Harvard’s tuition. However, to be conservative and to acknowledge the benefits participants may get from their “holiday” in Boston, we ignore this factor. The added time costs are another matter. Employers who permit their employees to take time off for trainings are revealing that the loss of the employees’ time at work is worth less than the benefit they will have to the job once they are trained. This consideration applies to both paid and free trainings, so we can ignore the issue of the value of leave time at the training. But travel to and from the training is not compensated in improved skills and applies only to the Harvard training.
Another factor to consider is that class size affects the per-hour value estimate. We are unsure how the Digital Coast training’s class sizes compare with those at Harvard. Digital Coast’s risk communication class size is 25 to 36 participants. If this is smaller relative to Harvard’s, it is possible that one hour of more individualized instruction could be more useful than one hour of Harvard instruction. On the other hand, if Harvard’s class sizes are typically smaller than those of the Digital Coast training, then its per-hour value could be greater in comparison, and thus this point represents another area of uncertainty in our estimates.
Case 2: Collaborative Skills Trainings
Planning and Facilitating Collaborative Meetings is a two-day, in-person training offered by the Digital Coast Academy. The first part of the course focuses on the collaborative process, which provides participants with a range of skills related to identifying the type of collaboration needed, how to engage stakeholders, problem framing, incorporating different perspectives, designing solutions, selecting a solution, and ultimately how to implement a chosen solution. The second part is devoted to helping participants master facilitation skills and techniques to effectively manage a collaborative group. These include how to engage all participants, such as through brainstorming techniques or criteria weighting, how to recognize and address different disruptive behaviors, and how and when to intervene in a situation. Overall, this training is intended to help facilitators effectively organize collaborative meetings to reach their intended collaboration goals.
Collaborative Thinking Skills: Driving Teams towards Better Results, offered by Business Trainings Works, is an on-site training at the host organization, with one-, one-and-a-half-, and two-day session options, the only difference being the level of depth covered for each topic. This course also covers topics related to effective collaboration, training participants how to identify situations where collaboration
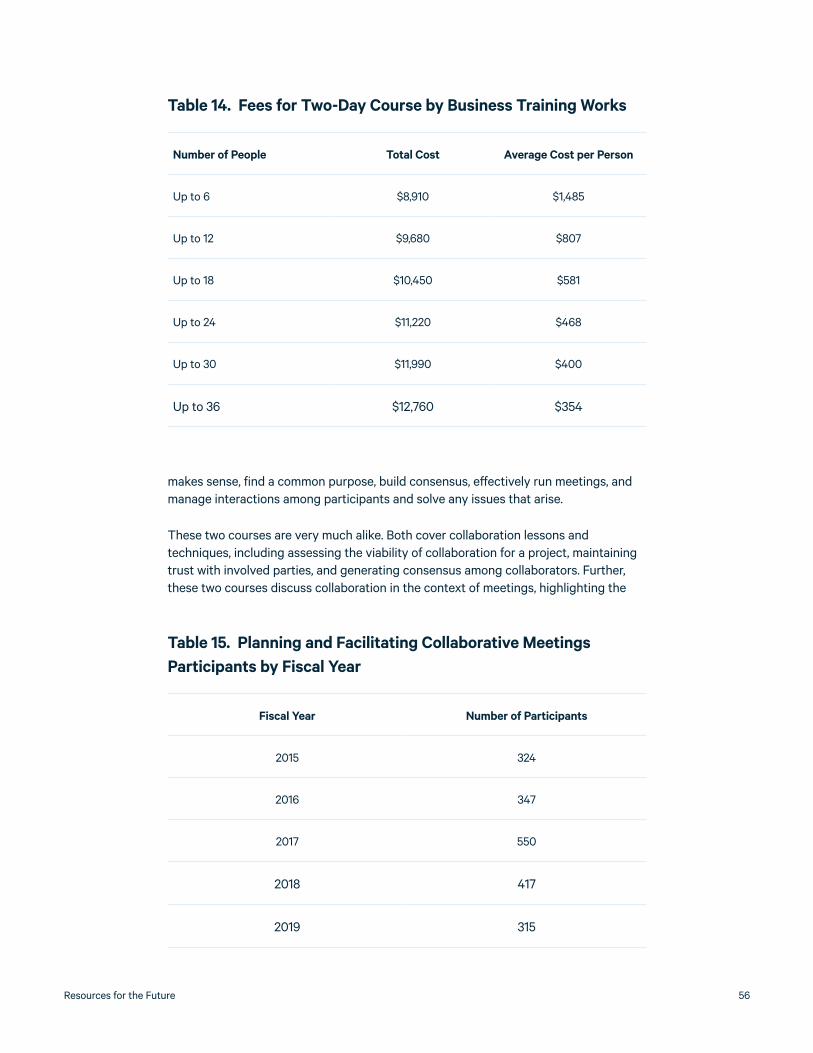
Resources for the Future 56
makes sense, find a common purpose, build consensus, effectively run meetings, and manage interactions among participants and solve any issues that arise.
These two courses are very much alike. Both cover collaboration lessons and techniques, including assessing the viability of collaboration for a project, maintaining trust with involved parties, and generating consensus among collaborators. Further, these two courses discuss collaboration in the context of meetings, highlighting the
Table 14. Fees for Two-Day Course by Business Training Works
Number of People Total Cost Average Cost per Person
Up to 6 $8,910 $1,485
Up to 12 $9,680 $807
Up to 18 $10,450 $581
Up to 24 $11,220 $468
Up to 30 $11,990 $400
Up to 36 $12,760 $354
Table 15. Planning and Facilitating Collaborative Meetings Participants by Fiscal Year
Fiscal Year Number of Participants
2015 324
2016 347
2017 550
2018 417
2019 315

The Societal Value of the Digital Coast 57
importance of role setting, being focused on objectives, and managing conflict and other disruptive behavior. Both go over a set of tools aimed at improving participants’ facilitation and decisionmaking ability.
In addition, these two trainings are very similar in logistics, which makes them more easily comparable than the first pair of trainings. In both cases, trainings are given on-site at the host organization or at a location provided by the host. This eliminates the possibility that additional travel time and expenses play a role in determining the societal value of the training. Also, they are the same duration (two-day trainings), and thus no hourly adjustment is necessary to account for differences in time spent on the material. Furthermore, the Business Training Works fee does not include catering costs, and thus the total price does not need to be adjusted and reflects the value of the workshop only. Since Business Training Works provides private group trainings, the company tailors its course to the organization, which makes it an even more suitable substitute in the event that the OCM training were not available. This could include using examples that make the most sense for the group.
Estimation of Benefits
Given the similarity of the two courses, it is safe to assume that, other things equal, the tuition for the Business Training Works course is a reasonable estimate of the value of the free Digital Coast course. Using the Business Training Works course as an estimate for the Digital Coast course’s worth is valid because it is a likely counterfactual. In the event that the Digital Coast course were not available, a business group could pay to take the Business Training Works course instead and achieve similar outcomes for participants, as the courses cover much the same content and participants are likely to obtain comparable skills from taking either course. Therefore, the benefit to society of the Digital Coast course is the avoided cost that participants would have to pay for the alternative course if the Digital Coast course were not available.
For the training of equal duration to the Digital Coast’s two-day training, Business Training Works charges different fees by the number of participants. It only offers on-site training in groups, not offering public courses or individual additions to training sessions. Fees for the Business Training Works’ Collaborative Thinking Skills: Driving Teams towards Better Results for a two-day training are given in Table 14.
To estimate the value of the Digital Coast course based on the Business Training Works fees, we must use the average Digital Coast class size. According to NOAA, the average class size for Planning and Facilitating Collaborative Meetings is 30 people. The value of a 30-person class on this topic offered by Business Training Works is $11,990 per class, or $400 per person, which we will use as an estimate for the value of the Digital Coast course. Table 15 shows the number of participants who took the training in each fiscal year since FY2015 according to OCM.
On average, 391 participants took the planning training annually over the five years from FY2015 to FY2019. Assuming an average cost of $400 per person, the course would be worth $156,400 annually in avoided costs for participants on average.

Resources for the Future 58
Table 16. Extrapolation of Other Digital Coast Courses
Course
Total Participant Hours per Training
Total Participant Hours by Course,
FY2015–19
Course 1 Per-Participant Value
($27 per Participant per Hour)
Course 2 Per-Participant Value
($146 per Participant per Hour)
Adaptation Planning for Coastal Communities
16 17,208 $458,880 $2,512,368
A Framework for Ecosystem Services Projects
8 144 $3,840 $21,024
Coastal Inundation Mapping 16 12,720 $339,200 $1,857,120
Dealing with Disruptive Behaviors 2 26 $693 $3,796
Developing a Competitive Grant Proposal
8 288 $7,680 $42,048
Estimating the Local Marine Economy 8 600 $16,000 $87,600
Estimating the Local Marine Economy—Technical Assistance
8 168 $4,480 $24,528
Facilitation Basics 8 4,712 $125,653 $687,952
Graphic Facilitation 8 648 $17,280 $94,608
Introducing Green Infrastructure 8 12,936 $344,960 $1,888,656
Managing Visitor Use 16 4,992 $133,120 $728,832
OpenNSPECT Advanced 3 81 $2,160 $11,826
OpenNSPECT Introduction 3 135 $3,600 $19,710
Planning Effective Projects 16 10,272 $273,920 $1,499,712
Planning for Meaningful Evaluation 12 600 $16,000 $87,600

The Societal Value of the Digital Coast 59
Other courses may be available that are like the Digital Coast course. For example, a course titled High Performance Collaboration: Leadership, Teamwork, and Negotiation is offered through Northwestern University via the online platform Coursera. While this course seems to cover similar topics, it is not as easily comparable to the Digital Coast course because it is offered online. An online class may not provide the same types of benefits as an in-person class, and therefore multiple additional assumptions would be necessary to compare the two. It also differs in course length, which makes a comparison more difficult.
Using the price of these alternative courses as representative of the opportunity cost for how the Digital Coast course could be priced is a narrow assumption, especially if there are other similar courses with different prices. However, we were not able to identify any other courses through our research that were close enough in both content and structure to be viable options with which to compare the Digital Coast trainings. While we do not discount the possibility that other such trainings do exist, we feel confident that our search was comprehensive and thus that our results are reasonable.
6.2.3. Extrapolation
This two-part case study demonstrates the high value of these two OCM trainings. In addition to the two trainings highlighted here, OCM offers 20 different in-person trainings that likely provide similar value to participants. In this section, we extrapolate our findings to the rest of the in-person trainings offered by the Digital Coast Academy
Table 16. cont. Extrapolation of Other Digital Coast Courses
Course
Total Participant Hours per Training
Total Participant Hours by Course,
FY2015–19
Course 1 Per-Participant Value
($27 per Participant per Hour)
Course 2 Per-Participant Value
($146 per Participant per Hour)
Risk Communication—Mini Course 2 128 $3,413 $18,688
Risk Communication Technical Assistance
5 270 $7,200 $39,420
Social Science Basics 1.5 244.5 $6,520 $35,697
Social Science Methods Series—Focus Groups
4 124 $3,307 $18,104
Virtual Facilitation 4 84 $2,240 $12,264
Total $1,770,147 $9,691,553
Resources for the Future 60
to present a better estimate of the value that the training program provides annually. To do so, we worked with OCM to collect information about the other in-person trainings, including the names of the courses, number of participant hours per course, and number of participants who took the course annually from FY2015 to FY2019.
Please note that our findings, presented in Table 16, are not precise because they are based only on the per-participant hourly cost of two courses; the rest of these trainings are different in content and could be very different in value to participants. However, these estimates are useful as a ballpark figure for the value of the Digital Coast Academy’s training program. Roughly, we estimate that the value of the 20 in-person courses offered by the Digital Coast Academy (not including the two we profiled) is between $1.8 million and $9.7 million annually.
References
Balaguru, K., D. R. Judi, and L. R. Leung. 2016. Future Hurricane Storm Surge Risk for the US gulf and Florida Coasts Based on Projections of Thermodynamic Potential Intensity. Climatic Change 138 (1–2): 99–110.
EJCCWRF (East Jackson County Consolidated Water Reclamation Facility). 2020. Final Proj-ect Report.
———. 2019. Capacity Analysis Report.
FEMA (Federal Emergency Management Agency). 2020. OpenFEMA Dataset: Public Assis-tance Funded Projects Details (09-08-2020). https://www.fema.gov/openfema-da-ta-page/public-assistance-funded-projects-details.
JCUA (Jackson County Utility Authority). 2012. Pascagoula Moss Point Wastewater Treat-ment Plant Assessment Draft.
Knutson, T. R., J. J. Sirutis, G. A. Vecchi, S. Garner, M. Zhao, H. S. Kim, M. Bender, R. E. Tuleya, I. M. Held, and G. Villarini. 2013. Dynamical Downscaling Projections of Twenty-First-Cen-tury Atlantic Hurricane Activity: CMIP3 and CMIP5 Model-Based Scenarios. Journal of Climate 26 (17): 6591–6617.
MGCRWA (Mississippi Gulf Coast Regional Wastewater Authority). 2005. Hurricane Katrina Recovery Project Preliminary Design Report.
NHC (National Hurricane Center). 2005. Tropical Cyclone Report Hurricane Katrina. https://www.nhc.noaa.gov/data/tcr/AL122005_Katrina.pdf.
———. 2018. Tropical Cyclone Report Hurricane Nate 4–8 October 2017. https://www.nhc.noaa.gov/data/tcr/AL162017_Nate.pdf.

The Societal Value of the Digital Coast 61
7. Case Studies Not SelectedThis section describes case study possibilities that we investigated but that ultimately proved to be unworkable primarily due to issues with attribution to the Digital Coast products related to on-the-ground changes. In most cases, we found that Digital Coast resources are being used for planning efforts that have not yet led to on-the-ground change. However, we wish to highlight how Digital Coast products are being used in these cases and how they could lead to important changes in the future.
7.1. Kauai (Sea Grant Kauai)
7.1.1. Use of Digital Coast Products
In 2014, the County of Kauai used NOAA’s Sea Level Rise Viewer to create maps that were included in its Climate Change and Coastal Hazards Assessment. This assessment was prepared as a technical study to inform the 2018 update to the Kauai County General Plan, whose purpose is to set long-term, high-level planning goals for the county, which are used to guide local community plans and zoning. The General Plan is updated every 10 years and provides high-level planning guidance for the next 20 years.
The assessment included sea level rise maps that were used to inform the General Plan’s discussion of climate change adaptation in Kauai. Specifically, the maps from the assessment were used along with FEMA flood maps to modify the General Plan’s land use maps. These maps are essential for the planning process and are used to identify areas appropriate for future development or preservation.
One of the most important uses of the General Plan is in the development of local community plans. Community plans are used to further the goals of the General Plan and guide land use planning at a more local level, and they typically encompass smaller geographic areas. Kauai is divided into five communities, each of which develops a community plan following the release of the General Plan. Overarching goals of the General Plan must be incorporated into the community plans.
The Kauai General Plan focuses on impacts from climate change and specifically states that the “results of hazard, risk, and vulnerability assessment to inform adaptation strategies [must] be incorporated into Community Plans.” As a result, following the release of the Kauai General Plan in 2018, West Kauai, a community that includes the towns of Kekaha, Waimea, and Hanapepe, released a draft of its updated community plan in January 2020 addressing risks it faces from sea level rise, coastal flooding, and coastal erosion, as directed by the General Plan.
Our contact in Kauai shared that West Kauai was considering a new special permit requirement called the Special Treatment Coastal Edge permit, which would have restricted development in some parcels near the shore in order to restrict damage from
Resources for the Future 62
sea level rise. If Digital Coast resources inform the creation of this new special permit, then the benefits of restricting development in this area could be attributed to the Digital Coast.
7.1.2. Issues with the Case
Unfortunately, we could not use this case because of an attribution issue. We assumed that the use of Digital Coast products for preparation of the hazard assessment for the General Plan would trickle down to the community plans and had led to the creation of the Open Coastal Edge Zone, which was on-the-ground change as a result of information from the Digital Coast maps. However, our contacts in Kauai informed us that the choice to pursue a Special Treatment Coastal Edge permit was based on the Hawaii Sea Level Rise Viewer, not the Digital Coast viewer. Therefore, the link with the Digital Coast source was broken, and the on-the-ground changes could not be attributed to the use of Digital Coast.
7.2. Rutgers Institute of Marine and Coastal Sciences, New Jersey
7.2.1. Use of Digital Coast Products
The Jacques Cousteau Reserve used the Digital Coast’s Sea Level Rise Viewer coding base and Coastal Flood Exposure Mapper to create its own mapping product called the NJ Flood Mapper, which provides a granular assessment of expected impacts to New Jersey’s shoreline given inputs of sea level rise, storm surge, and FEMA flood zones. The NJ Flood Mapper has been used for short-term planning purposes thus far but has not led to any state-level action. Contacts we spoke with claimed that some local municipalities may have increased their freeboard requirements in response to the information provided by the tool.
7.2.2. Issues with the Case
In the beginning, the NJ Flood Mapper resembled the Digital Coast tools that served as the base code. In the years since, however, it has evolved into its own separate product with a dedicated team. Therefore, the link between the Digital Coast and the NJ Flood Mapper is less clear, as is the attribution of any on-the-ground change resulting from the use of the NJ Flood Mapper. Also, even in towns that may have seen on-the-ground change, we learned from our contacts that the freeboard requirements may have been increased due to Community Rating System (CRS) requirements in order to benefit from a lower insurance rate, not because of sea level rise information. Even if a community improves its CRS class rating, there are many requirements that go into improving the rating, and attribution to Digital Coast use becomes even more complicated. One option would have been to conduct a case study on the time savings associated with using the Digital Coast products as inputs into the NJ Flood Mapper,

The Societal Value of the Digital Coast 63
but this case would have not had a focus on uses of the product for on-the-ground changes. Thus we decided not to pursue this case.
7.3. CRS Case, Stetson University, Florida
7.3.1. Use of Digital Coast Products
We had hoped to work with a consultant with Stetson University who has used the Digital Coast’s Sea Level Rise Viewer and lidar data to create vulnerability assessments (15–20 so far) for several communities in Florida, Georgia, and North Carolina. The vulnerability plans are a prerequisite for lowering a community’s CRS score, which allows it to save significantly on flood insurance premiums.
7.3.2. Issues with the Case
The hope for a partnership with the consultant did not pan out, and the same problems with a lack of on-the-ground change would have plagued this approach even if we were able to pursue it. The community vulnerability assessment is one of many requirements for lowering a community’s CRS rating, and thus the attribution becomes tricky. Also, the community is not required to follow through with implementation of the plan in order to receive the reduction in the CRS rating, so there usually is not any on-the-ground change.
7.4. Ocean County, New Jersey
7.4.1. Use of Digital Coast Products
The Digital Coast’s Sea Level Rise Viewer was used to prepare the 2014 Hazard Mitigation Plan for Ocean County, New Jersey. This story is featured on the Digital Coast website, and it claims that in response to the plan, two municipalities, Tuckerton and Mantoloking, increased their freeboard requirements from 1 to 3 feet because of anticipated sea level rise impacts. If this were the case, this increase in freeboard requirements would have led to avoided damages in the future from sea level rise, which could be attributed to the use of the Sea Level Rise Viewer.
7.4.2. Issues with the Case
A contact from the town of Tuckerton informed us that the information that fed into the decision to raise the freeboard requirement in that community was in response to FEMA maps, not the Digital Coast maps. Thus the link with Digital Coast products to change on the ground was broken.

Resources for the Future 64
7.5. Private Sector Case Study (The Dewberry Companies)
7.5.1. Use of Digital Coast Products
Dewberry is both a user and contributor of Digital Coast data and coastal mapping services. Dewberry products relevant to coastal infrastructure include its Resilience product line, community assistance consulting to provide rezoning and community planning assistance, and water resources services that deal in flood risk analysis and management. Digital Coast and other NOAA data have helped Dewberry engineers during their initial orientation of projects, with work using these datasets forming a base layer for their planning and design activities. As one Dewberry engineer noted, “Nothing gets built in the US without good elevation data.” They further emphasized that NOAA land data coverage provides immense value in areas where alternative sources would be cost prohibitive.
7.5.2. Issues with the Case
While our contacts at Dewberry acknowledged that underlying lidar data contributed to an “escalation of value,” from data to engineering and construction fees, attribution of a discrete portion of fees to the data was ambiguous and lacking in sufficient justification. Further, establishment of the counterfactual would likely entail meticulous estimation of lidar data generation at a local level that goes beyond the capabilities of this study. Ultimately, this case was unworkable.

The Societal Value of the Digital Coast 65
8. ConclusionsThis study has described and, to some extent, quantified certain aspects of the benefits provided by the Digital Coast platform. We have presented a descriptive analysis of the Digital Coast platform through website analytics and a categorization of uses based on the stories available on the website.
8.1. Main Findings Our website analysis revealed that many of the tools and datasets available through the Digital Coast focus on elevation and land cover, and the majority of both the tools and datasets are from contributing partners outside of NOAA.
In the first case study, we found that a onetime use of the Sea Level Rise Viewer and Coastal Flood Exposure Mapper expedited the planning process of relocating three wastewater treatment plants in Pascagoula, Mississippi, leading to approximately $1.1 million to $2.2 million (2014$) in estimated benefits from avoided damages from hurricane exposure. Unfortunately, we were unable to extrapolate this particular case study to other, similar uses of the Digital Coast products because data on uses of these products are not sufficiently detailed to permit credible extrapolation.
In the trainings case study, we found that a typical in-person Digital Coast training is worth approximately $150,000 per year. Extrapolating to the other 20 in-person trainings that the Digital Coast offers, we find that the estimated value of in-person trainings ranges from $1.8 million to $9.7 million annually.
8.2. Recommendations The research effort to create this report made it clear that the Digital Coast platform and products create tremendous benefit to users, although much of that benefit is difficult to monetize. At the same time, our research provided several insights about ways to improve the Digital Coast platform:
• Offer an interactive and expanded version of the Topics page that includes coherent subject areas. This could improve the user’s experience with the site and make finding relevant information quicker and easier.
• Have regular contact with frequent users of the Digital Coast. We had a fair amount of trouble choosing case studies because of a lack of information on changes happening on the ground in response to the use of Digital Coast products. We recommend that OCM look into appropriate ways of acting on this issue.
• Improve documentation of uses. We were unable to generalize our Mississippi case study because of a lack of information on other, similar uses of the Digital Coast products. We suggest that OCM find more ways to gain a better
Resources for the Future 66
understanding of how the Digital Coast’s resources are being used and for what purposes.
• Focus on improving the granularity of some tools. We heard from many users that they used Digital Coast products for rough estimates but would switch to other tools (or build their own) for in-depth analyses. In particular, the Sea Level Rise Viewer is used frequently, but rarely for in-depth analyses because of limitations of the bathtub model. We suggest improving the Sea Level Rise Viewer in particular to account for flooding, storm surge, and other likely effects of rising sea levels.
• Conduct surveys more frequently. While the time savings surveys are useful, surveys that aim to collect information on how localities are using Digital Coast products and any changes in decisionmaking resulting from those uses are important going forward.

Resources for the Future 67