Data Analysis and Quality Control for NOAA’s … Presentation_E_Ellis.pdf · for NOAA’s...
27
4 August 2008 1 Data Analysis and Quality Control for NOAA’s Hydrometeorological Testbed Program Elizabeth Ellis Pennsylvania State University Earth Systems Research Lab – Physical Sciences Division Dr. Allen White
-
Upload
nguyendang -
Category
Documents
-
view
228 -
download
2
Transcript of Data Analysis and Quality Control for NOAA’s … Presentation_E_Ellis.pdf · for NOAA’s...
4 August 2008 1
Data Analysis and Quality Control for NOAA’s Hydrometeorological
Testbed ProgramElizabeth Ellis
Pennsylvania State UniversityEarth Systems Research Lab – Physical Sciences
DivisionDr. Allen White
4 August 2008 2
Introduction
• Senior at Penn State University• Pursuing degrees in meteorology and
energy business and finance• Interned in Boulder, CO at the Earth
Systems Research Laboratory – Physical Sciences Division (NOAA’s Office of Oceanic and Atmospheric Research)
4 August 2008 3
4 August 2008 4
Introduction
• Senior at Penn State University• Pursuing degrees in meteorology and
energy business and finance• Interned in Boulder, CO at the Earth
Systems Research Laboratory – Physical Sciences Division (NOAA’s Office of Oceanic and Atmospheric Research)
4 August 2008 5
Introduction
• Senior at Penn State University• Pursuing degrees in meteorology and
energy business and finance• Interned in Boulder, CO at the Earth
Systems Research Laboratory – Physical Sciences Division (NOAA’s Office of Oceanic and Atmospheric Research)
4 August 2008 6
Outline
• Precipitation and brightbands• Hydrometeorological Testbed (HMT)
Program• Rainfall process partitioning• Visualizing BB data• Why this is important…
4 August 2008 7
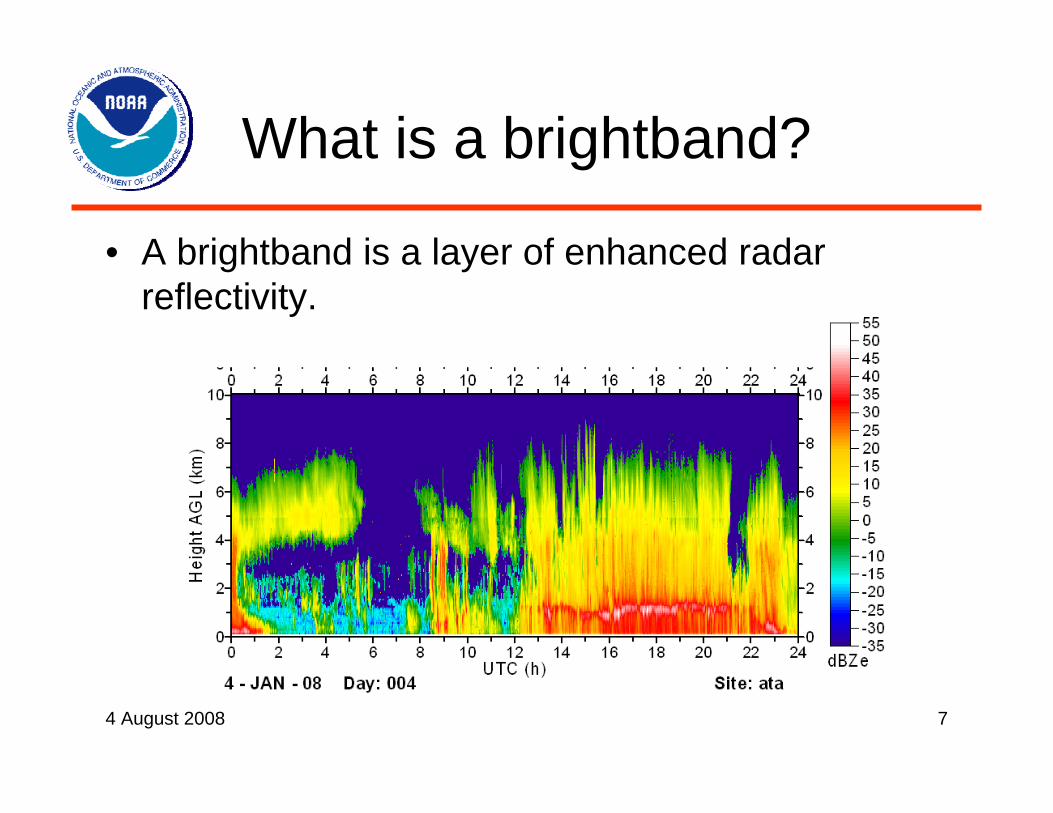
What is a brightband?
• A brightband is a layer of enhanced radar reflectivity.
4 August 2008 8
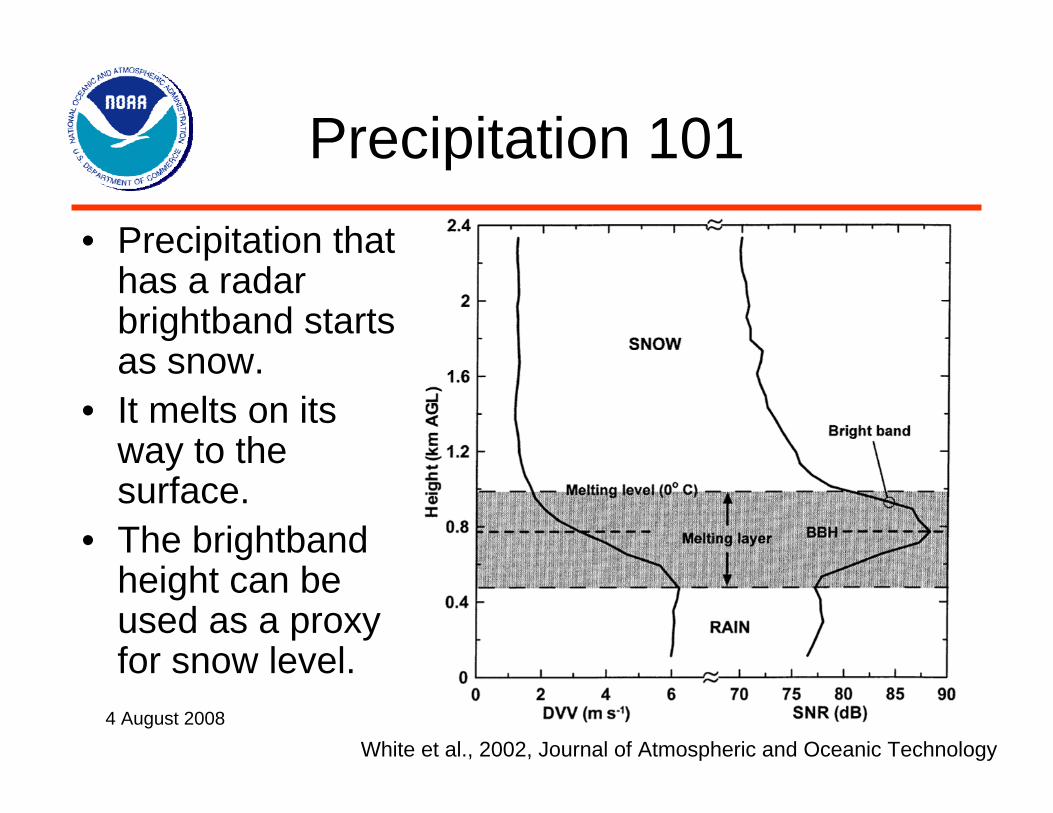
Precipitation 101• Precipitation that
has a radar brightband starts as snow.
• It melts on its way to the surface.
• The brightbandheight can be used as a proxy for snow level.
White et al., 2002, Journal of Atmospheric and Oceanic Technology
4 August 2008 9
NOAA’s HMT Program
• Providing near real time snow level data can help improve runoff/flooding forecasts.
• Snow level information is also important for emergency response crews, road maintenance, ski industry, etc.
4 August 2008 10
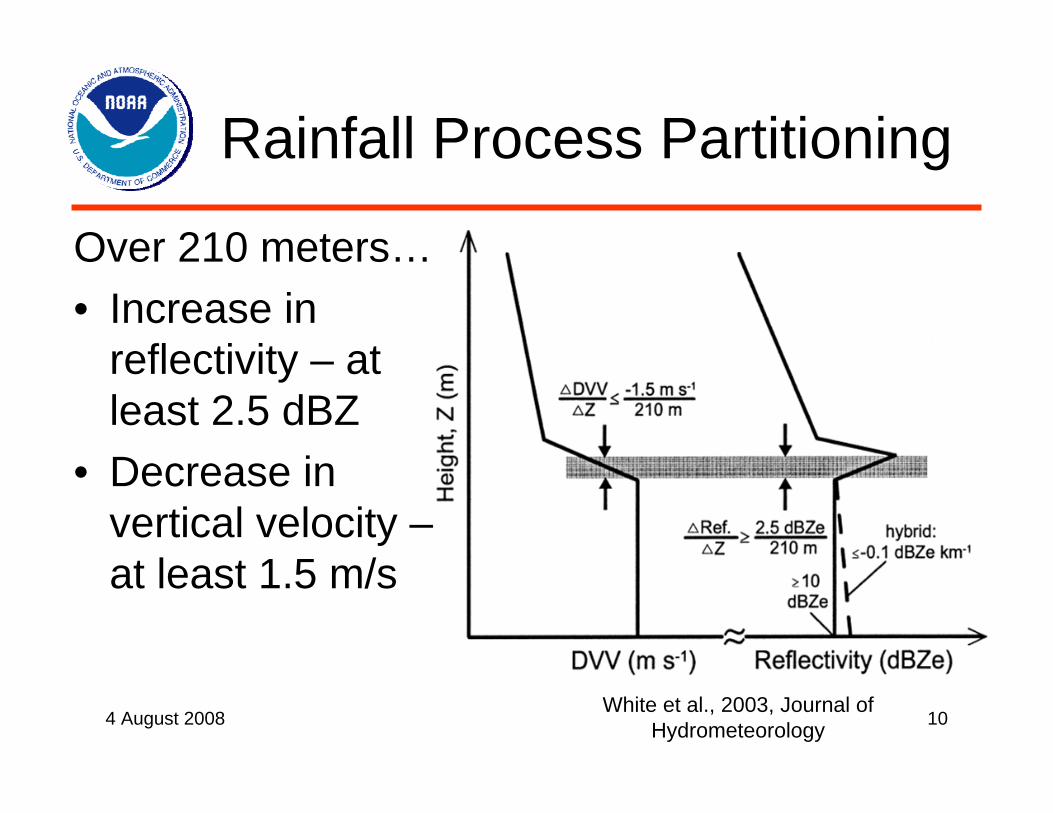
Rainfall Process Partitioning
Over 210 meters…• Increase in
reflectivity – at least 2.5 dBZ
• Decrease in vertical velocity –at least 1.5 m/s
White et al., 2003, Journal of Hydrometeorology
4 August 2008 11
4 August 2008 12
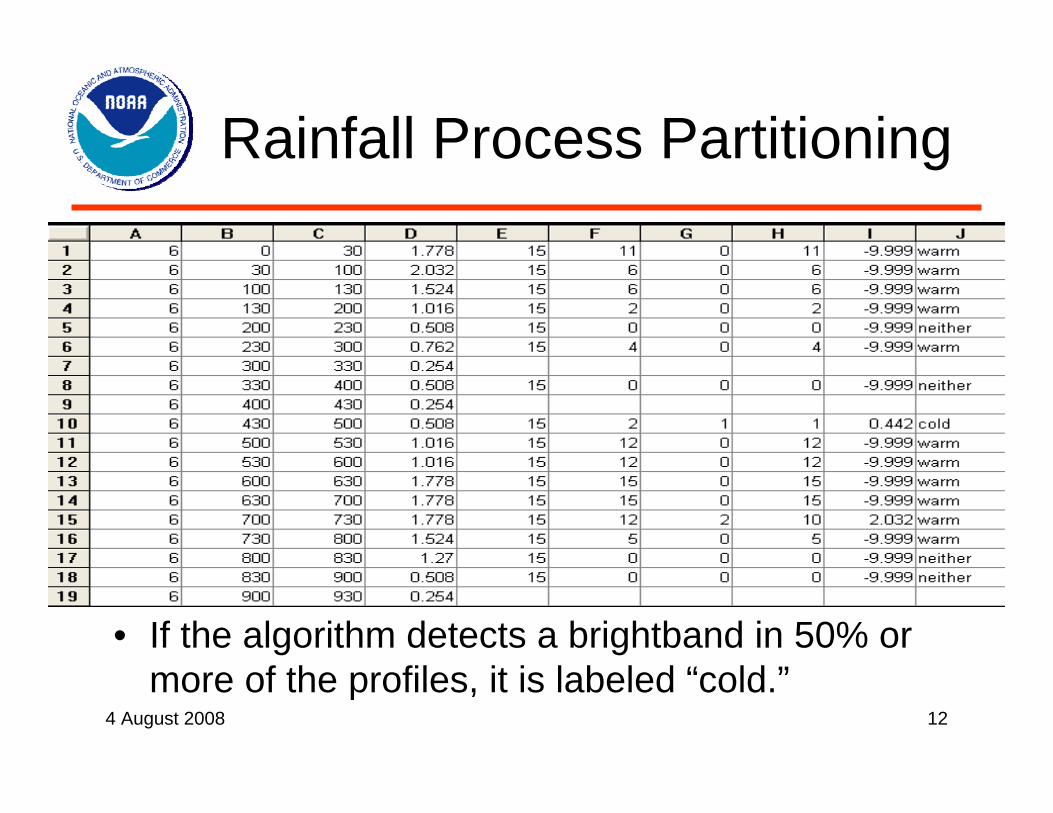
Rainfall Process Partitioning
• If the algorithm detects a brightband in 50% or more of the profiles, it is labeled “cold.”
4 August 2008 13
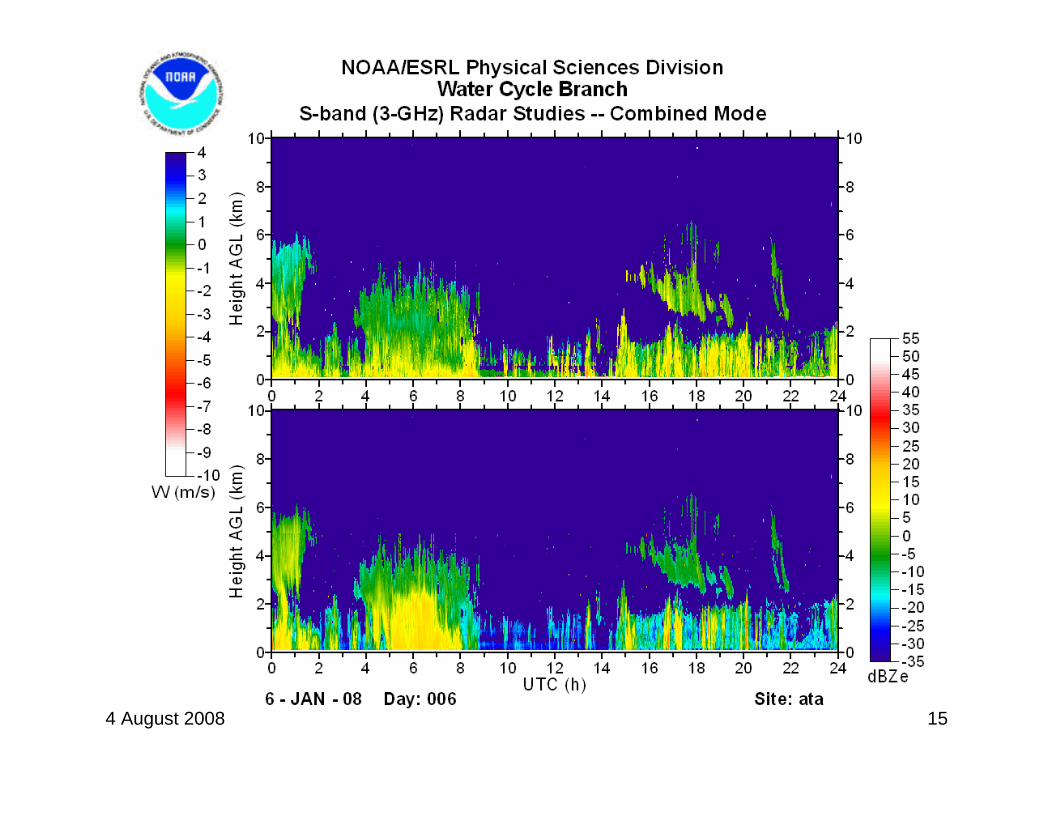
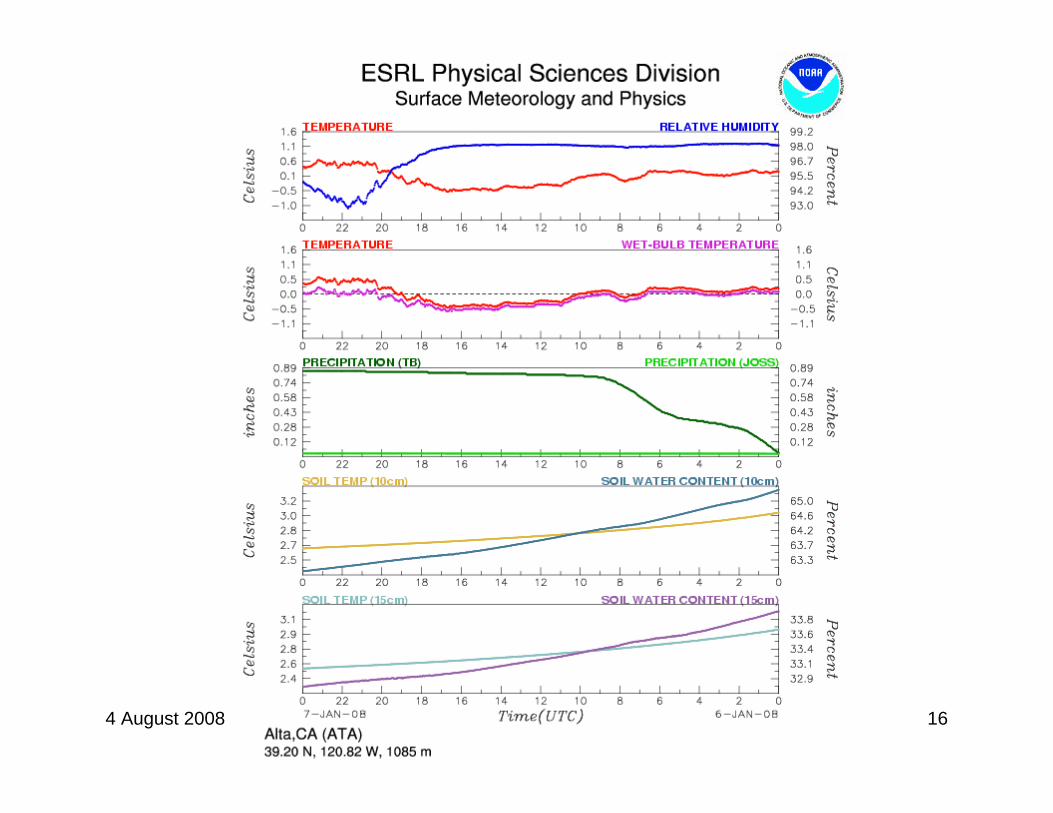
Quality Control
• Compare– Tables of warm/cold rain– Reflectivity plots– Time series of temperature
4 August 2008 14
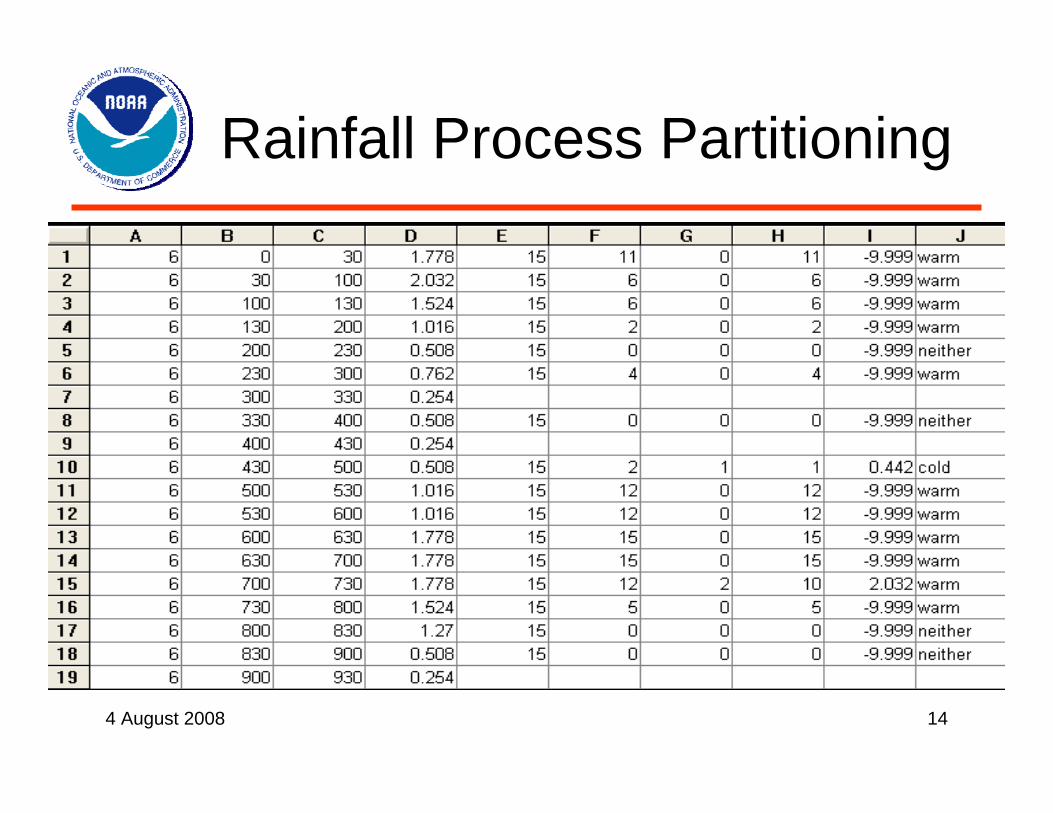
Rainfall Process Partitioning
4 August 2008 15
4 August 2008 16
4 August 2008 17
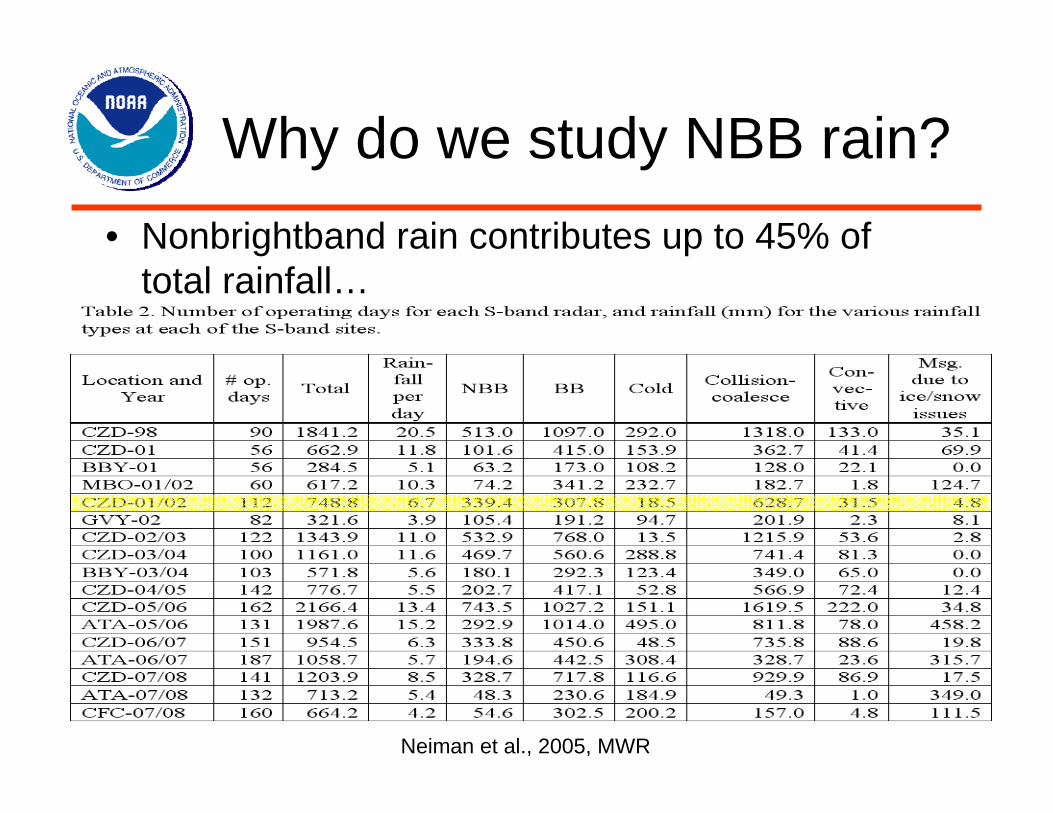
Why do we study NBB rain?• Nonbrightband rain contributes up to 45% of
total rainfall…
Neiman et al., 2005, MWR
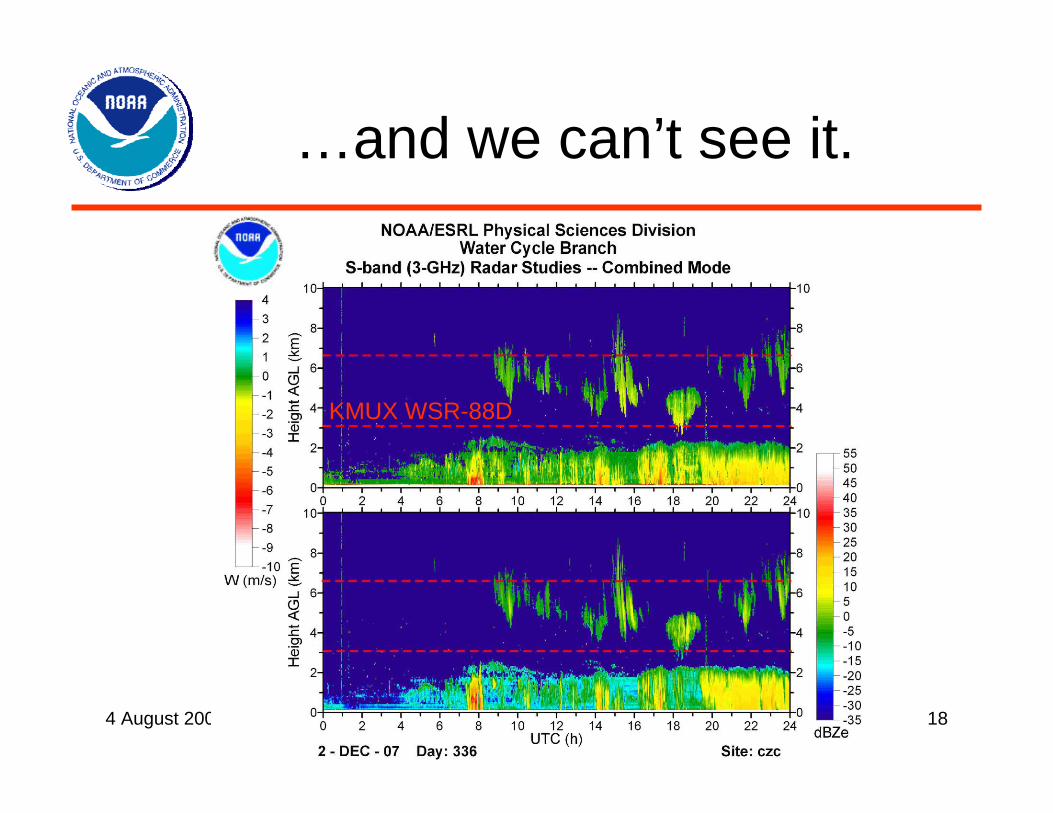
4 August 2008 18
…and we can’t see it.
KMUX WSR-88D
4 August 2008 19
4 August 2008 20
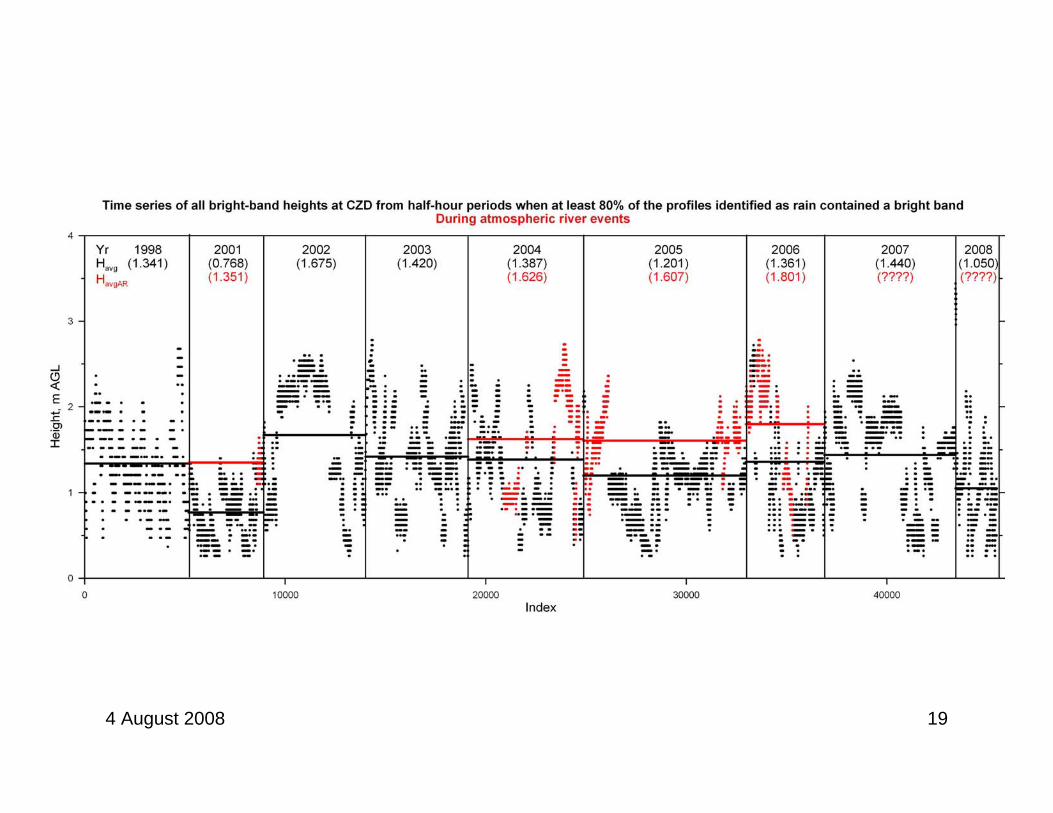
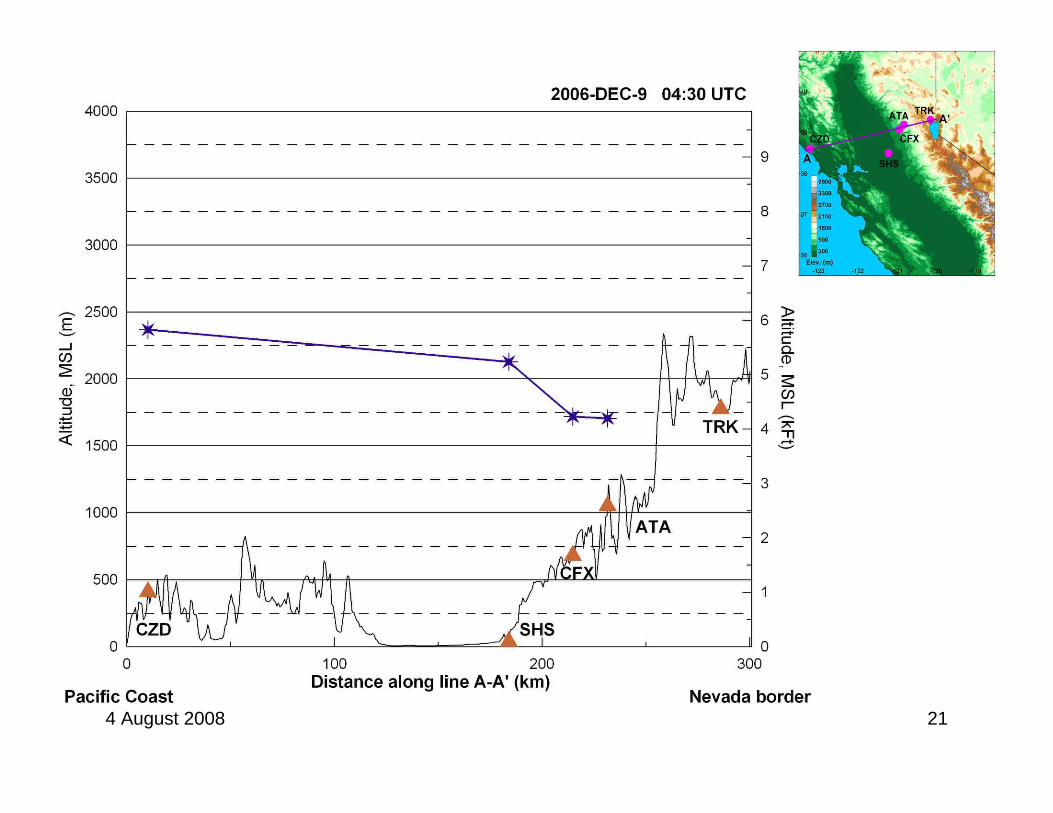
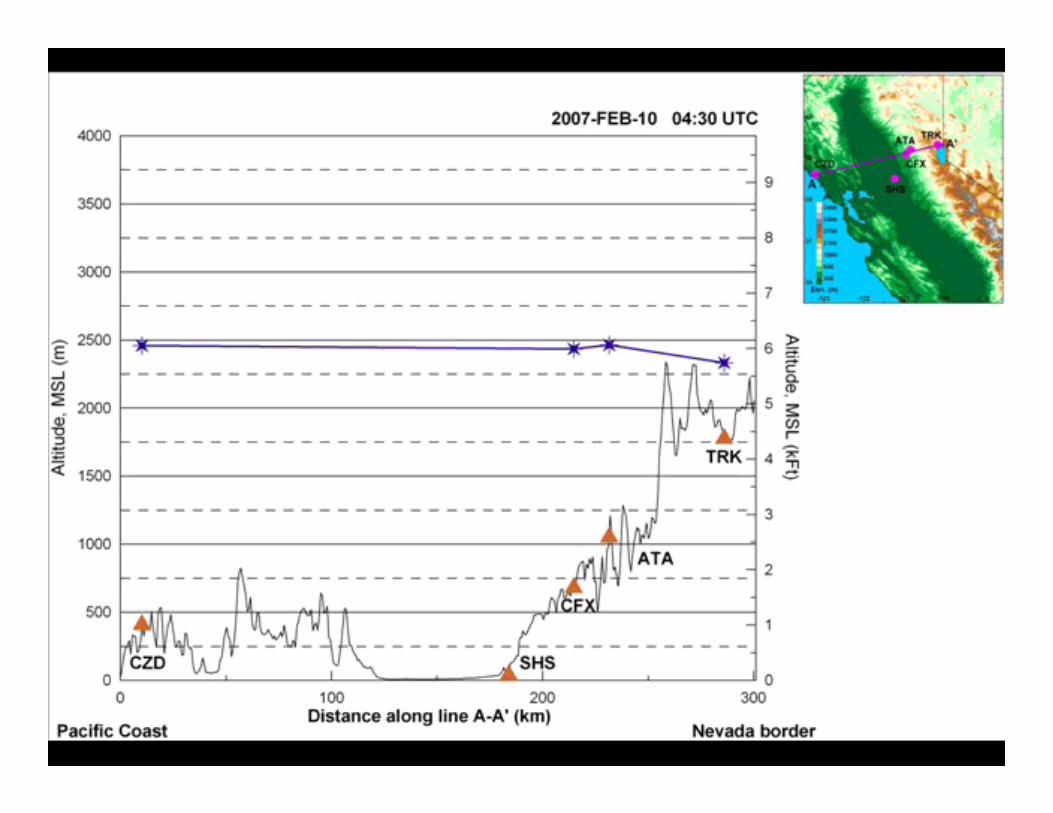
Plotting Snow Level Variability
• Learned a new object-based language for use with Golden software (Grapher)
• Wrote script to create two templates and to plot horizontal variability in brightbandheight
• These plots can be used to look for correlations between the sites on the coast, or in the valley, versus the mountainous sites.
4 August 2008 21
4 August 2008 22
4 August 2008 23
Next Steps
• Graduate in May 2009• Work in the field (research or private
industry)• Attend graduate school
4 August 2008 24
Summary
• A brightband is a layer of enhanced radar reflectivity.
• The brightband height is the altitude of the maximum in radar reflectivity, and is used to approximate the snow level.
• Rainfall process partitioning identifies periods of brightband and nonbrightbandrain.
4 August 2008 25
Summary
• Plots of reflectivity were used to:– QC rainfall process partitioning.– QC brightband heights.
• I created plots of brightband height variability.
4 August 2008 26
Acknowledgements• Partners in crime:
– Allen White– Dan Gottas, David Kingsmill, Paul
Neiman, Bob Zamora
This research was supported by an appointment to the National Oceanic and Atmospheric Administration Research Participation Program through a grant award to Oak Ridge Institute for Science and Education.
4 August 2008 27
Bibliography• White, Allen B., Daniel J. Gottas, Eric T. Strem, F. Martin Ralph, and
Paul J. Neiman. "An Automated Brightband Height Detection Algorithm for Use with Doppler Radar Spectral Moments." Journal of Atmospheric and Ocean Technology 19 (2002): 687-696.
• White, Allen B., Paul J. Neiman, F. Martin Ralph, David E. Kingsmill, and P. Olga G. Persson. "Coastal Orographic Rainfall Processes Observed by Radar During the California Land-Falling Jets Experiment." Journal of Hydrometeorology 4 (2003): 264-282.
• White, Allen B., James R. Jordan, Brooks E. Martner, F. Martin Ralph, and Bruce W. Bartram. "Extending the Dynamic Range of an S-Band Radar for Cloud and Precipitation Studies." Journal of Atmospheric and Ocean Technology 17 (2000): 1226-1234.