The Selection of Alarm Levels for Personnel Exit Monitors
59
Page 1 of 59. Interim Issue Dec 2009 Operational Monitoring Good Practice Guide The Selection of Alarm Levels for Personnel Exit Monitors Industry Radiological Protection Coordination Group
Transcript of The Selection of Alarm Levels for Personnel Exit Monitors

Page 1 of 59.
Interim Issue Dec 2009
Operational Monitoring Good Practice Guide
The Selection of Alarm Levels for Personnel Exit Monitors
Industry Radiological Protection Coordination Group

Page 2 of 59.
Contents
Foreword 3 Abbreviations 4
1. Introduction 5 2. Application 6 3. Role and Limitations of Personnel Exit Monitoring 7 4. Alarm Setting Methodology 9 5. Worked Examples 11
5.1. AGR Fingerprint 12
6. References 18 7. Working Group – Membership 20
Appendices Appendix A: Risk Assessment and Derivation of Minimum Detection Objective 21 Appendix B: Determination of Radiological Impact 25 Appendix C: Choice of P-factors for Hands and Clothing 31 Appendix D: Calculation of Instrument Response 38 Appendix E: Use of Statistics in Alarm Level Selection 41 Annex to Appendix E: Derivation of Effective and Limiting Alarm Thresholds 46 Appendix F: Operational Alarm Levels 48 Appendix G: Alarm Level Selection - ALARP Assessment 54 Appendix H: Worked Examples 59 Appendix H1 - High Energy Beta Fingerprint later Appendix H2 - Low Energy Beta Fingerprint later Appendix H3 - Low Energy Alpha Fingerprint later Appendix H4 - Higher Energy Alpha Fingerprint later

Page 3 of 59.
Foreword The UK Industry Radiological Protection Coordination Group has written this Good Practice Guide for the radiation user community. Membership of this group includes active participants of the UK Ionising Radiations Metrology Forum; thus, it was seen as a document that compliments the existing suite of Good Practice Guides published by the NPL. The guidance is produced to supplement the requirements of the Ionising Radiations Regulations 1999 and its associated Approved Code of Practice. It should also be used with other Good Practice Guides, in particular, NPL numbers 14, 29 and 49. Reference should also be made to the Nuclear Industry Code of Practice for Changerooms where appropriate. The intention of this Good Practice Guide is to provide the Radiological Protection Adviser with a practical framework to determine the appropriate alarm levels required for personnel on final exit from their working environment. The information produced will enable the Qualified Person to set up the instrumentation to meet these requirements. This guidance provides a common methodology in the derivation and application of alarm levels. It should be noted that this does not mean that alarm levels will be the same from site to site as sites (and buildings) vary. An alarm level which produces virtually no false alarms on one site could well produce a totally unacceptable false alarm rate on another site. Factors that will be taken into account for the chosen alarm levels will be, for example, the differences in the radionuclides of interest at an individual site, the gamma background, the influence of radon, the instrumentation deployed, the staff throughput and the level of confidence required in the final exit process. This guidance reviews the present science and provides worked examples for some common radionuclides that take into account contributions to dose from skin dose, inhalation and ingestion. The framework starts with a risk assessment of the operations followed by the identification and examination of the operational fingerprint. The reader will be prompted to think about practical detection P-Factors, statistics and also choosing the appropriate radioactive sources for instrumentation set up, calibration and functional testing. The guidance also has a section on limitations of detection in the field and includes information gained from experience for specific instrumentation. Finally, worked examples are provided for a number of common radionuclides that derive achievable alarm levels in a well set up final exit monitoring regime. The guidance is for final exit monitoring of personnel. It may however, be used for sub-change areas where the arrangements meet the assumptions in this guide. This guidance is not appropriate for use in demonstrating compliance with the Nuclear Industry Code of Practice on Clearance and Exemption.

Page 4 of 59.
Abbreviations 1. IRPCG
The Industry Radiological Protection Co-ordination Group consists of radiological protection specialists from nuclear site licensees that meet to consider regulatory developments, share experience and promote co-operation across the industry leading to publication of good practice guides and codes of practice on key radiological protection issues
2. IRMF
The Ionising Radiations Metrology Forum consists of representatives of UK establishments and organisations actively involved in radiation measurement for protection purposes; it is the aim of the forum to facilitate the exchange of information regarding UK calibration facilities and their efficient use by those required to comply with the regulations
3. DWL
Derived Working Level 4. GPG
Good Practice Guide 5. MDO
Minimum Detection Objective: a level determined from assessment of harm from a fingerprint above which it is determined that best practice can no longer be said to apply
6. MOL
Minimum Operational Level: the point below which it is not good practice to set alarm level values due to an excessive false alarm rate
7. MIL
Minimum Instrument Level: a limiting value below which the instrument itself will inhibit operation, e.g. because it detects that the background is too high, and will indicate a „fault‟ (inoperable) condition
8. NICOP Changerooms
Nuclear Industry Code of Practice for Changerooms
9. NICOP C&E Nuclear Industry Code of Practice on Clearance and Exemption
10. NPL
National Physical Laboratory 11. PEM
Personnel Exit Monitor

Page 5 of 59.
1. Introduction This good practice guide has been prepared as part of a project sponsored by the UK Industry Radiological Protection Co-ordination Group. The original terms of reference of the project were to establish a consistent method for monitoring of personnel from designated areas and to define a consistent set of detection levels for final exit monitors to be used by the industry. This would benefit the industry by ensuring personnel are all monitored on final exit from designated areas to a consistent clearance level and also assist promotion of a common understanding of the limitations of final exit monitoring. The principal aim of the project was to publish a final exit monitoring good practice guide that was agreed by the industry and acknowledged by the regulators. The initial scope included standardisation of equipment and associated procedures for calibration and set up. A working group was established comprising qualified persons and radiation protection advisers from a range of nuclear operators as well as active participants from the Ionising Radiations Metrology Forum. The working group initial conclusion was that, whilst the clearance levels applied across the industry were broadly comparable, there was wide variation in the interpretation of procedures used to determine alarm levels. As a result, the main aim of the project was changed, to the „development of an open and transparent methodology that determines alarm level values for exit monitors based upon acknowledged good practice‟. Individual nuclear operators would be expected to use this guide as a benchmark for their existing alarm level values, but not necessarily their set up procedures, and to determine whether any revision to alarm levels is justified or reasonably practicable. This guide has been written in the form of a process flowchart that refers out to a series of appendices that provide detailed information and recommendations to the RPA and Qualified Person on the factors to consider when selecting alarm level values. Also included is an appendix that defines reasonably practicable alarm level values suitable for application with modern exit monitors situated in well-designed changerooms. It is also intended, that the worked examples for the commonly encountered radionuclides may inform future industry processes that aspire towards common alpha and beta alarm level values on sites where there is a common radionuclide mix.

Page 6 of 59.
2. Application
This guide is applicable to the use of personnel monitors and hand and foot monitors of various types that are in common use throughout the nuclear industry. For the purposes of this guide these instruments will be collectively referred to as Personnel Exit Monitors (PEMs). PEMs used for final exit monitoring should be sited following guidance in the NICOP Changerooms. Application to sub change areas may also be possible. Where a PEM is sited in a final exit changeroom which is not compliant with the NICOP Changerooms it is the responsibility of the operator to justify that the chosen alarm level value is as low as reasonably practicable. The principles in this guide can be applied to any gas proportional or scintillation counter that generates an alarm based upon an integrated count. It is therefore the intent that this guide can also be applied to frisk probes used in support of PEMs located in final exit changerooms. This guidance is not appropriate for use in demonstrating compliance with the NICOP C&E.

Page 7 of 59.
3. Role and Limitations of Personnel Exit Monitoring
Personnel exit monitors are not operated in isolation but are used to compliment a series of upstream controls designed to ensure that significant levels of contamination are not removed from controlled contamination areas, either on articles or on the skin or personal clothing of individuals. It is the case that protection starts at source by provision of engineered controls to provide containment of radioactive material and, where appropriate, this is supported by ventilation control systems. A defence in depth approach is applied. Where there is a risk of containment loss then supplementary controls at the work area are applied. Portable frisk probes are used to identify where control of contamination has failed and removal of Personal Protective Equipment (PPE) ensures that the majority of the contamination risk remains in the work area. Health physics personnel may also be in attendance or the work may be supported by workers suitably trained in operational monitoring. It is best practice to implement a zoning approach to contamination control. Monitoring stations are located at the exits of higher risk areas of the plant. Many workers are trained to carry out monitoring using frisk probes. Control arrangements are described in Local Rules. The workplace is also subject to a regular regime of surface contamination monitoring that may be supported by static and real time air sampling. Together these provide a sensitive indicator to the breakdown of control such that early corrective action can be taken to minimise the spread of contamination. As a consequence, the risk of a worker receiving prolonged exposure to significant contamination is expected to be low. Workers then attend a changeroom. From the NICOP Changerooms, best practice is to locate frisk probes and/or hand monitor(s) prior to entrance to the changeroom. Outer layers of PPE are generally removed as part of the changeroom undress procedure. These actions ensure that the clothing with the highest potential to be contaminated is left on the designated side of the changeroom. The expectation then is that workers presenting themselves for final monitoring are unlikely to have high levels of contamination on their persons. This is confirmed in practice, as personal contamination is not a normal occurrence during final monitoring. The final stage of exit monitoring is therefore provided as a re-assurance check for personal radiological protection purposes and is applied in a low radiation background area. This involves use of frisk probes and installed, fixed geometry monitors that apply a defined duration integrating count process. PEMs comprise Installed Personal Monitors and Hand and Foot Monitors of various types and are in common use throughout the nuclear industry. Frisk probes use hand held detectors that may have a better overall detection threshold than PEMs, particularly for spot contamination, but have an increased risk of missing contamination due to variable speed of use, the difficulty of reaching parts of the body, the distance between the detector and the contamination source and the orientation with respect to the background radiation. It is therefore important that in order to achieve a high standard of monitoring practice the use of frisk probes is supported by an appropriate training programme. This training programme should cover:

Page 8 of 59.
the limitations of both the PEMs and the frisk probes
the correct procedure – distance from the body and rate of movement
the time that a proper frisk should take, generally at least one minute, and
be followed up by regular toolbox talks PEMs are designed to compliment the frisk probe monitoring process by removing some of the variability. PEM type exit monitors also have limitations and should not be viewed as infallible. They work well where the detector is in direct contact with the surface to be monitored and thus are effective for the hands and feet and some parts of the body. Their performance is degraded where the fixed geometry configuration of the detectors has a dominant effect on the overall detection efficiency. This is the case for low energy beta radionuclide detection on areas such as the knees where the detector can be up to 200 mm from the clothing surface, (Lunn and Renn, 2001). In addition, the detection of alpha radionuclides is also affected by surrounding contamination and dust (Semkow et al, 2004), to the extent that detection anywhere other than the hands is reduced (e.g. feet) or very unreliable (e.g. body). Note, however, that with some fingerprints the limitations of frisk probes are such that they may not be able to identify and locate contamination indicated by the PEM. This is particularly the case where the contamination is smeared out, rather than in spots. Care must be taken with respect to averaging areas as localised contamination that can result in a significant beta skin dose rate can fail to generate an alarm if the contamination is averaged over too large an area. A contamination occurrence detected by a PEM will usually mean that there has been a failure of the upstream contamination control arrangements. This may be due to a failure to follow the monitoring and decontamination procedures at the work location, a failure to use the frisk probes correctly or it may indicate that existing procedures and changeroom practices are inappropriate. In such circumstances, it is best practice to investigate and address the underlying causes of all PEM alarms. Responding to occurrences of missed contamination by attempting to increase the sensitivity of PEM type monitors to low or degraded energy radionuclides by reducing the alarm level should be applied with caution. The potential for increased false alarms and the need to consider implementation of complex alarm response actions are amongst the important factors that are discussed later in this guide. For the above reasons it is best practice that PEM type monitors are always operated in conjunction with a correctly used frisk probe so that a detector can be placed in direct contact with the potentially contaminated surfaces.
Page 9 of 59.
Conduct Prior Risk Assessment
Determine Minimum Instrument Level
Calculate Instrument Response(s) to Fingerprint(s)
Identify Exit Monitor Options
Determine Minimum Detection Objective
Evaluate Radionuclide Fingerprint
Demonstrate Instrument(s) Conform(s) to Type Test data
Carry Out ALARP Review
Record and Implement Selected ALARP Alarm Level
Appendix A
Appendix B
Appendix A & B
Appendix C,D
Appendix E
Appendix E,F
Appendix G
Revie
w C
on
clu
sio
ns
Derive Optimised Combination of Instrument Type(s)
Determine Minimum Operational Level
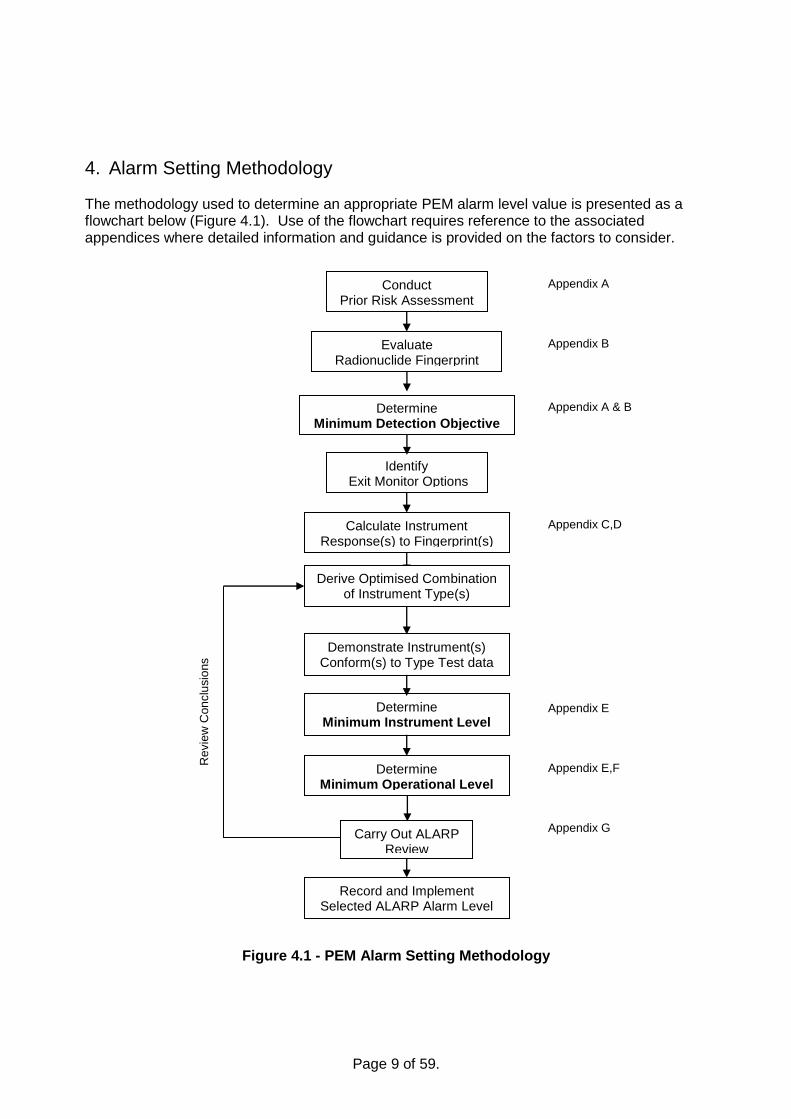
4. Alarm Setting Methodology
The methodology used to determine an appropriate PEM alarm level value is presented as a flowchart below (Figure 4.1). Use of the flowchart requires reference to the associated appendices where detailed information and guidance is provided on the factors to consider.
Figure 4.1 - PEM Alarm Setting Methodology

Page 10 of 59.
The flowchart above defines the range of permissible alarm level values for a given fingerprint. It is normal to determine separate alpha and beta fingerprints and alarms. The range is bounded at the upper level by the Minimum Detection Objective (MDO), above which good practice can no longer be said to apply. The lower end defines the Minimum Operational Level (MOL), i.e. the point below which it is not good practice to set alarm level values due to an excessive false alarm rate. Between the MDO and MOL it is the responsibility of the operator to justify that the proposed alarm level value is as low as reasonably practicable (ALARP). At some lower level again is a limiting value, the Minimum Instrument Level (MIL), below which the instrument itself will inhibit operation, e.g. because it detects that the background is too high, and will indicate a „fault‟ (inoperable) condition. These different levels are summarised in Figure 4.2, below.
Figure 4.2 – Selection of ALARP Alarm Level
Minimum Detection Objective (MDO)
Minimum Operational Level (MOL)
Minimum Instrument Level (MIL))
ALARP REGION ALARP Alarm Level Region

Page 11 of 59.
5. Worked Examples Appendix H provides a number of worked examples that illustrate the range of alarm level values for the commonly encountered radionuclides. The examples assume the use of modern PEMs that are located in areas of low radiation background as required by the NICOP Changerooms. Provision of the worked examples for some of the commonly encountered radionuclides may assist the nuclear industry to consider whether there is merit in adopting common PEM alpha and beta alarm level values on different sites where there is a common radionuclide mix. As already discussed site set up procedures and assumptions for PEMs vary across the industry. It is not the intention of this guide to require operators to change existing calibration and set up procedures to be consistent with the methodology used in this guide. Instead, operators are expected to compare their current alarm level values against those values derived by the methodology used in this guide. In many cases, a short note will be sufficient to provide comparison with the ALARP region defined by the MDO and MOL. This will result in either the lowering of existing alarm levels used on a site or a record that demonstrates that the current PEM alarm values are as low as reasonably practicable. For this issue an example is provided here to illustrate the processes applied through the appendices. The Appendix H examples will be added in later because there have been changes in the process since their original submission and they therefore need to be revised to follow the later process.

Page 12 of 59.
5.1 Worked Example - AGR Fingerprint From Appendix A - Risk Assessment and Derivation of MDO Exit monitor alarm levels have been based upon the historic DWLs of 4 Bq cm-2 beta and 0.4 Bq cm-2 alpha contaminations. This has been permitted over an area not exceeding 100 cm2, i.e. 400 Bq (β) and 40 Bq (α). However historically, it has been the dominant radionuclides that have been taken into account when setting the alarm levels, say 60Co and 241Am. Dominant in this case means the most measurable with reasonable abundance in the fingerprint. As part of the risk assessment stage, there is evidence that gamma detectors are beneficial for AGR fingerprint detection and are included in this example. Cobalt-60 is regarded as a dominant radionuclide for AGRs and there is evidence that it does appear entirely in isolation as a hot particle. The beta component of the 60Co can be absorbed/attenuated and, if it is on a part of the body that is not in direct contact with the beta detectors, it could be missed. Gamma monitors have proved to be very valuable for detecting 60Co that otherwise has not triggered the beta alarms. From Appendices A & B – Determination of Radiological Impact and Instrument Detection Capability A typical AGR Pile Cap fingerprint has been used. The percentage of each radionuclide alongside the dosimetric value of this fingerprint has been analysed. This information is shown in Table 5.1.1. The overall MDO has been calculated using the process and equations in Appendix A. The dose limits used for the MDO are in respect of a worker, but see “From Appendix G” below. The response of the PEM in use (the Rados RTM860UK-2) is shown in Table 5.1.2. The most likely alpha, beta and photon energies have been listed for an overall activity of 100 Bq. From Appendix C – P-factors, and Appendix D – Instrument Response The P-factors for the alpha and beta detectors have been determined, based upon the energies and emission probabilities of each radionuclide, together with considerations in respect of skin or lab-coat surfaces as described in Appendix C. A similar approach has been adopted for the P-factors of various photon energies for the gamma detectors. The response to a few radionuclides of varying energies has been recorded from type test data for the instrument (see Type test references), enabling response curves to be drawn up. The response curves provide a method of determining the response of the instrument to the radionuclide energies not included in the type tests report. These data are shown in Table 5.1.2. From Table 5.1.2 it can be seen, in 100 Bq of activity, how many Bq are attributed to each radionuclide (column 2). This number is divided by the P-factor (Column 6 or 7) and then

Page 13 of 59.
multiplied by the percentage efficiency of the detector to that radionuclide to give the detector response in counts per second (cps). The energy response curves show energy dependence only and are not related to the emission probabilities of the given radionuclides. Emission probabilities are accounted for in deriving P-factors - it is important to ensure that they are accounted only once, i.e. they are not accounted for in detector efficiency. For example, the gamma P-factor for 60Co is close to 1 since two energetic photons are emitted per disintegration (Bq), whereas the P-factor for 55Fe takes account of a total photon emission probability of only 28%. Similarly, the P-factor for 90Sr/90Y is close to 1 due to two beta emissions per 90Sr disintegration. It can be seen that applying the basic calculation from Appendix D, Equation D3, for each radionuclide in the fingerprint, that the instrument output in counts per second can be determined (Table 5.1.2, last 4 columns). From Appendix E – Use of Statistics in Alarm Levels Selection The following parameters and measurements are logged in the instrument‟s software Background count rate 25 cps Background update time 100 s Probability of false alarm 3.1σ Monitoring time 5 s Probability of detection 2.4σ Table 5.1.3 uses Appendix E formulae to generate limiting count rates for MIL and MOL for the instrument with their corresponding activity levels. From Appendix F – Operational Alarm Levels Table 5.1.3 provides comparison of MIL and MOL against MDO and also against the existing instrument settings. The values allow margin for variations in background and any instrument effects. Consideration can also be given to optimising check sources for routine and periodic tests. From Appendix G – Alarm Level Selection – ALARP Assessment Given the derived MDO, there is opportunity for optimisation. It is possible to review various aspects of the MDO derivation and review various of the instrument parameters. For example, the fingerprint generates an extremity dose rate of 1.4E-7 Sv h-1 Bq-1 cm2, i.e. if the MDO as shown was accepted as an alarm level, an operator contaminated at the MDO could receive an extremity dose rate of 2.1 mSv h-1. Setting at less than MDO is therefore desirable. An operator contaminated at the MOL might receive an extremity dose rate of 0.086 mSv h-1. Choice of MDO influences, using the principles in Appendix A, should be provided in the ALARP justification report for the alarm level settings. Choice of alarm level within the ALARP region should also be justified and reported.

Page 14 of 59.
It can be seen from Table 5.1.2 that an appropriate alarm level for the alpha detectors for this fingerprint is not practical. It is deemed that the lowest possible instrument setting is 2 cps. The alpha component comprises 1% of the fingerprint and there would need to be over 200 kBq of fingerprint before the alpha detector would alarm. Clearly, the beta and gamma alarms would have triggered well below this level.

Page 15 of 59.
Table 5.1.1 - Dose per Bq of activity in BE sample fingerprint and resultant MDO
Radionuclide Activity %
Skin dose mSv/h per kBq/cm
2
Sample Skin Dose (Sv/h) per (Bq/cm
2)
Ingestion Dose Sv/Bq
Sample Ingestion
Dose Sv/Bq
Inhalation Dose Sv/Bq
Sample Inhalation
Dose Sv/Bq
H-3 14.490 0.0E+00 0 1.8E-11 2.6E-12 1.8E-11 2.6E-12
C-14 1.155 3.2E-01 3.7E-09 5.8E-10 6.7E-12 5.8E-10 6.7E-12
S-35 0.068 3.5E-01 2.4E-10 7.7E-10 5.3E-13 1.3E-09 8.9E-13
Cl-36 0.072 1.7E+00 1.2E-09 9.3E-10 6.7E-13 6.9E-09 5.0E-12
Ca-45 0.028 8.4E-01 2.3E-10 7.6E-10 2.1E-13 2.7E-09 7.6E-13
Sc-46 0.014 1.4E+00 1.9E-10 1.5E-09 2.1E-13 6.4E-09 9.1E-13
Cr-51 1.028 1.5E-02 1.5E-10 3.8E-11 3.9E-13 2.1E-11 2.2E-13
Mn-54 4.958 6.2E-02 3.1E-09 7.1E-10 3.5E-11 1.2E-09 5.9E-11
Fe-55 55.686 1.6E-02 9.0E-09 3.3E-10 1.8E-10 9.2E-10 5.1E-10
Fe-59 0.072 9.7E-01 7.0E-10 1.8E-09 1.3E-12 2.2E-09 1.6E-12
Co-58 0.141 3.0E-01 4.2E-10 7.4E-10 1.0E-12 1.5E-09 2.1E-12
Co-60 14.206 7.8E-01 1.1E-07 3.4E-09 4.8E-10 1.7E-08 2.4E-09
Ni-63 6.819 0 0 1.5E-10 1.0E-11 5.2E-10 3.5E-11
Zn-65 0.403 7.6E-02 3.1E-10 3.9E-09 1.6E-11 2.9E-09 1.2E-11
Se-75 0.006 1.4E-01 8.6E-12 2.6E-09 1.6E-13 1.0E-09 6.0E-14
Sr-90 / Y-90 0.087 3.5E+00 3.1E-09 2.8E-08 2.4E-11 3.0E-08 2.6E-11
Nb-94 0.005 2.4E+00 1.1E-10 1.7E-09 7.7E-14 1.0E-08 4.5E-13
Nb-95 0.034 2.4E+00 8.3E-10 5.8E-10 2.0E-13 1.4E-09 4.8E-13
Zr-95 / Nb-95 0.031 1.6E+00 4.9E-10 8.8E-10 2.7E-13 2.5E-09 7.8E-13
Ru-103 / Rh-103m 0.020 7.8E-01 1.6E-10 7.3E-10 1.4E-13 4.9E-10 9.7E-14
Ru-106 / Rh-106 0.050 2.2E+00 1.1E-09 7.0E-09 3.5E-12 9.8E-09 4.9E-12
Ag-108m 0.005 1.6E+00 7.9E-11 2.3E-09 1.1E-13 6.1E-09 3.0E-13
Ag-110m 0.027 6.8E-01 1.8E-10 2.8E-09 7.5E-13 5.5E-09 1.5E-12
Sb-124 0.015 2.2E+00 3.2E-10 2.5E-09 3.7E-13 1.3E-09 1.9E-13
Sb-125 /Te-125m 0.011 1.3E+00 1.4E-10 1.1E-09 1.2E-13 1.4E-09 1.5E-13
I-129 0.000 3.4E-01 1.5E-16 1.1E-07 4.8E-17 3.7E-08 1.6E-17
Ba-133 0.006 1.3E-01 7.4E-12 1.0E-09 5.7E-14 1.5E-09 8.5E-14
Cs-134 0.025 1.4E+00 3.3E-10 1.9E-08 4.7E-12 9.6E-09 2.4E-12
Cs-137 / Ba-137m 0.166 1.6E+00 2.6E-09 1.3E-08 2.2E-11 4.8E-09 8.0E-12
Ce-144 0.015 1.8E+00 2.7E-10 5.2E-09 7.8E-13 3.4E-08 5.1E-12
Pr-144 2.1E+00 3.2E-10 5.0E-11 7.5E-15 3.0E-11 4.5E-15
Pm-147 0.017 6.0E-01 9.9E-11 2.6E-10 4.3E-14 4.7E-09 7.8E-13
Eu-152 0.009 9.2E-01 8.7E-11 1.4E-09 1.3E-13 3.9E-08 3.7E-12
Eu-154 0.012 2.1E+00 2.4E-10 2.0E-09 2.3E-13 5.0E-08 5.8E-12
Eu-155 0.007 3.3E-01 2.3E-11 3.2E-10 2.2E-14 6.5E-09 4.5E-13
Ta-182 0.026 2.4E+00 6.2E-10 1.5E-09 3.9E-13 7.2E-09 1.9E-12
Hg-203 0.012 8.9E-01 1.1E-10 1.9E-09 2.3E-13 5.7E-10 6.9E-14
U-234 0.0019 0 0 4.9E-08 9.4E-13 5.5E-07 1.1E-11
U-235 0.0001 1.8E-01 1.5E-13 4.6E-08 3.8E-14 5.1E-07 4.3E-13
Th-231 9.4E-01 7.9E-13 3.4E-10 2.8E-16 4.0E-10 3.3E-16
U-236 0.0013 0 0 4.6E-08 6.2E-13 5.2E-07 7.0E-12
U-238 0.0015 2.3E-03 3.4E-14 4.4E-08 6.6E-13 4.9E-07 7.4E-12
Th-234 3.5E-01 5.3E-12 3.4E-09 5.1E-14 5.8E-09 8.8E-14
Pa-234m 2.4E+00 3.6E-11 0 0 0 0
Pu-238 0.0042 3.7E-03 1.6E-13 2.3E-07 9.7E-12 4.3E-05 1.8E-09
Pu-239 0.0022 1.4E-03 3.2E-14 2.5E-07 5.5E-12 4.7E-05 1.0E-09
Pu-240 0.0053 0 0 2.5E-07 1.3E-11 4.7E-05 2.5E-09
Pu-241 0.2410 0 0 4.7E-09 1.1E-11 8.5E-07 2.0E-09
Am-241 0.0147 2.0E-02 2.9E-12 2.0E-07 2.9E-11 3.9E-05 5.7E-09
Cm-242 0.0003 0 0 1.2E-08 4.1E-14 4.8E-06 1.6E-11
Cm-243 0.0000 0 0 1.5E-07 1.4E-14 2.9E-05 2.8E-12
Cm-244 0.0007 2.2E-03 1.5E-14 1.2E-07 8.0E-13 2.5E-05 1.7E-10
Total 100.000 1.4E-07 8.7E-10 1.6E-08
Dose limit 0.500 Sv/a 0.020 Sv/a 0.020 Sv/a
Averaging area 1 cm2 10 cm
2 100 cm
2
Exposure time 200 h/a 200 d/a 200 h/a
MDO contributions 1.8E+04 Bq 1.1E+05 Bq 5.1E+06 Bq
MDO Combined 1.5E+04 Bq
Yellow shading is most prominent components. Ce and U daughters are assumed at parent concentration

Page 16 of 59.
Table 5.1.2 - RADOS RTM860UK-2 response to a typical AGR fingerprint
RTM860UK
Radionuclide
Component (Bq)
in 100 Bq total
Energies (MeV) P-factor Detector efficiency to radionuclide SER
Detector Response to 100 Bq (cps)
α β photon β,α γ α β contact
β BAE
γ α β β body
γ
H-3 14.490 0.019 6 0.00 0.00 0.00 0.00
C-14 1.155 0.156 6 0.22 0.02 0.04 0.00
S-35 0.068 0.167 6 0.22 0.02 0.00 0.00
Cl-36 0.072 0.710 2 0.44 0.20 0.02 0.01
Ca-45 0.028 0.257 4 0.28 0.05 0.00 0.00
Sc-46 0.014 0.360 0.889 4 1 0.38 0.08 0.20 0.00 0.00 0.00
Cr-51 1.028 0.000 0.320 6 10 0.06 0.00 0.03 0.01 0.00 0.00
Mn-54 4.958 0.000 0.835 6 2 0.07 0.00 0.20 0.06 0.00 0.50
Fe-55 55.686 0.000 0.006 6 6 0.06 0.00 0.00 0.56 0.00 0.00
Fe-59 0.072 0.467 1.099 4 2 0.40 0.18 0.20 0.01 0.00 0.01
Co-58 0.141 0.475 0.811 12 2 0.40 0.02 0.20 0.00 0.00 0.01
Co-60 14.206 0.318 1.333 4 1 0.38 0.16 0.20 1.35 0.57 2.84
Ni-63 6.819 0.066 6 0.04 0.00 0.05 0.00
Zn-65 0.403 0.330 1.116 50 4 0.01 0.00 0.20 0.00 0.00 0.02
Se-75 0.006 0.000 0.136 4 2 0.10 0.00 0.01 0.00 0.00 0.00
Sr-90 / Y-90 0.087 0.546 1 0.44 0.18 0.04 0.02
Nb-94 0.005 0.470 0.871 4 1 0.40 0.18 0.20 0.00 0.00 0.00
Nb-95 0.034 0.160 0.766 6 2 0.22 0.02 0.20 0.00 0.00 0.00
Zr-95 / Nb-95 0.031 0.360 0.757 3 1 0.38 0.16 0.20 0.00 0.00 0.01
Ru103/Rh103m 0.020 0.220 0.497 4 4 0.26 0.15 0.14 0.00 0.00 0.00
Ru-106/Rh-106 0.050 0.039 0.512 1 6 0.44 0.20 0.15 0.02 0.01 0.00
Ag-108m 0.005 0.000 0.614 4 1 0.07 0.00 0.20 0.00 0.00 0.00
Ag-110m 0.027 0.090 0.658 6 1 0.08 0.00 0.22 0.00 0.00 0.01
Sb-124 0.015 0.612 0.603 2 1 0.44 0.19 0.20 0.00 0.00 0.00
Sb125/Te125m 0.011 0.310 0.428 4 1 0.38 0.16 0.10 0.00 0.00 0.00
I-129 0.000 0.150 0.030 6 6 0.20 0.02 0.00 0.00 0.00 0.00
Ba-133 0.006 0.000 0.356 4 2 0.07 0.00 0.04 0.00 0.00 0.00
Cs-134 0.025 0.660 0.605 3 1 0.44 0.20 0.20 0.00 0.00 0.00
Cs137/Ba137m 0.166 0.512 0.662 2 2 0.40 0.18 0.22 0.03 0.01 0.02
Ce-144 0.015 0.320 0.134 4 10 0.38 0.16 0.00 0.00 0.00 0.00
Pr-144 3.000 2 0.44 0.20 0.00 0.00
Pm-147 0.017 0.225 4 0.26 0.15 0.00 0.00
Eu-152 0.009 0.000 0.122 6 2 0.06 0.00 0.20 0.00 0.00 0.00
Eu-154 0.012 0.571 0.123 3 2 0.44 0.19 0.00 0.00 0.00 0.00
Eu-155 0.007 0.150 0.087 6 6 0.18 0.02 0.00 0.00 0.00 0.00
Ta-182 0.026 0.522 1.121 2 2 0.40 0.18 0.20 0.01 0.00 0.00
Hg-203 0.012 0.210 0.279 4 4 0.26 0.02 0.01 0.00 0.00 0.00
U-234 0.0019 4.8 0.000 0.130 6 6 0.15 0.52 0.00 0.00 0.00 0.00 0.00 0.00
U-235 0.0001 4.4 0.000 0.186 6 6 0.14 0.52 0.00 0.00 0.00 0.00 0.00 0.00
Th-231 0.288 0.013 4 6 0.24 0.15 0.00 0.00 0.00 0.00
U-236 0.0013 4.5 0.000 0.015 6 6 0.14 0.52 0.00 0.00 0.00 0.00 0.00 0.00
U-238 0.0015 4.2 0.000 0.015 6 6 0.14 0.52 0.00 0.00 0.00 0.00 0.00 0.00
Th-234 0.189 0.013 8 20 0.22 0.02 0.00 0.00 0.00 0.00
Pa-234m 2.280 2 0.44 0.20 0.00 0.00
Pu-238 0.0042 5.5 0.000 0.017 6 6 0.26 0.52 0.00 0.00 0.00 0.00 0.00 0.00
Pu-239 0.0022 5.2 0.000 0.017 6 6 0.17 0.52 0.00 0.00 0.00 0.00 0.00 0.00
Pu-240 0.0053 5.2 0.000 0.017 6 6 0.17 0.52 0.00 0.00 0.00 0.00 0.00 0.00
Pu-241 0.2410 0.020 6 0.00 0.00 0.00 0.00
Am-241 0.0147 5.5 0.000 0.060 6 6 0.26 0.52 0.00 0.00 0.00 0.00 0.00 0.00
Cm-242 0.0003 6.1 0.000 0.018 6 6 0.26 0.52 0.00 0.00 0.00 0.00 0.00 0.00
Cm-243 0.0000 5.8 0.000 0.278 6 6 0.26 0.52 0.00 0.01 0.00 0.00 0.00 0.00
Cm-244 0.0007 5.8 0.000 0.018 6 6 0.26 0.52 0.00 0.00 0.00 0.00 0.00 0.00
100.00 0.00 2.22 0.64 3.44
Yellow shading is most prominent radionuclides Grey shading indicates where there is a beta response but not from a beta emission Ce and U daughters are assumed at parent concentration

Page 17 of 59.
Table 5.1.3 – Calculated MIL and MOL and comparison against MDO and Settings now
Detection β β body γ
Detector response per 100 Bq 2.22 0.64 3.44 cps
Efficiency 4π 2.22 0.63 3.44 %
Background 25 cps
Background time 100 s
Probability of false alarm 3.1 σ
Monitoring time 5 s
Probability of detection 2.4 σ
MIL 7.10 7.10 7.10 cps
MIL 320 1120 207 Bq
MOL 13.90 13.90 13.90 cps
MOL 627 2192 404 Bq
MDO 15226 15226 15226 Bq
Settings now
Assumed efficiency 4π 21.25 6 8 %
Alarm Level 85 24 32 cps
Assumed Alarm Level 400 400 400 Bq
Actual Alarm Levels 3825 3773 931 Bq

Page 18 of 59.
6. References
British Energy database of radionuclide information and dose coefficients Changeroom Design, Operation and Maintenance, A Nuclear Industry Code of Practice, IRPCG July 2006 (NICOP Changerooms) Clearance and Exemption, Principles, Processes and Practices for Use by the Nuclear Industry, A Nuclear Industry Code of Practice, CEWG August 2006, website: www.cewg.safety-directors-forum.org (NICOP C&E) Currie L.A., Limits for Qualitative Detection and Quantitative Determination, Analytical Chemistry Vol. 40, No. 3 March 1968 DL2, Derived Limits for Surface Contamination, 1979, Wrixon A.D., Linsley G.S., Binns K.C. and White D.F., NRPB DL2 DL2 supplement, Derived Limits for Surface Contamination, 1982, Wrixon A.D. and Linsley G.S., Supplement to NRPB DL2 Felgate C.E., The effects of surface materials on radioactive surface contamination measurements, Report RSA (Ext) 4, March 1990, National Physical Laboratory ICRP 68, Dose Coefficients for Intakes of Radionuclides by Workers, Annals of the ICRP Vol. 24 No.4 1994 ICRP 75, General Principles for the Radiation Protection of Workers, Annals of the ICRP Vol. 27 No.1 1997 IEC 61098, Radiation Protection Instrumentation – Installed Personnel Surface Contamination Monitoring Assemblies, 2nd edition 2003-11 IRR99 ACOP, Work with Ionising Radiation, Ionising Radiations Regulations 1999, Approved Code of Practice and Guidance, L121, HSE Books, 2000, ISBN 0717617467 IRR99, The Ionising Radiations Regulations 1999, Statutory Instrument 1999 No. 3232, Stationary Office, 1999, ISBN 0110856147 ISO 7503-1:1988, Evaluation of surface contamination - Part 1: Beta-emitters (maximum beta energy greater than 0,15 MeV) and alpha-emitters (This document is under revision) ISO 11929-1:2000 Determination of the detection limit and decision threshold for ionizing radiation measurements – Part 1 Fundamentals and application to courting measurements without the influence of sample treatment, BS ISO 11929-1:2000 Lunn and Renn, Practical limitations of monitoring personal contamination at a PWR, BNES, 2001

Page 19 of 59.
National Physical Laboratory, Measurement Good Practice Guide No. 29, The Examination, Testing and Calibration of Installed Radiation Protection Instruments, NPL, 2001 Nexia Solutions Report (05)6761 (Table 17) British Energy, 2005 RPD2002, Radionuclide and Radiation Protection Data Handbook 2002, Radiation Protection Dosimetry Vol. 98 No. 1 2002 Semkow T.M., Bari, A., Parekh, D.K., Haines, D.K., Gao, H., Bolden, A.N., Dahms, K.S., Scarpitta, S.C., Thern, R.E. & Velazquez, Experimental investigation of mass efficiency curve for alpha radioactivity counting using a gas-proportional detector, Applied Radiation and Isotopes 60: 879-886; 2004 Type test of the Rados RTM860UK Body Contamination Monitor, T3914/01/50/001 Radiation Metrology Bulletin 118 Type test of the Rados RTM860UK gamma detectors, email from Rados to R Dubouchet, Sept 2009

Page 20 of 59.
7. Working Group – Membership
Kathleen Stevenson, UKAEA, has been the Project Sponsor for the following IRPCG working group
Stuart Fannin UKAEA, now NII (Chairman) David McAulay British Energy (Secretary) Pete Burgess NPL, now Nuvia Ltd Andrew Burt Babcock Marine (Devonport) Mick Coffey AWE Fiona Dagless AWE Geoff Druce AWE Rhonda Dubouchet British Energy Dave Evans Rolls Royce Mike Renouf Sellafield Ltd Eliot Williams Sellafield Ltd

Page 21 of 59.
Appendix A
Risk Assessment and Derivation of Minimum Detection Objective Risk Assessment and the derivation of levels of harm from specific radionuclide mixes The Ionising Radiations Regulations 1999 (IRR99) regulation 7 establishes the need for risk assessment with respect to activities involving work with ionising radiations, for the purposes of identifying measures needed to restrict exposure to persons. The Approved Code of Practice (ACOP) for regulation 7 details considerations such as the nature of sources of ionising radiations and the likelihood of contamination arising and being spread. The ACOP also directs to other regulations to enable control of identified hazards, e.g. what action is needed to ensure that the radiation exposure of all persons is kept ALARP (regulation 8(1)) and what measures are needed to prevent spread of contamination, including means for monitoring for contamination on persons leaving a controlled area (regulation 18(7)(d)). For the purpose of exit monitoring, to satisfy regulation 18(7)(d), this implies having a sufficient understanding of the radionuclide mix (or fingerprint) likely to be encountered in the workplace and deriving alarm levels for exit monitoring that can be substantiated for the each assessed fingerprint. Fingerprints comprise mixes of radionuclides, some measurable, some not, some with higher potential for harm to persons, some lesser. Exit monitoring must home in on the measurable radionuclides that can represent the whole mix and then have alarm levels that relate to the harm of the whole mix. Alarm levels need to be traceable and therefore require calibration using sources that demonstrate that the instrument is working to type. Appendix B gives examples of fingerprint analysis to determine nuclides of importance. Surface contamination and contamination on persons can
cause extremity doses
feed pathways to personal intake through inhalation as a result of re-suspension of loose contamination, and/or
result in ingestion by direct contact with contamination. Intakes are modelled, and although models have developed and changed over the last decades and dose limits have changed, the end product for classification of the relative harm of the radionuclides has essentially remained unchanged. The publication “Derived Limits for Surface Contamination”, and its supplement, (DL2) published in 1979 and 1982 derived tables that gave categories of radionuclides and limits based on harm from the given category. Basic values more recently have centred round the numeric value of 4 rather than 3 since 1 µCi = 37 kBq and 3.7 is closer to 4 and in deriving the tables many pessimisms and conservative decisions were already included, negating the need to round down rather than up. Consequently, generalised values of 4 Bq cm-2 for beta and 0.4 Bq cm-2 for alpha have been used for the most commonly found radionuclides in the industry.

Page 22 of 59.
Now, however, it is possible to use readily accessible updated data to derive harm from complete fingerprints. A typical source is “Radionuclide and Radiation Protection Data Handbook 2002” (RPD2002), published by the journal Radiation Protection Dosimetry. This useful collation provides data for derived surface contamination limits for a number of common radionuclides as a result of four pathways
surface contamination to atmosphere which is then inhaled
surface contamination into a person by ingestion
surface contamination on the skin leading to external extremity dose
whole-body exposure due to surface contamination Other than extremity dose, the derived limits in RPD2002 are generally concerned with activity on surfaces in active areas. For the purposes of final exit monitoring, the surface contamination of interest is that found on clothing or skin of the operator as s/he leaves the designated area and the RPD2002 data will need to be refined accordingly for this particular consideration. Only the first three will be considered since whole body exposure is only from levels of contamination that are far above levels found in final exit monitoring. DL2 also did not consider inhalation as a pathway from surfaces of the body but only recognised the importance of common limits with inactive area surfaces as the conservative guide for limits for clothing. Averaging area considerations Exit monitoring involves setting simple go/no-go alarm thresholds based on a total activity to cause an alarm. So, for example, a limit of 4 Bq cm-2 would become an alarm threshold of 400 Bq when averaged over 100 cm2. Averaging areas may differ, e.g. 100 cm2 is generally the agreed averaging area for measurement on the body with 300 cm2 for measurement on the hands (DL2, ICRP75, and IEC61098). Some use 100 cm2 on hands as well. Clearly 4 Bq cm-2 becomes either 400 Bq or 1200 Bq as an alarm value dependent on the 100 cm2 or 300 cm2 averaging area. When considering dose limits different averaging areas apply. For inhalation, the whole area of the body (2 m2) may contribute to the source but for deriving an instrument detection level a uniform averaging area of 100 cm2 can be used. For ingestion, only small areas of the hands may present the hazard and 10 cm2 is proposed (as in DL2). For skin, the dose limit is specifically per cm2 and so 1 cm2 is used. Once MDO as an activity threshold has been determined, averaging areas for practical monitoring will be dependent on detector sizes and efficiencies, and choice of calibration sources. Minimum Detection Objective (MDO) The MDO is that level (related to harm) above which it is determined that best practice can no longer be said to apply. MDO is therefore the upper bound level, below which ALARP can apply for the application of best practice. This appendix is concerned with principles of deriving MDOs, looking at the three mechanisms of harm in turn. It is intended to derive appropriate limits for each of the pathways and to determine the overall MDO as an activity (Bq).

Page 23 of 59.
Inhalation For personal contamination on clothing or skin, re-suspension is from the relatively small area of the whole body (2 m2). Contact clothing is usually left in the changeroom and therefore not taken through final exit monitoring. Clothing leaving contaminated areas is unlikely to retain contamination such that it re-suspends on a regular basis to give significant intake. Re-suspension from exposed skin is likely to be a smaller contribution than that from ingestion pathways. DL2 therefore ignored inhalation as a pathway for final exit monitoring but combined it with inactive/active area surface monitoring to derive a lower single limit for all applications. The DL2 re-suspension factors (RFs) were 5x10⁻⁶ m-1 for low specific activity radionuclides (e.g. 232Th and 235,238U and natural, depleted and enriched U) and 5 x10⁻⁵ m-1 for all other radionuclides. RPD2002 uses an active area surface re-suspension factor RF of 10-4 m-1 and an annual exposure time of 2000 h at a breathing rate of 1.2 m3 h-1. Were there contamination that could be re-suspended from clothing or skin, it could be argued that abrasion or movement would increase RF, say by a factor of 10, particularly for the short time when removing clothing. Other factors, as above (including short exposure times for any re-suspension from small areas), would tend to drive this the other way, e.g. say that contamination that could be re-suspended actually only occurred on typically 2000 cm2 (down by 10) with its consequent less likely occurrence in the breathing zone (down by, say, 10). The resultant RF is then 10-5 m-1. For exit monitoring re-suspension occurs, say, for only 1 h per day for 200 working days a year. As discussed above, for detection purposes it can be assumed that activity is concentrated into a 100 cm2 averaging area. The MDO contribution from inhalation pathways can then be expressed as
][10][200][2.1][10][
][100][224113151
21
mcmahhmmBqSvtCoefficienDose
cmaSvLimitDoseMDOinhalation
Equation A1 Ingestion DL2 section 2.2.2 considered contamination transferred to mouth from skin and cautiously assumed a person ingested all the activity from 10 cm2 skin each working day. DL2 considered that ingestion of contamination from personal clothing is unlikely to be an exposure pathway of any significance. RPD2002 derives the active area surface level assuming 1 cm2 intake for each of 2000 h a-1. This produces the same result as in DL2 albeit for the active area surfaces, not exit monitoring. Using the 10 cm2 averaging area proposed above, the MDO contribution from ingestion can then be expressed as
][200][10][
][10][1121
21
adaysdaycmBqSvtCoefficienDose
cmaSvLimitDoseMDOingestion
Equation A2

Page 24 of 59.
Skin DL2 section 2.2.1 very cautiously assumes that contamination persists on skin for all hours of the year and derives a limit corresponding to 500 mSv a-1 divided by 8766 h a-1, i.e. 0.057 mSv h-1, and then converts this using the average dose equivalent rate per unit surface activity (mSv h-1 Bq-1 cm2). Nevertheless, DL2 recognises that contamination on the skin rarely persists for more than a few hours (though it can occur, and may then be treated on an incident basis rather than generalised exit monitoring); it also recognises that contamination is most common on the hands and can usually be removed by washing. RPD2002 considers only occupational exposure over 2000 h a-1 and assumes a transfer to skin from surfaces of 0.1, then converts using the average dose equivalent rate per unit surface activity (mSv h-1 Bq-1 cm2). RPD2002 assumes that contamination is eliminated on a daily basis when the user washes on leaving the working zone, and so doesn‟t specifically cover exit monitoring considerations. It seems reasonable to consider using an exposure time of 4 h per working day (generally low persistence), but that contamination may occur on fewer than 200 days per year, say 50, since there would tend to be other indicators of general loss of control if persons are contaminated at limit values every working day. Using the 1 cm2 averaging area, the MDO contribution for skin can be expressed as
][200][
][1][1211
21
ahcmBqhSvfactorConversion
cmaSvLimitDoseMDOskin
Equation A3
The combined MDO, as activity (Bq), is then derived from
skiningestioninhalation MDOMDOMDOMDO
1111 Equation A4
Surface effects affecting MDO Chosen alarm limits must take into account the dependency on the retention or absorption of nuclides in the surface of skin or the material of clothing. Operationally, for final exit monitoring, these effects are generally larger than those encountered in available calibration sources. Appendix C (Choice of P-factors) examines this in more detail. Comparison with existing levels and application of ALARP in setting alarm levels Using more restrictive P-factors, taking account of the whole fingerprint, changes in dose coefficients since DL2, are some of the factors which mean that resultant MDOs may vary from existing alarm levels. The principle aim of exit monitoring is to prevent (as far as is reasonably practicable) operators leaving the controlled area with contamination on themselves. To this end, the “as low as reasonably practicable” aspect of this guide challenges whether this is being done. Appendix G (ALARP Assessment), which allows for review of the justifications for alarm level settings, examines this further.

Page 25 of 59.
Appendix B
Determination of Radiological Impact In the majority of situations, radionuclide fingerprints should be already established as part of the relevant Company's compliance with the Radioactive Substances Act 1993 (RSA93) requirements. However, it is important to verify that the fingerprint is stable, and that it is reviewed if there are changes to work activities or processes that could affect the fingerprint, which is particularly the case with decommissioning. There are a number of ways that isotopic fingerprints can be determined, e.g.
high resolution gamma spectrometry (HRGS) for such as 60Co, 137Cs, and 241Am
radiochemistry and alpha spectrometry for the various radioisotopes of Pu and U
liquid scintillation counting for tritium and 14C Step 1 - Determine expected fingerprint emission Collect fingerprint data. If this is already in terms of activity (Bq) go to step 2. If it is in terms of mass fraction, convert to activity fraction. Consider the mass fraction for each radionuclide as g/100 g of fingerprint, e.g 5 g/100 g = 0.05. Convert the mass fraction to specific activity by multiplying by the appropriate specific activities in Bq/g. For example, if the radionuclide with a mass fraction of 0.05 has a specific activity of 2 MBq/g then the corresponding specific activity is 10 MBq/g. Dividing each specific activity value by the total specific activity will give the activity fraction for each radionuclide. Step 2 - Tabulate fingerprint in terms of activity fraction Look at the radionuclides specified and determine which progeny are likely to be present and in what fraction. For example, separated 238U that is more than a few weeks old will be in secular equilibrium with 234Th, which is a radiologically insignificant nuclide and difficult to detect, but also with 234mPa, which is an energetic beta emitter. Similarly, if 90Sr is specified, then 90Y will almost always be present. It is a higher energy beta emitter than its parent. Note that such progeny are sometimes included in a fingerprint but often are not. If not, add these progeny to the list. Sum the activities and normalise each nuclide to the total. For example, if there are 3 nuclides with fingerprint activities of X, Y and Z Bq/g or Bq then the fraction represented by X is X/(X+Y+Z). Step 3 - Evaluation of dose per unit activity Activity levels (Bq) for each radionuclide identified during formulation of the fingerprint are used to determine the exposure risk from the overall mix in order to calculate Minimum Detection Objective (MDO).

Page 26 of 59.
Assume a total activity on the surface of 1 Bq.
Dose (Sv/Bq) = Σ Activity (Bq) x Dose coefficient (Sv/Bq) summed over all nuclides
Equation B1 The following need to be assessed:
a) Intake scenarios Contamination events within the designated area, which could lead to potential exposure via inhalation, ingestion, or skin dose
b) Characteristics of radioactive material Solubility, chemical form, material classes, e.g. activity median aerodynamic diameter (AMAD), size, half-life
c) Dose coefficients Refer to published data, e.g.
ICRP 68, Dose Coefficients for Intakes of Radionuclides by Workers, Annals of the ICRP Vol. 24 No.4 1994
RPD2002, Radionuclide and Radiation Protection Data Handbook 2002, Radiation Protection Dosimetry Vol. 98 No. 1 2002
and apply modifying factors as described in Appendix A.
Step 4 - Determination of emissions for instrument response Against each radionuclide and activity fraction, the type, energy and probability of major emissions should be stated. In terms of usefulness for monitoring, these are
beta emitters with maximum energies above 1 MeV – long range in air and low attenuation in grime and clothing
beta energies with maximum energy between 300 keV and 1 MeV – reasonable range in air but poorer penetration of grime and clothing
beta energies with maxima less than 300 keV and all alpha emitters – only effectively detected for virtual contact measurements of clean surfaces.
The requirement is then to feed these data into the process requirements of Appendices C and D in reference to the effects of P-factors, workplace environmental aspects and emission degradation, etc. This can then be used to calculate the instrument response and to assist in deciding the most appropriate test radionuclide.

Page 27 of 59.
Appendix B - Worked Example (1) Intermediate Enriched Uranium (IEU) Step 1 & 2 - Determine expected fingerprint emission and tabulate fingerprint in terms of
activity fraction
Radio-nuclide
Mass Proportion
Specific Activity
Bq/g
IEU Specific Activity
Bq/g
Activity fraction
234
U 0.00325 2.32E+08 7.54E+05 0.9464 235
U 0.37445 8.00E+04 3.00E+04 0.0376 236
U 0.0021 2.39E+06 5.02E+03 0.0063 238
U 0.6202 1.24E+04 7.69E+03 0.0097
Total 1.000 7.97E+05 1.0000
Step 3 - Evaluation of dose per unit activity
Radio-nuclide
Activity (Bq)
Skin Dose1
from 1 kBq/cm
2
(mSv/h)
Skin Dose per Bq (Sv/h)
Ingestion2
Dose (Sv/Bq)
IEU Ingestion
Dose (Sv/Bq)
Inhalation2
5 m (Sv/Bq)
IEU Inhalation
Dose (Sv/Bq)
234
U 0.9464 0 0 4.90E-08 4.64E-08 6.80E-06 6.44E-06 235
U 0.0376 1.78E-01 6.69E-09 4.60E-08 1.73E-09 6.10E-06 2.29E-07 231
Th
9.40E-01 3.53E-08 3.40E-10 1.28E-11 4.00E-10 1.50E-11 236
U 0.0063 No Data No Data 4.60E-08 2.90E-10 6.30E-06 3.97E-08 238
U 0.0097 2.27E-03 2.19E-11 4.40E-08 4.25E-10 5.70E-06 5.50E-08 234
Th 3.50E-01 3.38E-09 3.40E-09 3.28E-11 5.80E-09 5.60E-11 234
Pa 2.40E+00 2.32E-08 0 0 0 0
Total 1 6.86E-08 4.89E-08 6.76E-06 1 RPD2002
2 ICRP68
235,238U daughters are assumed to be in equilibrium and so at the parent concentration
For this example, ingestion and inhalation assumptions are based on all unspecified compounds and are the fingerprint weighted exposure risk. The dominant hazard is intake due to 234U. The radionuclides considered are mainly an internal hazard and have similar toxicities by that route. Uranium-234 is by far the dominant activity fraction, not withstanding its very minor mass fraction.

Page 28 of 59.
Step 4 - Determination of emissions for instrument response
Nuclide Activity fraction
Emission type
Alpha (MeV) Beta (MeV) Fraction (%) 234
U 0.9464 4.7 100 235
U 0.0376 4.4 100 231
Th
0.206 / 0.288 / 0.305 15 / 41 / 45 236
U 0.0063 4.4 100 238
U 0.0097 4.1 100 234
Th
0.096 / 0.189 52 / 73 234
Pa
2.28 99
Note also that the 235U fraction has a relatively short lived beta-emitting daughter, 231Th, and 238U similarly has a very energetic beta emitting grand-daughter, 234mPa. All daughters are assumed in equilibrium with their parent. The X and gamma emissions are too low to be useful. Given the activity fractions above, calculation of instrument response should be on the basis of a low energy alpha emitter (≤4.7 MeV).
Appendix B - Worked Example (2) Active Effluent Treatment Plant (AETP) – Process Waste from Cooling, Flask Handling / Washdown Facilities Step 1 & 2 - Determine expected fingerprint emission and tabulate fingerprint in terms of
activity fraction
Radio-nuclide
Mass Proportion
Specific Activity
Bq/g
AETP Specific Activity
Bq/g
Activity Fraction
3H 0.04015 3.59E+14 1.44E+13 0.0761
45Ca 0.04255 6.58E+14 2.80E+13 0.1479
51Cr 0.01858 3.42E+15 6.35E+13 0.3357
54Mn 0.18951 2.87E+14 5.44E+13 0.2873
55Fe 0.18427 8.98E+13 1.65E+13 0.0874
60Co 0.07491 4.18E+13 3.13E+12 0.0165
63Ni 0.07251 2.10E+12 1.52E+11 0.0008
90Sr/
90Y 0.03393 5.21E+12 1.77E+11 0.0009
106Ru/
106Rh 0.02996 1.22E+14 3.66E+12 0.0193
134Cs 0.02187 4.77E+13 1.04E+12 0.0055
137Cs/
137mBa 0.06187 3.20E+12 1.98E+11 0.0010
144Ce 0.02037 1.17E+14 2.38E+12 0.0126
147Pm 0.03221 3.46E+13 1.11E+12 0.0059
241Pu 0.14382 3.81E+12 5.48E+11 0.0029
Total 0.96651 1.89E14 1.0000

Page 29 of 59.
Step 3 - Evaluation of dose per unit activity
Radio-nuclide
Activity (Bq)
Skin Dose1
from 1 kBq/cm
2
(mSv/h)
Skin Dose
per Bq (Sv/h)
Ingestion2
Dose (Sv/Bq)
AETP Ingestion
Dose (Sv/Bq)
Inhalation2
5 m (Sv/Bq)
AETP Inhalation
Dose (Sv/Bq)
3H 0.0761 0 0 4.2E-11 3.20E-12 1.8E-11 1.37E-12
45Ca 0.1479 8.38E-01 1.24E-07 7.6E-10 1.12E-10 2.3E-09 3.40E-10
51Cr 0.3357 1.49E-02 5.00E-09 3.8E-11 1.28E-11 3.6E-11 1.21E-11
54Mn
0.2873 6.20E-02 1.78E-08 7.1E-10 2.04E-10 1.2E-09 3.45E-10
55Fe
0.0874 1.60E-02 1.40E-09 3.3E-10 2.88E-11 9.2E-10 8.04E-11
60Co
0.0165 7.80E-01 1.29E-08 3.4E-09 5.62E-11 1.7E-08 2.81E-10
63Ni
0.0008 0 0 1.5E-10 1.21E-13 5.2E-10 4.18E-13
90Sr/
90Y
0.0009 3.50E+00 3.27E-09 2.8E-08 2.61E-11 7.7E-08 7.19E-11
106Ru/
106Rh
0.0193 2.24E+00 4.32E-08 7.0E-09 1.35E-10 3.5E-08 6.76E-10
134Cs
0.0055 1.35E+00 7.44E-09 1.9E-08 1.05E-10 9.6E-09 5.29E-11
137Cs/
137mBa
0.0010 1.57E+00 1.64E-09 1.3E-08 1.36E-11 6.7E-09 7.01E-12
144Ce
0.0126 No Data No Data 5.2E-09 6.55E-11 2.9E-08 3.65E-10
144Pr 2.14E+00 2.69E-08 5.0E-11 6.30E-13 3.0E-11 3.78E-13
147Pm
0.0059 5.95E-01 3.50E-09 2.6E-10 1.53E-12 3.5E-09 2.06E-11
241Pu 0.0029 0 0 4.7E-09 1.36E-11 5.8E-07 1.68E-09
Total 1.0000 2.47E-07 7.78E-10 3.93E-09 1 RPD2002
2 ICRP68
144Pr daughter is assumed to be in equilibrium and so at the parent concentration
For this example, ingestion and inhalation assumptions are based on all unspecified compounds and are the fingerprint weighted exposure risk. The dominant hazard is skin dose due to 45Ca.

Page 30 of 59.
Step 4 - Determination of emissions for instrument response
Radionuclide
Activity fraction
Emission type
Beta (MeV) Fraction (%)
3H 0.0761 0.019 100
45Ca
0.1479 0.257 100
51Cr
0.3357
54Mn
0.2873
55Fe
0.0874
60Co
0.0165 0.318 100
63Ni
0.0008 0.066 100
90Sr/
90Y
0.0009 0.546 / 2.284 100 / 100
106Ru/
106Rh
0.0193 2.407 / 3.541 10 / 79
134Cs
0.0055 0.658 70
137Cs/
137mBa
0.0010 0.512 / 1.173 5 / 95
144Ce 0.0126 0.185 / 0.238 / 0.318 20 / 5 / 75
144Pr
0.81 / 2.1 / 3.0 1 / 1 / 98
147Pm 0.0059 0.225 100
241Pu 0.0029 0.021 100
45Ca is responsible for 14.8% of the emissions with a maximum beta energy of 0.257 MeV. The only other major contributors are electron capture radionuclides which produce a mixture of gammas and low energy X-rays around 5 keV. The gammas have a detection efficiency of about 0.5 %. The X-rays may or may not be detectable, depending on the energy threshold of the instrument. The presumption at this stage is that they are not. Hence, the calculation of instrument response should go ahead on the basis of a low energy beta, being the only real choice.

Page 31 of 59.
Appendix C
Choice of P-factors for Hands and Clothing
P-factors
The purpose of exit monitoring is to detect and measure the level of activity, in Bq, on some defined surface. What the detector has to work with is the emission from that surface. The ratio between the two (particle generation/particle emission) is the P-factor.
Range of P-factors
The P-factor is a function of the radiations emitted and the condition of the surface. This appendix is concerned more with surface effects than emission probabilities but both must be included in evaluating instrument sensitivities to fingerprints. Consider a perfect contaminated surface with a detector above it. If the surface is infinitely thin and the whole thing is in vacuum, a particle emitted by the contaminant continues in a straight line. Hence 50% of the particles will be emitted from the surface at angles varying from normal to the surface down to being virtually parallel to the surface. The other 50% will escape from the other side of the surface heading away from the detector. This is a P-factor of 2. This is not a realistic situation. What can happen in practice? Moving closer to reality, assume that the surface on which the activity is deposited is thick but the contamination is still mass-less. For alpha particles, this thick surface makes little difference as alphas do not backscatter much because of their mass. However, beta particles have a much lower mass and pursue a much more tortuous path through a material. A significant fraction will backscatter and, hence, the emission rate from the surface will exceed 50%, particularly for energetic betas such as 90Y. This would correspond to a P-factor of less than 2, perhaps 1.7. Given the uncertainties associated with contamination monitoring and a general desire to err on the cautious side, this is never allowed for and a P-factor of 2 is still employed. A clean stainless steel sheet contaminated by 90Y would be a good example where this effect occurs. A much more important consideration is where the surface is coated with a layer of grime, water, etc. where the thickness is a significant fraction of the range of the particles. In such a circumstance, there is a very clear possibility that a particle, emitted in a direction where it should hit the window of a detector, will be stopped before it gets there or scattered so that its direction changes. Alpha radiation is recognised as being particularly susceptible to this effect but the same effect occurs with 35S on graphite moderated reactors and in the medical world with 14C. Figure C1 below illustrates the point. P-factors strictly apply purely to the surface of interest and do not take into account how the detector responds to particles with energy reduced by penetrating grime, etc. or direction changed by scatter. However, it is easier to illustrate the importance of P-factors by considering a real alpha detector, spaced a few mm from the surface, with a window with a mass per unit area of about 1.1 mg cm-2 (which is a typical value) and an energy threshold of about 0.5 MeV to discriminate against beta particles. So, to be counted, an alpha particle needs to escape from the surface, cross the air gap, pass through the window and still have about 0.5 MeV left. The influence of grime is significant enough for relatively energetic radionuclides such as 241Am and 239Pu with energies of around 5.5 MeV and 5.1 MeV. It is a lot worse for radionuclides such as 238U, which have long half lives and, hence, low decay energies, in this case 4.2 MeV.

Page 32 of 59.
The example below illustrates what happens in a scintillation detector, but exactly the same effects take place in a gas proportional counter, where the gas effectively replaces the zinc sulphide layer of a scintillation detector.
Figure C1 - P-factor
Letter Description
A B C D1 D2 E F
Into the surface Stopped in window – no count Goes through scintillator layer – counted Stops in scintillator layer, deposits >0.5 MeV – counted Stops in scintillator layer, deposits <0.5 MeV – no count Stops in the air – no count Stops in the grime – no count
The P-factor for the surface is the ratio of the total particles generated to the number escaping from the front surface. Using the symbols above, the P-factor is given by
P-factor = (A+B+C+D1+D2+E+F) / (B+C+ D1+D2+E) Equation C1 Particles which are counted are C+D1. Particles which escape from the surface but are not counted are B+D2+E. Often instrument responses are measured in terms of their 2π efficiency, which can be thought of as the ratio of the count rate displayed to the number of particles emerging per second from the surface of a contamination source which is exactly the same size and shape as the probe window. Using the example above,
E2π = (C+D1) / (B+C+D1+D2+E) Equation C2
D2
Grime
A
B
C
D 1
E
F Surface
Scintillator
Window frame and foil

Page 33 of 59.
We can illustrate from the diagram above.
Figure C2 - Illustrated P-factor
x y
P = 2 Maximum solid angle (Ω) where the alpha can just produce a count from a clean surface. This is when the mass per unit area traversed by the alpha particle before hitting the detector sensitive volume just equals the range. The solid angle of a cone with an apex angle 2x is given by:
Ω = 2π (1 – cos x) Equation C3
Taking the maximum range as 5 mg cm-2 and a normal incidence mass per unit area to be penetrated (8 mm air + window) as about 2 mg cm-2 gives a maximum angle of about 66°. The corresponding solid angle as a fraction of 2π equals (1-cos66°) or 0.58, giving an effective 2π efficiency for that geometry of 58%
Maximum solid angle where the alpha can just produce a count from a grubby surface with an added mass per unit area of 2 mg cm-2, equivalent to a layer of water about 0.02 mm thick. P-factor is greater than 2 as particles emitted at very shallow angles will either not escape or will fail to produce a countable pulse in the instrument. In this example, the angle to just be counted (y) would be about 36°. The corresponding solid angle as a fraction of 2π is about 0.19. This means the instrument count rate would be reduced by a factor of 3. To allow for this we should use a P-factor of 6. This level of mass per unit area corresponds to a lightly greasy surface. Note, again, that we are not sticking strictly to the definition of the P-factor as P-factor does not take into account how the instrument performs. However, all alpha monitoring instruments behave in very similar ways and the model, and calculated values, above will be realistic and, hence, the number derived above is valid.
y
x

Page 34 of 59.
ISO document 7503-1 considers the problem of monitoring for short range radionuclides. It essentially proposes two values of P-factor. For beta radiation with an Emax >0.4 MeV it suggests a factor of 2. For beta radiation with an Emax between 0.15 and 0.4 MeV and for all alpha emitters it suggests a value of 4. The value of 4 is based on monitoring a layer of activity which is exactly the saturation thickness, i.e. the thickness at which a particle emitted from the original surface will just escape from the surface of the grime, i.e. the dot/dashed/dot line above. However, the ISO document is considering the monitoring of flat, non-absorbent surfaces whereas this good practice guide is directed towards much more complicated surfaces such as skin and clothing. The practical effect of placing absorbers over an alpha emitting source, 210Po, is shown in Figure C3.
Figure C3 - Effect of surface deposits
Note that the energy of the alpha particles reduces and the energy distribution broadens as the absorber thickness increases. This was with a silicon surface barrier detector 3 mm from the source, which is a valid model for practical exit monitoring. A similar process will take place for beta radiation. Beta radiation is emitted as a continuous spectrum with energies between zero and Emax. The mean energy is approximately 30% of Emax. As material is added over the source, the maximum energy will decrease and the number of detector counts will decrease as the lower energy particles are completely absorbed.
Angle where normally incident particle can just be counted, i.e. the mass per unit area to be penetrated between emission and detection is approximately 5 mg cm-2. The solid angle is tiny, i.e. the P-factor approaches infinity. Note that the thickness of grime required to produce this is about 3 mg cm-2, only 50% more than the P-factor = 6 thickness. Hence P-factors increase very quickly with the level of grubbiness.

Page 35 of 59.
Skin
Skin introduces an added complication as it is a very complicated surface, Figure C4:
It is not flat
It has pores and follicles which may trap activity
It has a layer of grease on it and may also have sweat on it
Figure C4 - Skin Surface
There is virtually no data for P-factors for skin. The chemical and physical form of the original contaminant will be important, as will what has happened to the skin between contamination and monitoring. Some material may have been worked into the skin surface while some will have been removed by wiping and washing. What is likely to be presented at an exit monitoring point is likely to be well fixed if washing has taken place. Given this uncertainty, a P-factor of 6 is recommended. This is an increase of 50 % compared to the value recommended by ISO 7503. Monitoring of clothing adds an extra dimension, particularly for liquid contamination. This will soak into the fabric producing what can be thought of as a fairly uniformly contaminated close-mesh net. Particles can escape from quite deep within the cloth, in terms of their range in the solid material, provided they travel up the holes. Other particles emitted closer to the surface, which attempt to penetrate the material, will not escape. Work performed at NPL (Felgate 1990) produced the following results, based on the performance of good quality suitable instruments and large area uniform contamination. The results are normalised to stainless steel, which should have a P-factor close to 2.

Page 36 of 59.
Material Normalised response
Energetic beta (36Cl)
Soft beta (14C)
Alpha (241Am)
Towel Lab coat Formica
Aluminium
0.64 0.58 0.75 0.81
0.11 0.19 0.81 1.00
0.05 0.05 1.07 1.05
The values above have a high uncertainty, probably of the order of 10%, but they clearly indicate that lab coats and towels have a P-factor of approximately 40 for alpha contamination, 20 for soft beta emitters and 3 even for a relatively energetic beta emitter. Hence, in the examples above, the activity that is likely to be present on difficult materials for short range emitters is approximately 10 to 20 times higher than for good surfaces and the sensitivity (counts per second per Bq actually present) is 10 to 20 times lower.
Summary and recommendations
Skin and Clothing It is important to appreciate that, for short range emitters on skin, the P-factor will be much higher than 2. This is caused by where the activity is deposited in the skin and the presence of any grease or sweat on the surface. Alpha activity will be the most affected but lower energy beta emitters such as 35S and even 60Co will also be affected. There is virtually no experimental information available. P-factors change very rapidly with increase in absorber thickness. Given these complications, the recommendation is to use a P-factor of 6 where alpha or low energy beta emitters are a significant component of the fingerprint. If the fingerprint is mainly energetic beta radiation then P-factor of 2 can be used. Intermediate factors may be applicable for photon emitters or combinations of radionuclides. It should be remembered that P-factor should also take account of emission probabilities. As such, a variety of values will appear in fingerprint response tables. The introduction of the P-factor can be done at various stages in the instrument setting-up process. Possible approaches include dividing the calibration source emission rate by the chosen P-factor to obtain an effective activity or adjusting the alarm level, for example reducing it by a factor of 3 compared to the value derived from the calibration source. As always, it is vital that this process is carefully recorded and understood by all staff involved. For the purposes of this Good Practice Guide, P-factors are used as described in Appendix D. Calibration and Function Check Sources The effect of an increase in P-factor is effectively to reduce the alarm count rate for the defined activity. It is recognised that practical calibration sources are not perfect. Any practical source has a back plate which will result in significant backscatter for energetic beta emitters. Similarly, the

Page 37 of 59.
activity is protected and is not strictly on the surface. This means that for short range particles there will be some self-absorption and energy reduction, changing the energy spectrum and angular distribution away from that expected from a perfect source. It is not even possible to evaluate the effect as the emission rate can be measured directly with low uncertainty but the activity deposited is much less well known, given the way the sources are made. The majority of sources in current use are good enough, i.e. the mass per unit area covering the activity is low and hence the ratio of particles generated to particles emitted is not much above 2. Given the high uncertainties present in personnel monitoring it is legitimate to take these sources as perfect, i.e. the P-factor is 2.

Page 38 of 59.
Appendix D
Calculation of Instrument Response Introduction The scope of this appendix is to calculate the instrument response to a defined fingerprint in terms of counts per second per Bq in the defined geometry, taking account of the expected P-factor. Instrument response The detector efficiency, and hence the expected instrument response to defined areas, radionuclides and exposure geometries, is defined by the type testing process, and confirmed by the test before first use, the periodic test and any function check that is performed. These efficiencies are generic and, given the uncertainties in the exit monitoring process, it is totally acceptable to estimate the instrument efficiency using the type test data, and not take account of individual detector and instrument variations. Note that an element of caution is important here as some fingerprints may have a major component which is just on the edge of an instrument‟s useful response. A very good example is 55Fe in the AGR fingerprint and gas flow detectors. There are two ways to deal with this. One is to be very confident that the exit monitor is responding to this difficult radionuclide, in this case 55Fe, using the function check process. The other way is to assume that the instrument does not respond to 55Fe because the counting threshold energy has drifted up to above 5.9 keV, the mean X-ray energy, and calculate the instrument response purely on the basis of the other fingerprint components. The disadvantage of the first approach is that it may be necessary to use 55Fe as the function check source and the disadvantage of the second is that the calculated efficiency may, in practice, be very conservative indeed. The first step (Appendix B) is to define the appropriate radionuclide fingerprint or fingerprints. The decay scheme for each radionuclide should be determined, i.e. the radiations emitted and the fraction emitted per decay. This is step 4 in Appendix B. If any radionuclides have extremely short lived progeny, then there will be a possibility of coincidences, where two decays lead to only one countable pulse, but this is unusual in the nuclear industry although very common when dealing with radon daughters and medical radionuclides. Manufacturers will generally quote instrument response in terms of 2π efficiency. This is the ratio of the net count rate expected from the instrument to the source surface emission rate. Some may quote 4π efficiency. This is the ratio of the net count rate expected from the instrument to twice the surface emission rate. This is based on the assumption that the source is perfect, i.e. no backscatter and no self-absorption. To convert,
2π efficiency = 2 x 4π efficiency Equation D1
They may also quote response in terms of counts s-1 Bq-1 of a specified radionuclide. This is analogous to 4π efficiency for radionuclides with simple decay schemes. To convert,

Page 39 of 59.
X counts s-1 Bq-1 = 200X % 2π efficiency Equation D2
e.g. 0.25 counts s-1 Bq-1 = 50 % 2π efficiency Where the decay scheme is more complicated, the source effective activity will require to be calculated taking account of the decay scheme. Advice on this is given in NPL GPG14. The 2π detector efficiency (i.e. detector efficiency to the surface emission rate) for the type test radionuclides should be plotted against beta energy (or gamma energy, as appropriate), using a spreadsheet or graphically. The 2π efficiency for each of the fingerprint component radionuclide decays should then be estimated using the plotted energy response. Once this has been achieved, the results should be combined using the fingerprint fraction and appropriate P-factors to give an overall predicted instrument response in counts s-1 Bq-1.
Response (counts s-1 Bq-1) = Σ (Fi x Ei) / (Pi x10000) Equation D3
where Fi = fraction of radionuclide i in the fingerprint (%) Ei = calculated 2π efficiency (%) for the detector and exposure geometry under
consideration (based on a perfect source) Pi = P-factor for the radionuclide i (and 10000 takes account of the two % values in the numerator)
For example, consider a single radionuclide fingerprint with a 20 % 2 π efficiency and a P-factor of 4
Response (counts s-1 Bq-1) = (100 x 20) / (4 x 10000) = 0.05 Note that this may have to be done up to say 4 times for sophisticated instruments that have separate hand, foot, body and head detectors. As an individual stands in an exit monitor, the hand and feet areas are in contact with the detectors, therefore, the contact efficiencies can be used to determine the alarm levels for these areas. However, the same is not generally true of the body array detectors, or the head detector, due to the varying shapes and sizes of individuals passing through them. For most individuals, only a very small fraction of the body is in contact with a detector grille. Standard type tests for certain exit monitors recommend that a phantom person is used to provide an overall average efficiency (IEC61098). This efficiency is known as the Body Average Efficiency (BAE), and should be used to calculate the alarm levels on the body array and head detectors. BAEs of instruments with this capability are available from type test data and manufacturers‟ manuals. Essentially, these BAEs aim to compensate for two effects. One is air attenuation of any particles emitted and the other is that, even if there is no major attenuation, the particles will not all strike the detector immediate to them, some may strike adjacent detectors and a fraction may miss altogether. Where there is a range of fingerprints, it is sometimes possible to derive a common setting up process even though radionuclides and ratios are varying. For example, across the fingerprints, there may be a relatively consistent energetic beta fraction which will generally dominate the instrument‟s response and lead to a fairly consistent predicted instrument response in counts s-1 Bq-1. If the maximum acceptable contamination level defined by the RPA is also similar then this would allow a cross-site standard alarm level. It might also allow the selection of a common function check radionuclide, probably in this case 36Cl.

Page 40 of 59.
This process can also be repeated to look at the influence of credible fingerprint variations. Where the variation is dramatic, it may be better to constrain the instrument‟s radiation performance to remove the influence of radionuclides which are generating the variation by, for example, deliberately raising the threshold to exclude low energy beta emitters or X-ray emitters such as 55Fe. This can be done in tandem with looking at the variation in dose per Bq with fingerprint. Sometimes, the (response per Bq)/(dose per Bq) will be much less dependent on fingerprint variation if low energy, low toxicity radiations are deliberately not detected. It is essential, however, if this technique is adopted that the modified monitor has its contamination response re-evaluated, effectively replacing that part of the original type test. The QP will need to confirm that the monitor conforms to type. This is the purpose of the test before use and of the periodic test. Guidance is given in NPL GPG29. The type test data or manufacturer‟s specification will give the expected detector efficiency to sources of defined area in defined positions. Note that it is important that the QP has confidence that the instrument is working as predicted over the radionuclide range which has been used to calculate the instrument response. This may involve using sources for which the instrument response is limited and susceptible to significant change with the exact settings used, such as the high voltage on the detector. Conclusion The RPA will need to have determined the following parameters in order to set appropriate alarm levels for instrumentation used for final exit monitoring:
The appropriate radionuclide fingerprint (Appendix B)
The maximum allowable level of total activity an individual can have on each area of their person on exiting from a radiologically controlled area (MDO Appendices A & B)
The P-factor for the radionuclide(s) in question and the material being monitored, e.g. skin and clothing (Appendix C)
The QP will need to use the above information and
Type Test detector 2π surface emission rate efficiency to plot energy response curve(s)for each detector and geometry (e.g. BAE)
Derived detector 2π surface emission rate efficiencies (e.g. for contact and BAE, or any other expected geometry, as appropriate) for each fingerprint component
to calculate the instrument responses for each exposure geometry. The QP and RPA may wish to consult on the possibility of restricting an instrument‟s performance for low range/energy, low radiotoxicity radionuclides with the aim of making any alarm setting less fingerprint dependent.

Page 41 of 59.
Appendix E
Use of Statistics in Alarm Level Selection A number of operating parameters need to be considered when setting alarm levels. A description of each of the main parameters is described below and a worked example is also provided. The annex to this appendix includes the derivation of the equations used to determine:
1. Total Counts to Alarm (CT), where C is the alarm level count rate and T is the monitoring time
2. Effective Alarm Threshold (L), and 3. Limiting Alarm Threshold Llim
In relation to the ALARP model, Figure E1, CT corresponds to an alarm level. Llim corresponds to the Minimum Instrument Level.
Figure E1 - Selection of ALARP Alarm Levels
In some PEM designs, the instrument can automatically derive the effective alarm level based upon entry of the desired alarm level count rate and alarm detection probabilities. A spreadsheet / graph, Figure E2, has been made available by Thermo Fisher Scientific (TFS) which allows determination of the effective alarm level, L, for PEMs where the level must be set manually. The TFS model is based on normal distributions not Poisson. This is adequate in most situations, although very low alpha levels may require adjustment to avoid false alarms. The model fits around ISO11929-1:2000 time preselected basic decision threshold (ISO11929-1:2000 equation 4) and detection level (ISO11929-1:2000 equation 7). These in turn relate to the Currie qualitative limits (Currie 1968), LC, critical level, and LD, detection limit. The following table summarises the links, where T is monitoring time.
Minimum Detection Objective (MDO)
Minimum Operational Level (MOL)
Minimum Instrument Level (MIL))
ALARP REGION ALARP Alarm Level Region

Page 42 of 59.
MIL MOL
ISO11929-1:2000 Decision Threshold, Rn*.T (Rn* in equation 4)
Detection Limit, ρn*.T (ρn* in equation 7)
Currie 1968 Critical Level, LC (Currie equation 1)
Detection Limit, LD (Currie equation 2)
TFS Llim CT for MOL alarm
N.B. Care must be taken in that the TFS probability of detection sigma multiplier is denoted by ‘P’ and this must not be confused with the ‘P-factor’ definition in Appendix C.
Background Rate B 30
Background Time t 10
False Alarm Sigma F 3.1
Alarm Rate C 25
Monitoring Time T 5
Prob. of Detection P 2.4
False Alarm margin 5.7844
Figure E2 - Exit Monitor Alarm Setting Spreadsheet (Thermo Fisher Scientific)

Page 43 of 59.
Minimum Instrument Level MIL From the Annex to Appendix E it can be seen that the Minimum Instrument Level MIL is equivalent to the TFS Limiting alarm threshold is given by:
BTt
BTFL
2
lim Equation E1
The Limiting alarm threshold rate is given in Equation E2 and shown in Figure E3. This defines the minimum instrument value for an alarm level.
T
LrateL lim
lim Equation E2
Setting alarm level values below this minimum will result in a high number of false alarms leading to disruption to work schedules. The MIL corresponds to the „decision threshold‟/‟critical level‟, where the probability of detection of contamination is at 50% for a defined false alarm, i.e. the setting is entirely dependent on background.
Figure E3 – Limiting Alarm Threshold Rate
Llim rate
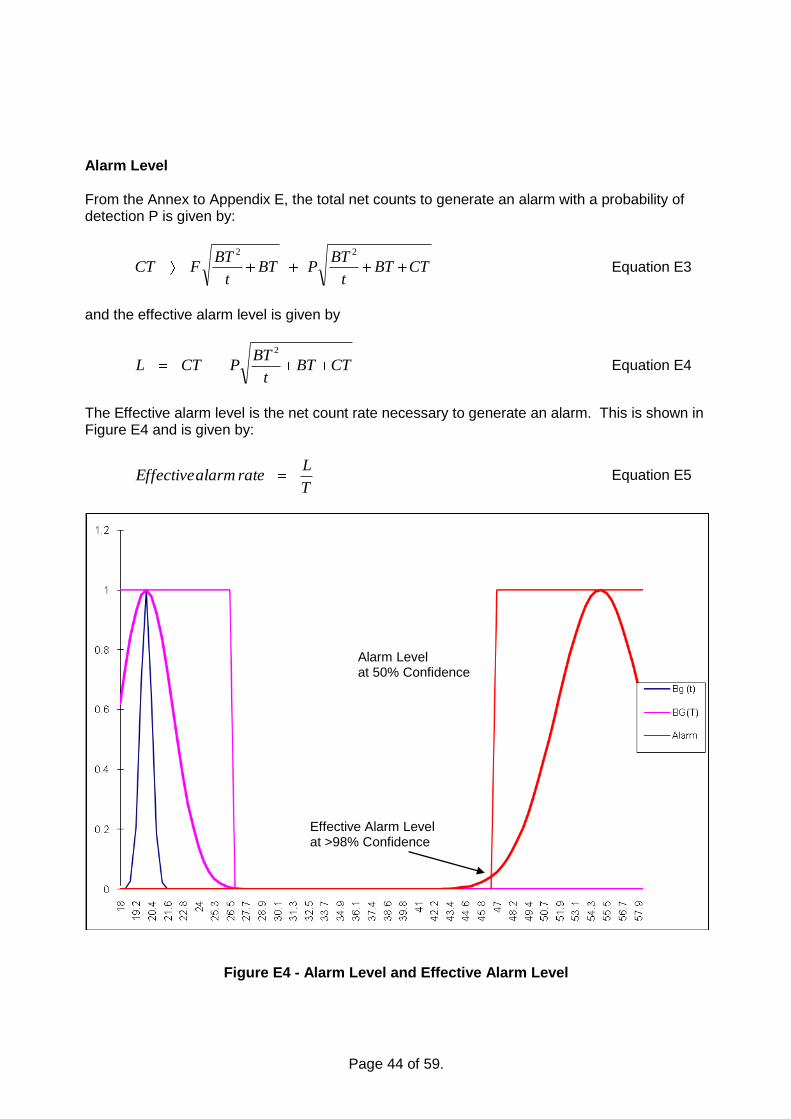
Page 44 of 59.
Alarm Level From the Annex to Appendix E, the total net counts to generate an alarm with a probability of detection P is given by:
CTBTt
BTPBT
t
BTFCT
22
Equation E3
and the effective alarm level is given by
CTBTt
BTPCTL
2
Equation E4
The Effective alarm level is the net count rate necessary to generate an alarm. This is shown in Figure E4 and is given by:
T
LratealarmEffective Equation E5
Figure E4 - Alarm Level and Effective Alarm Level
Alarm Level at 50% Confidence
Effective Alarm Level at >98% Confidence
Page 45 of 59.
The following parameters have to be determined and entered manually into PEM instruments during the setting up phase to determine the Effective alarm threshold.
Probability of Detection
The probability of detection is the probability that activity exactly at the set alarm level will cause an alarm. For example, if the probability of detection is set at 2.1σ, which is the equivalent to 98%, this means that contamination present at the exact level of the alarm will not cause an alarm on 2% of occasions. This is not the same as saying that 2 in 100 people who are contaminated will be able to leave through an exit monitor, since the probability of each individual passing through having contamination on their person at exactly the alarm level is very low. The opposite may also be considered: that more persons may be unnecessarily causing alarms at lower levels of contamination. Choice of this value can be from 50% (0σ) to 90% (1.3σ) and up to say 99% (2.4σ). Higher probabilities may be selected, depending on the background level and the alarm level setting. Longer measurement durations achieve an improved limit of detection.
Probability of false alarm and background measurements
It is suggested that the probability of a false alarm is set to at least 3.1σ, which is equivalent to 0.1% probability (i.e. 1 in 1000 chance of a false alarm for a completely clean person). For low background environments and a fingerprint which is efficiently detected then a count time of 5 s should be adequate to ensure a large false alarm margin at the proposed settings. However, for higher background gamma radiation levels, more difficult to detect fingerprints and an ambitious alarm level a longer count time may be required. Note that PEMs usually have more than one detector and to achieve a probability of 0.1% false alarms for the whole instrument will require choosing a sigma value appropriately, e.g. 20 detectors will require 1 in 20,000 (0.005%, 3.9σ) probability per detector to achieve 1 in 1,000 for the whole instrument. PEMs should be sited in areas of low radiation background. The probability of a false alarm is dependent to a great degree upon the background count rate. To ensure this is well characterised the background update time should be at least 6 times the monitoring time and ideally set to the maximum time permitted by the PEM. In most cases the background rate for alpha detectors is below one per second.
Measurement Time
The measurement time defines the time taken for an individual to be monitored. For most body exit monitors this means the time taken in each step (front and back). The optimum monitoring count time is determined by the lowest alarm setting of the detectors within the exit monitor. This will usually be on the body array, due the lower efficiencies of non contact measurements. A measurement count time of around 5 s has been deemed sufficient and practical for the levels derived in this example. Exit monitors in areas where the background measurements are higher may require longer counting times to meet the criteria. Another important factor when choosing the measurement time is the throughput of personnel. A balance of the risk and practicality must be achieved.

Page 46 of 59.
Annex to Appendix E
Derivation of Effective and Limiting Alarm Thresholds
Background count rate in background collection time t gives total count = Bt
Standard Deviation = Bt
So uncertainty in count rate function for B is
Bt
Bt =
t
BB
Background in monitoring time T, similarly is T
BB
For the difference ( BT – Bt ), i.e. monitoring with background subtraction without any contamination present, the uncertainty is the root mean square (rms) of the individual uncertainties, i.e.
T
B
t
B
Similarly contamination count rate C + background in monitoring time T, = (B + C)T
and its uncertainty is T
CB
Then for the sum ( (B + C)T – Bt ), i.e. contamination monitoring with background subtraction, the uncertainty is the rms of the two separate measures is
T
CB
t
B or
T
C
T
B
t
B
For actual total count rate for alarm C, for all this to work, with F as probability of false alarm, as number of sigma, and P as probability of detection, as number of sigma
T
C
T
B
t
BP
T
B
t
BFC
In computational terms in an instrument, i.e. total counts to alarm, CT
CTBTt
BTPBT
t
BTFCT
22
Equation E3
(continued)

Page 47 of 59.
The effective alarm threshold, L (as total counts for alarm), is given by
CTBTt
BTPCTL
2
Equation E4
The limiting alarm threshold, Llim is equivalent to the MIL and is given by
BTt
BTFL
2
lim Equation E6
The MOL is the „detection limit‟ given by CT in the equality
CTBTt
BTPBT
t
BTFCT
22
Equation E7

Page 48 of 59.
Appendix F
Operational Alarm Levels Alarm level issues Whilst in theory it is possible to set alarm levels at the Minimum Instrument Level MIL, in reality this will lead to an unacceptable number of false alarms and a loss in operator confidence in the equipment.
Whilst the theoretical alarm levels are a good starting point for determining an exit monitors alarm point, the following areas should also be taken into consideration. It should be noted that this list will not be exhaustive and if possible there is no substitute for real life trials under maintenance supervision.
By taking these factors into consideration the Minimum Operational Level (MOL) can be adjusted to include an “operational margin” as shown in the diagram below by the gap between the two vertical lines. This operational margin allows for some variations to exist between each individual detector, changes in the environmental conditions and fluctuations in the background readings.
0
0.2
0.4
0.6
0.8
1
1.2
1818
.619
.219
.820
.521
.121
.722
.322
.923
.524
.224
.825
.4 2626
.627
.227
.928
.529
.129
.730
.330
.931
.632
.232
.833
.4 3434
.635
.235
.936
.537
.137
.738
.3
Bg (t)
BG(T)
Alarm
False Alarm
P
Figure F1 - Adjusted MOL to allow for environmental variables
Reasonable gap between F and P
MOL at 50% (0σ) confidence Alarm level
Background +3σ
MOL - 3σ MOL at 98% (2.1σ) confidence Effective Alarm level

Page 49 of 59.
It is strongly recommended that if lowering alarm levels for existing equipment that the levels should be reduced in stages with a good test period between stages to ensure that the alarm rate remains acceptable
The Operational Margin
When selecting the appropriate minimum operational alarm level a small “operational margin” is required for both changes in environmental conditions, background and variation between detectors. The amount of “operational margin” is a discretional quantity which is not easily defined. As a rule of thumb, the minimum 50% confidence alarm level should be such that the distribution for the alarm count rate and the distribution for the average background do not cross at less than the 3σ level above the mean background and below the alarm activity level, as in Figure F1. This results in close to100% confidence of no false alarm at the typical background rate and a low alarm level is still achievable up to variations in the background rate of over three times the initial background.
Low alarm levels Modern instruments Modern instruments can do more than just look for a fixed count rate above background for the alarm level. It is now possible to set statistical options like the probability of false alarm and probability of detection discussed earlier, to vary the count time within user parameters and for the instrument to decide if there has been a significant change in background which requires a new background to be performed. Whilst the probability of false alarm should always be set to give a minimum acceptable number of false alarms per year, the probability of alarm can either be left at 50% or increased. Increasing the probability of alarm effectively lowers the mean alarm level. It should be noted that in some instruments the probability of false alarm is for each individual detector not for the system as a whole. The changing background function continuously monitors the background count rate and, in the event that the average background changes by a significant amount, will force the instrument to a complete new background count. The significant amount is often a percentage of the alarm level. Therefore, care must be taken to ensure that the changing background level is appropriate with respect to the alarm level required and the typical background rate. Older instruments Older instruments do not apply any of the above statistical calculations except for the high background function on some equipment. If the probability of detections is required, this will need to be manually calculated. The high background function is typically set to remove the instrument from operation when the background levels become high enough that there is a probability of greater than 1 in 1000 that the background fluctuations will cause a false alarm.
Another important factor in setting the alarm levels for older equipment is often the averaging times are fixed by the circuit components. Each individual instrument will be slightly different

Page 50 of 59.
due to component tolerances and aging. As a result of the fixed times the minimum alarm levels may well be higher than that on more modern equipment.
Common Detector High Voltage Supply For instruments that have multiple gas proportional detectors there is often only one High Voltage generator to supply the EHT to all of the detectors; this is particularly true of older style instruments. There is now a trend toward individual EHT generators. This means that whilst gas proportional detectors are reasonably consistent in their operation, the efficiency of each individual detector within the unit will vary. In these types of instruments manufacturers will usually quote the EHT voltage required for the gas type used which will be common for all detectors regardless of size. In addition, these units typically only have one alarm level per detector type, e.g. Body Beta, Foot alpha, etc.
Typically, during calibration the efficiency of each detector is checked to confirm that it is within ±10% of the mean efficiency of that type such that in the calculation for the alarm rate the type test figure can be used.
As a result, it should be noted that due to the variation in efficiency between each detector a fixed amount of activity will give a different reading on each detector. The variations are because of component tolerances and statistical variation of the counts used in the calibration process and the theoretical minimum figures calculated in the previous example will not be suitable for each and every detector.
In order to minimise this effect it is recommended that each detector should be tested and confirmed to be within ±10% of the published type test data. It is also necessary to allow an “operational margin” between the maximum permissible background and the minimum possible alarm level in order to account for the difference between each detector. Radon Radon levels both in the area that an operator works and the area in which the instrument has been installed can have a great effect on measurement results. On all instruments, alpha radiation will produce a count rate in both the alpha and beta channels, with typically 80 % in the alpha channel. Add to this the much lower (generally factor of 10) alarm level in the alpha channel and the result is that the alpha influence on the beta channel is generally ignored. However, the radon decay chain includes energetic beta emitters and, in areas where the radon background is high (typically above 200 Bq/m3), this can cause beta alarms even on beta only instruments. As radon is denser than air, and the progeny have a tendency to attach to dust particles, the lower body and foot detectors are typically more at risk from radon related problems. These are typically displayed as “high background” and “high alpha count” alarms.

Page 51 of 59.
Some manufacturers have incorporated a “Radon Alarm” within the software to warn the user that they have measured above the alarm level, but the unit believes this is the result of radon progeny, either in the general area or attached to the clothing (often nylon or fleece materials). This function typically checks the ratio of the beta to alpha counts to a user defined value to decide if the contamination is due to radon. This is a function that is not often used as it requires considerable knowledge of the radon equilibrium and the stability of the equilibrium. Figures F2 to F5 show the effect of the annual radon variation on the background count rate for a typical PEM located in an unventilated facility and the effect of a ventilation failure on a PEM background located in a facility with a filtered plenum.
Figure F2 - Annual Radon Variation Unventilated Facility (Beta Background)
Figure F3 - Annual Radon Variation Unventilated Facility (Alpha Background)

Page 52 of 59.
Figure F4 - Effect of Ventilation Failures (during Aug and Nov) in Filtered Plenum Facility (Beta Background)
Figure F5 - Effect of Ventilation Failures (during Aug and Nov) in Filtered Plenum Facility (Alpha Background)

Page 53 of 59.
External gamma Changes in the background count rate of monitors are not always avoidable. Monitors should be sited in locations to minimise the potential for significant change, but in older facilities, this may not always be possible. Even the passage of something as innocuous as a function check gamma source can cause a significant change in the background. It is also worth considering that certain medical treatments can result in an easily detectable gamma dose rate around the person under treatment. This will obviously influence the measurement results for that person, but for very low alarm levels can potentially produce a false alarm for a colleague using the instrument. As a change of 1 μSv/h can typically result in an increase in count rate of between 100 and 200 cps in a gas proportional detector, some allowance if often necessary to allow for some change in the background. Modern instruments are capable of working correctly in considerably high background rates, but the minimum alarm level will also be much higher. As final personnel exit monitors, these monitors should be located in areas of essentially natural background, often around 0.05 μSv/h. At these levels, it is potentially possible to set the beta alarm level around 20 cps. At 1 μSv/h this will rise to around 50 cps and at 2.5 μSv/h this rises again to around 75 cps. These figures are for indication only and will depend upon the energy of the background radiation and size of the individual detector. Consideration of changeroom monitoring equipment When considering the instrumentation for a changeroom it is important to understand fully how the instrument will operate in that environment and how it will compare to other instrument types in the area. The classic example is the comparison of energy response between a gas proportional instrument and scintillation instrument, where it is very important to understand the difference in the low energy beta response for certain areas. Other possible differences between equipment types are in the way the instrument collects and interprets the monitoring data which may be electronically fixed or set via software. The site instrument Qualified Person can offer good advice in ensuring that proposed alarm levels are within the technical ability of the instrument and how the instrument compares to other similar types.

Page 54 of 59.
Appendix G
Alarm Level Selection - ALARP Assessment Managing Personnel Exit Monitor (PEM) Alarm Level Values When setting PEM alarms levels, it must be remembered that the alarm level value is directly coupled to the actions to be taken by staff using the instrument and by alarm response personnel. When changing an alarm level, the impact on existing custom and practice must be considered and any amendments made through a structured change management process that is supported by a written justification. The justification should clearly state the purpose of the alarm level value, i.e. what it is intended to achieve. It should consider the provision of adequate monitoring equipment, resource and time, so that staff can follow the prescribed monitoring regime and carry out the alarm response actions with a high degree of compliance against operating procedures. An alarm level can be chosen within a wide range of values. At the highest level an alarm would signify that an individual is contaminated to an unacceptable degree and must be immediately decontaminated. The minimum level is based upon the instrument detection limit in the operational environment. Between these boundaries, the alarm level provides an information alert to changes to plant radiological conditions and operating procedure. The precise value chosen is dependent upon what is as low as reasonably practicable under local operating conditions. This range is presented graphically in Figure G1 and is discussed more fully below in terms of what is good practice under differing conditions. Upper Limit to Exit Monitor Alarm Level Values – Minimum Detection Objective (MDO) At the upper limit, the purpose of the alarm level value is to provide an alert to the presence of significant contamination on the skin or personal clothing. This requires an immediate response to decontaminate the individual and investigate the cause, as it indicates a significant breakdown in upstream control. It is good practice that the alarm response has the following elements:
Re-monitor by the individual to verify whether an alarm is due to a background fluctuation or some unknown instrument fault condition.
A repeat alarm is an indication that further action is warranted; usually the call for dedicated Health Physics response personnel to investigate further.
The individual is monitored using an alternative make of surface contamination instrument. This may be either a frisk probe or another installed instrument of a different type / manufacture.
This process either confirms that the alarm condition is real or false. Where confirmed, corrective action involves decontamination of the individual‟s skin or removal of contaminated clothing and some form of investigation as to the cause. This ensures that individuals are not sent home with unacceptable contamination levels on their person.

Page 55 of 59.
If the contamination source is anticipated to be widespread or large enough this may require an assessment of the individual‟s effective dose and/or extremity dose and some monitoring and decontamination of the upstream work area.
Lower Limit to Exit Monitor Levels Values – Minimum Operational Level (MOL) At the opposite end of the scale from the MDO, the choice of PEM alarm level value is constrained by the instrument minimum detectable activity. These values are determined by:
False alarm probability
Limits of the detector physics
Limits imposed by the energy spectrum of the radiation
Limitations of the instrument set up, e.g. counting duration Other operational environment factors such as radon, the presence of fluctuating background radiation levels and shine paths raise the minimum detectable activity level further. These are discussed more fully in Appendices E and F and effectively define the lowest operational alarm level setting. Setting alarm level values below these minima results in an unacceptable number of false alarms leading to disruption to work schedules. It can also contribute to staff apathy and distrust, leading to non compliances with exit monitoring and other associated changeroom procedures. It is thus not good practice to set alarm level values below the minima in appendixes E and F. Factors to consider when selecting the ALARP Alarm Level Value Regulation 8 of the Ionising Radiations Regulations 1999 requires that all necessary steps be taken to restrict so far as reasonably practicable the extent to which persons are exposed to ionising radiations. This generates a requirement to consider lowering the alarm level value below the MDO as it lowers the contamination levels tolerated on individuals. It can also provide an alert to small changes to plant radiological conditions and operating practice. It is industry good practice that exit monitors are set up with the following as minimum acceptable parameters, (see Appendices E and F for explanation):
A count duration of 5 s
A probability of false alarm of 3.1σ
A detection probability of at least 1.3σ
A background update time of at least 6 times the count duration (30 s) Where a PEM cannot be set up using these parameters, the alarm level value should be calculated manually in accordance with the Appendix E guidance. The set up parameters effectively constrain the choice of alarm level value. Relaxing these parameters is not considered good practice whereas it may be reasonably practicable to lower the selected alarm level towards the lowest level permitted by the parameters. It may also be

Page 56 of 59.
ALARP to extend the count duration or increase the background update time to increase sensitivity and achieve a further lowering of the exit monitor alarm level. The impact of any proposed change must be assessed and justified before altering an existing alarm level. This involves an ALARP cost benefit analysis where the benefits of reducing the alarm level are compared against the actions required to implement it properly. Reducing the level well below the MDO means that alarms will be generated at contamination levels that do not present a significant radiological hazard, thus the purpose of the alarm becomes provision of information that assists in restriction of exposure. Benefits and uses of this “Review of radiological conditions” information are described in ICRP75 and include:
Providing an alert to the failure of upstream controls.
Acting as a restraint on deterioration of existing protection arrangements.
Monitoring the adequacy of existing PPE and other control arrangements that protect against prolonged low level exposure.
Defining the standard of contamination control that is achievable from existing operations / practices.
Controlling trivial levels of contamination that might be transferred outside of a controlled area or removed from a site.
If the alarm level were to be lowered with the intent of using exit monitors to provide the above information then there would be an increase in the number of PEM alarm occurrences. The alarms would signify that personnel are contaminated, which would require removal. In addition, that loose contamination is present in upstream work areas which would require investigation to an appropriate degree. Where it can be shown that lowering an alarm level would not impact on existing exit monitoring, changeroom and alarm response procedure, then it is ALARP to make the change. The justification is that, in return for minimal additional cost, there would be a direct safety benefit to workers in terms of reduced contamination levels tolerated on personnel. The work area would also benefit through promotion of higher standards. Where there would be an impact on existing exit monitoring and alarm response procedure, there will be a diminishing return in terms of safety benefit versus the work involved in implementing the change. Factors to consider are described below and listed in terms of increasing implementation cost. Amending the alarm response procedure
For lower alarm rates, a single default response as described for an alarm at the MDO may not be appropriate. It could result in workers losing confidence in the PEM, leading to possible monitoring non compliance and adverse safety culture issues. It may also be a disproportionate use of Health Physics resource to respond to alarms at low levels of contamination that do not present a radiological hazard of any significance. In such circumstances alternative alarm response actions may be appropriate. These could involve:

Page 57 of 59.
Requiring a worker to re-monitor using a frisk probe and if no contamination were detected then the worker would be released from control.
o This requires a high degree of operator discipline when using frisk probes and experience shows that this needs to be supported by regular refresher training and compliance inspection.
Requiring a worker to wash their hands and then re-monitor. o Provided the re-monitored area does not generate an alarm then the worker
could be released from further control. Alterations to exit monitoring and changeroom layout
Any re-monitoring that identifies genuine radioactivity would be responded to by re-monitoring, investigation and possible de-contamination as described above. Possible implications from a reduced alarm level include:
Delays to worker changeroom throughput.
Increased improper use of secondary frisk probes.
Increased non compliance occurrences and decreasing safety culture problems associated with the perception of low confidence or low importance of the monitoring task.
To prevent the above a number of intervention actions may be required including:
Increasing the number of PEMs and frisk probes.
Installation of turnstile control to prevent monitor bypass.
Addressing process flow problems associated with interface of turnstile and frisk probe.
Installation of hand washing facilities prior to the PEM monitoring station.
Increasing resource to support generation of low value transitory information and paperwork resultant from investigation of alarms
Revisions to controlled area PPE requirements to include full change of outer-PPE, including coveralls, shoes and hats etc so that potentially contaminated clothing is removed and remains on the designated side of the changeroom barrier.
It is not good practice to reduce an alarm level to the point where changes are required to existing custom and practice without the modification being subject to a wider review of the impacts. A written justification prepared and supported by the RPA and plant operating management is required to demonstrate ALARP in such cases.
The ALARP Alarm Level Setting the alarm level below the MDO is seen as a minimum performance requirement for PEMs. Conversely, to ensure that the instrument remains functional and retains the confidence of the users, the alarm level must be set higher than the MOL.

Page 58 of 59.
The ALARP alarm position is the lowest level, between the above criteria, that can be reasonably achieved that is consistent with a high degree of worker understanding and hence compliance with the facility exit monitoring procedure and associated alarm response actions. For an existing exit monitoring regime, where it can be shown that lowering the alarm level would not impact on the current exit monitoring and alarm response procedures, then it is ALARP to make the change. The justification is that, in return for minimal additional cost, there would be a direct safety benefit to workers, i.e. reduced contamination levels tolerated on the person and in the work area through promotion of higher standards. Where there would be an impact on existing monitoring procedure, an ALARP assessment is required that is agreed by the RPA and supported by the plant operating management. For new facilities, it is a requirement that the final exit monitoring regime and associated alarm level is based upon best practice. Best practice is essentially sourcing the best available instrument technology and design that places the detector in contact with the surfaces to be monitored. Alarm levels are then selected in accordance with this guidance and the PEMs located in accordance with the NICOP Changerooms.
Figure G1 - Selection of ALARP Alarm Levels
Minimum Detection Objective (MDO)
Minimum Operational Level (MOL)
Minimum Instrument Level (MIL))
ALARP REGION ALARP Alarm Level Region

Page 59 of 59.
Appendix H
Worked Examples
Worked examples, for a number of commonly encountered radionuclides are provided in this Appendix. These provide some guidance to operators as to the range of reasonably practicable / good practice alarm level values as defined by the MDO and MOL at specified confidence levels. The calculations assume modern PEMs sited in changerooms in compliance with NICOP Changerooms and located in areas of low radiation background. Appendix H1 - High energy beta
137Cs / 90Sr fingerprint from a Post Irradiation Examination facility Appendix H2 - Low energy beta
60Co dominated fingerprint Appendix H3 - Low energy alpha
Intermediate enriched uranium fingerprint Appendix H4 - Higher energy alpha Reactor grade plutonium fingerprint