THE ROLE OF WHOLE BODY VIBRATION IN THE PREVENTION OF POSTMENOPAUSAL OSTEOPOROSIS · 2014-01-29 ·...
270
THE ROLE OF WHOLE‐BODY VIBRATION IN THE PREVENTION OF POSTMENOPAUSAL OSTEOPOROSIS by Lubomira Slatkovska A thesis submitted in conformity with the requirements for the degree of Doctor of Philosophy Institute of Medical Science University of Toronto Copyright© by Lubomira Slatkovska 2011
Transcript of THE ROLE OF WHOLE BODY VIBRATION IN THE PREVENTION OF POSTMENOPAUSAL OSTEOPOROSIS · 2014-01-29 ·...

THE ROLE OF WHOLE‐BODY VIBRATION
IN THE PREVENTION OF POSTMENOPAUSAL OSTEOPOROSIS
by Lubomira Slatkovska
A thesis submitted in conformity with the requirements
for the degree of Doctor of Philosophy
Institute of Medical Science
University of Toronto
Copyright© by Lubomira Slatkovska 2011

ABSTRACT
THE ROLE OF WHOLE BODY‐VIBRATION IN THE PREVENTION
OF POSTMENOPAUSAL OSTEOPOROSIS
Lubomira Slatkovska
Doctor of Philosophy 2011
Graduate Department of Medical Science
University of Toronto
Whole‐body vibration (WBV) was recently introduced as a potential modality for
strengthening bones, and this thesis was set out to investigate whether it plays a role in
the prevention of postmenopausal bone loss.
First, effects of WBV on bone mineral density (BMD) were systematically
evaluated in previous randomized controlled trials (RCTs) in postmenopausal women.
Second, a RCT of 202 postmenopausal women with primary osteopenia not on bone
medications was conducted to investigate the effects of WBV at 0.3g and 90 Hz versus
0.3g and 30 Hz versus controls on various bone outcomes, as measured by dual‐energy
x‐ray absorptiometry (DXA), high‐resolution peripheral quantitative computed
tomography (HR‐pQCT), and quantitative ultrasound (QUS).
ii

In the systematic evaluation of previous RCTs, statistically significant increase in
areal BMD (aBMD) at the hip was found in postmenopausal women receiving WBV
versus controls, but the effect was small and may have been due to study bias. Also,
WBV was not found to influence aBMD at the lumbar spine or volumetric BMD (vBMD)
at the distal tibia in the systematic evaluation. In the RCT conducted in this thesis, no
statistically significant effects of WBV were found on aBMD at the femoral neck, total
hip or lumbar spine, as measured by DXA, or on vBMD or bone structure parameters at
the distal tibia or distal radius, as measured by HR‐pQCT. Further in this RCT, a
statistically significant decrease was observed in QUS attenuation at the calcaneus in
women receiving 90 Hz or 30 Hz WBV compared to controls. This may have been due to
heel bone or soft tissue damage, although the effect was small and may not be clinically
important.
In conclusion, this investigation of postmenopausal women did not find clinically
relevant benefits of WBV on osteoporotic‐prone skeletal sites, including the hip, spine,
tibia or radius, while potentially harmful effects on heel bone and/or soft tissue was
observed in response to WBV. Thus based on this thesis, WBV is currently not
recommended for the prevention of bone loss in community‐dwelling postmenopausal
women with primary osteopenia.
iii

iv
ACKNOWLEDGEMENTS
First and foremost, I want to thank my supervisor Dr. Angela Cheung for giving me this
opportunity to work with and learn from her about the ins-and-outs of clinical epidemiology,
how to persevere with optimism and see in the big scheme of things.
Also, many thanks to my thesis committee members – Drs. Shabbir Alibhai and Joseph
Beyene. Shabbir, thank you for your helpful feedback, advice and encouragement. Joseph,
thank you for your invaluable statistical advice and for helping me see more clearly through
analytical complexities.
Maryam Hamidi, Olga Gajic-Veljanoski and Judy Scher, thank you for your research
support and advice. My acknowledgements also go to Hanxian Hu who helped me with data
analysis. Alice Demaras, Claudia Chan, Queenie Wong, Farrah Ahmed, Diana Yau and Gail
Jefferson, our research group’s analysts and technologists, thank you for your knowledge and
for being a pleasure to work with. As well, many thanks to all my research volunteers and work-
study students for your hard work with recruitment and data management.
Last but not least, many heartfelt thanks to my loving family and friends for cheering
along and believing in my pursuit. This has been an interesting life journey with many lessons
and surprises that challenged yet fulfilled my being.
This doctoral thesis was supported by the Canadian Institutes of Health
Research/Ontario Women’s Health Council Doctoral Research Award. The study in chapter two
was funded by the Ontario Physicians’ Services Incorporated foundation.

TABLE OF CONTENTS
ABSTRACT ............................................................................................................................................................. ii
ACKNOWLEDGEMENTS........................................................................................................................................ iv
TABLE OF CONTENTS ............................................................................................................................................ v
FIGURES AND TABLES .......................................................................................................................................... ix
ABBREVIATIONS ................................................................................................................................................... xi
INTRODUCTION.....................................................................................................................................................1
OSTEOPOROSIS OVERVIEW ..............................................................................................................................1
What is osteoporosis? ..................................................................................................................................1
Public and personal burden..........................................................................................................................2
Bone remodelling .........................................................................................................................................3
Risk factors ...................................................................................................................................................6
DIAGNOSIS AND MONITORING OF POSTMENOPAUSAL OSTEOPOROSIS ........................................................8
Osteoporotic fracture.................................................................................................................................11
Dual‐energy x‐ray: the gold standard.........................................................................................................11
Monitoring..................................................................................................................................................12
BONE STRENGTH AND FRAGILITY ...................................................................................................................13
Bone biomechanics.....................................................................................................................................13
Bone tissue properties................................................................................................................................16
Bone strength determinants in postmenopausal women..........................................................................17
NON‐INVASIVE MEASUREMENTS OF BONE STRENGTH .................................................................................20
Bone densitometry .....................................................................................................................................20
Quantitative ultrasound .............................................................................................................................23
PREVENTION OF POSTMENOPAUSAL OSTEOPOROSIS ...................................................................................25
Nutrition .....................................................................................................................................................27
v

Bone medications .......................................................................................................................................28
Physical activity ..........................................................................................................................................29
PHYSICAL STIMULI AND BONE........................................................................................................................30
Bone adaptation to loading........................................................................................................................30
Loading characteristics required for bone formation ................................................................................31
Translation of physical stimuli via bone fluid‐flow.....................................................................................34
WHOLE‐BODY VIBRATION: PHYSICAL STIMULUS FOR BONE..........................................................................36
What is whole‐body vibration? ..................................................................................................................36
How does whole‐body vibration influence muscles and bones? ...............................................................39
Whole‐body vibration and bone formation ...............................................................................................40
Experimental models of whole‐body vibration ..........................................................................................41
Clinical studies of whole‐body vibration ....................................................................................................43
WHOLE‐BODY VIBRATION SAFETY..................................................................................................................45
RATIONALE..........................................................................................................................................................47
OBJECTIVES AND HYPOTHESIS ............................................................................................................................50
CHAPTER ONE: EFFECT OF WHOLE‐BODY VIBRATION ON BONE MINERAL DENSITY: A SYSTEMATIC REVIEW AND META‐ANALYSIS..........................................................................................................................................54
ABSTRACT .......................................................................................................................................................55
INTRODUCTION...............................................................................................................................................57
METHODS .......................................................................................................................................................58
Data sources ...............................................................................................................................................59
Study selection ...........................................................................................................................................60
Data extraction ...........................................................................................................................................61
Sensitivity and subgroup analyses..............................................................................................................62
Quantitative data synthesis........................................................................................................................63
RESULTS ..........................................................................................................................................................64
Study characteristics...................................................................................................................................64
vi

Postmenopausal women............................................................................................................................66
Children and adolescents ...........................................................................................................................76
Young adults ...............................................................................................................................................78
Adverse events ...........................................................................................................................................78
COMMENT ......................................................................................................................................................79
CHAPTER TWO: EFFECT OF 12 MONTHS OF WHOLE‐BODY VIBRATION ON BONE DENSITY AND STRUCTURE IN POSTMENOPAUSAL WOMEN WITH OSTEOPENIA: A RANDOMIZED CONTROLLED TRIAL (THE VIBRATION STUDY) ................................................................................................................................................................84
ABSTRACT .......................................................................................................................................................85
INTRODUCTION...............................................................................................................................................87
METHODS .......................................................................................................................................................89
Setting and study design ............................................................................................................................89
Participants.................................................................................................................................................90
Interventions ..............................................................................................................................................91
Outcomes ...................................................................................................................................................92
Statistical analyses......................................................................................................................................93
RESULTS ..........................................................................................................................................................94
Participants characteristics.........................................................................................................................94
Adherence ..................................................................................................................................................96
Bone outcomes...........................................................................................................................................98
Adverse events .........................................................................................................................................100
COMMENT ....................................................................................................................................................100
CHAPTER THREE: EFFECTS OF WHOLE‐BODY VIBRATION ON CALCANEAL QUANTITATIVE ULTRASOUND PARAMETERS IN OSTEOPENIC POSTMENOPAUSAL WOMEN: A RANDOMIZED CONTROLLED TRIAL (THE VIBRATION STUDY) ...........................................................................................................................................107
ABSTRACT .....................................................................................................................................................108
INTRODUCTION.............................................................................................................................................110
METHODS .....................................................................................................................................................114
vii

Participants and study design...................................................................................................................114
Study interventions ..................................................................................................................................115
Outcomes .................................................................................................................................................116
Statistical analyses....................................................................................................................................117
RESULTS ........................................................................................................................................................119
Participant characteristics ........................................................................................................................119
Calcaneus QUS outcomes.........................................................................................................................122
Adverse events .........................................................................................................................................125
COMMENT ....................................................................................................................................................126
DISCUSSION ......................................................................................................................................................131
CONCLUSIONS...................................................................................................................................................156
FUTURE DIRECTIONS.........................................................................................................................................158
LIST OF REFERENCES .........................................................................................................................................162
TECHNICAL APPENDIX.......................................................................................................................................192
CHAPTER ONE: STANDARDIZED DATA COLLECTION FORMS ........................................................................193
CHAPTER ONE: HANDLING MISSING DATA...................................................................................................198
CHAPTERS TWO AND THREE: A PRIORI PROTOCOL......................................................................................201
CHAPTERS TWO AND THREE: STANDARDIZED DATA COLLECTION FORMS..................................................212
CHAPTERS TWO AND THREE: A PRIORI DATA ANALYSIS PLAN.....................................................................227
CHAPTER TWO: SAS CODES ..........................................................................................................................235
CHAPTER TWO: ADDITIONAL RESULTS .........................................................................................................244
CHAPTER THREE: SAS CODES........................................................................................................................247
CHAPTER THREE: QUS QC – CALIBRATION LOG............................................................................................250
CHAPTER THREE: ADDITIONAL RESULTS.......................................................................................................257
viii

FIGURES AND TABLES
GENERAL INTRODUCTION
Page 5 Figure 1. Bone mass changes in men and women during a normal bone remodelling life‐cycle.
Page 9 Table 1. A FRAX® chart for 10‐year probability of osteoporotic fractures (%) according to number of clinical risk factors (CRFs) and BMD T‐score at the femoral neck in Canadian women aged 60.
Page 10 Table 2. A FRAX® chart for 10‐year probability of hip fracture (%) according to number of clinical risk factors (CRFs) and BMD T‐score at the femoral neck in Canadian women aged 60.
Page 14 Figure 2. Bone biomechanics: load‐deformation and stress‐strain curves.
Page 18 Figure 3. Bone material and structure properties that determine bone strength and fracture risk.
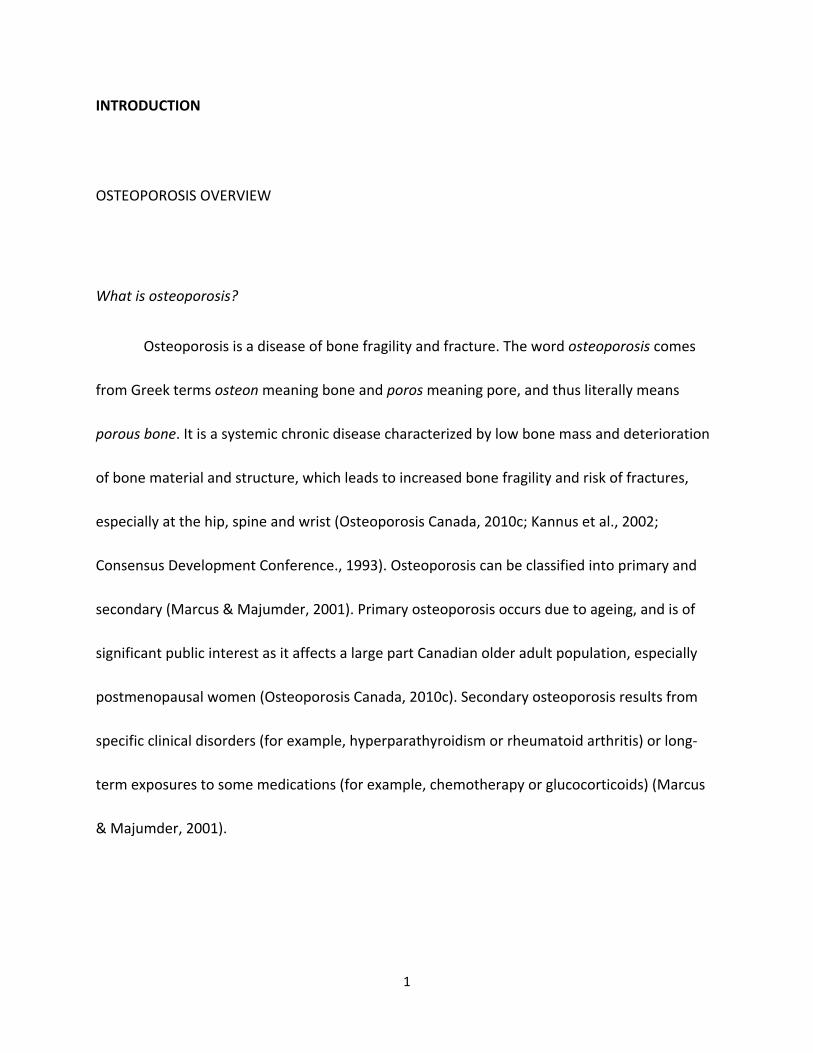
Page 26 Figure 4. Bone material and structure properties that can be directly estimated using DXA, HR‐pQCT and QUS.
Page 33 Figure 5. Proposed non‐linear relationship between bone strain magnitude and number of daily loading cycles necessary for the maintenance of bone mass in the turkey ulna model.
Page 38 Figure 6. Low‐magnitude whole‐body vibration platform: Dynamic Motion Therapy 1000 ™ (Juvent Medical Inc.)
CHAPTER 1
Page 65 Figure 1. QUOROM flow diagram showing systematic literature search summary.
Page 67 Table 1. Characteristics of RCTs included in the systematic review
Page 69 Table 2. Bone mineral density data extracted for all analyses
Page 70 Figure 2. Primary analyses of whole‐body vibration effect on bone mineral density in postmenopausal women.
ix

Page 71 Figure 3. Sensitivity analyses of whole‐body vibration effect on bone mineral density in postmenopausal women.
Page 74 Figure 4. Subgroup analyses of whole‐body vibration effect on hip areal bone mineral density (g∙cm‐2) in postmenopausal women.
Page 77 Figure 5. Primary and sensitivity analyses of whole‐body vibration effect on the spine trabecular volumetric bone mineral density (mg∙cm‐3) in children and adolescents.
CHAPTER 2
Page 95 Figure 1. Flow diagram of participant’s progress through the trial.
Page 97 Table 1. Baseline characteristics of women participating in the Vibration Study.
Page 99 Table 2. Absolute change in all DXA and HR‐pQCT parameters.
Page 101 Table 3. Adverse events summary.
CHAPTER 3
Page 120 Figure 1. Flow diagram of participants’ progress through the analysis of quantitative ultrasound parameters.
Page 121 Table 1. Participants baseline characteristics.
Page 123 Table 2. Absolute 12‐month change in quantitative ultrasound parameters.
Page 124 Figure 2. Subgroup analyses.
x

ABBREVIATIONS
30Hz study group receiving 30 Hertz whole‐body vibration in the trial reported in
chapters two and three of this thesis
90Hz study group receiving 90 Hertz whole‐body vibration in the trial reported in
chapters two and three of this thesis
aBMD areal bone mineral density
aBMDf areal bone mineral density at the femoral neck
aBMDh areal bone mineral density at the total hip (total proximal femur)
aBMDs areal bone mineral density at the lumbar spine
AE adverse event
AMI activity metabolic index
BMC bone mineral content
BMD bone mineral density
BMI body mass index
BUA broadband attenuation
BV/TV trabecular bone volume fraction
CAROC the Canadian Association of Radiologists and Osteoporosis Canada
CON control group not receiving whole‐body vibration in the trial reported in
chapters two and three of this thesis
CRF clinical risk factor/case report form
CTh cortical thickness
DXA dual‐energy x‐ray absorptiometry
FRAX fracture risk calculator
g acceleration due to gravity, 1g = 9.8 m∙s‐2
HAVS hand and arm vibration syndrome
xi

HR‐pQCT high‐resolution peripheral quantitative computed tomography
HRT hormone replacement therapy
HSA hip structural analysis
Hz Hertz, one oscillation per second
ITT intention‐to‐treat
LSC least significant change
pQCT peripheral quantitative computed tomography
QC quality control
QCT quantitative computed tomography
QUI quantitative ultrasound index
QUS quantitative ultrasound
RCT randomized controlled trial
RMS‐CV root mean square coefficient of variation
SAE serious adverse event
SD standard deviation
SOS speed of sound
TN trabecular number
TSp trabecular separation
TTh trabecular thickness
vBMD volumetric bone mineral density
vBMDc volumetric bone mineral density of the cortical bone
vBMDt volumetric bone mineral density of the trabecular bone
vBMDtot volumetric bone mineral density of the total (cortical and trabecular) bone
UHN University Health Network in Toronto, Canada
WBV whole‐body vibration
WHO World Health Organization
xii
1
INTRODUCTION
OSTEOPOROSIS OVERVIEW
What is osteoporosis?
Osteoporosis is a disease of bone fragility and fracture. The word osteoporosis comes
from Greek terms osteon meaning bone and poros meaning pore, and thus literally means
porous bone. It is a systemic chronic disease characterized by low bone mass and deterioration
of bone material and structure, which leads to increased bone fragility and risk of fractures,
especially at the hip, spine and wrist (Osteoporosis Canada, 2010c; Kannus et al., 2002;
Consensus Development Conference., 1993). Osteoporosis can be classified into primary and
secondary (Marcus & Majumder, 2001). Primary osteoporosis occurs due to ageing, and is of
significant public interest as it affects a large part Canadian older adult population, especially
postmenopausal women (Osteoporosis Canada, 2010c). Secondary osteoporosis results from
specific clinical disorders (for example, hyperparathyroidism or rheumatoid arthritis) or long-
term exposures to some medications (for example, chemotherapy or glucocorticoids) (Marcus
& Majumder, 2001).

2
Public and personal burden
According to Osteoporosis Canada as many as 2 million Canadians suffer from
osteoporosis (Osteoporosis Canada, 2010c). Based on Canadian fracture data, approximately
one in four women and one in eight men over the age of 50 will be diagnosed with osteoporosis
(Jackson et al., 2000; Prior et al., 1996). The prevalence of osteoporosis rises dramatically with
age. For instance, going from 50 to 80 years of age the prevalence of osteoporosis increases
from approximately 6% to over 50% (Looker et al., 2010). These figures become even more
striking when one considers that by 2031 the population aged 65 and over is expected to reach
25% of the total Canadian population (Rosenberg, 2000).
Osteoporosis-related bone deterioration progresses silently, until an osteoporotic
fracture is sustained (Osteoporosis Canada, 2010c). There were about 25,000 hip fractures in
Canada in 1993, of which 80% were osteoporotic (Osteoporosis Canada, 2010c). Approximately
40% of Canadian postmenopausal women will develop an osteoporotic fracture at the hip,
vertebrae or wrist (Cheung et al., 2004). This is of serious public concern, because osteoporotic
fractures lead to significant increases in mortality and morbidity. For example in North
American and European populations, approximately 20% of postmenopausal women were
found to die within the first year after experiencing a hip fracture (Chrischilles et al., 1991), and
increased mortality was found to persist for 10 years after sustaining a vertebral fracture,
primarily due to pulmonary disease and cancer (Kado et al., 1999; Hasserius et al., 2005).

3
The personal burden of osteoporosis involves a reduction in the quality of life due to
post-fracture recovery. It was estimated that about 50% of postmenopausal women lost their
ability to live independently after sustaining a hip fracture (Chrischilles et al., 1991;
Osteoporosis Canada, 2010c). Vertebral fractures can cause significant back pain and loss of
height due to kyphosis, and may result in depression and low self-esteem (Gold, 1996;
Silverman, 1992). However, only about one-third of vertebral fractures are clinically diagnosed
before leading to visible disfigurement (Cooper et al., 1992).
It was estimated that in 1993 the total Canadian health care costs attributable to
osteoporosis-related hospitalization, outpatient care and drug therapy were $1.3 billion
(Tenenhouse et al., 2000). Given that the proportion of older people in the Canadian
population is rising, these costs are also expected to increase (Osteoporosis Canada, 2010c). For
example, annual Canadian health care costs due to hip fracture were estimated to be $650
million in 2001 and expected to rise to $2.4 billion by 2041 (Wiktorowicz et al., 2001).
Bone remodelling
Bone remodelling refers to the continuous process of bone resorption by a type of bone
cells named osteoclasts, and bone formation by another type of bone cells named osteoblasts.
The balance between bone resorption and formation determines whether bone is accrued,
maintained or lost (Marcus & Majumder, 2001). Based on bone mineral density (BMD)

4
measurement by the gold standard, dual-energy x-ray absorptiometry (DXA), there are three
basic stages during a human life-cycle, during which a different balance between bone
formation and resorption occurs (Marcus & Majumder, 2001). Bones need to grow during
childhood and adolescence, thus the overall bone remodelling rate is relatively high, and
osteoblastic bone formation exceeds osteoclastic bone resorption, leading to overall bone
accrual (Wren et al., 2005). In young adults, osteoblasts and osteoclasts function at a slower
and relatively equal rate, thus bone mass is more or less maintained so that about 10% of old
bone becomes replaced with new bone each year (Marcus & Majumder, 2001). After about the
age of 40, the overall bone remodelling rate increases again but osteoclastic resorption exceeds
osteoblastic formation, hence bone mass is lost (Riggs et al., 2001). Factors that contribute to
this age-related bone loss include reductions in endogenous estrogens, especially in women,
impairment in osteoblast function, calcium and vitamin D deficiency, and changes in intestinal
mineral absorption, renal mineral handling and parathyroid hormone secretion (Riggs et al.,
2001). Compared to men, women are particularly affected by age-related bone loss (Riggs et al.,
2001); one in four women and one in eight men will be diagnosed with osteoporosis in Canada
(Jackson et al., 2000; Prior et al., 1996). This is because in addition to slow age-related bone loss
which begins at the age of 40 for both men and women, postmenopausal women experience
accelerated bone loss during the initial 4 to 8 years of menopause due to a lack of estrogen-
dependent inhibition of osteoclastic resorption (Figure 1). Compared to women, men also tend
to achieve higher absolute peak bone mass (Riggs et al., 2001).

Age,
yea
rs
20
40
60
80
100
Bone mass, g/calcium
Adap
ted
from
: Rig
gs L
, Kho
sla S
, Mel
ton
J. Th
e ty
pe I/
type
II m
odel
for i
nvol
utio
nal o
steo
poro
sis. I
n: M
arcu
s R, F
eldm
an D
, Ke
lsey
J, ed
s. O
steo
poro
sis, S
econ
d Ed
ition
. San
Die
go, C
A: A
cade
mic
Pre
ss; 2
001:
49-5
8.
Figu
re 1
.Bon
e m
ass c
hang
es in
men
and
wom
en d
urin
g a
norm
al b
one
rem
odel
ling
life-
cycl
e
500 1000 1500
Luba
Typewritten Text
5
Luba
Typewritten Text

6
Risk factors
The fracture risk calculator (FRAX®) has been recently developed by the World Health
Organization (WHO) to evaluate individual’s 10-year risk of developing osteoporotic fracture
(World Health Organization, 2010). FRAX® is a computer-driven tool that integrates the
probability of sustaining an osteoporotic fracture based on clinical risk factors and BMD at the
femoral neck. The 10-year risk of fracture is calculated based on models developed from
studying population-based cohorts from various countries and its calculations are country-
specific. The Canadian FRAX® tool can be accessed electronically at the WHO website (World
Health Organization, 2010), and uses the following risk factors for the calculation of 10-year
fracture risk in Canadian women and men:
- BMD at the femoral neck: This factor is optional, as the assessment of 10-year fracture
risk can be performed with only the risk factors listed below, but its inclusion results in
better fracture risk determination (Papaioannou et al., 2010).The lower the femoral
neck BMD the higher the risk of osteoporotic fracture.
- Age: Risk of fracture increases with age
- Sex: Fracture risk is higher for women than men.
- Weight: Low body mass is a risk factor of osteoporosis.

7
- Height: Low body mass index (BMI), calculated based on height and weight is a risk
factor of osteoporosis.
- Previous osteoporotic fracture: Prior osteoporotic fracture is an especially strong risk
factor for sustaining future fracture(s).
- Parent hip fracture: Osteoporosis has a strong genetic component (Williams & Spector ,
2006), therefore family history of osteoporotic fracture indicates an increased risk of
sustaining an osteoporotic fracture(s).
- Current smoking: Current smoking status has a dose-dependent effect; in other words,
the greater the exposure the higher the risk of osteoporosis.
- Glucocorticoids: Taking glucocorticoids for more than 3 months at a dose approximately
equal to 5 mg of prednisolone or more increases the risk of osteoporotic fracture and
the effect is dose-dependent.
- Rheumatoid arthritis: Rheumatoid arthritis is a secondary cause of osteoporosis, and
thus increases the risk of developing osteoporotic fracture.
- Secondary osteoporosis: Other secondary causes of osteoporosis also increase the risk
of developing osteoporotic fracture.
- Alcohol ≥3 units a day: Excessive alcohol ingestion increases bone loss and
deterioration, and has a dose-dependent effect.

8
DIAGNOSIS AND MONITORING OF POSTMENOPAUSAL OSTEOPOROSIS
The Osteoporosis Canada 2010 clinical practice guidelines for the diagnosis and
management of osteoporosis in women and men over the age of 50 highlight a current
paradigm shift in the focus on treating and preventing osteoporotic fractures and their
consequences, rather than on treating low BMD (Papaioannou et al., 2010). This shift occurred
because low BMD, as measured by DXA the gold standard, was viewed as only one of several
risk factors for fracture. Thus, the 2010 Canadian guidelines recommend that the treatment of
osteoporosis is not just based on DXA BMD testing, but rather has to be predicated by an
assessment of absolute fracture risk (Papaioannou et al., 2010). The absolute 10-year fracture
risk can be assessed using two different clinical tools, with high (90%) concordance to one
another, both calibrated using the same Canadian fracture data and validated in Canadians: 1)
the Canadian Association of Radiologists and Osteoporosis Canada tool (CAROC;
www.osteoporosis.ca) and 2) the WHO FRAX® tool, specific for Canada (Papaioannou et al.,
2010). The CAROC tool uses sex, age, femoral neck DXA BMD testing, presence of prior fragility
fracture after age 40, and recent prolonged use of systemic glucocorticoids to assess absolute
10-year fracture risk, and is easy to use. The WHO FRAX® tool uses a more complete set of
clinical risk factors to assess absolute or hip 10-year fracture risk, described in the section
above, but its calculations require access to system software, website or paper charts (e.g.,
Table 1 and 2). The, the choice between these two tools should be primarily based on personal
preference and convenience (Papaioannou et al., 2010). However, although this paradigm shit
in Canadian osteoporosis guidelines occurred, DXA BMD testing still remains the strongest

Sour
ce: F
RAX®
WHO
web
site
-ht
tp:/
/ww
w.s
heffi
eld.
ac.u
k/FR
AX/c
hart
s.jsp
Not
e: B
MI i
s set
at 2
4 kg
/m²)
Tabl
e 1.
A F
RAX®
cha
rt fo
r 10-
year
pro
babi
lity
of o
steo
poro
tic fr
actu
re(s
) (%
) acc
ordi
ng to
num
ber o
f clin
ical
risk
fact
ors (
CRFs
) and
BM
D T-
scor
e at
the
fem
oral
nec
k in
Can
adia
n w
omen
age
d 60
.
Luba
Typewritten Text
9

Tabl
e 2.
A F
RAX®
cha
rt fo
r 10-
year
pro
babi
lity
of h
ip fr
actu
re (%
) acc
ordi
ng to
num
ber o
f clin
ical
risk
fact
ors (
CRFs
) and
BM
D T-
scor
e at
the
fem
oral
nec
k in
Can
adia
n w
omen
age
d 60
.
Sour
ce: F
RAX®
WHO
web
site
-ht
tp:/
/ww
w.s
heffi
eld.
ac.u
k/FR
AX/c
hart
s.jsp
Not
e: B
MI i
s set
at 2
4 kg
/m²)
Luba
Typewritten Text
10

11
independent skeletal factor for the prediction of osteoporotic fractures, and is used as the gold
standard to classify patients as having osteoporosis or low bone mass (also known as
osteopenia in postmenopausal women) (World Health Organization, 1994).
Osteoporotic fracture
The diagnosis of osteoporosis in postmenopausal population is made when a
osteoporotic or fragility fracture is sustained after the age of 40. Although the definition of
osteoporotic fracture is somewhat subjective, some criteria exist (Johnell & Kanis, 2005). A
fracture is considered osteoporotic if it occurs at a site associated with low bone mass (for
example, femur, pelvis, vertebrae, radius and ulna), and in response to a seemingly insignificant
force that would otherwise not be expected to cause a clinical fracture (Johnell & Kanis, 2005;
Cummings & Nevitt, 1989). For example, a hip fracture that is sustained due to a fall from a
standing height or less would be considered as osteoporotic.
Dual-energy x-ray: the gold standard
BMD, as assessed by DXA at the femoral neck, total proximal femur, lumbar spine or
distal radius, is the gold standard for diagnosing postmenopausal osteoporosis in Canada
(Siminoski et al., 2005). DXA BMD testing is recommended in postmenopausal women with a
risk factor for osteoporotic fracture or those aged 65 or older (Papaioannou et al., 2010). DXA
measurement is evaluated based on a scoring system called the T-Score, which specifies the
number of standard deviations (SDs) that a postmenopausal woman’s BMD falls below the

12
mean BMD of a young female reference population (Siminoski et al., 2005). Since peak BMD is
generally achieved around the age of 30, young versus old reference population is used for
comparison (Riggs et al., 2001). Based on WHO criteria, postmenopausal osteoporosis is
defined as a T-Score of ≤-2.5 SDs, and osteopenia, a stage prior to postmenopausal
osteoporosis, is defined as a T-Score falling between ≤-1.0 and >-2.5 SDs (World Health
Organization, 1994). A threshold of -2.5 SDs was chosen for the diagnosis of osteoporosis,
because it identifies approximately 30% of Caucasian women as having osteoporosis, which is
similar to the proportion of women who will experience fracture in their lifetime (Lewiecki et
al., 2006). Based on the WHO criteria using DXA BMD, the prevalence of osteoporosis in
Canadian women 50 years or older was found to be 8% at the femoral neck and 12% at the
lumbar spine in the Canadian Multicentre Osteoporosis Study (Tenenhouse et al., 2000).
Monitoring
Monitoring of bone health in postmenopausal population begins with the assessment of
10-year risk of fracture with CAROC or WHO FRAX® tools and initial DXA BMD testing, which are
used to decide whether pharmacotherapy would be beneficial to reduce fracture risk
(Papaioannou et al., 2010). After pharmacotherapy has been provided, monitoring of bone
health in postmenopausal women based on CAROC or WHO FRAX® tools is not recommended,
because this 10-year fracture risk assessment reflects the theoretical risk of treatment-naïve
patients and does not reflect a reduction in risk associated with therapy (Papaioannou et al.,
2010). Monitoring with DXA BMD is recommended in the Osteoporosis Canada 2010 clinical

13
practice guidelines in postmenopausal women who are 1) treatment-naïve with moderate 10-
year fracture risk every 1-3 years, 2) treatment-naïve with low 10-year fracture risk and stable
BMD every 5-10 years, and 3) on bone pharmacotherapy every 1-3 years (Papaioannou et al.,
2010). New osteoporotic and vertebral fractures also need to be assessed in postmenopausal
women as part of bone health monitoring (Papaioannou et al., 2010).
BONE STRENGTH AND FRAGILITY
Bone biomechanics
The complex nature of bone strength can be better understood by examining bone’s
behaviour when it is placed under an external force or load. In ex vivo experiments, an external
load is typically applied to a long bone through bending, such as four-point bending, and as the
load is progressively increased, bone deformation is measured in millimetres at the side that is
being stretched or elongated (Bouxsein, 2006). This relationship between external loading and
bone deformation can be plotted using the load-deformation curve (Figure 2). When the load is
initially applied, the bone will undergo deformation in a linear manner in the elastic region until
it reaches its yield point. Prior to reaching the yield point, bone returns to its original size and
shape when the load is removed. Beyond the yield point, bone will enter the plastic region
during which deformation becomes permanent and the bone does not return to its original size

Figu
re 2
.Bon
e bi
omec
hani
cs: l
oad-
defo
rmat
ion
and
stre
ss-s
trai
n cu
rves
.
Adap
ted
from
: Bou
xsei
n M
L. B
iom
echa
nics
of b
one.
In: D
emps
ter D
, Fel
senb
erg
D, v
an D
er G
eest
S, e
ds.
The
Bone
Qua
lity
Book
: A G
uide
to F
acto
rs In
fluen
cing
Bon
e St
reng
th. A
mst
erda
m: E
lsvie
r BV;
200
6.
Def
orm
atio
n (m
m)
Load (N)
Stra
in (m
m/m
m)
Stress (N/mm2)
ULT
IMAT
E ST
RES
S =
STR
ENG
TH
STIF
FNES
S (N
/mm
)
Duc
tile
mat
eria
l, e.
g. ir
on
Brit
tle m
ater
ial e
.g.,
glas
s
Bon
e
ELAS
TIC
M
OD
ULU
S/
STIF
FNES
S
TOU
GH
NES
S
FAIL
UR
E LO
AD
Luba
Typewritten Text
14

15
or shape. If the load continues to be applied, the bone will reach its failure load, at which point
a complete structural failure results in bone fracture. Bone stiffness is estimated by the slope
of the load-deformation relationship in the elastic region, and represents the amount of force
needed to cause deformation. When a significant amount of force is required to deform a
structure by a small length, the structure is said to be stiff. On the other hand, an elastic
structure will undergo ample deformation under small external loads and return to its original
shape easily.
When the applied load is expressed per bone’s cross sectional area (stress) and the
deformation is divided by the original bone length (strain), the resulting relationship, known as
the stress-strain curve, provides additional information about bone’s biomechanics (Bouxsein,
2006). Elastic modulus, or the inherent stiffness of a bone tissue, can be calculated by obtaining
the slope of a stress-strain curve in the elastic region. Bone toughness can be calculated by
obtaining the area under stress-strain curve, and bone strength is the ultimate stress reached at
the failure point (Figure 2). A material such as glass is said to be brittle because it undergoes
very little deformation, while iron is considered to be ductile as it undergoes significant
deformation before it completely reaches its ultimate stress.
Since bone is a composite material, comprised mainly of mineral and collagen matrix
embedded in one another, it can act with both stiffness and toughness; mineral affords bone its
stiffness and collagen its toughness (Bouxsein, 2006). Bone also has viscoelastic and anisotropic

16
characteristics. Viscoleasticity determines bone’s behaviour in response to loads applied at
different rates. Bone will respond with more stiffness and withstand greater loads prior to
failure when they are applied at faster rates. Anisotropy refers to bone’s ability to behave
differently under loads applied in different directions. For example, bone is strong under
compression, because it has been habitually loaded in that direction, but does not have much
strength under loads applied in a transverse direction, as it is unaccustomed to shear or torsion
stresses (Bouxsein, 2006).
Bone tissue properties
Bone has material and structural properties which determine its strength (Felsenberg,
2006). Human bone is a composite material made up of inorganic mineral matrix (70%), organic
matrix (~25%) and water (5-8%) (Bouxsein, 2006). As mentioned above, the calcium-phosphate
mineral matrix, which is a specific hydroxyapatite crystal, gives bone its stiffness. The organic
phase is primarily made up of type I collagen fibres, which are imbedded in the mineral matrix
in various directions, and partly provides bone with elasticity and toughness. Bone fluid is found
in pores or canaliculi within the bone matrix and gives bone its viscoelastic properties.
Two types of bone tissue exist, each with different bone strength characteristics.
Cortical (or compact) bone tissue forms the outer layer of bones, particularly along the shafts of
long bones. It is made up of hollow tubes of bone matrix placed inside one another, so that

17
they are packed very densely and give bone it stiffness and strength. Trabecular (or cancellous)
bone tissue is made up of small flat pieces of bone matrix (trabeculi) connected to one another
in a lattice-like arrangement, and is found in abundance in the vertebral bodies, femoral neck
and calcaneus. Although it is more porous, less stiff and more likely to fracture than cortical
bone, its trabecular microstructure allows it to resist forces by absorbing and distributing
energy. Trabecular tissue contributes to bone’s elasticity and shock-absorption, and allows the
skeleton to remain relatively light while maintaining its strength. The trabeculi will also adapt
their thickness, number and orientation in parallel to the direction of the imposed stress, and
thus contribute to bone’s anisotropy.
Bone strength determinants in postmenopausal women
Various bone material and structural properties influence bone fragility in
postmenopausal women (Figure 3), and some can be measured non-invasively as described in a
section below. The most widely used in vivo determinant of bone strength is the amount of
mineralized bone matrix or BMD (Siminoski et al., 2005). Bone hydroxyapatite provides bone
with stiffness and strength, and the lower the BMD the higher the risk of osteoporotic fracture
(Kanis et al., 2010). Bone geometry, including its shape and external diameter, influence bone’s
behaviour under external load, and is especially important to consider when examining femoral
neck fractures in postmenopausal women (Turner, 2005). Also, expansion of the external bone

BON
E ST
REN
GTH
Bone
min
eral
den
sity
Area
lTo
tal
Volu
met
ric
Trab
ecul
arCo
rtic
alTr
abec
ular
/tot
al
Bone
stru
ctur
e
Geom
etry
Bone
shap
eEx
tern
al d
iam
eter
Cort
ical
thic
knes
s
Mic
roar
chite
ctur
eTr
abec
ular
Co
rtic
al p
oros
ity
Bone
intr
insic
pro
pert
ies
Min
eral
Min
eral
/mat
rixCr
ysta
l size
Mic
roda
mag
eN
umbe
rSi
zeLo
catio
n
Colla
gen
Amou
ntCr
oss-
links
Frac
ture
Bala
nce,
m
uscl
e st
reng
th,
& p
rote
ctiv
e re
spon
ses
Figu
re 3
. Bon
e m
ater
ial a
nd st
ruct
ure
prop
ertie
s tha
t det
erm
ine
bone
stre
ngth
and
frac
ture
risk
.
Luba
Typewritten Text
18

19
diameter that occurs after menopause is believed to compensate for some of the age-related
bone fragility due to decreased BMD (Ahlborg et al., 2003). Further, deterioration in trabecular
microarchitecture is believed to significantly contribute to age-related increase in bone fragility,
especially in early menopause (Pacifici, 2001). Age-related perforation and complete
disappearance of bone trabeculi lead to porous trabecular tissue, making it less able to absorb
energy and more likely to collapse. Slow, age-related bone loss is 50-70% cortical and 30-50%
trabecular, and accelerated early postmenopausal bone loss is at least 85% trabecular (Riggs et
al., 2001). Further, women who develop postmenopausal osteoporosis can often experience 15
to 20 years of the accelerated trabecular bone loss (Riggs et al., 2001). The intrinsic properties
of bone inorganic and organic matrix further determine bone strength (Felsenberg, 2006). The
mineral to organic matrix ratio influences the balance between bone stiffness and flexibility; for
example, too much mineral matrix and the bone loses its elasticity only to become too brittle.
The accumulated bone fatigue or microdamage also contributes to bone’s increased risk of
fracturing in postmenopausal women. More abundant, larger micro-cracks, which can
accumulate at an already weakened skeletal site, are believed to contribute to osteoporotic
fractures (Burr et al., 1997; Felsenberg, 2006). Finally, whether a postmenopausal woman
sustains an osteoporotic fracture does not only depend on her bone strength but also on her
muscle strength, balance and protective responses during a fall (Cumming et al., 1997).

20
NON-INVASIVE MEASUREMENTS OF BONE STRENGTH
Bone densitometry
Several bone material and structure properties discussed above can be estimated using
various non-invasive bone densitometry instruments. DXA is one bone densitometry tool and
its BMD measurement is used for the diagnosis of osteoporosis, predicting fracture risk and
monitoring treatment in clinical practice (Kanis et al., 2010; Siminoski et al., 2005; World Health
Organization, 1994). DXA involves minimal ionizing radiation (approximately 1/10th of a chest x-
ray), and its measurements are made at osteoporosis-prone sites, including the femoral neck,
total proximal femur (total hip), lumbar spine (L1-L4) and distal radius. BMD measurement
using DXA involves differential absorption of two x-ray beams by bone and soft tissues, and
reflects the mass of mineralized bone matrix per unit of bone area (g·cm-2). DXA has good
accuracy (3-5%) and precision (0.5-2%) (Mirsky & Einhorn, 1998). Since it reflects bone mass
and the degree of bone matrix mineralization, it has been shown to correlate strongly (r2 = 0.4-
0.9) with the force needed to break a bone in ex vivo studies (Cummings et al., 2002). Hip
structural analysis (HSA), which is based on DXA hip measurement and involves making
projective estimates about bone geometric and biomechanical parameters, has also been used
in research (Prevrhal et al., 2008). However, DXA measurements do not reflect bone
microarchitecture or bone intrinsic properties. Further, true density is a volumetric measure

21
where mass is expressed per unit of volume (mg·cm-3), but DXA obtains areal BMD (aBMD)
expressed per unit of area in the coronal plane (g·cm-2). As such, DXA BMD is significantly
influenced by changes in bone size or volume, especially in children and adolescents whose
bones are growing (Binkley et al., 2005). DXA’s limitations partly explain why only a portion of
fracture risk reduction in response to osteoporosis medications can be explained by increased
aBMD (Lenchik et al., 2002) and why fragility fractures often occur even when aBMD T-Scores
are >-2.5 SD in postmenopausal women (Marshall et al., 1996).
To overcome some of DXA’s shortcomings, volumetric bone densitometry tools have
been developed including quantitative computed tomography (QCT). Due to three-dimensional
and high-resolution measurement characteristics, QCT is able to obtain true volumetric BMD
(vBMD, g·cm-3), separately assess trabecular and cortical bone tissues, and examine bone
geometry (Bouxsein, 2004). QCT measurement is particularly responsive to lumbar spine
trabecular vBMD changes in postmenopausal women (Chesnut et al., 2001). However, QCT
involves high doses of radiation, because it is used for measurements at central sites. Thus,
peripheral computed tomography (pQCT) instruments have been developed for volumetric
densitometry measurements at peripheral sites, generally the tibia and radius, which involve
approximately the same dose of radiation as DXA (Bouxsein, 2004). vBMD measurements using
pQCT were found to have good short-term and long-term precision and accuracy, comparable
to DXA (Wapniarz et al., 1994; Grampp et al., 1994; Ashe et al., 2006).

22
More recently, high-resolution pQCT (HR-pQCT) instruments were developed for
measurements of cortical thickness and trabecular microarchitecture (Bouxsein, 2004). HR-
pQCT is of particular interest in the management of postmenopausal osteoporosis, because it
can assess trabecular vBMD and microarchitecture, which become especially deteriorated
during early menopause (Riggs et al., 2001). Used as an adjunct to DXA aBMD, it can better
identify postmenopausal women at increased risk of fracture and examine responses to
treatment (Boutroy et al., 2005; Bouxsein, 2004). Other advantages of HR-pQCT include exact
three dimensional matching of bone volume for intra-person comparisons and minimal
superposition of soft tissues (Chesnut et al., 2001). In a cross-sectional study, HR-pQCT was able
to differentiate between premenopausal and postmenopausal women based on vBMD,
trabecular microarchitecture and cortical thickness (Boutroy et al., 2005). Also based on
trabecular bone parameters, HR-pQCT was able to identify those postmenopausal women who
were diagnosed with osteopenia but sustained osteoporotic fracture (Boutroy et al., 2005).
Although short-term precision, as measured by root mean square coefficient of deviation (RMS-
CV), for HR-pQCT vBMD measurements (RMS-CVs: 0.7-1.5%) is good and comparable to DXA, it
is not as good for trabecular microarchitecture measurements (RMS-CVs: 2.5-4.4%) (Boutroy et
al., 2005). As well, there is some concern that peripheral HR-pQCT bone characteristics are site-
specific and do not necessarily reflect bone properties at central sites (Lochmüller et al., 2002).
Also, some bone intrinsic properties, such as micro-cracks, cannot be evaluated using HR-pQCT,
because its resolution is still not high enough. Finally, because it is a newer technology and not

23
the gold standard, HR-pQCT remains less available and less readily utilized in the management
of postmenopausal osteoporosis than DXA (Bouxsein, 2004).
Quantitative ultrasound
Quantitative ultrasound (QUS) is not a bone densitometry tool, but it can be used to
estimate BMD and bone stiffness (Guglielmi et al., 2010). Although various peripheral
measurements can be made with QUS, the calcaneus has been more commonly examined in
osteoporosis research than other skeletal sites, such as the phalanges (Krieg et al., 2008).
Calcaneal QUS measurement involves placing a heel between two piezoelectric probes, one of
which emits and the other one receives impulses of ultrasound waves (typical frequency range:
200-800 kHz) (Guglielmi et al., 2010; Krieg et al., 2008). After being transmitted through the
bone, ultrasound wave characteristics that relate to bone material and structure are obtained,
including attenuation (dB·MHz-1) and speed (m·s-1) of sound (Guglielmi et al., 2010; Krieg et al.,
2008). The stronger the bone, the greater is the attenuation and speed of sound through the
bone. Ex vivo QUS bone measurements were found to be well correlated with bone stiffness,
strength and BMD in human cadavers and bovine femur (Ashman et al., 1987; Bouxsein &
Radloff, 1997; Glüer et al., 1994; Hodgskinson et al., 1996; Langton et al., 1996; Njeh et al.,
1996; Sasso et al., 2008). Since bone acoustic properties are believed to be primarily affected by
the mineralized bone matrix, it is currently accepted that QUS parameters are good estimates

24
of the calcaneal BMD (Nicholson et al., 2001; Wu et al., 1998). However, some believe that they
may also reflect trabecular microarchitecture and bone intrinsic properties of collagen fibres
(Lin et al., 2009; Njeh et al., 2001; Sasso et al., 2008; Wu et al., 1998). Sound attenuation, but
not speed, was found to be particularly influenced by trabecular microarchitecture, possibly
because as sound waves pass through bone they may become scattered and absorbed by the
trabecular structure (Glüer et al., 1994; Kaczmarek et al., 2000; Sasso et al., 2008).
Correlations between QUS and DXA have been found to be as high as r = 0.8-0.9 at the
same skeletal sites, as summarize elsewhere (Lewiecki et al., 2006). Further, in a recent large
prospective study, QUS was found to predict fracture risk independently of DXA (Moayyeri et
al., 2009). Although discordant QUS and DXA results occur, they are not believed to represent
QUS measurement error, but rather the difference in independent information obtained by
these two techniques (Krieg et al., 2008). Currently, calcaneal QUS measurements have been
recommended for estimating the risk of fracture where DXA is not available, as part of
educational programs designed to increase public awareness of osteoporosis, but were not
recommended for osteoporosis diagnosis or treatment monitoring in postmenopausal
population (Krieg et al., 2008; Lewiecki et al., 2006). In postmenopausal research, calcaneal
QUS parameters have been used to monitor bone medications and nutritional strategies (Frost,
2001; Moschonis & Manios, 2006), but large randomized controlled trials (RCTs) are lacking
(Krieg et al., 2008). Although calcaneal QUS has good short-term precision (RMS-CVs: 2.7-5%)

25
(Krieg et al., 2008), follow-up measurements can be influenced by changes in soft tissue
thickness, composition or skin temperature (Chappard et al., 2000; Ikeda & Iki, 2004; Kotzki et
al., 1994). Further, calcaneal QUS parameters were found to be less responsive to bone
medications than central DXA aBMD (Frost, 2001), primarily because peripheral sites are
believed to respond slower to pharmacological interventions (Bouxsein et al., 1999; Krieg et al.,
2008; Lewiecki et al., 2006).
In summary, various bone material and structure properties that determine bone
strength can be estimated non-invasively using DXA, HR-pQCT and QUS tools, as summarized in
Figure 4.
PREVENTION OF POSTMENOPAUSAL OSTEOPOROSIS
Prevention of osteoporosis is especially important in postmenopausal women with
osteopenia, because their bone fragility is not far from being considered osteoporotic and they
continue to lose bone. A postmenopausal woman who is diagnosed with osteopenia should first
attempt to reduce or eliminate modifiable risk factors for osteoporotic fracture, such as
excessive alcohol consumption (≥3 drinks a day) and smoking (Kanis et al., 2010).
BON
E ST
REN
GTH
Bone
min
eral
den
sity
Area
lTo
tal
Volu
met
ric
Trab
ecul
arCo
rtic
alTr
abec
ular
/tot
al
Bone
stru
ctur
e
Geom
etry
Bone
shap
eEx
tern
al d
iam
eter
Cort
ical
thic
knes
s
Mic
roar
chite
ctur
eTr
abec
ular
Co
rtic
al p
oros
ity
Bone
intr
insic
pro
pert
ies
Min
eral
Min
eral
/mat
rixCr
ysta
l size
Mic
roda
mag
eN
umbe
rSi
zeLo
catio
n
Colla
gen
Amou
ntCr
oss-
links
DXA
HR-p
QCT
QU
S
Figu
re 4
. Bon
e m
ater
ial a
nd st
ruct
ure
prop
ertie
s tha
t can
be
dire
ctly
est
imat
ed u
sing
DXA,
HR-
pQCT
and
QU
S.
Abbr
evia
tions
: HR-
pQCT
, hig
h-re
solu
tion
perip
hera
l qua
ntita
tive
com
pute
d to
mog
raph
y; Q
US,
qua
ntita
tive
ultr
asou
nd; D
XA, d
ual-e
nerg
y x-
ray
abso
rptio
met
ry. D
otte
d ar
row
: Alth
ough
HR-
pQCT
is a
ble
to o
btai
n ar
eal b
one
min
eral
den
sity,
it is
not
par
t of i
ts st
anda
rd o
utpu
t.
Luba
Typewritten Text
26

27
Nutrition
Adequate calcium and vitamin D intakes are necessary for healthy bones, because
calcium is the main constituent of the bone mineral matrix and vitamin D regulates calcium
absorption in the body. The most recent Osteoporosis Canada guidelines recommend daily
1200 mg of calcium and 800-2000 IU of vitamin D in adults over the age of 50 (Osteoporosis
Canada, 2010c). Postmenopausal women often do not ingest adequate amounts of calcium
through diet, and are not exposed to enough sunshine throughout the year in the Canadian
climate to metabolize adequate amounts of vitamin D (Pacifici, 2001; Marcus & Majumder,
2001). Thus, calcium and vitamin D supplements are especially recommended in this population
(Brown et al., 2006). However, since excessive calcium supplementation has been recently
linked to increased risk of kidney stones and vascular events (Bolland et al., 2008), dietary
calcium intakes should be estimated and supplements should be matched so that total (diet
plus supplements) daily intakes are no more than 1500 mg (Hung et al., 2010; Osteoporosis
Canada, 2010a). Although the role of other nutrients (for example, vitamin K) and dietary
patterns have been previously investigated (Tucker et al., 2002; Cheung et al., 2008), only
calcium and vitamin D remain to be recommended for osteoporosis prevention in clinical
practice (Brown et al., 2006).

28
Bone medications
Various bone medications are currently prescribed in Canada, but are generally used for
osteoporosis treatment and not prevention in postmenopausal women (Papaioannou et al.,
2010). However, if a postmenopausal woman who has osteopenia is deemed to have a high 10-
year fracture risk due to other clinical factors besides her BMD and age (for example, taking
glucocorticoids for >3 months), bone medications are recommended (Kanis et al., 2010; World
Health Organization, 2010). The most commonly administered bone medications are
bisphosphonates, which reduce bone resorption and bone loss during menopause (Brown et al.,
1990; Cheung et al., 2004). Of these, once a year infusion of zoledronic acid was recently shown
to significantly reduce mortality due to osteoporosis-related causes (Lyles et al., 2007). Daily
injections of parathyroid hormone have been primarily administered in Canada to patients with
severe osteoporosis, because it is a strong anabolic bone agent that not only reduces bone
resorption but also increases bone formation (Black et al., 2003). Other bone medications
include selective estrogen receptor modulators (for example, raloxifene), calcitonin and
denosumab (Osteoporosis Canada, 2010b). Hormone replacement therapy (HRT) is currently
recommended for the treatment of osteoporosis in select postmenopausal women, such as
those with vasomotor symptoms of menopause (NAMS, 2010).

29
Physical activity
Prevention of postmenopausal osteoporosis through physical activity should be a life-
long goal (Vainionpää et al., 2005). There are many striking examples of the effects of physical
activity or disuse on the human skeleton. For instance, adult professional tennis players were
observed to have as much as 35% larger and denser bone in the dominant versus non-dominant
arm (Jones et al., 1977). Astronauts were found to experience as much as 2% monthly bone loss
due to microgravity-related disuse (Jones et al., 1977; Lang et al., 2004), which is similar to the
amount of bone lost in a year in postmenopausal women (Cheung et al., 2008). Physical activity
during childhood and adolescence is especially important for maintaining bone health
throughout life, because insufficient bone formation during this life period can result in
inadequate peak bone accrual (Shea et al., 2004; Wallace & Cumming, 2000). Also compared to
the aging skeleton, young bones have a greater potential for forming new bone, and are thus
more responsive to physical activity (Forwood & Burr, 1993). Only modest increases in BMD (1-
2%) have been found in postmenopausal women, primarily in response to moderate- to high-
intensity but not light-intensity exercises (Shea et al., 2004; Wallace & Cumming, 2000).
Adherence to physical activity can also be low in postmenopausal women, partly due to fear of
sustaining musculoskeletal injury or falling (Shea et al., 2004; Wallace & Cumming, 2000).
However, in spite of minimal BMD improvements and struggles with adherence, physical
activity continues to be an important strategy for the prevention of postmenopausal

30
osteoporosis, because it also improves muscle strength and balance and reduces the risk of
falling (Shea et al., 2004; Wallace & Cumming, 2000).
PHYSICAL STIMULI AND BONE
Bone adaptation to loading
According to Wolff’s law of bone adaptation, normal bone will respond to external loads
it is placed under by adapting to it (Wolff, 1986). If loading on a particular bone is increased
over time, the bone will undergo remodelling and adjust its properties so that it becomes
stronger and better able to resist such forces. In contrast, if loading on a bone decreases, bone
remodelling changes over time so that less bone is accrued and bone becomes weaker. Thus,
habitual loading of the skeleton is necessary for the maintenance of strong bones, otherwise
the skeletal tissue will become compromised by disuse; ‘use it or lose it’ principle applies to the
bones as it does to muscles (Wolff, 1986). In response to increased mechanical loading over
time, the net bone remodelling balance will favour bone formation, resulting in various changes
including increased bone diameter (Haapasalo et al., 2000; Jones et al., 1977), cortical thickness
(Adami et al., 1999), trabecular thickness and number (Modlesky et al., 2008), and BMD
(Wallace & Cumming, 2000). Trabecular microarchitecture will also adapt in the direction at
which the load is applied, due to its anisotropic properties (Biewener et al., 1996).

31
Loading characteristics required for bone formation
What characteristics should an external load have to stimulate bone formation? First,
the load needs to be dynamic or time-varying and not static (Lanyon & Rubin, 1984). Also, bone
responds more to high-magnitude loads and this effect is dose dependent (Rubin & Lanyon,
1985). Until recently, the common perception was that only powerful forces, such as those
experienced during high-intensity impact activities, can cause bone adaptation (Rubin et al.,
2001a). It was assumed that a certain threshold of magnitude of an external force had to be
reached to cause bone tissue microdamage, which would require repair and stimulate bone
formation through osteoblasts (Wolff, 1986; Rubin et al., 2001a). If the magnitude of an
external load was not high enough, bone adaptation was not expected. This assumption was
supported by the evidence which showed that bone adaptation in humans was significant in
response to high-intensity impact activities or heavy dynamic loading, such as running or
weightlifting, but not due to low-intensity physical activities (Margulies et al., 1986; Wallace &
Cumming, 2000). Thus, primarily moderate- to high-intensity physical activities have been
recommended for the prevention of osteoporosis in postmenopausal women (Forwood & Burr,
1993).
Recently, however, the importance of small-magnitude loads, which were applied below
an order necessary to cause bone microdamage, but at a high frequency, became highlighted

32
(Judex et al., 2003). High-magnitude loads are not very common during a typical human day,
while small-magnitude strains seem to be omnipresent due to muscle contractions necessary to
retain posture (Fritton et al., 2000). If only high-magnitude strains were the primary source of
physical bone adaptation in humans, then disuse due to microgravity would be expected to
cause minimal bone deterioration in astronauts (Rubin et al., 2001a). However, the amount of
bone lost during one month of microgravity is similar to that of annual bone loss due to age-
related osteoporosis (Lang et al., 2004; Cheung et al., 2008). Thus, lack of constant contractions
of postural slow-twitch muscles, which cause small-magnitude high-frequency strains within
the bone, probably explains such considerable bone loss due to microgravity (Ozcivici et al.,
2010). The importance of high-frequency small-magnitude physical stimuli became more
apparent after various experimental models were conducted (Judex et al., 2003; Qin et al.,
1998; Rubin et al., 2001a; Rubin & McLeod, 1994). Using the turkey ulna model, Qin et al.
established a non-linear relationship between strain magnitude and number of daily loading
cycles necessary for the maintenance of bone mass (Qin et al., 1998), as shown in Figure 5. Also
in disuse osteopenia turkey models, smaller reductions in cross-sectional bone area and
increased growth in bone implant were found in response to low-magnitude high-frequency
mechanical loading applied directly to ulnae using vibrating clamps (Rubin & McLeod, 1994).

Figu
re 5
. Pro
pose
d no
n-lin
ear r
elat
ions
hip
betw
een
bone
stra
in m
agni
tude
and
num
ber o
f dai
ly lo
adin
g cy
cles
nec
essa
ry fo
r the
m
aint
enan
ce o
f bon
e m
ass
in th
e tu
rkey
uln
a m
odel
.
Adap
ted
from
: Qin
YX,
Rub
in C
T, M
cLeo
d K.
Non
linea
r dep
ende
nce
of lo
adin
g in
tens
ity a
nd c
ycle
num
ber i
n th
e m
aint
enan
ce
of b
one
mas
s and
mor
phol
ogy.
Jour
nal o
f Ort
hopa
edic
Res
earc
h.19
98; 1
6:48
2-48
9.
Num
ber o
f loa
ding
cyc
les
Bone strain magnitude
Bone
reso
rptio
n
Bone
form
atio
n
2,00
0 m
icro
stra
in,
4 cy
cles
X
1,00
0 m
icro
stra
in,
100
cycl
es
X
10 m
icro
stra
in,
100,
000
cycl
es
X
Luba
Typewritten Text
33

34
Translation of physical stimuli via bone fluid-flow
How do physical stimuli become translated within the bone to cause regulatory changes
and bone formation? As discussed above, Wolff’s law and the assumption that high enough
forces were required to cause bone microdamage and bone formation did not explain how
small-magnitude physical stimuli became amplified and translated into bone formation within
the bone (Qin et al., 1998; Wolff, 1986). Thus, it was proposed that transduction of mechanical
signals to bone formation probably involved bone fluid-flow through pores or canaliculi in the
bone matrix, as the bone became influenced by physical perturbations in its environment
(Huiskes et al., 2000; Knothe Tate, 2003; Frost, 1998; Turner et al., 1995). Potential bone cells
that may become influenced by changes in bone fluid-flow and orchestrate transduction of
mechanical signals into cellular signalling include bone osteocytes, which are mature
osteoblasts surrounded by their own secreted products with cytoplasmic extensions connecting
one osteocyte to another (Huiskes et al., 2000; Knothe Tate, 2003; Frost, 1998; Turner et al.,
1995). These cytoplasmic extensions are located in a network of canaliculi and surrounded by
the bone fluid. Osteocytes are also connected to bone lining cells, which are precursors of
osteoblasts located on the trabecular surface. Thus, this syncytium of osteocytes, which is
surrounded by bone fluid and connected to bone lining cells and osteoblasts, became the
candidate medium for the conversion of mechanical signals into regulatory mechanisms
involving bone formation (Huiskes et al., 2000).

35
Under stable conditions, bone exists in an environment with specific strain
characteristics to which it is accustomed, and which is dictated by its material and structural
properties. When a physical stimulus is applied to a bone, perturbations in bone’s strain
environment occur, leading to changes in bone fluid-flow. Perturbations to bone’s strain
environment can be caused by external or internal physical stimuli. For example, osteoclastic
resporption is believed to result in a formation of tiny cavities, which can cause perturbations
to bone’s strain environment and fluid-flow locally, and thus stimulate bone formation
(Huiskes et al., 2000), while skeletal muscles contraction provides external stimulation (Judex &
Rubin, 2010). High-magnitude external forces may cause more significant perturbations to
bone’s strain environment and bone fluid-flow, while small-magnitude high-frequency
mechanical signals may create smaller but more abundant changes in bone fluid-flow (Huiskes
et al., 2000).
How exactly bone fluid-flow changes become translated into bone formation is still
poorly understood. As already mentioned, osteocytes are believed to be involved in the
orchestration of mechanical signals transduction by bone fluid-flow changes perhaps via the
Wnt-β-catenin signalling and mesenchynal stem cell differentiation towards osteoblasts
(Ozcivici et al., 2010). As summarized elsewhere, the mechanosensors that may sense bone
fluid-flow changes by the bone cells may include 1) cellular ion channels activity stimulated by

36
stretch and/or strain, 2) cell membrane integrins influenced by shear stress and deformation, 3)
cell membrane lipid rafts influenced by shear stress (Ozcivici et al., 2010).
WHOLE-BODY VIBRATION: PHYSICAL STIMULUS FOR BONE
What is whole-body vibration?
Recently, whole-body vibration (WBV) has been advocated as an exercise modality for
improving muscle and bone strength (Prisby et al., 2008; Totosy de Zepetnek et al., 2009). WBV
involves a person standing on a ground-based platform which accelerates up-and-down in an
oscillating fashion, and in turn propagates mechanical signals from the plantar feet surface to
the weight-bearing muscles and bones. Both, frequency and magnitude of WBV determine its
intensity. Frequency is the speed at which the platform oscillates and is expressed in Hertz; 1 Hz
equals one oscillation per second. The magnitude or peak acceleration at which the WBV
platform moves up-and-down is expressed as acceleration due to Earth’s gravity; 1g equals 9.8
m·s-2 (Rauch et al., 2010). Generally, the higher the frequency and magnitude of WBV, the
faster and more pronounced is the body’s movement (Griffin, 1998; Griffin & Mills, 2002a;
Griffin & Mills, 2002b). Also, at a certain frequency range even small-magnitude WBV can
become amplified within the body. This phenomenon is known as resonance. The frequency at
which resonance occurs is called natural frequency, and it varies from one body segment to

37
another. For example, resonance of the whole body occurs at natural frequencies between 8 to
20Hz, while spine resonates at 3 to 5 Hz and fingers at 125 to 300 Hz (Miwa, 1988; Randall et
al., 1997). Further, radius was found to resonate between 70 to 110 Hz in older men and tibia
between 21 to 39 Hz in postmenopausal women (Bediz et al., 2010; Ozdurak et al., 2006).
Currently available WBV platforms have been commonly classified as low-magnitude or
high-magnitude (Rubin et al., 2004). Low-magnitude WBV platforms oscillate at <1g, while high-
magnitude WBV accelerates the body at ≥1g. Low-magnitude WBV was the primary focus of
experimental animal models which examined WBV effects on bone (Rubin et al., 2001a). In
clinical bone research, the most commonly examined low-magnitude WBV was at 0.3g and at
90 Hz or 30 Hz (e.g., Figure 6 shows Dynamic Motion Therapy 1000 by Juvent Medical Inc.)
(Gilsanz et al., 2006; Rubin et al., 2004; Ward et al., 2004). Investigations of high-magnitude
WBV initially focused on its effects on muscle strength and power, particularly in athletes (Rehn
et al., 2007). When osteogenic effects of high-magnitude WBV were examined, various
magnitudes above 1g were used at frequencies typically less than 30 Hz, although one
investigation used frequencies between 35 and 40 Hz (Verschueren et al., 2004). WBV
platforms have also been classified based on the direction of vibration plate movement as 1)
synchronous, due to vertical up-and-down movement, and 2) side-alternating, due to tilting up-
and-down movement (Rauch et al., 2010).

Figu
re 6
. Low
-mag
nitu
de w
hole
-bod
y vi
brat
ion
plat
form
: Dyn
amic
Mot
ion
Ther
apy
1000
™ (J
uven
t Med
ical
Inc.
)
Luba
Typewritten Text
38

39
How does whole-body vibration influence muscles and bones?
From a biomechanical standpoint, WBV accelerates the whole body and its segments
analogous to ground reaction forces leading to ground-based accelerations of the body during
weight-bearing activities, such as walking, running or jumping. As such, WBV may 1) directly
‘shake’ the bones and/or 2) activate the skeletal muscles, possibly via the stretch reflex, and
thus indirectly stimulate the bones (Cardinale & Lim, 2003; Judex & Rubin, 2010). It was
recently highlighted that although high-magnitude WBV may activate the skeletal muscles and
thus stimulate the bone, low-magnitude WBV probably causes direct ‘shaking’ and stimulation
of the bone, independent of skeletal muscle activation (Judex & Rubin, 2010). In older adults,
who experience age-related sarcopenia and decline in skeleton’s sensitivity to mechanical
signals, WBV is believed to harness mechanical stimulation within the bone that would
otherwise arise due to skeletal muscles contraction during activities of normal daily-living or
due to slow-twitch postural muscles contractions (Ozcivici et al., 2010). This harnessing of
mechanical stimulation of the bone in older adults could occur in various ways: 1) direct
stimulation or ‘shaking’ of the bones by WBV may mimic mechanical signals that would
otherwise arise from skeletal muscles activation, 2) skeletal muscles activation by the WBV may
introduce additional mechanical signals within the bone, and 3) increased muscle strength due
to skeletal muscles activation by WBV may expose bone to greater forces and thus introduce
greater stimulation of the bones during normal daily activities (Judex & Rubin, 2010).
How much the whole body and its parts become accelerated in response to WBV
depends on the transmission of vibration signal through the body, and is influenced by WBV
magnitude, frequency and resonance, soft tissue attenuation, joint angles, and muscle activity

40
(Kiiski et al., 2008; Rubin et al., 2003). Although transmission of the WBV signal through the
body is a complex phenomenon that depends on an interplay between many factors, several
generalizations can be made (Kiiski et al., 2008; Rubin et al., 2003). Compared to low-
magnitude WBV, high-magnitude vibration shakes the body parts more violently, and is thus
propagated more readily through the body (Kiiski et al., 2008; Rubin et al., 2003). Transmission
of WBV is also frequency-dependent, possibly due to resonance. For example, more than 100%
transmissibility of WBV signal was found at the hip at frequencies <20 Hz, but declined to 80%
at frequencies >25 Hz (Rubin et al., 2003). Finally, the further away the WBV signal has to travel
from its oscillating source, the more attenuated it becomes within the body (Kiiski et al., 2008).
One study found that WBV accelerations transmitted through the body were the least
attenuated at the ankle and the most at the spine, regardless of frequencies and magnitudes
used (Kiiski et al., 2008). Significant factors that are believed to dampen accelerations due to
WBV, include muscle activity, body fat and joint flexion, specially at the knees (Kiiski et al.,
2008; Rubin et al., 2003; Rubin et al., 2004).
Whole-body vibration and bone formation
Based on experimental findings of increased bone formation rate and other bone
benefits in early animal models’ of WBV (Garman et al., 2007; Judex et al., 2007; Oxlund et al.,
2003) and improvements in BMD in clinical studies’ of WBV (Gusi et al., 2006; Ruan et al., 2008;
Verschueren et al., 2004; Gilsanz et al., 2006; Ward et al., 2004), several physiological
mechanisms have been proposed to explain WBV effects on bone; however, the exact

41
mechanism has not yet been elucidated. Regardless of whether WBV causes direct ‘shaking’ of
the bones or activation of the skeletal muscles, mechanical signals arising from vibration within
the bone become somehow translated into cellular mechanisms leading to increased bone
formation. Since the magnitude of external loads due to WBV may not be high enough to cause
bone tissue microdamage, especially with low-magnitude WBV, microdamage repair leading to
increased bone formation probably does not occur (Judex & Rubin, 2010; Qin et al., 1998;
Wolff, 1986). Thus, bone fluid-flow changes in the canaliculi, resulting from the direct or
indirect shaking of the bones, may occur in response to WBV and cause anabolic bone changes,
via cellular mechanisms explained in the section above (You et al., 2001). Other physiological
mechanisms, such as increased oxygen consumption and blood flow and hormonal activation
may also influence bone changes in response to WBV (Cardinale & Lim, 2003; Cardinale et al.,
2007; Kvorning et al., 2006; Rittweger et al., 2000; Stewart et al., 2005).
Experimental models of whole-body vibration
As reviewed previously (Prisby et al., 2008), several experimental animal models, albeit
not all (Castillo et al., 2006; Rubinacci et al., 2008), found anabolic effects of WBV on bone.
Perhaps the most convincing evidence of WBV osteogenic effects was obtained by Rubin et al.
(2001a), who administered WBV in mature female sheep through their hind legs. After 12
months of low-magnitude WBV at 0.3g and 30 Hz for 20 minutes a day, a 30% increase in
trabecular vBMD and significant improvements in trabecular microarchitecture were observed

42
at the femur when compared to controls (Rubin et al., 2001a; Rubin et al., 2002b). However,
these osteogenic effects of WBV were observed at hind limbs (femur) and not front limbs
(radius), suggesting that the benefits may be limited to the weight-bearing bones in humans
(Rubin et al., 2002b). Positive effects of WBV on the skeleton were also found in growing mice
and rats (Garman et al., 2007; Ozcivici E et al., 2007; Rubin et al., 2001a; Xie et al., 2008), and
ovariectomized young and mature rats (Judex et al., 2007; Oxlund et al., 2003; Flieger et al.,
1998). WBV was found to counteract bone loss in ovariectomized rats while no effect was
found in SHAM-operated controls, indicating that more compromised skeleton may respond
more to WBV (Flieger et al., 1998). In adult mice, enhanced trabecular bone volume was found
in the proximal tibia but not at skeletal sites located further away from the origin of WBV
stimulus, such as vertebrae or femur (Christiansen & Silva, 2006). Bone parameters which were
found to significantly improve due to WBV in experimental animal models, included trabecular
bone volume (Christiansen & Silva, 2006; Judex et al., 2007), bone mass (Rubin et al., 2001a)
and bone formation rate (Garman et al., 2007; Judex et al., 2007; Oxlund et al., 2003).
Trabecular bone parameters were found to respond more to WBV than cortical (Rubin et al.,
2002b). Further, WBV at low magnitudes (0.1 to 0.6 g) and high frequencies (30-90Hz) was
primarily examined in experimental animal models (Prisby et al., 2008). One study in mice
observed greater enhancements in trabecular bone formation at 0.3g than 0.6g WBV at 45 Hz
(Garman et al., 2007), while another investigation in rats observed improvements in trabecular
microarchitecture in response to 90 Hz but not 45 Hz WBV at 0.15g (Judex et al., 2007). This

43
evidence suggests that WBV anabolic bone effects may be more frequency than magnitude-
dependent. Finally, Judex et al. observed significant bone anabolic effects of WBV only in a
subset of mice with specific genetic variations, suggesting that genes also play a role in
skeleton’s responsiveness to WBV (Judex et al., 2002).
Clinical studies of whole-body vibration
Clinical investigations of WBV effects on bone have been primarily conducted in
postmenopausal women (Gusi et al., 2006; Iwamoto et al., 2005; Ruan et al., 2008; Rubin et al.,
2004; Russo et al., 2003; Verschueren et al., 2004; von Stengel et al., 2010a), although other
clinical populations were also investigated (Davis et al., 2010; Gilsanz et al., 2006; Torvinen et
al., 2003; Ward et al., 2004). Postmenopausal women were probably more commonly
examined because, as discussed above, they are at increased risk of developing osteoporosis,
and would thus especially benefit from novel prevention strategy such as WBV. As well, WBV
was previously shown to increase muscle power, strength and balance in younger individuals
and postmenopausal women (Verschueren et al., 2004; Cardinale & Rittweger, 2006; Rehn et
al., 2007). As such, not only skeletal but also muscle and balance benefits were expected in
response to WBV in postmenopausal women, which may protect them better from sustaining a
fall-related fracture (Verschueren et al., 2004). Some trials of postmenopausal women found
improvements in BMD (Gusi et al., 2006; Ruan et al., 2008; Verschueren et al., 2004), while

44
others did not (Iwamoto et al., 2005; Rubin et al., 2004; Russo et al., 2003; von Stengel et al.,
2010a). Conclusions about the efficacy of WBV in reducing postmenopausal bone loss are
difficult to make, because prior trials utilized somewhat flawed study designs and
heterogeneous WBV regimens. For instance, calcium and vitamin D supplements were not
provided in many trials, sample sizes were small (n<100) and loss to follow-up was significant.
Low-magnitude and high-magnitude WBV were administered at various frequencies (12-90 Hz)
anywhere between 4 to 20 minutes per day and once a week to twice a day.
In addition to postmenopausal women, WBV effects on the bone have been examined
in various clinical populations, such as children and adolescents with low bone mass, healthy
young adults, and spinal cord injury patients (Davis et al., 2010; Gilsanz et al., 2006; Torvinen et
al., 2003; Ward et al., 2004). Significant effects of WBV on bone were observed in children and
adolescents with compromised bones (Gilsanz et al., 2006; Ward et al., 2004). For example,
compared to controls, an overall 18% improvement in vBMD was found in children with
disabling conditions who received WBV at 0.3g and 90 Hz for 6 months (10 minutes a day, 5
days a week), and this in spite of 44% adherence (Ward et al., 2004). Only one trial was
conducted in young adults showing no significant WBV effects (Torvinen et al., 2003), and
investigations in spinal cord injury patients are only beginning (Davis et al., 2010).

45
WHOLE-BODY VIBRATION SAFETY
Safety of WBV as an exercise and osteoporosis-prevention strategy requires some
attention. Although previous trials in postmenopausal women did not report serious or
frequent adverse events in response to 6 to 12 months of WBV (Gusi et al., 2006; Iwamoto et
al., 2005; Ruan et al., 2008; Rubin et al., 2004; Russo et al., 2003; Verschueren et al., 2004; von
Stengel et al., 2010a), prolonged exposures to WBV in occupational settings have been linked to
a variety of debilitating chronic conditions (Griffin, 1998; Randall et al., 1997). Vibration sources
in occupational settings such as construction, mining, and forestry include, driving in a vehicle
that causes vertical accelerations of the seated body, standing on a drilling platform or holding
a drill. Some deleterious effects of occupational vibration are believed to be caused by
resonance due to WBV in a seated position, generally at high magnitude (≥1g) and low
frequency (<20 Hz) (Griffin, 1998; Mansfield, 2005; Randall et al., 1997). Different body parts
were found to be sensitive to different resonance frequencies; for example, the standing body
was found to resonate at 8-20 Hz, while spinal column resonated at 3-5 Hz and stomach at 4-5
Hz (Randall et al., 1997). Common deleterious effects due to prolonged exposures to
occupational WBV in a seated position at high magnitude and low frequency (for example,
driving) include, motion sickness, gastric motility suppression, low-back and neck pain, and
spinal degeneration (Griffin, 1998; Mansfield, 2005; Ishitake et al., 1999). Interestingly, some of

46
the symptoms caused by prolonged exposures to occupational WBV are opposite to those
observed in response to WBV as an exercise-like modality. For example, improvements in
balance were observed in nursing home residents in response to WBV as an exercise-like
modality (Bruyere et al., 2005), while reductions in standing balance occurred to drivers
exposed to WBV while driving (Mani et al., 2010). Similarly, improvements in back pain were
found in postmenopausal women due to exercise-like WBV (Iwamoto et al., 2005), but chronic
back pain symptoms have been reported in drivers due to occupational WBV (Lings et al., 2000;
Pope et al., 1998).
Other injuries in the occupational settings involve local vibration of the feet, generally
due to standing on a drilling platform or sitting in a moving vehicle. Vibration-related symptoms
of the feet resemble those of a well-known vibration syndrome due to holding a drill, the hand-
and-arm vibration syndrome (HAVS), which involves vascular, neurological and musculoskeletal
damage leading to disorders such as Raynaud’s and vibration-white hand (Dong et al., 2001;
Friden, 2001). Vibration-white foot syndrome was also recently described in the medical
literature (Thompson et al., 2010; Dong et al., 2001; Friden, 2001). Hands were found to be
more deleteriously influenced by the vibration at high frequencies (hand: 30-40Hz; fingers: 125-
300 Hz) (Dong et al., 2001; Friden, 2001), and foot sensitivity to small-magnitude WBV was also
found to increase with increasing frequency (Miwa, 1988). However, resonance frequency
range for foot injuries due to WBV has not yet been established.

47
RATIONALE
Is there a role for WBV in the prevention of postmenopausal osteoporosis? A plethora
of WBV platforms exist, some advertised as osteoporosis prevention strategies while others as
exercise-like modalities (Power Plate, 2020; Juvent Inc, 2010). Hopeful claims have been made
in the newspapers, magazines and medical journals (Eisman, 2001; Harvard Health Publications,
2006; Skelly, 2007). As reviewed above, early experimental animal models showed relatively
consistent and significant improvements in various bone parameters due to WBV. Also, the
current understanding of how mechanical signals become translated to bone formation via
bone fluid-flow elegantly parallels a potential mechanism through which WBV could exert its
osteogenic effects. However, clinical research in postmenopausal women produced conflicting
results and contained several research gaps, thus requiring further investigations. This has left
clinicians and the general population wondering whether WBV can be used to improve skeletal
integrity in humans, and especially in postmenopausal women who are burdened by age-
related osteoporosis (Eisman, 2001; Harvard Health Publications, 2006; Skelly, 2007).
Many reviews have been written in an attempt to decipher the overall effect of WBV on
bone in postmenopausal women, however none were conducted systematically (Cardinale &
Rittweger, 2006; Ozcivici et al., 2010; Prisby et al., 2008; Rubin et al., 2006; Totosy de Zepetnek
et al., 2009). Further, previous RCTs have not yet been examined in a meta-analysis to estimate

48
the overall magnitude of WBV effect on bone. This is important, because the sample sizes of
previous trials were small (n<100), thus statistical power could be gained by combining them in
a meta-analysis. As well, because previous study designs were relatively flawed, more RCTs are
needed in postmenopausal women with methodological improvements.
Previous RCTs of WBV effects on bone in postmenopausal women primarily examined
aBMD measurements at central sites. Although central DXA measurements are more relevant
to postmenopausal osteoporosis management, the efficacy of WBV in this population is yet to
be determined. Peripheral sites are located closer to the origin of WBV and are thus expected
to receive a less attenuated WBV signal (Kiiski et al., 2008). Also, because trabecular bone is
more metabolically active than cortical bone, and was shown in experimental models to be
especially responsive to WBV (Rubin et al., 2002b), obtaining peripheral measurement of
trabecular bone is of particular interest. Thus, further assessment of trabecular vBMD at the
distal tibia using an HR-pQCT would be of great relevance to the study of WBV efficacy in
postmenopausal population. As well, WBV effects on calcaneal QUS parameters have not yet
been examined in any clinical populations or experimental animal models. Although calcaneal
QUS measurements have not been as widely used and recommended for monitoring therapy as
DXA and HR-pQCT (Krieg et al., 2008; Lewiecki et al., 2006), WBV presents a special clinical
situation where such measurements would be of special interest, because the vibration
stimulus enters the skeleton through the plantar feet surface, including the calcaneus.

49
To better elucidate the efficacy of WBV on postmenopausal skeleton, women with low
BMD should be examined. Early experimental models have shown that more compromised
bones may respond better to WBV (Flieger et al., 1998). However, since WBV is not yet
considered an appropriate treatment for osteoporosis, it should not be investigated in
osteoporotic populations unless they are also taking bone medications. Thus, a more
appropriate postmenopausal population for the study of WBV effects on bone would be
osteopenic women not on bone medications.
Finally, previous RCTs in postmenopausal women utilized various magnitudes and
frequencies of WBV, potentially contributing to conflicting findings. Since animal models
showed smaller importance of high-magnitude WBV and greater importance of a high-
frequency WBV, this should be also investigated in postmenopausal women (Garman et al.,
2007; Judex et al., 2007).
Thus, this thesis was proposed to first examine previous RCTs of WBV effects on bone in
postmenopausal women by conducting a systematic review and a meta-analysis. Second, a RCT
was conducted in osteopenic postmenopausal women to examine effects of low-magnitude
WBV at two different frequencies (90Hz and 30 Hz) on bone parameters assessed by DXA and
HR-pQCT, while improving on several methodological limitations of previous trials. Third,
calcaneal QUS parameters were also examined as secondary outcomes in this RCT.

50
OBJECTIVES AND HYPOTHESIS
The main objectives and this investigation were:
1. To perform a systematic review and meta-analysis of the existing RCTs to examine WBV
effects on BMD in postmenopausal women.
2. To conduct a RCT to examine bone changes (absolute, 12-month) assessed by bone
densitometry tools, DXA (aBMD at the femoral neck, total hip and lumbar spine) and HR-pQCT
(total, cortical and trabecular vBMD, cortical thickness, and trabecular microarchitecture at the
distal tibia and distal radius), in response to WBV in postmenopausal women.
3. To examine bone ultrasound properties (broadband attenuation and speed of sound), as
assessed by calcaneal QUS, as secondary outcomes in the aforementioned RCT.
The systematic evaluation was conducted here so that only trials which used a true
randomized controlled design were included, and so that methodological quality and study bias
were assessed. Children, adolescents and young adults were also included in the systematic
evaluation, so that WBV effects in postmenopausal women could be compared to those
occurring during other stages of the bone remodelling cycle. Meta-analysis was also conducted
as part of this systematic evaluation to estimate WBV effect magnitude.

51
The RCT conducted as part of this thesis was designed to improve on the following gaps and
methodological limitations observed in previous trials:
- Only postmenopausal women with osteopenia, as defined by WHO criteria, not on bone
medications were included. Strict inclusion and exclusion criteria were applied to
eliminate any potential effects of bone medications and secondary causes for
osteoporosis.
- A fuller assessment of bone changes in response to WBV was performed by non-
invasively obtaining more determinants of bone strength than in prior trials. The
following measurements were obtained: DXA aBMD at the femoral neck, total hip,
lumbar spine (aBMDf, aBMDh, aBMDs); HR-pQCT total, cortical, and trabecular vBMD
(vBMDtot, vBMDc, vBMDt), cortical thickness (CTh), and trabecular thickness,
separation, number and bone volume fracture (TTh, TSp, TN, BV/TV) at the distal tibia
and distal radius; and QUS broadband attenuation (BUA), speed of sound (SOS) and
quantitative ultrasound index (QUI, a composite score of BUA and SOS) at the calcaneus.
The primary outcome, specified a priori, was trabecular vBMD at the distal tibia.
- Adequate calcium and vitamin D supplements were provided, so that total daily intakes
from diet plus supplements were approximately 1200 mg and 1000 IU, respectively.
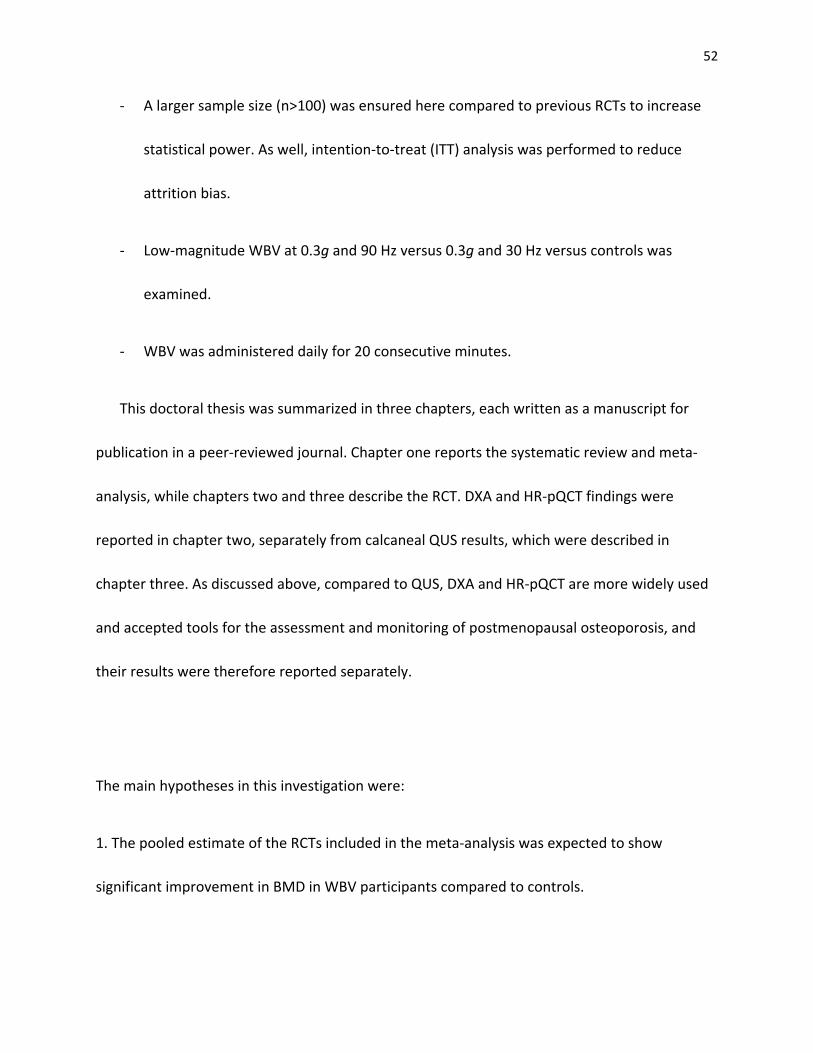
52
- A larger sample size (n>100) was ensured here compared to previous RCTs to increase
statistical power. As well, intention-to-treat (ITT) analysis was performed to reduce
attrition bias.
- Low-magnitude WBV at 0.3g and 90 Hz versus 0.3g and 30 Hz versus controls was
examined.
- WBV was administered daily for 20 consecutive minutes.
This doctoral thesis was summarized in three chapters, each written as a manuscript for
publication in a peer-reviewed journal. Chapter one reports the systematic review and meta-
analysis, while chapters two and three describe the RCT. DXA and HR-pQCT findings were
reported in chapter two, separately from calcaneal QUS results, which were described in
chapter three. As discussed above, compared to QUS, DXA and HR-pQCT are more widely used
and accepted tools for the assessment and monitoring of postmenopausal osteoporosis, and
their results were therefore reported separately.
The main hypotheses in this investigation were:
1. The pooled estimate of the RCTs included in the meta-analysis was expected to show
significant improvement in BMD in WBV participants compared to controls.

53
2. DXA and HR-pQCT parameters were expected to improve in WBV participants compared to
controls to indicate stronger bones. The greatest improvements were expected in trabecular
vBMD and structure measurements at the distal tibia. WBV at 90 Hz was expected to have
stronger effects than at 30 Hz.
3. Calcaneal QUS parameters were expected to improve in WBV participants compared to
controls to indicate stronger bones. WBV at 90 Hz was expected to have stronger effects than
at 30 Hz.

54
CHAPTER ONE: EFFECT OF WHOLE-BODY VIBRATION ON BONE MINERAL DENSITY: A
SYSTEMATIC REVIEW AND META-ANALYSIS.
Accepted for publication in a peer-reviewed journal:
Slatkovska L, Alibhai S, Beyene J, Cheung AM. Effect of whole-body vibration on bone mineral
density: a systematic review and meta-analysis. Osteoporosis International, 2010 (Epub ahead
of print)

55
ABSTRACT
Purpose: Animal experiments report anabolic bone changes in response to whole-body
vibration (WBV), but data in humans are limited. Our objective is to conduct a systematic
review and meta-analysis of RCTs examining WBV effect on bone mineral density (BMD).
Methods: Eligible RCTs included randomized or quasi-randomized trials, with follow-up
of ≥6 months, examining WBV effects on BMD in ambulatory individuals without secondary
causes of osteoporosis. The weighted mean differences between WBV and control groups in
absolute pre-post change in spine and hip areal BMD (aBMD), and in spine and tibia trabecular
volumetric BMD (vBMD) were calculated.
Results: Eight RCTs in postmenopausal women (5 RCTs), young adults (1 RCT), and
children and adolescents (2 RCTs) were included. The regimens were heterogeneous, study
durations were relatively short, and available data was mostly per-protocol. In postmenopausal
women, WBV was found to significantly increase hip aBMD (0.015 g·cm-2; 95% CI, 0.008-0.022;
n=131) versus controls, but not spine aBMD (n=181) or tibia trabecular vBMD (n=29). In
children and adolescents, WBV significantly increased spine (6.2 mg·cm-3; 95% CI, 2.5-10.0;
n=65) and tibia (14.2 mg·cm-3; 95% CI, 5.2-23.2; n=17) trabecular vBMD. In young adults, WBV
did not increase spine or hip bone mineral content, or tibia trabecular vBMD (n=53).

56
Conclusions: We found significant but small improvements in BMD in postmenopausal
women and children and adolescents, but not in young adults. WBV is a promising new
modality, but before recommendations can be made for clinical practice, large-scale long-term
studies are needed to determine optimal magnitude, frequency and duration.
Keywords: meta-analysis, whole-body vibration, bone mineral density, quantitative computed
tomography.

57
INTRODUCTION
Whole-body vibration (WBV) has received much attention as a potential anti-
osteoporotic intervention in recent years (Eisman, 2001; Rubin et al., 2006). In experimental
animal models, WBV was found to lead to anabolic bone changes (Flieger et al., 1998; Rubin et
al., 2001b; Rubinacci et al., 2008; Judex et al., 2003; Rubin et al., 2002a; Rubin et al., 2002b;
Judex et al., 2005; Xie et al., 2006; Christiansen & Silva, 2006). Based on these data and the
availability of many different WBV platforms in North America and Europe, optimistic claims
that these benefits may translate to humans have been made within the scientific community
(Rubin et al., 2001a) and in the media (Kolata, 2007). Such claims quickly proliferated to today’s
information-savvy general population (Wikimedia Foundation Inc, 2009), and has left many
clinicians and patients wondering about the role of WBV in osteoporosis prevention and/or
treatment.
The intervention involves an individual standing on a vibrating platform. Through
ground-based vertical accelerations starting at the plantar surface of the feet, the mechanical
vibration is transmitted through the weight-bearing muscles and bones (Kiiski et al., 2008;
Rubin et al., 2003). The intensity of WBV is defined by its frequency (Hertz) and magnitude,
where magnitude is expressed as peak acceleration (g; 1g=9.8 m/s2 acceleration due to gravity)
and/or vertical displacement (millimetres). A hypothesized mechanism through which WBV is

58
believed to exert its anabolic effects on the skeleton is via activation of the musculature which
results in mechanotransduction of vibration strains within the bone (Rubin et al., 2006; Fritton
et al., 2000). Another hypothesis is that these high frequencies but low magnitude WBV signals
become amplified within the bone tissue by stress-generated fluid flow, and thereby activate
bone cells which act as mechanosensors (Rubin et al., 2006; Fritton et al., 2000).
In spite of the plausible physiological mechanism and the promising results obtained in
experimental animal models, effects of WBV on the human skeleton remain uncertain.
Although different reviews have attempted to summarize the existing body of clinical evidence,
none of them have performed a systematic evaluation (Eisman, 2001; Prisby et al., 2008; Rubin
et al., 2006). Therefore, to more objectively advance our knowledge of the role of WBV in
clinical practice, we conducted a systematic review and a meta-analysis of WBV effect on bone
mineral density (BMD) in humans.
METHODS
We followed the procedures for conducting systematic reviews as defined by the
Cochrane Collaboration (Higgins & Green S, 2008), and reporting guidelines of the QUOROM
statement (Moher et al., 1999). Data sources, study selection, data extraction and quantitative
data synthesis were specified a priori. Study selection and data extraction were conducted

59
independently by two authors (LS and SMHA) using the same data forms, and disagreements
were resolved by consensus. Subgroup and sensitivity analyses were modified post hoc due to
the small number of eligible RCTs.
Data sources
One reviewer (LS) performed a search strategy, screened the titles and abstracts, and
identified references potentially appropriate for inclusion. With assistance from an experienced
research librarian, a broad search strategy was performed without language restriction, from
the earliest available date, using relevant electronic databases (MEDLINE, EMBASE, Cochrane,
CINAHL, SportsDiscus, ProQuest Dissertations, and Theses Canada Portal). The following
medical subject headings terms were used: (vibration, mechanical stress, physical stress,
physical activity, or weight-bearing) and (bone and bones, bone density, or muscles) and (clinical
trial, meta-analysis or multicenter study). Finally, we performed a hand search of bibliographies
of the publications that were retrieved. Unpublished trials were searched using clinical trials
registries (ClinicalTrials.gov and controlled-trials.com) and by enquiring experts in the area of
WBV.

60
Study selection
We included randomized and quasi-randomized trials examining the effects of WBV on
BMD in humans, with a minimum follow-up period of six months, as it takes 6 or more months
for BMD to show a significant response. Eligible study populations were not restricted based on
age, sex, race, or physical activity levels. Blinding of participants and study staff was not an
eligibility requirement. WBV therapy was defined as mechanical vibration, performed with a
straight body (standing or lying), with no restriction on the frequency (Hertz), amplitude
(millimetres), peak acceleration (gravitational constant, g), and cumulative dose (total number
of minutes per study duration; most WBV platforms have a sensory device that monitors the
adherence) of WBV. Localized mechanical vibration (for example, vibration pads) or ultrasound
and electrical stimuli were not recognized as WBV. Vibration signals that were not received
through a completely straight body (for example, sitting on a vibrating chair) were also
excluded. Acceptable control interventions types included no treatment, sham vibration
(audible sound with no mechanical vibration), and exercise interventions. Trials which included
participants with secondary causes of osteoporosis (for example, glucocorticoids therapy or
haemodialysis) or those with causes for non-ambulatory status (for example, paraplegics) were
also excluded. We also excluded RCTs in which participants were taking anti-osteoporotic
medications if they were not distributed equally between study-arms, but we included trials in
which anti-osteoporotic co-interventions were matched between trial arms. Finally, trials with
more than two study arms were included in the analysis without eliminating any of the arms;

61
relevant study arms were combined to create a single pair-wise comparison as recommended
in the Cochrane Handbook for Systematic Reviews of Interventions version 5.0.1 (Higgins &
Green S, 2008).
Data extraction
All data was extracted using standardized data collection forms (see the Technical
Appendix). The extracted data included any relevant information regarding the trials’
characteristics, BMD outcomes, and methodological quality. Per-protocol and not intention-to-
treat (ITT) data were preferentially extracted for primary analysis. We chose per-protocol over
ITT data because the majority of the included RCTs reported per-protocol and not ITT analysis.
Also, adherence to prescribed cumulative dose of WBV ranged considerably between the
included trials. Hence, using per-protocol data allowed us to minimize the clinical heterogeneity
between-trials, as well as enabled us to better examine the effectiveness of WBV due to higher
overall adherence. A major drawback of per-protocol analysis is that it produces attrition bias,
reduces the methodological quality of the results, and thus increases the type I error.
Data was extracted separately for postmenopausal women, young adults, and children
and adolescents, so that separate analyses can be performed for each population. Pooling
these populations would introduce unwanted clinical heterogeneity, because physiologically
different bone metabolic processes occur in these populations. In children and adolescents,

62
bone is being accrued and their BMD typically increases over time and in response to effective
therapies (Nelson et al., 2006). In young adults, BMD generally plateaus and would be expected
to also increase in response to effective interventions (Nelson et al., 2006). Finally,
postmenopausal women typically lose BMD over time, and would be expected to experience a
reduction in the decline of BMD in response an effective therapy (Reid, 2006).
Methodological quality was assessed in terms of the different components that make up
trial quality as opposed to using the currently available quality scales, due to the advantages
that this approach offers in comparison to the scale approach (Juni et al., 2001). As such, we
identified the presence of the following types of study bias via a standardized but not validated
checklist: selection bias (lack of true randomization and concealment of allocation),
performance bias (lack of matching based on relevant baseline characteristics), detection bias
(lack of blinding of outcome assessors), and/or attrition bias (lack of ITT data).
Sensitivity and subgroup analyses
Per-protocol data were replaced with ITT data for those trials that made both types of
data available, in order to examine whether the different analytic approach influenced our
primary results. The influence of methodological quality on the robustness of the results was
assessed by excluding trial(s) with the greatest number of biases. For the areal BMD (aBMD)

63
analysis of the hip, trials that obtained the femoral neck measurements were analyzed
separately from those that obtained the total hip measurements.
We performed separate subgroup analyses for each population type (postmenopausal
women, young adults, and children and adolescents). A priori specified sources of clinical
heterogeneity were analyzed in the following subgroup analyses: 1) control intervention type
(no treatment or sham vibration versus exercise interventions; excluded RCTs where bone
medications were used as a co-intervention), 2) magnitude of WBV (low magnitude [<1g]
versus high magnitude [≥1g]), and 3) actual cumulative dose of WBV (at or below median
versus above median).
Quantitative data synthesis
The effect measure was a weighted mean difference between the WBV and control
groups (WBV group minus control group) in absolute pre-post change in aBMD in the spine (L1-
L4 or L2-L4) and hip (femoral neck or total hip), as measured by DXA, and in the trabecular
volumetric BMD (vBMDt) in the spine (lumbar) and tibia (distal or proximal), as measured by
quantitative computed tomography (QCT). Values were considered statistically significant if
p≤0.05. Fixed effect models were reported, unless statistically significant heterogeneity was
found, in which case random effects models were used. The Cochrane Q test for heterogeneity
was performed and considered statistically significant if p≤0.10. Heterogeneity was also
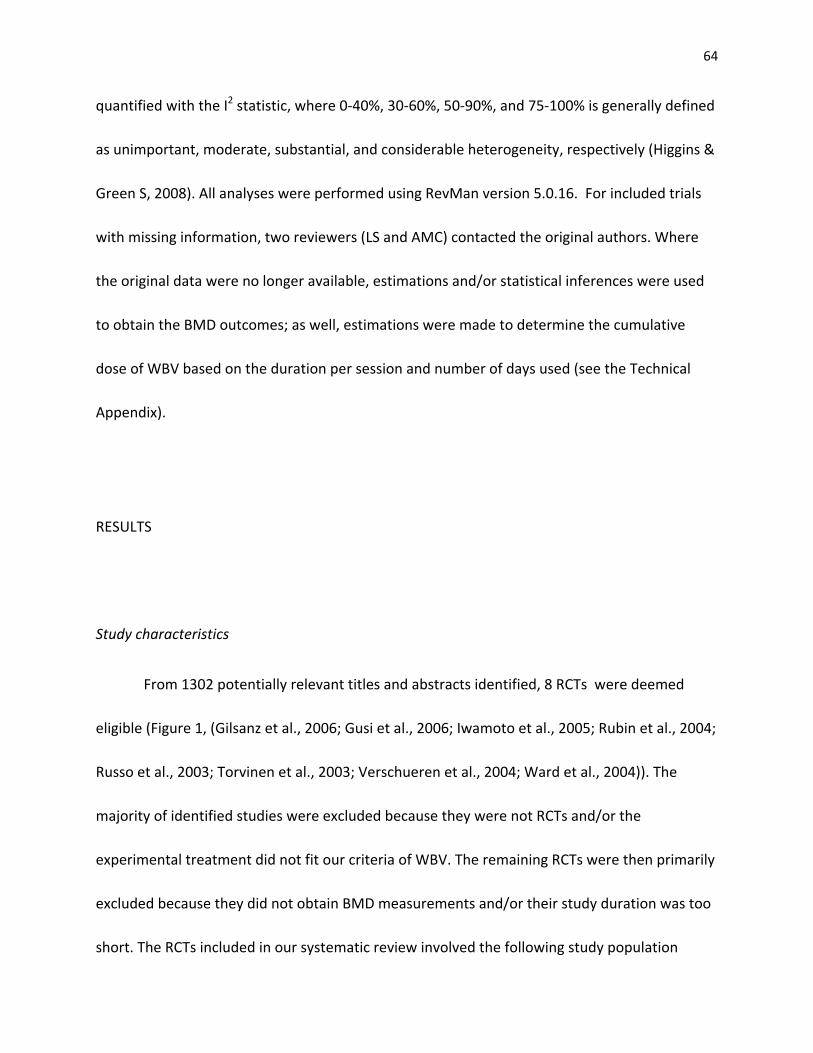
64
quantified with the I2 statistic, where 0-40%, 30-60%, 50-90%, and 75-100% is generally defined
as unimportant, moderate, substantial, and considerable heterogeneity, respectively (Higgins &
Green S, 2008). All analyses were performed using RevMan version 5.0.16. For included trials
with missing information, two reviewers (LS and AMC) contacted the original authors. Where
the original data were no longer available, estimations and/or statistical inferences were used
to obtain the BMD outcomes; as well, estimations were made to determine the cumulative
dose of WBV based on the duration per session and number of days used (see the Technical
Appendix).
RESULTS
Study characteristics
From 1302 potentially relevant titles and abstracts identified, 8 RCTs were deemed
eligible (Figure 1, (Gilsanz et al., 2006; Gusi et al., 2006; Iwamoto et al., 2005; Rubin et al., 2004;
Russo et al., 2003; Torvinen et al., 2003; Verschueren et al., 2004; Ward et al., 2004)). The
majority of identified studies were excluded because they were not RCTs and/or the
experimental treatment did not fit our criteria of WBV. The remaining RCTs were then primarily
excluded because they did not obtain BMD measurements and/or their study duration was too
short. The RCTs included in our systematic review involved the following study population

Figure 1. QUOROM flow diagram showing systematic literature search summary.
1302 Potentially Relevant References Identified and Screened for retrieval
163 Abstracts Retrieved for More Detailed Evaluation
1139 Excluded1139 Not whole-body vibration or not RCT
144 Excluded10 Double references
4 Not RCT8 No BMD measurement
49 Not whole-body vibration60 Not ≥ 6 months follow-up
2 Ineligible study population11 Incomplete/unpublished trial
8 RCTs Included in Primary Analyses2 Children/adolescents1 Young adults5 Postmenopausal women
19 Potentially Appropriate for Inclusion
11 Excluded6 Not RCTa
3 No BMD measurement1 Not whole-body vibration1 Ineligible study population
aOne study, “potentially appropriate for inclusion”, was later excluded because it was not a true RCT. This study examined postmenopausal Chinese women with osteoporosis who received either whole‐body vibration or no treatment (Ruan et al., 2008). After contacting the original authors, it was confirmed that the group allocation did not involve randomization or quasi‐randomization but instead it involved a convenience‐based assignment.
Luba
Typewritten Text
65

66
types: postmenopausal women (n=210, 5 RCTs, (Gusi et al., 2006; Iwamoto et al., 2005; Rubin
et al., 2004; Russo et al., 2003; Verschueren et al., 2004)), young adults (n=53, 1 RCT, (Torvinen
et al., 2003)), and children and adolescents (n=65, 2 RCTs, (Gilsanz et al., 2006; Ward et al.,
2004)). All included trials were of relatively short duration (6 to 12 months) and small sample
size (17 to 70 participants), and included at least one type of study bias (Table 1). The control
intervention types included no treatment, sham vibration, and exercise regimens. The WBV
regimens varied between the included trials in terms of the WBV frequency and magnitude,
and the cumulative dose (Table 1). Four studies ensured adequate calcium intake either
through diet (Torvinen et al., 2003; Iwamoto et al., 2005) or supplementation (Russo et al.,
2003; Gilsanz et al., 2006), but only one trial also ensured adequate vitamin D intake (Russo et
al., 2003). Two RCTs measured dietary calcium but not vitamin D intake at baseline, but did not
report whether the average intake was adequate and/or matched between the study groups
(Gusi et al., 2006; Rubin et al., 2004).
Postmenopausal women
There were five trials in postmenopausal women: four using high magnitude WBV (Gusi
et al., 2006; Russo et al., 2003) (Iwamoto et al., 2005; Verschueren et al., 2004) and one using
low magnitude WBV (Rubin et al., 2004). Study participants included women with osteopenia
and osteoporosis, aged 47-88 years, of Caucasian and Southeast Asian origin, and with low to

Table 1 Ch
aracteristics of RCT
s includ
ed in
the system
atic review
Source
No. of
participants
enrolled
No. of
participants
analyzed
Age (range,
years or
mean ± SD
)
Participants
Control
Interven
tion
Follow‐up
(mon
ths)
WBV
freq
uency
(Hertz)
WBV
magnitude
(g)
Prescribed
mean
cumulative
volume
(minutes)
Actual m
ean
cumulative
volume
(minutes)a
Calcium
requ
irem
ents
Vitamin D
requ
irem
ents
Stud
y bias
POSTMEN
OPA
USA
L WOMEN
Russo et al.,
2003
33
29
61
± 7
Health
y Europe
an
wom
en
No treatm
ent
6 12
‐28
≥
≥
≥
≥1
240
200
1000
mg
supp
lemen
t 0.25
µg
supp
lemen
t S, D, A
Verschue
ren et
al., 2004
89
70
58
‐74
Health
y Europe
an
wom
en
No treatm
ent
& re
sistance
training
6 35
‐40
1 1134
1021
Non
e Non
e S, A
Rubin et al.,
2004
70
33
47
‐64
Health
y North
American
wom
en
Sham
vibration
12
30
<1
7300
5840
Measured
intake
Non
e P, A
Iwam
oto et al.,
2005
50
50
55
‐88
Osteo
porotic
Japane
se
wom
en on
alen
dron
ate (5 m
g pe
r day)
No treatm
ent
12
201
208
208
>800mg
through diet
Non
e S
Gusi et a
l., 2006
36
28
66 ± 5
Health
y Europe
an
wom
en
Walking
8
12.6
≥1
549
494
Measured
intake
Measured
intake
S, P, A
YOUNG ADULTS
Torvinen
et a
l.,
2003
56
53
19
‐38
Health
y no
n‐athletic
Europe
an m
en and
wom
en
No treatm
ent
8 25
‐45
1 354
330
>800mg
through diet
Non
e S, A
CHILDRE
N/ADOLESCEN
TS
Ward et al.,
2004
20
17
4‐19
Ambu
latory North
American
boys and
girls with
limite
d mob
ility due
to
disabled
con
ditio
ns
Sham
vibration
6 90
<1
1300
568
Non
e Non
e P, A
Gilsanz et al.,
2006
48
48
15
‐20
Health
y North
American
Caucasian
girls with
low BMD
No treatm
ent
12
30
<1
3650
2124
500m
g supp
lemen
t Non
e S, A
WBV
, who
le‐bod
y vibration; SD, stand
ard de
viation; g, acceleration du
e to gravity; S, selectio
n bias; P, perform
ance bias; D, detectio
n bias; A
, attritio
n bias.
aActual cum
ulative do
se was derived
from
the mean pe
rcen
t adh
eren
ce and
the prescribed
cum
ulative do
se.
Luba
Typewritten Text
67

68
moderate physical activity levels (Table 1). Most participants did not take bone medication as a
co-intervention, except for one RCT in which 50 osteoporotic Japanese women received the
same alendronate treatment in both the WBV and the control arms (Iwamoto et al., 2005). In
another trial, 8 out of 29 women were on hormone replacement therapy and were matched
between the trial arms (Russo et al., 2003). Where two control arms were included
(Verschueren et al., 2004), we combined them in the primary analysis to create a single pair-
wise comparison (n=45) and then entered them separately in a subgroup analysis of the control
intervention type (no treatment: n=23; exercise: n=22). Four RCTs obtained spine aBMD
measurements (L1-L4, 2 RCTs, (Iwamoto et al., 2005; Verschueren et al., 2004); L2-L4, 2 RCTs,
(Gusi et al., 2006; Rubin et al., 2004)), three hip aBMD (femoral neck, 2 RCTs, (Gusi et al., 2006;
Rubin et al., 2004); total hip, 1 RCT, (Verschueren et al., 2004)) and one tibia vBMDt
measurements (Table 2, (Russo et al., 2003)).
The difference in the hip aBMD change between the WBV and control groups was
statistically significant (0.015 g·cm-2 [95% confidence interval (CI), 0.008 to 0.022] p<0.0001,
n=131; Figure 2). No significant effects of WBV on spine aBMD (-0.003 g·cm-2 [95% CI, -0.012-
0.005] p=0.44, n=181; Figure 2) and tibia vBMDt (-2.2 mg·cm-3 [95% CI, -10.0-5.7] p=0.58, n=29)
were found.
When we analyzed BMD outcomes according to ITT analysis, there was no effect of WBV
on hip aBMD (0.014 g·cm-2 [95% CI, -0.003-0.031] p=0.12, n=168; Figure 3), and spine aBMD

Table 2. Bon
e mineral den
sity data extracted for a
ll analyses
Source
Data type
available for
extractio
n
Stud
y grou
p No. participants
extracted
Absolute pre‐po
st change in BMD (m
ean ± SD
)
Hip aBM
D (g
∙cm
‐2)
Spine aB
MD (g
∙cm
‐2)
Tibia vBMDt (mg∙cm
‐3)
Spine vBMDt (mg∙cm
‐3)
POSTMEN
OPA
USA
L WOMEN
Ru
sso et al., 2003 [28]
Per‐protocol
Vibration
14
‐
‐
‐
3.5 ± 12.9
Control
15
1.3 ± 7.9
Verschue
ren et al., 200
4 [30]
Per‐protocol
Vibration
25
0.008 ± 0.01
6*‐0.003
± 0.019
Control
45
‐0.006
± 0.013
0.003 ± 0.02
0
Rubin et al., 2004 [27]
Per‐protocol Vibration
19‐0.002
± 0.048
‐0.004
± 0.057
Control
14‐0.009
± 0.029
‐0.008
± 0.029
(IT
T)
Vibration
(33)
(‐0.005 ± 0.048)
(‐0.005 ± 0.057)
Control
(37)
(‐0.002 ± 0.029)
(‐0.006 ± 0.029)
Iwam
oto et al., 2005 [26]
ITT
Vibration
250.051 ± 0.04
5
Control
250.042 ± 0.04
6
Gusi et a
l., 2006 [25]
Per‐protocol
Vibration
14
0.020 ± 0.04
8*‐0.010
± 0.057
Control
14‐0.020
± 0.029
‐0.010
± 0.029
YOUNG ADULTS
Torvinen
et a
l., 2003 [29]
Per‐protocol
Vibration
27
0.033 ± 0.21
9a0.454 ± 3.06
4a4.2 ± 8.3
Control
26
0.029 ± 0.24
0a0.026 ± 3.31
2a4.9 ± 10.1
CHILDRE
N/ADOLESCEN
TS
Ward et al., 2004 [31]
Per‐protocol
Vibration
8
8.5 ± 8.2*
5.5 ± 8.3
Control
9
5.7 ± 10.7
‐0.5 ± 8.3
Gilsanz et al., 2006 [24]
Per‐protocol Vibration
18
5.9 ± 7.2*
Control
30
‐0
.4 ± 7.4
(IT
T)
Vibration
(24)
(3.8 ± 7.7)
Control
(24)
(0.1 ± 7.7)
ITT, intention‐to‐treat; aBM
D, areal BMD; vBM
Dt, trabecular volum
etric BM
D; SD, stand
ard de
viation
a aBM
D change repo
rted
in bon
e mineral con
tent units (grams).
*Significant e
ffect o
f the
who
le‐bod
y vibration grou
p compared to th
e control group
, as repo
rted
in th
e original pub
lication.
Note: Brackets indicate intention‐to‐treat data that was used as part o
f the
sen
sitiv
ity analysis on
ly.
Luba
Typewritten Text
69

Figure 2. P
rimary analyses of w
hole‐bod
y vibration effect on bo
ne m
ineral den
sity in
postm
enop
ausal w
omen
. a)H
ip areal bon
e mineral den
sity (g
∙cm
‐2); b) Spine
areal bon
e mineral den
sity (g
∙cm
‐2).
Stud
y or
Sub
grou
pV
ersc
huer
enR
ubin
Iwam
oto
Gus
i
Tota
l (95
% C
I)H
eter
ogen
eity
: Chi
² = 1
.49,
df =
3 (P
= 0
.68)
; I² =
0%
Test
for o
vera
ll ef
fect
: Z =
0.7
8 (P
= 0
.44)
Mea
n-0
.003
-0.0
040.
051
-0.0
1
SD0.
019
0.05
70.
045
0.05
7
Tota
l25 19 25 14 83
Mea
n0.
003
-0.0
080.
042
-0.0
1
SD 0.02
0.02
90.
046
0.02
9
Tota
l45 14 25 14 98
Wei
ght
75.7
%7.
6%10
.7%
6.0%
100.
0%
IV, F
ixed
, 95%
CI
-0.0
1 [-0
.02,
0.0
0]0.
00 [-
0.03
, 0.0
3]0.
01 [-
0.02
, 0.0
3]0.
00 [-
0.03
, 0.0
3]
-0.0
0 [-0
.01,
0.0
0]
Year
2004
2004
2005
2006
Vibr
atio
nC
ontr
olM
ean
Diff
eren
ceM
ean
Diff
eren
ceIV
, Fix
ed, 9
5% C
I
-0.1
-0.0
50
0.05
0.1
Favo
urs
cont
rol
Favo
urs
vibr
atio
n
b
Stud
y or
Sub
grou
pVe
rsch
uere
nRu
bin
Gus
i
Tota
l (95
% C
I)He
tero
gene
ity: C
hi² =
3.2
1, d
f = 2
(P =
0.2
0); I
² = 3
8%Te
st fo
r ove
rall e
ffect
: Z =
4.2
7 (P
< 0
.000
1)
Mea
n0.
008
-0.0
020.
02
SD0.
016
0.04
80.
048
Tota
l25 19 14 58
Mea
n-0
.006
-0.0
09-0
.02
SD0.
013
0.02
90.
029
Tota
l45 14 14 73
Wei
ght
87.8
%6.
8%5.
5%
100.
0%
IV, F
ixed
, 95%
CI
0.01
[0.0
1, 0
.02]
0.01
[-0.
02, 0
.03]
0.04
[0.0
1, 0
.07]
0.01
[0.0
1, 0
.02]
Year
2004
2004
2006
Vibr
atio
nCo
ntro
lM
ean
Diffe
renc
eM
ean
Diffe
renc
eIV
, Fix
ed, 9
5% C
I
-0.1
-0.0
50
0.05
0.1
Favo
urs
cont
rol
Favo
urs
vibra
tion
a
Forest plots sho
w th
e weighted mean differen
ce between the who
le‐bod
y vibration and the control group
s in absolute pre‐po
st change. Squ
ares and
diamon
ds
represen
t the
effect sizes fo
r each trial and
for all tria
ls, respe
ctively. Lines crossing the squares represen
t con
fiden
ce intervals. W
hen the line crossing
the square doe
s no
t tou
ch th
e middle vertical line
, the
trial results are statistically significant. W
hen the black diam
ond do
es not to
uch the middle vertical line
, the
poo
led results are
statistically significant. Tria
ls were listed by year o
f pub
lication startin
g with
the earliest trial. Note: The
RevMan
5.0.16 software repo
rted
all bo
ne m
ineral den
sitie
sin
term
s of tw
o de
cimal places in th
e forest plots. In the text and
tables, areal bon
e mineral den
sitie
s and trabecular volum
etric bo
ne m
ineral den
sitie
s are repo
rted
in
term
s of th
ree and on
e de
cimal place(s), respectively.
Luba
Typewritten Text
70

Stud
y or
Sub
grou
pVe
rsch
uere
nRu
bin
Gus
i
Tota
l (95
% C
I)He
tero
gene
ity: T
au² =
0.0
0; C
hi² =
6.0
8, d
f = 2
(P =
0.0
5); I
² = 6
7%Te
st fo
r ove
rall e
ffect
: Z =
1.5
7 (P
= 0
.12)
Mea
n0.
008
-0.0
050.
02
SD0.
016
0.04
80.
048
Tota
l25 33 14 72
Mea
n-0
.006
-0.0
02-0
.02
SD0.
013
0.02
90.
029
Tota
l45 37 14 96
Wei
ght
47.0
%32
.1%
20.9
%
100.
0%
IV, R
ando
m, 9
5% C
I0.
01 [0
.01,
0.0
2]-0
.00
[-0.0
2, 0
.02]
0.04
[0.0
1, 0
.07]
0.01
[-0.
00, 0
.03]
Year
2004
2004
2006
Vibr
atio
nCo
ntro
lM
ean
Diffe
renc
eM
ean
Diffe
renc
eIV
, Ran
dom
, 95%
CI
-0.1
-0.0
50
0.05
0.1
Favo
urs
cont
rol
Favo
urs
vibra
tion
Stud
y or
Sub
grou
pV
ersc
huer
enR
ubin
Iwam
oto
Gus
i
Tota
l (95
% C
I)H
eter
ogen
eity
: Chi
² = 1
.42,
df =
3 (P
= 0
.70)
; I² =
0%
Test
for o
vera
ll ef
fect
: Z =
0.7
9 (P
= 0
.43)
Mea
n-0
.003
-0.0
050.
051
-0.0
1
SD0.
019
0.05
70.
045
0.05
7
Tota
l25 33 25 14 97
Mea
n0.
003
-0.0
060.
042
-0.0
1
SD 0.02
0.02
90.
046
0.02
9
Tota
l45 37 25 14 121
Wei
ght
70.8
%13
.6%
10.0
%5.
7%
100.
0%
IV, F
ixed
, 95%
CI
-0.0
1 [-0
.02,
0.0
0]0.
00 [-
0.02
, 0.0
2]0.
01 [-
0.02
, 0.0
3]0.
00 [-
0.03
, 0.0
3]
-0.0
0 [-0
.01,
0.0
0]
Year
2004
2004
2005
2006
Vibr
atio
nC
ontr
olM
ean
Diff
eren
ceM
ean
Diff
eren
ceIV
, Fix
ed, 9
5% C
I
-0.1
-0.0
50
0.05
0.1
Favo
urs
cont
rol
Favo
urs
vibr
atio
n
baFigure 3.Sen
sitiv
ity analyses of who
le‐bod
y vibration effect on bo
ne m
ineral den
sity in
postm
enop
ausal w
omen
. a) H
ip areal bon
e mineral den
sity (g
∙cm
‐2) –
intention‐to‐treat data includ
ed; b) Spine
areal bon
e mineral den
sity (g
∙cm
‐2) –
intention‐to‐treat data
includ
ed; c) Hip areal bon
e mineral den
sity (g
∙cm
‐2) –
trial w
ith largest n
umbe
r of bias exclud
ed; d
) Spine
areal bon
e mineral den
sity
(g∙cm
‐2) –
trial w
ith largest n
umbe
r of bias exclud
ed.
Luba
Typewritten Text
71

Stud
y or
Sub
grou
pVe
rsch
uere
nRu
bin
Iwam
oto
Tota
l (95
% C
I)He
tero
gene
ity: C
hi² =
1.4
5, d
f = 2
(P =
0.4
8); I
² = 0
%Te
st fo
r ove
rall e
ffect
: Z =
0.8
0 (P
= 0
.42)
Mea
n-0
.003
-0.0
040.
051
SD0.
019
0.05
70.
045
Tota
l25 19 25 69
Mea
n0.
003
-0.0
080.
042
SD 0.02
0.02
90.
046
Tota
l45 14 25 84
Wei
ght
80.5
%8.
1%11
.3%
100.
0%
IV, F
ixed
, 95%
CI
-0.0
1 [-0
.02,
0.0
0]0.
00 [-
0.03
, 0.0
3]0.
01 [-
0.02
, 0.0
3]
-0.0
0 [-0
.01,
0.0
1]
Year
2004
2004
2005
Expe
rimen
tal
Cont
rol
Mea
n Di
ffere
nce
Mea
n Di
ffere
nce
IV, F
ixed
, 95%
CI
-0.1
-0.0
50
0.05
0.1
Favo
urs
expe
rimen
tal
Favo
urs
cont
rol
dStud
y or
Sub
grou
pVe
rsch
uere
nRu
bin
Tota
l (95
% C
I)He
tero
gene
ity: C
hi² =
0.2
5, d
f = 1
(P =
0.6
2); I
² = 0
%Te
st fo
r ove
rall e
ffect
: Z =
3.7
4 (P
= 0
.000
2)
Mea
n0.
008
-0.0
02
SD0.
016
0.04
8
Tota
l25 19 44
Mea
n-0
.006
-0.0
09
SD0.
013
0.02
9
Tota
l45 14 59
Wei
ght
92.8
%7.
2%
100.
0%
IV, F
ixed
, 95%
CI
0.01
[0.0
1, 0
.02]
0.01
[-0.
02, 0
.03]
0.01
[0.0
1, 0
.02]
Vibr
atio
nCo
ntro
lM
ean
Diffe
renc
eM
ean
Diffe
renc
eIV
, Fix
ed, 9
5% C
I
-0.1
-0.0
50
0.05
0.1
Favo
urs
cont
rol
Favo
urs
vibra
tion
c Forest plots sho
w th
e weighted mean differen
ce between the who
le‐bod
y vibration and the control group
s in absolute pre‐po
st change. Squ
ares and
diam
onds rep
resent th
e effect sizes fo
r each trial and
for a
ll trials, respe
ctively. Lines crossing the squares represen
t con
fiden
ce intervals. W
hen the line
crossing
the square doe
s no
t tou
ch th
e middle vertical line
, the
trial results are statistically significant. W
hen the black diam
ond do
es not to
uch the middle
vertical line
, the
poo
led results are statistically significant.Trials were listed by year o
f pub
lication startin
g with
the earliest trial. Note: The
RevMan
5.0.16
software repo
rted
all bo
ne m
ineral den
sitie
sin te
rms of tw
o de
cimal places in th
e forest plots. In the textand tables, areal bon
e mineral den
sitie
s and
trabecular volum
etric
bon
e mineral den
sitie
s are repo
rted
in te
rms of th
ree and on
e de
cimal place(s), respectively.
Luba
Typewritten Text
72

73
(-0.003 g·cm-2 [95% CI, -0.011-0.005] p=0.43, n=218; Figure 3). When we excluded the lowest
quality trial (Gusi et al., 2006), our results remained the same as in the primary analysis
(Difference in hip aBMD: 0.014 g·cm-2 [95% CI, 0.006-0.021] p=0.0002, n=103; Difference in
spine aBMD: -0.003 g·cm-2 [95% CI, -0.012-0.005] p=0.42, n=153; Figure 3). Finally, after
separating the hip aBMD measurements into total hip (1 RCT, (Verschueren et al., 2004)) and
femoral neck (2 RCTs, (Gusi et al., 2006; Rubin et al., 2004)), the results remained significant for
the total hip (0.014 g·cm-2 [95% CI, 0.007-0.021] p=0.0002, n=70) but not for the femoral neck
(0.023 g·cm-2 [95% CI, -0.009-0.055] p=0.17, n=61).
In all subgroup analyses of spine aBMD, our results remained non-significant. In a
subgroup analysis of hip aBMD based on different control intervention types, results remained
statistically significant when WBV was compared to no treatment or sham vibration (0.013
g·cm-2 [95% CI, 0.005-0.021] p=0.001, n=81; Figure 4), but became non-significant when WBV
was compared to exercise interventions (0.023 g·cm-2 [95% CI, -0.003-0.048] p=0.08, n=75;
Figure 4). Hip aBMD subgroup analyses of the magnitude and actual cumulative dose involved
the same division of trials. The aBMD results were neither significant for RCTs examining WBV
at ≥1g magnitude and at or below median cumulative dose (0.023 g·cm-2 [95% CI, -0.001-0.047]
p=0.06, n=98; Figure 4), nor for a trial examining WBV at <1g magnitude and above median
cumulative dose (0.007 g·cm-2 [95% CI, -0.019-0.033] p=0.60, n=33; Figure 4).

Stud
y or
Sub
grou
pVe
rsch
uere
nRu
bin
Tota
l (95
% C
I)He
tero
gene
ity: C
hi² =
0.2
4, d
f = 1
(P =
0.6
2); I
² = 0
%Te
st fo
r ove
rall e
ffect
: Z =
3.2
4 (P
= 0
.001
)
Mea
n0.
008
-0.0
02
SD0.
016
0.04
8
Tota
l25 19 44
Mea
n-0
.006
-0.0
09
SD0.
014
0.02
9
Tota
l23 14 37
Wei
ght
90.6
%9.
4%
100.
0%
IV, F
ixed
, 95%
CI
0.01
[0.0
1, 0
.02]
0.01
[-0.
02, 0
.03]
0.01
[0.0
1, 0
.02]
Vibr
atio
nCo
ntro
lM
ean
Diffe
renc
eM
ean
Diffe
renc
eIV
, Fix
ed, 9
5% C
I
-0.1
-0.0
50
0.05
0.1
Favo
urs
cont
rol
Favo
urs
vibra
tion
aFigure 4.Subgroup
analyses of who
le‐bod
y vibration effect on hip areal bon
e mineral den
sity (g∙cm
‐2) in po
stmen
opausal w
omen
. a) Sham who
le‐bod
y vibration or no treatm
ent con
trol group
s with
out b
one med
ications used as a co‐interven
tion; b) Exercise
interven
tion control group
s; c) High magnitude
and
at/be
low m
edian cumulative do
se of w
hole‐bod
y vibration; d) Low
magnitude
and
abo
ve m
edian cumulative do
se of w
hole‐bod
y vibration.
Stud
y or S
ubgr
oup
Versc
huer
enGu
si
Total
(95%
CI)
Heter
ogen
eity:
Tau²
= 0.
00; C
hi² =
3.02
, df =
1 (P
= 0.
08);
I² =
67%
Test
for ov
erall
effec
t: Z =
1.75
(P =
0.08
)
Mean
0.008 0.0
2
SD0.0
160.0
48
Total 25 14 39
Mean
-0.00
5-0
.02
SD0.0
120.0
29
Total 22 14 36
Weig
ht64
.3%35
.7%
100.0
%
IV, R
ando
m, 9
5% C
I0.0
1 [0.0
0, 0.0
2]0.0
4 [0.0
1, 0.0
7]
0.02 [
-0.00
, 0.05
]
Year
2004
2006
Vibr
ation
Cont
rol
Mean
Diff
eren
ceMe
an D
iffer
ence
IV, R
ando
m, 95
% CI
-0.1
-0.05
00.0
50.1
Favo
urs c
ontro
lFa
vour
s vibr
ation
b
Luba
Typewritten Text
74
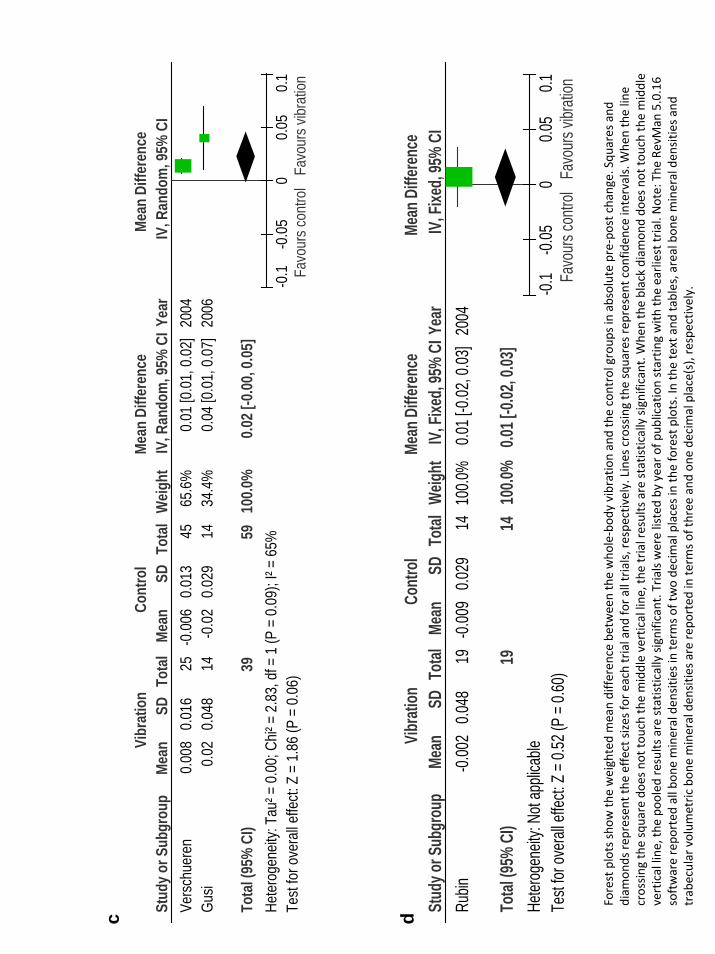
c Stud
y or S
ubgr
oup
Vers
chue
ren
Gusi
Tota
l (95
% C
I)He
tero
gene
ity: T
au² =
0.0
0; C
hi² =
2.8
3, d
f = 1
(P =
0.0
9); I
² = 6
5%Te
st fo
r ove
rall e
ffect:
Z =
1.8
6 (P
= 0
.06)
Mean
0.00
80.
02
SD0.
016
0.04
8
Tota
l25 14 39
Mean
-0.0
06-0
.02
SD0.
013
0.02
9
Tota
l45 14 59
Weig
ht65
.6%
34.4
%
100.0
%
IV, R
ando
m, 9
5% C
I0.
01 [0
.01,
0.0
2]0.
04 [0
.01,
0.0
7]
0.02 [
-0.00
, 0.05
]
Year
2004
2006
Vibr
atio
nCo
ntro
lMe
an D
iffer
ence
Mean
Diff
eren
ceIV
, Ran
dom
, 95%
CI
-0.1
-0.0
50
0.05
0.1
Favo
urs c
ontro
lFa
vour
s vibr
ation
Stud
y or S
ubgr
oup
Rubin
Total
(95%
CI)
Heter
ogen
eity:
Not a
pplic
able
Test
for ov
erall e
ffect:
Z = 0
.52 (P
= 0.6
0)
Mean
-0.00
2SD
0.048
Total 19 19
Mean
-0.00
9SD
0.029
Total 14 14
Weig
ht10
0.0%
100.0
%
IV, Fi
xed,
95%
CI0.0
1 [-0.
02, 0
.03]
0.01 [
-0.02
, 0.03
]
Year
2004
Vibrat
ionCo
ntrol
Mean
Diffe
rence
Mean
Diffe
rence
IV, Fi
xed,
95%
CI
-0.1
-0.05
00.0
50.1
Favo
urs co
ntrol
Favo
urs vi
bratio
n
d
Forest plots sho
w th
e weighted mean differen
ce between the who
le‐bod
y vibration and the control group
s in absolute pre‐po
st change. Squ
ares and
diam
onds rep
resent th
e effect sizes fo
r each trial and
for a
ll trials, respe
ctively. Lines crossing the squares represen
t con
fiden
ce intervals. W
hen the line
crossing
the square doe
s no
t tou
ch th
e middle vertical line
, the
trial results are statistically significant. W
hen the black diam
ond do
es not to
uch the middle
vertical line
, the
poo
led results are statistically significant.Trials were listed by year o
f pub
lication startin
g with
the earliest trial. Note: The
RevMan
5.0.16
software repo
rted
all bo
ne m
ineral den
sitie
sin te
rms of tw
o de
cimal places in th
e forest plots. In the textand tables, areal bon
e mineral den
sitie
s and
trabecular volum
etric
bon
e mineral den
sitie
s are repo
rted
in te
rms of th
ree and on
e de
cimal place(s), respectively.
Luba
Typewritten Text
75

76
Children and adolescents
There were two trials in children and adolescents (Gilsanz et al., 2006),(Ward et al.,
2004) . Both used low magnitude WBV. Study participants included ambulatory boys and girls
aged 4 to 20 years with limited mobility due to disabled conditions (Ward et al., 2004), and
healthy girls aged 15 to 20 years with low BMD and a history of at least one fracture ((Gilsanz et
al., 2006), Table 1). As part of their per-protocol analysis, one trial (Gilsanz et al., 2006)
excluded the lowest adherence quartile of WBV participants (n=6) from the WBV vibration
group (n=18) and included it in the control group (n=30). A significant difference in the tibia
vBMDt was observed between the control and WBV groups (14.2 mg·cm-3 [95% CI, 5.2-23.2]
p=0.002, n=17) in one RCT (Ward et al., 2004). A significant difference in the spine vBMDt (L2,
(Ward et al., 2004) and L1-L3, (Gilsanz et al., 2006)) was also found (6.2 mg·cm-3 [95% CI, 2.5-
10.0] p=0.001, n=65; Figure 5). In addition to per-protocol data, one trial also reported the ITT
data which involved the original allocation of WBV (n=24) and control (n=24) participants in
their respective arms (Gilsanz et al., 2006). This allowed us to perform a sensitivity analysis of
the influence of different analytical approaches, in which the spine vBMDt results remained
significant (4.2 mg·cm-3 [95% CI, 0.4-8.1] p=0.03, n=65; Figure 5). No additional sensitivity
analyses were performed, because the methodological quality was similar and no hip aBMD
outcomes were reported in the two included RCTs. Finally, no subgroup analyses were
performed due to insufficient number of eligible trials.

Stud
y or
Sub
grou
pW
ard
Gils
anz
Tota
l (95
% C
I)He
tero
gene
ity: C
hi² =
0.0
0, d
f = 1
(P =
0.9
5); I
² = 0
%Te
st fo
r ove
rall e
ffect:
Z =
3.2
6 (P
= 0
.001
)
Mea
n 5.5
5.9
SD 8.3
7.2
Tota
l 8 18 26
Mea
n-0
.5-0
.4
SD 8.3
7.4
Tota
l 9 30 39
Wei
ght
22.4
%77
.6%
100.
0%
IV, F
ixed
, 95%
CI
6.00
[-1.
90, 1
3.90
]6.
30 [2
.05,
10.
55]
6.23
[2.4
9, 9
.98]
Year
2004
2006
Vibr
atio
nCo
ntro
lM
ean
Diffe
renc
eM
ean
Diffe
renc
eIV
, Fix
ed, 9
5% C
I
-20
-10
010
20Fa
vour
s con
trol
Favo
urs
vibra
tion
a
Stud
y or
Sub
grou
pW
ard
Gils
anz
Tota
l (95
% C
I)He
tero
gene
ity: C
hi² =
0.2
5, d
f = 1
(P =
0.6
2); I
² = 0
%Te
st fo
r ove
rall e
ffect:
Z =
2.1
8 (P
= 0
.03)
Mea
n 5.5
3.8
SD 8.3
7.7
Tota
l 8 24 32
Mea
n-0
.5 0.1
SD 8.3
7.7
Tota
l 9 24 33
Wei
ght
23.3
%76
.7%
100.
0%
IV, F
ixed
, 95%
CI
6.00
[-1.
90, 1
3.90
]3.
70 [-
0.66
, 8.0
6]
4.24
[0.4
2, 8
.05]
Year
2004
2006
Vibr
atio
nCo
ntro
lM
ean
Diffe
renc
eM
ean
Diffe
renc
eIV
, Fix
ed, 9
5% C
I
-20
-10
010
20Fa
vour
s con
trol
Favo
urs
vibra
tion
bFig. 5Prim
ary (a) and
sen
sitivity
(b) analyses of who
le‐bod
y vibration effect on the spine trabecular volum
etric bo
ne m
ineral
density
(mg∙cm
‐3) in children and adolescents.
Forest plots sho
w th
e weighted mean differen
ce between the who
le‐bod
y vibration and the control group
s in absolute pre‐po
st change. Squ
ares and
diam
onds rep
resent th
e effect sizes fo
r each trial and
for a
ll trials, respe
ctively. Lines crossing the squares represen
t con
fiden
ce intervals. W
hen the line
crossing
the square doe
s no
t tou
ch th
e middle vertical line
, the
trial results are statistically significant. W
hen the black diam
ond do
es not to
uch the middle
vertical line
, the
poo
led results are statistically significant.Trials were listed by year o
f pub
lication startin
g with
the earliest trial. Note: The
RevMan
5.0.16
software repo
rted
all bo
ne m
ineral den
sitie
sin te
rms of tw
o de
cimal places in th
e forest plots. In the textand tables, areal bon
e mineral den
sitie
s and
trabecular volum
etric
bon
e mineral den
sitie
s are repo
rted
in te
rms of th
ree and on
e de
cimal place(s), respectively.
Luba
Typewritten Text
77

78
Young adults
There is only one trial using high magnitude WBV in young adults (Torvinen et al., 2003).
Study participants were healthy, non-athletic European men and women aged 19 to 38 (Table
1). Bone mineral content (BMC, in grams) versus aBMD was reported in one eligible trial, and
aBMD was not available to the original authors (Torvinen et al., 2003). However, since bone size
would not be expected to change in a young adult population over the study duration of 8
months, BMC changes were included in our analysis to approximate aBMD changes (Table 2).
No significant between-group differences in the change in L2-L4 BMC (0.428 g [95% CI, -1.291-
2.147], p=0.63, n=53), femoral neck BMC (0.004 g [95% CI, -0.120-0.128] p=0.95, n=53), and
tibia vBMDt (-0.7 mg·cm-3 [95% CI, -5.7-4.3] p=0.78, n=53) were observed (Torvinen et al.,
2003). No subgroup or sensitivity analyses were performed due to insufficient number of
eligible trials.
Adverse events
Only one included RCT, examining postmenopausal women, reported non-serious
adverse events (AEs) that were possibly caused or exacerbated by WBV (Russo et al., 2003).
Lower leg itching and erythema was reported in 6 of 17 participants receiving high-magnitude
WBV, which disappeared after the first three vibration sessions (Russo et al., 2003). Possible
knee pain exacerbation was also reported in two overweight WBV participants with pre-existing

79
knee osteoarthritis, which subsided after a few days of rest (Russo et al., 2003). Based on an 8-
month follow-up MRI examination, the trial which examined young adults did not observe any
changes in the articular cartilage or bone tissue of the ankle joint (Torvinen et al., 2003). The
remaining trials did not report AEs that could be possibly related to WBV use (Verschueren et
al., 2004; Gusi et al., 2006; Iwamoto et al., 2005; Rubin et al., 2004; Torvinen et al., 2003;
Gilsanz et al., 2006; Ward et al., 2004). Positive health-related outcomes were reported in one
trial which examined 50 Japanese postmenopausal, osteoporotic women receiving alendronate
therapy (Iwamoto et al., 2005). As part of the trial’s inclusion criteria, all of the included
participants were experiencing chronic low back pain at baseline, as evaluated by face scale
score (Iwamoto et al., 2005). After 12 months of high-magnitude WBV, most of the treatment-
arm participants “felt refreshed in the leg and back muscles” immediately after the vibration
session. Further, the chronic back pain of the WBV participants was significantly less when
compared to the controls (Iwamoto et al., 2005).
COMMENT
Our systematic evaluation of WBV found statistically significant improvement in hip
aBMD in postmenopausal women and in spine and tibia vBMDt in children and adolescents. No
significant effects were found on spine aBMD and tibia vBMDt in postmenopausal women, and

80
on BMC and vBMDt in young adults. Although statistically significant, the effect size in
postmenopausal women was small. The between-group difference in the hip aBMD change of
0.015 g·cm-2 is comparable to the effect size expected in response to adequate calcium and
vitamin D supplementation (Tang et al., 2007). Further, this magnitude is approximately one
half of the least significant change (LSC) in hip aBMD as detectable by current DXA instruments
in the clinical settings (Bonnick, 2004).
Compared to postmenopausal women, the effect size observed in children and
adolescents was greater. The magnitude of the effect for vBMDt in children and adolescents
was 14.2 mg·cm-3 in the tibia and 6.2 mg·cm-3 in the spine. An RCT examining the effect of
adequate calcium supplementation in normal children found a between-group difference of
approximately 6.0 mg·cm-3 in the tibia vBMDt (Ward et al., 2007). This comparably larger effect
size existed even though children and adolescents were relatively less adherent to WBV than
the other two populations (Table 1). Therefore, it would seem that a growing skeleton in
children and adolescents with a compromised bone mass is more sensitive to WBV than that of
postmenopausal women or young adults.
There may be differential effects of WBV on different bone sites, because of the
variability in the transmission of WBV signals. The transmissibility of WBV signals varies
significantly from one anatomical site to another due to the nonlinearities of the
musculoskeletal system (for example, joint angle, soft tissue distribution) and the differences in

81
body positions (for example, bent knees versus straight knees) (Kiiski et al., 2008; Rubin et al.,
2003). This may explain the discrepancy between the hip versus spine aBMD findings in
postmenopausal women. However, the discrepancy between the hip aBMD versus tibia vBMDt
results in postmenopausal women was probably due to inadequate sample size, leading to
inadequate statistical power in the vBMDt analysis.
In contrast to postmenopausal women and children and adolescents, we did not find a
significant effect of WBV in healthy young adults. Some clinical (Rubin et al., 2004) and
experimental (Flieger et al., 1998; Judex et al., 2002) evidence suggests that there is an inverse
relationship between the skeleton’s sensitivity to WBV and the initial BMD. Young adults may
be less sensitive to WBV, because their baseline BMDs are generally higher than those in
postmenopausal women and children and adolescents. As well, young adults’ skeletons are less
metabolically active than children’s and adolescents’, and thus may be less sensitive to
mechanical stimuli such as WBV. Another plausible reason for not observing a significant effect
in young adults is insufficient sample size and statistical power in this population.
There are current controversies as to the optimal frequency and magnitude of WBV.
According to Wolff’s law of bone remodelling, only large-magnitude strains (such as those
arising from high-intensity impact activities) are capable of new bone formation, and the
greater the magnitude the greater the effect (Wolff, 1986; Rubin et al., 2002b). For WBV, this
conventional premise was challenged by the experimental animal models which showed that

82
exposures to low-magnitude but high-frequency vibration can also enhance bone accrual
(Flieger et al., 1998; Rubin et al., 2001b; Rubinacci et al., 2008; Judex et al., 2003; Rubin et al.,
2002a; Rubin et al., 2002b; Christiansen & Silva, 2006; Judex et al., 2005; Xie et al., 2006). These
high-frequency, low-magnitude vibration signals are believed to stimulate bone cells via stress-
generated fluid flow (Rubin et al., 2006; Fritton et al., 2000), with the bone anabolic effect
increasing with increasing frequency (Rubin et al., 2004; Ward et al., 2004). We were unable to
examine the differential effect of various frequencies (12-90 Hz) because of the small number
of RCTs included. However, we grouped the magnitudes of WBV into two relevant categories
(<1g and ≥1g) for hip aBMD analysis, and found no significant differences (Figure 4).
There are several limitations to our study, including the small number of RCTs available,
and the small sample sizes, short durations and methodological issues of the included trials. The
small number of RCTs was especially true for the adult (1 RCT, n=53, (Torvinen et al., 2003)) and
children and adolescent (2 RCTs, n=65, (Gilsanz et al., 2006; Ward et al., 2004)) populations in
comparison to the postmenopausal women (5 RCTs, n=210, (Gusi et al., 2006; Iwamoto et al.,
2005; Rubin et al., 2004; Russo et al., 2003; Verschueren et al., 2004)). At least one study bias
was present in each trial, most frequently attrition bias, and calcium and vitamin D intakes may
have been insufficient in study subjects. Our primary analysis was not according to ITT, because
of the lack of ITT data in the original trials. This may bias our results to show more favourable
outcomes.

83
In conclusion, this is the first systematic review and meta-analysis of the effect of WBV
on BMD in humans. We found statistically significant but clinically small effects in
postmenopausal women, and moderate effects in children and adolescents, but not in young
adults. We also found WBV to be well tolerated and safe. While WBV is a promising new
modality for improving bone health in certain populations, larger and well-designed RCTs are
needed before recommendations can be made for clinical practice. In addition to examining
efficacy and safety of WBV on BMD, these future RCTs should also compare different
frequencies, magnitudes, and cumulative doses of WBV, as well as examine other bone quality
parameters as measured by newer techniques such as high resolution peripheral quantitative
computed tomography. Whether WBV can exert effects in addition to other simultaneous
bone therapies such as calcium and vitamin D supplementation, exercise, and pharmacological
interventions should also be further examined.

84
CHAPTER TWO: EFFECT OF 12 MONTHS OF WHOLE-BODY VIBRATION ON BONE DENSITY AND
STRUCTURE IN POSTMENOPAUSAL WOMEN WITH OSTEOPENIA: A RANDOMIZED
CONTROLLED TRIAL (THE VIBRATION STUDY)
Being submitted for publication in a peer-reviewed scientific journal:
Slatkovska L, Alibhai S, Beyene J, Hu H, Alice Demaras, Cheung AM. (2010). Effect of 12 months
of whole-body vibration on bone density and structure in postmenopausal women with
osteopenia: a randomized controlled trial (The Vibration Study).

85
ABSTRACT
Context and objective: Recent data suggest that whole-body vibration (WBV) may have
beneficial effects on bone. Therefore, we investigated whether WBV prevents postmenopausal
bone loss.
Design and setting: A randomized controlled trial was conducted from November 2006
to December 2009 at the University Health Network (Toronto, Canada).
Participants and interventions: Two hundred and two postmenopausal women with
primary osteopenia not on bone medications were randomized to one of three groups: 0.3g
WBV at 90 Hz (90Hz, n=67), 0.3g WBV at 30 Hz (30Hz, n=68) and control (CON, n=67). Women
in the 90Hz and 30Hz groups were asked to stand on a WBV platform daily for 20 minutes for
12 months. All women were provided calcium and vitamin D supplements.
Main outcome measures: Volumetric bone mineral density (vBMD) and bone structure,
measured by high-resolution peripheral quantitative computed tomography (HR-pQCT) at the
distal tibia and distal radius, and areal bone mineral density (aBMD), measured by dual-energy
x-ray absorptiometry (DXA) at the femoral neck, total hip and lumbar spine, were obtained at
baseline and 12 months. Primary outcome was trabecular vBMD at the distal tibia. Adherence
was recorded by each WBV platform. Between-group differences in absolute change in HR-
pQCT and DXA parameters were examined using ANOVA with a priori contrasts (p < 0.05).

86
Results: No significant between-group differences in 12-month change in trabecular
vBMD at the distal tibia were found (p=0.5; +0.4, -0.1 and -0.2 mg⋅cm-3 in 90Hz, 30Hz and CON,
respectively). No effects on any other HR-pQCT or DXA parameters were found. A priori
specified subgroups also did not reveal any effect in women ≥80% adherent, <65 kg in mass,
≤60 years-old or ≤10 years since menopause. Median adherence based on total cumulative
duration of WBV was 79% and 77% in 90Hz and 30Hz groups, respectively.
Conclusions: WBV for 12 months at 0.3g and 90 or 30 Hz did not alter BMD or bone
structure in postmenopausal women with osteopenia.
Trial Registration: ClinicalTrials.gov (#NCT00420940)
Keywords: whole-body vibration, menopause, bone mineral density, bone structure,
osteopenia
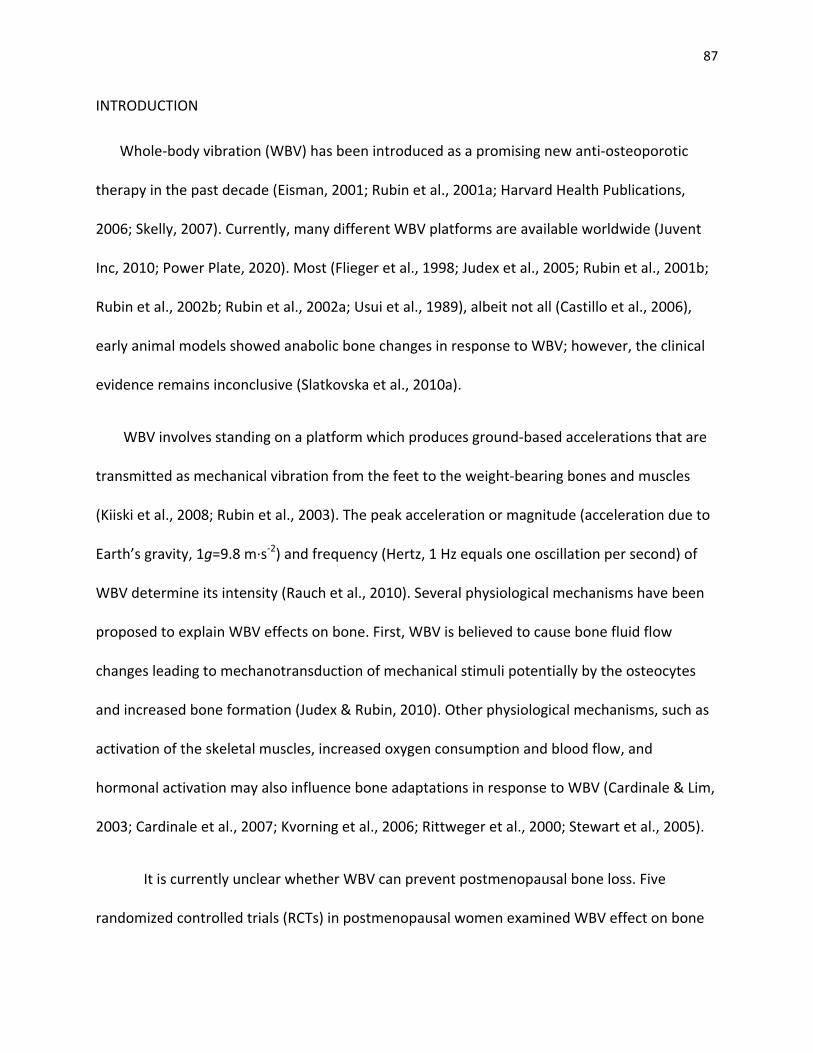
87
INTRODUCTION
Whole-body vibration (WBV) has been introduced as a promising new anti-osteoporotic
therapy in the past decade (Eisman, 2001; Rubin et al., 2001a; Harvard Health Publications,
2006; Skelly, 2007). Currently, many different WBV platforms are available worldwide (Juvent
Inc, 2010; Power Plate, 2020). Most (Flieger et al., 1998; Judex et al., 2005; Rubin et al., 2001b;
Rubin et al., 2002b; Rubin et al., 2002a; Usui et al., 1989), albeit not all (Castillo et al., 2006),
early animal models showed anabolic bone changes in response to WBV; however, the clinical
evidence remains inconclusive (Slatkovska et al., 2010a).
WBV involves standing on a platform which produces ground-based accelerations that are
transmitted as mechanical vibration from the feet to the weight-bearing bones and muscles
(Kiiski et al., 2008; Rubin et al., 2003). The peak acceleration or magnitude (acceleration due to
Earth’s gravity, 1g=9.8 m·s-2) and frequency (Hertz, 1 Hz equals one oscillation per second) of
WBV determine its intensity (Rauch et al., 2010). Several physiological mechanisms have been
proposed to explain WBV effects on bone. First, WBV is believed to cause bone fluid flow
changes leading to mechanotransduction of mechanical stimuli potentially by the osteocytes
and increased bone formation (Judex & Rubin, 2010). Other physiological mechanisms, such as
activation of the skeletal muscles, increased oxygen consumption and blood flow, and
hormonal activation may also influence bone adaptations in response to WBV (Cardinale & Lim,
2003; Cardinale et al., 2007; Kvorning et al., 2006; Rittweger et al., 2000; Stewart et al., 2005).
It is currently unclear whether WBV can prevent postmenopausal bone loss. Five
randomized controlled trials (RCTs) in postmenopausal women examined WBV effect on bone

88
mineral density (BMD) (Gusi et al., 2006; Iwamoto et al., 2005; Rubin et al., 2004; Verschueren
et al., 2004; Russo et al., 2003). Four trials assessed areal BMD (aBMD), as measured by dual-
energy x-ray absorptiometry (DXA), and found no effect at the lumbar spine (Gusi et al., 2006;
Iwamoto et al., 2005; Rubin et al., 2004; Verschueren et al., 2004), while significant
improvements on hip aBMD were observed two trials (Gusi et al., 2006; Verschueren et al.,
2004). Only one RCT examined volumetric BMD (vBMD), as measured by high-resolution
peripheral quantitative tomography (HR-pQCT), but no significant effect was found at the distal
tibia (Russo et al., 2003). Limitations of these RCTs included inadequate calcium and vitamin D
supplementation (Gusi et al., 2006; Iwamoto et al., 2005; Rubin et al., 2004; Verschueren et al.,
2004), small sample sizes (n<100) and attrition bias, as summarized in our recent meta-analysis
(Slatkovska et al., 2010a).
Further, whether different magnitudes and frequencies of WBV utilized in previous RCTs of
postmenopausal women contributed to discrepant findings is not known. Four trials
administered high-magnitude (≥1g) WBV at 12 to 40 Hz (Gusi et al., 2006; Iwamoto et al., 2005;
Russo et al., 2003; Verschueren et al., 2004), of which two found significant effect on hip aBMD
(Gusi et al., 2006; Verschueren et al., 2004). One RCT examined low-magnitude (<1g) WBV at
0.3g and 30 Hz, but no effect on hip or spine aBMD was found. In contrast, early animal models
primarily examined low-magnitude (<1g) WBV at 30 to 90 Hz, as summarized elsewhere (Prisby
et al., 2008), and found more significant increases in bone formation rate at WBV magnitude of
0.3g versus 0.6g (at 45 Hz) (Garman et al., 2007) and at WBV frequency of 90 Hz versus 45 Hz
(at 0.2g) (Judex et al., 2007). In RCTs of children and adolescents, low-magnitude WBV at 0.3g
and 30 or 90 Hz was also found to significantly increase vBMD at the tibia, femur and spine

89
(Gilsanz et al., 2006; Ward et al., 2004). Finally, deleterious effects of WBV on the human body
are also more likely at higher magnitudes (Griffin, 1998).
Therefore, we conducted a 12-month RCT to examine effects of daily 20-minute WBV at
0.3g and 90 Hz versus 0.3g and 30 Hz versus no WBV on aBMD, vBMD and bone structure in
202 osteopenic postmenopausal women with adequate calcium and vitamin D
supplementation.
METHODS
Setting and study design
Postmenopausal women were primarily recruited through newsletters, posted flyers
and word-of-mouth in the Greater Toronto Area, Canada. A computer-generated block-
randomization scheme (n=10) and sealed envelopes were used to randomly assign eligible
participants to one of three groups: 90 Hz WBV (90Hz), 30 Hz WBV (30Hz), and control (CON).
Women in the 90Hz and 30Hz groups received WBV, and were blinded to the frequency of their
WBV platform, while controls did not receive WBV or a sham platform. Outcome assessors,
including HR-pQCT and DXA analysts, were blinded to group assignment. Data collection was
conducted from November 2006 to December 2009 at the Centre of Excellence in Skeletal
Health Assessment (Toronto, Canada), and included baseline and 6- and 12-month follow-up
visits. HR-pQCT and DXA bone parameters, physical activity levels, and body mass and height

90
were collected at baseline and 12 months. Medical conditions, medications and falls were
assessed at each study visit, and participants were also asked to inform us via phone of any
health changes they experienced during study. Dietary calcium and vitamin D intakes were
assessed and supplements were provided at baseline and 6 months. Adherence to WBV was
self-reported at 6 months and extracted from WBV platforms at 12 months, while adherence to
calcium and vitamin D supplements was self-reported at 12 months. Serum 25-hydroxy vitamin
D levels were obtained from recent medical records (i.e., obtained during the study period ±3
months). A priori study protocol and standardised data forms were used for collecting all data
(see the Technical Appendix). This study was approved by the UHN research ethics board,
registered at ClinicalTrials.gov (#NCT00420940) and funded by the Ontario Physicians’ Services
Incorporated Foundation.
Participants
Women were eligible if they were postmenopausal (≥1 year after cessation of menses)
and had primary osteopenia (lowest aBMD T-score at the lumbar spine, femoral neck, or total
hip between -1.0 and -2.5). Exclusion criteria included osteoporosis; fragility fracture after age
40; secondary causes for bone loss; other metabolic bone diseases or diseases affecting bone
metabolism; current use of any bone medications; recent use of hormone replacement therapy
(HRT) (past 12 months), bisphosphonates (past 3 months) or raloxifene (past 6 months); prior
use of bisphosphonates for ≥3 months; chronic glucocorticoid, anticoagulant or anticonvulsant
therapy; history of active cancer in the past 5 years; body mass of ≥90 kg; knee or hip joint

91
replacements; spinal implants; inability to tolerate WBV for 20 minutes; expected changes in
physical activity levels; and expected travels for more than four consecutive weeks during the
study.
Interventions
90Hz and 30Hz participants were asked to stand on a WBV platform (Dynamic Motion
Therapy 1000™, Juvent Medical Inc, Somerset, NJ) oscillating at a magnitude of 0.3g and at
frequencies of 90 or 30 Hz, respectively, for 20 minutes a day for 12 months at home, while
controls did not receive WBV. At baseline, 90Hz and 30Hz participants were provided
instructions about how to stand on a vibrating platform; erect, with neutral posture at the neck,
lumbar spine, and knees, wearing socks or barefoot, and without excessive foot or body
movements. Self-reported adherence to WBV was obtained at 6 months and feedback about
how to improve adherence was provided. Actual adherence to WBV was extracted from each
platform at study completion, using an internal digital clock recording of every session date,
time and duration. All platforms were designed to automatically turn off at the end of each 20-
minute WBV session, but it was possible for participants to administer two or more daily WBV
sessions or less than 20 minutes a day. As such, three different percent adherence measures
were obtained; based on the total cumulative duration of all WBV sessions, total number of
WBV days and total number of full 20-minute WBV sessions performed during study.
Daily dietary calcium and vitamin D intakes were estimated using a recall questionnaire
(Hung et al., 2010) and appropriate supplement (Jamieson Laboratories™ calcium carbonate or

92
citrate and cholecalciferol tablets) dose was provided to all participants, so that total daily
calcium and vitamin D intakes from diet plus supplements were approximately 1200 mg and
1000 IU, respectively. All participants were asked to report their perceived percent adherence
(0-100%) to calcium and vitamin D supplements.
Outcomes
vBMD (trabecular, cortical and total; vBMDt, vBMDc, vBMDtot) and bone structure
(cortical thickness, and trabecular thickness, number, separation and bone volume fraction;
CTh, TTh, TN, TSp, BV/TV) were measured using HR-pQCT (XtremeCT, Scanco Medical AG,
Bassersdorf, Switzerland) at the distal tibia and distal radius. Our primary outcome was vBMDt
at the distal tibia. aBMD was measured using DXA (Hologic DiscoveryA; Hologic, Bedford, MA)
at the femoral neck, total hip and L1 to L4 lumbar spine (aBMDf, aBMDh, aBMDs). HR-pQCT and
DXA outcome assessment was performed by trained and certified technologists using a
standardized protocol and manufacturer software. Baseline and final HR-pQCT scans were
matched for their common region in order to calculate absolute 12-month change in HR-pQCT
parameters. The RMS-CVs for short-term reproducibility in our laboratory were: HR-pQCT distal
tibia vBMD, 0.19-0.40%, CTh, 0.50%, BV/TV, 0.37%, and trabecular structure, 3.73-4.08%; HR-
pQCT distal radius vBMD, 0.46-0.70%, CTh, 1.33%, BV/TV, 0.71%, and trabecular structure,
4.55-4.83%; DXA aBMD, 1.0-1.8% (Cheung et al., 2008; Cheung et al., 2010).
Serious adverse events (SAEs; hospitalization, cancer, life-threatening event or death
experienced during study) and adverse events (AEs; any untoward effects with an onset after

93
baseline or worsening of an existing condition) were recorded using the National Cancer
Institute’s Common Terminology Criteria for AEs v3.0 (National Cancer Institute, 2006). Clinical
fractures occurring during the study were confirmed by radiographs or radiological reports. An
investigator blinded to group assignment (AMC) determined whether SAEs were related to
WBV and identified clinical fractures experienced during study as fragility or non-fragility. Falls
were recorded based on participants’ recall, and medications and other treatments were self-
reported. Daily physical activity metabolic index (AMI, kcal/day) was obtained using the
Minnesota Leisure-Time Physical Activity Questionnaire (Wilson, 1997).
Statistical analyses
Baseline characteristics were compared between groups using one-way ANOVA and X2
statistics. Differences in absolute 12-month change (final – baseline) in all bone outcomes were
assessed with one-way ANOVA with contrasts, using intention-to-treat (ITT) and per-protocol
approaches (Vickers, 2001). All randomized participants were included in the ITT approach, and
single imputations based on group means substituted any missing bone outcomes; in other
words, for each participant with a missing bone outcome, the mean value of that bone
outcome for the study group to which they belonged was used in place of the missing value.
Missing bone outcomes and participants who started hormone replacement therapy (HRT)
during study were excluded from the per-protocol approach. The following contrasts were
specified a priori: all pair-wise (90Hz versus 30Hz, 30Hz versus CON, 90Hz versus CON) and
90Hz plus 30Hz versus CON group (see the Technical Appendix for a priori data analysis plan).

94
Our a priori specified subgroups included participants who were ≥80% adherent (using all three
adherence estimates), <65 kg in mass, ≤60 years-old or ≤10 years since menopause. Using one-
way ANCOVA with contrasts, we examined whether baseline physical activity or serum vitamin
D levels influenced between-group differences in bone outcomes. In our sensitivity analyses,
we excluded participants with potentially compromised bone outcomes (for example, due to
fracture-related ankle immobilization) or study conduct (for example, performed WBV with
shoes). Changes in total daily calcium and vitamin D intakes, physical activity levels, and body
mass and body mass index were assessed with one-way ANOVA. AEs were categorized
independently by two investigators (LS and HH) and compared between study groups using the
Fisher’s Exact X2 test. Using a LSC of 1.1% and a standard deviation of ~2.5% for tibial vBMDt,
based on a precision study in our laboratory (Cheung et al., 2010), a sample size of 200 was
deemed adequate to achieve 80% statistical power at α=0.05. All analyses were conducted
using SAS version 9.2 (see the Technical Appendix for SAS codes) and a statistical significance
level of p≤0.05.
RESULTS
Participants characteristics
We contacted 1,126 potential participants, of which 303 were interested and eligible,
attended a screening visit, and signed an informed consent (Figure 1). Of those, 202 osteopenic

202
Ran
dom
ized
90 H
z WBV
Gro
up67
Allo
cate
d to
and
rece
ived
90
Hz W
BV
Co
ntro
l Gro
up67
Allo
cate
d to
and
rece
ived
no
WBV
2 L
ost t
o fo
llow
-up
1 ex
tenu
atin
g ci
rcum
stan
ces
1 lo
ss o
f int
eres
t
2 Lo
st to
follo
w-u
p 2
loss
of i
nter
est
67 In
clud
ed in
inte
ntio
n-to
-tre
at a
naly
sis64
Incl
uded
in p
er-p
roto
col a
naly
sis3
Excl
uded
: 2 L
ost t
o fo
llow
-up
1 st
arte
d HR
T
67 In
clud
ed in
int
entio
n-to
-tre
at a
naly
sis64
Incl
uded
in p
er-p
roto
col a
naly
sis3
Excl
uded
: 2 L
ost t
o fo
llow
-up
1 st
arte
d HR
T
823
Excl
uded
524
Did
not m
eet i
nclu
sion
crite
ria19
8 Re
fuse
d to
par
ticip
ate
101
Oth
er re
ason
sa
1126
As
sess
ed fo
r elig
ibili
ty &
in
tere
st v
ia p
hone
101
Did
not m
eet i
nclu
sion
crite
riab
30 H
z WBV
Gro
up68
Allo
cate
d to
and
rece
ived
30
Hz W
BV
3 Lo
st to
follo
w-u
p1
exte
nuat
ing
circ
umst
ance
s1
loss
of i
nter
est
1 m
oved
68 In
clud
ed in
inte
ntio
n-to
-tre
at a
naly
sis65
Incl
uded
in p
er-p
roto
col a
naly
sis3
Excl
uded
: 3 L
ost t
o fo
llow
-up
303
Ass
esse
d fo
r elig
ibili
ty &
in
tere
st d
urin
g sc
reen
ing
visit
a No
resp
onse
(n=5
5), s
tudy
clo
sed
prio
r to
asse
ssin
g el
igib
ility
via
pho
ne (n
=33)
, diff
icul
t to
sche
dule
(n=7
), an
d ot
her (
n=6)
b Not
ost
eope
nic
(n=8
3), m
edic
atio
ns a
ffect
ing
bone
met
abol
ism (n
=9),
not p
ostm
enop
ausa
l (n=
1), d
iseas
es a
ffect
ing
bone
met
abol
ism(n
=2),
body
mas
s of >
90 k
g (n
=1),
expe
cted
trav
els f
or >
1 m
onth
(n=1
), e
xpec
ted
chan
ges i
n ph
ysic
al le
vels
(n=1
), jo
int r
epla
cem
ents
/spi
ne im
plan
ts (n
=1),
and
poor
med
ical
/psy
chia
tric
risk
(n=2
).
Figu
re 1
. Flo
w d
iagr
am o
f par
ticip
ants
’ pr
ogre
ss th
roug
h th
e tr
ial.
Luba
Typewritten Text
95

96
postmenopausal women met our inclusion/exclusion criteria, and were randomized to 90Hz
(n=67), 30Hz (n=68) or CON (n=67) groups. Participants were primarily of European (78%) and
South-East Asian (16%) ethnic origin with mean age of 60 years (range: 44-79), on average 10
years (range: 1-43) past menopause, mean body mass of 63 kg (range: 43-88), and total daily
calcium and vitamin D intakes of 1429 mg (SD: 660) and 817 IU (SD: 581). Baseline
characteristics were similar between groups (Table 1). Seven participants dropped out (four lost
interest, two underwent extenuating life circumstances and one moved) and two participants
started taking HRT during the study. Mean change in total daily calcium (90Hz, -63 mg; 30Hz, 18
mg; CON, 102 mg; p=0.29) and vitamin D (90Hz, 11 IU; 30Hz, 68 IU; CON, 86 IU; p=0.68) intakes,
after we provided study supplements, were insignificant and similar between groups. Serum
25-hydroxy vitamin D levels (90Hz, 94 nmol/L, n=60; 30Hz, 94 nmol/L, n=61; CON, 90 nmol/L,
n=59; p=0.67) and 12-month change in physical activity levels (90Hz, -24 AMI; 30Hz, -12 AMI;
CON, -30 AMI; p=0.85), body mass (90Hz, 0.2 kg; 30Hz, 0.0 kg; CON, 0.5 kg; p=0.60) and BMI
(90Hz, 0.1 kg·m-2; 30Hz, 0.0 kg·m-2; CON, 0.2 kg·m-2; p=0.53) were also similar between groups.
Additional results are reported in the Technical Appendix.
Adherence
Adherence to WBV was not obtained in five drop-outs and in three participants with
WBV platform digital clock malfunction. Most participants were either close to 100% or 0%
adherent, making the adherence distribution bimodal and heavy in the extremes, thus medians
were calculated. All three estimates of adherence to WBV, based on total cumulative duration,

Table 1. Baseline Characteristics of Women Participating in the Vibration Study. Baseline Characteristic Category 90 Hz WBV
(n = 67) 30 Hz WBV
(n = 68) Control (n = 67)
Age, mean (SD) - 60.5 (7.0) 59.6 (6.0) 60.8 (5.5) Age at menarche, mean (SD) - 12.9 (1.5) 12.2 (1.5) 12.9 (1.6) Years since menopause, mean (SD) Natural menopause (n=169) 8.6 (6.0) 9.5 (6.7) 9.4 (6.2) Surgical menopause (n=33) 24.6 (11.5) 15.8 (7.4) 15.2 (10.4) Mass (kg), mean (SD) - 64.4 (10.6) 62.0 (10.5) 62.4 (9.5) Height (m), mean (SD) - 1.61 (0.06) 1.59 (0.06) 1.60 (0.06) BMI (kg∙m-2), mean (SD) - 24.9 (4.0) 24.5 (3.6) 24.2 (3.4) Ethnicity, n (%) European 55 (82) 48 (70) 54 (81) Southeast Asian 8 (12) 14 (20) 10 (15) Other 4 (6) 6 (9) 3 (4) Education, n (%) High school or less 13 (19) 11 (16) 11 (16) University/community college 44 (66) 35 (51) 35 (52) Post graduate 10 (15) 22 (32) 21 (31) Marital status, n (%) Married/common law 38 (57) 41 (60) 41 (61) Divorced/separated/widowed 20 (30) 21 (31) 15 (22) Never married 9 (13) 6 (9) 11 (16) Family osteoporosis history, n (%) - 26 (39) 34 (50) 35 (52) Alcohol use, n (%) None 30 (45) 39 (57) 35 (52) 1 serving a day 32 (48) 23 (34) 25 (37) >1 servings a day 5 (7) 6 (9) 7 (10) Smoking, n (%) Past smoker 24 (36) 19 (28) 20 (30) Current smoker 4 (6) 4 (6) 4 (6) Never smoked 39 (58) 45 (66) 43 (64) Falls experienced in past 12 months, n (%) None 52 (78) 54 (79) 48 (72) 1 fall 13 (19) 10 (15) 16 (24) >1 falls 2 (3) 4 (6) 3 (4) DXA areal measurements, mean (SD) aBMDf (g∙cm-2) 0.686 (0.049) 0.676 (0.060) 0.687 (0.054) aBMDh (g∙cm-2) 0.851 (0.066) 0.836 (0.083) 0.845 (0.068) aBMDs (g∙cm-2) 0.904 (0.090) 0.890 (0.069) 0.902 (0.080) Distal tibia HR-pQCT measurements, mean (SD)* vBMDt (mg⋅cm-3) 149 (36) 144 (29) 145 (30) vBMDc (mg⋅cm-3) 827 (54) 828 (61) 823 (44) vBMDtot (mg⋅cm-3) 264 (48) 268 (41) 264 (43) CTh (mm) 0.99 (0.21) 1.03 (0.24) 1.00 (0.20) TTh (mm) 0.079 (0.016) 0.081 (0.013) 0.079 (0.015) TN (mm-1) 1.56 (0.25) 1.50 (0.28) 1.54 (0.27) TSp (mm) 0.578 (0.118) 0.610 (0.127) 0.592 (0.125) BV/TV (%) 0.124 (0.030) 0.120 (0.024) 0.120 (0.025) Distal radius HR-pQCT measurements, mean (SD)* vBMDt (mg⋅cm-3) 137 (35) 138 (28) 139 (32) vBMDc (mg⋅cm-3) 847 (66) 837 (71) 843 (62) vBMDtot (mg⋅cm-3) 291 (64) 290 (58) 294 (59) CTh (mm) 0.68 (0.17) 0.67 (0.18) 0.69 (0.17) TTh (mm) 0.066 (0.011) 0.067 (0.010) 0.067 (0.012) TN (mm-1) 1.73 (0.26) 1.71 (0.27) 1.73 (0.28) TSp (mm) 0.526 (0.095) 0.530 (0.093) 0.530 (0.130) BV/TV (%) 0.114 (0.029) 0.115 (0.024) 0.116 (0.027) Calcium intakes (mg), mean (SD) - 1538 (677) 1399 (656) 1352 (642) Vitamin D intakes (IU), mean (SD) - 866 (582) 778 (583) 808 (584) Physical activity AMI (kcal/day), mean (SD)** 352 (224) 337 (237) 383 (277) Abbreviations: WBV, whole-body vibration; SD, standard deviation; BMI, body mass index; DXA, dual-energy x-ray absorptiometry; BMD, bone mineral density; aBMDf, areal BMD at the femoral neck; aBMDh, areal BMD at the total hip; aBMDs, areal BMD at the lumbar spine L1-L4; HR-pQCT, high-resolution peripheral quantitative computed tomography; vBMDt, trabecular volumetric BMD; vBMDc, cortical volumetric BMD; vBMDtot, total volumetric BMD; CTh, cortical thickness; TTh, trabecular thickness; TN, trabecular number; TSp, trabecular separation; BV/TV, trabecular bone volume fraction. *One distal tibia (n=201) and two distal radius (n=200) scans were not evaluable, resulting in an incomplete baseline analysis of HR-pQCT parameters. **Daily physical activity metabolic index (AMIs) units in kcal per day, as estimated by Minnesota Leisure-Time Physical Activity Questionnaire.
Luba
Typewritten Text
97

98
number of days and number of full treatments, were similar in 90Hz and 30Hz groups, and their
medians were, respectively, 79%‚ 70% and 78% (mean: 65%, 58%, 64%; interquartile range:
50%‚ 49%‚ 51%) versus 77%‚ 65% and 77% (mean: 66%, 60%; 65%; interquartile range: 30%‚
28%‚ 33%). Depending on the adherence estimate used, 29-48% of 90Hz participants and 26-
45% of 30Hz participants were ≥80% adherent to WBV. Mean adherence to calcium and vitamin
D supplements was also similar between 90Hz (90%; median: 98%), 30Hz (89%; median: 98%)
and CON (89%; median: 96%) groups.
Bone outcomes
There was excellent matching of baseline and final HR-pQCT scans with mean matched
common region of 96% (SD: 3) for the distal tibia and 93% (SD: 6) for the distal radius. After 12-
months of WBV, no significant between-group differences in any HR-pQCT or DXA parameters
were observed using ITT or per-protocol approaches (Table 2). Percent 12-month changes
observed in the per-protocol approach for 90Hz, 30Hz, and CON groups were, respectively:
distal tibia vBMDt, 0.4%, -0.1% and -0.2%; aBMDf, -0.7%, -0.8% and -0.1%; aBMDh -0.4%, -0.2%
and -0.3%; and aBMDs, -0.6%, -0.9% and -0.8%. Our subgroup analyses of participants who
were ≥80% adherent, <65 kg in mass, ≤60 years-old or ≤10 years since menopause did not
identify any subgroup which responded to WBV. Finally, our adjustment for baseline physical
activity levels or serum vitamin D levels, or our sensitivity analyses did not make a difference in
the HR-pQCT and DXA findings.

Table 2. Absolute change in all DXA and HR-pQCT parameters. Intention-to-treat approach (n=202) Per-protocol approach (n=193) Bone Outcomes: Absolute 12 months Change
90 Hz WBV (n = 67)
30 Hz WBV (n = 68)
Control (n = 67)
90 Hz (n = 64)
30 Hz (n = 65)
Control (n = 64)
DXA areal bone mineral density, mean (SD) aBMDf (g∙cm-2) -0.005 (0.018) -0.005 (0.022) -0.001 (0.020) -0.005 (0.018) -0.005 (0.022) -0.001 (0.020) aBMDh (g∙cm-2) -0.004 (0.014) -0.002 (0.016) -0.002 (0.016) -0.004 (0.015) -0.002 (0.016) -0.002 (0.016) aBMDs (g∙cm-2) -0.006 (0.028) -0.008 (0.020) -0.007 (0.020) -0.006 (0.029) -0.008 (0.020) -0.006 (0.021) Distal tibia HR pQCT volumetric bone measurements, mean (SD)* vBMDt (mg⋅cm-3) 0.4 (3.7) -0.1 (3.3) -0.2 (3.1) 0.4 (3.8) -0.1 (3.4) -0.2 (3.2) vBMDc (mg⋅cm-3) -10.9 (12.7) -10.4 (14.0) -9.2 (11.6) -11.1 (12.9) -10.4 (14.5) -9.1 (11.8) vBMDtot (mg⋅cm-3) -1.4 (5.4) -2.3 (5.3) -1.7 (4.3) -1.4 (5.5) -2.3 (5.5) -1.7 (4.4) CTh (mm) 0.000 (0.028) -0.006 (0.036) 0.001 (0.026) 0.000 (0.029) -0.006 (0.038) 0.001 (0.026) TTh (mm) -0.003 (0.006) -0.004 (0.007) -0.002 (0.006) -0.003 (0.006) -0.004 (0.007) -0.002 (0.006) TN (mm-1) 0.070 (0.142) 0.078 (0.154) 0.056 (0.128) 0.072 (0.146) 0.078 (0.160) 0.056 (0.132) TSp (mm) -0.022 (0.044) -0.023 (0.046) -0.018 (0.048) -0.023 (0.045) -0.023 (0.048) -0.017 (0.049) BV/TV (%) 0.000 (0.003) -0.000 (0.003) -0.000 (0.003) 0.000 (0.003) -0.000 (0.003) -0.000 (0.003) Distal radius HR pQCT volumetric bone measurements, mean (SD)** vBMDt (mg⋅cm-3) -2.2 (9.6) -1.6 (5.0) -1.0 (4.4) -2.1 (9.9) -1.6 (5.1) -0.9 (4.4) vBMDc (mg⋅cm-3) -14.8 (17.1) -10.4 (18.0) -13.0 (17.1) -15.1 (17.5) -10.4 (18.7) -12.8 (17.6) vBMDtot (mg⋅cm-3) -5.2 (12.1) -3.8 (7.5) -5.2 (9.3) -5.2 (12.5) -3.8 (7.8) -5.0 (9.4) CTh (mm) -0.007 (0.032) -0.006 (0.024) -0.014 (0.037) -0.007 (0.033) -0.006 (0.025) -0.013 (0.038) TTh (mm) -0.002 (0.006) -0.002 (0.006) -0.001 (0.007) -0.002 (0.006) -0.002 (0.006) -0.001 (0.007) TN (mm-1) 0.031 (0.196) 0.036 (0.137) 0.024 (0.167) 0.033 (0.201) 0.036 (0.142) 0.028 (0.168) TSp (mm) -0.002 (0.096) -0.010 (0.038) -0.008 (0.052) -0.003 (0.099) -0.010 (0.039) -0.010 (0.052) BV/TV (%) -0.002 (0.008) -0.001 (0.004) -0.001 (0.004) -0.002 (0.008) -0.001 (0.004) -0.001 (0.004) Abbreviations: DXA, dual-energy x-ray absorptiometry; HR-pQCT, high-resolution peripheral quantitative computed tomography; WBV, whole-body vibration; SD, standard deviation; BMI, body mass index; BMD, bone mineral density; aBMDf, areal BMD at the femoral neck; aBMDh, areal BMD at the total hip; aBMDs, areal BMD at the lumbar spine L1-L4; vBMDt, trabecular volumetric BMD; vBMDc, cortical volumetric BMD; vBMDtot, total volumetric BMD; CTh, cortical thickness; TTh, trabecular thickness; TN, trabecular number; TSp, trabecular separation; BV/TV, trabecular bone volume fraction. *HR-pQCT analysis of the distal tibia was based on <193 participants included in the per-protocol approach (n=191), due to compromised bone scans (one baseline scan was not evaluable and one participant refused to complete the final scan). **HR-pQCT analysis of the distal radius was based on <193 participants included in the per-protocol approach (n=189), due to compromised bone scans (two baseline scans were not evaluable and two participants refused to complete the final scan).
Luba
Typewritten Text
99

100
Adverse events
The following SAEs were reported, but none were deemed to be due to WBV: breast
cancer (1 in 30Hz, 1 in CON), grade 3 oligodendroglioma (1 in 30Hz), appendicitis (2 in CON),
pneumonia requiring hospitalization (1 in 30Hz) and pacemaker insertion (30Hz, n=1). When
various AE categories were compared between study groups, including falls and clinical
fractures, no statistically significant differences were observed (Table 3).Three participants
discontinued WBV, within two months after starting the therapy, upon experiencing the
following AEs with WBV use: dizziness at night (1 in 30Hz), chronic shin pain (1 in 90Hz) and
chronic plantar foot pain (1 in 30Hz). The following mild symptoms lasting briefly during or just
after WBV were also reported: pain, numbness or weakness at various leg sites (5 in 90Hz, 5 in
30Hz), nausea (2 in 90Hz), increased bowel movement (2 in 90Hz, 1 in 30Hz), and exacerbation
of pre-existing headaches, bladder discomfort, inner ear sensitivity or neck pain (3 in 90Hz, 1 in
30Hz).
COMMENT
In our RCT of osteopenic postmenopausal women, low magnitude WBV at 0.3g and at
90 or 30 Hz had no effect on vBMD and bone structure parameters at the distal tibia and distal
radius, and aBMD at the lumbar spine, total hip and femoral neck. Low-magnitude WBV at 0.3g
and 30 Hz was previously examined in one RCT of postmenopausal women, and similarly no

Table 3 – Adverse events summary. Adverse Events Category Number of participants
90Hz 30Hz CON All adverse events 44 47 43 Serious adverse events 0 4 3 Clinical fractures One 3 1 0 Two 1 0 1 Fall(s) One 11 6 17 Two or more 10 6 7 Back pain Improved 6 8 2 Worsened 4 7 3 Unchanged 23 20 26 Osteoarthritis 2 2 2 Lower-limb problems* 27 20 19 Other musculoskeletal problems** 34 24 26 Edema 4 2 3 Dizziness or faintness 1 1 4 Headache 2 2 0 Gastrointestinal discomfort 5 1 2 Ear problems 2 1 0 Eye problems 5 3 2 Renal problems 1 3 0 Hypertension 2 4 2 Depression, anxiety or insomnia 2 2 4 *Included aches and pains, joint stiffness or weakness, change is sensation or numbness, swelling or edema or any other symptoms in the lower-limbs (hips, thighs, knees, lower leg and feet). Did not include clinical fractures. **Included all musculoskeletal problems, except clinical fractures, back pain and osteoarthritis, occurring anywhere in the body including the lower limbs.
Luba
Typewritten Text
101

102
significant effect on aBMD at the lumbar spine or femoral neck was found (Rubin et al., 2004).
Four RCTs in postmenopausal women examined high-magnitude (≥1g) WBV at frequencies
between 12 to 40 Hz, and observed no significant effect on vBMDt at the distal tibia (Russo et
al., 2003) or aBMD at the lumbar spine (Gusi et al., 2006; Iwamoto et al., 2005; Rubin et al.,
2004; Verschueren et al., 2004), however, statistically significant but small effect on hip aBMD
was found in two trials (Gusi et al., 2006; Verschueren et al., 2004). Although high- (≥1g) but
not low-magnitude (<1g) WBV was previously found to improve hip aBMD in postmenopausal
women (Gusi et al., 2006; Verschueren et al., 2004), we examined low-magnitude WBV in our
RCT for various reasons. The early animal models primarily examined low-magnitude WBV at
0.1g to 0.6g and observed bone adaptations in the weight-bearing skeleton, such as improved
trabecular vBMD and microarchitecture, as summarized elsewhere (Prisby et al., 2008). Further,
larger increases in bone formation rate were found in adult female mice receiving 0.3g versus
0.6g WBV at 45 Hz (Garman et al., 2007). In children and adolescents, 0.3g WBV at 90 and 30
Hz was found to significantly improve vBMD at the spine, femur and tibia (Gilsanz et al., 2006;
Ward et al., 2004). Finally, the RCT in postmenopausal women which examined effects of 0.3g
WBV at 30 Hz on hip and spine aBMD, observed significant improvements in a small subgroup
of ≥80% adherent and <65 kg women (n=10), albeit not in the whole study population (n=70),
and calcium and vitamin D supplements were not provided in this trial (Rubin et al., 2004).
Compared to previous RCTs of WBV effects on bone in postmenopausal women, we
examined larger sample size (n=202 vs. n<100) (Gusi et al., 2006; Iwamoto et al., 2005; Rubin et
al., 2004; Russo et al., 2003; Verschueren et al., 2004), lost less participants to follow-up (4% vs.
13-50%) (Gusi et al., 2006; Rubin et al., 2004; Russo et al., 2003; Verschueren et al., 2004) and

103
provided calcium and vitamin D supplements (Gusi et al., 2006; Iwamoto et al., 2005; Rubin et
al., 2004; Verschueren et al., 2004). Also, we employed several strategies to improve the
efficacy of WBV in our trial. First, our primary outcome was vBMDt at the distal tibia, because
trabecular bone density at a weight-bearing site closest to the vibrating platform was expected
to respond more to WBV than other bone parameters or sites (Rubin et al., 2002b; Rubin et al.,
2002a; Kiiski et al., 2008). Second, we included postmenopausal women with osteopenia versus
normal aBMD, because early animal models have shown stronger osteogenic effects of WBV in
rats with more compromised skeletons (Flieger et al., 1998), while previous RCTs of WBV also
included postmenopausal women with normal aBMD (Gusi et al., 2006; Rubin et al., 2004;
Russo et al., 2003; Verschueren et al., 2004). Third, we examined a priori specified subgroups of
<65 kg, ≤10 years after menopause or ≤60-year-old women, as previous authors hypothesized
that skeletons of lighter women with smaller soft tissue mass may receive less dissipated WBV
stimulus (Rubin et al., 2004), and we hypothesized that younger postmenopausal women may
respond more to WBV due to faster bone metabolism (Reid, 2006).
Overall, low-magnitude WBV at 30 and 90 Hz was found to be well tolerated in our
population of osteopenic postmenopausal women. Previous RCTs in this population also found
WBV to be well tolerated, as summarized in our recent meta-analysis (Slatkovska et al., 2010a).
However, prolonged exposure to WBV in occupational settings (e.g., driving or drilling
platforms) has been linked to various conditions (Griffin, 1998; Randall et al., 1997), such as
vibration-white foot syndrome and motion sickness (Griffin, 1998; Thompson et al., 2010).
Several 90Hz and 30Hz participants self-reported pain and numbness involving the feet and
dizziness and nausea possibly related to WBV. Increased gastrointestinal motility during or just

104
after WBV was also reported in our trial, while prolonged vibration exposure during driving was
previously found to reduce gastrointestinal motility (Ishitake et al., 1999).
To our knowledge, this was the first RCT to administer more than 10 consecutive
minutes of WBV to postmenopausal women (Rubin et al., 2004; Slatkovska et al., 2010a). The
early animal models primarily examined 10 to 30 minutes of continuous WBV and observed
significant bone adaptations (Prisby et al., 2008); for example, 12 months of daily 20-minute
WBV at 0.3g and 30 Hz was found to increase femur vBMDt by 30% in adult female sheep
(Rubin et al., 2002b; Rubin et al., 2002a). In contrast, some believe that intermittent WBV may
be more beneficial for promoting musculoskeletal adaptations in humans (Totosy de Zepetnek
et al., 2009), since prolonged muscle vibration was previously found to reduce motor output
during muscular contraction (Bongiovanni et al., 1990). However, it was recently proposed that
although potential osteogenic effects of high-magnitude WBV may involve skeletal muscles
activation, this is probably not the case with low-magnitude WBV (Judex & Rubin, 2010).
Instead, low-magnitude WBV was hypothesized to exert osteogenic effects by direct ‘shaking’
of the bones leading to bone fluid-flow changes and mechanotransduction of mechanical
stimuli potentially by the osteocytes (Judex & Rubin, 2010). As such, low-magnitude WBV is
believed to mimic mechanical signals that would normally arise within the skeleton from slow-
twitch postural muscles contractions, especially in older adults who experience sarcopenia and
reduced skeletal muscles activity (Ozcivici et al., 2010). Further, compared to high-magnitude,
low-magnitude WBV can be safely tolerated for up to several hours, according to the
International Standardization Organization guidelines for WBV exposure in industrial settings
(ISO 2631) (Griffin, 1998; Rubin et al., 2004).

105
Several limitations existed in our trial. First, median adherence to WBV ranged between
65-79%, depending on the estimate used, and mean cumulative duration of WBV was 4700
minutes versus prescribed 7300 minutes. When low-magnitude WBV was previously prescribed
to postmenopausal women for 12-months twice a day for 10 continuous minutes, no effect of
WBV on aBMD was found and adherence was also low; 37% of participants were ≥80%
adherent (Rubin et al., 2004). Thus, in order to improve adherence in our trial, we combined
two daily 10-minute sessions into one 20-minute session, and we monitored adherence at 6-
months to provide feedback to our participants. In RCTs of children and adolescents, significant
effect of low-magnitude WBV was found on vBMD even with mean cumulative duration of 600-
2100 minutes (Gilsanz et al., 2006; Ward et al., 2004), while in RCTs of postmenopausal women,
significant effect of high-magnitude WBV was found on aBMD even with mean cumulative
duration of 500-1000 minutes (Gusi et al., 2006; Verschueren et al., 2004). Also, our ≥80%
adherent subgroups included approximately 100 participants, which is more than the total
sample sizes of previous RCTs examining WBV effects on bone in postmenopausal women
(Slatkovska et al., 2010a). Second, due to feasibility, WBV was administered at home, thus
beyond us providing instructions at baseline and reinforcing them at 6 months, participants
were not supervised during WBV. For example, some participants performed more than one
daily WBV session on some days, as if trying to catch up. Also, whether or not instructions
regarding proper posture during WBV were followed is not known. However, at-home
administration may in some ways better represent real-life use of WBV. Third, double-blinding
was not possible, because due to limited funding sham WBV, a platform producing audible
sound, was not provided to our controls. However, sham versus true WBV are somewhat

106
discernable from one another, as 70% of controls receiving sham WBV correctly guessed their
group assignment in a previous RCT of postmenopausal women (Rubin et al., 2004). Thus, we
ensured that HR-pQCT and DXA outcome assessors were blinded to group assignment in our
trial.
To conclude, in our population of healthy community-dwelling osteopenic
postmenopausal women, 12 months of low-magnitude (0.3g) WBV at 90 or 30 Hz did not
influence vBMD and bone structure parameters at the distal tibia or distal radius as measured
by HR-pQCT or aBMD at the femoral neck, total hip or lumbar spine as measured by DXA.
Future RCTs should investigate effects of this WBV therapy in other study populations.

107
CHAPTER THREE: EFFECTS OF WHOLE-BODY VIBRATION ON CALCANEAL QUANTITATIVE
ULTRASOUND PARAMETERS IN OSTEOPENIC POSTMENOPAUSAL WOMEN: A RANDOMIZED
CONTROLLED TRIAL (THE VIBRATION STUDY)
Being submitted for publication in a peer-reviewed journal:
Slatkovska L, Alibhai S, Beyene J, Queenie Wong, Cheung AM. (2010). Effects of Whole-Body
Vibration on Calcaneal Quantitative Ultrasound Parameters in Osteopenic Postmenopausal
Women: A Randomized Controlled Trial (The Vibration Study).

108
ABSTRACT
Objective and context: Although recent data suggest that whole-body vibration (WBV)
may have beneficial effect on bone, calcaneal quantitative ultrasound (QUS) parameters have
not been examined. Since WBV enters the body through the plantar foot surface, calcaneus
may respond more to WBV than other skeletal sites. Thus, we examined WBV effect on
calcaneal QUS parameters.
Design, participants and interventions: A 12-month randomized controlled trial was
conducted with calcaneal QUS outcomes as secondary endpoints. Participants were 202
postmenopausal women with primary not on bone medications, randomized to one of three
groups: 90Hz, receiving 90 Hz WBV at 0.3g (n=67); 30Hz, receiving 30 Hz WBV at 0.3g (n=68); or
CON, controls not receiving WBV (n=67). Participants in the 90Hz and 30Hz groups were asked
to stand on a WBV platform for 20 minutes a day and all participants were provided with daily
calcium and vitamin D supplements for 12 months.
Quantitative ultrasound outcomes: At baseline and 12 months, broadband attenuation
(BUA), speed of sound (SOS) and QUS index (QUI) were obtained at the calcaneus using the
Sahara Clinical Bone Sonometer (Hologic). Between-group differences in absolute 12-month
change in SOS, BUA and QUI were examined using one-way ANOVA with a priori contrasts. A

109
priori specified ≥80% adherent, <65 kg in mass, ≤60 years-old or ≤10 years since menopause
subgroups were also examined.
Results: Between-group differences in BUA change were found to be statistically
significant (p<0.05) using the intention-to-treat analysis (ITT) analysis, due to a decrease in 90Hz
(-0.4 dB·MHz-1) and 30Hz (-0.7 dB·MHz-1) groups and an increase in controls (1.3 dB·MHz-1).
Significant BUA decrease in 30Hz versus CON group was found using ITT (n=202) and per-
protocol (n=175) approaches, while significant decrease in 90Hz versus CON group was found in
≥80% adherent and <65 kg subgroups. BUA decrease was not significantly different between
90Hz and 30Hz groups in any analysis. No significant between-group differences in SOS or QUI
changes were found.
Conclusions: WBV may reduce BUA in osteopenic postmenopausal women. However,
the observed negative effect was small and likely not clinically significant. Since this was the
first study to examine effects of WBV on calcaneal QUS parameters, future studies are needed
to confirm our findings.
Trial Registration: ClinicalTrials.gov (#NCT00420940).
Keywords: whole-body vibration, menopause, quantitative ultrasound, broadband attenuation,
calcaneus

110
INTRODUCTION
The potential role of whole-body vibration (WBV) in preventing postmenopausal bone
loss was previously examined (Slatkovska et al., 2010a). Small bone mineral density (BMD)
improvements were found at the hip in some randomized controlled trials (RCTs) of WBV (Gusi
et al., 2006; Verschueren et al., 2004), but not at the lumbar spine or distal tibia (Gusi et al.,
2006; Iwamoto et al., 2005; Rubin et al., 2004; Russo et al., 2003; Verschueren et al., 2004).
Potential reasons for conflicting results include small sample sizes (<100), lack of calcium and
vitamin D supplementation, and heterogeneity between WBV therapies (Slatkovska et al.,
2010a).
WBV involves standing on an oscillating platform, which transmits mechanical waves
from the plantar feet surface to the weight-bearing muscles and bones (Kiiski et al., 2008; Rubin
et al., 2003), and is believed to stimulate bone cells via bone fluid flow changes directly or
indirectly by skeletal muscles activation (Judex & Rubin, 2010; Ozcivici et al., 2010). Intensity of
WBV is determined by its magnitude and frequency. Magnitude or peak acceleration refers to
how powerful the oscillations are, and is generally expressed in units of acceleration due to
gravity (1g, gravitational constant 9.8 m·s-2), while frequency refers to the speed of oscillations
(1 Hz, one oscillation per second). Higher WBV magnitudes may exert stronger effects on bone
(Wolff, 1986; Frost, 1998), but can also be harmful to the body (Griffin, 1998; Griffin & Mills,

111
2002b; Wolff, 1986; Mansfield, 2005; Seidel & Heide, 1986). Osteogenic effects of WBV may be
frequency-dependent, with greater effects occurring at higher frequencies (Judex et al., 2007;
Ward et al., 2004), but specific frequency range has not been determined in humans
(Slatkovska et al., 2010a). It is also plausible that matching WBV to bone’s resonance frequency
range (for example, ulna, 70-110 Hz; tibia at 21-38Hz (Bediz et al., 2010; Ozdurak et al., 2006))
could prove to be more efficacious, since resonance involves amplification of even small-
magnitude vibrations within a system (Randall et al., 1997). However, long-term exposures to
vibration in industrial settings have been linked to various deleterious effects due to resonance
of the stomach (4-5 Hz), spinal column (3-5 Hz), hands (30-40 Hz), or fingers (125-300 Hz)
(Griffin, 1998; Mansfield, 2005; Miwa, 1988; Randall et al., 1997).
Many WBV platforms exist world-wide and can be classified into high- (≥1g) and low-
magnitude (<1g) WBV, both of which have been previously examined in postmenopausal
women (Gusi et al., 2006; Iwamoto et al., 2005; Rubin et al., 2004; Russo et al., 2003;
Verschueren et al., 2004). High-magnitude WBV (≥1g) was administered at 12 to 40 Hz in short
bursts (1 to 4 min) per session (4 to 20 min) one to three times a week in a supervised setting
(Gusi et al., 2006; Iwamoto et al., 2005; Russo et al., 2003; Verschueren et al., 2004). Although
no improvements were found in lumbar spine or distal tibia BMD (Gusi et al., 2006; Iwamoto et
al., 2005; Russo et al., 2003; Verschueren et al., 2004), small increases in hip BMD were
observed in two small trials (n=33 to 89) with short follow-up (6 to 8 months) (Gusi et al., 2006;

112
Verschueren et al., 2004). Only one RCT examined low-magnitude (<1g) WBV in
postmenopausal women (n=70) administered at 0.3g and 30 Hz for 10 minutes twice a day at
home (Rubin et al., 2004). No effects were found on hip or lumbar spine BMD after 12-months,
except in the ≥80% adherent and <65 kg subgroup (Rubin et al., 2004). However, only 37% of
women in this trial were ≥80% adherent (Rubin et al., 2004). At 0.3g and 90 or 30 Hz, low-
magnitude WBV was found to increase BMD at the lumbar spine and proximal tibia when
administered to children and adolescents for 10 minutes a day 5-7 days a week, in spite of 43-
58% adherence (Gilsanz et al., 2006; Ward et al., 2004).
Previous RCTs of WBV in postmenopausal women examined areal BMD (aBMD) at
central sites as measured by dual-energy x-ray absorptiometry (DXA) (Gusi et al., 2006;
Iwamoto et al., 2005; Rubin et al., 2004; Verschueren et al., 2004), and volumetric BMD (vBMD)
at the tibia as measured by high-resolution peripheral quantitative tomography (HR-pQCT)
(Russo et al., 2003). To our knowledge, no previous clinical studies or experimental animal
models examined WBV effects on bone using quantitative ultrasound (QUS) parameters (Prisby
et al., 2008; Slatkovska et al., 2010a). QUS measurements collect different information about
bone material properties than bone densitometry tools. In a recent large prospective study,
QUS parameters were found to predict fracture incidence among the elderly at least as well as
and independent of DXA; a 1 SD decrease in DXA-aBMD and QUS-BUA was associated with a
2.26 and 2.04 increased risk for fracture, respectively (Moayyeri et al., 2009). QUS measures the

113
broadband attenuation (BUA) and speed of sound (SOS) of ultrasound waves, which pass
through the calcaneus and become altered due to bone material properties (Guglielmi et al.,
2010; Krieg et al., 2008). While BUA and SOS have been found to be primarily related to bone
hydroxyapatite crystal status or BMD (Nicholson et al., 2001; Wu et al., 1998), they may also
reflect bone trabecular microarchitecture (Njeh et al., 2001), particularly BUA (Lin et al., 2009;
Sasso et al., 2008; Wu et al., 1998). A composite score of BUA and SOS, termed quantitative
ultrasound index (QUI), has also been obtained in research (Guglielmi et al., 2010; Krieg et al.,
2008; Hans et al., 1996). QUS measurements at the calcaneus may be useful for evaluating
efficacy of WBV, because it is likely that this site receives more intense WBV stimulus prior to it
becoming dissipated by lower-limb joints and soft tissue (Kiiski et al., 2008; Rubin et al., 2003).
Further, calcaneus is almost entirely made up of trabecular bone, which compared to cortical
bone is more metabolically active and responds faster to treatment (Rubin et al., 2002a;
Guglielmi et al., 2010).
Thus, as part of a 12-month RCT of 202 osteopenic postmenopausal women (The Vibration
Study), we examined effects of daily 20-minute WBV at 0.3g and 90 Hz versus 0.3g and 30 Hz
versus no WBV on calcaneal QUS parameters as pre-specified secondary outcomes.

114
METHODS
Participants and study design
This 12-month RCT examined WBV effects on HR-pQCT, DXA and QUS bone parameters
and was conducted at the University Health Network (UHN) in Toronto Canada from November
2006 to December 2009; HR-pQCT and DXA bone outcomes were published elsewhere
(Slatkovska et al., 2010b). Women were included in this trial if they were postmenopausal (≥1
year after cessation of menses) and osteopenic (lowest aBMD T-score at the lumbar spine,
femoral neck, or total hip between -1.0 and -2.5), and were excluded due to taking medications
affecting bone metabolism, secondary causes for bone loss, and if they could not safely
undergo WBV (see elsewhere for detailed inclusion/exclusion criteria (Slatkovska et al., 2010b)).
Computer-generated block-randomization scheme (n=10) and sealed envelopes were used to
assign eligible participants to the 90 Hz WBV group (90Hz), the 30 Hz group WBV (30Hz) or the
control group (CON). WBV was provided to 90Hz and 30Hz participants, but not to controls.
There was a single QUS outcome assessor (LS), not blinded to the participants’ group
assignment.
Three study visits were conducted as part of this RCT, baseline and 6- and 12-month
follow-up. At baseline and 12-motnhs, calcaneal QUS bone parameters, body mass, body mass
index (BMI), and physical activity levels were obtained. Adherence to WBV was self-reported at

115
6-months and extracted from the WBV platform at 12-months. Calcium and vitamin D intakes
were assessed and supplements were provided at baseline and 6 months. Participants’ medical
records were accessed to obtain recent serum 25-hydroxy vitamin D levels (i.e., obtained during
the study period ±3 months). Health conditions and current medication or other treatments
were self-reported by at each study visit, and participants were also asked to phone us
regarding any health changes that they experienced during stud. This trial was approved by the
UHN research ethics board and informed consent was obtained from all participants.
ClinicalTrials.gov (#NCT00420940) was used for trial registration and funding was provided by
the Ontario Physicians’ Services Incorporated Foundation.
Study interventions
Participants in 90Hz and 30Hz groups were asked to stand on a WBV platform (Dynamic
Motion Therapy 1000™, Juvent Medical Inc, Somerset, NJ) oscillating at 0.3g and 90 and 30 Hz,
respectively, for 20 minutes once a day at home for 12 months. Based on previous RCTs and ISO
2631 guidelines for occupational hazards of WBV, low-magnitude (0.3g) high-frequency (>30
Hz) WBV administered for 20 minutes a day was expected to be safe (Gilsanz et al., 2006;
Griffin, 1998; Rubin et al., 2004; Ward et al., 2004). Each platform was designed to
automatically turn off after 20 minutes of WBV and to record each session date, time and
duration. Since on some days some participants administered WBV for <20 minutes or >1

116
sessions per day, three adherence measures were assessed; based on total cumulative
duration, number of WBV days and full 20-minute treatment count. Sham WBV was not utilized
in controls because sham and true WBV are somewhat discernable from one another (Rubin et
al., 2004), and due to limited funding. Using a recall questionnaire (Hung et al., 2010), dietary
calcium and vitamin D intakes were assessed and so that appropriate supplement dose was
provided to all participants to ensure total (supplements plus diet) daily intakes of 1200 mg and
800 IU.
Outcomes
Calcaneal QUS bone parameters included BUA (dB·MHz-1), SOS (m·s-1) and QUI (0.41 ×
[BUA + SOS] -571), and were measured at the non-dominant using Sahara Clinical Bone
Sonometer (Hologic, Waltham, MA). A single trained outcome assessor, QUS device, and
calibration phantom were used. Calibration was performed on the day of measurement using a
manufacturer-specific phantom, and when acceptable quality control (QC) values could not be
obtained, it was repeated until satisfactory. QC values were recorded over the study duration
and their mean, range and standard deviations (SDs) were compared with manufacturer
specifications to assess device stability over time (Hologic Inc, 1998). During QUS measurement,
each participant sat still in a chair with her foot placed in an indicated area on the device, so
that her knee angle was at 90 degrees and her heel and toes were positioned at the same mark

117
each time. If BUA, SOS and QUI values were indicated as invalid by the QUS device,
measurement was repeated up to three times. The root mean square coefficient of variation
(RMS-CV) for short-term reproducibility in our laboratory for calcaneal BUA measurements
were 3.0-4.5%, which translates to least significant change of 12.5% (LSC, 2.77 x RMS-CV). RMS-
CVs obtained in our laboratory are comparable to previous investigations using the same device
(mean: 4.1%; range: 2.7-5.0%) (Krieg et al., 2008). Two sources of error were identified, due to
which QUS outcomes were excluded from the analysis: 1) unsuccessful calibration on the day of
measurement and 2) invalid measurement due to ankle edema or after three attempts as
indicated by the device (Krieg et al., 2008).
Adverse events (AEs), any untoward effects with an onset after baseline or worsening of
pre-existing health conditions, were reported using the National Cancer Institute’s Common
Terminology Criteria for AEs v3.0 (National Cancer Institute, 2006)). Daily physical activity
metabolic index (AMI, kcal/day) was obtained using the Minnesota Leisure-Time Physical
Activity Questionnaire (Wilson, 1997).
Statistical analyses
Baseline characteristics were compared between groups using one-way ANOVA and X2
statistics. Between-group differences in absolute 12-month change (final – baseline) in BUA,
SOS and QUI were assessed using one-way ANOVA with contrasts specified a priori; all pair-wise

118
(90Hz versus CON, 30Hz versus CON, and 90 Hz versus 30 Hz) and 90Hz plus 30Hz versus CON
group comparisons were made. An intention-to-treat (ITT) approach was used, in which all
randomized participants were included, and missing or compromised QUS outcomes were
imputed using single imputation from group means; in other words, for each participant with a
missing bone outcome, the mean value of that bone outcome for the study group to which they
belonged was used in place of the missing value. Multiple imputation models were used to
assess the robustness of estimating missing data with single imputations (Rubin, 1996). A per-
protocol approach was also used, from which missing or compromised QUS outcomes and
participants who started hormone replacement therapy (HRT) during study were excluded. A
priori-specified ≥80% adherent (based on all three adherence estimates), <65 kg in mass, ≤60
years-old or ≤10 years since menopause subgroups were examined. Women with smaller soft
tissue mass (<65 kg) were expected to experience less dissipated WBV stimulus (Rubin et al.,
2004), while younger postmenopausal women were expected to respond more due to faster
bone remodelling (Reid, 2006). To examine whether between-group differences in QUS
outcomes were influenced by baseline physical activity levels or vitamin D levels, ANCOVA with
contrasts was performed. We additionally excluded participants with potentially compromised
study conduct (for example, wore shoes during WBV) as part of our sensitivity analyses. AEs
were compared between groups using Fisher’s Exact test. Sample size calculations were based
on our primary outcome, HR-pQCT volumetric trabecular BMD at the distal tibia, as reported

119
elsewhere (Slatkovska et al., 2010b). All analyses were conducted using SAS Version 9.2 (see
Technical Appendix for SAS codes) at p≤0.05.
RESULTS
Participant characteristics
Participants were the same osteopenic postmenopausal women as those included in our
analysis of HR-pQCT and DXA bone outcomes (Figure 1; 90Hz, n=67; 30Hz, n=68; CON, n=67)
(Slatkovska et al., 2010b). Baseline characteristics were similar between groups (Table 1). No
significant between-group differences in 12-month changes in HR-pQCT or DXA parameters,
calcium or vitamin D intakes, body mass or physical activity levels were found (Slatkovska et al.,
2010b). Mean serum 25-hydroxy vitamin D levels were also similar between groups (90Hz, 94
nmol/L, 30Hz, 94 nmol/L; CON, 90 nmol/L). Median adherences to WBV based on cumulative
duration, number of days and full-treatment count were 79%‚ 70% and 78% (mean: 65%, 58%
and 64%) in 90Hz and 77%‚ 65% and 77% (mean: 66%, 60% and 65%) in 30Hz groups. QUS
outcomes were missing or compromised in 27 participants due to drop-out (n=7), unattained
final measurement (n=4), unsuccessful calibration (n=7), invalid measurement (n=7) or taking
HRT during study (n=2).

Abbr
evia
tions
: RCT
, ran
dom
ized
cont
rolle
d tr
ial;
HR-p
QCT
, hi
gh re
solu
tion
perip
hera
l qua
ntita
tive
com
pute
d to
mog
raph
y; D
XA, d
ual-e
nerg
y x-
ray
abso
rptio
met
ry; Q
US,
qua
ntita
tive
ultr
asou
nd.
90 H
z WBV
Gro
up67
Allo
cate
d to
and
rece
ived
90
Hz W
BV
Co
ntro
l Gro
up67
Allo
cate
d to
and
rece
ived
no
WBV
2 L
ost t
o fo
llow
-up
1 lo
st in
tere
st, 1
life
circ
umst
ance
s6
QU
S M
easu
rem
ent i
ssue
s3
unca
libra
ted,
3 u
natt
aine
d
202
Rand
omize
d in
the
mai
n RC
T of
HR
-pQ
CT a
nd D
XA b
one
outc
omes
30 H
z WBV
Gro
up68
Allo
cate
d to
and
rece
ived
30
Hz W
BV
67 In
clud
ed in
QU
S in
tent
ion-
to-t
reat
ana
lysis
57 In
clud
ed in
QU
S pe
r-pr
otoc
ol a
naly
sis10
Exc
lude
d: 2
Los
t to
follo
w-u
p 7
mea
sure
men
t iss
ues
1 st
arte
d HR
T
67 In
clud
ed in
QU
S in
tent
ion-
to-t
reat
ana
lysis
58 In
clud
ed in
QU
S pe
r-pr
otoc
ol a
naly
sis9
Excl
uded
: 2 L
ost t
o fo
llow
-up
6 m
easu
rem
ent i
ssue
s1
star
ted
HRT
68 In
clud
ed in
QU
S in
tent
ion-
to-t
reat
ana
lysis
60 In
clud
ed in
QU
S pe
r-pr
otoc
ol a
naly
sis8
Excl
uded
: 3 L
ost t
o fo
llow
-up
5 m
easu
rem
ent i
ssue
s
3 Lo
st to
follo
w-u
p 1
lost
inte
rest
, 1 m
oved
, 1 li
fe c
ircum
stan
ces
5 Q
US
Mea
sure
men
t iss
ues
1 un
calib
rate
d, 4
inva
lid
2 Lo
st to
follo
w-u
p 2
lost
inte
rest
7 Q
US
Mea
sure
men
t iss
ues
3 un
calib
rate
d, 3
inva
lid, 1
una
ttai
ned
Figu
re 1
. Flo
w d
iagr
am o
f par
ticip
ants
’ pro
gres
s thr
ough
the
anal
ysis
of q
uant
itativ
e ul
tras
ound
par
amet
ers.
Luba
Typewritten Text
120

Table 1. Participants Baseline Characteristics. Baseline Characteristic 90Hz
(n = 67) 30Hz
(n = 68) CON
(n = 67) Ethnicity, n (%) European 55 (82) 48 (70) 54 (81) Southeast Asian 8 (12) 14 (20) 10 (15) Other 4 (6) 6 (9) 3 (4) Age, mean (SD) 60.5 (7.0) 59.6 (6.0) 60.8 (5.5) Years since menopause, mean (SD) 10.2 (8.3) 10.8 (7.3) 10.5 (7.5) Mass (kg), mean (SD) 64.4 (10.6) 62.0 (10.5) 62.4 (9.5) BMI (kg∙m-2), mean (SD) 24.9 (4.0) 24.5 (3.6) 24.2 (3.4) Calcium intakes (mg), mean (SD) 1538 (677) 1399 (656) 1352 (642) Vitamin D intakes (IU), mean (SD) 866 (582) 778 (583) 808 (584) Physical activity AMI (kcal/day), mean (SD) 352 (224) 337 (237) 383 (277) QUS calcaneus measurements, mean (SD)* BUA (dB∙MHz-1) 72.2 (13.0) 75.4 (14.7) 72.0 (12.9) SOS (m∙s-1) 1538.0 (28.3) 1542.7 (23.9) 1538.6 (23.5) QUI 89.2 (16.3) 92.4 (14.8) 89.3 (14.4) DXA areal BMD measurements, mean (SD) Femoral neck (g∙cm-2) 0.686 (0.049) 0.676 (0.060) 0.687 (0.054) Total hip (g∙cm-2) 0.851 (0.066) 0.836 (0.083) 0.845 (0.068) Spine L1 to L4 (g∙cm-2) 0.904 (0.090) 0.890 (0.069) 0.902 (0.080) Abbreviations: 90Hz, 90 Hz group; 30Hz, 30 Hz group; CON, controls; SD, standard deviation; BMI, body mass index; AMI, daily activity metabolic index as estimated by validated Minnesota Leisure-Time Physical Activity Questionnaire; QUS, quantitative ultrasound; SOS, speed of sound; BUA, broadband attenuation; QUI, quantitative ultrasound index; BMD, bone mineral density; DXA, dual-energy x-ray absorptiometry; *Baseline analysis of QUS parameters (n=196) was incomplete due to uncalibrated or invalid baseline measurements.
Luba
Typewritten Text
121

122
Calcaneus QUS outcomes
QC values for our QUS device obtained during the study period and their mean and SD
corresponded with ranges specified by the manufacturer (see the Technical Appendix for QUS
calibration log). ITT analysis revealed statistically significant between-group differences in BUA
change due to decreases in 90Hz (-0.4 dB·MHz-1) and 30Hz (-0.7 dB·MHz-1) groups and an
increase in controls (1.3 dB·MHz-1; p=0.048; Table 2). This WBV effect was small and translated
to percent BUA changes of -0.2% (SD: 8.1%) in 90Hz, -0.6% (SD: 7.2%) in 30Hz and 2.0% (SD:
6.9%) in controls in per-protocol analysis. Significant between-group differences in BUA change
were also found in ≥80% adherent based on cumulative duration and full-treatment count and
<65 kg subgroups (Figure 2a,b,d), but not in ≥80% adherent based on number of days, ≤60 year-
old or ≤10 years after menopause subgroups (Figure 2c,e,f). In the ITT and per-protocol
analyses of BUA change, 30Hz versus CON and 90Hz plus 30Hz versus CON contrasts were
significant, while in the ≥80% adherent based on cumulative duration and full-treatment count
and <65 kg subgroups, 90Hz versus CON and 90Hz plus 30Hz versus CON comparisons were
significant. BUA change in 90Hz and 30Hz groups was not found to be statistically different in
any of our analyses. When we adjusted for baseline physical activity levels or vitamin D levels
and when we excluded participants with potentially compromised study

Table 2. Absolute 12-Month Change in Quantitative Ultrasound Parameters. Quantitative Ultrasound Parameters
N 90Hz 30Hz CON One-way ANOVA
p BUA, mean (SD) Intention-to-treat (dB∙MHz-1) 202 -0.4 (5.5) -0.7 (5.7)* 1.3 (4.5)** <0.05 Per-protocol (dB∙MHz-1) 175 -0.4 (5.9) -0.7 (6.0)* 1.3 (4.8)** 0.11 SOS, mean (SD) Intention-to-treat (m∙s-1) 202 -1.7 (10.3) -1.7 (8.7) -0.4 (7.9) 0.66 Per-protocol (m∙s-1) 175 -1.6 (11.1) -1.7 (9.2) -0.4 (8.6) 0.73 QUI, mean (SD) Intention-to-treat 202 -0.9 (5.6) -1.0 (4.9) 0.4 (4.5) 0.24 Per-protocol 175 -0.8 (6.1) -1.0 (5.2) 0.4 (4.9) 0.34 Abbreviations: 90Hz, 90 Hz WBV group; 30Hz, 30 Hz WBV group; CON, control group, SD, standard deviation; SOS, speed of sound; BUA, broadband attenuation; QUI, quantitative ultrasound index. *Significant 30Hz versus CON comparison p<0.05. **Significant 90Hz plus 30Hz versus CON comparison p<0.05.
Luba
Typewritten Text
123

Blac
k -9
0Hz (
90 H
z WBV
gro
up),
Grey
-30
Hz (3
0Hz W
BV g
roup
), W
hite
-CO
N.
A) ≥
80%
adh
eren
t par
ticip
ants
, bas
ed o
n to
tal c
umul
ativ
e W
BV d
urat
ion
(90H
z, n
=29;
30H
z, n
=27;
CO
N, n
=57)
. B) ≥
80%
adh
eren
t par
ticip
ants
, bas
ed o
n to
tal n
umbe
r of
full
WBV
trea
tmen
ts (9
0Hz,
n=2
9; 3
0Hz,
n=2
6; C
ON
, n=5
7) C
) ≥80
% a
dher
ent p
artic
ipan
ts, b
ased
on
tota
l num
ber o
f WBV
day
s (90
Hz,n
=18;
30H
z, n
=17;
CO
N, n
=57)
. D)
<65
kg (9
0Hz,
n=3
3 30
Hz, n
=42;
CO
N, n
=35)
. E) ≤
60 y
ears
old
(90H
z, n
=27
30Hz
, n=3
5; C
ON
, n=2
5). F
) ≤10
yea
rs a
fter
men
opau
se (9
0Hz,
n=3
6 30
Hz, n
=35;
CO
N, n
=37)
.
Figu
re 2
.Sub
grou
p An
alys
es.
-0.7
1.3
-1.3
-2
-1.5-1
-0.50
0.51
1.52
BUA change (dB/MHz)
90Hz
vs. 3
0Hz v
s. C
ON:
p<0.
0590
Hz vs
. CON
:
p<0.
0530
Hz vs
. CON
:
p=0.
0790
Hz +
30Hz
vs. C
ON:
p<
0.05
-1.1
0.4
1.3
-2
-1.5-1
-0.50
0.51
1.52
BUA change (dB/MHz)
90Hz
vs. 3
0Hz v
s. CO
N:
p=
0.15
90Hz
vs. C
ON:
p
=0.0
630
Hz vs
. CON
:
p=0
.47
90Hz
+ 30
Hz vs
. CON
:
p=
0.10
-1.3
-0.7
1.3
-2
-1.5-1
-0.50
0.51
1.52
BUA change (dB/MHz)
90Hz
vs. 3
0Hz v
s.CO
N:
p<0
.05
90Hz
vs. C
ON:
p
<0.0
530
Hz vs
. CON
:
p=0
.07
90Hz
+ 30
Hz vs
. CON
:
p<0
.05
0.1
1.7
-1.4
-2
-1.5-1
-0.50
0.51
1.52
BUA change (dB/MHz)
90Hz
vs. 3
0Hz v
s. C
ON:
p<0
.05
90Hz
vs. C
ON:
p
<0.0
130
Hz vs
. CON
:
p=0
.16
90Hz
+ 30
Hz vs
. CON
:
p<0
.05
-0.8
-0.9
1.2
-2
-1.5-1
-0.50
0.51
1.52
BUA change (dB/MHz)
90Hz
vs. 3
0Hz v
s. C
ON:
p
=0.2
490
Hz vs
. CON
:
p
=0.1
430
Hz vs
. CON
:
p
=0.1
290
Hz +
30Hz
vs. C
ON:
p=0.
08
-1.3
-0.8
1.0
-2
-1.5-1
-0.50
0.51
1.52
BUA change (dB/MHz)
90Hz
vs. 3
0Hz v
s. C
ON:
p=0
.26
90Hz
vs. C
ON:
p
=0.1
230
Hz vs
. CON
:
p=0
.20
90Hz
+ 30
Hz vs
. CON
:
p=0
.11
AB
C
DE
F
Luba
Typewritten Text
124

125
conduct (n=16) our results remained similar as in our per-protocol analysis. Various multiple
imputation models were used (Rubin, 1996), which produced similar BUA results as our ITT
analysis based on single imputations from group means (see the Technical appendix for
additional results). No significant between-group differences in SOS change were observed in
any analyses. QUI change was significant in 90Hz versus CON group comparison in <65 kg
subgroup (90Hz, -1.8 versus CON, 0.7; p=0.041) due to the BUA component.
Adverse events
AEs and serious adverse events were similar between groups, as reported elsewhere
(Slatkovska et al., 2010b). However, various foot AEs were self-reported by 90Hz and 30Hz
participants, and were assessed here qualitatively. One 30Hz participant developed chronic
plantar foot pain and refused to administer WBV after seven weeks of use (14% adherent). The
pain was exacerbated during WBV, disappeared when WBV was stopped for two weeks, and
returned within two weeks after it was re-introduced. Two 90Hz participants also developed
chronic plantar foot pain potentially related to WBV – one limited WBV use (22% adherent) and
another wore shoes during WBV (83% adherent). Other participants reported minor transient
foot pain or numbness (2 in 90Hz, 2 in 30Hz) and toe cramps or loss in sensation (2 in 90Hz)
lasting briefly during or just after WBV. When lower-limb AEs (90Hz, n=27; 30Hz, n=20; CON,

126
n=19) or plantar foot pain (90Hz, n=5; 30Hz, n=2; CON, n=1) were compared quantitatively, no
significant between-group differences were found.
COMMENT
After 12 months of WBV, we found a statistically significant decrease in BUA in 90Hz and
30Hz participants compared to controls. These findings were unexpected, as prior RCTs in
postmenopausal women either showed no bone changes (Iwamoto et al., 2005; Rubin et al.,
2004; Russo et al., 2003; Slatkovska et al., 2010b) or small improvements in hip aBMD (Gusi et
al., 2006; Verschueren et al., 2004) in response to WBV. However, no previous clinical studies
or experimental models obtained QUS bone measurements (Prisby et al., 2008; Slatkovska et
al., 2010a).
Although the negative effect in BUA was small in this RCT, our results were not likely
due to chance or measurement error. First, consistent decreases were observed in 90Hz and
30Hz groups in various analyses. Also, since 13% of QUS outcomes were lost due to
measurement issues (lack of calibration and invalid measurement) and unattained
measurements (drop-out and refused), ITT analysis was performed with single and multiple
imputations to confirm our per-protocol BUA results. Finally, we also ensured that our QC
procedures were according to prior recommendations (Krieg et al., 2008) and the same across
all measurements. A single QUS outcome assessor, device and phantom were used, foot

127
positioning was standardized, and our QC values were found to be stable over time and within
the manufacturer-specified range (Hologic Inc, 1998).
However, whether these findings represent real bone changes requires further
investigation. Potential variations in heel soft tissue properties over time, including thickness,
fat content and skin temperature, can influence ultrasound propagation through the calcaneus
(Krieg et al., 2008; Lewiecki et al., 2006). Currently, no accepted standards exist as to how to
control for these sources of error (Krieg et al., 2008; Krieg et al., 2008). Mild symptoms
probably involving the feet soft tissue were qualitatively observed in 90Hz and 30Hz groups (for
example, plantar heel pain, foot numbness). In occupational settings like construction or
mining, prolonged exposures to WBV through the feet were also found to result in
musculoskeletal and vascular damage, such as Raynaud’s and vibration-white foot syndromes
(Sakakibara et al., 1991; Thompson et al., 2010; Miwa, 1988). However, variations in heel soft
tissue properties were previously shown to significantly alter calcaneal SOS but not BUA
measurements (Chappard et al., 2000; Ikeda & Iki, 2004; Kotzki et al., 1994). Further, the
recommended follow-up duration for assessing real bone changes with calcaneal QUS in
response to anti-osteoporotic therapy is currently more than 12 months (Krieg et al., 2008;
Lewiecki et al., 2006), primarily because peripheral sites are believed to respond slower to
pharmacological treatments (Krieg et al., 2008; Lewiecki et al., 2006). However, the study of
WBV effects on the calcaneus may represent a special clinical situation where less time is

128
possibly adequate to show changes in the bone tissue, because the physical stimulus is applied
directly to the calcaneus.
If the reductions in BUA observed in this trial reflects real bone changes, the effect we
found was small and likely clinically insignificant. BUA decreased only by -0.2% and -0.6% in
90Hz and 30Hz groups, respectively, and increased by 2% in controls. A prior prospective study,
which used the same QUS device to monitor calcium and vitamin D effects in postmenopausal
women, found BUA increase of 0.9% in controls and 2.0% in participants receiving calcium and
vitamin D, but observed no statistically significant between-group differences (Moschonis &
Manios, 2006). Since all participants received calcium and vitamin D supplements in this RCT,
the 2% increase in BUA observed in our control group may have reflected this. The overall
treatment effects for BUA, defined as the difference in the mean BUA changes between
controls and 90Hz/30Hz groups, were -2.2/-2.6% and -1.7/-2.0 dB·MHz-1, respectively. This was
smaller in magnitude than the LSC for BUA of obtained in our laboratory (LSC = 2.77 x RMS-CV =
2.77 x 4.5% = 12.5%). In a Swiss study using the same QUS device (Sahara, Hologic), the
difference in mean BUA between healthy postmenopausal women aged 65-87 years (n=38,
BUA: 61.2 db·MHz-1) and young women aged 20-40 years (n=47, BUA: 77.5 db·MHz-1) was -16.3
db·MHz-1 (-26.6%) (Hans et al., 2003). Further, when DXA and HR-pQCT bone changes were
examined in this RCT, no statistically significant between-group differences were observed for
aBMD at the lumbar spine, femoral neck or total hip or for vBMD or bone structure at the distal

129
tibia or distal radius (Slatkovska et al., 2010b). Therefore, any potential negative bone tissue
effects in response to WBV, as reflected in BUA decline in 90Hz and 30Hz participants, probably
represented changes at the calcaneus and not at other central or skeletal sites that we assessed
(Slatkovska et al., 2010b).
A plausible mechanism that could explain calcaneal BUA decrease in response to WBV in
osteopenic postmenopausal women may involve changes in the calcaneus microstructure due
to high-rate compressive loads applied repeatedly over time. Although BUA and SOS have been
primarily correlated with aBMD (Nicholson et al., 2001; Wu et al., 1998), BUA has also been
hypothesized to reflect bone microarchitecture characteristics (Njeh et al., 2001; Lin et al.,
2009; Sasso et al., 2008; Wu et al., 1998). Since SOS was similar between-groups while BUA
significantly differed, changes in trabecular microarchitecture rather than BMD may have
occurred in response to WBV. Each time the WBV platform accelerates upwards, it presses
against the heel, thus creating strains within the calcaneus. Even though these compressive
forces were not very high, they occurred 30 or 90 times per second for 20 consecutive minutes,
and their strains perhaps accumulated over time. In a similar way in which a bone fatigue test
can cause a break in a bone specimen, due to application of many low-force loading cycles
(Bouxsein, 2006), low-magnitude vibration applied to the calcaneus could potentially cause
micro-damage of the trabecular microstructure, especially in osteopenic postmenopausal
women who already have weakened trabeculi and accelerated bone resorption (Pacifici, 2001).

130
Structural damage to collagen is also plausible, because vibration was previously shown to
damage connective tissue (Falkenbach et al., 1997; Hedlund, 1989), and collagen reinforces the
bone hydroxyapatite crystal which primarily influences QUS measurements (Wu et al., 1998).
However, further clinical investigations or experimental models are needed to confirm our
findings and provide more information about the potential mechanisms. Future studies should
control for heel soft tissue variations in thickness, composition or temperature, and assess foot
injuries.
In conclusion, WBV at 0.3g and at 90 or 30 Hz may reduce BUA in osteopenic
postmenopausal women, although the observed effect was small, and it is unclear whether it
was due to bone or soft tissue changes. Since this was the first study to examine effects of WBV
on calcaneal QUS parameters, future studies are needed to confirm our findings.

131
DISCUSSION
This thesis examined the effects of WBV on various bone parameters through
systematic evaluation of previous RCTs conducted in postmenopausal women, young adults,
and children and adolescents, as well as by carrying out a 12-month RCT in 202 osteopenic
postmenopausal women investigating effects of WBV at 0.3g and 90 Hz versus 0.3g and 30 Hz
versus controls on DXA, HR-pQCT and QUS bone parameters. The primary objective was to
provide new information to enhance our current understanding of the role of WBV in the
prevention of postmenopausal osteoporosis.
In the systematic review, small improvements in hip aBMD, similar in magnitude to that
of calcium and vitamin D supplementation, were found in postmenopausal women receiving
WBV compared to controls. However, no significant effects of WBV were observed on lumbar
spine aBMD or distal tibia vBMD. In the 12-month RCT, the effects of WBV at 0.3g and 90 Hz
versus 0.3g and 30 Hz versus controls were examined, but no significant improvements were
found in aBMD at the femoral neck, total hip or lumbar spine as measured by DXA, or in vBMD
or bone structure parameters at the distal tibia or distal radius as measured by HR-pQCT.
Finally, the analysis of calcaneal QUS parameters, collected as secondary outcomes in the same
RCT, revealed possible decreases in BUA in 90Hz and 30Hz participants compared to controls.
Eight RCTs were selected for the systematic evaluation of WBV effects on BMD, as
reported in chapter one (Gilsanz et al., 2006; Gusi et al., 2006; Iwamoto et al., 2005; Rubin et

132
al., 2004; Russo et al., 2003; Torvinen et al., 2003; Verschueren et al., 2004; Ward et al., 2004).
Systematic review and a meta-analysis were conducted using pre-specified and standardized
forms for study inclusion/exclusion, quality assessment and data extraction (see the Technical
Appendix – chapter one: standardized data collection forms). In summary, eligible RCTs were
randomized or quasi-randomized controlled trials with a minimum follow-up of 6 months,
which examined WBV effects on aBMD or vBMD in ambulatory individuals without secondary
causes for osteoporosis. Five eligible RCTs were conducted in postmenopausal women (Gusi et
al., 2006; Iwamoto et al., 2005; Rubin et al., 2004; Russo et al., 2003; Verschueren et al., 2004),
two in children and adolescents (Gilsanz et al., 2006; Ward et al., 2004), and one in young
adults (Torvinen et al., 2003). Mostly high-magnitude WBV was examined in postmenopausal
women between 12 to 40 Hz (Gusi et al., 2006; Iwamoto et al., 2005; Russo et al., 2003;
Verschueren et al., 2004), although one trial administered low-magnitude WBV at 30 Hz (Rubin
et al., 2004). High-magnitude WBV was also assessed in young adults (25-45 Hz) (Torvinen et al.,
2003), while only low-magnitude WBV was examined in children and adolescents (30 and 90
Hz) (Gilsanz et al., 2006; Ward et al., 2004).
From five RCTs conducted in postmenopausal women, four examined effects of WBV on
lumbar spine aBMD (Gusi et al., 2006; Iwamoto et al., 2005; Rubin et al., 2004; Verschueren et
al., 2004). Of these, three RCTs were combined in the analysis of hip aBMD, which included
total hip or femoral neck measurements (Gusi et al., 2006; Rubin et al., 2004; Verschueren et

133
al., 2004). One RCT was not included in the meta-analysis of hip or spine aBMD, because only
vBMD measurements at the distal tibia were collected in this trial (Russo et al., 2003). As
hypothesized, small improvements in hip aBMD were observed in the meta-analysis of
postmenopausal women receiving WBV compared to controls. However, no significant effect
was found on lumbar spine aBMD, even though more participants were included in the spine
(n=181) versus hip (n=131) analysis. This site-specific response to WBV in postmenopausal
women may have been due to different transmission of the vibration signal to the hip versus
spine (Kiiski et al., 2008; Rubin et al., 2003). Propagation of WBV through the weight-bearing
skeleton is a complex phenomenon that depends on many factors, including joint angles,
muscle activity, and vibration frequency and magnitude (Kiiski et al., 2008; Rubin et al., 2003).
When transmissibility of WBV at various magnitudes and frequencies was compared between
the ankle, hip and spine, accelerations were found to be the least attenuated at the ankle, and
the most at the spine (Kiiski et al., 2008). In other words, the further up the weight-bearing
skeleton the vibration signal needs to travel, the more dissipated it becomes. Thus compared to
the hip, the spine may have received insufficient WBV stimulus in this population of
postmenopausal women. Finally, although statistically significant WBV effect was found in the
hip aBMD, the magnitude of this effect was small and not clinically significant.
Two trials in postmenopausal women were not included in the systematic evaluation,
because upon closer inspection it was established that they were not true RCTs (Ruan et al.,
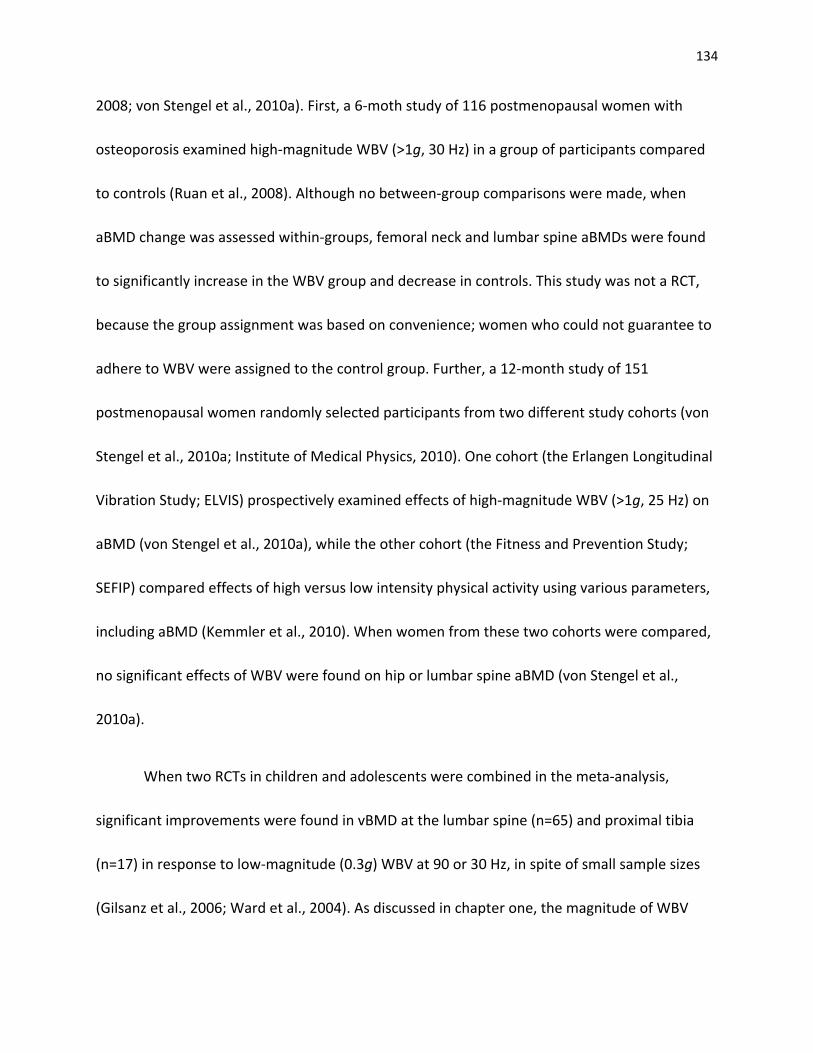
134
2008; von Stengel et al., 2010a). First, a 6-moth study of 116 postmenopausal women with
osteoporosis examined high-magnitude WBV (>1g, 30 Hz) in a group of participants compared
to controls (Ruan et al., 2008). Although no between-group comparisons were made, when
aBMD change was assessed within-groups, femoral neck and lumbar spine aBMDs were found
to significantly increase in the WBV group and decrease in controls. This study was not a RCT,
because the group assignment was based on convenience; women who could not guarantee to
adhere to WBV were assigned to the control group. Further, a 12-month study of 151
postmenopausal women randomly selected participants from two different study cohorts (von
Stengel et al., 2010a; Institute of Medical Physics, 2010). One cohort (the Erlangen Longitudinal
Vibration Study; ELVIS) prospectively examined effects of high-magnitude WBV (>1g, 25 Hz) on
aBMD (von Stengel et al., 2010a), while the other cohort (the Fitness and Prevention Study;
SEFIP) compared effects of high versus low intensity physical activity using various parameters,
including aBMD (Kemmler et al., 2010). When women from these two cohorts were compared,
no significant effects of WBV were found on hip or lumbar spine aBMD (von Stengel et al.,
2010a).
When two RCTs in children and adolescents were combined in the meta-analysis,
significant improvements were found in vBMD at the lumbar spine (n=65) and proximal tibia
(n=17) in response to low-magnitude (0.3g) WBV at 90 or 30 Hz, in spite of small sample sizes
(Gilsanz et al., 2006; Ward et al., 2004). As discussed in chapter one, the magnitude of WBV

135
effect on BMD was found to be approximately the same as that of calcium and vitamin D
supplementation in postmenopausal women, while in children and adolescents it was found to
be slightly greater, in spite of low adherence (44-58%). Therefore, postmenopausal women’s
skeletons may benefit less from the WBV stimulus than children’s and adolescents’. This is
probably because bone remodelling favours bone resorption in postmenopausal women, while
the growing skeleton favours bone formation. Physical activity is also known to cause greater
skeletal improvements in the growing versus ageing skeleton, which has been partly attributed
to children and adolescents having greater potential for bone accrual (Forwood & Burr, 1993;
Shea et al., 2004; Wallace & Cumming, 2000). Only one trial which examined WBV in young
adults was included in the systematic evaluation, but no significant effects were found on BMC
at the spine or hip or on vBMD at the distal tibia (Torvinen et al., 2003).
Several limitations existed in the systematic evaluation of postmenopausal women.
First, eligible RCTs had small sample sizes (n=33 to n=89), and even after they were combined in
the meta-analysis of hip or spine aBMD, less than 200 postmenopausal women were assessed.
Therefore, significant aBMD hip results were particularly influenced by the largest trial of
Verschueren at al. (2004) (n=89). Second, at least one study bias was present in included RCTs.
Except for Iwamoto’s et al. (2005) trial, each trial suffered attrition bias because ITT analysis
was not performed and loss to follow-up was >10%. This was especially true for Verschueren’s
et al. (2004) and Rubin’s et al. (2004) trials, where the loss to follow-up was >20%. Selection

136
bias was also present in most trials, as concealed randomization methods were not utilized.
Most importantly, except for one trial which examined WBV effects on vBMD (Russo et al.,
2003), calcium and vitamin D were not supplemented and their intakes were not reported.
Since observed WBV effect on hip aBMD was similar in magnitude to that of calcium and
vitamin D supplementation, it is possible that it was due to between-group differences in
calcium and vitamin D intakes. Most participants were unblinded to their group assignment,
and thus knew that they were receiving WBV. Even when blinding was performed by
administering sham WBV to controls, at least 70% of participants were aware of their group
assignment (Rubin et al., 2004). Thus, it is possible that compared to controls, participants who
received WBV became more conscious and eager about bone health and experienced higher
calcium and vitamin D intakes. However, it is also possible that participants receiving WBV
became falsely reassured that BMD would increase due to WBV, and thus became less
conscious about their calcium and vitamin D intakes.
When a systematic evaluation relies primarily on small-sampled and biased RCTs, the
search for true treatment effect becomes flawed by the methodological limitations present in
the original study designs (Moher et al., 1999). This situation is sometimes described as
“garbage in, garbage out”, and requires deciphering the overall results with caution. In other
words, the higher the overall methodological quality of RCTs included in the meta-analysis, the
more trustworthy are its findings. Only five RCTs in postmenopausal women with relatively

137
flawed study designs were eligible for this systematic evaluation, and were all included
regardless of their methodological quality. The systematic evaluation of WBV effects on BMD in
postmenopausal women was necessary at this point, because as outlined in the rationale, the
role of WBV in the prevention of postmenopausal osteoporosis is of considerable interest. Since
previous RCTs had small sample sizes, it was important to include as many participants as
possible to obtain reasonable statistical power in the meta-analysis. Without such systematic
evaluation, it would be even more difficult to make clinical decisions and recommendations
about the role of WBV in the prevention of postmenopausal bone loss.
Several important sources of study bias described above were eliminated in this RCT of
WBV effects on various bone parameters in osteopenic postmenopausal women conducted
here; calcium and vitamin D supplements were provided and sample size of 202 was evaluated
using the ITT approach. In contrast to the original hypothesis, no significant effects of low-
magnitude WBV at 0.3g and at 90 or 30 Hz were found on DXA aBMD at the femoral neck, total
hip or lumbar spine or on HR-pQCT vBMD or bone structure parameters at the distal tibia or
distal radius, as reported in chapter two. In Verschueren’s et al. and Gusi’s et al. trials, where
significant improvements in hip aBMD were observed, WBV was administered at high-
magnitudes (≥1g) and frequencies of 13 Hz and 45 Hz, three times a week, and better mean
adherence was achieved (90%) (Gusi et al., 2006; Verschueren et al., 2004). It is possible that
compared to high-magnitude, low-magnitude WBV administered at 0.3g was an insufficient

138
mechanical stimulus to cause bone changes required for increased bone accrual in this
population of postmenopausal women, especially since median adherence obtained here was
only 65-79%. Low-magnitude WBV may cause small changes in bone fluid-flow that may
sometimes become significant enough to increase bone accrual, primarily in populations such
as children and adolescents, whose skeletons are more responsive to physical stimuli than
postmenopausal women’s (Gilsanz et al., 2006; Ward et al., 2004).
However, since this RCT improved on many of the methodological limitations observed
previously, the null effects of WBV on DXA and HR-pQCT bone parameters found here may
simply represent elimination of study bias that was potentially present in Verschueren’s et al.
(2004) and Gusi’s et al. (2006) trials. First, the sample size was much larger (n=202 versus n=36
or n=89) and the study duration was longer (12 months versus 8 or 6 months), thus the results
were probably less likely to be influenced by random variation in bone measurements in this
RCT. Second, ITT analysis was performed and loss to follow-up was smaller (3% versus 22% or
21%), thus reducing the influence of attrition bias on the results obtained here. Third, HR-pQCT
measurements were obtained in addition to DXA to better monitor WBV effects by obtaining
more sensitive measurements (i.e., vBMDt) at potentially more responsive skeletal sites (i.e.,
distal tibia). Finally, as already discussed, adequate calcium and vitamin D intakes were ensured
in all participants regardless of their group assignment. In Russo’s et al. (2003) RCT, where
postmenopausal women were administered high-magnitude WBV at 12 to 28 Hz to (n=36), and

139
adequate calcium and vitamin D supplements provided, no significant effect of WBV on HR-
pQCT vBMDt at the distal tibia was found at mean adherence of 83%.
In spite of methodological improvements that were made in this RCT, several limitations
remained in the investigation of DXA and HR-pQCT parameters. As in most prior RCTs (Gusi et
al., 2006; Iwamoto et al., 2005; Russo et al., 2003; Torvinen et al., 2003; Verschueren et al.,
2004), double-blinding was not possible, because sham WBV was not utilized. However, HR-
pQCT and DXA outcome assessors were blinded in this trial. As well, study group allocation was
concealed here with sealed envelopes, and baseline data collection of calcium and vitamin D
intakes, physical activity levels and general health history was completed prior to
randomization and opening of the sealed envelopes. Although the sample size in this RCT was
larger than in previous investigations of WBV, it was still relatively small with a potential for
type II or false negative error, especially when compared to large RCTs which examined effects
of bone medications on postmenopausal bone loss (Black et al., 2007). However, even if much
larger RCT was performed and statistically significant results were obtained, the magnitude of
WBV effect may have been small and clinically irrelevant, as seen in the meta-analysis of hip
aBMD in postmenopausal women, in chapter two of this thesis. Although large-magnitude
effects of WBV were observed in experimental animal models (for example, 30% increase in
vBMDt in adult sheep) (Rubin et al., 2002b), effects of much smaller magnitudes have been

140
observed thus far in various clinical populations (Gilsanz et al., 2006; Gusi et al., 2006; Rubin et
al., 2004; Verschueren et al., 2004; Ward et al., 2004).
Challenges with adherence to WBV were expected prior to commencing this RCT.
Rubin’s et al. (2004) 12-month trial in community-dwelling postmenopausal women (n=70),
which administered low-magnitude WBV at 0.3g and 30 Hz for 10 minutes twice a day,
observed only 37% of participants being at least 80% adherent. In this trial of community-
dwelling postmenopausal women, 45% of 90Hz participants and 48% of 30Hz participants were
at least 80% adherent based on total cumulative duration. Neither this nor Rubin’s et al. (2004)
trial found overall improvements in aBMD at the hip or lumbar spine, but they reported
significant improvements in aBMD at the lumbar spine when WBV participants were compared
to controls in ≥80% adherent and <65 kg subgroup. However, this subgroup in Rubin’s et al.
(2004) trial included only 10 participants, and since they did not provide calcium and vitamin D
supplements, the subgroup analysis was further biased. In Hannan’s et al. (2004) 6-month trial
of elderly women (79 to 86 years old) living in a retirement community, the mean adherence to
WBV at 0.3g and 30 Hz was 83% (Hannan et al., 2004). Hannan et al. (2004) administered WBV
once a day for 10 minutes, but bone outcomes were not obtained. Therefore, WBV was
administered once a day for 20 consecutive minutes in the RCT conducted as part of this thesis,
because it was expected that a twice-a-day regimen may be too time-demanding for this study
population of community-dwelling postmenopausal women. However, 20 minutes per day

141
were maintained here as in Rubin’s et al. trial, to ensure that adequate and comparable amount
of WBV stimulus was administered. Since adherence to WBV observed in this RCT (~65%)
remained lower than in Hannan’s et al. (2004) trial, factors other than number of daily sessions
probably played a role on participants’ willingness to administer WBV. Hannan’s et al. (2004)
trial was conducted only for 6 months and their adherence to WBV is probably not
representative of the expected adherence after 12 months. Also, their participants were elderly
women living in a retirement community who probably lead less busy lives than community-
dwelling women in this and Rubin’s et al. (2004) trial. Finally, the primary outcome of Hannan’s
et al. (2004) trial was adherence and most of their trial’s resources were probably dedicated to
ensuring good adherence.
Although several adherence and retention strategies were employed in this trial, they
seemed inadequate. One of the strategies utilized here, was to conduct scheduled follow-up
phone calls with participants to assess their performance and provide helpful tips on how to
improve their adherence to WBV. Each platform displayed the number of full 20-minute
treatments completed since baseline, and participants were asked to read this number during
follow-up phone calls. This strategy was terminated after approximately 6 months of data
collection, because participants who were not very adherent avoided these follow-up phone
calls and/or their adherence was not improving. Thus, there was a concern that this strategy
may actually make women less eager about their participation in this trial. Since this adherence

142
strategy was unsuccessful, new ones were put in place. First, all participants attended a 6
month follow-up visit during which calcium and vitamin D intakes were re-assessed and more
supplements were dispensed. During this visit, 90Hz and 30Hz participants were questioned in
detail about how they were doing with WBV and what adherence problems were they
encountering. Encouragement and practical tips were provided, which included: 1) to keep the
WBV platform visible and easily accessible in the house so that a WBV routine can be more
easily established and maintained, 2) to perform other activities while standing on the platform
which would not interfere with the transmission of WBV through the body, including reading
morning newspapers or leisure books, talking on the phone or watching regular TV shows, and
3) even if a daily routine could not be established, participants were encouraged to attempt this
as much as they possibly could. Newsletters which included trial updates, bone health news
and bone-nutrient-rich recipes were also mailed to participants approximately twice a year.
These newsletters were well-received, but it is not clear if they influenced the overall
adherence to WBV. Even though adherence strategies were not very successful in this trial, the
overall adherence observed here may approximate or possibly even overestimate expected
adherence to this WBV therapy in the general population. Women in this trial were probably
systematically different from the general postmenopausal population, because they were self-
motivated and health-conscious enough to seek out participation in this trial. Many of them
were also eager to administer WBV because of its novelty and because it was provided to them
free of charge for 12-months. However, after commencing the trial, many became dissatisfied

143
with the WBV regimen because they found daily schedule and/or 20 consecutive minutes too
tedious and time-consuming, especially those with full-time jobs (see the Technical appendix
chapter two additional results).
Calcaneal QUS parameters were also obtained in this RCT, but were examined and
reported as secondary outcomes in chapter three, separate from DXA and HR-pQCT
parameters. This was done because compared to HR-pQCT and DXA, QUS measurements are
currently not as well accepted in the management of postmenopausal osteoporosis (Krieg et al.,
2008; Lewiecki et al., 2006). In addition, 13% (n=27) of calcaneal QUS data was either missing or
compromised and not included in the analysis. Participants with missing or compromised QUS
outcomes may have been systematically different from the complete cases, and imputations
were thus necessary. The multiple imputations method is generally used as the gold standard
when a significant amount of data is missing (>10%), because it maintains the natural variability
and preserves relationships between variables in the dataset (Rubin, 1996). As a result, more
statistically valid inferences can be made that better reflect the uncertainty due to missing
values than with single imputations from the mean (Rubin, 1996). Thus, in addition to single
imputations based on group means, multiple imputations were performed in the analysis of
QUS parameters to assess the robustness of ITT results based on the single imputations (see the
Technical appendix – chapter three: additional results).

144
In contrast to the hypothesis made at the beginning of this investigation, calcaneal BUA
declined in the 90Hz and 30Hz groups when compared to controls. Between-group differences
in BUA change were statistically significant in the ITT analysis, as well as in the analyses of ≥80%
adherent based on cumulative duration or full-treatment count or <65 kg subgroups. Both 90Hz
and 30Hz groups experienced significant reductions in BUA compared to controls. In the
aforementioned subgroup analyses, decrease in BUA in 90Hz group versus controls was
statistically significant, as well as greater in magnitude and more consistent than in the 30Hz
group. In contrast, decrease in BUA in the 30Hz group versus controls, but not in the 90Hz
group, was statistically significant in the ITT and per-protocol analyses. Finally, whenever the
90Hz versus 30Hz groups were compared, BUA change was not found to be significantly
different in any of the analysis performed. Although controls experienced significant increases
in BUA in this trial, this was may not have been not due to chance but possibly due to calcium
and vitamin D supplementation. In 1-year prospective study of 101 postmenopausal women
without osteoporosis (55-65 years old), similar increase in BUA (2%) was observed in the study
group receiving 1200 mg of calcium and 300 IU of vitamin D, as measured by the same QUS
device (Moschonis & Manios, 2006). However, since all participants here in this RCT were
supplemented with calcium and vitamin D equally, similar increases in BUA as that observed in
controls were also expected in 90Hz and 30Hz groups.

145
Although a statistically significant treatment effect was observed in the analysis of
calcaneal BUA, its magnitude was relatively small and probably not clinically significant. The
magnitude of WBV treatment effect can be estimated by obtaining the difference in mean
absolute 12-month change in BUA between 90Hz participants and controls (90Hz – CON) or
between 30Hz participants and controls (30Hz – CON). In the per-protocol approach, WBV
treatment effect was -1.7 db·MHz-1 (-2.2%) for 90Hz participants and -2.0 db·MHz-1 (-2.6%) for
30 Hz participants. In a prospective study of postmenopausal women with a mean age of 59
years, where the same QUS device was used (Sahara, Hologic), significant 12-month treatment
effect of anti-resortpive bone medications (n=39; BUA mean change: 5.5 db·MHz-1) on calcaneal
BUA was found to be 4.2 db·MHz-1 (7.3%) compared to controls (n=131; BUA mean change: 1.3
db·MHz-1) (Frost, 2001). Further, using the same QUS device (Sahara, Hologic) in a cross-
sectional study of Swiss women, the difference in mean calcaneal BUA between healthy
postmenopausal women aged 65-87 years (n=38; BUA: 61.2 db·MHz-1) and age-matched
women with a recent osteoporotic hip fracture (n=38; BUA: 41.9 db·MHz-1) was 19.3 db·MHz-1
(31.5%) (Hans et al., 2003). In the same Swiss study, the difference in mean BUA between the
same population of healthy postmenopausal women and young women aged 20-40 years
(n=47, BUA: 77.5 db·MHz-1) was -16.3 db·MHz-1 (-26.6%) (Hans et al., 2003).
As reported in chapter three, statistically significant reductions in BUA in 90Hz and 30Hz
groups compared to controls were probably not due to chance, lack of QC procedures or

146
outcome assessor bias. If chance played a significant role then BUA decline would probably not
be as consistent between 90Hz and 30Hz groups and between various analyses that were
performed. Several QC strategies recommended by the International Society for Bone
Densitometry were also employed to minimize sources of QUS measurement error (Krieg et al.,
2008). The same room, device, outcome assessor and foot positioning procedures were used
across all measurements regardless of participants’ group assignment. QUS device calibration
was performed on the day of measurement using the same phantom and according to
manufacturer’s instruction. All calibration values obtained for BUA and SOS during this trial’s
data collection as well as their means and SDs were evaluated and found to correspond with
ranges specified by the manufacturer (see the Technical Appendix QUS QC – calibration log).
Sometimes calibration could not be obtained after numerous tries, while at other times
calcaneal measurements were identified as invalid by the QUS device even after three
attempts. However, uncalibrated or invalid measurements were not included in the analysis. It
was unclear why sometimes calibration or normal calcaneal measurements could not be
obtained, but anecdotal observations were made. Calibration problems tended to be more
common during extremely cold winter days, indicating that fluctuations in the room or
phantom temperature may have played a role. For most participants with an invalid QUS
measurement, either baseline or final scan was affected. However, in one participant, both
measurements were affected, probably due to her noticeably small feet and narrow heels.
Several women with bunions had to have their feet repositioned differently from those without

147
bunions, so that valid measurement could be obtained. Although some of the variation in the
calcaneal QUS outcomes was probably still due to foot positioning and/or calibration errors, it
was unlikely to be systematically different in 90Hz and 30Hz groups compared to controls, since
QC procedures were standardized across all measurements. The QUS outcome assessor was
unblinded but had no control over what BUA, SOS or QUI values were obtained. Beyond foot
positioning, outcome assessor was not able to manipulate the measurement to obtain desired
outcomes, because QUS device displayed BUA, SOS, QUI values and no further evaluation was
needed. Manipulating foot positioning to obtain desired values is extremely difficult, if not
impossible, thus detection bias due to an unblinded QUS outcome assessment probably did not
play a role in observing significant BUA reductions in 90Hz and 30Hz groups compared to
controls.
Real bone tissue changes at the calcaneus may explain statistically significant reductions
in BUA in 90Hz and 30Hz groups compared to controls observed in this trial. It is possible that
the BUA decrease observed here may represents changes in trabecular microarchitecture
and/or collagen but probably not BMD. Although calcaneal BUA and SOS measurements are
primarily influenced by bone hydroxyapatite properties, which relate to BMD, other bone
strength determinants may also play a role (Nicholson et al., 2001; Wu et al., 1998). For
instance, trabecular microarchitecture was previously shown to influence QUS measurements
in vivo and ex vivo, BUA in particular (Njeh et al., 2001; Lin et al., 2009; Sasso et al., 2008; Wu

148
et al., 1998). Since significant reductions in calcaneal BUA, but not in SOS, were observed in
90Hz and 30Hz groups compared to controls, it is possible that bone tissue changes primarily
involved trabecular microstructure damage. Further, type one collagen fibres are intertwined
within the bone mineral matrix which partly gives bone its elasticity, and their properties are
also believed by some to influence calcaneal BUA and SOS measurements (Wu et al., 1998).
Thus, changes in bone collagen in response to WBV may have also played role in the statistically
significant decrease in BUA in 90Hz and 30Hz groups.
Low-magnitude WBV applied to the calcaneus could have potentially caused micro-
damage of the trabecular microstructure in a similar way in which a bone fatigue test can cause
a break in a bone specimen, due to the application of many low-force loading cycles (Bouxsein,
2006). Each time the WBV platform accelerates upwards, it presses against the heel, thus
creating strains within the calcaneus. Even though these compressive forces were not very high,
they occurred 30 or 90 times per second for 20 consecutive minutes, and their strains may have
accumulated over time. It is possible that this accumulated strain within the calcaneus caused
buckling or crumbling of tiny trabeculi (mean baseline TTh: 0.08 mm). This is especially true for
osteopenic postmenopausal women who already have compromised trabecular
microarchitecture (Pacifici, 2001). The compression strains due to WBV may have resembled
those created by osteoclastic cavities, which according to bone fluid-flow hypothesis describe
earlier should upregulate bone formation, so that the cavities can be filled up with new bone

149
(Huiskes et al., 2000). However, osteoclastic cavities or bone resorption are in greater
abundance in postmenopausal women than bone formation, resulting in overall trabecular
deterioration (Pacifici, 2001). Similarly, for the amount trabecular microdamage that was
created by the compression of the calcaneus due to WBV, insufficient bone formation may have
been recruited in osteopenic postmenopausal women for adequate compensation, thus leading
to overall trabecular deterioration.
It is important to note that between-group differences in BUA change observed in this
trial most likely reflect site-specific WBV effect unique to the heel and not other central or
peripheral skeletal sites. As seen in chapter two, no significant between-group differences in
12-month change were observed in aBMD at the femoral neck, total hip or lumbar spine as
measured by DXA, the gold standard, or in vBMD or bone structure parameters at the distal
tibia and distal radius as measured by HR-pQCT. Also as discussed above, statistically significant
reductions in BUA in 90Hz and 30Hz groups versus controls were probably due to the
accumulated compression forces applied directly to the heels as the platform accelerates
upwards. As the WBV stimulus propagates through the heels to other weight-bearing bones, it
is dissipated by the soft tissue and joints and becomes increasingly less intense the further
away it travels from the oscillating platform (Kiiski et al., 2008). No significant changes in HR-
pQCT vBMDt or trabecular microarchitecture were found even at the distal tibia, which is in
very close proximity to the calcaneus, possibly due to the absorption of the WBV compression

150
forces by the talocrural joint (the ankle). Therefore, compared to the calcaneus, the remaining
weight-bearing bones were probably just ‘shaken’ and not compressed by the upward
acceleration of the WBV platform and body segments, due to the cushioning provided by the
joints.
However, BUA findings observed in this RCT may not reflect bone but instead soft tissue
changes, as also discussed in chapter three. Several sources of evidence indicate that soft tissue
changes due to WBV may have occurred in 90Hz and 30Hz groups, which were possibly
reflected in BUA measurements. Several foot-related AEs probably involving the soft tissue
were observed in 90Hz and 30Hz participants in this RCT. For example, plantar foot and heel
pain, which resembled plantar fasciitis and was probably related to WBV, was reported in three
WBV participants. In occupational settings such as mining and construction (for example, drills
and drilling platforms), prolonged exposures to hands and feet vibration can often lead to soft
tissue injuries involving the muscles, vasculature and connective tissues (for example,
Raynaud’s) (Falkenbach et al., 1997; Hedlund, 1989). Some studies have also shown that WBV
may reduce fat content in mice and body weight in postmenopausal women (Rubin et al., 2007;
von Stengel et al., 2010b). Previous examinations of the influence of heel soft tissue
characteristics on the calcaneal QUS parameters have shown that skin temperature, and soft
tissue thickness and fat content play a significant role (Chappard et al., 2000; Ikeda & Iki, 2004;
Kotzki et al., 1994). However, primarily calcaneal SOS was previously found to be significantly

151
affected by soft tissue characteristics but not BUA (Chappard et al., 2000; Ikeda & Iki, 2004;
Kotzki et al., 1994), perhaps because the heel soft tissue has similar speed of sound
characteristics as the calcaneal bone (Krieg et al., 2008).
BUA changes observed in 90Hz and 30Hz groups in this trial may not reflect real bone
changes, also because prospective studies have shown that calcaneal BUA measurements
respond slower to bone medications than central DXA aBMD measurements (Frost, 2001).
Thus, more than 12 months of follow-up has been recommended to observe real bone tissue
changes (Krieg et al., 2008; Lewiecki et al., 2006). However, QUS parameters are believed to be
less responsive in monitoring pharmacological treatments not necessarily because QUS involves
less sensitive measurement, but because peripheral sites such as the calcaneus are expected to
respond slower to bone medications (Bouxsein et al., 1999; Krieg et al., 2008; Lewiecki et al.,
2006). In contrast, WBV may represent a unique clinical situation where the physical stimulus is
applied directly at the calcaneus and at greater intensity than expected at the central sites
(Kiiski et al., 2008).
BUA decrease in 90Hz group was especially pronounced in ≥80% adherent based on
cumulative duration and <65 kg subgroups, suggesting that potential harmful effects of WBV on
the calcaneal bone or heel soft tissue may be dose-dependent and more pronounced when
body mass is lower. Similar trends exist in exercise literature involving injuries in runners. As
reviewed elsewhere, running injuries involving the lower-legs have been primarily attributed to

152
the repetitive nature of the same movement and ground reaction forces experienced at the
feet (van Gent et al., 2007; van Mechelen, 1992). The risk of such injuries was found to
significantly rise with increasing weekly running distance or duration (van Gent et al., 2007; van
Mechelen, 1992). Also, there is some evidence to suggest that running injuries involving the
feet may be more likely in runners with lower body mass (Taunton et al., 2002). Thus, similar
biomechanics as those experienced during running may reflect potential deleterious effects of
WBV on the heel bone and/or soft tissue, as reflected by BUA decrease in 90Hz and 30Hz
groups, particularly in lighter postmenopausal women exposed to a greater cumulative
duration of WBV.
Overall, WBV administered at 0.3g and 90 or 30 Hz for 12 months was found to be
relatively safe and well-tolerated. As shown in chapter two, number of reported SAEs was
similar between study groups, and none of the SAEs experienced in the 90Hz or 30Hz groups
were deemed to be related to WBV. Further, when numbers of AEs were compared between
groups using various relevant categories (for example, back pain, lower-leg injuries, and
gastrointestinal problems) no statistically significant differences were found. However, when
AEs were reported qualitatively, several AEs somewhat resembled conditions due to prolonged
exposures to WBV in occupational settings (Griffin, 1998; Mansfield, 2005; Randall et al., 1997).
For example, nausea and dizziness resembling motion sickness were reported in one participant
who discontinued WBV because they lasted during sleep, as well as in two other participants

153
who experienced these symptoms only briefly during WBV. Although in occupational settings
motion sickness was primarily observed in response to low-frequency high-magnitude WBV in a
seated position (for example, driving a large forestry vehicle) (Griffin, 1998; Mansfield, 2005),
the postmenopausal women in this trial were possibly also sensitive to high-frequency and low-
magnitude WBV in a standing position. WBV was also found to influence the gastrointestinal
tract in this trial, as increased motility was self-reported in three women, especially when WBV
was performed immediately after breakfast. Interestingly, suppressed gastrointestinal motility
have been found to occur due to prolonged exposures to WBV at low frequencies (for example,
4 Hz) during driving in a seated position (Ishitake et al., 1999), while increased motility was
observed here, and participants perceived this symptom as positive. Further, various mild and
transient foot symptoms were self-reported by 90 or 30 Hz participants, which lasted briefly
during WBV and included plantar foot pain, foot numbness or loss in sensation and joint
stiffness or weakness. Vibration-white foot syndrome, also involving loss in sensation and pain
of the feet, has been reported due to vibration exposure from prolonged standing on a drilling
platform (Sakakibara et al., 1991; Thompson et al., 2010). As discussed in chapter one, previous
RCTs of postmenopausal women did not adequatelyreport AEs, except for Russo et al. (2003)
who observed knee pain and lower-leg erythema in response to high-magnitude WBV. No
significant knee pain or lower-leg erythema was observed in this RCT. Finally, compared
Iwamoto’s at al. (2005) trial where high-magnitude (≥1g) WBV administered at 20 Hz to

154
Japanese postmenopausal women was found to significantly reduce pre-existing back pain, no
significant reductions in back pain were observed here in this RCT.
Other health-risks potentially related to WBV that were of more concern than the
aforementioned AEs involved chronic plantar fasciitis-like pain of the feet, as reported in
chapter three. One 30Hz participant was weaned off and on WBV, and the plantar pain
subsided during the weeks when WBV was not administered, but came back when it was
reintroduced and was exacerbated during WBV. The plantar foot pain was perhaps due to the
interplay between high WBV frequency and cumulative duration of WBV. Foot sensitivity to
mechanical vibration was previously shown to rise with increasing frequency (Kekoni et al.,
1989; Miwa, 1988). Also as discussed previously, risk of running injuries of the lower legs were
found to rise with increasing weekly running duration possibly due to excessive repetition of
the same movement and ground reaction forces (van Gent et al., 2007; van Mechelen, 1992).
This is similar to the biomechanics of WBV in relation to the feet and to the cumulative duration
of WBV performed in a week. Although the compression forces at the feet during WBV at 0.3g
were probably smaller than those expected during running, the repetitive nature of WBV was
far more excessive (30 or 90 times per second) than that of repeated pounding at the ground
during running. It is also probably important to note that foot and hand soft tissue injuries in
occupational settings occur due to long-term exposures to WBV (years) and can sometimes be
debilitating (Sakakibara et al., 1991; Thompson et al., 2010), while deleterious effects of the

155
feet that were possibly related to WBV (for example, chronic plantar foot pain or decreased
BUA) in this trial occurred in a mild form, but with an exposure of <12 months.

156
CONCLUSIONS
When previous RCTs in postmenopausal women were systematically evaluated in
chapter one, various high- and low-magnitude WBV therapies were not found to have
significant effect on lumbar spine aBMD or distal tibia vBMD. A statistically significant but small
WBV effect was found on hip aBMD but may have been due to study bias observed in the
included trials.
Based on the RCT results reported in chapters two and three, low-magnitude WBV at
0.3g and at 90 or 30 Hz prescribed daily for 20 minutes for 12 months to community-dwelling
osteopenic postmenopausal women was found to be:
1. Not effective in reducing overall postmenopausal bone loss, as determined by DXA aBMD
measurements at the femoral neck, total hip and lumbar spine, and by HR-pQCT vBMD and
bone structure measurements at the distal tibia and distal radius.
2. Inadequately adhered to (median 65-79%), primarily due to its time-consuming nature (i.e.,
20 minutes per day 7 days a week)
3. Possibly causes small reductions in the calcaneal BUA that may have been due to bone
and/or tissue damage, as a result of its frequent and repetitive compression forces applied to
the heels by the oscillating platform.

157
Thus, WBV is not recommended for the prevention of osteoporosis in community-
dwelling osteopenic postmenopausal women, because its effects on various osteoporosis-
prone sites were found to be clinically insignificant, while it may also cause small damage to
heel bone and/or soft tissue.

158
FUTURE DIRECTIONS
Future RCTs of WBV effects on DXA aBMD at the central sites or HR-pQCT
measurements at the peripheral sites are not recommended in healthy community-dwelling
osteopenic postmenopausal women for the following reasons:
- Although statistically significant improvements in hip aBMD were found in the
systematic evaluation of 131 postmenopausal women, the effect was small and clinically
not relevant. This effect may have been due to lack of calcium and vitamin D
supplementation and/or attrition bias.
- In the RCT of 202 osteopenic postmenopausal women, no significant improvements
were found in response to low-magnitude WBV. Compared to RCTs included in the
systematic evaluation, calcium and vitamin D was provided, attrition bias was minimized
and more sensitive and responsive measurements were obtained.
- Possible small damage of heel bone and/or soft tissue due low-magnitude WBV were
observed in this RCT, which further makes WBV an undesirable choice for
postmenopausal osteoporosis management. More serious, similar deleterious effects
would probably be expected in response to high-magnitude WBV.

159
Future RCTs of WBV effects on bone should be conducted in different clinical
populations that may benefit from WBV more than postmenopausal women. Children and
adolescents with compromised skeletal integrity should be perhaps examined further.
Populations such as children with cerebral palsy (Ward et al., 2004) and girls with low BMD
(Gilsanz et al., 2006) were previously examined in two small trials, as summarized in chapter
one, and significant improvements were found in response to low-magnitude WBV even with
low adherence (<60%). Low-magnitude WBV should be examined in children and adolescents,
because high-magnitude WBV may be too deleterious for the growing bodies, while low-
magnitude was previously found to be well-tolerated. Volumetric measurements should be
obtained in this children and adolescent, because their bones are growing in size, which makes
DXA a poor bone densitometry choice. Calcium and vitamin D supplements should be provided
and larger sample sizes should be examined than previously. It is not recommended to study
normal children or adolescents in future trials of WBV, because this population should be
encouraged to participate in regular physical activity, and their bones are not expected to be so
compromised to require an adjunct bone-building strategy. However, populations such as
children with cerebral palsy, who have more compromised skeletons and find it more difficult
to engage in physical activities, such as running or jumping, should be examined. In young girls
with low bone mass who may also have low BMI, WBV-related foot injuries should be of
concern and should be carefully monitored in clinical trials. Finally, it may be interesting to
examine obese or overweight children receiving WBV. These children are often reluctant to

160
engage in regular physical activities, and may thus benefit from an exercise-like modality such
as WBV. Since some evidence exists to show that WBV may reduce body’s fat content and body
mass (Rubin et al., 2007; von Stengel et al., 2010b), it is recommended that body composition
measurements are made in addition to bone measurements in such trials.
Investigations of WBV effects on bones and muscles in spinal cord injury patients should
also be conducted in the future (Davis et al., 2010; Melchiorri et al., 2007). These patients have
inactive and disused weight-bearing muscles and bones and are unable to perform any type of
weight-bearing physical activity or locomotion. As such, they may especially benefit from WBV,
because it has a potential to improve their skeletal integrity possibly via bone fluid-flow
changes. As well, compared to osteopenic postmenopausal women, spinal cord injury patients
tend to be younger individuals with more compromised bones, especially in the hips and legs,
and may thus be more responsive to WBV.
Further, there is a need to carefully incorporate investigations of AEs in any future trials
of WBV. As discussed in chapter one, reporting of AEs in previous RCTs of WBV effects on bone
was scarce and inadequate. Our current knowledge of potential deleterious effects of WBV on
the body relies on older studies conducted in occupational settings (Griffin, 1998). Compared to
current WBV therapies, WBV in the occupational settings is generally administered in a seated
position, at larger magnitudes and lower frequencies (for example, due to driving in a mining
vehicle) or locally at higher frequencies (for example, standing on a drilling platform), and for

161
prolonged exposures (daily for years). There is a need for a systematic evaluation of WBV
deleterious effects that would separately examine occupational vibration and WBV as exercise-
like modality.
Future investigations of WBV in any study population, where the entry point of vibration
is through the feet, should also obtain calcaneal QUS measurements to confirm the findings of
possible decrease in BUA due to WBV obtained in this RCT conducted here. Calcaneal QUS
device is easy and safe to use, inexpensive and portable, and thus does not require significant
study resources. Future experimental models should also incorporate QUS measurements in
their design to better elucidate potential mechanisms behind the possible relationship between
WBV and bone QUS properties.
Finally, WBV should continue to be examined in various populations for other than bone
effects. Potential benefits of WBV on muscle strength and balance (Verschueren et al., 2004), as
well as on fibromyalgia, multiple sclerosis and Parkinson’s symptoms have been previously
examined (Alenton-Geli et al., 2008; Haas et al., 2006; Schuhfried et al., 2005). However, future
clinical investigations of WBV effects on any outcome should employ effective adherence
strategies and rigorously monitor and report AEs.

162
LIST OF REFERENCES
Adami, S., Gatti, D., Braga, V., Bianchini, D., & Rossini, M. (1999). Site-specific effects of strength
training on bone structure and geometry of ultradistal radius in postmenopausal
women. Journal of Bone and Mineral Research, 14, 1634-1635.
Ahlborg, H., Johnell, O., Turner, C., Rannevik, G., & Karlsson, M. (2003). Bone loss and bone size
after menopause. New England Journal of Medicine, 349, 327-334.
Alenton-Geli, E., Padilla, J., Moras, G., Haro, C., & Fernandez-Sola, J. (2008). Six weeks of whole-
body vibration exercise improves pain and fatigue in women with fibromyalgia. Journal
of Alternative and Complementary Medicine, 14, 975-981.
Ashe, M., Khan, K., Kontulainen, S., Guy, P., Liu, D., Beck, T. et al. (2006). Accuracy of pQCT for
evaluating the aged human radius: an ashing, histomorphometry and failure load
investigation. Osteoporos International, 17, 1241-1251.
Ashman, R., Corin, J., & Turner, C. (1987). Elastic properties of cancellous bone: measurement
by an ultrasonic technique. Journal of Biomechanics, 20, 979-986.
Bediz, B., Ozguven, N., & Korkusuz, F. (2010). Vibration measirements predict the mechanical
properties of human tibia. Clinical Biomechanics, 25, 365-371.
Biewener, A., Fazzalari, N., Konieczynski, D., & Baudinette, R. (1996). Adaptive changes in
trabecular architecture in relation to functional strain patterns and disuse. Bone, 19, 1-8.

163
Binkley, T., Johnson, J., Vogel, L., Kecskemethy, H., Henderson, R., & Specker, B. (2005). Bone
measurements by peripheral quantitative computed tomography (pQCT) in children
with cerebral palsy. Journal of Pediatrics, 147, 791-796.
Black, D., Delmas, P., Eastell, R., Reid, I., Boonen, S., Cauley, J. et al. (2007). Once-yearly
zoledronic acid for treatment of postmenopausal osteoporosis.HORIZON Pivotal
Fracture Trial. New England Journal of Medicine, 356, 1809-1822.
Black, D., Greenspan, S., Ensrud, K., Palermo, L., McGowan, J., Lang, T. et al. (2003). The effects
of parathyroid hormone and alendronate alone or in combination in postmenopausal
osteoporosis. New England Journal of Medicine, 349, 1207-1215.
Bolland, M., Barber, P., Doughty, R., Mason, B., Horne, A., Ames, R. et al. (2008). Vascular
events in healthy older women receiving calcium supplementation: randomised
controlled trial. British Medical Journal, 336, 262-266.
Bongiovanni, L., Hagbarth, K., & Stjernberg, L. (1990). Prolonged muscle vibration reducing
motor output in maximal voluntary contractions in man. Journal of Physiology, 423, 15-
26.
Bonnick, S. L. (2004). Changes in bone density. In Bone Densitometry in Clinical Practice:
Application and Interpretation, 2nd edn (pp. 279). Totowa: Human Press Inc.
Boutroy, S., Bouxsein ML, Munoz F, & Delmas PD (2005). In vivo assessment of trabecular bone
microarchitecture by high-resolution peripheral quantitative computed tomography.
Journal of Clinical Endocrinology and Metabolism, 90, 6508-6515.

164
Bouxsein, M. (2004). Non-invasive measurements of bone strength: promise and peril. Journal
of Musculoskeletal Neuronal Interactions, 4, 404-405.
Bouxsein, M. (2006). Biomechanics of bone. In D.Dempster, D. Felsenberg, & S. van Der Geest
(Eds.), The Bone Quality Book: A Guide to Factors Influencing Bone Strength,
Amsterdam: Elsvier BV.
Bouxsein, M., Parker, R., & Greenspan, S. (1999). Forearm bone mineral densitometry cannot
be used to monitor response to alendronate therapy in postmenopausal women.
Osteoporosis International, 10, 505-509.
Bouxsein, M. & Radloff, S. (1997). Quantitative ultrasound of the calcaneus reflects the
mechanical properties of calcaneal trabecular bone. Journal of Bone and Mineral
Research, 12, 839-846.
Brown, J., Fortier, M., Frame, H., Lalonde, A., Papaioannou, A., Senikas, V. et al. (2006).
Canadian consensus conference on osteoporosis, 2006 update. Journal of Obstetrics and
Gynaecology Canada, 28, S95-S112.
Brown, T. D., Pedersen, D. R., Gray, M. L., Brand, R. A., & Rubin, C. T. (1990). Toward an
identification of mechanical parameters initiating periosteal remodeling: a combined
experimental and analytic approach. Journal of Biomechanics, 23, 893-905.
Bruyere, O., Wuidart, M., Di Palma, E., Gourlay, M., Ethgen, O., Richy, F. et al. (2005). Controlled
whole body vibration to decrease fall risk and improve health-related quality of life of
nursing home residents. Archives of Physical Medicine & Rehabilitation, 86, 303-307.

165
Burr, D., Forwood, M., Fyhrie, D., Martin, R., Schaffler, M., & Turner, C. (1997). Bone
microdamage and skeletal fragility in osteoporotic and stress fractures. Journal of Bone
and Mineral Research, 12, 6-15.
Cardinale, M., Leiper, J., Farajian, P., & Heer, M. (2007). Whole-body vibration can reduce
calciuria induced by high protein intakes and may counteract bone resorption: A
preliminary study. Journal of Sports Sciences, 25, 111-119.
Cardinale, M. & Lim, J. (2003). Electromyography activity of vastus lateralis muscle during
whole-body vibrations of different frequencies. Journal of Strength & Conditioning
Research, 17, 621-624.
Cardinale, M. & Rittweger, J. (2006). Vibration exercise makes your muscles and bones
stronger: fact or fiction? Journal of the British Menopause Society, 12, 12-18.
Castillo, A. B., Alam, I., Tanaka, S. M., Levenda, J., Li, J., Warden, S. J. et al. (2006). Low-
amplitude, broad-frequency vibration effects on cortical bone formation in mice. Bone,
39, 1087-1096.
Chappard, C., Camus, E., Lefebvre, F., Guillot, G., Bittoun, J., Berger, G. et al. (2000). Evaluation
of error bounds on calcaneal speed of sound caused by surrounding soft tissue. Journal
of Clinical Densitometry, 3, 121-131.
Chesnut, C., Majumdar, S., Gardner, J., Shields, A., Newitt, D., Erickson, E. et al. (2001).
Assessment of bone quality, quantity, and turnover with multiple methodologies at
multiple skeletal sites. Advances in Experimental Medicine and Biology, 496, 95-97.

166
Cheung, A. M., Chan, C., Ahmed, F., Hu, H., Demaras, A., Polidoulis, I. et al. (2010). Intra-
operator precision for in vivo high resolution pQCT scans. (submitted).
Cheung, A. M., Feig, D. S., Kapral, M., Raz-Granados, N., Dodin, S., & Canadian Task Force on
Preventive Health Care (2004). Prevention of osteoporosis and osteoporotic fractures in
postmenopausal women: recommendation statement from the Canadian Task Force on
Preventive Health Care. Canadian Medical Association Journal, 170, 1665-1667.
Cheung, A. M., Tile, L., Lee, Y., Tomlinson, G., Hawker, G., Scher, J. et al. (2008). Vitamin K
supplementation in postmenopausal women with osteopenia (ECKO trial): a randomized
controlled trial. PLoS Medicine, 5, 1-12.
Chrischilles, E., Butler, D., Davis, C., & Wallace, R. (1991). A model of lifetime osteoporosis
impact. Archives of Internal Medicine, 151, 2026-2032.
Christiansen, B. A. & Silva, M. J. (2006). The effect of varying magnitudes of whole-body
vibration on several skeletal sites in mice. Annals of Biomedical Engineering.34(7):1149-
56.
Consensus Development Conference. (1993). Diagnosis, prophylaxis and treatment of
osteoporosis. The American Journal of Medicine, 94, 646-650.
Cooper, C., Atkinson, E., O'Fallon, W., & Melton, L. 3. (1992). Incidence of clinically diagnosed
vertebral fractures: a population-based study in Rochester, Minnesota, 1985-1989.
Journal of Bone and Mineral Research, 7, 221-227.

167
Cumming, R., Nevitt, M., & Cummings, S. (1997). Epidemiology of hip fractures. Epidemiology
Reviews, 19, 244-257.
Cummings, S., Bates, D., & Black, D. (2002). Clinical use of bone densitometry: scientific review.
Journal of American Medical Association, 288, 1889-1897.
Cummings, S. & Nevitt, M. (1989). A hypothesis: the causes of hip fractures. Journal of
Gerontology, 44, 107-111.
Davis, R., Sanborn, C., Nichols, D., Bazett-Jones, D., & Dugan, E. (2010). The effect of whole
body vibration on bone mineral density for a person with a spinal cord injury: a case
study. Adapted Physical Activity Quarterly, 27, 60-72.
Dong, R. G., Rakheja, S., Schopper, A. W., Han, B., & Smutz, W. P. (2001). Hand-transmitted
vibration and biodynamic response of the human hand-arm: a critical review. Critical
Reviews in Biomedical Engineering, 29, 393-439.
Eisman, J. A. (2001). Good, good, good ... good vibrations: the best option for better bones?
Lancet, 358, 1924-1925.
Falkenbach, A., Watanabe, I., Hartmann, B., & Agishi, Y. (1997). Raynaud's phenomenon in
vibration syndrome: the impact of cold feet on skin temperature and vasomotion of the
hand after immersion in cold water. Angiology, 48, 1037-1044.

168
Felsenberg, D. (2006). Bone quality. In D.Dempster, D. Felsenberg, & S. van Der Geest (Eds.),
The Bone Quality Book: A Guide to Factors Influencing Bone Strength ( Amsterdam:
Elsvier BV.
Flieger, J., Karachalios, T., Khaldi, L., Raptou, P., & Lyritis, G. (1998). Mechanical stimulation in
the form of vibration prevents postmenopausal bone loss in ovariectomized rats.
Calcified Tissue International, 63, 510-504.
Forwood, M. & Burr, D. (1993). Physical activity and bone mass: exercises in futility? Bone
Mineral, 21, 89-112.
Friden, J. (2001). Vibration damage to the hand: clinical presentation, prognosis and length and
severity of vibration required. Journal of Hand Surgery - British Volume, 26, 471-474.
Fritton, J. C., McLeod, K., & Rubin, B. (2000). Quantifying the strain history of bone: spatial
uniformity and self-similarity of low-magnitude strains. Journal of Biomechanics, 33,
317-325.
Frost, H. (1998). From Wolff's law to the mechanostat: a new "face" of physiology. Journal of
Orthopaedic Science, 3, 282-286.
Frost, M. (2001). Changes in QUS and BMD measurements with antiresorptive therapy: a two-
year longitudinal study. Calcified Tissue International, 69, 138-146.

169
Garman, R., Gaudette, G., Donahue, L. R., Rubin, C., & Judex, S. (2007). Low-level accelerations
applied in the absence of weight bearing can enhance trabecular bone formation.
Journal of Orthopaedic Research, 25, 732-740.
Gilsanz, V., Wren, T. A. L., Sanchez, M., Dorey, F., Judex, S., & Rubin, C. (2006). Low-level, high-
frequency mechanical signals enhance musculoskeletal development of young women
with low BMD. Journal of Bone and Mineral Research, 21, 1464-1474.
Glüer, C., Wu, C., Jergas, M., Goldstein, S., & Genant, H. (1994). Three quantitative ultrasound
parameters reflect bone structure. Calcified Tissue International, 55, 46-52.
Gold, D. (1996). The clinical impact of vertebral fractures: quality of life in women with
osteoporosis. Bone, 18, S185-S189.
Grampp, S., Lang, P., Jergas, M., Gluer, C., Takada, M., Engelke, K. et al. (1994). Peripheral
quantitative computed tomography: short-term in-vivo precision and comparison to
forearem DXA. Journal of Bone and Mineral Research, 9, A368.
Griffin, M. J. (1998). Predicting the hazards of whole-body vibration - consideration of a
standard. Industrial Health, 36, 83-91.
Griffin, M. J. & Mills, K. L. (2002a). Effect of frequency and direction of horizontal oscillation on
motion sickness. Aviation Space & Environmental Medicine, 73, 537-543.
Griffin, M. J. & Mills, K. L. (2002b). Effect of magnitude and direction of horizontal oscillation on
motion sickness. Aviation Space & Environmental Medicine, 73, 640-646.

170
Guglielmi, G., Scalzo, G., de Terlizzi, F., & Peh, WC. (2010). Quantitative ultrasound in
osteoporosis and bone metabolism pathologies. Radiology Clinics of North America, 48,
577-588.
Gusi, N., Raimundo, A., & Leal, A. (2006). Low-frequency vibratory exercise reduces the risk of
bone fracture more than walking: a randomized controlled trial. BMC Musculoskelet
Disord, 7, 92.
Haapasalo, H., Kontulainen, S., Sievänen, H., Kannus, P., Järvinen, M., & Vuori, I. (2000).
Exercise-induced bone gain is due to enlargement in bone size without a change in
volumetric bone density: a peripheral quantitative computed tomography study of the
upper arms of male tennis players. Bone, 27, 351-357.
Haas, C. T., Turbanski, S., Kessler, K., & Schmidtbleicher, D. (2006). The effects of random
whole-body-vibration on motor symptoms in Parkinson's disease. Neurorehabilitation,
21, 29-36.
Hannan, M. T., Cheng, D. M., Green, E., Swift, C., Rubin, C. T., & Kiel, D. P. (2004). Establishing
the compliance in elderly women for use of a low level mechanical stress device in a
clinical osteoporosis study. Osteoporosis International, 15, 918-926.
Hans, D., Dargent-Molina, P., Schott, A., Sebert, J., Cormier, C., Kotzki, P. et al. (1996).
Ultrasonographic heel measurements to predict hip fracture in elderly women: the
EPIDOS prospective study. Lancet, 348, 511-514.

171
Hans, D., Genton, L., Allaoua, S., Pichard, C., & Slosman, D. (2003). Hip Fracture Discrimination
Study. Journal of Clinical Densitometry, 6, 163-172.
Harvard Health Publications (2006). Tiny vibrations may help muscle, bone, and balance.
Harvard Women's Health Watch, 14, 7.
Hasserius, R., Karlsson, M., Jónsson, B., Redlund-Johnell, I., & Johnell, O. (2005). Long-term
morbidity and mortality after a clinically diagnosed vertebral fracture in the elderly: a
12- and 22-year follow-up of 257 patients. Calcified Tissue International, 76, 235-242.
Hedlund, U. (1989). Raynaud's phenomenon of fingers and toes of miners exposed to local and
whole-body vibration and cold. International Archives of Occupational & Environmental
Health, 61, 457-461.
Higgins, J. & Green S (2008). Cochrane's handbook for systematic reviews of interventions
version 5.0.1 (Accessed Jun 2008). The Cochrane Collaboration. [On-line]. Available:
http://www.cochrane-handbook.org
Hodgskinson, R., Njeh, C., Whitehead, M., & Langton, C. (1996). The non-linear relationship
between BUA and porosity in cancellous bone. Physics in Medicine and Biology, 41,
2411-2420.
Hologic Inc (1998). Sahara Clinical Bone Sonometer Clinical User's Guide. Waltham, MA: Hologic
Inc.

172
Huiskes, R., Ruimerman, R., & Janssen, J. (2000). Effects of mechanical forces on maintenance
and adaptation of form in trabecular bone. Nature, 405, 704-706.
Hung, A., Hamidi, M., Riazantseva, E., Thompson, L., Tile, L., Tomlinson, G. et al. (2010).
Validation of a calcium assessment tool in Canadian postmenopausal women.
(submitted).
Ikeda, Y. & Iki, M. (2004). Precision control and seasonal variations in quantitative ultrasound
measurement of the calcaneus. Journal of Bone and Mineral Research, 22, 588-593.
Institute of Medical Physics (2010). Osteoporosis Research (Accessed August 2010). Institute of
Medical Physics Website [On-line]. Available: http://www.imp.uni-erlangen.de
Ishitake, T., Miyazaki, Y., Ando, H., & Matoba, T. (1999). Suppressive mechanism of gastric
motility by whole-body vibration. International Archives of Occupational &
Environmental Health, 72, 469-474.
Iwamoto, J., Takeda, T., Sato, Y., & Uzawa, M. (2005). Effect of whole-body vibration exercise on
lumbar bone mineral density, bone turnover, and chronic back pain in post-menopausal
osteoporotic women treated with alendronate. Aging Clinical and Experimental
Research, 17, 157-163.
Jackson, S., Tenenhouse, A., & Robertson, L. (2000). Vertebral fracture definition from
population-based data: preliminary results from the Canadian Multicenter Osteoporosis
Study (CaMos). Osteoporosis International, 11, 680-687.

173
Johnell, O. & Kanis, J. (2005). Epidemiology of osteoporotic fractures. Osteoporos Int., 16, S3-S7.
Jones, H. H., Priest, J., & Hayes, W. (1977). Humeral hypertrophy in response to exercise.
Journal of Bone and Joint Surgery American Volume, 59, 204-208.
Judex, S., Lei, X., Han, D., & Rubin, C. (2007). Low-magnitude mechanical signals that stimulate
bone formation in the ovariectomized rat are dependent on the applied frequency but
not on the strain magnitude. Journal of Biomechanics, 40, 1333-1339.
Judex, S., Boyd, S., Qin, Y. X., Turner, S., Ye, K., Muller, R. et al. (2003). Adaptations of trabecular
bone to low magnitude vibrations result in more uniform stress and strain under load.
Annals of Biomedical Engineering, 31, 12-20.
Judex, S., Donahue, L. R., & Rubin, C. (2002). Genetic predisposition to osteoporosis is paralleled
by an enhanced sensitivity to signals anabolic to the skeleton. FASEB Journal, 16, 1280-
1282.
Judex, S. & Rubin, C. T. (2010). Is bone formation induced by high-frequency mechanical signals
modulated by muscle activity? Journal of Musculoskeletal Neuronal Interactions.10(1):3-
11.
Judex, S., Zhong, N., Squire, M. E., Ye, K., Donahue, L. R., Hadjiargyrou, M. et al. (2005).
Mechanical modulation of molecular signals which regulate anabolic and catabolic
activity in bone tissue. Journal of Cell Biochemistry, 94, 982-994.

174
Juni, P., Altman, G., & Egger, M. (2001). Assessing the quality of controlled clinical trials. British
Medical Journal, 323, 42-46.
Juvent Inc (2010). The Juvent 1000 (Accessed August 2010). American Medical Innovations LLC
[On-line]. Available: http://www.juvent.com/juvent/
Kaczmarek, M., Pakula, M., & Kubik, J. (2000). Multiphase nature and structure biomaterials
studies by ultrasounds. Ultrasonics, 38, 703-707.
Kado, D., Browner, W., Palermo, L., Nevitt, M., Genant, H., & Cummings, S. (1999). Vertebral
fractures and mortality in older women: a prospective study. Study of Osteoporotic
Fractures Research Group. Archives of Internal Medicine, 159, 1215-1220.
Kanis, J., McCloskey, E., Johansson, H., Oden, A., & Borgström, F. (2010). Development and use
of FRAX in osteoporosis. Osteoporos International, 21, S407-S413.
Kannus, P., Palvanen, M., Niemi, S., Parkkari, J., & Järvinen, M. (2002). Increasing number and
incidence of low-trauma ankle fractures in elderly people: Finnish statistics during 1970-
2000 and projections for the future. Bone, 31, 430-433.
Kekoni, J., Hamalainen, H., Rautio, J., & Tukeva, T. (1989). Mechanical sensibility of the sole of
the foot determined with vibratory stimuli of varying frequency. Experimental Brain
Research, 78, 419-424.
Kemmler, W., von Stengel, S., Engelke, K., Häberle, L., & Kalender, W. (2010). Exercise effects on
bone mineral density, falls, coronary risk factors, and health care costs in older women:

175
the randomized controlled senior fitness and prevention (SEFIP) study. Archives of
Internal Medicine, 170, 179-185.
Kiiski, J., Heinonen, A., Jarvinen, T. L., Kannus, P., & Sievanen, H. (2008). Transmission of vertical
whole body vibration to the human body. Journal of Bone and Mineral Research, 23,
1318-1325.
Knothe Tate, M. (2003). "Whither flows the fluid in bone?" An osteocyte's perspective. Journal
of Biomechanics, 36, 1409-1424.
Kolata, G. (2007). Low buzz may give mice better bones and less fat. The New York Times,
October 10, F6.
Kotzki, P., Buyck, D., Hans, D., Thomas, E., Bonnel, F., Favier, F. et al. (1994). Influence of fat on
ultrasound measurements of the Os calcis. Calcified Tissue International, 54, 91-95.
Krieg, M., Barkmann R, Gonnelli S, Stewart A, Bauer DC, Del Rio Barquero L et al. (2008).
Quantitative ultrasound in the management of osteoporosis: the 2007 ISCD Official
Positions. Journal of Clinical Densitometry, 11, 163-187.
Kvorning, T., Bagger, M., Caserotti, P., & Madsen, K. (2006). Effects of vibration and resistance
training on neuromuscular and hormonal measures. European Journal of Applied
Physiology, 96, 615-625.

176
Lang, T., LeBlanc, A., Evans, H., Lu, Y., & Yu, A. (2004). Cortical and trabecular bone mineral loss
from the spine and hip in long-duration spaceflight. Journal of Bone and Mineral
Research, 19, 1006-1012.
Langton, C., Njeh, C., Hodgskinson, R., & Currey, J. (1996). Prediction of mechanical properties
of the human calcaneus by broadband ultrasonic attenuation. Bone, 18, 495-503.
Lanyon, L. & Rubin, C. (1984). Static vs dynamic loads as an influence on bone remodelling.
Journal of Biomechanics, 17, 897-905.
Lenchik, L., Kiebzak, G., Blunt, B., & International Society for ClinicalDensitometry Position
Development Panel and Scientific Advisory Committee. (2002). What is the role of serial
bone mineral density measurements in patient management? Journal of Clinical
Densitometry, 5, S29-S38.
Lewiecki, E., Richmond, B., & Miller, P. (2006). Uses and misuses of quantitative
ultrasonography in managing osteoporosis. Cleveland Clinic Journal of Medicine, 73,
742-752.
Lin , W., Xia, Y., & Qin, Y. (2009). Characterization of the trabecular bone structure using
frequency modulated ultrasound pulse. Journal of Acoustic Society of America, 125,
4071-4077.
Lings, S., Leboeuf-Yde, & C (2000). Whole-body vibration and low back pain: A systematic,
critical review of the epidimiological literature 1992-1999. International Archives of
Occupational and Environmental Health, 73, 290-297.

177
Lochmüller, E., Bürklein, D., Kuhn, V., Glaser, C., Müller, R., Glüer, C. et al. (2002). Mechanical
strength of the thoracolumbar spine in the elderly: prediction from in situ dual-energy
X-ray absorptiometry, quantitative computed tomography (QCT), upper and lower limb
peripheral QCT, and quantitative ultrasound. Bone, 31, 77-84.
Looker, A., Melton, L. 3., Harris, T., Borrud, L., & Shepherd, J. (2010). Prevalence and trends in
low femur bone density among older US adults: NHANES 2005-2006 compared with
NHANES III. Journal of Bone and Mineral Research, 25, 64-71.
Lyles, K., Colón-Emeric, C., Magaziner, J., Adachi, J., Pieper, C., Mautalen, C. et al. (2007).
Zoledronic acid and clinical fractures and mortality after hip fracture. New England
Journal of Medicine, 357, 1799-1809.
Mani, R., Milosavljevic, S., & Sullivan, S. (2010). The effect of occupational whole-body vibration
on standing balance: A systematic review. International Journal of Industrial Ergonomics
(Epub ahead of print).
Mansfield, N. J. (2005). Whole-body vibration. In Human Response to Vibration. (London: CRC
Press LLC.
Marcus, R. & Majumder, S. (2001). The nature of osteoporosis. In R.Marcus, D. Feldman, & J.
Kelsey (Eds.), Osteoporosis (pp. 3-18). San Diego, CA: Academic Press.
Margulies, J., Simkin, A., Leichter, I., Steinberg, R., Giladi, M., Kashtan, H. et al. (1986). Effect of
intense physical activity on the bone-mineral content in the lower limbs of young adults.
Journal of Bone and Joint Surgery American Volume, 68, 1090-1093.

178
Marshall, D., Johnell, O., & Wedel, H. (1996). Meta-analysis of how well measures of bone
mineral density predict occurrence of osteoporotic fractures. British Medical Journal,
312, 1254-1259.
Melchiorri, G., Andreoli, A., Padua, E., Sorge, R., & De, L. A. (2007). Use of vibration exercise in
spinal cord injury patients who regularly practise sport. Functional Neurology, 22, 151-
154.
Mirsky, E. & Einhorn, T. (1998). Bone densitometry in orthopaedic practice. Journal of Bone and
Joint Surgery - American Volume, 80, 1687-1698.
Miwa, T. (1988). Evaluation of vertical vibration given to the human foot. Journal of Acoustic
Society of America, 83, 984-990.
Moayyeri, A., Kaptoge, S., Dalzell, N., Luben, R., Wareham, N., Reeve, J. et al. (2009). Is QUS or
DXA better for predicting the 10-year absolute risk of fracture? Journal of Bone and
Mineral, 24, 1319-1325.
Modlesky, C., Majumdar, S., & Dudley, G. (2008). Trabecular bone microarchitecture in female
collegiate gymnasts. Osteoporosis International, 19, 1011-1018.
Moher, D., Cook, D., Eastwood, O., Rennie, D., & Stroup, F. (1999). Improving the quality of
reports of meta-analyses of randomized controlled trials: the QUOROM statement.
Lancet, 354, 1896-1900.

179
Moschonis, G. & Manios, Y. (2006). Skeletal site-dependent response of bone mineral density
and quantitative ultrasound parameters following 12-month dietary intervention using
dairy products fortified with calcium and vitamin D: the postmenopausal health study.
British Journal of Nutrition, 96, 1140-1148.
NAMS (2010). Estrogen and progestogen use in postmenopausal women: 2010 position
statement of The North American Menopause Society. Menopause, 17, 242-255.
National Cancer Institute (2006). Common Terminology Criteria for Adverse Events 3.0
(Accessed September 2006). National Cancer Institute [On-line]. Available:
http://ctep.cancer.gov
Nelson, D. A., Norris, S. A., & Gilsanz, V. (2006). Childhood and adolescence. In M.J.Favus (Ed.),
Primer on the Metabolic Bone Diseases and Disorders of Mineral Metabolism,
Washington: American Society for Bone and Mineral Research.
Nicholson, P., Müller, R., Cheng, X., Rüegsegger, P., Van Der Perre, G., Dequeker, J. et al. (2001).
Quantitative ultrasound and trabecular architecture in the human calcaneus. Journal of
Bone and Mineral Research, 16, 1886-1892.
Njeh, C., Fuerst, T., Diessel, E., & Genant, H. (2001). Is quantitative ultrasound dependent on
bone structure? A reflection. Osteoporosis International, 12, 1-15.
Njeh, C., Hodgskinson, R., Currey, J., & Langton, C. (1996). Orthogonal relationships between
ultrasonic velocity and material properties of bovine cancellous bone. Medical
Engineering & Physics, 18, 373-381.

180
Osteoporosis Canada (2010a). Calculate my calcium (Accessed September 2010). Osteoporosis
Canada [On-line]. Available:
http://www.osteoporosis.ca/index.php/ci_id/5355/la_id/1.htm
Osteoporosis Canada (2010b). Health Canada approves PROLIATM (denosumab) as new choice in
osteoporosis therapy (Accessed September 2010). Osteoporosis Canada [On-line].
Available: http://www.osteoporosis.ca/index.php/ci_id/10046/la_id/1.htm
Osteoporosis Canada (2010c). Osteoporosis at-a-glance (Accessed August 2010). Osteoporosis
Canada [On-line]. Available:
http://www.osteoporosis.ca/index.php/ci_id/5526/la_id/1.htm
Oxlund, B., Ørtoft, G., Andreassen, T., & Oxlund, H. (2003). Low-intensity, high-frequency
vibration appears to prevent the decrease in strength of the femur and tibia associated
with ovariectomy of adult rats. Bone, 32, 69-77.
Ozcivici E, Garman R, & Judex S (2007). High-frequency oscillatory motions enhance the
simulated mechanical properties of non-weight bearing trabecular bone. Journal of
Biomechanics, 40, 3404-3411.
Ozcivici, E., Luu, Y. K., Adler, B., Qin, Y. X., Rubin, J., Judex, S. et al. (2010). Mechanical signals as
anabolic agents in bone. Nature Reviews Rheumatology, 6, 50-59.
Ozdurak, R. H., Sezgin, O. C., Akin, S., & Korkusuz, F. (2006). Vibration analysis of the human
radius of elderly men. Clinical Orthopaedics & Related Research, 443, 94-100.

181
Pacifici, R. (2001). Postmenopausal osteoporosis: how the hormonal changes of menopause
cause bone loss. In R.Marcus, D. Feldman, & J. Kelsey (Eds.), Osteoporosis Second
Edition, San Diego, CA: Academic Press.
Papaioannou, A., Morin, S., Cheung, A. M., Atkkinson, S., Brown, J., Feldman, S. et al. (2010).
2010 clinical practice guidelines for the diagnosis and management of osteoporosis in
Canada: summary. Canadian Medical Association Journal (Epub ahead of print).
Pope, M. H., Magnusson, M., & Wilder, D. G. (1998). Kappa Delta Award. Low back pain and
whole body vibration. Clinical Orthopaedics & Related Research, 354, 241-248.
Power Plate (2020). Products: Power Plate Products for Every Purpose (Accessed August 2010).
Power Plate International Limited [On-line]. Available: http://ca.powerplate.com
Prevrhal, S., Shepherd, J., Faulkner, K., Gaither, K., Black, D., & Lang, T. (2008). Comparison of
DXA hip structural analysis with volumetric QCT. Journal of Clinical Densitometry, 11,
232-236.
Prior, J., Barr, S., Chow, R., & Faulkner RA (1996). Prevention and management of osteoporosis:
consensus statements from the Scientific Advisory Board of the Osteoporosis Society of
Canada. 5. Physical activity as therapy for osteoporosis. Canadian Medical Association
Journal, 155, 940-944.
Prisby, R. D., Lafage-Proust, M. H., Malaval, L., Belli, A., & Vico, L. (2008). Effects of whole-body
vibration on the skeleton and other organ systems in man and animal models: what we
know and what we need to know. Ageing Research Reviews, 7, 319-329.

182
Qin, Y. X., Rubin, C. T., & McLeod, K. (1998). Nonlinear dependence of loading intensity and
cycle number in the maintenance of bone mass and morphology. Journal of Orthopaedic
Research, 16, 482-489.
Randall, J., Matthews, R., & Stiles, M. (1997). Resonant frequencies of standing humans.
Ergonomics, 40, 879-886.
Rauch, F., Sievanen, H., Boonen, S., Cardinale, M., Degens, H., Felsenberg, D. et al. (2010).
Reporting whole-body vibration intervention studies: recommendations of the
International Society of Musculoskeletal and Neuronal Interactions. Journal of
Musculoskeletal Neuronal Interactions, 10, 193-198.
Rehn, B., Lidstrom, J., Skoglund, J., & Lindstrom, B. (2007). Effects on leg muscular performance
from whole-body vibration exercise: a systematic review. Scandinavian Journal of
Medicine & Science in Sports, 17, 2-11.
Reid, I. R. (2006). Menopause. In M.J.Favus (Ed.), Primer on the Metabolic Bone Diseases and
Disorders of Mineral Metabolism, Washington: American Society for Bone and Mineral
Research.
Riggs, L., Khosla, S., & Melton, J. (2001). The type I/type II model for involutional osteoporosis.
In R.Marcus, D. Feldman, & J. Kelsey (Eds.), Osteoporosis, San Diego, CA: Academic
Press.
Rittweger, J., Beller, G., & Felsenberg, D. (2000). Acute physiological effects of exhaustive
whole-body vibration exercise in man. Clinical Physiology, 20, 134-142.

183
Rosenberg, M. (2000). The effects of population ageing on the Canadian Health Care System.
Social and Economic Dimensions of an Aging Population Research Papers (SEDAP).,
McMaster University, 1-43.
Ruan, XY., Jin, FY., Liu, Y., Peng, ZL., & Sundelin, YG. (2008). Effects of vibration therapy on bone
mineral density in postmenopausal women with osteoporosis. Chinese Medical Journal,
121, 1155-1158.
Rubin, C., Judex, S., & Qin, Y. X. (2006). Low-level mechanical signals and their potential as a
non-pharmacological intervention for osteoporosis. Age Ageing, 35, ii32-ii36.
Rubin, C., Pope, M., Fritton, J. C., Magnusson, M., Hansson, T., & McLeod, K. (2003).
Transmissibility of 15-Hertz to 35-Hertz vibrations to the human hip and lumbar spine:
determining the physiologic feasibility of delivering low-level anabolic mechanical
stimuli to skeletal regions at greatest risk of fracture because of osteoporosis. Spine, 28,
2621-2627.
Rubin, C., Recker, R., Cullen, D., Ryaby, J., McCabe, J., & McLeod, K. (2004). Prevention of
postmenopausal bone loss by a low-magnitude, high-frequency mechanical stimuli: a
clinical trial assessing compliance, efficacy, and safety. Journal of Bone and Mineral
Research, 19, 343-351.
Rubin, C., Turner, A. S., Bain, S., Mallinckrodt, C., & McLeod, K. (2001a). Anabolism. Low
mechanical signals strengthen long bones. Nature, 412, 603-604.

184
Rubin, C., Turner, A. S., Mallinckrodt, C., Jerome, C., McLeod, K., & Bain, S. (2002a). Mechanical
strain, induced noninvasively in the high-frequency domain, is anabolic to cancellous
bone, but not cortical bone. Bone, 30, 445-452.
Rubin, C., Turner, A. S., Muller, R., Mittra, E., McLeod, K., Lin, W. et al. (2002b). Quantity and
quality of trabecular bone in the femur are enhanced by a strongly anabolic, noninvasive
mechanical intervention. Journal of Bone and Mineral Research, 17, 349-357.
Rubin, C., Xu, G., & Judex, S. (2001b). The anabolic activity of bone tissue, suppressed by disuse,
is normalized by brief exposure to extremely low-magnitude mechanical stimuli. FASEB
Journal, 15, 2225-2229.
Rubin, C. T., Capilla, E., Luu, Y. K., Busa, B., Crawford, H., Nolan, D. J. et al. (2007). Adipogenesis
is inhibited by brief, daily exposure to high-frequency, extremely low-magnitude
mechanical signals. Proceedings of the National Academy of Sciences of the United
States of America.104(45):17879-84.
Rubin, C. T. & McLeod, K. J. (1994). Promotion of bony ingrowth by frequency-specific, low-
amplitude mechanical strain. Clinical Orthopaedics & Related Research.(298):165-74.
Rubin, C. & Lanyon, L. (1985). Regulation of bone mass by mechanical strain magnitude.
Calcified Tissue International, 37, 411-417.
Rubin, D. (1996). Multiple imputation After 18+ years. Journal of American Statistical
Association, 91, 473-489.

185
Rubinacci, A., Marenzana, M., Cavani, F., Colasante, F., Villa, I., Willnecker, J. et al. (2008).
Ovariectomy sensitizes rat cortical bone to whole-body vibration. Calcified Tissue
International, 82, 316-326.
Russo, C. R., Lauretani, F., Bandinelli, S., Bartali, B., Cavazzini, C., Guralnik, J. M. et al. (2003).
High-frequency vibration training increases muscle power in postmenopausal women.
Archives of Physical Medicine & Rehabilitation, 84, 1854-1857.
Sakakibara, H., Hashiguchi, T., Furuta, M., Kondo, T., Miyao, M., & Yamada, S. (1991).
Circulatory disturbances of the foot in vibration syndrome. International Archives of
Occupational & Environmental Health, 63, 145-148.
Sasso, M., Haïat, G., Yamato, Y., Naili, S., & Matsukawa, M. (2008). Dependence of ultrasonic
attenuation on bone mass and microstructure in bovine cortical bone. Journal of
Biomechanics, 41, 347-355.
Schuhfried, O., Mittermaier, C., Jovanovic, T., Pieber, K., & Paternostro-Sluga, T. (2005). Effects
of whole-body vibration in patients with multiple sclerosis: a pilot study. Clinical
Rehabilitation, 19, 834-842.
Seidel, H. & Heide, R. (1986). Long-term effects of whole-body vibration: a critical survey of the
literature. International Archives of Occupational and Environmental Health, 58, 1-26.
Shea, B., Bonaiuti, D., Iovine, R., Negrini, S., Robinson, V., Kemper, H. et al. (2004). Cochrane
Review on exercise for preventing and treating osteoporosis in postmenopausal women.
Eura Medicophysica, 40, 199-209.

186
Silverman, S. (1992). The clinical consequences of vertebral compression fracture. Bone, 13,
S27-S31.
Siminoski, K., Lesilie, W. D., Frame, H., Hodsman, A., Jose, R., Khan, A. et al. (2005).
Recommendations for Bone Mineral Density Reporting in Canada. Canadian Association
of Radiologists Journal, 56, 178-188.
Skelly, A. (2007). Good vibrations. The Medical Post, 38, 22.
Slatkovska, L., Alibhai, S., Beyene, J., & Cheung, A. (2010a). Effect of whole-body vibration on
BMD: a systematic review and meta-analysis. Osteoporosis International (Epub ahead of
print).
Slatkovska, L., Alibhai, S., Beyene, J., Hu, H., & Cheung, A. M. (2010b). Effect of 12 months of
whole-body vibration on bone density and structure in postmenopausal women with
osteopenia: a randomized controlled trial (The Vibration Study). (submitted).
Stewart, J. M., Karman, C., Montgomery, L. D., & McLeod, K. J. (2005). Plantar vibration
improves leg fluid flow in perimenopausal women. American Journal of Physiology -
Regulatory Integrative & Comparative Physiology, 288, R623-R629.
Tang, B., Eslick, G., Nowson, C., Smith, C., & Bensoussan, A. (2007). Use of calcium or calcium in
combination with vitamin D supplementation to prevent fractures and bone loss in
people aged 50 years and older: a meta-analysis. Lancet, 370, 657-666.

187
Taunton, J., Ryan, M., Clement, D., McKenzie, D., loyd-Smith, D., & umbo, B. (2002). A
retrospecitve case-control analysis of 2002 running injuries. British Journal of Sports
Medicine, 36, 95-101.
Tenenhouse, A., Joseph, L., Kreiger, N., Poliquin, S., Murray, T., Blondeau, L. et al. (2000).
Estimation of the prevalence of low bone density in Canadian women and men using a
population-specific DXA reference standard: the Canadian Multicentre Osteoporosis
Study (CaMos). Osteoporosis International, 11, 897-904.
Thompson, A., House, R., Krajnak, K., & Eger, T. (2010). Vibration-white foot: a case report.
Occupational Medicine London (Epub ahead of print).
Torvinen, S., Kannus, P., Sievanen, H., Jarvinen, T. A., Pasanen, M., Kontulainen, S. et al. (2003).
Effect of 8-month vertical whole body vibration on bone, muscle performance, and body
balance: a randomized controlled study. Journal of Bone and Mineral Research, 18, 876-
884.
Totosy de Zepetnek, J., Giangregorio, L., & Craven, C. (2009). Whole-body vibration as potential
intervention for people with low bone mineral density and osteoporosis: A review.
Journal of Rehabilitation Research and Development, 46, 529-542.
Tucker, K., Chen H, Hannan MT, Cupples LA, Wilson PW, Felson D et al. (2002). Bone mineral
density and dietary patterns in older adults: the Framingham Osteoporosis Study.
American Journal of Clinical Nutrition, 76, 245-252.

188
Turner, C. H., Owan, I., & Takano, Y. (1995). Mechanotransduction in bone: role of strain rate.
American Journal of Physiology - Endocrinology and Metabolism, 269, E438-E442.
Turner, C. (2005). The biomechanics of hip fracture. Lancet, 366, 98-99.
Usui, Y., Zerwekh, J. E., Vanharanta, H., Ashman, R. B., & Mooney, V. (1989). Different effects of
mechanical vibration on bone ingrowth into porous hydroxyapatite and fracture healing
in a rabbit model. Journal of Orthopaedic Research, 7, 559-567.
Vainionpää, A., Korpelainen, R., Leppäluoto, J., & Jämsä, T. (2005). Effects of high-impact
exercise on bone mineral density: a randomized controlled trial in premenopausal
women. Osteoporosis International, 16, 191-197.
van Gent, R., Siem, D., van Middelkoop, M., van Os, A., Bierma-Zeinstra, S., & Koes, B. (2007).
Incidence and determinants of lower extremity running injuries in long distance runners:
a systematic review. British Journal of Sports Medicine, 41, 469-480.
van Mechelen, W. (1992). Running injuries. A review of the epidemiological literature. Sports
Medicine, 14, 320-325.
Verschueren, S. M., Roelants, M., Delecluse, C., Swinnen, S., Vanderschueren, D., & Boonen, S.
(2004). Effect of 6-month whole body vibration training on hip density, muscle strength,
and postural control in postmenopausal women: a randomized controlled pilot study.
Journal of Bone and Mineral Research, 19, 352-359.

189
Vickers, A. J. (2001). The use of percentage change from baseline as an outcome in a controlled
trial is statistically inefficient: a simulation study. BMC Medical Research Methodology,
1, 1-4.
von Stengel, S., Kemmler, W., Engelke, K., & Kalender, W. (2010a). Effects of whole body
vibration on bone mineral density and falls: results of the randomized controlled ELVIS
study with postmenopausal women. Osteoporosis International (Epub ahead of print).
von Stengel, S., Kemmler, W., Kalender, W., & Engelke, K. (2010b). Effects of whole body
vibration on vertical versus rotational devices on osteoporotic risk factors - preliminary
results of the Elvis II study (P888). Osteoporosis International, 21, S380-S381.
Wallace, B. & Cumming, R. (2000). Systematic review of randomized trials of the effect of
exercise on bone mass in pre- and postmenopausal women. Calcified Tissue
International, 67, 10-18.
Wapniarz, M., Lehmann, R., Randerath, O., Baedeker, S., John, W., Klein, K. et al. (1994).
Precision of dual x-ray absorptiometry and peripheral computed tomography using
mobile densitometry units. Calcified Tissue International, 54, 219-223.
Ward, K., Alsop, C., Caulton, J., Rubin, C., Adams, J., & Mughal, Z. (2004). Low magnitude
mechanical loading is osteogenic in children with disabling conditions. Journal of Bone
and Mineral Research, 19, 360-369.

190
Ward, K. A., Roberts, S. A., Adams, J. E., Lanhan-New, S., & Mughal, M. Z. (2007). Calcium
supplementation and weight bearing physical activity--do they have a combined effect
on the bone density of pre-pubertal children? Bone, 41, 496-504.
Wikimedia Foundation Inc (2009). Whole-body vibration (Accessed June 2009). Wikipedia The
Free Encyclopedia [On-line]. Available:
http://en.wikipedia.org/wiki/Whole_body_vibration
Wiktorowicz, M., Goeree, R., Papaioannou, A., Adachi, J., & Papadimitropoulos, E. (2001).
Economic implications of hip fracture: health service use, institutional care and cost in
Canada. Osteoporosis International, 12, 271-278.
Williams, F. & Spector , T. (2006). Recent advances in the genetics of osteoporosis. Journal of
Musculoskeletal Neuronal Interactions, 6, 27-35.
Wilson, H. W. (1997). Minnesota Leirure-Time Physical Activity Questionnaire. Medicine and
Science in Sports & Exercise, 29, S62-S72.
Wolff, J. (1986). The Law of Bone Remodeling. Berlin: Springer.
World Health Organization (1994). Assessment of Fracture Risk and Its Application to Screening
for Postmenopausal Osteoporosis. Geneva, Switzerland.
World Health Organization (2010). FRAX (R) WHO Fracture Risk Assessment Tool (Accessed
September 2010). World Health Organization Collaborating Centre for Metabolic Bone
Diseases, University of Sheffield, UK [On-line]. Available: http://www.shef.ac.uk/

191
Wren, T., Liu, X., Pitukcheewanont, P., & Gilsanz, V. (2005). Bone acquisition in healthy children
and adolescents: comparisons of dual-energy x-ray absorptiometry and computed
tomography measures. Clinical Endocrinology and Metabolism, 90, 1925-1928.
Wu, C., Lu, Y., Fuerst, T., Hans, D., & Genant, H. (1998). Ultrasound Characterization of Bone
Demineralization. Calcified Tissue International, 2, 133-139.
Xie, L., Jacobson, J., Choi, E. S., Busa, B., Donahue, L. R., Miller, L. M. et al. (2006). Low-level
mechanical vibrations can influence bone resorption and bone formation in the growing
skeleton. Bone, 39, 1059-1066.
Xie, L., Rubin, C., & Judex, S. (2008). Enhancement of the adolescent murine musculoskeletal
system using low-level mechanical vibrations. Journal of Applied Physiology, 104, 1056-
1062.
You, L., Cowin, S. C., Schaffler, M. B., & Weinbaum, S. (2001). A model for strain amplification in
the actin cytoskeleton of osteocytes due to fluid drag on pericellular matrix. Journal of
Biomechanics, 34, 1375-1386.

192
TECHNICAL APPENDIX

193
CHAPTER ONE: STANDARDIZED DATA COLLECTION FORMS

WBV systematic evaluation: standardized RCT inclusion/exclusion criteria
Primary author ___________________________ Year _____________________________ Publication type: Yes No Unclear Acceptable publication type (check one):
Peer‐reviewed full‐text articles: no language or publication year restrictions Abstracts: ≤5 years old and satisfactory information regarding eligibility criteria Unpublished studies: data collection completed and results and protocol available Dissertations/theses: include Reviews, commentaries, and letter to editors: only if contain original data
Study design: Yes No Unclear RCT or quasi‐RCT (cross over and cluster randomization allowed)
Participants: Yes No Unclear Ambulatory or able to walk with limited support (exclude quadric‐ or paraplegics).
Intervention: Yes No Unclear Acceptable WBV (check all):
Vertical (up‐and‐down or reciprocating) or horizontal displacements Transmitted through feet to whole‐body (exclude local vibration) Erect, erect intermittent with exercises (e.g., squads), or supine Powered by motors or acoustic waves (exclude ultrasound or electrical stimuli) Duration ≥6 months
Control intervention: Yes No Unclear Appropriate control intervention(check one):
No treatment Placebo Exercise Bone medications Yes No Unclear Group matching based on or exclusion of major confounders (check all):
Medications affecting bone metabolism Disease affecting bone metabolism Outcomes: Yes No Unclear At least one of the specified primary BMD outcomes available.
NOTES:
Luba
Typewritten Text
Luba
Typewritten Text
Luba
Typewritten Text
194

WBV systematic evaluation: standardized RCT quality checklist
Primary author ___________________________ Year _____________________________ Selection bias present (check as present if at least one “no” or “unclear” is present): Yes No Unclear True random study‐arm allocation performed Yes No Unclear Concealed study‐arm allocation performed
Performance bias (check as present if at least one “no” or “unclear” is present): Groups were matched baseline based on minor confounders: Yes No Unclear Calcium intakes Yes No Unclear Age at baseline Yes No Unclear Menstrual status at baseline Yes No Unclear BMD at baseline Yes No Unclear Body mass at baseline
Detection bias present (check as present if at least one “no” or “unclear” is present): Yes No Unclear Blinding of those assessing BMD outcomes
Attrition bias present (check as present if at least one “no” or “unclear” is present): Yes No Unclear Only intention‐to‐treat analysis performed
Other considerations:
Yes No Unclear Adequate calcium and vitamin D intakes ensured NOTE: If criterion is unclear and determines whether or not the particular bias is present or absent, attempt to confirm with the authors of the study. If answer is not provided consider it as “no”. NOTES:
Luba
Typewritten Text
195

WBV
systematic evaluation: stand
ardized da
ta extraction form
s
QUALITY/SEN
SITIVITY
INTERV
ENTION
Selection
bias
(y/n/u)
Performan
ce
bias (y/n/u)
Detection
bias (y/n/u)
Attrition
bias
(y/n/u)
Loss to
follo
w‐
up (%
) Adh
eren
ce
(%)
n TR
T (at
analysis)
n CO
N (a
t an
alysis)
Ca
D
Regimen
du
ration
(m
onths)
Platform
mod
el
Freq
uency
(hz)
Magnitude
(cm/m
m or
g)
prescribed
#
Sessions
Session du
ration
(m
in/session
)
prescribed
Volum
e (#
sessions*d
uration)
Gusi, 20
06
Iwam
oto, 2005
Rubin, 2004 (n=56)
Verschu
eren
, 2004 (tot)
Russo, 2003
Torvinen
, 2003
Ward, 2004 (tibia PP)
Ward, 2004 (spine
PP)
Gilsan
z, 200
6 (PP)
ITT
Rubin, 2004 (n=70)
Gilsan
z, 200
6 (ITT)
PA
RTICIPANTS
CONTR
OL INTERV
ENTION
INSTUMEN
T
Life stage
(post‐men
opau
sal;
child
ren/ad
olesen
ts; adu
lts; elderly)
Sex
(m/f/m
f)
Age ran
ge
comprom
ised
bon
e he
alth (y/n)
if yes de
scribe
ond
ition
No
treatm
ent
(y/n)
placeb
o (y/n)
Exercise (y/n; if
yes de
scribe
) Bo
ne m
edications
(y/n; if yes describe)
DXA
mod
el
QCT
mod
el
Gusi, 20
06
Iwam
oto, 2005
Rubin, 2004 (n=56)
Verschu
eren
, 2004 (tot)
Russo, 2003
Torvinen
, 2003
Ward, 2004 (tibia PP)
Ward, 2004 (spine
PP)
Gilsan
z, 200
6 (PP)
ITT
Rubin, 2004 (n=70)
Gilsan
z, 200
6 (ITT)
Luba
Typewritten Text
196

OUTC
OMES ‐ BM
D SPINE (g/cm2)
OUTC
OMES ‐ BM
D HIP (g/cm2)
OUTC
OMES ‐ QCT
TRABE
CULA
R BM
D (m
g/cm
3)
treatm
ent
control
estimate
site
treatm
ent
control
estimate
site
treatm
ent
control
estimate
site
mg/cm
2 mg/cm
2 mean
SD
mg/cm
2 mg/cm
2 mean
SD
mg/cm
2 mg/cm
2 mean
SD
mg/cm
2 mg/cm
2 mean
SD
%
SD
mean
SD
%
SD
mean
SD
Gusi, 20
06
Iwam
oto, 2005
Rubin, 2004 (n=56)
Verschu
eren
, 2004 (tot)
Russo, 2003
Torvinen
, 2003
Ward, 2004 (tibia PP)
Ward, 2004 (spine
PP)
Gilsan
z, 200
6 (PP)
ITT
Rubin, 2004 (n=70)
Gilsan
z, 200
6 (ITT)
Luba
Typewritten Text
197

198
CHAPTER ONE: HANDLING MISSING DATA

WBV Meta‐analysis: Contacting the original authors for missing data
We contacted the original authors of all of the included trials to obtain missing information, and we obtained 100% response rate. The mean absolute change in BMD was not reported in a number of original publications (Iwamoto, 2005; Verschueren, 2004; Rubin, 2004; Russo, 2003; Torvinen, 2003). After contacting all of the original authors, Iwamoto et al. (2005) and Verschueren et al. (2004) provided us with the missing mean absolute change in BMD. However, since the original data were no longer available to Rubin et al. (2004), Russo et al. (2003) and Torvinen et al. (2003), some estimations and statistical manipulations were performed to obtain the correct BMD outcome.
WBV Meta‐analysis: estimations of missing data
Where BMD data were reported only as the baseline and final means the mean absolute change in BMD was obtained by subtracting the final from the baseline mean (Russo, 2003; Torvinen, 2003). The standard deviation (SD) corresponding to the absolute BMD change was estimated using the Follmann’s method as described in the Cochrane Handbook for Systematic Reviews of Interventions Version 5.0.1. (Higgins, 2008). The correlation coefficient value (r) of 0.95 was used in all Follmann’s calculations. Based on the 12‐month follow‐up data collected in our laboratory, we obtained r values ranging from 0.94 to 0.97 for the total hip, femoral neck and L1‐L4 aBMD change in 440 postmenopausal women receiving either placebo or vitamin K treatment (Cheung, 2008). Prior meta‐analysis utilized an even higher correlation coefficient value (r = 0.99) in their Follmann’s calculations (Martyn‐St James, 2006). Therefore, an r of 0.95 seemed to be a conservative value to use in our calculations.
A trial of Rubin et al. (Rubin, 2004) required special attention in the determination of the aBMD outcomes. Neither the absolute mean change in aBMD nor the final aBMD was available to us. Instead, baseline aBMD was reported for 56 participants with all follow‐up data out of the 70 originally enrolled participants. Also, the mean percent change in aBMD for the ITT (n=70) and per‐protocol data was reported. The mean percent change for the per‐protocol data was only reported for different adherence groups but not for the 56 participants with the baseline aBMD. The adherence group with the largest sample size (n=33) consisted of at least 60% adherent participants. Therefore, for our primary analysis of the per‐protocol data we utilized the baseline aBMD data (n=56) and the percent change aBMD data (n=33) to estimate an
Luba
Typewritten Text
199

absolute change in BMD. Alternatively, for our sensitivity analysis of the ITT data we utilized the baseline BMD data (n=56) and the percent change aBMD data (n=70) to estimate an absolute change in aBMD. Finally, the SD corresponding to the mean absolute change in aBMD was imputed from another trial (Gusi, 2006) for each study group (i.e., control and vibration) and each measurement site (i.e., L2‐L4 and femoral neck). This trial (Gusi, 2006) was used, because it is the most similar to the Rubin’s al. (2004) trial in terms of its study sample size, populations type, and measurement type.
WBV Meta‐analysis: other statistical manipulations
Where confidence intervals (Gusi, 2006) or standard errors (Russo, 2003) were reported only, statistical formulas were used to convert these measurements to SDs. Where BMD data for more than one arm were pooled into one arm (Verschueren, 2004) the mean absolute change was obtained using the “weighted mean” formula and the corresponding SD was obtained using the “pooled or weighted SD” formula. Where raw data were provided in the original publication (Ward, 2004) or in our email communication with the original authors (Iwamoto, 2005), appropriate descriptive statistics were used to obtain the mean absolute change and the corresponding SD.
Luba
Typewritten Text
200

201
CHAPTERS TWO AND THREE: A PRIORI PROTOCOL

The Effect of Daily Whole-Body Vibration on Tibial Trabecular Bone Mineral Density in
Osteopenic Postmenopausal Women (Vibration Study)
Study Protocol
28-Apr-2008
Luba
Typewritten Text
202

TABLE OF CONTENTS
INTRODUCTION................................................................................................................................... 1
BACKGROUND AND RATIONALE .................................................................................................. 1 BONE MECHANICAL STIMULUS ................................................................................................... 1 WHOLE BODY VIBRATION ............................................................................................................. 1
Brief description: .......................................................................................................................... 1 Effects on bone in animal models: ................................................................................................ 1 Effects on bone in humans: ........................................................................................................... 2
OBJECTIVES AND HYPOTHESES ................................................................................................... 2 Primary objective:......................................................................................................................... 2 Secondary objectives: ................................................................................................................... 3
METHODOLOGY ................................................................................................................................. 3 SUBJECTS ........................................................................................................................................... 3 EXPERIMENTAL DESIGN ................................................................................................................ 4 MEASUREMENTS OF BMD AND BONE MICROARCHITECTURE............................................. 4 WHOLE BODY VIBRATION REGIMEN .......................................................................................... 4
Regimen duration, interval frequency and interval duration: ...................................................... 5 Vibration magnitude and frequency: ............................................................................................ 5
SAFETY CONSIDERATIONS ............................................................................................................ 5 STATISTICAL ANALYSIS................................................................................................................. 6
REFERENCES........................................................................................................................................ 7
Luba
Typewritten Text
203

The Effect of Daily Whole-Body Vibration on Tibial Trabecular Bone Mineral Density in Osteopenic Postmenopausal Women INTRODUCTION Exercise is believed to produce bone growth in adults only during relatively high-impact activities; moderate exercise regimens have not been shown to compensate for early postmenopausal bone loss1,2. However, vigorous physical activity has low compliance, and can increase risk of musculoskeletal injuries in the elderly1,2. Recently, low-magnitude high-frequency mechanical vibration has been shown to produce anabolic effects on animal skeleton3-10. However, studies of the influence of similar vibration stimulus on human bones in vivo have produced variable results11-16. One of the confounding variables may be the frequency of vibration signals. BACKGROUND AND RATIONALE BONE MECHANICAL STIMULUS According to the conventional premise of mechanical loading effects on the skeleton, only large-magnitude strains arising from high-intensity impact activities are capable of tissue microdamage and growth in bone16. This conventional wisdom has been recently challenged by disuse osteopenia turkey models in vivo in which low-magnitude high-frequency mechanical vibration applied directly to ulnae resulted in smaller reductions in cross-sectional bone area4 and increased bony implant ingrowth3. Further, similar stimulus administered non-invasively through whole-body-vibration (WBV) resulted in various anabolic bone changes in animals6-10 and can increase bone mineral density (BMD) in humans13,15,16. Therefore, it seems that mechanical stimuli are not only osteogenic at high, but also at low magnitudes, possibly due to their high frequency6,13. It has been recently proposed that small mechanical signals may be amplified by by-products of bone material deformation, specifically fluid flow17 and intramedullary pressure18 in relation to their frequency. This may be a one plausible mechanism by which the skeletal system perceives and responds to low-magnitude, high-frequency vibration13,16. Further, vibration noise may indirectly regulate bone anabolic response through neuromuscular feedback amplified through stochastic resonance13,16. Perturbations in stochastic threshold in the neuromuscular system occur when subthreshold mechanical stimuli become detectable in the presence of noise. This results in small membrane potentials which bring neuromuscular cells closer to depolarization and to firing of action potentials19. WHOLE BODY VIBRATION Brief description: While standing on a vibrating platform, WBV affects all body parts and tissues of the exposed person. The vibration stimulus is imposed noninvasively through ground-based vertical accelerations. These are believed to result in mechanical signals within the weight-bearing bones from reflexive muscle contractions of the adjacent musculature13,16. The intensity of WBV is defined by magnitude and frequency, where magnitude is expressed as the vertical acceleration (g, where 1g = 9.8 m/s2 acceleration due to gravity) or vertical displacement. Two types of WBV systems are currently available20: one uses reciprocal vertical displacements on the left and right side of the fulcrum, thrusting alternatively the right and left leg upwards (these devices can produce high (1 to 15g) and low (<1g) magnitude vibration at high frequencies (20-45 Hz)); and the other produces uniform oscillation of the whole plate up and down at low magnitudes (0.2 & 0.3g) and high or very high frequencies (30 & 90 Hz). Effects on bone in animal models: Up to date, all animal models of WBV have observed anabolic changes in various species, including rabbits10, rats8,9, sheep7, mice6. In sheep, trabecular BMD was found to preferentially adapt due to increased trabecular number and decreased trabecular spacing in proximal and distal femur7,21. Further, vibration caused increased trabecular BMD in sheep femur but
Version: 28-Apr-2008 Page 1
Luba
Typewritten Text
204

The Effect of Daily Whole-Body Vibration on Tibial Trabecular Bone Mineral Density in Osteopenic Postmenopausal Women not in radius, suggesting that the benefits may be limited to the weight-bearing skeleton7. Finally, data in rats also suggest that there may be greater bone responses to these vibration stimuli when bone mass is low as compared to normal8. Effects on bone in humans: Six available studies of WBV in humans have shown increased13,15,16 or no change in BMD11,12,14. No changes in BMD of cortical or trabecular bones were found in young healthy adults. In postmenopausal women, two studies12,14 found no change in BMD while one study observed increased BMD in the total hip15 and another in the lumbar spine13. The latter observed these changes only in highly compliant and low body weight women13. In pre- and pubertal disabled children, BMD of trabecular but not cortical bone increased16. Limitations of the these studies include small sample size11-15, different study populations11,16 (i.e., adults with normal bone or children with high bone formation), and confounding issues such as the inclusion of bone medications12. Since a wide variety of WBV regimens was utilized, it is not known what the optimal effective training schedule and vibration intensity is for the prevention of bone loss. Similar to animal models6,8-10, relatively brief WBV exposures of 6 months produced increases in BMD in children and post-menopausal women15,16. Further, various interval frequencies (number of times per week) and durations (number of minutes per session) have been used with no observable trends with osteogenic effects. With respect to WBV intensity, both high (>1g)8,10,13,16 and low (1g)6,7,9,11,12,14,15 magnitudes and various frequencies within the 12-90 Hz range produced osteogenic effects in animal models and humans with lack of any clear trends. Previous authors postulated that it was the high-frequency (30-45 Hz) and not the high-magnitude (2-5g) of vibration that played a key role in their study, because no BMD effects were observed with high-impact exercises on the WBV platform15. Further, an undisturbed sinusoidal loading waveform may be necessary to observe osteogenic benefits making the vibration acceleration that exceeds 1g insufficient. High-magnitude vibration prevents subject from standing steadily on the platform thereby causing intermittent loading and disturbed waveform11. Theoretically, the higher the frequency the greater the osteogenic effects of the low-magnitude mechanical stimuli, since the relevant physiological mechanisms (i.e., changes in bone fluid flow and intramedullary pressure) are frequency dependent13,16. To date, it has not been examined whether different frequencies within the high-frequency range of WBV affect bone differently. Thus, we propose an exploratory study to examine the effects of different vibrational frequencies on BMD in postmenopausal women. OBJECTIVES AND HYPOTHESES The objective of our study is to explore the effects of low-magnitude (0.3g) WBV at very high (90 Hz) and high (30 Hz) frequencies versus no vibration on trabecular bone mineral density of the lower tibia in non-osteoporotic postmenopausal women. Primary objective: To evaluate whether there are statistically significant differences in the longitudinal changes in trabecular BMD of the lower tibia (using peripheral quantitative computed tomography; pQCT) between very high-frequency vibration group (VHG), high-frequency vibration group (HG) and control group (CG). Primary hypothesis: Significantly larger increases in trabecular BMD will be found in VHG and HG when compared to CG groups, with greater differences occurring between VHG vs. CG in comparison to HG vs. CG groups.
Version: 28-Apr-2008 Page 2
Luba
Typewritten Text
205

The Effect of Daily Whole-Body Vibration on Tibial Trabecular Bone Mineral Density in Osteopenic Postmenopausal Women Secondary objectives: To examine whether there are statistically significant differences in the longitudinal changes in: 1. total BMD of the lower tibia (using pQCT) 2. cortical BMD and cortical thickness of the lower tibia (using pQCT) 3. trabecular thickness, separation, and number of the lower tibia (using pQCT) 4. total BMD of the distal radius (using pQCT) 5. cortical BMD and cortical thickness of the distal radius (using pQCT) 6. trabecular BMD and thickness, separation, and number of the distal radius (using pQCT) 7. BMD at the total hip (using dual x-ray absorptiometry; DXA) 8. BMD at the femoral neck (using DXA) 9. BMD lumbar spine (using DXA) 10. Speed of sound and broadband ultrasound attenuation at the calcaneus (using quantitative
ultrasound; QUS). Secondary hypotheses: Significantly larger increases in all secondary outcomes will be found in VHG and HG when compared to CG groups, with greater differences occurring between VHG vs. CG in comparison to HG vs. CG groups. METHODOLOGY SUBJECTS Subjects will be 200 healthy, osteopenic, postmenopausal women, recruited via media advertisements and posted announcements. This study will include women who are postmenopausal, with the lowest BMD T-score at L1 to L4, femoral neck or total hip being ≤-1.0 and ≥-2.0 regardless of age or being ≤-1.0 and >-2.5 up to and inclusive age 70. Postmenopausal status will be defined as the last menstruation occurring more than one year ago based on personal menstrual history. Exclusion criteria will include: use of HRT in the past 12 months, use of raloxifene or parathyroid hormone in the past 6 months, use of bisphosphonates or fluoride in the past 3 months or ever taken for ≥3 months, current use of calcitonin, use of other medications that may indirectly affect bone metabolism, presence of metabolic bone disease or diseases that indirectly affect bone metabolism, occurrence of fragility fracture over 40 years of age, presence of unhealed non-fragility fracture (i.e., occurring less then 6 months ago), having body mass ≤28 kg and ≥90 kg, having knee or hip joint replacements and spine implants, having poor balance (assessed by Timed-Up-and-Go; TUG22,23), presence of other medical risks for the study, inability to stand erect daily for 20 minutes, and planned vacation or other activities that would prevent one from using the platform for ≥1 month. Participation in physical activity will be acceptable, as long as subjects are willing and able to maintain approximately the same physical activity levels throughout the study. Physical activity levels will be determined using the Minnesota Leisure-Time Physical Activity Questionnaire which has been validated for women aged 21 to 74 years24. Decision about study participation will be consulted with the principal investigator or personal physician for individuals with the following conditions/devices: congestive heart failure, joint implants, pre-existing deep vein thrombosis, thrombophlebitis, pulmonary embolism, severe diabetic neuropathy, poor somatosensory receptor sensitivity on the soles of the feet, sensitivity to motion sickness, known retinal condition, pacemakers and implantable cardioverter defibrillators, known neurological conditions. The study protocol and consent form is approved by the University Health Network Research Ethics Board, and all subjects will provide written informed consent.
Version: 28-Apr-2008 Page 3
Luba
Typewritten Text
206

The Effect of Daily Whole-Body Vibration on Tibial Trabecular Bone Mineral Density in Osteopenic Postmenopausal Women EXPERIMENTAL DESIGN Subjects will be randomly assigned to VHG, HG, or CG. All subjects will participate in 1) screening visit, 2) baseline visit, 3) follow-up visits at 6 months, and 4) study completion visit at 12 months. During the screening visit, inclusion/exclusion criteria will be reviewed, and BMD at lumbar spine, total hip and femoral neck (using DXA), anthropometric measurements (body mass), and TUG will be obtained for the purposes of inclusion/exclusion. During baseline, demographics (date of birth, education, and racial origin), anthropometric measurements (body mass, height, and BMI), general health history (menstrual history, medications, conditions, and lifestyle habits such as smoking and alcohol intake), physical activity levels, calcium and vitamin D dietary intakes, and pQCT and QUS bone parameters will be obtained, as well as the first 20-minute WBV treatment will be administered in the presence of study staff. Baseline may be performed on the same day as or within 1 month after the screening visit. During the follow-up visit at 6 months, compliance, anthropometric measurements (body mass, body height, and BMI), general health history (changes in lifestyle habits), medications use, adverse events, physical activity levels, calcium and vitamin D dietary intakes will be obtained. During the study completion visit at 12 months, compliance, anthropometric measurements (body mass, body height, and BMI), general health history (changes in lifestyle habits), medications use, adverse events, physical activity levels, and calcium and vitamin D dietary intakes will be obtained, as well as all bone parameters will be assessed using DXA, pQCT and QUS. Subjects will be expected to take calcium and vitamin D supplements for the duration of the study. Their calcium and vitamin D dietary intakes will be determined at baseline, using a recall-questionnaire of a typical 7-day diet. Subjects’ baseline dietary intakes will be used to calculate a supplement dose that will produce total daily calcium and vitamin D intakes (i.e., from diet plus supplements) to 1000-12000 mg and 800-1000 IU, respectively. This dietary recall-questionnaire will be repeated during the 6- and 12-month visits to ensure that no significant changes in calcium and vitamin D intakes occurred. MEASUREMENTS OF BMD AND BONE MICROARCHITECTURE In both animal models and humans, greater increases were observed in trabecular volumetric BMD (vBMDt) 7,16,21 and in weight-bearing bones15,16. Therefore, when considering outcome measurements, vBMDt of the lower left tibia as measured by high resolution pQCT (XtremeCT, Scanco Medical AG, Bassersdorf, Switzerland; described elsewhere25) was selected for this study. Additional pQCT measurements will include total volumetric BMD (vBMDtot), cortical volumetric BMD (vBMDc), cortical thickness (CrT), trabecular thickness (TbT), trabecular separation (TbS), and trabecular number (TbN) of the lower left tibia. As well, all of the above pQCT measurements will be repeated at the distal non-dominant radius. BMD at the total hip and femoral neck (unilateral; left side), and the lumbar spine will be determined using DXA (Hologic DiscoveryA; Hologic, Bedford, MA). Further, QUS (Hologic Sahara; Hologic, Bedford, MA) will be used to determine speed of sound (SOS) and broadband ultrasound attenuation (BUA) at the left calcaneus. All densitometric measurements will be performed by a single trained technologist to minimize measurement error. Coefficients of variation for in vivo measurements with repositioning in our laboratory are: 1.5% at the tibia and radius for pQCT, 1.01% at L1 to L4, 1.08% at the total hip and 1.44% at femoral neck for DXA, 1.5% for QUS. WHOLE BODY VIBRATION REGIMEN Subjects in the CG will not receive WBV. VHG and HG subjects will take home a Juvent 1000 WBV device (Juvent Ltd, Waterford, Ireland; described elsewhere13) for the duration of the study. Subjects will be asked to stand erect and barefoot on the platform for 20 minutes per day, 7 days per week for 12 months. Study compliance will be determined at 6 and 12 months from recorded time, date, and interval duration by an electronic monitor built-in in the WBV device, and confirmed by a personal
Version: 28-Apr-2008 Page 4
Luba
Typewritten Text
207

The Effect of Daily Whole-Body Vibration on Tibial Trabecular Bone Mineral Density in Osteopenic Postmenopausal Women compliance log that will be filled out by each subject and phone compliance log maintained by study staff. Subjects in the VHG and HG will undergo WBV at 0.3g (~50 micrometers), with VHG receiving vibration at 90 Hz and HG receiving vibration at 30 Hz. Regimen duration, interval frequency and interval duration: Since exposures of 6 months increased vBMDt in disabled children15,16 and in BMD in postmenopausal women15,16, 12-month WBV regimen is considered sufficient for this study. In a study that utilized two 10-min daily intervals, changes in BMD were only seen in postmenopausal women that were >86% compliant. This regimen resulted in only 37% of subjects completing the study being at least 80% compliant13. Reducing the interval frequency to one daily 10-min interval resulted in 83% of the proposed number of days being actually attended by elderly postmenopausal women26. When considering the safety of interval duration, 20 minutes of vibration per day (35-40 Hz, 2.28-5.09g) did not result in any adverse events in postmenopausal women15. According to the International Organization for Standardization (ISO) 2631, daily allowable exposure for frequencies in the range of 25 to 31.5 Hz is 4 hr at 0.6g13. Therefore, daily 20-min WBV regimen utilized by this study should produce favorable balance between compliance and treatment effect. Vibration magnitude and frequency: Generally, the lower the magnitude of WBV, the lower the health risks involved, with 0.8g being established by the ISO 2631 as the discomfort level for vibration in the 30 Hz range27-29. Further, since high-magnitude (>1g) of WBV is not believed to play a key role in producing anabolic effects on human bone11,15, magnitudes below 1g should produce optimally safe and effective stimulus in the prevention of bone loss. With respect to frequency, deleterious range is between 1 to 20 Hz, with tolerance increasing with increasing frequency 30. Theoretically, osteogenic effects of low magnitude mechanical stimuli should also increase with increasing frequency, since the relevant physiological mechanisms (i.e., changes in bone fluid flow and intramedullary pressure) are related to frequency13,16. For the purposes of this study, 30 Hz and 90 Hz should provide a safe stimuli at the two extremes of current WBV high-frequency spectrum, thereby allowing for sufficient comparisons. SAFETY CONSIDERATIONS In general, low-magnitude high-frequency WBV is very well tolerated26. Few non-serious adverse events of shorter term (<1year) exposures to WBV devices have been reported, including itching and erythema of the lower legs, mild inflammation of the forefoot, and feeling of dizziness 12,14,26,28,31-33. In total ten11-13,15,16,32,34-37 of fifteen 11-16,26,28,31-37 present studies of whole-body vibration found no adverse events. Six to 12 months of WBV for four to 7 minutes per day at high magnitude (>1g) and frequencies between 18 to 20 Hz have been shown to alleviate lower back pain in the elderly with chronic lower back pain12,32. This is in contrast to previous observational studies in occupational environments which found that long-term exposures to WBV have been commonly associated with low back pain13,27. However, in common occupational environments WBV exposures are generally long-term (>1 y), with relatively low frequencies (<15 Hz) and high magnitudes (>1g)28. People are most sensitive to WBV within the frequency range of 1 to 20 Hz with tolerance increasing with higher frequencies30. The human resonate frequency of the spine is between 5 to 15 Hz28,38. Further, generally the higher magnitudes the greater the health risks, with most health risks occurring at vibration above 0.5g27-29. Both pQCT (XtremeCT; 2 tibial and 2 radial scans) and DXA (2 scans) measurements will expose the subjects to very low dose radiation. Each scan is approximately 1-3 microSieverts. For the whole 12-month study, participants will be exposed to the dose equivalent to a chest radiograph. SAMPLE SIZE CALCULATION
Version: 28-Apr-2008 Page 5
Luba
Typewritten Text
208

The Effect of Daily Whole-Body Vibration on Tibial Trabecular Bone Mineral Density in Osteopenic Postmenopausal Women Original sample size determination: For our original sample size calculations, we used a statistically significant difference in a 12-month mean percent change in vBMDt (1.08 %) between the experimental and control groups, and an average SD for the change in vBMDt for the experimental and control groups (1.26 %). These values were reported in a prospective non-randomized intervention study of healthy post-menopausal Chinese women19. The experimental group consisted of 17 self-selected regular Tai Chi Chuan exercisers and the control group included 17 age- and gender-matched non-exercising controls. The pQCT instrument used in this study was produced by the same manufacturer (Scanco Medical, Zurich, Switzerland), but was an older model (Densiscan 1000) of our laboratory’s HR-pQCT (XtremeCT). At the time of the original submission, this was the best estimate that we had. Using a within group SD of 1.26% and significant between-group difference of +1.08% for longitudinal changes in vBMDt produced a minimum sample size estimate of approximately 30 per group (80% power and an alpha level of p < 0.05). Using the drop out rate of 20% obtained from a similar RCT that examined the effect of 12-month WBV on BMD in postmenopausal women25. Rubin et al. (2004)25, we estimated that we needed a sample size of 40 subjects per group (i.e., total of 120 participants). New sample size determination: Since our original sample size calculations, several pieces of information became available to us that improved our sample size determination. First, our research group conducted a short-term precision study involving two repeat-measurements of vBMDt on the same day using the XtremeCT5, the same instrument used in our study for the assessment of our primary outcome. This study included twenty-five women and six men (age range: 20-69) and the least significant change (LSC) for vBMDt was calculated to be 1.1%. This value is the smallest meaningful clinical change based on the precision of the instrument. Second, a 12-month RCT examining the effect of denosumab or alendronate compared to placebo in postmenopausal women was recently completed. The study population was similar to ours (mostly Caucasian women with osteopenia). Over 12 months, the placebo group (~80 postmenopausal women) had approximately a 2% loss in vBMDt (unpublished data). The SD in this study was 3.1% (unpublished data). Third, based on our initial experience in this study, we estimate a drop-out rate of 0.4 participants per month. Fourth, we calculated our adherence rate based on our first 14 months of data collection. Using these 4 new estimates, we estimate that we need approximately 202 subjects for our vibration study at 80% power and an alpha level of p < 0.05. STATISTICAL ANALYSIS A one-way ANOVA will be used to test for baseline differences in the BMD, body mass, BMI, age, and age from menopause between groups. For the primary and secondary analyses, comparisons of bone parameters will be performed with repeated measures two-way ANOVA with study group being one variable (between-group comparisons; VHG x HG x CG) and time being the other variable (within-group comparisons; baseline x 6 months x 12 months). To examine whether baseline BMD, body mass, age from menopause, and compliance influence the effectiveness of WBV, repeated measures two-way ANCOVA (study group x time) will be performed with controlling for these variables. Values for all statistical tests will be considered significant if p < 0.05.
Version: 28-Apr-2008 Page 6
Luba
Typewritten Text
209

The Effect of Daily Whole-Body Vibration on Tibial Trabecular Bone Mineral Density in Osteopenic Postmenopausal Women
REFERENCES 1. Chesnut, C. H., Bone mass and exercise. American Journal of Medicine 95, 34S-36S (1993). 2. Kohrt, W. M., et al., American College of Sports Medicine position stand: Physical activity and
bone health. Medicine & Science in Sports & Exercise 36, 1985-1996 (2004). 3. Rubin, C. T. & McLeod, K., Promotion of bony ingrowth by frequency-specific, low amplitude
mechanical strain. Clinical Orthopaedics & Related Research 298, 165-174 (1994). 4. Qin, Y. X., Rubin, C. T., & McLeod, K., Nonlinear dependence of loading intensity and cycle
number in the maintenance of bone mass and morphology. Journal of Orthopaedic Research 16, 482-489 (1998).
5. Rubin, C., et al., Anabolism. Low mechanical signals strengthen long bones. Nature 412, 603-604 (2001).
6. Judex, S., et al., Mechanical modulation of molecular signals which regulate anabolic and catabolic activity in bone tissue. Journal of Cellular Biochemistry 94, 982-994 (2005).
7. Rubin, C., et al., Mechanical strain, induced noninvasively in the high-frequency domain, is anabolic to cancellous bone, but not cortical bone. Bone 30, 445-452 (2002).
8. Flieger, J., et al., Mechanical stimulation in the form of vibration prevents postmenopausal bone loss in ovariectomized rats. Calcified Tissue International 63, 510-514 (1998).
9. Rubin, C., Xu, G., & Judex, S., The anabolic activity of bone tissue, suppressed by disuse, is normalized by brief exposure to extremely low-magnitude mechanical stimuli. FASEB Journal 15, 2225-2229 (2001).
10. Usui, Y., et al., Different effects of mechanical vibration on bone ingrowth into porous hydroxyapatite and fracture healing in a rabbit model. Journal of Orthopaedic Research 7, 559-567 (1989).
11. Torvinen, S., et al., Effect of 8-month vertical whole body vibration on bone, muscle performance, and body balance: a randomized controlled study. Journal of Bone & Mineral Research 18, 876-884 (2003).
12. Iwamoto, J., et al., Effect of whole-body vibration exercise on lumbar bone mineral density, bone turnover, and chronic back pain in post-menopausal osteoporotic women treated with alendronate. Aging-Clinical & Experimental Research 17, 157-163 (2005).
13. Rubin, C., et al., Prevention of postmenopausal bone loss by a low-magnitude, high-frequency mechanical stimuli: a clinical trial assessing compliance, efficacy, and safety. Journal of Bone & Mineral Research 19, 343-351 (2004).
14. Russo, C. R., et al., High-frequency vibration training increases muscle power in postmenopausal women. Archives of Physical Medicine & Rehabilitation 84, 1854-1857 (2003).
15. Verschueren, S. M., et al., Effect of 6-month whole body vibration training on hip density, muscle strength, and postural control in postmenopausal women: a randomized controlled pilot study. Journal of Bone & Mineral Research 19, 352-359 (2004).
16. Ward, K., et al., Low magnitude mechanical loading is osteogenic in children with disabling conditions. Journal of Bone & Mineral Research 19, 360-369 (2004).
17. You, L., et al., A model for strain amplification in the actin cytoskeleton of osteocytes due to fluid drag on pericellular matrix. Journal of Biomechanics 34, 1375-1386 (2001).
18. Qin, Y. X., Lin, W., & Rubin, C., The pathway of bone fluid flow as defined by in vivo intramedullary pressure and streaming potential measurements. Annals of Biomedical Engineering 30, 693-702 (2002).
19. Gravelle, D. C., et al., Noise-enhanced balance control in older adults. Neuroreport 13, 1853-1856 (2002).
20. Cardinale, M. & Wakeling, J., Whole body vibration exercise: are vibrations good for you? British Journal of Sports Medicine 39, 585-589 (2005).
Version: 28-Apr-2008 Page 7
Luba
Typewritten Text
210

The Effect of Daily Whole-Body Vibration on Tibial Trabecular Bone Mineral Density in Osteopenic Postmenopausal Women
21. Rubin, C., et al., Quantity and quality of trabecular bone in the femur are enhanced by a strongly anabolic, noninvasive mechanical intervention. Journal of Bone & Mineral Research 17, 349-357 (2002).
22. Isles, R., et al., Normal values of balance tests in women aged 20-80. Journal of American Geriatrics Society 52, 1367-1372 (2004).
23. Bischoff, H., et al., Identifying a cut-off point for normal mobility: a comparison of the timed 'up and go' test in community-dwelling and institutionalised elderly women. Age and Ageing 32, 315-320 (2003).
24. Wilson, H. W., Minnesota Leirure-Time Physical Activity Questionnaire. Medicine & Science in Sports & Exercise 29, S62-S72 (1997).
25. Boutroy, S., et al., In vivo assessment of trabecular bone microarchitecture by high-resolution peripheral quantitative computed tomography. Journal of Clinical Endocrinology & Metabolism 90, 6508-6515 (2005).
26. Hannan, M. T., et al., Establishing the compliance in elderly women for use of a low level mechanical stress device in a clinical osteoporosis study. Osteoporosis International 15, 918-926 (2004).
27. Mansfield, N. J., Whole-Body Vibration,in Human Response to Vibration.,(CRC Press LLC, London, 2005), pp.11-52.
28. Rubin, C., et al., Transmissibility of 15-hertz to 35-hertz vibrations to the human hip and lumbar spine: determining the physiologic feasibility of delivering low-level anabolic mechanical stimuli to skeletal regions at greatest risk of fracture because of osteoporosis. Spine 28, 2621-2627 (2003).
29. Seidel, H. & Heide, R., Long-term effects of whole-body vibration: a critical survey of the literature. International Archives of Occupational and Environmental Health 58, 1-26 (1986).
30. Lings, S., Leboeuf-Yde, & C, Whole-body vibration and low back pain: A systematic, critical review of the epidimiological literature 1992-1999. International Archives of Occupational and Environmental Health 73, 290-297 (2000).
31. Runge, M. & Resnicek, R. E., Balance training and exercise in geriatric patients. Journal of Musculoskeletal Neuronal Interactions 1, 61-65 (2000).
32. Rittweger, J., et al., Treatment of chronic lower back pain with lumbar extension and whole-body vibration exercise. Spine 27, 1829-1834 (2006).
33. Rittweger, J., Beller, G., & Felsenberg, D., Acute physiological effects of exhaustive whole-body vibration exercise in man. Clinical Physiology 20, 134-142 (2000).
34. Torvinen, S., et al., Effect of four-month vertical whole body vibration on performance and balance. Medicine & Science in Sports & Exercise 34, 1523-1528 (2002).
35. Delecluse, C., Roelants, M., & Verschueren, S., Strength increase after whole-body vibration compared with resistance training. Medicine & Science in Sports & Exercise 35, 1033-1041 (2003).
36. de Ruiter, C. J., et al., The effects of 11 weeks whole body vibration training on jump height, contractile properties and activation of human knee extensors. European Journal of Applied Physiology 90, 595-600 (2003).
37. Roelants, M., Delecluse, C., & Verschueren, S. M., Whole-body-vibration training increases knee-extension strength and speed of movement in older women. Journal of the American Geriatrics Society 52, 901-908 (2004).
38. Wilder, D. G., The biomechanics of vibration and low back pain. American Journal of Industrial Medicine 23, 577-588 (1993).
39. Qin, L., et al., Regular Tai Chi Chuan exercise may retard bone loss in postmenopausal women: A case-control study. Archives of Physical Medicine & Rehabilitation 83, 1355-1359 (2002).
Version: 28-Apr-2008 Page 8
Luba
Typewritten Text
211

212
CHAPTERS TWO AND THREE: STANDARDIZED DATA COLLECTION FORMS

VIBRATION STUDY Patient Name:________________________ Date:__ __/__ __ __/ __ __ __ __
SCREENING VISIT
Page 1
Informed Consent Date: __ __/__ __ __/ __ __ __ __ Inclusion Criteria: 1. Postmenopausal Yes No 2. BMD T-score -1.0 to -2.4 if ≤70 years or to -2.0 >70 years Yes No
at L1 to L4, total hip and femoral neck Exclusion Criteria: 1. Taking bone medications Yes No 2. Taking other medications that indirectly affect bone metabolism Yes No 3. Having bone disease Yes No 4. Having a disease that indirectly affects bone metabolism Yes No 5. Having had fragility fracture Yes No 6. Having unhealed fracture Yes No 7. Having body mass ≤28 kg and ≥90 kg Yes No 8. Having joint replacements or spine implants Yes No 9. Having poor balance (TUG score > 12 s) Yes No 10. Being unable to stand erect daily for 20 minutes Yes No 11. Participating in other studies that conflict with current study Yes No 12. Planning to travel for ≥1 month at a time Yes No 13. Significantly changing physical activity Yes No 14. Being at poor medical or psychiatric risk Yes No Precautions: 1. Congestive heart failure Yes No 2. Pre-existing deep vein thrombosis Yes No 3. Thrombophlebitis Yes No 4. Pulmonary embolism Yes No 5. Diabetic neuropathy Yes No 6. Poor somatosensory receptor sensitivity on the soles of the feet Yes No 7. Sensitivity to motion sickness Yes No 8. Known retinal condition Yes No 9. Pacemakers and implantable cardioverter defibrillators Yes No 10. Known neurological conditions Yes No
Excluded or deferred: No Yes: _________________________________________________________ Date of birth: __ __/__ __ __/__ __ __ __ Menstrual history: Age at menarche (years): _________________ Have you ever had your uterus removed? No Unknown Yes: Year___________________ Have you ever had your ovaries removed? No Unknown Yes: ONE BOTH Year________________ Last menstrual period: __ __/__ __ __/__ __ __ __ Age from menopause (years): _________ FSH:_______________ Anthropometric measurements: Weight (kg):___________Height (m):____________BMI (kg/m2):_______________ Balance: TUG score (s): #1_____ #2_____ #3_____ >12 seconds: Yes No Notes: _______________________________________________________________________________________________
Luba
Typewritten Text
Luba
Typewritten Text
213

VIBRATION STUDY Patient Number __ __ __ Participant Initials __ __ __ Date __ __/__ __ __/__ __ __ __
CRF 1: BASELINE
Page 1
Demographics: Date of birth: __ __/__ __ __/__ __ __ __ Education: Elementary Secondary College University undergraduate University graduate Racial origin: Caucasian Afro-Caribbean East Asian West Asian Hispanic Other:_________________ Marital status: Married Separated Divorced Widowed Never married Other:_______________________ Anthropometric measurements: Weight (kg):___________Height (m):____________BMI (kg/m2):_______________ Menstrual history: Age at menarche (years): _________________ Have you ever had your uterus removed? No Unknown Yes: Year___________________ Have you ever had your ovaries removed? No Unknown Yes: one both Year________________ Last menstrual period: __ __/__ __ __/__ __ __ __ Age from menopause (years): _________ FSH:_______________________ General health history: Alcohol consumption? No Yes, currently Yes, previously
If yes: Servings per week:__________ Duration (y):_________ Year stopped:_________ Type:_____________ Do you drink coffee or tea? No Yes: Servings per week: _______/_______ Duration(y)________/_________ Are you on a special diet (e.g., high-protein): No Yes:________________________________________________ Have you ever smoked? No Yes, currently Yes, previously
If yes: Cigarettes per week:___________ Duration (y):______________ Year stopped smoking:_____________
Have you ever been exposed to second-hand smoking? No Yes, currently Yes, previously
If yes: Cigarettes per week:___________ Duration (y):____________ Year stopped exposure:______________ Family history of osteoporosis? No Yes: Relationship:_____________/______________ Age: _______/________
Type: _________________/____________________ Location: ____________________/__________________ Family history of fracture? No Yes: Relationship:_____________/_____________ Age: ___________/___________
Type: _________________/____________________ Location: ___________________/___________________ Have you had a fall in the past 12 months? No Yes: How:_________________________/_____________________ Did it result in an injury? No Yes: Injury:_________/__________ Treatment: ____________/__________
Balance: TUG score (s): #1_____ #2_____ #3_____ >12 seconds: Yes No
Luba
Typewritten Text
214

VIBRATION STUDY Patient Number __ __ __ Participant Initials __ __ __ Date __ __/__ __ __/__ __ __ __
CRF 1: BASELINE
Page 2
Vibration treatment details: 30 Hz Trial:
Duration (min): ______________________
Immediate rating: Unpleasant Neutral Pleasant
Immediate side effects: _____________________________________________________________________
Immediate sensation (e.g. tingling and location): _________________________________________________ Juvent platform serial number: ______________________ Group allocation: ______________________ Date of first treatment: __ __/__ __ __/__ __ __ __ Bone mineral density and microarchitecture measurements: pQCT: Date: __ __/__ __ __/ __ __ __ __ Notes: ___________________________________________________ QUS: Date: __ __/__ __ __/ __ __ __ __ Notes: ___________________________________________________ DXA: Date: __ __/__ __ __/ __ __ __ __ Notes: ___________________________________________________ NOTES:
Luba
Typewritten Text
215

VIBRATION STUDY Patient Number __ __ __ Participant Initials __ __ __ Date __ __/__ __ __/__ __ __ __
CRF 1: BASELINE
Page 3
Past treatments: Calcium: No Yes Vitamin D: No Yes Vitamin K: No Yes
Description Start Date dd-mmm-yyyy
End date
dd-mmm-yyyy
__ __-__ __ __-__ __ __ __
__ __-__ __ __-__ __ __ __
__ __-__ __ __-__ __ __ __
__ __-__ __ __-__ __ __ __
__ __-__ __ __-__ __ __ __
__ __-__ __ __-__ __ __ __
__ __-__ __ __-__ __ __ __
__ __-__ __ __-__ __ __ __
__ __-__ __ __-__ __ __ __
__ __-__ __ __-__ __ __ __
__ __-__ __ __-__ __ __ __
__ __-__ __ __-__ __ __ __
__ __-__ __ __-__ __ __ __
__ __-__ __ __-__ __ __ __
__ __-__ __ __-__ __ __ __
__ __-__ __ __-__ __ __ __
__ __-__ __ __-__ __ __ __
__ __-__ __ __-__ __ __ __
__ __-__ __ __-__ __ __ __
__ __-__ __ __-__ __ __ __
__ __-__ __ __-__ __ __ __
__ __-__ __ __-__ __ __ __
__ __-__ __ __-__ __ __ __
__ __-__ __ __-__ __ __ __
__ __-__ __ __-__ __ __ __
__ __-__ __ __-__ __ __ __
__ __-__ __ __-__ __ __ __
__ __-__ __ __-__ __ __ __
__ __-__ __ __-__ __ __ __
__ __-__ __ __-__ __ __ __
__ __-__ __ __-__ __ __ __
__ __-__ __ __-__ __ __ __
Luba
Typewritten Text
Luba
Typewritten Text
216

VIBRATION STUDY Patient Number __ __ __ Participant Initials __ __ __ Date __ __/__ __ __/__ __ __ __
CRF 1: BASELINE
Page 4
Past morbidities:
No Yes Fracture No Yes Back pain
No Yes Legs swelling/redness No Yes Feet swelling/redness
No Yes Dizziness No Yes Motion Sickness
Description
Start Date dd/mmm/yyyy
End date dd/mmm/yyyy
__ __-__ __ __-__ __ __ __
__ __-__ __ __-__ __ __ __
__ __-__ __ __-__ __ __ __
__ __-__ __ __-__ __ __ __
__ __-__ __ __-__ __ __ __
__ __-__ __ __-__ __ __ __
__ __-__ __ __-__ __ __ __
__ __-__ __ __-__ __ __ __
__ __-__ __ __-__ __ __ __
__ __-__ __ __-__ __ __ __
__ __-__ __ __-__ __ __ __
__ __-__ __ __-__ __ __ __
__ __-__ __ __-__ __ __ __
__ __-__ __ __-__ __ __ __
__ __-__ __ __-__ __ __ __
__ __-__ __ __-__ __ __ __
__ __-__ __ __-__ __ __ __
__ __-__ __ __-__ __ __ __
__ __-__ __ __-__ __ __ __
__ __-__ __ __-__ __ __ __
__ __-__ __ __-__ __ __ __
__ __-__ __ __-__ __ __ __
__ __-__ __ __-__ __ __ __
__ __-__ __ __-__ __ __ __
__ __-__ __ __-__ __ __ __
__ __-__ __ __-__ __ __ __
__ __-__ __ __-__ __ __ __
__ __-__ __ __-__ __ __ __
__ __-__ __ __-__ __ __ __
__ __-__ __ __-__ __ __ __
__ __-__ __ __-__ __ __ __
__ __-__ __ __-__ __ __ __
Luba
Typewritten Text
217

VIBRATION STUDY Patient Number __ __ __ Participant Initials __ __ __ Date __ __/__ __ __/__ __ __ __
CRF 2: 6-MONTH FOLLOW-UP
Page 1
Compliance: 6 months Notes: Total number of treatments: ____________ ____________________________________________ Expected number of treatments: ____________ ____________________________________________ Number of treatments missed: ____________ ____________________________________________ Compliance (%): __________
Anthropometric measurements: Weight (kg):___________Height (m):____________BMI (kg/m2):_______________ General health history: Since last visit have you significantly changed: Alcohol intake? No Yes: Servings per week:_____ Duration (m):_______Month stopped:________ Type:________
Coffee/ tea intake? No Yes: Servings per week:____/____ Duration(m)____/____ Month stopped:______/______ Smoking habits? No Yes: Cigarettes per week: _______ Duration (m):_______ Month stopped:______________ Second-hand smoking exposure? No Yes: Cigarettes per week: _____Duration (m):_____ Month stopped:_______ Diet? (e.g., to high-protein): No Yes:_____________________________________________________________
Physical levels? No Yes: ______________________________________________________________________ Have you had a fall? No Yes: How:______________________________________________________________ Did it result in an injury? No Yes: Injury:_______________________ Treatment: _______________________ NOTES:
Luba
Typewritten Text
218

VIBRATION STUDY Patient Number __ __ __ Participant Initials __ __ __ Date __ __/__ __ __/__ __ __ __
CRF 3: END-OF-STUDY VISIT
Page 1
Compliance: A Total number of treatments: ____________ Expected number of treatments: ____________ Number of treatments missed: ____________ Compliance A (%): __________
B Total treatment time (min): ___________ Expected treatment time (min): ___________ Missed treatment time (min): ___________ Compliance B (%): _________
Compliance notes:________________________________________________________________________________ Anthropometric measurements: Weight (kg):___________Height (m):____________BMI (kg/m2):_______________ General health history: Since last visit have you changed: Alcohol intake? No Yes: Servings per week:_____ Duration (m):_______Month stopped:________ Type:________
Coffee/ tea intake? No Yes: Servings per week:____/____ Duration(m)____/____ Month stopped:______/______ Smoking habits? No Yes: Cigarettes per week: _______ Duration (m):_______ Month stopped:______________ Second-hand smoking exposure? No Yes: Cigarettes per week: _____Duration (m):_____ Month stopped:_______ Have you radically changed your diet? (e.g., to high-protein): No Yes:___________________________________ Have you had a fall? No Yes: How:______________________________________________________________ Did it result in an injury? No Yes: Injury:_______________________ Treatment: _______________________ Balance: TUG score (s): #1_____ #2_____ #3_____ >12 seconds: Yes No Bone mineral density and microarchitecture measurements: pQCT: Date: __ __/__ __ __/ __ __ __ __ Notes: ___________________________________________________ QUS: Date: __ __/__ __ __/ __ __ __ __ Notes: ___________________________________________________ DXA: Date: __ __/__ __ __/ __ __ __ __ Notes: ___________________________________________________ WBV: Serial #___________________ Group: ______________ Correct group allocation confirmed? Yes No Footwear:_______________________________________ Surface: _________________________________________ Ethnic/cultural background (describe):______________________________________________________________ Vitamin D measurement: Yes _________________________ No NOTES:
Luba
Typewritten Text
219

VIBRATION STUDY Patient Number __ __ __ Participant Initials __ __ __ Date __ __/__ __ __/__ __ __ __
END-OF-STUDY QUESTIONNAIRE
Version: 12-Jul-07 Page 1
1. By putting a cross on the line below, indicate what percent of the time did you take calcium and vitamin D supplements as prescribed?
Not applicable 0% 10% 20% 30% 40% 50% 60% 70% 80% 90% 100% >100% I______I______I______I______I______I______I______I______I______I______I______I
2. If you were in the vibration group, which speed of vibration do you think you received?
Not applicable 30 Hz (fast: 30 times per second) 90 Hz (very fast: 90 times per second)
3. Were there any causes of dissatisfaction with the vibration platform use?
No Yes (please check one or more of the items below)
It was too time consuming. Comment:_________________________________________________
It was too large and/and or heavy to use. Comment:_____________________________________
It was difficult to operate. Comment: _________________________________________________
It caused the following long-term health concerns:_______________________________________
It caused the following immediate discomforts:__________________________________________
It was irritable due to noise:_________________________________________________________
Other:__________________________________________________________________________
4. Were there any causes of satisfaction with the vibration platform use?
No Yes (please check one or more of the items below)
It was easy to fit in my schedule. Comment:____________________________________________
It came in a convenient size and weight. Comment: _____________________________________
It was easy to operate. Comment: ___________________________________________________
It improved the following long-term health concerns:_____________________________________
It had pleasant immediate sensation:_________________________________________________
It was relatively quiet to use. Comment:_______________________________________________
Other:__________________________________________________________________________
5. By putting a cross on the line below, indicate what was your overall satisfaction with the platform use?
Very satisfied Satisfied Neutral Unsatisfied Very unsatisfied I_________________ I_________________ I_________________ I_________________I
Luba
Typewritten Text
220

Calcium and Vitamin D Intake Calculator Patient Number __ __ __ Patient Initials __ __ __ Visit ______________
Version: 12-Jan-07
Calcium-Rich Foods Portion Size
mg/portion No portions /week
Calcium (mg)
Vitamin D (IU)
DAIRY PRODUCTS Milk - skim, 1%, 2%, whole, buttermilk or chocolate
1 cup 300 mg 100 IU (D)
Yogurt, plain (reg. or low fat) 3/4 cup 300 mg Yogurt, fruit flavoured (reg. or low fat) 3/4 cup 250 mg Processed cheese slices (reg. or low fat) 1 slice 125 mg Soft and semi-soft cheese such as feta, mozzarella, camembert (reg. or low fat)
1 1/4" cube 150 mg
Firm cheese such as cheddar, swiss, gouda (reg. or low fat)
1 1/4" cube 250 mg
Parmesan cheese 1 Tbsp. 75 mg Cottage cheese (regular or low fat) 1/2 cup 75 mg Skim milk powder 1/3 cup 300 mg
VEGETABLES AND LEGUMES Broccoli 3/4 cup 50 mg Bok choy or Kale, cooked 1 cup 150 mg Chickpeas 1 cup 75 mg Kidney beans, Lima beans, Lentils 1 cup 50 mg Baked beans, Soybeans, White beans 1 cup 150 mg
DESERTS Ice cream 1/2 cup 75 mg Pudding, made with milk 1/2 cup 150 mg Pancakes or Waffles, made with milk 3 medium 150 mg Ice milk, Frozen yogurt (reg. or low fat) 1/2 cup 150 mg
OTHER Bread 1 slice 25 mg Almonds 1/4 cup 75 mg Tofu 3 oz. 150 mg Salmon or Sardines, canned with bones 1/2 can 250 mg Soup, made with milk 1 cup 150 mg Tahini 1 Tbsp. 25 mg Orange (fruit, not juice) 1 medium 50 mg Calcium-fortified beverages (e.g. soy, orange juice, rice)
1 cup 300 mg
Mineral water (carbonated) 1 cup 50mg CALCIUM Total Ca (mg) from diet:_________ mg ÷ 7 = ________ mg/day Total Ca (mg) from own supplements: ________ mg/day Total Ca (mg) from own multivitamin: ________ mg/day Study Ca provided ________mg/day _____tab/day ___bottles_________________type TOTAL Ca ________ mg/day VITAMIN D Total D (IU) from diet:_________ IU ÷ 7 = ________ IU/day Total D (IU) from own supplements: ________ IU/day Total D (IU) from own multivitamin: ________ IU/day Study D provided ________ IU/day _____tab/day ___bottles_________________type TOTAL D ________ iu/day
Luba
Typewritten Text
221

VIBRATION STUDY
MLTPAQ AMI Calculations
Subject #: __ __ __ Subject Initials:__ __ __ Visit: ________________ Person calculating: _______________________________________________
ALL BONE
Light AMI
Moderate AMI
Heavy AMI
TOTAL
Luba
Typewritten Text
222

Interviewer initials: __ __ __ Patient # __ __ __ Patient Initials: __ __ __ Study visit:____________________
Luba
Typewritten Text
223

Interviewer initials: __ __ __ Patient # __ __ __ Patient Initials: __ __ __ Study visit:____________________
Luba
Typewritten Text
224

V
IBR
ATI
ON
STU
DY
A
dver
se E
vent
s
Pat
ient
# _
_ __
__
Par
ticip
ant I
nitia
ls _
_ __
__
Line
#
A
E di
agno
sis
or s
yndr
ome
(if k
now
n)
OR
Sig
n(s)
/Sym
ptom
(s)
Li
st o
ne p
er li
ne
C
ode
D
id A
E
star
t pr
ior t
o ba
selin
e?
D
ate
Star
ted
D
ate
Ende
d,
Cha
nged
in
Seve
rity
Check if event continuing
S
ever
ity
(reco
rd o
ne
code
)*
01=m
ild
02=M
oder
ate
03=S
ever
e 04
=Life
th
reat
enin
g 05
=Fat
al
R
elat
ions
hip
Is th
ere
a re
ason
able
po
ssib
ility
that
the
even
t may
hav
e be
en c
ause
d by
st
udy
treat
men
t.
Act
ion
Take
n fo
r thi
s A
E
(reco
rd a
ll th
at
appl
y)
01=N
o ac
tion
take
n 02
=Stu
dy
treat
men
t dur
atio
n or
freq
uenc
y al
tere
d or
with
held
03
=Med
icat
ion
take
n 04
=Hos
pita
lizat
ion
05=R
emov
ed fr
om
stud
y 06
=Stu
dy
treat
men
t di
scon
tinue
d 08
=Oth
er p
roto
col
drug
alte
red
or
with
held
88
=Oth
er (p
ecify
)
W
as
even
t S
erio
us
( gra
des
4 an
d 5)
?
N
Y
D
ay
dd
Mon
th
mm
m
Year
yy
yy
Day
dd
M
onth
m
mm
Ye
ar
yyyy
N
Y
N
Y
1
2
3
4
5
6
7
8
9
10
11
12
13
14
15
01-M
ild: m
inor
, no
spec
ific
med
ical
inte
rven
tion
02-
Mod
erat
e: m
inim
al/lo
cal/n
onin
vasi
ve m
edic
al in
terv
entio
n 0
3-S
ever
e: s
igni
fican
t sym
ptom
s re
quiri
ng h
ospi
taliz
atio
n or
inva
sive
med
ical
inte
rven
tion
04-
Life
-thre
aten
ing:
nee
d in
tens
ive
care
or e
mer
gent
inva
sive
05
Dea
th
Luba
Typewritten Text
Luba
Typewritten Text
225

V
IBR
ATI
ON
STU
DY
C
urre
nt N
on-In
vest
igat
iona
l Tre
atm
ents
P
atie
nt #
__
__ _
_ P
artic
ipan
t Ini
tials
__
__ _
_
Ple
ase
reco
rd a
ny d
rugs
, vita
min
s, m
iner
als,
sup
plem
ents
, her
bs, n
euro
mus
cula
r tre
atm
ents
(chi
ropr
acto
r, ph
ysio
ther
apy)
, alte
rnat
ive
treat
men
ts (a
cupu
nctu
re,
hom
eopa
th, n
atur
opat
h), a
nd o
pera
tions
/sur
gerie
s fro
m b
asel
ine
until
the
stud
y co
mpl
etio
n.
Li
ne
#
Tr
eatm
ent
Li
st o
ne p
er li
ne
Type
D
=dru
g V
=vita
min
M
=min
eral
S
=sup
plem
ents
H
=her
bs
NM
=
neur
omus
cula
r A
=alte
rnat
ive
O=o
pera
tions
Did
m
edic
atio
n us
e st
art
befo
re fi
rst
treat
men
t ad
min
istra
tion
(i.e
., pr
ior t
o ba
selin
e)?
D
ate
Star
ted
D
ate
Ende
d,
Cha
nged
in D
osin
g
Check if event continuing
D
osin
g
R
easo
ns fo
r tak
ing
med
icat
ion
Des
crip
tion
C
ode
N
o Ye
s D
ay
dd
Mon
th
mm
m
Year
yy
yy
Day
dd
M
onth
m
mm
Ye
ar
yyyy
mg
per
dose
D
ose
per
day
Oth
er
1
2
3
4
5
6
7
8
9
10
11
12
13
14
15
Luba
Typewritten Text
226

227
CHAPTERS TWO AND THREE: A PRIORI DATA ANALYSIS PLAN

Vibration Study’s Analysis Plan
Purpose ..................................................................................................................................................... 2
Trial Flow .................................................................................................................................................. 2
Baseline Characteristics ........................................................................................................................... 3
Main WBV Effect: Between‐Group Differences in Bone Outcomes........................................................ 4
Potential Covariates ................................................................................................................................. 5
Sensitivity Analysis ................................................................................................................................... 6
References ................................................................................................................................................ 7
Luba
Typewritten Text
Luba
Typewritten Text
228

Purpose
Vibration Study is a randomized controlled trial (RCT) designed to examine effects of whole‐body vibration on bone. Our trial’s main objective is to examine whether there are statistically significant differences between study groups (90 Hz WBV group versus 30 HZ WBV group versus control group; 90Hz versus 30Hz versus CON) in absolute pre‐post change in all bone outcomes. The purpose of this analysis plan is to outline and describe a priori analyses (i.e., specified prior to examining the main effect: between‐group differences in bone outcomes), so that our trial’s withdrawal and reporting bias can be reduced1. Bone Outcomes ‐ HR‐pQCT volumetric trabecular (vBMDt), cortical (vBMDc) and total (vBMDtot) BMD, cortical thickness (CTh),
and trabecular thickness, separation, number and bone volume fraction (TTh, TSp, TN, BV/TV) at the distal tibia and distal radius
‐ DXA areal BMD at the total hip, femoral neck, and lumbar spine (aBMDh, aBMDf, aBMDs) ‐ Calcaneal QUS BUA, SOS, QUI Primary Outcome vBMDt at the distal tibia Hypothesis Significantly smaller reductions in the above bone outcomes are expected to be found in 90Hz and 30Hz versus CON, with greater differences occurring between 90Hz versus CON in comparison to 30Hz versus CON. TSp is expected to change in the opposite direction.
Trial Flow
Adapted version of the CONSORT flow diagram below will be used to outline our trial’s progression from recruitment to analysis and will serve as Figure 1 in our main publication.
Luba
Typewritten Text
229

Baseline Characteristics
Purpose ‐To examine whether potential covariates are evenly distributed between 90Hz, 30Hz and CON at baseline ‐To describe 90Hz, 30Hz and CON at baseline in terms of relevant clinical and demographic characteristics Study sample All randomized participants Variable selection Potential covariates and relevant study population characteristics Statistical analyses Descriptive statistics: Counts and percentages will be obtained for categorical variables. Mean and standard deviations will be obtained for continuous variables; data dispersion, outliers, and data distribution will also be examined. Inferential statistics: One‐way ANOVA will assess between‐group differences (90Hz x 30Hz x CON) in continuous baseline variables. Levene’s test for homogeneity of variances will be conducted, and if significant Welch’s ANOVA p value will be noted. X2 statistic will assess between‐group differences (90Hz x 30Hz x CON) in categorical baseline variables (predictor = study group; outcome = categorical baseline variable). Fisher’s exact test will be reported for variables with <5 entries per cell. Reporting The below table summary of baseline characteristics will serve as Table 1 in our main publication. Baseline Characteristics
Category 90Hz (n=)
30Hz (n=)
CON (n=)
Continuous baseline characteristic, mean (SD) ‐ … ‐ Categorical baseline characteristic, n (%) Category A Category B ….
Luba
Typewritten Text
230

Main WBV Effect: Between‐Group Differences in Bone Outcomes Purpose ‐To examine between‐group differences in 12‐month change in all bone outcomes Study sample Intention‐to‐treat (ITT) and per‐protocol data sets Variable selection All bone outcomes Statistical analyses Descriptive statistics: Mean and standard deviations will be obtained. Data dispersion and outliers will be inspected. Data distribution will be examined using Shapiro‐Wilk test. Inferential statistics: One‐way ANOVA with contrasts will assess between‐group (90Hz x 30Hz x CON), all pair‐wise (90Hz x 30Hz, 30Hz x CON, 90Hz x CON), and 90Hz plus 30Hz versus CON group (90Hz + 30Hz x CON) differences in absolute 12‐month change (final minus baseline) in all bone outcomes. Levene’s test for homogeneity of variances will be conducted, and if significant Welch’s ANOVA p value will be noted. Reporting The following table summary of all bone outcomes in the ITT and per‐protocol data sets will serve as Table 2 in the main publication. Intention‐to‐treat (n=) Per‐protocol (n=) Bone Outcomes: Absolute Pre‐Post Change
90 Hz WBV
30 Hz WBV
Control
90 Hz
30 Hz
Control
Etc…
Version: April 2010 4
Luba
Typewritten Text
231

Potential Covariates
Purpose ‐ To examine effects of potential covariates on between‐group differences in 12‐month change in all bone outcomes Study sample Per‐protocol data set Variables selection All bone outcomes and the following potential covariates1 will be examined: 1) Adherence to WBV: Bones of ≥80% adherent participants are expected to respond more to WBV3. 2) Baseline body mass: Significant WBV effect was previously found, but only in a subgroup analysis of
postmenopausal women <65kg in mass3. Fat tissue may dissipate WBV in the body. 3) Serum vitamin D levels: Vitamin D is necessary for bone metabolism, as it assists with skeletal calcium
absorption. Stronger WBV effect on bone is expected with higher serum vitamin D levels. 4) Age: Muscle mass decreases with age. Due to their larger muscle mass, younger postmenopausal
women’s bones would be expected to respond more to WBV4. 5) Age from menopause: Higher bone metabolism occurs for up to ~10 years after menopause5, during
which time WBV effect would be expected to be stronger than when the skeleton is less active. 6) Physical activity levels: Physical stimulus due to exercise can increase bone accrual in postmenopausal
women6, and as such could compete with WBV effect on bone. Statistical analyses Descriptive statistics: Mean and standard deviations will be obtained. Data dispersion and outliers will be inspected. Data distribution will be examined using Shapiro‐Wilk test. Subgroup analyses: One‐way ANOVA with contrasts will assess differences between groups (90Hz x 30Hz x CON; 90Hz x 30Hz, 30Hz x CON, 90Hz x CON; 90Hz + 30Hz x CON) in absolute pre‐post change (final minus baseline) in all bone outcomes using the following subgroups: 1) ≥80% adherent to WBV, 2) <65 kg in mass, 3) ≤60 years‐old, and 4) ≤5 years and ≤10 years since menopause (one will be reported) ANCOVA analysis: One‐way ANCOVA with contrasts will assess differences between groups (90Hz x 30Hz x CON; 90Hz x 30Hz, 30Hz x CON, 90Hz x CON; 90Hz + 30Hz x CON) in absolute pre‐post change (final minus baseline) in all bone outcomes, where each of the following potential covariates will be adjusted for separately: 1) serum 25‐hydroxy vitamin D level, and 2) baseline change in physical activity level. Reporting All potential covariates analyses will be reported in‐text.
1Potential covariate is a source of variation that is not controlled for in the design of a RCT. It is associated with the predictor (study group) and outcome (bone change), and should not correlate highly with another covariate.
Version: April 2010 5
Luba
Typewritten Text
232

Sensitivity Analysis
Purpose ‐ To examine whether excluding participants with potential causes for compromised study conduct, bone measurement or bone metabolism alters the main effect findings Study sample Per‐protocol data set, with participants excluded due to following pre‐specified sensitivity reasons: 1) Potential causes for compromised study conduct
a. Unknown true adherence to WBV due to digital clock malfunction b. Improper WBV administration (e.g., sitting or wearing shoes) c. Other
2) Potential causes for compromised bone measurement a. Late (>120 days) final bone measurement b. Poorly matched (<80%) baseline and final HR‐pQCT bone scans c. Other
3) Potential causes for compromised bone metabolism during study
a. Questionable bone history revealed after study participation (e.g., prior bisphosphonate use) b. Taking medications during study that may have altered bone metabolism c. Ankle or wrist immobilization due to fracture and wearing a cast during study d. Other
Variable selection All bone outcomes Statistical analyses Descriptive statistics: Mean and standard deviations will be obtained. Data dispersion and outliers will be inspected. Data distribution will be examined using Shapiro‐Wilk test. Inferential statistics: One‐way ANOVA with contrasts will assess differences between groups (90Hz x 30Hz x CON; 90Hz x 30Hz, 30Hz x CON, 90Hz x CON; 90Hz + 30Hz x CON) in absolute pre‐post change (final minus baseline) in all bone outcomes. Levene’s test for homogeneity of variances will be conducted, and if significant Welch’s ANOVA p value will be noted. Reporting Sensitivity analysis will be summarized in‐text.
Version: April 2010 6
Luba
Typewritten Text
233

References
1. Jadad AR, Enkin MW. Chapter 3: Bias in RCTs. Randomized Controlled Trials: Questions, Answers, and Musings (2nd Ed). Malden: USA: Blackwell Publishing; 2007:38‐9. 2. Vickers AJ. The use of percentage change from baseline as an outcome in a controlled trial is statistically inefficient: a simulation study. BMC Med Res Method. 2001;1:1‐4. 3. Rubin C, Recker R, Cullen D, Ryaby J, McCabe J, McLeod K. Prevention of postmenopausal bone loss by a low‐magnitude, high‐frequency mechanical stimuli: a clinical trial assessing compliance, efficacy, and safety. J Bone Miner Res. 2004;19:343‐351. 4. Torvinen S, Kannus P, Sievanen H et al. Effect of 8‐month vertical whole body vibration on bone, muscle performance, and body balance: a randomized controlled study. J Bone Miner Res. 2003;18:876‐884. 5. Reid IR. Menopause. In: Favus MJ, ed. Primer on the Metabolic Bone Diseases and Disorders of Mineral Metabolism, 7th edn. Washington: American Society for Bone and Mineral Research; 2006:68‐70. 6. Chan K, Qin L, Lau M et al. A randomized, prospective study of the effects of Tai Chi Chun Exercise on Bone Mineral Density in Postmenopausal Women. Archives of Physical Medicine & Rehabilitation. 2004;85:717‐722.
Version: April 2010 7
Luba
Typewritten Text
234

235
CHAPTER TWO: SAS CODES

1
*************************************************************************************************************************
PRIMARY ANALYSIS OF VIBRATION STUDY HR-PQCT AND DXA OUTCOMES
*************************************************************************************************************************;
TITLE VIBRATION STUDY DATA FILE; r
un;
libname lubalib 'Z:\_LUBA_\2_VIBRATION STUDY\Data Analysis\SAS'; d
ata cov1; set lubalib.cov1;
run;
libname lubalib 'Z:\_LUBA_\2_VIBRATION STUDY\Data Analysis\SAS'; d
ata covadd; set lubalib.covadd;
run;
libname lubalib 'Z:\_LUBA_\2_VIBRATION STUDY\Data Analysis\SAS'; d
ata dxa1; set lubalib.dxa1;
run;
libname lubalib 'Z:\_LUBA_\2_VIBRATION STUDY\Data Analysis\SAS'; d
ata pqct1tib; set lubalib.pqct1tib;
run;
libname lubalib 'Z:\_LUBA_\2_VIBRATION STUDY\Data Analysis\SAS'; d
ata pqct1rad; set lubalib.pqct1rad;
run;
data cov1A; set cov1;
B_bmi= B_mass/(B_height**2); F_bmi= F_mass/(F_height**2);
B_age= (bsldate-dob)/3
65.2
5;
B_pat= (B_pal+B_pam+B_pah)*5
2/36
5.25; F_pat= (F_pal+F_pam+F_pah)*5
2/36
5.25;
y1=year(B_lastperiod); y2=year(bsldate); PMage=y2-y1;
if hys='y' or ova='y' then mp='surgical';
if id='005' or id='044' or id='138' or id='187' or id='197' then mp='natural'; /*these had only 1 ovary removed*/
if hys='n' and ova='n' then mp='natural';
if B_alcservwk = 0 then alcohol='none'; if B_alcservwk > 7 then alcohol='>1d'; if B_alcservwk >
0 and B_alcservwk <= 7 then
alcohol='=<1d';
if ethnicity='AFRO-CARIBBEAN' or ethnicity='HISPANIC' or ethnicity='WEST-ASIAN' then ethnicity='OTHER';
if marital='OTHER' or marital='MARRIED' then marital='MARR/COMMON';
if marital='DIVORCED' or marital='SEPARATED' or marital='WIDOWED' then marital='DIV/SEP/WID';
if education='ELEMENTARY' or education='SECONDARY' then education='SEC/ELE';
if education='COLLEGE' or education='UNDERGRADUATE' then education='UNDERGRAD/COLLEGE';
x_ca=(b_castudy-b_calin); x_vitd=(b_vitdstudy-B_vitdin); x_mass=(f_mass-B_mass); x_BMI= (f_bmi-b_bmi); x_pat=(f_pat-b_pat);
keep id group dob B_age menarche PMage mp B_mass B_height B_bmi ethnicity education marital osteofamhx alcohol smokehx
B_calin B_vitdin B_pat Dlevel X_ca x_vitd x_mass x_BMI x_pat;
run;
data dxa1A; set dxa1;
x_aBMDf=(F_aBMDf-B_aBMDf);x_aBMDh=(F_aBMDh-B_aBMDh);x_aBMDs=(F_aBMDs-B_aBMDs);
keep id b_aBMDf x_aBMDf b_aBMDh x_aBMDh b_aBMDs x_aBMDs ;r
un;
data pqct1tibA; set pqct1tib;
X_vBMDtt=(F_vBMDt-B_vBMDt);X_vBMDct=(F_vBMDc-B_vBMDc);X_vBMD100t=(F_vBMD100-B_vBMD100);X_CTht=(F_CTh-B_CTh);
X_TTht=(F_TTh-B_TTh);X_TNt=(F_TN-B_TN);X_TSpt=(F_TSp-B_TSp);X_BVTVt=(F_TBV_TV-B_TBV_TV);
keep id
B_vBMDt B_vBMDc B_vBMD100 B_CTh B_TTh B_TN B_TSp B_TBV_TV areatot commregion sliceshift
x_vBMDtt x_vBMDct x_vBMD100t x_CTht x_TTht x_TNt x_TSpt x_BVTVt ;
rename
B_CTh=B_CTht B_TBV_TV=B_BVTVt B_TN=B_TNt B_TSp=B_TSpt B_TTh=B_TTht B_vBMD100=B_vBMD100t B_vBMDc=B_vBMDct
B_vBMDt=B_vBMDtt areatot=areatott commregion=commregiont sliceshift=sliceshiftt; r
un;
data pqct1radA; set pqct1rad;
X_vBMDtr=(F_vBMDt-B_vBMDt);X_vBMDcr=(F_vBMDc-B_vBMDc);X_vBMD100r=(F_vBMD100-B_vBMD101);X_CThr=(F_CTh-B_CTh);
X_TThr=(F_TTh-B_TTh);X_TNr=(F_TN-B_TN);X_TSpr=(F_TSp-B_TSp);X_BVTVr=(F_TBV_TV-B_TBV_TV);
keep id
B_vBMDt B_vBMDc B_vBMD101 B_CTh B_TTh B_TN B_TSp B_TBV_TV areatot commregion sliceshift
x_vBMDtr x_vBMDcr x_vBMD100r x_CThr x_TThr x_TNr x_TSpr x_BVTVr ;
rename
B_CTh=B_CThr B_TBV_TV=B_BVTVr B_TN=B_TNr B_TSp=B_TSpr B_TTh=B_TThr B_vBMD101=B_vBMD100r B_vBMDc=B_vBMDcr
B_vBMDt=B_vBMDtr areatot=areatotr commregion=commregionr sliceshift=sliceshiftr; r
un;
data vib; merge cov1A covadd dxa1A pqct1tibA pqct1radA; by id; r
un;
proc s
ort data=vib out=vibsort; by group;
run;
2
TITLE BASELINE ANALYSES;
proc g
lm data=vib;
class group; model B_mass=group;
means group;
run;
proc g
lm data=vib;
class group; model B_height=group; means group;
run;
proc g
lm data=vib;
class group; model B_bmi=group;
means group;
run;
proc g
lm data=vib;
class group; model B_age=group;
means group;
run;
proc g
lm data=vib;
class group; model menarche=group; means group;
run;
proc g
lm data=vib;
class group; model B_pat=group;
means group;
run;
proc g
lm data=vib;
class group; model B_calin=group; means group;
run;
proc g
lm data=vib;
class group; model B_vitdin=group; means group;
run; q
uit;
data surgical;set vib; if mp='surgical'; r
un;
data natural; set vib; if mp='natural';
run;
proc g
lm data=surgical;class group; model PMage=group;
means group;
run;
proc g
lm data=natural; class group; model PMage=group;
means group;
run;
quit;
proc f
req data=vib; tables ethnicity*group
/chisq exact;r
un;
proc f
req data=vib; tables education*group
/chisq exact;r
un;
proc f
req data=vib; tables marital*group /chisq exact;r
un;
proc f
req data=vib; tables osteofamhx*group /chisq exact;r
un;
proc f
req data=vib; tables alcohol*group /chisq exact;r
un;
proc f
req data=vib; tables smokehx*group /chisq exact;r
un;
proc f
req data=vib; tables bfall*group /chisq exact; r
un;
proc g
lm data=vib;
class group; model B_aBMDf=group; means group;
run;
proc g
lm data=vib;
class group; model B_aBMDh=group; means group;
run;
proc g
lm data=vib;
class group; model B_aBMDs=group; means group;
run;
libname lubalib 'Z:\_LUBA_\2_VIBRATION STUDY\Data Analysis\SAS'; d
ata bslT; set lubalib.bslT;
run;/*unadjusted baseline*/
libname lubalib 'Z:\_LUBA_\2_VIBRATION STUDY\Data Analysis\SAS'; d
ata bslR; set lubalib.bslR;
run;
proc g
lm data=bslT;
class group; model B_vBMDt=group; means group;
run;
proc g
lm data=bslT;
class group; model B_vBMDc=group; means group;
run;
proc g
lm data=bslT;
class group; model B_vBMD100=group; means group;
run;
proc g
lm data=bslT;
class group; model B_CTh=group;
means group;
run;
proc g
lm data=bslT;
class group; model B_TTh=group;
means group;
run;
proc g
lm data=bslT;
class group; model B_TN=group;
means group;
run;
proc g
lm data=bslT;
class group; model B_TSp=group;
means group;
run;
proc g
lm data=bslT;
class group; model B_TBV_TV=group; means group;
run;
proc g
lm data=bslR;
class group; model B_vBMDt=group; means group;
run;
proc g
lm data=bslR;
class group; model B_vBMDc=group; means group;
run;
proc g
lm data=bslR;
class group; model B_vBMD100=group; means group;
run;
proc g
lm data=bslR;
class group; model B_CTh=group;
means group;
run;
proc g
lm data=bslR;
class group; model B_TTh=group;
means group;
run;
proc g
lm data=bslR;
class group; model B_TN=group;
means group;
run;
proc g
lm data=bslR;
class group; model B_TSp=group;
means group;
run;
proc g
lm data=bslR;
class group; model B_TBV_TV=group; means group;
run; q
uit;
3
title OTHER NON-BASELINE COVARIATES;
data vibadh; set vib; if group='C' then delete;
proc t
test data=vibadh; class group; var adherence1 adherence2 adherence3 ;
run;
proc g
lm data=vib;class group; model adhcd=group; means group/hovtest=levene welch;r
un;
proc g
lm data=vib;class group; model x_ca=group; means group/hovtest=levene welch;
run;
proc g
lm data=vib;class group; model x_vitd=group; means group/hovtest=levene welch;
run;
proc g
lm data=vib;class group; model x_mass=group; means group/hovtest=levene welch;
run;
proc g
lm data=vib;class group; model x_bmi=group; means group/hovtest=levene welch;r
un;
proc g
lm data=vib;class group; model x_pat=group; means group/hovtest=levene welch;r
un;
proc g
lm data=vib;class group; model dlevel=group; means group/hovtest=levene welch;
run; q
uit;
title AEs AND FALLS;
proc f
req data=vib; tables ae*group /chisq exact;r
un;
proc f
req data=vib; tables sae*group /chisq exact; r
un;
data leg; set vib; if leg>
1 then leg=1;p
roc
freq data=leg; tables leg*group /chisq exact;
run;
data back; set vib; if back='p' then back='z'; r
un;
proc f
req data=back; tables back*group /chisq exact; r
un;
data back2; set back; if back='z' then delete; r
un;
proc f
req data=back2; tables back*group /chisq exact;
run;
data fall; set vib; if sfall>
1 then sfall=2;
proc f
req data=fall; tables sfall*group /chisq exact; r
un;
data fall2; set vib; if sfall>
1 then sfall=1;
proc f
req data=fall2; tables sfall*group /chisq exact; r
un;
title ITT ANALYSIS single imputation/group mean; *7 drop outs imputed from the original data without d/o and with HRT;
pr
oc m
eans data=vibsort mean n nmiss; by group; var X_aBMDf X_aBMDh X_aBMDs
X_vBMDtt X_vBMDct X_vBMD100t X_CTht X_TTht X_TNt X_TSpt X_BVTVt X_vBMDtr X_vBMDcr X_vBMD100r X_CThr X_TThr X_TNr X_TSpr
X_BVTVr;
run;
data vibITT; set vib;
if group='A' and X_aBMDf='.' then X_aBMDf=-
0.00
498; if group='A' and X_aBMDh='.' then X_aBMDh=-0
.003
54;if group='A'
and X_aBMDs='.' then X_aBMDs=-
0.00
655;
if group='A' and x_vBMDtt='.' then X_vBMDtt=
0.39
846; if group='A' and X_vBMDct='.' then X_vBMDct=-
10.9
2615;
if group='A' and X_vBMD100t='.' then X_vBMD100t=-1
.369
23;if group='A' and X_CTht='.' then X_CTht=0
.000
15; if group='A'
and X_TTht='.' then X_TTht=-0
.003
14;
if group='A' and X_TNt='.' then X_TNt=0
.070
46; if group='A' and X_TSpt='.' then X_TSpt=-
0.02
240; if group='A'
and X_BVTVt='.' then X_BVTVt=0
.000
31;
if group='A' and X_vBMDtr='.' then X_vBMDtr=-2
.165
63; if group='A' and X_vBMDcr='.' then X_vBMDcr=-
14.7
8594;
if group='A' and X_vBMD100r='.' then X_vBMD100r=-5
.150
0; if group='A' and X_CThr='.' then X_CThr=-
0.00
719; if group='A'
and X_TThr='.' then X_TThr=-0
.001
80;
if group='A' and X_TNr='.' then X_TNr=0
.030
62; if group='A' and X_TSpr='.' then X_TSpr=-
0.00
230; if group='A'
and X_BVTVr='.' then X_BVTVr=-
0.00
178 ;
/*group=A Variable Mean N Miss
x_aBMDf -0.0049763 65 2
x_aBMDh -0.0035387 65 2
x_aBMDs -0.0065544 65 2
4
X_vBMDtt
0.3984615 65 2
X_vBMDct -10.9261538 65 2
X_vBMD100t -1.3692308 65 2
X_CTht 0.000153846 65 2
X_TTht -0.0031385 65 2
X_TNt 0.0704615 65 2
X_TSpt -0.0224000 65 2
X_BVTVt 0.000307692 65 2
X_vBMDtr -2.1656250 64 3
X_vBMDcr -14.7859375 64 3
X_vBMD100r -5.1500000 64 3
X_CThr -0.0071875 64 3
X_TThr -0.0017969 64 3
X_TNr 0.0306250 64 3
X_TSpr -0.0022969 64 3
X_BVTVr -0.0017812 64 3*/
if group='B' and X_aBMDf='.' then X_aBMDf=-
0.00
549; if group='B' and X_aBMDh='.' then X_aBMDh=-0
.001
60;if group='B'
and X_aBMDs='.' then X_aBMDs=-
0.00
823;
if group='B' and x_vBMDtt='.' then X_vBMDtt=-0
.100
0; if group='B' and x_vBMDct='.' then X_vBMDct=-
10.4
3968;
if group='B' and x_vBMD100t='.' then X_vBMD100t=-2
.293
65;if group='B' and x_CTht='.' then X_CTht=-
0.00
635; if group='B'
and x_TTht='.' then X_TTht=-0
.003
73;
if group='B' and x_TNt='.' then X_TNt=0
.078
10; if group='B' and x_TSpt='.' then X_TSpt=-
0.02
270; if group='B'
and x_BVTVt='.' then X_BVTVt=-
0.00
005;
if group='B' and X_vBMDtr='.' then X_vBMDtr=-1
.550
79; if group='B' and X_vBMDcr='.' then X_vBMDcr=-
10.3
6032;
if group='B' and X_vBMD100r='.' then X_vBMD100r=-3
.753
97;if group='B' and X_CThr='.' then X_CThr=-
0.00
556; if group='B'
and X_TThr='.' then X_TThr=-0
.002
13;
if group='B' and X_TNr='.' then X_TNr=0
.035
71; if group='B' and X_TSpr='.' then X_TSpr=-
0.01
041; if group='B'
and X_BVTVr='.' then X_BVTVr=-
0.00
135;
/*group=B Variable Mean N Miss
x_aBMDf -0.0054864 65 3
x_aBMDh -0.0016012 65 3
x_aBMDs -0.0082332 65 3
X_vBMDtt -0.1000000 63 5
X_vBMDct -10.4396825 63 5
X_vBMD100t -2.2936508 63 5
X_CTht -0.0063492 63 5
X_TTht -0.0037302 63 5
X_TNt 0.0780952 63 5
X_TSpt -0.0226984 63 5
X_BVTVt -0.000047619 63 5
X_vBMDtr -1.5507937 63 5
X_vBMDcr -10.3603175 63 5
X_vBMD100r -3.7539683 63 5
X_CThr -0.0055556 63 5
X_TThr -0.0021270 63 5
X_TNr 0.0357143 63 5
X_TSpr -0.0104127 63 5
Luba
Typewritten Text
236

5
X_BVTVr -
0.0013492 63 5*/
if group='C' and X_aBMDf='.' then X_aBMDf=-
0.00
146; if group='C' and X_aBMDh='.' then X_aBMDh=-0
.002
36;if group='C'
and X_aBMDs='.' then X_aBMDs=-
0.00
669;
if group='C' and x_vBMDtt='.' then X_vBMDtt=-0
.241
54; if group='C' and x_vBMDct='.' then X_vBMDct=-
9.16
462;
if group='C' and x_vBMD100t='.' then X_vBMD100t=-1
.718
46;if group='C' and x_CTht='.' then X_CTht=0
.000
77; if group='C'
and X_TTht='.' then X_TTht=-0
.002
54;
if group='C' and X_TNt='.' then X_TNt=0
.056
31; if group='C' and X_TSpt='.' then X_TSpt=-
0.01
775; if group='C'
and X_BVTVt='.' then X_BVTVt=-
0.00
020;
if group='C' and X_vBMDtr='.' then X_vBMDtr=-1
.000
0; if group='C' and X_vBMDcr='.' then X_vBMDcr=-
12.9
6563;
if group='C' and X_vBMD100r='.' then X_vBMD100r=-5
.210
94;if group='C' and X_CThr='.' then X_CThr=-
0.01
359; if group='C'
and X_TThr='.' then X_TThr=-0
.001
39;
if group='C' and X_TNr='.' then X_TNr=0
.023
75; if group='C' and X_TSpr='.' then X_TSpr=-
0.00
795; if group='C'
and X_BVTVr='.' then X_BVTVr=-0
.000
84;r
un;
/*group=C Variable Mean N Miss
x_aBMDf -0.0014627 65 2
x_aBMDh -0.0023598 65 2
x_aBMDs -0.0066935 65 2
X_vBMDtt -0.2415385 65 2
X_vBMDct -9.1646154 65 2
X_vBMD100t -1.7184615 65 2
X_CTht 0.000769231 65 2
X_TTht -0.0025385 65 2
X_TNt 0.0563077 65 2
X_TSpt -0.0177538 65 2
X_BVTVt -0.000200000 65 2
X_vBMDtr -1.0000000 64 3
X_vBMDcr -12.9656250 64 3
X_vBMD100r -5.2109375 64 3
X_CThr -0.0135937 64 3
X_TThr -0.0013906 64 3
X_TNr 0.0237500 64 3
X_TSpr -0.0079531 64 3
X_BVTVr -0.000843750 64 3*/
pr
oc g
lm data=vibITT; class group; model X_aBMDf=group; means group/hovtest=levene welch;
contrast 'A>B>C: A vs B'
group
1 -1
0;
contrast 'A>B>C: B vs C'
group
0 1 -
1;
contrast 'A>B>C: C vs A'
group
1 0 -
1;
contrast 'A=B>C: A+B vs C'
group
1 1 -
2; r
un;
quit;
proc g
lm data=vibITT; class group; model X_aBMDh=group; means group/hovtest=levene welch;
contrast 'A>B>C: A vs B'
group
1 -1
0;
contrast 'A>B>C: B vs C'
group
0 1 -
1;
contrast 'A>B>C: C vs A'
group
1 0 -
1;
contrast 'A=B>C: A+B vs C'
group
1 1 -
2; r
un;
quit;
proc g
lm data=vibITT; class group; model X_aBMDs=group; means group/hovtest=levene welch;
contrast 'A>B>C: A vs B'
group
1 -1
0;
contrast 'A>B>C: B vs C'
group
0 1 -
1;
contrast 'A>B>C: C vs A'
group
1 0 -
1;
6
contrast 'A=B>C: A+B vs C'
group
1 1 -
2; r
un;
quit;
proc g
lm data=vibITT; class group; model X_vBMDtt=group;
means group/hovtest=levene welch;
contrast 'A>B>C: A vs B'
group
1 -1
0;
contrast 'A>B>C: B vs C'
group
0 1 -
1;
contrast 'A>B>C: C vs A'
group
1 0 -
1;
contrast 'A=B>C: A+B vs C'
group
1 1 -
2; r
un;
quit;
proc g
lm data=vibITT; class group; model X_vBMDct=group;
means group/hovtest=levene welch;
contrast 'A>B>C: A vs B'
group
1 -1
0;
contrast 'A>B>C: B vs C'
group
0 1 -
1;
contrast 'A>B>C: C vs A'
group
1 0 -
1;
contrast 'A=B>C: A+B vs C'
group
1 1 -
2; r
un;
quit;
proc g
lm data=vibITT; class group; model X_vBMD100t=group; means group/hovtest=levene welch;
contrast 'A>B>C: A vs B'
group
1 -1
0;
contrast 'A>B>C: B vs C'
group
0 1 -
1;
contrast 'A>B>C: C vs A'
group
1 0 -
1;
contrast 'A=B>C: A+B vs C'
group
1 1 -
2; r
un;
quit;
proc g
lm data=vibITT; class group; model X_CTht=group;
means group/hovtest=levene welch;
contrast 'A>B>C: A vs B'
group
1 -1
0;
contrast 'A>B>C: B vs C'
group
0 1 -
1;
contrast 'A>B>C: C vs A'
group
1 0 -
1;
contrast 'A=B>C: A+B vs C'
group
1 1 -
2; r
un;
quit;
proc g
lm data=vibITT; class group; model X_TTht=group;
means group/hovtest=levene welch;
contrast 'A>B>C: A vs B'
group
1 -1
0;
contrast 'A>B>C: B vs C'
group
0 1 -
1;
contrast 'A>B>C: C vs A'
group
1 0 -
1;
contrast 'A=B>C: A+B vs C'
group
1 1 -
2; r
un;
quit;
proc g
lm data=vibITT; class group; model X_TNt=group;
means group/hovtest=levene welch;
contrast 'A>B>C: A vs B'
group
1 -1
0;
contrast 'A>B>C: B vs C'
group
0 1 -
1;
contrast 'A>B>C: C vs A'
group
1 0 -
1;
contrast 'A=B>C: A+B vs C'
group
1 1 -
2; r
un;
quit;
proc g
lm data=vibITT; class group; model X_TSpt=group;
means group/hovtest=levene welch;
contrast 'A>B>C: A vs B'
group
1 -1
0;
contrast 'A>B>C: B vs C'
group
0 1 -
1;
contrast 'A>B>C: C vs A'
group
1 0 -
1;
contrast 'A=B>C: A+B vs C'
group
1 1 -
2; r
un;
quit;
proc g
lm data=vibITT; class group; model X_BVTVt=group;
means group/hovtest=levene welch;
contrast 'A>B>C: A vs B'
group
1 -1
0;
contrast 'A>B>C: B vs C'
group
0 1 -
1;
contrast 'A>B>C: C vs A'
group
1 0 -
1;
contrast 'A=B>C: A+B vs C'
group
1 1 -
2; r
un;
quit;
proc g
lm data=vibITT; class group; model X_vBMDtr=group;
means group/hovtest=levene welch;
contrast 'A>B>C: A vs B'
group
1 -1
0;
contrast 'A>B>C: B vs C'
group
0 1 -
1;
contrast 'A>B>C: C vs A'
group
1 0 -
1;
contrast 'A=B>C: A+B vs C'
group
1 1 -
2; r
un;
quit;
proc g
lm data=vibITT; class group; model X_vBMDcr=group;
means group/hovtest=levene welch;
7
contrast 'A>B>C: A vs B'
group
1 -1
0;
contrast 'A>B>C: B vs C'
group
0 1 -
1;
contrast 'A>B>C: C vs A'
group
1 0 -
1;
contrast 'A=B>C: A+B vs C'
group
1 1 -
2; r
un;
quit;
proc g
lm data=vibITT; class group; model X_vBMD100r=group; means group/hovtest=levene welch;
contrast 'A>B>C: A vs B'
group
1 -1
0;
contrast 'A>B>C: B vs C'
group
0 1 -
1;
contrast 'A>B>C: C vs A'
group
1 0 -
1;
contrast 'A=B>C: A+B vs C'
group
1 1 -
2; r
un;
quit;
proc g
lm data=vibITT; class group; model X_CThr=group;
means group/hovtest=levene welch;
contrast 'A>B>C: A vs B'
group
1 -1
0;
contrast 'A>B>C: B vs C'
group
0 1 -
1;
contrast 'A>B>C: C vs A'
group
1 0 -
1;
contrast 'A=B>C: A+B vs C'
group
1 1 -
2; r
un;
quit;
proc g
lm data=vibITT; class group; model X_TThr=group;
means group/hovtest=levene welch;
contrast 'A>B>C: A vs B'
group
1 -1
0;
contrast 'A>B>C: B vs C'
group
0 1 -
1;
contrast 'A>B>C: C vs A'
group
1 0 -
1;
contrast 'A=B>C: A+B vs C'
group
1 1 -
2; r
un;
quit;
proc g
lm data=vibITT; class group; model X_TNr=group;
means group/hovtest=levene welch;
contrast 'A>B>C: A vs B'
group
1 -1
0;
contrast 'A>B>C: B vs C'
group
0 1 -
1;
contrast 'A>B>C: C vs A'
group
1 0 -
1;
contrast 'A=B>C: A+B vs C'
group
1 1 -
2; r
un;
quit;
proc g
lm data=vibITT; class group; model X_TSpr=group;
means group/hovtest=levene welch;
contrast 'A>B>C: A vs B'
group
1 -1
0;
contrast 'A>B>C: B vs C'
group
0 1 -
1;
contrast 'A>B>C: C vs A'
group
1 0 -
1;
contrast 'A=B>C: A+B vs C'
group
1 1 -
2; r
un;
quit;
proc g
lm data=vibITT; class group; model X_BVTVr=group;
means group/hovtest=levene welch;
contrast 'A>B>C: A vs B'
group
1 -1
0;
contrast 'A>B>C: B vs C'
group
0 1 -
1;
contrast 'A>B>C: C vs A'
group
1 0 -
1;
contrast 'A=B>C: A+B vs C'
group
1 1 -
2; r
un;
quit;
8
title PER-PROTOCOL ANALYSIS drop-outs and HRT excluded;
/*EXCLUDED n=9*/
data vibPP; set vib; if id='021' or id='065' or id='100' or id='111' or id='140' or id='158' or id='163' OR id='053' or
id='116' then delete;
proc g
lm data=vibPP; class group; model X_aBMDf=group; means group/hovtest=levene welch;
contrast 'A>B>C: A vs B'
group
1 -1
0;
contrast 'A>B>C: B vs C'
group
0 1 -
1;
contrast 'A>B>C: C vs A'
group
1 0 -
1;
contrast 'A=B>C: A+B vs C'
group
1 1 -
2; r
un;
quit;
proc g
lm data=vibPP; class group; model X_aBMDh=group; means group/hovtest=levene welch;
contrast 'A>B>C: A vs B'
group
1 -1
0;
contrast 'A>B>C: B vs C'
group
0 1 -
1;
contrast 'A>B>C: C vs A'
group
1 0 -
1;
contrast 'A=B>C: A+B vs C'
group
1 1 -
2; r
un;
quit;
proc g
lm data=vibPP; class group; model X_aBMDs=group; means group/hovtest=levene welch;
contrast 'A>B>C: A vs B'
group
1 -1
0;
contrast 'A>B>C: B vs C'
group
0 1 -
1;
contrast 'A>B>C: C vs A'
group
1 0 -
1;
contrast 'A=B>C: A+B vs C'
group
1 1 -
2; r
un;
quit;
proc g
lm data=vibPP; class group; model X_vBMDtt=group;
means group/hovtest=levene welch;
contrast 'A>B>C: A vs B'
group
1 -1
0;
contrast 'A>B>C: B vs C'
group
0 1 -
1;
contrast 'A>B>C: C vs A'
group
1 0 -
1;
contrast 'A=B>C: A+B vs C'
group
1 1 -
2; r
un;
quit;
proc g
lm data=vibPP; class group; model X_vBMDct=group;
means group/hovtest=levene welch;
contrast 'A>B>C: A vs B'
group
1 -1
0;
contrast 'A>B>C: B vs C'
group
0 1 -
1;
contrast 'A>B>C: C vs A'
group
1 0 -
1;
contrast 'A=B>C: A+B vs C'
group
1 1 -
2; r
un;
quit;
proc g
lm data=vibPP; class group; model X_vBMD100t=group; means group/hovtest=levene welch;
contrast 'A>B>C: A vs B'
group
1 -1
0;
contrast 'A>B>C: B vs C'
group
0 1 -
1;
contrast 'A>B>C: C vs A'
group
1 0 -
1;
contrast 'A=B>C: A+B vs C'
group
1 1 -
2; r
un;
quit;
proc g
lm data=vibPP; class group; model X_CTht=group;
means group/hovtest=levene welch;
contrast 'A>B>C: A vs B'
group
1 -1
0;
contrast 'A>B>C: B vs C'
group
0 1 -
1;
contrast 'A>B>C: C vs A'
group
1 0 -
1;
contrast 'A=B>C: A+B vs C'
group
1 1 -
2; r
un;
quit;
proc g
lm data=vibPP; class group; model X_TTht=group;
means group/hovtest=levene welch;
contrast 'A>B>C: A vs B'
group
1 -1
0;
contrast 'A>B>C: B vs C'
group
0 1 -
1;
contrast 'A>B>C: C vs A'
group
1 0 -
1;
contrast 'A=B>C: A+B vs C'
group
1 1 -
2; r
un;
quit;
proc g
lm data=vibPP; class group; model X_TNt=group;
means group/hovtest=levene welch;
contrast 'A>B>C: A vs B'
group
1 -1
0;
contrast 'A>B>C: B vs C'
group
0 1 -
1;
contrast 'A>B>C: C vs A'
group
1 0 -
1;
Luba
Typewritten Text
Luba
Typewritten Text
237

9
contrast 'A=B>C: A+B vs C'
group
1 1 -
2; r
un;
quit;
proc g
lm data=vibPP; class group; model X_TSpt=group;
means group/hovtest=levene welch;
contrast 'A>B>C: A vs B'
group
1 -1
0;
contrast 'A>B>C: B vs C'
group
0 1 -
1;
contrast 'A>B>C: C vs A'
group
1 0 -
1;
contrast 'A=B>C: A+B vs C'
group
1 1 -
2; r
un;
quit;
proc g
lm data=vibPP; class group; model X_BVTVt=group;
means group/hovtest=levene welch;
contrast 'A>B>C: A vs B'
group
1 -1
0;
contrast 'A>B>C: B vs C'
group
0 1 -
1;
contrast 'A>B>C: C vs A'
group
1 0 -
1;
contrast 'A=B>C: A+B vs C'
group
1 1 -
2; r
un;
quit;
proc g
lm data=vibPP; class group; model X_vBMDtr=group;
means group/hovtest=levene welch;
contrast 'A>B>C: A vs B'
group
1 -1
0;
contrast 'A>B>C: B vs C'
group
0 1 -
1;
contrast 'A>B>C: C vs A'
group
1 0 -
1;
contrast 'A=B>C: A+B vs C'
group
1 1 -
2; r
un;
quit;
proc g
lm data=vibPP; class group; model X_vBMDcr=group;
means group/hovtest=levene welch;
contrast 'A>B>C: A vs B'
group
1 -1
0;
contrast 'A>B>C: B vs C'
group
0 1 -
1;
contrast 'A>B>C: C vs A'
group
1 0 -
1;
contrast 'A=B>C: A+B vs C'
group
1 1 -
2; r
un;
quit;
proc g
lm data=vibPP; class group; model X_vBMD100r=group; means group/hovtest=levene welch;
contrast 'A>B>C: A vs B'
group
1 -1
0;
contrast 'A>B>C: B vs C'
group
0 1 -
1;
contrast 'A>B>C: C vs A'
group
1 0 -
1;
contrast 'A=B>C: A+B vs C'
group
1 1 -
2; r
un;
quit;
proc g
lm data=vibPP; class group; model X_CThr=group;
means group/hovtest=levene welch;
contrast 'A>B>C: A vs B'
group
1 -1
0;
contrast 'A>B>C: B vs C'
group
0 1 -
1;
contrast 'A>B>C: C vs A'
group
1 0 -
1;
contrast 'A=B>C: A+B vs C'
group
1 1 -
2; r
un;
quit;
proc g
lm data=vibPP; class group; model X_TThr=group;
means group/hovtest=levene welch;
contrast 'A>B>C: A vs B'
group
1 -1
0;
contrast 'A>B>C: B vs C'
group
0 1 -
1;
contrast 'A>B>C: C vs A'
group
1 0 -
1;
contrast 'A=B>C: A+B vs C'
group
1 1 -
2; r
un;
quit;
proc g
lm data=vibPP; class group; model X_TNr=group;
means group/hovtest=levene welch;
contrast 'A>B>C: A vs B'
group
1 -1
0;
contrast 'A>B>C: B vs C'
group
0 1 -
1;
contrast 'A>B>C: C vs A'
group
1 0 -
1;
contrast 'A=B>C: A+B vs C'
group
1 1 -
2; r
un;
quit;
proc g
lm data=vibPP; class group; model X_TSpr=group;
means group/hovtest=levene welch;
contrast 'A>B>C: A vs B'
group
1 -1
0;
contrast 'A>B>C: B vs C'
group
0 1 -
1;
contrast 'A>B>C: C vs A'
group
1 0 -
1;
contrast 'A=B>C: A+B vs C'
group
1 1 -
2; r
un;
quit;
proc g
lm data=vibPP; class group; model X_BVTVr=group;
means group/hovtest=levene welch;
10
contrast 'A>B>C: A vs B'
group
1 -1
0;
contrast 'A>B>C: B vs C'
group
0 1 -
1;
contrast 'A>B>C: C vs A'
group
1 0 -
1;
contrast 'A=B>C: A+B vs C'
group
1 1 -
2; r
un;
quit;
title SUBGROUP =>8
0% cummulative WBV duration (adherence1); /*using per-protocol dataset*/
data vib801; set vibPP; if group='C' then adherence1=1
00; if adherence1>=8
0;ru
n;
proc g
lm data=vib801; class group; model X_aBMDf=group; means group/hovtest=levene welch;
contrast 'A>B>C: A vs B'
group
1 -1
0;
contrast 'A>B>C: B vs C'
group
0 1 -
1;
contrast 'A>B>C: C vs A'
group
1 0 -
1;
contrast 'A=B>C: A+B vs C'
group
1 1 -
2; r
un;
quit;
proc g
lm data=vib801; class group; model X_aBMDh=group; means group/hovtest=levene welch;
contrast 'A>B>C: A vs B'
group
1 -1
0;
contrast 'A>B>C: B vs C'
group
0 1 -
1;
contrast 'A>B>C: C vs A'
group
1 0 -
1;
contrast 'A=B>C: A+B vs C'
group
1 1 -
2; r
un;
quit;
proc g
lm data=vib801; class group; model X_aBMDs=group; means group/hovtest=levene welch;
contrast 'A>B>C: A vs B'
group
1 -1
0;
contrast 'A>B>C: B vs C'
group
0 1 -
1;
contrast 'A>B>C: C vs A'
group
1 0 -
1;
contrast 'A=B>C: A+B vs C'
group
1 1 -
2; r
un;
quit;
proc g
lm data=vib801; class group; model X_vBMDtt=group;
means group/hovtest=levene welch;
contrast 'A>B>C: A vs B'
group
1 -1
0;
contrast 'A>B>C: B vs C'
group
0 1 -
1;
contrast 'A>B>C: C vs A'
group
1 0 -
1;
contrast 'A=B>C: A+B vs C'
group
1 1 -
2; r
un;
quit;
proc g
lm data=vib801; class group; model X_vBMDct=group;
means group/hovtest=levene welch;
contrast 'A>B>C: A vs B'
group
1 -1
0;
contrast 'A>B>C: B vs C'
group
0 1 -
1;
contrast 'A>B>C: C vs A'
group
1 0 -
1;
contrast 'A=B>C: A+B vs C'
group
1 1 -
2; r
un;
quit;
proc g
lm data=vib801; class group; model X_vBMD100t=group; means group/hovtest=levene welch;
contrast 'A>B>C: A vs B'
group
1 -1
0;
contrast 'A>B>C: B vs C'
group
0 1 -
1;
contrast 'A>B>C: C vs A'
group
1 0 -
1;
contrast 'A=B>C: A+B vs C'
group
1 1 -
2; r
un;
quit;
proc g
lm data=vib801; class group; model X_CTht=group;
means group/hovtest=levene welch;
contrast 'A>B>C: A vs B'
group
1 -1
0;
contrast 'A>B>C: B vs C'
group
0 1 -
1;
contrast 'A>B>C: C vs A'
group
1 0 -
1;
contrast 'A=B>C: A+B vs C'
group
1 1 -
2; r
un;
quit;
proc g
lm data=vib801; class group; model X_TTht=group;
means group/hovtest=levene welch;
contrast 'A>B>C: A vs B'
group
1 -1
0;
11
contrast 'A>B>C: B vs C'
group
0 1 -
1;
contrast 'A>B>C: C vs A'
group
1 0 -
1;
contrast 'A=B>C: A+B vs C'
group
1 1 -
2; r
un;
quit;
proc g
lm data=vib801; class group; model X_TNt=group;
means group/hovtest=levene welch;
contrast 'A>B>C: A vs B'
group
1 -1
0;
contrast 'A>B>C: B vs C'
group
0 1 -
1;
contrast 'A>B>C: C vs A'
group
1 0 -
1;
contrast 'A=B>C: A+B vs C'
group
1 1 -
2; r
un;
quit;
proc g
lm data=vib801; class group; model X_TSpt=group;
means group/hovtest=levene welch;
contrast 'A>B>C: A vs B'
group
1 -1
0;
contrast 'A>B>C: B vs C'
group
0 1 -
1;
contrast 'A>B>C: C vs A'
group
1 0 -
1;
contrast 'A=B>C: A+B vs C'
group
1 1 -
2; r
un;
quit;
proc g
lm data=vib801; class group; model X_BVTVt=group;
means group/hovtest=levene welch;
contrast 'A>B>C: A vs B'
group
1 -1
0;
contrast 'A>B>C: B vs C'
group
0 1 -
1;
contrast 'A>B>C: C vs A'
group
1 0 -
1;
contrast 'A=B>C: A+B vs C'
group
1 1 -
2; r
un;
quit;
proc g
lm data=vib801; class group; model X_vBMDtr=group;
means group/hovtest=levene welch;
contrast 'A>B>C: A vs B'
group
1 -1
0;
contrast 'A>B>C: B vs C'
group
0 1 -
1;
contrast 'A>B>C: C vs A'
group
1 0 -
1;
contrast 'A=B>C: A+B vs C'
group
1 1 -
2; r
un;
quit;
proc g
lm data=vib801; class group; model X_vBMDcr=group;
means group/hovtest=levene welch;
contrast 'A>B>C: A vs B'
group
1 -1
0;
contrast 'A>B>C: B vs C'
group
0 1 -
1;
contrast 'A>B>C: C vs A'
group
1 0 -
1;
contrast 'A=B>C: A+B vs C'
group
1 1 -
2; r
un;
quit;
proc g
lm data=vib801; class group; model X_vBMD100r=group; means group/hovtest=levene welch;
contrast 'A>B>C: A vs B'
group
1 -1
0;
contrast 'A>B>C: B vs C'
group
0 1 -
1;
contrast 'A>B>C: C vs A'
group
1 0 -
1;
contrast 'A=B>C: A+B vs C'
group
1 1 -
2; r
un;
quit;
proc g
lm data=vib801; class group; model X_CThr=group;
means group/hovtest=levene welch;
contrast 'A>B>C: A vs B'
group
1 -1
0;
contrast 'A>B>C: B vs C'
group
0 1 -
1;
contrast 'A>B>C: C vs A'
group
1 0 -
1;
contrast 'A=B>C: A+B vs C'
group
1 1 -
2; r
un;
quit;
proc g
lm data=vib801; class group; model X_TThr=group;
means group/hovtest=levene welch;
contrast 'A>B>C: A vs B'
group
1 -1
0;
contrast 'A>B>C: B vs C'
group
0 1 -
1;
contrast 'A>B>C: C vs A'
group
1 0 -
1;
contrast 'A=B>C: A+B vs C'
group
1 1 -
2; r
un;
quit;
proc g
lm data=vib801; class group; model X_TNr=group;
means group/hovtest=levene welch;
contrast 'A>B>C: A vs B'
group
1 -1
0;
contrast 'A>B>C: B vs C'
group
0 1 -
1;
contrast 'A>B>C: C vs A'
group
1 0 -
1;
12
contrast 'A=B>C: A+B vs C'
group
1 1 -
2; r
un;
quit;
proc g
lm data=vib801; class group; model X_TSpr=group;
means group/hovtest=levene welch;
contrast 'A>B>C: A vs B'
group
1 -1
0;
contrast 'A>B>C: B vs C'
group
0 1 -
1;
contrast 'A>B>C: C vs A'
group
1 0 -
1;
contrast 'A=B>C: A+B vs C'
group
1 1 -
2; r
un;
quit;
proc g
lm data=vib801; class group; model X_BVTVr=group;
means group/hovtest=levene welch;
contrast 'A>B>C: A vs B'
group
1 -1
0;
contrast 'A>B>C: B vs C'
group
0 1 -
1;
contrast 'A>B>C: C vs A'
group
1 0 -
1;
contrast 'A=B>C: A+B vs C'
group
1 1 -
2; r
un;
quit;
title SUBGROUP =>8
0% number of WBV days (adherence2); /*using per-protocol dataset*/
data vib802; set vibPP; if group='C' then adherence2=1
00; if adherence2>=8
0;ru
n;
proc g
lm data=vib802; class group; model X_aBMDf=group; means group/hovtest=levene welch;
contrast 'A>B>C: A vs B'
group
1 -1
0;
contrast 'A>B>C: B vs C'
group
0 1 -
1;
contrast 'A>B>C: C vs A'
group
1 0 -
1;
contrast 'A=B>C: A+B vs C'
group
1 1 -
2; r
un;
quit;
proc g
lm data=vib802; class group; model X_aBMDh=group; means group/hovtest=levene welch;
contrast 'A>B>C: A vs B'
group
1 -1
0;
contrast 'A>B>C: B vs C'
group
0 1 -
1;
contrast 'A>B>C: C vs A'
group
1 0 -
1;
contrast 'A=B>C: A+B vs C'
group
1 1 -
2; r
un;
quit;
proc g
lm data=vib802; class group; model X_aBMDs=group; means group/hovtest=levene welch;
contrast 'A>B>C: A vs B'
group
1 -1
0;
contrast 'A>B>C: B vs C'
group
0 1 -
1;
contrast 'A>B>C: C vs A'
group
1 0 -
1;
contrast 'A=B>C: A+B vs C'
group
1 1 -
2; r
un;
quit;
proc g
lm data=vib802; class group; model X_vBMDtt=group;
means group/hovtest=levene welch;
contrast 'A>B>C: A vs B'
group
1 -1
0;
contrast 'A>B>C: B vs C'
group
0 1 -
1;
contrast 'A>B>C: C vs A'
group
1 0 -
1;
contrast 'A=B>C: A+B vs C'
group
1 1 -
2; r
un;
quit;
proc g
lm data=vib802; class group; model X_vBMDct=group;
means group/hovtest=levene welch;
contrast 'A>B>C: A vs B'
group
1 -1
0;
contrast 'A>B>C: B vs C'
group
0 1 -
1;
contrast 'A>B>C: C vs A'
group
1 0 -
1;
contrast 'A=B>C: A+B vs C'
group
1 1 -
2; r
un;
quit;
proc g
lm data=vib802; class group; model X_vBMD100t=group; means group/hovtest=levene welch;
contrast 'A>B>C: A vs B'
group
1 -1
0;
contrast 'A>B>C: B vs C'
group
0 1 -
1;
contrast 'A>B>C: C vs A'
group
1 0 -
1;
contrast 'A=B>C: A+B vs C'
group
1 1 -
2; r
un;
quit;
Luba
Typewritten Text
Luba
Typewritten Text
Luba
Typewritten Text
Luba
Typewritten Text
Luba
Typewritten Text
Luba
Typewritten Text
Luba
Typewritten Text
Luba
Typewritten Text
Luba
Typewritten Text
Luba
Typewritten Text
Luba
Typewritten Text
Luba
Typewritten Text
Luba
Typewritten Text
Luba
Typewritten Text
Luba
Typewritten Text
Luba
Typewritten Text
238

13
pr
oc g
lm data=vib802; class group; model X_CTht=group;
means group/hovtest=levene welch;
contrast 'A>B>C: A vs B'
group
1 -1
0;
contrast 'A>B>C: B vs C'
group
0 1 -
1;
contrast 'A>B>C: C vs A'
group
1 0 -
1;
contrast 'A=B>C: A+B vs C'
group
1 1 -
2; r
un;
quit;
proc g
lm data=vib802; class group; model X_TTht=group;
means group/hovtest=levene welch;
contrast 'A>B>C: A vs B'
group
1 -1
0;
contrast 'A>B>C: B vs C'
group
0 1 -
1;
contrast 'A>B>C: C vs A'
group
1 0 -
1;
contrast 'A=B>C: A+B vs C'
group
1 1 -
2; r
un;
quit;
proc g
lm data=vib802; class group; model X_TNt=group;
means group/hovtest=levene welch;
contrast 'A>B>C: A vs B'
group
1 -1
0;
contrast 'A>B>C: B vs C'
group
0 1 -
1;
contrast 'A>B>C: C vs A'
group
1 0 -
1;
contrast 'A=B>C: A+B vs C'
group
1 1 -
2; r
un;
quit;
proc g
lm data=vib802; class group; model X_TSpt=group;
means group/hovtest=levene welch;
contrast 'A>B>C: A vs B'
group
1 -1
0;
contrast 'A>B>C: B vs C'
group
0 1 -
1;
contrast 'A>B>C: C vs A'
group
1 0 -
1;
contrast 'A=B>C: A+B vs C'
group
1 1 -
2; r
un;
quit;
proc g
lm data=vib802; class group; model X_BVTVt=group;
means group/hovtest=levene welch;
contrast 'A>B>C: A vs B'
group
1 -1
0;
contrast 'A>B>C: B vs C'
group
0 1 -
1;
contrast 'A>B>C: C vs A'
group
1 0 -
1;
contrast 'A=B>C: A+B vs C'
group
1 1 -
2; r
un;
quit;
proc g
lm data=vib802; class group; model X_vBMDtr=group;
means group/hovtest=levene welch;
contrast 'A>B>C: A vs B'
group
1 -1
0;
contrast 'A>B>C: B vs C'
group
0 1 -
1;
contrast 'A>B>C: C vs A'
group
1 0 -
1;
contrast 'A=B>C: A+B vs C'
group
1 1 -
2; r
un;
quit;
proc g
lm data=vib802; class group; model X_vBMDcr=group;
means group/hovtest=levene welch;
contrast 'A>B>C: A vs B'
group
1 -1
0;
contrast 'A>B>C: B vs C'
group
0 1 -
1;
contrast 'A>B>C: C vs A'
group
1 0 -
1;
contrast 'A=B>C: A+B vs C'
group
1 1 -
2; r
un;
quit;
proc g
lm data=vib802; class group; model X_vBMD100r=group; means group/hovtest=levene welch;
contrast 'A>B>C: A vs B'
group
1 -1
0;
contrast 'A>B>C: B vs C'
group
0 1 -
1;
contrast 'A>B>C: C vs A'
group
1 0 -
1;
contrast 'A=B>C: A+B vs C'
group
1 1 -
2; r
un;
quit;
proc g
lm data=vib802; class group; model X_CThr=group;
means group/hovtest=levene welch;
contrast 'A>B>C: A vs B'
group
1 -1
0;
contrast 'A>B>C: B vs C'
group
0 1 -
1;
contrast 'A>B>C: C vs A'
group
1 0 -
1;
contrast 'A=B>C: A+B vs C'
group
1 1 -
2; r
un;
quit;
proc g
lm data=vib802; class group; model X_TThr=group;
means group/hovtest=levene welch;
contrast 'A>B>C: A vs B'
group
1 -1
0;
14
contrast 'A>B>C: B vs C'
group
0 1 -
1;
contrast 'A>B>C: C vs A'
group
1 0 -
1;
contrast 'A=B>C: A+B vs C'
group
1 1 -
2; r
un;
quit;
proc g
lm data=vib802; class group; model X_TNr=group;
means group/hovtest=levene welch;
contrast 'A>B>C: A vs B'
group
1 -1
0;
contrast 'A>B>C: B vs C'
group
0 1 -
1;
contrast 'A>B>C: C vs A'
group
1 0 -
1;
contrast 'A=B>C: A+B vs C'
group
1 1 -
2; r
un;
quit;
proc g
lm data=vib802; class group; model X_TSpr=group;
means group/hovtest=levene welch;
contrast 'A>B>C: A vs B'
group
1 -1
0;
contrast 'A>B>C: B vs C'
group
0 1 -
1;
contrast 'A>B>C: C vs A'
group
1 0 -
1;
contrast 'A=B>C: A+B vs C'
group
1 1 -
2; r
un;
quit;
proc g
lm data=vib802; class group; model X_BVTVr=group;
means group/hovtest=levene welch;
contrast 'A>B>C: A vs B'
group
1 -1
0;
contrast 'A>B>C: B vs C'
group
0 1 -
1;
contrast 'A>B>C: C vs A'
group
1 0 -
1;
contrast 'A=B>C: A+B vs C'
group
1 1 -
2; r
un;
quit;
title SUBGROUP =>8
0% WBV full-treatment count (adherence3); /*using per-protocol dataset*/
data vib803; set vibPP; if group='C' then adherence3=1
00; if adherence3>=8
0;ru
n;
proc g
lm data=vib803; class group; model X_aBMDf=group; means group/hovtest=levene welch;
contrast 'A>B>C: A vs B'
group
1 -1
0;
contrast 'A>B>C: B vs C'
group
0 1 -
1;
contrast 'A>B>C: C vs A'
group
1 0 -
1;
contrast 'A=B>C: A+B vs C'
group
1 1 -
2; r
un;
quit;
proc g
lm data=vib803; class group; model X_aBMDh=group; means group/hovtest=levene welch;
contrast 'A>B>C: A vs B'
group
1 -1
0;
contrast 'A>B>C: B vs C'
group
0 1 -
1;
contrast 'A>B>C: C vs A'
group
1 0 -
1;
contrast 'A=B>C: A+B vs C'
group
1 1 -
2; r
un;
quit;
proc g
lm data=vib803; class group; model X_aBMDs=group; means group/hovtest=levene welch;
contrast 'A>B>C: A vs B'
group
1 -1
0;
contrast 'A>B>C: B vs C'
group
0 1 -
1;
contrast 'A>B>C: C vs A'
group
1 0 -
1;
contrast 'A=B>C: A+B vs C'
group
1 1 -
2; r
un;
quit;
proc g
lm data=vib803; class group; model X_vBMDtt=group;
means group/hovtest=levene welch;
contrast 'A>B>C: A vs B'
group
1 -1
0;
contrast 'A>B>C: B vs C'
group
0 1 -
1;
contrast 'A>B>C: C vs A'
group
1 0 -
1;
contrast 'A=B>C: A+B vs C'
group
1 1 -
2; r
un;
quit;
proc g
lm data=vib803; class group; model X_vBMDct=group;
means group/hovtest=levene welch;
contrast 'A>B>C: A vs B'
group
1 -1
0;
contrast 'A>B>C: B vs C'
group
0 1 -
1;
15
contrast 'A>B>C: C vs A'
group
1 0 -
1;
contrast 'A=B>C: A+B vs C'
group
1 1 -
2; r
un;
quit;
proc g
lm data=vib803; class group; model X_vBMD100t=group; means group/hovtest=levene welch;
contrast 'A>B>C: A vs B'
group
1 -1
0;
contrast 'A>B>C: B vs C'
group
0 1 -
1;
contrast 'A>B>C: C vs A'
group
1 0 -
1;
contrast 'A=B>C: A+B vs C'
group
1 1 -
2; r
un;
quit;
proc g
lm data=vib803; class group; model X_CTht=group;
means group/hovtest=levene welch;
contrast 'A>B>C: A vs B'
group
1 -1
0;
contrast 'A>B>C: B vs C'
group
0 1 -
1;
contrast 'A>B>C: C vs A'
group
1 0 -
1;
contrast 'A=B>C: A+B vs C'
group
1 1 -
2; r
un;
quit;
proc g
lm data=vib803; class group; model X_TTht=group;
means group/hovtest=levene welch;
contrast 'A>B>C: A vs B'
group
1 -1
0;
contrast 'A>B>C: B vs C'
group
0 1 -
1;
contrast 'A>B>C: C vs A'
group
1 0 -
1;
contrast 'A=B>C: A+B vs C'
group
1 1 -
2; r
un;
quit;
proc g
lm data=vib803; class group; model X_TNt=group;
means group/hovtest=levene welch;
contrast 'A>B>C: A vs B'
group
1 -1
0;
contrast 'A>B>C: B vs C'
group
0 1 -
1;
contrast 'A>B>C: C vs A'
group
1 0 -
1;
contrast 'A=B>C: A+B vs C'
group
1 1 -
2; r
un;
quit;
proc g
lm data=vib803; class group; model X_TSpt=group;
means group/hovtest=levene welch;
contrast 'A>B>C: A vs B'
group
1 -1
0;
contrast 'A>B>C: B vs C'
group
0 1 -
1;
contrast 'A>B>C: C vs A'
group
1 0 -
1;
contrast 'A=B>C: A+B vs C'
group
1 1 -
2; r
un;
quit;
proc g
lm data=vib803; class group; model X_BVTVt=group;
means group/hovtest=levene welch;
contrast 'A>B>C: A vs B'
group
1 -1
0;
contrast 'A>B>C: B vs C'
group
0 1 -
1;
contrast 'A>B>C: C vs A'
group
1 0 -
1;
contrast 'A=B>C: A+B vs C'
group
1 1 -
2; r
un;
quit;
proc g
lm data=vib803; class group; model X_vBMDtr=group;
means group/hovtest=levene welch;
contrast 'A>B>C: A vs B'
group
1 -1
0;
contrast 'A>B>C: B vs C'
group
0 1 -
1;
contrast 'A>B>C: C vs A'
group
1 0 -
1;
contrast 'A=B>C: A+B vs C'
group
1 1 -
2; r
un;
quit;
proc g
lm data=vib803; class group; model X_vBMDcr=group;
means group/hovtest=levene welch;
contrast 'A>B>C: A vs B'
group
1 -1
0;
contrast 'A>B>C: B vs C'
group
0 1 -
1;
contrast 'A>B>C: C vs A'
group
1 0 -
1;
contrast 'A=B>C: A+B vs C'
group
1 1 -
2; r
un;
quit;
proc g
lm data=vib803; class group; model X_vBMD100r=group; means group/hovtest=levene welch;
contrast 'A>B>C: A vs B'
group
1 -1
0;
contrast 'A>B>C: B vs C'
group
0 1 -
1;
contrast 'A>B>C: C vs A'
group
1 0 -
1;
contrast 'A=B>C: A+B vs C'
group
1 1 -
2; r
un;
quit;
16
pr
oc g
lm data=vib803; class group; model X_CThr=group;
means group/hovtest=levene welch;
contrast 'A>B>C: A vs B'
group
1 -1
0;
contrast 'A>B>C: B vs C'
group
0 1 -
1;
contrast 'A>B>C: C vs A'
group
1 0 -
1;
contrast 'A=B>C: A+B vs C'
group
1 1 -
2; r
un;
quit;
proc g
lm data=vib803; class group; model X_TThr=group;
means group/hovtest=levene welch;
contrast 'A>B>C: A vs B'
group
1 -1
0;
contrast 'A>B>C: B vs C'
group
0 1 -
1;
contrast 'A>B>C: C vs A'
group
1 0 -
1;
contrast 'A=B>C: A+B vs C'
group
1 1 -
2; r
un;
quit;
proc g
lm data=vib803; class group; model X_TNr=group;
means group/hovtest=levene welch;
contrast 'A>B>C: A vs B'
group
1 -1
0;
contrast 'A>B>C: B vs C'
group
0 1 -
1;
contrast 'A>B>C: C vs A'
group
1 0 -
1;
contrast 'A=B>C: A+B vs C'
group
1 1 -
2; r
un;
quit;
proc g
lm data=vib803; class group; model X_TSpr=group;
means group/hovtest=levene welch;
contrast 'A>B>C: A vs B'
group
1 -1
0;
contrast 'A>B>C: B vs C'
group
0 1 -
1;
contrast 'A>B>C: C vs A'
group
1 0 -
1;
contrast 'A=B>C: A+B vs C'
group
1 1 -
2; r
un;
quit;
proc g
lm data=vib803; class group; model X_BVTVr=group;
means group/hovtest=levene welch;
contrast 'A>B>C: A vs B'
group
1 -1
0;
contrast 'A>B>C: B vs C'
group
0 1 -
1;
contrast 'A>B>C: C vs A'
group
1 0 -
1;
contrast 'A=B>C: A+B vs C'
group
1 1 -
2; r
un;
quit;
title SUBGROUP <
65kg; /*using per-protocol dataset*/
data vib65; set vibpp; if b_mass<6
5; r
un;
proc g
lm data=vib65; class group; model X_aBMDf=group; means group/hovtest=levene welch;
contrast 'A>B>C: A vs B'
group
1 -1
0;
contrast 'A>B>C: B vs C'
group
0 1 -
1;
contrast 'A>B>C: C vs A'
group
1 0 -
1;
contrast 'A=B>C: A+B vs C'
group
1 1 -
2; r
un;
quit;
proc g
lm data=vib65; class group; model X_aBMDh=group; means group/hovtest=levene welch;
contrast 'A>B>C: A vs B'
group
1 -1
0;
contrast 'A>B>C: B vs C'
group
0 1 -
1;
contrast 'A>B>C: C vs A'
group
1 0 -
1;
contrast 'A=B>C: A+B vs C'
group
1 1 -
2; r
un;
quit;
proc g
lm data=vib65; class group; model X_aBMDs=group; means group/hovtest=levene welch;
contrast 'A>B>C: A vs B'
group
1 -1
0;
contrast 'A>B>C: B vs C'
group
0 1 -
1;
contrast 'A>B>C: C vs A'
group
1 0 -
1;
contrast 'A=B>C: A+B vs C'
group
1 1 -
2; r
un;
quit;
proc g
lm data=vib65; class group; model X_vBMDtt=group;
means group/hovtest=levene welch;
contrast 'A>B>C: A vs B'
group
1 -1
0;
Luba
Typewritten Text
Luba
Typewritten Text
Luba
Typewritten Text
Luba
Typewritten Text
Luba
Typewritten Text
Luba
Typewritten Text
Luba
Typewritten Text
Luba
Typewritten Text
Luba
Typewritten Text
Luba
Typewritten Text
Luba
Typewritten Text
Luba
Typewritten Text
Luba
Typewritten Text
Luba
Typewritten Text
Luba
Typewritten Text
Luba
Typewritten Text
Luba
Typewritten Text
Luba
Typewritten Text
Luba
Typewritten Text
Luba
Typewritten Text
Luba
Typewritten Text
Luba
Typewritten Text
Luba
Typewritten Text
Luba
Typewritten Text
Luba
Typewritten Text
Luba
Typewritten Text
Luba
Typewritten Text
Luba
Typewritten Text
Luba
Typewritten Text
239

17
contrast 'A>B>C: B vs C'
group
0 1 -
1;
contrast 'A>B>C: C vs A'
group
1 0 -
1;
contrast 'A=B>C: A+B vs C'
group
1 1 -
2; r
un;
quit;
proc g
lm data=vib65; class group; model X_vBMDct=group;
means group/hovtest=levene welch;
contrast 'A>B>C: A vs B'
group
1 -1
0;
contrast 'A>B>C: B vs C'
group
0 1 -
1;
contrast 'A>B>C: C vs A'
group
1 0 -
1;
contrast 'A=B>C: A+B vs C'
group
1 1 -
2; r
un;
quit;
proc g
lm data=vib65; class group; model X_vBMD100t=group; means group/hovtest=levene welch;
contrast 'A>B>C: A vs B'
group
1 -1
0;
contrast 'A>B>C: B vs C'
group
0 1 -
1;
contrast 'A>B>C: C vs A'
group
1 0 -
1;
contrast 'A=B>C: A+B vs C'
group
1 1 -
2; r
un;
quit;
proc g
lm data=vib65; class group; model X_CTht=group;
means group/hovtest=levene welch;
contrast 'A>B>C: A vs B'
group
1 -1
0;
contrast 'A>B>C: B vs C'
group
0 1 -
1;
contrast 'A>B>C: C vs A'
group
1 0 -
1;
contrast 'A=B>C: A+B vs C'
group
1 1 -
2; r
un;
quit;
proc g
lm data=vib65; class group; model X_TTht=group;
means group/hovtest=levene welch;
contrast 'A>B>C: A vs B'
group
1 -1
0;
contrast 'A>B>C: B vs C'
group
0 1 -
1;
contrast 'A>B>C: C vs A'
group
1 0 -
1;
contrast 'A=B>C: A+B vs C'
group
1 1 -
2; r
un;
quit;
proc g
lm data=vib65; class group; model X_TNt=group;
means group/hovtest=levene welch;
contrast 'A>B>C: A vs B'
group
1 -1
0;
contrast 'A>B>C: B vs C'
group
0 1 -
1;
contrast 'A>B>C: C vs A'
group
1 0 -
1;
contrast 'A=B>C: A+B vs C'
group
1 1 -
2; r
un;
quit;
proc g
lm data=vib65; class group; model X_TSpt=group;
means group/hovtest=levene welch;
contrast 'A>B>C: A vs B'
group
1 -1
0;
contrast 'A>B>C: B vs C'
group
0 1 -
1;
contrast 'A>B>C: C vs A'
group
1 0 -
1;
contrast 'A=B>C: A+B vs C'
group
1 1 -
2; r
un;
quit;
proc g
lm data=vib65; class group; model X_BVTVt=group;
means group/hovtest=levene welch;
contrast 'A>B>C: A vs B'
group
1 -1
0;
contrast 'A>B>C: B vs C'
group
0 1 -
1;
contrast 'A>B>C: C vs A'
group
1 0 -
1;
contrast 'A=B>C: A+B vs C'
group
1 1 -
2; r
un;
quit;
proc g
lm data=vib65; class group; model X_vBMDtr=group;
means group/hovtest=levene welch;
contrast 'A>B>C: A vs B'
group
1 -1
0;
contrast 'A>B>C: B vs C'
group
0 1 -
1;
contrast 'A>B>C: C vs A'
group
1 0 -
1;
contrast 'A=B>C: A+B vs C'
group
1 1 -
2; r
un;
quit;
proc g
lm data=vib65; class group; model X_vBMDcr=group;
means group/hovtest=levene welch;
contrast 'A>B>C: A vs B'
group
1 -1
0;
contrast 'A>B>C: B vs C'
group
0 1 -
1;
contrast 'A>B>C: C vs A'
group
1 0 -
1;
18
contrast 'A=B>C: A+B vs C'
group
1 1 -
2; r
un;
quit;
proc g
lm data=vib65; class group; model X_vBMD100r=group; means group/hovtest=levene welch;
contrast 'A>B>C: A vs B'
group
1 -1
0;
contrast 'A>B>C: B vs C'
group
0 1 -
1;
contrast 'A>B>C: C vs A'
group
1 0 -
1;
contrast 'A=B>C: A+B vs C'
group
1 1 -
2; r
un;
quit;
proc g
lm data=vib65; class group; model X_CThr=group;
means group/hovtest=levene welch;
contrast 'A>B>C: A vs B'
group
1 -1
0;
contrast 'A>B>C: B vs C'
group
0 1 -
1;
contrast 'A>B>C: C vs A'
group
1 0 -
1;
contrast 'A=B>C: A+B vs C'
group
1 1 -
2; r
un;
quit;
proc g
lm data=vib65; class group; model X_TThr=group;
means group/hovtest=levene welch;
contrast 'A>B>C: A vs B'
group
1 -1
0;
contrast 'A>B>C: B vs C'
group
0 1 -
1;
contrast 'A>B>C: C vs A'
group
1 0 -
1;
contrast 'A=B>C: A+B vs C'
group
1 1 -
2; r
un;
quit;
proc g
lm data=vib65; class group; model X_TNr=group;
means group/hovtest=levene welch;
contrast 'A>B>C: A vs B'
group
1 -1
0;
contrast 'A>B>C: B vs C'
group
0 1 -
1;
contrast 'A>B>C: C vs A'
group
1 0 -
1;
contrast 'A=B>C: A+B vs C'
group
1 1 -
2; r
un;
quit;
proc g
lm data=vib65; class group; model X_TSpr=group;
means group/hovtest=levene welch;
contrast 'A>B>C: A vs B'
group
1 -1
0;
contrast 'A>B>C: B vs C'
group
0 1 -
1;
contrast 'A>B>C: C vs A'
group
1 0 -
1;
contrast 'A=B>C: A+B vs C'
group
1 1 -
2; r
un;
quit;
proc g
lm data=vib65; class group; model X_BVTVr=group;
means group/hovtest=levene welch;
contrast 'A>B>C: A vs B'
group
1 -1
0;
contrast 'A>B>C: B vs C'
group
0 1 -
1;
contrast 'A>B>C: C vs A'
group
1 0 -
1;
contrast 'A=B>C: A+B vs C'
group
1 1 -
2; r
un;
quit;
title SUBGROUP =<6
0yrs; /*using per-protocol dataset*/
data vib60; set vibpp; if b_age=<6
0; r
un;
proc g
lm data=vib60; class group; model X_aBMDf=group; means group/hovtest=levene welch;
contrast 'A>B>C: A vs B'
group
1 -1
0;
contrast 'A>B>C: B vs C'
group
0 1 -
1;
contrast 'A>B>C: C vs A'
group
1 0 -
1;
contrast 'A=B>C: A+B vs C'
group
1 1 -
2; r
un;
quit;
proc g
lm data=vib60; class group; model X_aBMDh=group; means group/hovtest=levene welch;
contrast 'A>B>C: A vs B'
group
1 -1
0;
contrast 'A>B>C: B vs C'
group
0 1 -
1;
contrast 'A>B>C: C vs A'
group
1 0 -
1;
contrast 'A=B>C: A+B vs C'
group
1 1 -
2; r
un;
quit;
19
pr
oc g
lm data=vib60; class group; model X_aBMDs=group; means
group/hovtest=levene welch;
contrast 'A>B>C: A vs B'
group
1 -1
0;
contrast 'A>B>C: B vs C'
group
0 1 -
1;
contrast 'A>B>C: C vs A'
group
1 0 -
1;
contrast 'A=B>C: A+B vs C'
group
1 1 -
2; r
un;
quit;
proc g
lm data=vib60; class group; model X_vBMDtt=group;
means group/hovtest=levene welch;
contrast 'A>B>C: A vs B'
group
1 -1
0;
contrast 'A>B>C: B vs C'
group
0 1 -
1;
contrast 'A>B>C: C vs A'
group
1 0 -
1;
contrast 'A=B>C: A+B vs C'
group
1 1 -
2; r
un;
quit;
proc g
lm data=vib60; class group; model X_vBMDct=group;
means group/hovtest=levene welch;
contrast 'A>B>C: A vs B'
group
1 -1
0;
contrast 'A>B>C: B vs C'
group
0 1 -
1;
contrast 'A>B>C: C vs A'
group
1 0 -
1;
contrast 'A=B>C: A+B vs C'
group
1 1 -
2; r
un;
quit;
proc g
lm data=vib60; class group; model X_vBMD100t=group; means group/hovtest=levene welch;
contrast 'A>B>C: A vs B'
group
1 -1
0;
contrast 'A>B>C: B vs C'
group
0 1 -
1;
contrast 'A>B>C: C vs A'
group
1 0 -
1;
contrast 'A=B>C: A+B vs C'
group
1 1 -
2; r
un;
quit;
proc g
lm data=vib60; class group; model X_CTht=group;
means group/hovtest=levene welch;
contrast 'A>B>C: A vs B'
group
1 -1
0;
contrast 'A>B>C: B vs C'
group
0 1 -
1;
contrast 'A>B>C: C vs A'
group
1 0 -
1;
contrast 'A=B>C: A+B vs C'
group
1 1 -
2; r
un;
quit;
proc g
lm data=vib60; class group; model X_TTht=group;
means group/hovtest=levene welch;
contrast 'A>B>C: A vs B'
group
1 -1
0;
contrast 'A>B>C: B vs C'
group
0 1 -
1;
contrast 'A>B>C: C vs A'
group
1 0 -
1;
contrast 'A=B>C: A+B vs C'
group
1 1 -
2; r
un;
quit;
proc g
lm data=vib60; class group; model X_TNt=group;
means group/hovtest=levene welch;
contrast 'A>B>C: A vs B'
group
1 -1
0;
contrast 'A>B>C: B vs C'
group
0 1 -
1;
contrast 'A>B>C: C vs A'
group
1 0 -
1;
contrast 'A=B>C: A+B vs C'
group
1 1 -
2; r
un;
quit;
proc g
lm data=vib60; class group; model X_TSpt=group;
means group/hovtest=levene welch;
contrast 'A>B>C: A vs B'
group
1 -1
0;
contrast 'A>B>C: B vs C'
group
0 1 -
1;
contrast 'A>B>C: C vs A'
group
1 0 -
1;
contrast 'A=B>C: A+B vs C'
group
1 1 -
2; r
un;
quit;
proc g
lm data=vib60; class group; model X_BVTVt=group;
means group/hovtest=levene welch;
contrast 'A>B>C: A vs B'
group
1 -1
0;
contrast 'A>B>C: B vs C'
group
0 1 -
1;
contrast 'A>B>C: C vs A'
group
1 0 -
1;
contrast 'A=B>C: A+B vs C'
group
1 1 -
2; r
un;
quit;
proc g
lm data=vib60; class group; model X_vBMDtr=group;
means group/hovtest=levene welch;
contrast 'A>B>C: A vs B'
group
1 -1
0;
20
contrast 'A>B>C: B vs C'
group
0 1 -
1;
contrast 'A>B>C: C vs A'
group
1 0 -
1;
contrast 'A=B>C: A+B vs C'
group
1 1 -
2; r
un;
quit;
proc g
lm data=vib60; class group; model X_vBMDcr=group;
means group/hovtest=levene welch;
contrast 'A>B>C: A vs B'
group
1 -1
0;
contrast 'A>B>C: B vs C'
group
0 1 -
1;
contrast 'A>B>C: C vs A'
group
1 0 -
1;
contrast 'A=B>C: A+B vs C'
group
1 1 -
2; r
un;
quit;
proc g
lm data=vib60; class group; model X_vBMD100r=group; means group/hovtest=levene welch;
contrast 'A>B>C: A vs B'
group
1 -1
0;
contrast 'A>B>C: B vs C'
group
0 1 -
1;
contrast 'A>B>C: C vs A'
group
1 0 -
1;
contrast 'A=B>C: A+B vs C'
group
1 1 -
2; r
un;
quit;
proc g
lm data=vib60; class group; model X_CThr=group;
means group/hovtest=levene welch;
contrast 'A>B>C: A vs B'
group
1 -1
0;
contrast 'A>B>C: B vs C'
group
0 1 -
1;
contrast 'A>B>C: C vs A'
group
1 0 -
1;
contrast 'A=B>C: A+B vs C'
group
1 1 -
2; r
un;
quit;
proc g
lm data=vib60; class group; model X_TThr=group;
means group/hovtest=levene welch;
contrast 'A>B>C: A vs B'
group
1 -1
0;
contrast 'A>B>C: B vs C'
group
0 1 -
1;
contrast 'A>B>C: C vs A'
group
1 0 -
1;
contrast 'A=B>C: A+B vs C'
group
1 1 -
2; r
un;
quit;
proc g
lm data=vib60; class group; model X_TNr=group;
means group/hovtest=levene welch;
contrast 'A>B>C: A vs B'
group
1 -1
0;
contrast 'A>B>C: B vs C'
group
0 1 -
1;
contrast 'A>B>C: C vs A'
group
1 0 -
1;
contrast 'A=B>C: A+B vs C'
group
1 1 -
2; r
un;
quit;
proc g
lm data=vib60; class group; model X_TSpr=group;
means group/hovtest=levene welch;
contrast 'A>B>C: A vs B'
group
1 -1
0;
contrast 'A>B>C: B vs C'
group
0 1 -
1;
contrast 'A>B>C: C vs A'
group
1 0 -
1;
contrast 'A=B>C: A+B vs C'
group
1 1 -
2; r
un;
quit;
proc g
lm data=vib60; class group; model X_BVTVr=group;
means group/hovtest=levene welch;
contrast 'A>B>C: A vs B'
group
1 -1
0;
contrast 'A>B>C: B vs C'
group
0 1 -
1;
contrast 'A>B>C: C vs A'
group
1 0 -
1;
contrast 'A=B>C: A+B vs C'
group
1 1 -
2; r
un;
quit;
title SUBGROUP =<1
0PMage; /*using per-protocol dataset*/
data vib10; set vibpp; if PMage=<1
0;ru
n;
proc g
lm data=vib10; class group; model X_aBMDf=group; means group/hovtest=levene welch;
contrast 'A>B>C: A vs B'
group
1 -1
0;
contrast 'A>B>C: B vs C'
group
0 1 -
1;
Luba
Typewritten Text
240

21
contrast 'A>B>C: C vs A'
group
1 0 -
1;
contrast 'A=B>C: A+B vs C'
group
1 1 -
2; r
un;
quit;
proc g
lm data=vib10; class group; model X_aBMDh=group; means group/hovtest=levene welch;
contrast 'A>B>C: A vs B'
group
1 -1
0;
contrast 'A>B>C: B vs C'
group
0 1 -
1;
contrast 'A>B>C: C vs A'
group
1 0 -
1;
contrast 'A=B>C: A+B vs C'
group
1 1 -
2; r
un;
quit;
proc g
lm data=vib10; class group; model X_aBMDs=group; means group/hovtest=levene welch;
contrast 'A>B>C: A vs B'
group
1 -1
0;
contrast 'A>B>C: B vs C'
group
0 1 -
1;
contrast 'A>B>C: C vs A'
group
1 0 -
1;
contrast 'A=B>C: A+B vs C'
group
1 1 -
2; r
un;
quit;
proc g
lm data=vib10; class group; model X_vBMDtt=group;
means group/hovtest=levene welch;
contrast 'A>B>C: A vs B'
group
1 -1
0;
contrast 'A>B>C: B vs C'
group
0 1 -
1;
contrast 'A>B>C: C vs A'
group
1 0 -
1;
contrast 'A=B>C: A+B vs C'
group
1 1 -
2; r
un;
quit;
proc g
lm data=vib10; class group; model X_vBMDct=group;
means group/hovtest=levene welch;
contrast 'A>B>C: A vs B'
group
1 -1
0;
contrast 'A>B>C: B vs C'
group
0 1 -
1;
contrast 'A>B>C: C vs A'
group
1 0 -
1;
contrast 'A=B>C: A+B vs C'
group
1 1 -
2; r
un;
quit;
proc g
lm data=vib10; class group; model X_vBMD100t=group; means group/hovtest=levene welch;
contrast 'A>B>C: A vs B'
group
1 -1
0;
contrast 'A>B>C: B vs C'
group
0 1 -
1;
contrast 'A>B>C: C vs A'
group
1 0 -
1;
contrast 'A=B>C: A+B vs C'
group
1 1 -
2; r
un;
quit;
proc g
lm data=vib10; class group; model X_CTht=group;
means group/hovtest=levene welch;
contrast 'A>B>C: A vs B'
group
1 -1
0;
contrast 'A>B>C: B vs C'
group
0 1 -
1;
contrast 'A>B>C: C vs A'
group
1 0 -
1;
contrast 'A=B>C: A+B vs C'
group
1 1 -
2; r
un;
quit;
proc g
lm data=vib10; class group; model X_TTht=group;
means group/hovtest=levene welch;
contrast 'A>B>C: A vs B'
group
1 -1
0;
contrast 'A>B>C: B vs C'
group
0 1 -
1;
contrast 'A>B>C: C vs A'
group
1 0 -
1;
contrast 'A=B>C: A+B vs C'
group
1 1 -
2; r
un;
quit;
proc g
lm data=vib10; class group; model X_TNt=group;
means group/hovtest=levene welch;
contrast 'A>B>C: A vs B'
group
1 -1
0;
contrast 'A>B>C: B vs C'
group
0 1 -
1;
contrast 'A>B>C: C vs A'
group
1 0 -
1;
contrast 'A=B>C: A+B vs C'
group
1 1 -
2; r
un;
quit;
proc g
lm data=vib10; class group; model X_TSpt=group;
means group/hovtest=levene welch;
contrast 'A>B>C: A vs B'
group
1 -1
0;
contrast 'A>B>C: B vs C'
group
0 1 -
1;
contrast 'A>B>C: C vs A'
group
1 0 -
1;
contrast 'A=B>C: A+B vs C'
group
1 1 -
2; r
un;
quit;
22
pr
oc g
lm data=vib10; class group; model X_BVTVt=group;
means group/hovtest=levene welch;
contrast 'A>B>C: A vs B'
group
1 -1
0;
contrast 'A>B>C: B vs C'
group
0 1 -
1;
contrast 'A>B>C: C vs A'
group
1 0 -
1;
contrast 'A=B>C: A+B vs C'
group
1 1 -
2; r
un;
quit;
proc g
lm data=vib10; class group; model X_vBMDtr=group;
means group/hovtest=levene welch;
contrast 'A>B>C: A vs B'
group
1 -1
0;
contrast 'A>B>C: B vs C'
group
0 1 -
1;
contrast 'A>B>C: C vs A'
group
1 0 -
1;
contrast 'A=B>C: A+B vs C'
group
1 1 -
2; r
un;
quit;
proc g
lm data=vib10; class group; model X_vBMDcr=group;
means group/hovtest=levene welch;
contrast 'A>B>C: A vs B'
group
1 -1
0;
contrast 'A>B>C: B vs C'
group
0 1 -
1;
contrast 'A>B>C: C vs A'
group
1 0 -
1;
contrast 'A=B>C: A+B vs C'
group
1 1 -
2; r
un;
quit;
proc g
lm data=vib10; class group; model X_vBMD100r=group; means group/hovtest=levene welch;
contrast 'A>B>C: A vs B'
group
1 -1
0;
contrast 'A>B>C: B vs C'
group
0 1 -
1;
contrast 'A>B>C: C vs A'
group
1 0 -
1;
contrast 'A=B>C: A+B vs C'
group
1 1 -
2; r
un;
quit;
proc g
lm data=vib10; class group; model X_CThr=group;
means group/hovtest=levene welch;
contrast 'A>B>C: A vs B'
group
1 -1
0;
contrast 'A>B>C: B vs C'
group
0 1 -
1;
contrast 'A>B>C: C vs A'
group
1 0 -
1;
contrast 'A=B>C: A+B vs C'
group
1 1 -
2; r
un;
quit;
proc g
lm data=vib10; class group; model X_TThr=group;
means group/hovtest=levene welch;
contrast 'A>B>C: A vs B'
group
1 -1
0;
contrast 'A>B>C: B vs C'
group
0 1 -
1;
contrast 'A>B>C: C vs A'
group
1 0 -
1;
contrast 'A=B>C: A+B vs C'
group
1 1 -
2; r
un;
quit;
proc g
lm data=vib10; class group; model X_TNr=group;
means group/hovtest=levene welch;
contrast 'A>B>C: A vs B'
group
1 -1
0;
contrast 'A>B>C: B vs C'
group
0 1 -
1;
contrast 'A>B>C: C vs A'
group
1 0 -
1;
contrast 'A=B>C: A+B vs C'
group
1 1 -
2; r
un;
quit;
proc g
lm data=vib10; class group; model X_TSpr=group;
means group/hovtest=levene welch;
contrast 'A>B>C: A vs B'
group
1 -1
0;
contrast 'A>B>C: B vs C'
group
0 1 -
1;
contrast 'A>B>C: C vs A'
group
1 0 -
1;
contrast 'A=B>C: A+B vs C'
group
1 1 -
2; r
un;
quit;
proc g
lm data=vib10; class group; model X_BVTVr=group;
means group/hovtest=levene welch;
contrast 'A>B>C: A vs B'
group
1 -1
0;
contrast 'A>B>C: B vs C'
group
0 1 -
1;
contrast 'A>B>C: C vs A'
group
1 0 -
1;
contrast 'A=B>C: A+B vs C'
group
1 1 -
2; r
un;
quit;
23
title ANCOVA - BASELINE PHYSICAL ACTIVITY;/*using per-
protocol dataset*/
proc g
lm data=vibPP; class group; model X_aBMDf=B_pat group; lsmeans group;
contrast 'A>B>C: A vs B'
group
1 -1
0;
contrast 'A>B>C: B vs C'
group
0 1 -
1;
contrast 'A>B>C: C vs A'
group
1 0 -
1;
contrast 'A=B>C: A+B vs C'
group
1 1 -
2; r
un;
quit;
proc g
lm data=vibPP; class group; model X_aBMDh=B_pat group; lsmeans group;
contrast 'A>B>C: A vs B'
group
1 -1
0;
contrast 'A>B>C: B vs C'
group
0 1 -
1;
contrast 'A>B>C: C vs A'
group
1 0 -
1;
contrast 'A=B>C: A+B vs C'
group
1 1 -
2; r
un;
quit;
proc g
lm data=vibPP; class group; model X_aBMDs=B_pat group; lsmeans group;
contrast 'A>B>C: A vs B'
group
1 -1
0;
contrast 'A>B>C: B vs C'
group
0 1 -
1;
contrast 'A>B>C: C vs A'
group
1 0 -
1;
contrast 'A=B>C: A+B vs C'
group
1 1 -
2; r
un;
quit;
proc g
lm data=vibPP; class group; model X_vBMDtt=B_pat group;
lsmeans group;
contrast 'A>B>C: A vs B'
group
1 -1
0;
contrast 'A>B>C: B vs C'
group
0 1 -
1;
contrast 'A>B>C: C vs A'
group
1 0 -
1;
contrast 'A=B>C: A+B vs C'
group
1 1 -
2; r
un;
quit;
proc g
lm data=vibPP; class group; model X_vBMDct=B_pat group;
lsmeans group;
contrast 'A>B>C: A vs B'
group
1 -1
0;
contrast 'A>B>C: B vs C'
group
0 1 -
1;
contrast 'A>B>C: C vs A'
group
1 0 -
1;
contrast 'A=B>C: A+B vs C'
group
1 1 -
2; r
un;
quit;
proc g
lm data=vibPP; class group; model X_vBMD100t=B_pat group; lsmeans group;
contrast 'A>B>C: A vs B'
group
1 -1
0;
contrast 'A>B>C: B vs C'
group
0 1 -
1;
contrast 'A>B>C: C vs A'
group
1 0 -
1;
contrast 'A=B>C: A+B vs C'
group
1 1 -
2; r
un;
quit;
proc g
lm data=vibPP; class group; model X_CTht=B_pat group;
lsmeans group;
contrast 'A>B>C: A vs B'
group
1 -1
0;
contrast 'A>B>C: B vs C'
group
0 1 -
1;
contrast 'A>B>C: C vs A'
group
1 0 -
1;
contrast 'A=B>C: A+B vs C'
group
1 1 -
2; r
un;
quit;
proc g
lm data=vibPP; class group; model X_TTht=B_pat group;
lsmeans group;
contrast 'A>B>C: A vs B'
group
1 -1
0;
contrast 'A>B>C: B vs C'
group
0 1 -
1;
contrast 'A>B>C: C vs A'
group
1 0 -
1;
contrast 'A=B>C: A+B vs C'
group
1 1 -
2; r
un;
quit;
proc g
lm data=vibPP; class group; model X_TNt=B_pat group;
lsmeans group;
contrast 'A>B>C: A vs B'
group
1 -1
0;
contrast 'A>B>C: B vs C'
group
0 1 -
1;
contrast 'A>B>C: C vs A'
group
1 0 -
1;
contrast 'A=B>C: A+B vs C'
group
1 1 -
2; r
un;
quit;
proc g
lm data=vibPP; class group; model X_TSpt=B_pat group;
lsmeans group;
24
contrast 'A>B>C: A vs B'
group
1 -1
0;
contrast 'A>B>C: B vs C'
group
0 1 -
1;
contrast 'A>B>C: C vs A'
group
1 0 -
1;
contrast 'A=B>C: A+B vs C'
group
1 1 -
2; r
un;
quit;
proc g
lm data=vibPP; class group; model X_BVTVt=B_pat group;
lsmeans group;
contrast 'A>B>C: A vs B'
group
1 -1
0;
contrast 'A>B>C: B vs C'
group
0 1 -
1;
contrast 'A>B>C: C vs A'
group
1 0 -
1;
contrast 'A=B>C: A+B vs C'
group
1 1 -
2; r
un;
quit;
proc g
lm data=vibPP; class group; model X_vBMDtr=B_pat group;
lsmeans group;
contrast 'A>B>C: A vs B'
group
1 -1
0;
contrast 'A>B>C: B vs C'
group
0 1 -
1;
contrast 'A>B>C: C vs A'
group
1 0 -
1;
contrast 'A=B>C: A+B vs C'
group
1 1 -
2; r
un;
quit;
proc g
lm data=vibPP; class group; model X_vBMDcr=B_pat group;
lsmeans group;
contrast 'A>B>C: A vs B'
group
1 -1
0;
contrast 'A>B>C: B vs C'
group
0 1 -
1;
contrast 'A>B>C: C vs A'
group
1 0 -
1;
contrast 'A=B>C: A+B vs C'
group
1 1 -
2; r
un;
quit;
proc g
lm data=vibPP; class group; model X_vBMD100r=B_pat group; lsmeans group;
contrast 'A>B>C: A vs B'
group
1 -1
0;
contrast 'A>B>C: B vs C'
group
0 1 -
1;
contrast 'A>B>C: C vs A'
group
1 0 -
1;
contrast 'A=B>C: A+B vs C'
group
1 1 -
2; r
un;
quit;
proc g
lm data=vibPP; class group; model X_CThr=B_pat group;
lsmeans group;
contrast 'A>B>C: A vs B'
group
1 -1
0;
contrast 'A>B>C: B vs C'
group
0 1 -
1;
contrast 'A>B>C: C vs A'
group
1 0 -
1;
contrast 'A=B>C: A+B vs C'
group
1 1 -
2; r
un;
quit;
proc g
lm data=vibPP; class group; model X_TThr=B_pat group;
lsmeans group;
contrast 'A>B>C: A vs B'
group
1 -1
0;
contrast 'A>B>C: B vs C'
group
0 1 -
1;
contrast 'A>B>C: C vs A'
group
1 0 -
1;
contrast 'A=B>C: A+B vs C'
group
1 1 -
2; r
un;
quit;
proc g
lm data=vibPP; class group; model X_TNr=B_pat group;
lsmeans group;
contrast 'A>B>C: A vs B'
group
1 -1
0;
contrast 'A>B>C: B vs C'
group
0 1 -
1;
contrast 'A>B>C: C vs A'
group
1 0 -
1;
contrast 'A=B>C: A+B vs C'
group
1 1 -
2; r
un;
quit;
proc g
lm data=vibPP; class group; model X_TSpr=B_pat group;
lsmeans group;
contrast 'A>B>C: A vs B'
group
1 -1
0;
contrast 'A>B>C: B vs C'
group
0 1 -
1;
contrast 'A>B>C: C vs A'
group
1 0 -
1;
contrast 'A=B>C: A+B vs C'
group
1 1 -
2; r
un;
quit;
proc g
lm data=vibPP; class group; model X_BVTVr=B_pat group;
lsmeans group;
contrast 'A>B>C: A vs B'
group
1 -1
0;
contrast 'A>B>C: B vs C'
group
0 1 -
1;
Luba
Typewritten Text
241

25
contrast 'A>B>C: C vs A'
group
1 0 -
1;
contrast 'A=B>C: A+B vs C'
group
1 1 -
2; r
un;
quit;
title ANCOVA - VITAMIN D; /*using per-protocol dataset*/
proc g
lm data=vibPP; class group; model X_aBMDf=Dlevel group; lsmeans group;
contrast 'A>B>C: A vs B'
group
1 -1
0;
contrast 'A>B>C: B vs C'
group
0 1 -
1;
contrast 'A>B>C: C vs A'
group
1 0 -
1;
contrast 'A=B>C: A+B vs C'
group
1 1 -
2; r
un;
quit;
proc g
lm data=vibPP; class group; model X_aBMDh=Dlevel group; lsmeans group;
contrast 'A>B>C: A vs B'
group
1 -1
0;
contrast 'A>B>C: B vs C'
group
0 1 -
1;
contrast 'A>B>C: C vs A'
group
1 0 -
1;
contrast 'A=B>C: A+B vs C'
group
1 1 -
2; r
un;
quit;
proc g
lm data=vibPP; class group; model X_aBMDs=Dlevel group; lsmeans group;
contrast 'A>B>C: A vs B'
group
1 -1
0;
contrast 'A>B>C: B vs C'
group
0 1 -
1;
contrast 'A>B>C: C vs A'
group
1 0 -
1;
contrast 'A=B>C: A+B vs C'
group
1 1 -
2; r
un;
quit;
proc g
lm data=vibPP; class group; model X_vBMDtt=Dlevel group;
lsmeans group;
contrast 'A>B>C: A vs B'
group
1 -1
0;
contrast 'A>B>C: B vs C'
group
0 1 -
1;
contrast 'A>B>C: C vs A'
group
1 0 -
1;
contrast 'A=B>C: A+B vs C'
group
1 1 -
2; r
un;
quit;
proc g
lm data=vibPP; class group; model X_vBMDct=Dlevel group;
lsmeans group;
contrast 'A>B>C: A vs B'
group
1 -1
0;
contrast 'A>B>C: B vs C'
group
0 1 -
1;
contrast 'A>B>C: C vs A'
group
1 0 -
1;
contrast 'A=B>C: A+B vs C'
group
1 1 -
2; r
un;
quit;
proc g
lm data=vibPP; class group; model X_vBMD100t=Dlevel group; lsmeans group;
contrast 'A>B>C: A vs B'
group
1 -1
0;
contrast 'A>B>C: B vs C'
group
0 1 -
1;
contrast 'A>B>C: C vs A'
group
1 0 -
1;
contrast 'A=B>C: A+B vs C'
group
1 1 -
2; r
un;
quit;
proc g
lm data=vibPP; class group; model X_CTht=Dlevel group;
lsmeans group;
contrast 'A>B>C: A vs B'
group
1 -1
0;
contrast 'A>B>C: B vs C'
group
0 1 -
1;
contrast 'A>B>C: C vs A'
group
1 0 -
1;
contrast 'A=B>C: A+B vs C'
group
1 1 -
2; r
un;
quit;
proc g
lm data=vibPP; class group; model X_TTht=Dlevel group;
lsmeans group;
contrast 'A>B>C: A vs B'
group
1 -1
0;
contrast 'A>B>C: B vs C'
group
0 1 -
1;
contrast 'A>B>C: C vs A'
group
1 0 -
1;
contrast 'A=B>C: A+B vs C'
group
1 1 -
2; r
un;
quit;
26
pr
oc g
lm data=vibPP; class group; model X_TNt=Dlevel group;
lsmeans group;
contrast 'A>B>C: A vs B'
group
1 -1
0;
contrast 'A>B>C: B vs C'
group
0 1 -
1;
contrast 'A>B>C: C vs A'
group
1 0 -
1;
contrast 'A=B>C: A+B vs C'
group
1 1 -
2; r
un;
quit;
proc g
lm data=vibPP; class group; model X_TSpt=Dlevel group;
lsmeans group;
contrast 'A>B>C: A vs B'
group
1 -1
0;
contrast 'A>B>C: B vs C'
group
0 1 -
1;
contrast 'A>B>C: C vs A'
group
1 0 -
1;
contrast 'A=B>C: A+B vs C'
group
1 1 -
2; r
un;
quit;
proc g
lm data=vibPP; class group; model X_BVTVt=Dlevel group;
lsmeans group;
contrast 'A>B>C: A vs B'
group
1 -1
0;
contrast 'A>B>C: B vs C'
group
0 1 -
1;
contrast 'A>B>C: C vs A'
group
1 0 -
1;
contrast 'A=B>C: A+B vs C'
group
1 1 -
2; r
un;
quit;
proc g
lm data=vibPP; class group; model X_vBMDtr=Dlevel group;
lsmeans group;
contrast 'A>B>C: A vs B'
group
1 -1
0;
contrast 'A>B>C: B vs C'
group
0 1 -
1;
contrast 'A>B>C: C vs A'
group
1 0 -
1;
contrast 'A=B>C: A+B vs C'
group
1 1 -
2; r
un;
quit;
proc g
lm data=vibPP; class group; model X_vBMDcr=Dlevel group;
lsmeans group;
contrast 'A>B>C: A vs B'
group
1 -1
0;
contrast 'A>B>C: B vs C'
group
0 1 -
1;
contrast 'A>B>C: C vs A'
group
1 0 -
1;
contrast 'A=B>C: A+B vs C'
group
1 1 -
2; r
un;
quit;
proc g
lm data=vibPP; class group; model X_vBMD100r=Dlevel group; lsmeans group;
contrast 'A>B>C: A vs B'
group
1 -1
0;
contrast 'A>B>C: B vs C'
group
0 1 -
1;
contrast 'A>B>C: C vs A'
group
1 0 -
1;
contrast 'A=B>C: A+B vs C'
group
1 1 -
2; r
un;
quit;
proc g
lm data=vibPP; class group; model X_CThr=Dlevel group;
lsmeans group;
contrast 'A>B>C: A vs B'
group
1 -1
0;
contrast 'A>B>C: B vs C'
group
0 1 -
1;
contrast 'A>B>C: C vs A'
group
1 0 -
1;
contrast 'A=B>C: A+B vs C'
group
1 1 -
2; r
un;
quit;
proc g
lm data=vibPP; class group; model X_TThr=Dlevel group;
lsmeans group;
contrast 'A>B>C: A vs B'
group
1 -1
0;
contrast 'A>B>C: B vs C'
group
0 1 -
1;
contrast 'A>B>C: C vs A'
group
1 0 -
1;
contrast 'A=B>C: A+B vs C'
group
1 1 -
2; r
un;
quit;
proc g
lm data=vibPP; class group; model X_TNr=Dlevel group;
lsmeans group;
contrast 'A>B>C: A vs B'
group
1 -1
0;
contrast 'A>B>C: B vs C'
group
0 1 -
1;
contrast 'A>B>C: C vs A'
group
1 0 -
1;
contrast 'A=B>C: A+B vs C'
group
1 1 -
2; r
un;
quit;
proc g
lm data=vibPP; class group; model X_TSpr=Dlevel group;
lsmeans group;
contrast 'A>B>C: A vs B'
group
1 -1
0;
27
contrast 'A>B>C: B vs C'
group
0 1 -
1;
contrast 'A>B>C: C vs A'
group
1 0 -
1;
contrast 'A=B>C: A+B vs C'
group
1 1 -
2; r
un;
quit;
proc g
lm data=vibPP; class group; model X_BVTVr=Dlevel group;
lsmeans group;
contrast 'A>B>C: A vs B'
group
1 -1
0;
contrast 'A>B>C: B vs C'
group
0 1 -
1;
contrast 'A>B>C: C vs A'
group
1 0 -
1;
contrast 'A=B>C: A+B vs C'
group
1 1 -
2; r
un;
quit;
title SENSITIVITY ANALYSIS excluded flagged participants from per-protocol;
/*using per-protocol dataset*/
data vibSEN; set vibPP;
if id='046' or id='031' or id='134' or id='059' or id='129' or id='132' or id='181' or id='152' or id='175' or id='177' or
id='058' or
id='103' or id='161' or id='117' or id='124' or id='125' or id='040' or id='099' then delete; /*all bone outcomes
affected*/
if id='083' then x_aBMDh= -0
.011
8952
97; if id='083' then x_aBMDf= -0
.012
1818
79; /*DXA outcomes affected*/
if id='013' or id='131' or id='144' or id='188' or id='136' or id='185' or id='193' then X_vBMDtr='.';
if id='013' or id='131' or id='144' or id='188' or id='136' or id='185' or id='193' then X_vBMDcr='.';
if id='013' or id='131' or id='144' or id='188' or id='136' or id='185' or id='193' then X_vBMD100r='.';
if id='013' or id='131' or id='144' or id='188' or id='136' or id='185' or id='193' then X_CThr='.';
if id='013' or id='131' or id='144' or id='188' or id='136' or id='185' or id='193' then X_TThr='.';
if id='013' or id='131' or id='144' or id='188' or id='136' or id='185' or id='193' then X_TNr='.';
if id='013' or id='131' or id='144' or id='188' or id='136' or id='185' or id='193' then X_TSpr='.';
if id='013' or id='131' or id='144' or id='188' or id='136' or id='185' or id='193' then X_BVTVr='.'; /*Radius pqct outcomes
affected*/
proc g
lm data=vibSEN; class group; model X_aBMDf=group; means group/hovtest=levene welch;
contrast 'A>B>C: A vs B'
group
1 -1
0;
contrast 'A>B>C: B vs C'
group
0 1 -
1;
contrast 'A>B>C: C vs A'
group
1 0 -
1;
contrast 'A=B>C: A+B vs C'
group
1 1 -
2; r
un;
quit;
proc g
lm data=vibSEN; class group; model X_aBMDh=group; means group/hovtest=levene welch;
contrast 'A>B>C: A vs B'
group
1 -1
0;
contrast 'A>B>C: B vs C'
group
0 1 -
1;
contrast 'A>B>C: C vs A'
group
1 0 -
1;
contrast 'A=B>C: A+B vs C'
group
1 1 -
2; r
un;
quit;
proc g
lm data=vibSEN; class group; model X_aBMDs=group; means group/hovtest=levene welch;
contrast 'A>B>C: A vs B'
group
1 -1
0;
contrast 'A>B>C: B vs C'
group
0 1 -
1;
contrast 'A>B>C: C vs A'
group
1 0 -
1;
contrast 'A=B>C: A+B vs C'
group
1 1 -
2; r
un;
quit;
proc g
lm data=vibSEN; class group; model X_vBMDtt=group;
means group/hovtest=levene welch;
contrast 'A>B>C: A vs B'
group
1 -1
0;
contrast 'A>B>C: B vs C'
group
0 1 -
1;
contrast 'A>B>C: C vs A'
group
1 0 -
1;
28
contrast 'A=B>C: A+B vs C'
group
1 1 -
2; r
un;
quit;
proc g
lm data=vibSEN; class group; model X_vBMDct=group;
means group/hovtest=levene welch;
contrast 'A>B>C: A vs B'
group
1 -1
0;
contrast 'A>B>C: B vs C'
group
0 1 -
1;
contrast 'A>B>C: C vs A'
group
1 0 -
1;
contrast 'A=B>C: A+B vs C'
group
1 1 -
2; r
un;
quit;
proc g
lm data=vibSEN; class group; model X_vBMD100t=group; means group/hovtest=levene welch;
contrast 'A>B>C: A vs B'
group
1 -1
0;
contrast 'A>B>C: B vs C'
group
0 1 -
1;
contrast 'A>B>C: C vs A'
group
1 0 -
1;
contrast 'A=B>C: A+B vs C'
group
1 1 -
2; r
un;
quit;
proc g
lm data=vibSEN; class group; model X_CTht=group;
means group/hovtest=levene welch;
contrast 'A>B>C: A vs B'
group
1 -1
0;
contrast 'A>B>C: B vs C'
group
0 1 -
1;
contrast 'A>B>C: C vs A'
group
1 0 -
1;
contrast 'A=B>C: A+B vs C'
group
1 1 -
2; r
un;
quit;
proc g
lm data=vibSEN; class group; model X_TTht=group;
means group/hovtest=levene welch;
contrast 'A>B>C: A vs B'
group
1 -1
0;
contrast 'A>B>C: B vs C'
group
0 1 -
1;
contrast 'A>B>C: C vs A'
group
1 0 -
1;
contrast 'A=B>C: A+B vs C'
group
1 1 -
2; r
un;
quit;
proc g
lm data=vibSEN; class group; model X_TNt=group;
means group/hovtest=levene welch;
contrast 'A>B>C: A vs B'
group
1 -1
0;
contrast 'A>B>C: B vs C'
group
0 1 -
1;
contrast 'A>B>C: C vs A'
group
1 0 -
1;
contrast 'A=B>C: A+B vs C'
group
1 1 -
2; r
un;
quit;
proc g
lm data=vibSEN; class group; model X_TSpt=group;
means group/hovtest=levene welch;
contrast 'A>B>C: A vs B'
group
1 -1
0;
contrast 'A>B>C: B vs C'
group
0 1 -
1;
contrast 'A>B>C: C vs A'
group
1 0 -
1;
contrast 'A=B>C: A+B vs C'
group
1 1 -
2; r
un;
quit;
proc g
lm data=vibSEN; class group; model X_BVTVt=group;
means group/hovtest=levene welch;
contrast 'A>B>C: A vs B'
group
1 -1
0;
contrast 'A>B>C: B vs C'
group
0 1 -
1;
contrast 'A>B>C: C vs A'
group
1 0 -
1;
contrast 'A=B>C: A+B vs C'
group
1 1 -
2; r
un;
quit;
proc g
lm data=vibSEN; class group; model X_vBMDtr=group;
means group/hovtest=levene welch;
contrast 'A>B>C: A vs B'
group
1 -1
0;
contrast 'A>B>C: B vs C'
group
0 1 -
1;
contrast 'A>B>C: C vs A'
group
1 0 -
1;
contrast 'A=B>C: A+B vs C'
group
1 1 -
2; r
un;
quit;
proc g
lm data=vibSEN; class group; model X_vBMDcr=group;
means group/hovtest=levene welch;
contrast 'A>B>C: A vs B'
group
1 -1
0;
contrast 'A>B>C: B vs C'
group
0 1 -
1;
contrast 'A>B>C: C vs A'
group
1 0 -
1;
contrast 'A=B>C: A+B vs C'
group
1 1 -
2; r
un;
quit;
proc g
lm data=vibSEN; class group; model X_vBMD100r=group; means group/hovtest=levene welch;
Luba
Typewritten Text
242

29
contrast 'A>B>C: A vs B'
group
1 -1
0;
contrast 'A>B>C: B vs C'
group
0 1 -
1;
contrast 'A>B>C: C vs A'
group
1 0 -
1;
contrast 'A=B>C: A+B vs C'
group
1 1 -
2; r
un;
quit;
proc g
lm data=vibSEN; class group; model X_CThr=group;
means group/hovtest=levene welch;
contrast 'A>B>C: A vs B'
group
1 -1
0;
contrast 'A>B>C: B vs C'
group
0 1 -
1;
contrast 'A>B>C: C vs A'
group
1 0 -
1;
contrast 'A=B>C: A+B vs C'
group
1 1 -
2; r
un;
quit;
proc g
lm data=vibSEN; class group; model X_TThr=group;
means group/hovtest=levene welch;
contrast 'A>B>C: A vs B'
group
1 -1
0;
contrast 'A>B>C: B vs C'
group
0 1 -
1;
contrast 'A>B>C: C vs A'
group
1 0 -
1;
contrast 'A=B>C: A+B vs C'
group
1 1 -
2; r
un;
quit;
proc g
lm data=vibSEN; class group; model X_TNr=group;
means group/hovtest=levene welch;
contrast 'A>B>C: A vs B'
group
1 -1
0;
contrast 'A>B>C: B vs C'
group
0 1 -
1;
contrast 'A>B>C: C vs A'
group
1 0 -
1;
contrast 'A=B>C: A+B vs C'
group
1 1 -
2; r
un;
quit;
proc g
lm data=vibSEN; class group; model X_TSpr=group;
means group/hovtest=levene welch;
contrast 'A>B>C: A vs B'
group
1 -1
0;
contrast 'A>B>C: B vs C'
group
0 1 -
1;
contrast 'A>B>C: C vs A'
group
1 0 -
1;
contrast 'A=B>C: A+B vs C'
group
1 1 -
2; r
un;
quit;
proc g
lm data=vibSEN; class group; model X_BVTVr=group;
means group/hovtest=levene welch;
contrast 'A>B>C: A vs B'
group
1 -1
0;
contrast 'A>B>C: B vs C'
group
0 1 -
1;
contrast 'A>B>C: C vs A'
group
1 0 -
1;
contrast 'A=B>C: A+B vs C'
group
1 1 -
2; r
un;
quit;
TITLE DESCRIBING IMPORTANT VARIABLES;
title x_vBMDtt;
proc u
niva
riat
e data=vibsort normal plot; id id; by group; var x_vBMDtt;
histogram/cfill=ligr VSCALE=count normal (color=blue) kernel(color=red) cv=black; inset n mean std max min nmiss skewness
kurtosis;
run;
title x_aBMDf; p
roc
univ
aria
te data=vibsort normal plot; id id; by group; var x_aBMDf;
histogram/cfill=ligr VSCALE=count normal (color=blue) kernel(color=red) cv=black; inset n mean std max min nmiss skewness
kurtosis;
run;
title x_aBMDh; p
roc
univ
aria
te data=vibsort normal plot; id id; by group; var x_aBMDh;
histogram/cfill=ligr VSCALE=count normal (color=blue) kernel(color=red) cv=black; inset n mean std max min nmiss skewness
kurtosis;
run;
title x_aBMDs; p
roc
univ
aria
te data=vibsort normal plot; id id; by group; var x_aBMDs;
histogram/cfill=ligr VSCALE=count normal (color=blue) kernel(color=red) cv=black; inset n mean std max min nmiss skewness
kurtosis;
run;
30
title adherence1;
proc u
niva
riat
e data=vibsort normal plot;
id id; by group; var adherence1;
histogram/cfill=ligr VSCALE=count normal (color=blue) kernel(color=red) cv=black; inset n nmiss mean std median min max
qrange;
run;
title adherence2;
proc u
niva
riat
e data=vibsort normal plot; id id; by group; var adherence2;
histogram/cfill=ligr VSCALE=count normal (color=blue) kernel(color=red) cv=black; inset n nmiss mean std median min max
qrange;
run;
title adherence3;
proc u
niva
riat
e data=vibsort normal plot; id id; by group; var adherence3;
histogram/cfill=ligr VSCALE=count normal (color=blue) kernel(color=red) cv=black; inset n nmiss mean std median min max
qrange;
run;
proc m
eans data=vib n mean min max std; var b_age PMage b_mass b_calin b_vitdin commregiont commregionr; r
un;
proc m
eans data=vibsort n mean median qrange min max; by group; var adhcd; r
un;
data vibppp; set vibpp;
PX_aBMDf=(X_aBMDf/B_aBMDf)*1
00; PX_aBMDh=(X_aBMDh/B_aBMDh)*1
00; PX_aBMDs=(X_aBMDs/B_aBMDs)*1
00;
PX_vBMDtt=(X_vBMDtt/B_vBMDtt)*
100; PX_vBMDct=(X_vBMDct/B_vBMDct)*1
00;
PX_vBMD100t=(X_vBMD100t/B_vBMD100t)*
100;PX_CTht=(X_CTht/B_CTht)*
100;
PX_TTht=(X_TTht/B_TTht)*
100; PX_TNt=(X_TNt/B_TNt)*
100; PX_TSpt=(X_TSpt/B_TSpt)*1
00; PX_BVTVt=(X_BVTVt/B_BVTVt)*1
00;
PX_vBMDtr=(X_vBMDtr/B_vBMDtr)*
100; PX_vBMDcr=(X_vBMDcr/B_vBMDcr)*1
00; PX_vBMD100r=(X_vBMD100r/B_vBMD100r)*
100;
PX_CThr=(X_CThr/B_CThr)*
100;
PX_TThr=(X_TThr/B_TThr)*
100; PX_TNr=(X_TNr/B_TNr)*
100; PX_TSpr=(X_TSpr/B_TSpr)*1
00; PX_BVTVr=(X_BVTVr/B_BVTVr)*1
00;
run;
proc s
ort data=vibppp; by group; p
roc
mean
s data=vibppp; by group; var PX_aBMDf PX_aBMDh PX_aBMDs PX_vBMDtt PX_vBMDct
PX_vBMD100t
PX_CTht PX_TTht PX_TNt PX_TSpt PX_BVTVt PX_vBMDtr PX_vBMDcr PX_vBMD100r PX_CThr PX_TThr PX_TNr PX_TSpr PX_BVTVr; r
un;
TITLE DATA CHECKING;
proc c
onte
nts data=vib;r
un;
proc p
rint data=vib; var adherence1 adherence2 adherence3 adhcd sfall X_ca x_vitd x_mass x_BMI x_pat;
run;
proc p
rint data=vibPP; var id group x_aBMDs x_vBMDtt x_BVTVr;
run;
proc p
rint data=vib801; var id group adherence1 x_aBMDs x_vBMDtt x_BVTVr;
run;
proc p
rint data=vib802; var id group adherence2 x_aBMDs x_vBMDtt x_BVTVr;
run;
proc p
rint data=vib803; var id group adherence3 x_aBMDs x_vBMDtt x_BVTVr;
run;
proc p
rint data=vib65; var id group b_mass x_aBMDs x_vBMDtt x_BVTVr; r
un;
proc p
rint data=vib60; var id group b_age x_aBMDs x_vBMDtt x_BVTVr;
run;
proc p
rint data=vib10; var id group PMage x_aBMDs x_vBMDtt x_BVTVr;
run;
proc p
rint data=vibSEN; var id group x_aBMDh x_vBMDtt x_BVTVr; r
un;
Luba
Typewritten Text
243

244
CHAPTER TWO: ADDITIONAL RESULTS

Chapter 2 appendix table 1: Summary of missing cases.
MISSING/COMPROMISED REASON PARTICIPANTS MISSING
PARTICIPANTS (#)
90Hz 30Hz CON Drop‐outs 2 3 2 021, 065, 100, 111, 140, 158, 163 HRT during study 1 1 053, 116 Not evaluable HR‐pQCT tibia scans
Baseline 1 090
Final 1 099 Not evaluable HR‐pQCT radius scans
Baseline 1 1 091, 186
Final 2 040, 099, Suspected compromised study conduct
Improper WBV use 3 4 031, 046, 059, 129, 132, 134, 181
Unknown adherence 3 1 152, 163, 175, 177 Potentially compromised bone
metabolism during study 2 3 040, 058, 099, 103, 161
Late final visit (>3 months) 1 1 2 116, 117, 124, 125 Left ankle fracture 1 059 Left wrist or arm fracture 3 131, 144, 188 <80% matched region for HR‐
pQCT radius scans 1 1 2 136, 185, 188, 193
Large/unexplained loss in radius HR‐pQCT measurements
1 013
Unknown WBV adherence
Unreturned platform 1 163
Digital clock malfunction 3 152, 175, 177 Vitamin D – no recent medical record
5 4 6 003, 042, 053, 086, 092, 097, 104, 115, 117, 119, 120, 145, 151, 153, 196
Abbreviations: 90Hz, 90 Hz group, 30Hz, 30 Hz group, CON, controls. Chapter 2 appendix table 2: Post‐baseline characteristics of vibration study participants. Study Characteristic Category 90Hz 30Hz CON Changes after baseline, mean (SD) Calcium intakes (mg)* ‐63 (632) 18 (621) 102 (570) Vitamin D intake (IU)* 11 (504) 68 (540) 86 (508) Physical activity AMI (kcal/day)** ‐24 (208) ‐12 (150) ‐30 (189) Mass (kg)** 0.2 (2.8) 0.0 (2.3) 0.5 (2.8) BMI (kg∙m‐2)** 0.1 (1.1) 0.0 (0.9) 0.2 (1.1) Vitamin D (nmol/L), mean (SD) Serum 25‐hydroxy 94 (26) 94 (33) 90 (27) Adherence (%), mean (median) WBV cumulative duration 65 (79) 66 (77) na WBV days count 58 (70) 60 (65) na WBV full‐treatment count 64 (78) 65 (77) na Calcium and vitamin D 90 (98) 89 (98) 89 (96) Falls, n (%) One 11 6 17 Two or more 10 6 7 Abbreviations: 90Hz, 90 Hz group, 30Hz, 30 Hz group, CON, controls, SD, standard deviation; AMI, activity metabolic index; BMI, body mass index; calcium and vitamin D supplements; SAE, serious adverse events. *Absolute change in total calcium and vitamin D intakes (diet plus supplements intakes) from baseline (prior to study supplementation) to the first day of WBV treatment and calcium and vitamin D supplementation (Day 1 – baseline) **Change from baseline to 12‐months (final – baseline)
Luba
Typewritten Text
245

Chapter 2 appendix table 3: Percent 12‐month change for DXA and HR‐pQCT parameters in the per‐protocol approach. Per‐protocol approach (n=193) Bone Outcomes: Percent 12 months Change
90Hz (n = 64)
30Hz (n = 65)
CON (n = 64)
DXA aBMDf (%) ‐0.7 (2.6) ‐0.8 (3.4) ‐0.1 (2.9) aBMDh (%) ‐0.4 (1.7) ‐0.2 (2.0) ‐0.3 (1.8) aBMDs (%) ‐0.6 (3.2) ‐0.9 (2.3) ‐0.8 (2.3) HR‐pQCT distal tibia vBMDt (%) 0.4 (2.8) ‐0.1 (2.6) ‐0.2 (2.4) vBMDc (%) ‐1.3 (1.5) ‐1.3 (1.8) ‐1.1 (1.4) vBMDtot (%) ‐0.4 (2.2) ‐0.8 (2.0) ‐0.6 (1.7) CTh (%) 0.1 (3.2) ‐0.6 (4.1) 0.1 (2.9) TTh (%) ‐3.6 (7.7) ‐4.2 (8.8) ‐3.1 (7.6) TN (%) 4.8 (8.9) 5.0 (9.7) 3.7 (8.8) TSp (%) ‐3.9 (8.2) ‐4.0 (8.6) ‐2.9 (7.8) BV/TV (%) 0.4 (2.8) ‐0.0 (2.8) ‐0.2 (2.3) vBMDt (%) ‐1.3 (7.0) ‐1.1 (3.8) ‐0.6 (3.2) HR‐pQCT distal radius vBMDc (%) ‐1.7 (2.0) ‐1.2 (2.2) ‐1.5 (2.1) vBMDtot (%) ‐1.6 (3.8) ‐1.3 (2.7) ‐1.5 (3.2) CTh (%) ‐0.9 (4.9) ‐0.8 (4.2) ‐1.6 (5.9) TTh (%) ‐2.6 (8.6) ‐2.9 (8.3) ‐1.9 (9.4) TN (%) 2.3 (12.0) 2.4 (7.9) 2.1 (9.7) TSp (%) ‐0.2 (18.1) ‐1.6 (7.8) ‐1.1 (9.6) BV/TV (%) ‐1.3 (6.9) ‐1.2 (3.8) ‐0.6 (3.2) Abbreviations: 90Hz, 90 Hz group, 30Hz, 30 Hz group, CON, controls, DXA, dual‐energy x‐ray absorptiometry; HR‐pQCT, high‐resolution peripheral quantitative computed tomography; WBV, whole‐body vibration; SD, standard deviation; BMI, body mass index; BMD, bone mineral density; aBMDf, areal BMD at the femoral neck; aBMDh, areal BMD at the total hip; aBMDs, areal BMD at the lumbar spine L1‐L4; vBMDt, trabecular volumetric BMD; vBMDc, cortical volumetric BMD; vBMDtot, total volumetric BMD; CTh, cortical thickness; TTh, trabecular thickness; TN, trabecular number; TSp, trabecular separation; BV/TV, trabecular bone volume fraction. Chapter 2 appendix table 4: Percent 12‐month change for DXA and HR‐pQCT parameters in the per‐protocol approach.
Cause for dissatisfaction with WBV use Number of 90Hz/30Hz participants agreed
Found 20 minutes of WBV a day too time consuming 39 Found WBV too heavy and bulky 57 Found WBV too difficult to use 3 Experienced unpleasant chronic symptom perceived as WBV‐related 4 Experienced unpleasant transient symptom perceived as WBV‐related 17 Found WBV irritable due to its noisiness 3 Abbreviations: WBV, whole‐body vibration, 90Hz, 90 Hz group, 30Hz, 30 Hz group,
Luba
Typewritten Text
Luba
Typewritten Text
246

247
CHAPTER THREE: SAS CODES

*************************************************************************************************************************
SECONDARY ANALYSIS OF QUS OUTCOMES
*************************************************************************************************************************;
title QUS DATA FILE; run;
libname lubalib 'Z:\_LUBA_\2_VIBRATION STUDY\Data Analysis\SAS'; data qus1; set lubalib.qus1;run;
libname lubalib 'Z:\_LUBA_\2_VIBRATION STUDY\Data Analysis\SAS'; data cov1; set lubalib.cov1;run;
data mergequs; merge qus1 cov1; by id;
keep id
group B_qui B_bua B_sos F_qui F_bua F_sos bsldate dob B_lastperiod B_mass B_pal B_pam B_pah Dlevel
adherence1 adherence2 adherence3; run;
data qus; set mergequs;
x_sos=(f_sos-b_sos); x_bua=(f_bua-b_bua); x_qui=(f_qui-b_qui);
B_age= (bsldate-dob)/365.25;
B_pat= (B_pal+B_pam+B_pah)*52/365.25;
y1=year(B_lastperiod); y2=year(bsldate); PMage=y2-y1; run;
title BASELINE ANALYSIS;
proc glm data=qus; class group; model B_sos=group; means group/hovtest=levene welch; run;
proc glm data=qus; class group; model B_bua=group; means group/hovtest=levene welch; run;
proc glm data=qus; class group; model B_qui=group; means group/hovtest=levene welch; run;
proc glm data=qus; class group; model PMage=group; means group/hovtest=levene welch; run; quit;
title ITT ANALYSIS single imputation/population mean; *27 missing and compromised outcomes imputed from per-protocol;
proc sort data=qus out=qussort; by group; run;
proc means data=qussort n mean; by group; var x_sos x_bua x_qui; run;
/*group=A ---------------------------------------------
ƒƒƒƒƒƒƒƒƒƒƒƒƒƒƒƒƒƒƒƒƒƒƒƒƒƒƒƒƒƒƒ
x_sos 59 -1.9271186
x_bua 59 -0.7135593
x_qui 59 -1.0864407
ƒƒƒƒƒƒƒƒƒƒƒƒƒƒƒƒƒƒƒƒƒƒƒƒƒƒƒƒƒƒƒ
group=B ---------------------------------------------
ƒƒƒƒƒƒƒƒƒƒƒƒƒƒƒƒƒƒƒƒƒƒƒƒƒƒƒƒƒƒƒ
x_sos 60 -1.6900000
x_bua 60 -0.7450000
x_qui 60 -0.9783333
ƒƒƒƒƒƒƒƒƒƒƒƒƒƒƒƒƒƒƒƒƒƒƒƒƒƒƒƒƒƒƒ
group=C ---------------------------------------------
ƒƒƒƒƒƒƒƒƒƒƒƒƒƒƒƒƒƒƒƒƒƒƒƒƒƒƒƒƒƒƒ
x_sos 58 -0.6396552
x_bua 58 1.3241379
x_qui 58 0.2672414*/
data qusitt; set qus;
if id='053' or id='116' then x_sos='.';/*HRT participants*/
if id='053' or id='116' then x_bua='.';
if id='053' or id='116' then x_qui='.';
if x_sos='.' and group='A' then x_sos=-1.9271186;
if x_bua='.' and group='A' then x_bua=-0.7135593;
if x_qui='.' and group='A' then x_qui=-1.0864407;
if x_sos='.' and group='B' then x_sos=-1.6900000;
if x_bua='.' and group='B' then x_bua=-0.7450000;
if x_qui='.' and group='B' then x_qui=-0.9783333;
if x_sos='.' and group='C' then x_sos=-0.6396552;
if x_bua='.' and group='C' then x_bua=1.3241379;
if x_qui='.' and group='C' then x_qui=0.2672414; run;
proc glm data=qusitt;class group; model x_sos=group; means group/hovtest=levene welch;
contrast 'A>B>C: A vs B'
group 1 -1 0;
contrast 'A>B>C: A vs C'
group 1 0 -1;
contrast 'A>B>C: B vs C'
group 0 1 -1;
contrast 'A=B>C: A+B vs C'
group 1 1 -2; run; quit;
proc glm data=qusitt;class group; model x_bua=group; means group/hovtest=levene welch;
contrast 'A>B>C: A vs B'
group 1 -1 0;
contrast 'A>B>C: A vs C'
group 1 0 -1;
contrast 'A>B>C: B vs C'
group 0 1 -1;
contrast 'A=B>C: A+B vs C'
group 1 1 -2; run; quit;
proc glm data=qusitt;class group; model x_qui=group; means group/hovtest=levene welch;
contrast 'A>B>C: A vs B'
group 1 -1 0;
contrast 'A>B>C: A vs C'
group 1 0 -1;
contrast 'A>B>C: B vs C'
group 0 1 -1;
contrast 'A=B>C: A+B vs C'
group 1 1 -2; run; quit;
title PER PROTOCOL ANALYSIS; *27 missing and compromised QUS outcomes excluded;
data quspp; set qus; if id='053' or id='116' then delete;
proc glm data=quspp; class group; model x_sos=group; means group/hovtest=levene welch;
contrast 'A>B>C: A vs B'
group 1 -1 0;
contrast 'A>B>C: A vs C'
group 1 0 -1;
contrast 'A>B>C: B vs C'
group 0 1 -1;
contrast 'A=B>C: A+B vs C'
group 1 1 -2; run; quit;
proc glm data=quspp; class group; model x_bua=group; means group/hovtest=levene welch;
contrast 'A>B>C: A vs B'
group 1 -1 0;
contrast 'A>B>C: A vs C'
group 1 0 -1;
contrast 'A>B>C: B vs C'
group 0 1 -1;
contrast 'A=B>C: A+B vs C'
group 1 1 -2; run; quit;
proc glm data=quspp; class group; model x_qui=group; means group/hovtest=levene welch;
contrast 'A>B>C: A vs B'
group 1 -1 0;
contrast 'A>B>C: A vs C'
group 1 0 -1;
contrast 'A>B>C: B vs C'
group 0 1 -1;
contrast 'A=B>C: A+B vs C'
group 1 1 -2; run; quit;
title SUBGROUP =>80% cummulative WBV duration (adherence1);
data qus801; set quspp; if group='C' then adherence1=100; if adherence1>=80;run;
proc glm data=qus801;class group; model x_sos=group; means group/hovtest=levene welch;
contrast 'A>B>C: A vs B'
group 1 -1 0;
contrast 'A>B>C: A vs C'
group 1 0 -1;
contrast 'A>B>C: B vs C'
group 0 1 -1;
contrast 'A=B>C: A+B vs C'
group 1 1 -2; run; quit;
proc glm data=qus801;class group; model x_bua=group; means group/hovtest=levene welch;
contrast 'A>B>C: A vs B'
group 1 -1 0;
contrast 'A>B>C: A vs C'
group 1 0 -1;
contrast 'A>B>C: B vs C'
group 0 1 -1;
contrast 'A=B>C: A+B vs C'
group 1 1 -2; run; quit;
proc glm data=qus801;class group; model x_qui=group; means group/hovtest=levene welch;
contrast 'A>B>C: A vs B'
group 1 -1 0;
contrast 'A>B>C: A vs C'
group 1 0 -1;
contrast 'A>B>C: B vs C'
group 0 1 -1;
contrast 'A=B>C: A+B vs C'
group 1 1 -2; run; quit;
title SUBGROUP =>80% number of WBV days (adherence2);
data qus802; set quspp; if group='C' then adherence2=100; if adherence2>=80;run;
proc glm data=qus802;class group; model x_sos=group; means group/hovtest=levene welch;
contrast 'A>B>C: A vs B'
group 1 -1 0;
contrast 'A>B>C: A vs C'
group 1 0 -1;
contrast 'A>B>C: B vs C'
group 0 1 -1;
contrast 'A=B>C: A+B vs C'
group 1 1 -2; run; quit;
proc glm data=qus802;class group; model x_bua=group; means group/hovtest=levene welch;
contrast 'A>B>C: A vs B'
group 1 -1 0;
contrast 'A>B>C: A vs C'
group 1 0 -1;
contrast 'A>B>C: B vs C'
group 0 1 -1;
contrast 'A=B>C: A+B vs C'
group 1 1 -2; run; quit;
proc glm data=qus802;class group; model x_qui=group; means group/hovtest=levene welch;
contrast 'A>B>C: A vs B'
group 1 -1 0;
contrast 'A>B>C: A vs C'
group 1 0 -1;
contrast 'A>B>C: B vs C'
group 0 1 -1;
contrast 'A=B>C: A+B vs C'
group 1 1 -2; run; quit;
title SUBGROUP =>80% WBV full-treatment count (adherence3);
data qus803; set quspp; if group='C' then adherence3=100; if adherence3>=80;run;
proc glm data=qus803;class group; model x_sos=group; means group/hovtest=levene welch;
contrast 'A>B>C: A vs B'
group 1 -1 0;
contrast 'A>B>C: A vs C'
group 1 0 -1;
contrast 'A>B>C: B vs C'
group 0 1 -1;
contrast 'A=B>C: A+B vs C'
group 1 1 -2; run; quit;
proc glm data=qus803;class group; model x_bua=group; means group/hovtest=levene welch;
contrast 'A>B>C: A vs B'
group 1 -1 0;
contrast 'A>B>C: A vs C'
group 1 0 -1;
contrast 'A>B>C: B vs C'
group 0 1 -1;
contrast 'A=B>C: A+B vs C'
group 1 1 -2; run; quit;
proc glm data=qus803;class group; model x_qui=group; means group/hovtest=levene welch;
contrast 'A>B>C: A vs B'
group 1 -1 0;
contrast 'A>B>C: A vs C'
group 1 0 -1;
contrast 'A>B>C: B vs C'
group 0 1 -1;
contrast 'A=B>C: A+B vs C'
group 1 1 -2; run; quit;
title SUBGROUP <65kg;
data qus65; set quspp; if b_mass<65;run;
proc glm data=qus65;class group; model x_sos=group; means group/hovtest=levene welch;
contrast 'A>B>C: A vs B'
group 1 -1 0;
contrast 'A>B>C: A vs C'
group 1 0 -1;
contrast 'A>B>C: B vs C'
group 0 1 -1;
contrast 'A=B>C: A+B vs C'
group 1 1 -2; run; quit;
proc glm data=qus65;class group; model x_bua=group; means group/hovtest=levene welch;
contrast 'A>B>C: A vs B'
group 1 -1 0;
contrast 'A>B>C: A vs C'
group 1 0 -1;
contrast 'A>B>C: B vs C'
group 0 1 -1;
contrast 'A=B>C: A+B vs C'
group 1 1 -2; run; quit;
proc glm data=qus65;class group; model x_qui=group; means group/hovtest=levene welch;
contrast 'A>B>C: A vs B'
group 1 -1 0;
contrast 'A>B>C: A vs C'
group 1 0 -1;
contrast 'A>B>C: B vs C'
group 0 1 -1;
contrast 'A=B>C: A+B vs C'
group 1 1 -2; run; quit;
title SUBGROUP =<60yrs;
data qus60; set quspp; if b_age=<60;run;
proc glm data=qus60;class group; model x_sos=group; means group/hovtest=levene welch;
contrast 'A>B>C: A vs B'
group 1 -1 0;
contrast 'A>B>C: A vs C'
group 1 0 -1;
contrast 'A>B>C: B vs C'
group 0 1 -1;
contrast 'A=B>C: A+B vs C'
group 1 1 -2; run; quit;
proc glm data=qus60;class group; model x_bua=group; means group/hovtest=levene welch;
contrast 'A>B>C: A vs B'
group 1 -1 0;
contrast 'A>B>C: A vs C'
group 1 0 -1;
contrast 'A>B>C: B vs C'
group 0 1 -1;
contrast 'A=B>C: A+B vs C'
group 1 1 -2; run; quit;
proc glm data=qus60;class group; model x_qui=group; means group/hovtest=levene welch;
contrast 'A>B>C: A vs B'
group 1 -1 0;
contrast 'A>B>C: A vs C'
group 1 0 -1;
contrast 'A>B>C: B vs C'
group 0 1 -1;
contrast 'A=B>C: A+B vs C'
group 1 1 -2; run; quit;
Luba
Typewritten Text
248

title SUBGROUP =<10PMage;
data qus10; set quspp; if PMage=<10;run;
proc glm data=qus10;class group; model x_sos=group; means group/hovtest=levene welch;
contrast 'A>B>C: A vs B'
group 1 -1 0;
contrast 'A>B>C: A vs C'
group 1 0 -1;
contrast 'A>B>C: B vs C'
group 0 1 -1;
contrast 'A=B>C: A+B vs C'
group 1 1 -2; run; quit;
proc glm data=qus10;class group; model x_bua=group; means group/hovtest=levene welch;
contrast 'A>B>C: A vs B'
group 1 -1 0;
contrast 'A>B>C: A vs C'
group 1 0 -1;
contrast 'A>B>C: B vs C'
group 0 1 -1;
contrast 'A=B>C: A+B vs C'
group 1 1 -2; run; quit;
proc glm data=qus10;class group; model x_qui=group; means group/hovtest=levene welch;
contrast 'A>B>C: A vs B'
group 1 -1 0;
contrast 'A>B>C: A vs C'
group 1 0 -1;
contrast 'A>B>C: B vs C'
group 0 1 -1;
contrast 'A=B>C: A+B vs C'
group 1 1 -2; run; quit;
title ANCOVA ANALYSES;
proc glm data=quspp; class group; model x_sos=b_pat group; lsmeans group;
contrast 'A>B>C: A vs B'
group 1 -1 0;
contrast 'A>B>C: A vs C'
group 1 0 -1;
contrast 'A>B>C: B vs C'
group 0 1 -1;
contrast 'A=B>C: A+B vs C'
group 1 1 -2; run; quit;
proc glm data=quspp; class group; model x_bua=b_pat group; lsmeans group;
contrast 'A>B>C: A vs B'
group 1 -1 0;
contrast 'A>B>C: A vs C'
group 1 0 -1;
contrast 'A>B>C: B vs C'
group 0 1 -1;
contrast 'A=B>C: A+B vs C'
group 1 1 -2; run; quit;
proc glm data=quspp; class group; model x_qui=b_pat group; lsmeans group;
contrast 'A>B>C: A vs B'
group 1 -1 0;
contrast 'A>B>C: A vs C'
group 1 0 -1;
contrast 'A>B>C: B vs C'
group 0 1 -1;
contrast 'A=B>C: A+B vs C'
group 1 1 -2; run; quit;
proc glm data=quspp; class group; model x_sos=dlevel group; lsmeans group;
contrast 'A>B>C: A vs B'
group 1 -1 0;
contrast 'A>B>C: A vs C'
group 1 0 -1;
contrast 'A>B>C: B vs C'
group 0 1 -1;
contrast 'A=B>C: A+B vs C'
group 1 1 -2; run; quit;
proc glm data=quspp; class group; model x_bua=dlevel group; lsmeans group;
contrast 'A>B>C: A vs B'
group 1 -1 0;
contrast 'A>B>C: A vs C'
group 1 0 -1;
contrast 'A>B>C: B vs C'
group 0 1 -1;
contrast 'A=B>C: A+B vs C'
group 1 1 -2; run; quit;
proc glm data=quspp; class group; model x_qui=dlevel group; lsmeans group;
contrast 'A>B>C: A vs B'
group 1 -1 0;
contrast 'A>B>C: A vs C'
group 1 0 -1;
contrast 'A>B>C: B vs C'
group 0 1 -1;
contrast 'A=B>C: A+B vs C'
group 1 1 -2; run; quit;
title SENSITIVITY ANALYSIS; *16 participants with potentially compromised study conduct excluded (177 already excluded);
data qussen; set quspp;
if id='046' or id='031' or id='134' or id='129' or id='132' or id='181' or id='152' or id='175' or id='177' or id='058'
or id='103' or id='161' or id='040' or id='099' or id='117' or id='124' or id='125' then x_bua='.';
if id='046' or id='031' or id='134' or id='129' or id='132' or id='181' or id='152' or id='175' or id='177' or id='058'
or id='103' or id='161' or id='040' or id='099' or id='117' or id='124' or id='125' then x_sos='.';
if id='046' or id='031' or id='134' or id='129' or id='132' or id='181' or id='152' or id='175' or id='177' or id='058'
or id='103' or id='161' or id='040' or id='099' or id='117' or id='124' or id='125' then x_qui='.'; run;
proc glm data=qussen;class group; model x_sos=group; means group/hovtest=levene welch;
contrast 'A>B>C: A vs B'
group 1 -1 0;
contrast 'A>B>C: A vs C'
group 1 0 -1;
contrast 'A>B>C: B vs C'
group 0 1 -1;
contrast 'A=B>C: A+B vs C'
group 1 1 -2; run; quit;
proc glm data=qussen;class group; model x_bua=group; means group/hovtest=levene welch;
contrast 'A>B>C: A vs B'
group 1 -1 0;
contrast 'A>B>C: A vs C'
group 1 0 -1;
contrast 'A>B>C: B vs C'
group 0 1 -1;
contrast 'A=B>C: A+B vs C'
group 1 1 -2; run; quit;
proc glm data=qussen;class group; model x_qui=group; means group/hovtest=levene welch;
contrast 'A>B>C: A vs B'
group 1 -1 0;
contrast 'A>B>C: A vs C'
group 1 0 -1;
contrast 'A>B>C: B vs C'
group 0 1 -1;
contrast 'A=B>C: A+B vs C'
group 1 1 -2; run; quit;
title DESCRIBING IMPORTANT VARIABLES;
proc means data=qussort n nmiss mean std median min max; by group; var adherence1 adherence2 adherence3 b_mass b_age PMage
b_pat dlevel; run;
proc sort data=quspp out=qusppsort; by group; run;
proc univariate data=qusppsort normal plot; id id; by group; var x_bua;
title x_sos; proc univariate data=qusppsort normal plot; id id; by group; var x_sos;
histogram/cfill=ligr VSCALE=count normal (color=blue) kernel(color=red) cv=black; inset n mean std max min nmiss skewness
kurtosis;
qqplot/normal(mu=est sigma=est color=red); run;
title x_bua; proc univariate data=qusppsort normal plot; id id; by group; var x_bua;
histogram/cfill=ligr VSCALE=count normal (color=blue) kernel(color=red) cv=black; inset n mean std max min nmiss skewness
kurtosis;
qqplot/normal(mu=est sigma=est color=red); run;
title x_qui; proc univariate data=qusppsort normal plot; id id; by group; var x_qui;
histogram/cfill=ligr VSCALE=count normal (color=blue) kernel(color=red) cv=black; inset n mean std max min nmiss skewness
kurtosis;
qqplot/normal(mu=est sigma=est color=red); run;
data quspercent; set qusppsort; px_sos=(x_sos/b_sos)*100; px_bua=(x_bua/b_bua)*100; px_qui=(x_qui/b_qui)*100; run;
proc means data=quspercent; var px_sos px_bua px_qui; run;
title DATA CHECKING;
proc contents data=qus; run;
proc print data=quspp; id id; var id group F_sos b_sos x_sos F_bua b_bua x_bua F_qui b_qui x_qui;
run;
proc print data=quspp; id id; var id group b_age PMage B_pat; run;
proc print data=qus801; id id; var id group adherence1 x_sos x_bua x_qui; run;
proc print data=qus802; id id; var id group adherence2 x_sos x_bua x_qui; run;
proc print data=qus803; id id; var id group adherence3 x_sos x_bua x_qui; run;
proc print data=qus65;var id group b_mass x_sos x_bua x_qui; run;
proc print data=qus60;var id group b_age x_sos x_bua x_qui; run;
proc print data=qus10;var id group PMage x_sos x_bua x_qui; run;
proc print data=qussen; id id; var id group x_sos x_bua x_qui; run;
Luba
Typewritten Text
249

250
CHAPTER THREE: QUS QC – CALIBRATION LOG

Month/Year ASSESING BUA QC RANGE (QAB) ASSESING SOS QC RANGE (QAS) WIDE NARROW NARROW WIDE WIDE NARROW NARROW WIDE Day QAB QAB>=0.7 QAB>=0.87 QAB=<1.14 QAB=<1.30 QAS QAS=>0.97 QAS=>0.987 QAS<=1.014 QAS<=1.03
NOVEMBER 2009
3 1.08 TRUE TRUE TRUE TRUE 0.994 TRUE TRUE TRUE TRUE 4 1.08 TRUE TRUE TRUE TRUE 0.992 TRUE TRUE TRUE TRUE 6 1.09 TRUE TRUE TRUE TRUE 0.99 TRUE TRUE TRUE TRUE 13 1.1 TRUE TRUE TRUE TRUE 0.991 TRUE TRUE TRUE TRUE 17 1.11 TRUE TRUE TRUE TRUE 0.99 TRUE TRUE TRUE TRUE
OCTOBER 2009
1 1.12 TRUE TRUE TRUE TRUE 0.994 TRUE TRUE TRUE TRUE
7 1.13 TRUE TRUE TRUE TRUE 0.994 TRUE TRUE TRUE TRUE 9 1.14 TRUE TRUE TRUE TRUE 0.991 TRUE TRUE TRUE TRUE 13 1.15 TRUE TRUE FALSE TRUE 0.993 TRUE TRUE TRUE TRUE 14 1.16 TRUE TRUE FALSE TRUE 0.992 TRUE TRUE TRUE TRUE 15 1.17 TRUE TRUE FALSE TRUE 0.989 TRUE TRUE TRUE TRUE 19 1.18 TRUE TRUE FALSE TRUE 0.993 TRUE TRUE TRUE TRUE 23 1.19 TRUE TRUE FALSE TRUE 0.995 TRUE TRUE TRUE TRUE 26 1.2 TRUE TRUE FALSE TRUE 0.992 TRUE TRUE TRUE TRUE 28 1.21 TRUE TRUE FALSE TRUE 0.99 TRUE TRUE TRUE TRUE
SEPTEMBER 2009
3 1.22 TRUE TRUE FALSE TRUE 0.994 TRUE TRUE TRUE TRUE
8 1.23 TRUE TRUE FALSE TRUE 0.993 TRUE TRUE TRUE TRUE 11 1.24 TRUE TRUE FALSE TRUE 0.994 TRUE TRUE TRUE TRUE 21 1.25 TRUE TRUE FALSE TRUE 0.979 TRUE FALSE TRUE TRUE 28 1.26 TRUE TRUE FALSE TRUE 0.995 TRUE TRUE TRUE TRUE
AUGUST 2009 4 1.27 TRUE TRUE FALSE TRUE 0.994 TRUE TRUE TRUE TRUE 11 1.28 TRUE TRUE FALSE TRUE 0.994 TRUE TRUE TRUE TRUE 13 1.29 TRUE TRUE FALSE TRUE 0.994 TRUE TRUE TRUE TRUE 28 1.3 TRUE TRUE FALSE TRUE 0.993 TRUE TRUE TRUE TRUE
JULY 2009 21 1.31 TRUE TRUE FALSE FALSE 0.994 TRUE TRUE TRUE TRUE 22 1.32 TRUE TRUE FALSE FALSE 0.995 TRUE TRUE TRUE TRUE 23 1.33 TRUE TRUE FALSE FALSE 0.992 TRUE TRUE TRUE TRUE 27 1.34 TRUE TRUE FALSE FALSE 0.993 TRUE TRUE TRUE TRUE 29 1.35 TRUE TRUE FALSE FALSE 0.995 TRUE TRUE TRUE TRUE 31 1.36 TRUE TRUE FALSE FALSE 0.995 TRUE TRUE TRUE TRUE
JUNE 2009 2 1.12 TRUE TRUE TRUE TRUE 0.995 TRUE TRUE TRUE TRUE 12 1.07 TRUE TRUE TRUE TRUE 0.989 TRUE TRUE TRUE TRUE 22 1.08 TRUE TRUE TRUE TRUE 0.991 TRUE TRUE TRUE TRUE 23 1.1 TRUE TRUE TRUE TRUE 0.993 TRUE TRUE TRUE TRUE 25 1.09 TRUE TRUE TRUE TRUE 0.991 TRUE TRUE TRUE TRUE
MAY 2009 25 1.11 TRUE TRUE TRUE TRUE 0.994 TRUE TRUE TRUE TRUE 28 1.12 TRUE TRUE TRUE TRUE 0.995 TRUE TRUE TRUE TRUE
APRIL 2009 6 1.13 TRUE TRUE TRUE TRUE 0.998 TRUE TRUE TRUE TRUE 13 1.13 TRUE TRUE TRUE TRUE 0.996 TRUE TRUE TRUE TRUE 28 1.08 TRUE TRUE TRUE TRUE 0.988 TRUE TRUE TRUE TRUE
MARCH 2009 9 1.12 TRUE TRUE TRUE TRUE 0.995 TRUE TRUE TRUE TRUE 25 1.12 TRUE TRUE TRUE TRUE 0.994 TRUE TRUE TRUE TRUE
FEB 2009 6 1.11 TRUE TRUE TRUE TRUE 0.995 TRUE TRUE TRUE TRUE 7 1.08 TRUE TRUE TRUE TRUE 0.995 TRUE TRUE TRUE TRUE 18 1.02 TRUE TRUE TRUE TRUE 0.992 TRUE TRUE TRUE TRUE 20 1.15 TRUE TRUE FALSE TRUE 0.993 TRUE TRUE TRUE TRUE 24 1.11 TRUE TRUE TRUE TRUE 0.995 TRUE TRUE TRUE TRUE
JANUARY 2009 6 1.09 TRUE TRUE TRUE TRUE 0.995 TRUE TRUE TRUE TRUE 9 1.16 TRUE TRUE FALSE TRUE 0.992 TRUE TRUE TRUE TRUE 16 1.11 TRUE TRUE TRUE TRUE 0.997 TRUE TRUE TRUE TRUE 19 1.13 TRUE TRUE TRUE TRUE 0.995 TRUE TRUE TRUE TRUE 21 1.12 TRUE TRUE TRUE TRUE 0.99 TRUE TRUE TRUE TRUE 23 1.11 TRUE TRUE TRUE TRUE 0.996 TRUE TRUE TRUE TRUE 30 1.11 TRUE TRUE TRUE TRUE 0.994 TRUE TRUE TRUE TRUE
lslatkov
Text Box
251

DECEMBER 2008
1 1.09 TRUE TRUE TRUE TRUE 0.993 TRUE TRUE TRUE TRUE
4 1.07 TRUE TRUE TRUE TRUE 0.993 TRUE TRUE TRUE TRUE 9 1.1 TRUE TRUE TRUE TRUE 0.996 TRUE TRUE TRUE TRUE 16 1.1 TRUE TRUE TRUE TRUE 0.997 TRUE TRUE TRUE TRUE 19 1.09 TRUE TRUE TRUE TRUE 0.995 TRUE TRUE TRUE TRUE
NOVEMBER 2008
1 1.08 TRUE TRUE TRUE TRUE 0.994 TRUE TRUE TRUE TRUE
6 1.08 TRUE TRUE TRUE TRUE 0.991 TRUE TRUE TRUE TRUE 17 1.09 TRUE TRUE TRUE TRUE 0.996 TRUE TRUE TRUE TRUE 24 1.06 TRUE TRUE TRUE TRUE 0.994 TRUE TRUE TRUE TRUE 25 1.08 TRUE TRUE TRUE TRUE 0.996 TRUE TRUE TRUE TRUE 28 1.16 TRUE TRUE FALSE TRUE 0.995 TRUE TRUE TRUE TRUE
OCTOBER 2008 1 1.05 TRUE TRUE TRUE TRUE 0.995 TRUE TRUE TRUE TRUE 2 1.05 TRUE TRUE TRUE TRUE 0.996 TRUE TRUE TRUE TRUE 3 1.07 TRUE TRUE TRUE TRUE 0.998 TRUE TRUE TRUE TRUE 6 1.05 TRUE TRUE TRUE TRUE 0.994 TRUE TRUE TRUE TRUE 7 1.09 TRUE TRUE TRUE TRUE 0.996 TRUE TRUE TRUE TRUE 8 1.09 TRUE TRUE TRUE TRUE 0.996 TRUE TRUE TRUE TRUE 10 1.06 TRUE TRUE TRUE TRUE 0.992 TRUE TRUE TRUE TRUE 11 1.06 TRUE TRUE TRUE TRUE 0.992 TRUE TRUE TRUE TRUE 14 1.05 TRUE TRUE TRUE TRUE 0.996 TRUE TRUE TRUE TRUE 17 1.06 TRUE TRUE TRUE TRUE 0.994 TRUE TRUE TRUE TRUE 21 1.07 TRUE TRUE TRUE TRUE 0.997 TRUE TRUE TRUE TRUE 22 1.09 TRUE TRUE TRUE TRUE 0.997 TRUE TRUE TRUE TRUE 23 1.06 TRUE TRUE TRUE TRUE 0.994 TRUE TRUE TRUE TRUE 24 1.1 TRUE TRUE TRUE TRUE 0.995 TRUE TRUE TRUE TRUE 27 1.08 TRUE TRUE TRUE TRUE 0.993 TRUE TRUE TRUE TRUE 28 1.1 TRUE TRUE TRUE TRUE 0.995 TRUE TRUE TRUE TRUE 31 1.09 TRUE TRUE TRUE TRUE 0.991 TRUE TRUE TRUE TRUE 1.03 TRUE TRUE TRUE TRUE 0.991 TRUE TRUE TRUE TRUE 1.06 TRUE TRUE TRUE TRUE 0.996 TRUE TRUE TRUE TRUE
SEPTEMBER 2008
2 1.07 TRUE TRUE TRUE TRUE 0.995 TRUE TRUE TRUE TRUE
3 1.06 TRUE TRUE TRUE TRUE 0.995 TRUE TRUE TRUE TRUE 18 1.06 TRUE TRUE TRUE TRUE 0.997 TRUE TRUE TRUE TRUE 22 1.04 TRUE TRUE TRUE TRUE 0.994 TRUE TRUE TRUE TRUE 23 1.04 TRUE TRUE TRUE TRUE 0.994 TRUE TRUE TRUE TRUE 25 1.05 TRUE TRUE TRUE TRUE 0.996 TRUE TRUE TRUE TRUE 30 1.06 TRUE TRUE TRUE TRUE 0.993 TRUE TRUE TRUE TRUE
AUGUST 2008 18 1.04 TRUE TRUE TRUE TRUE 0.996 TRUE TRUE TRUE TRUE 21 1.07 TRUE TRUE TRUE TRUE 0.995 TRUE TRUE TRUE TRUE 22 1.07 TRUE TRUE TRUE TRUE 0.997 TRUE TRUE TRUE TRUE 26 1.06 TRUE TRUE TRUE TRUE 0.994 TRUE TRUE TRUE TRUE 27 1.07 TRUE TRUE TRUE TRUE 0.996 TRUE TRUE TRUE TRUE 29 1.07 TRUE TRUE TRUE TRUE 0.996 TRUE TRUE TRUE TRUE
JULY 2008 10 1.04 TRUE TRUE TRUE TRUE 0.996 TRUE TRUE TRUE TRUE 14 1.1 TRUE TRUE TRUE TRUE 0.995 TRUE TRUE TRUE TRUE 17 1.07 TRUE TRUE TRUE TRUE 0.992 TRUE TRUE TRUE TRUE 21 1.07 TRUE TRUE TRUE TRUE 0.996 TRUE TRUE TRUE TRUE 22 1.08 TRUE TRUE TRUE TRUE 0.997 TRUE TRUE TRUE TRUE 25 1.1 TRUE TRUE TRUE TRUE 0.996 TRUE TRUE TRUE TRUE 28 1.09 TRUE TRUE TRUE TRUE 0.996 TRUE TRUE TRUE TRUE 30 1.1 TRUE TRUE TRUE TRUE 0.996 TRUE TRUE TRUE TRUE 31 1.1 TRUE TRUE TRUE TRUE 0.995 TRUE TRUE TRUE TRUE
JUNE 2008 6 1.08 TRUE TRUE TRUE TRUE 0.997 TRUE TRUE TRUE TRUE 11 1.13 TRUE TRUE TRUE TRUE 0.993 TRUE TRUE TRUE TRUE 13 1.12 TRUE TRUE TRUE TRUE 0.997 TRUE TRUE TRUE TRUE 16 1.08 TRUE TRUE TRUE TRUE 0.998 TRUE TRUE TRUE TRUE 18 1.09 TRUE TRUE TRUE TRUE 0.998 TRUE TRUE TRUE TRUE 23 1.11 TRUE TRUE TRUE TRUE 0.995 TRUE TRUE TRUE TRUE 25 1.11 TRUE TRUE TRUE TRUE 0.997 TRUE TRUE TRUE TRUE
lslatkov
Text Box
252

MAY 2008 2 1.12 TRUE TRUE TRUE TRUE 0.997 TRUE TRUE TRUE TRUE 5 1.12 TRUE TRUE TRUE TRUE 0.999 TRUE TRUE TRUE TRUE 6 1.12 TRUE TRUE TRUE TRUE 0.999 TRUE TRUE TRUE TRUE 7 1.03 TRUE TRUE TRUE TRUE 0.993 TRUE TRUE TRUE TRUE 8 1.12 TRUE TRUE TRUE TRUE 0.997 TRUE TRUE TRUE TRUE 9 1.11 TRUE TRUE TRUE TRUE 0.999 TRUE TRUE TRUE TRUE 12 1.09 TRUE TRUE TRUE TRUE 0.997 TRUE TRUE TRUE TRUE 13 1.12 TRUE TRUE TRUE TRUE 1 TRUE TRUE TRUE TRUE 20 1.12 TRUE TRUE TRUE TRUE 0.999 TRUE TRUE TRUE TRUE 22 1.12 TRUE TRUE TRUE TRUE 0.993 TRUE TRUE TRUE TRUE 23 1.13 TRUE TRUE TRUE TRUE 0.998 TRUE TRUE TRUE TRUE 26 1 TRUE TRUE TRUE TRUE 1.12 TRUE TRUE FALSE FALSE 30 1.12 TRUE TRUE TRUE TRUE 0.999 TRUE TRUE TRUE TRUE
APRIL 2008 1 1.1 TRUE TRUE TRUE TRUE 0.997 TRUE TRUE TRUE TRUE 14 1.11 TRUE TRUE TRUE TRUE 0.999 TRUE TRUE TRUE TRUE 16 1.12 TRUE TRUE TRUE TRUE 0.997 TRUE TRUE TRUE TRUE 18 1.13 TRUE TRUE TRUE TRUE 0.998 TRUE TRUE TRUE TRUE 21 1.13 TRUE TRUE TRUE TRUE 0.998 TRUE TRUE TRUE TRUE 30 1.13 TRUE TRUE TRUE TRUE 0.997 TRUE TRUE TRUE TRUE
MARCH 2008 14 1.1 TRUE TRUE TRUE TRUE 0.997 TRUE TRUE TRUE TRUE 17 1.12 TRUE TRUE TRUE TRUE 0.997 TRUE TRUE TRUE TRUE 18 1.06 TRUE TRUE TRUE TRUE 0.993 TRUE TRUE TRUE TRUE 19 1.1 TRUE TRUE TRUE TRUE 0.997 TRUE TRUE TRUE TRUE 20 1.08 TRUE TRUE TRUE TRUE 0.998 TRUE TRUE TRUE TRUE 26 1.1 TRUE TRUE TRUE TRUE 0.997 TRUE TRUE TRUE TRUE 28 1.1 TRUE TRUE TRUE TRUE 0.999 TRUE TRUE TRUE TRUE
FEBRUARY 2008 4 1.11 TRUE TRUE TRUE TRUE 1 TRUE TRUE TRUE TRUE 5 1.09 TRUE TRUE TRUE TRUE 0.998 TRUE TRUE TRUE TRUE 6 1.1 TRUE TRUE TRUE TRUE 0.998 TRUE TRUE TRUE TRUE 7 1.12 TRUE TRUE TRUE TRUE 1 TRUE TRUE TRUE TRUE 13 1.1 TRUE TRUE TRUE TRUE 0.994 TRUE TRUE TRUE TRUE 15 1.13 TRUE TRUE TRUE TRUE 0.999 TRUE TRUE TRUE TRUE 20 1.12 TRUE TRUE TRUE TRUE 0.998 TRUE TRUE TRUE TRUE 22 1.11 TRUE TRUE TRUE TRUE 0.999 TRUE TRUE TRUE TRUE 26 1.13 TRUE TRUE TRUE TRUE 0.998 TRUE TRUE TRUE TRUE 29 1.13 TRUE TRUE TRUE TRUE 0.999 TRUE TRUE TRUE TRUE
JANUARY 2008 4 1.13 TRUE TRUE TRUE TRUE 0.996 TRUE TRUE TRUE TRUE 7 1.13 TRUE TRUE TRUE TRUE 1 TRUE TRUE TRUE TRUE 8 1.08 TRUE TRUE TRUE TRUE 0.997 TRUE TRUE TRUE TRUE 9 1.08 TRUE TRUE TRUE TRUE 0.998 TRUE TRUE TRUE TRUE 10 1.09 TRUE TRUE TRUE TRUE 1 TRUE TRUE TRUE TRUE 11 1.1 TRUE TRUE TRUE TRUE 0.998 TRUE TRUE TRUE TRUE 14 1.08 TRUE TRUE TRUE TRUE 0.91 FALSE FALSE TRUE TRUE 15 1.11 TRUE TRUE TRUE TRUE 0.996 TRUE TRUE TRUE TRUE 16 1.11 TRUE TRUE TRUE TRUE 0.994 TRUE TRUE TRUE TRUE 17 1.12 TRUE TRUE TRUE TRUE 0.998 TRUE TRUE TRUE TRUE 18 1.1 TRUE TRUE TRUE TRUE 0.998 TRUE TRUE TRUE TRUE 23 1.13 TRUE TRUE TRUE TRUE 1 TRUE TRUE TRUE TRUE 24 1.13 TRUE TRUE TRUE TRUE 0.997 TRUE TRUE TRUE TRUE 28 1.13 TRUE TRUE TRUE TRUE 0.999 TRUE TRUE TRUE TRUE 31 1.13 TRUE TRUE TRUE TRUE 0.997 TRUE TRUE TRUE TRUE
DECEMBER 2007
4 1.11 TRUE TRUE TRUE TRUE 0.998 TRUE TRUE TRUE TRUE
6 1.12 TRUE TRUE TRUE TRUE 0.99 TRUE TRUE TRUE TRUE 7 1.12 TRUE TRUE TRUE TRUE 0.992 TRUE TRUE TRUE TRUE 10 1.12 TRUE TRUE TRUE TRUE 0.988 TRUE TRUE TRUE TRUE 11 1.12 TRUE TRUE TRUE TRUE 0.999 TRUE TRUE TRUE TRUE 12 1.13 TRUE TRUE TRUE TRUE 0.998 TRUE TRUE TRUE TRUE 14 1.11 TRUE TRUE TRUE TRUE 0.997 TRUE TRUE TRUE TRUE 17 1.12 TRUE TRUE TRUE TRUE 0.995 TRUE TRUE TRUE TRUE 18 1.12 TRUE TRUE TRUE TRUE 0.994 TRUE TRUE TRUE TRUE 19 1.12 TRUE TRUE TRUE TRUE 0.999 TRUE TRUE TRUE TRUE
lslatkov
Text Box
lslatkov
Text Box
253

20 1.13 TRUE TRUE TRUE TRUE 1 TRUE TRUE TRUE TRUENOVEMBER 2007
5 1.12 TRUE TRUE TRUE TRUE 0.998 TRUE TRUE TRUE TRUE
7 1.06 TRUE TRUE TRUE TRUE 0.997 TRUE TRUE TRUE TRUE 8 1.08 TRUE TRUE TRUE TRUE 0.999 TRUE TRUE TRUE TRUE 12 1.07 TRUE TRUE TRUE TRUE 0.998 TRUE TRUE TRUE TRUE 16 1.06 TRUE TRUE TRUE TRUE 0.998 TRUE TRUE TRUE TRUE 19 1.04 TRUE TRUE TRUE TRUE 0.987 TRUE TRUE TRUE TRUE 20 1.05 TRUE TRUE TRUE TRUE 0.989 TRUE TRUE TRUE TRUE 21 1.05 TRUE TRUE TRUE TRUE 0.987 TRUE TRUE TRUE TRUE 22 1.05 TRUE TRUE TRUE TRUE 0.987 TRUE TRUE TRUE TRUE 23 1.11 TRUE TRUE TRUE TRUE 0.998 TRUE TRUE TRUE TRUE 26 1.09 TRUE TRUE TRUE TRUE 0.999 TRUE TRUE TRUE TRUE 27 1.06 TRUE TRUE TRUE TRUE 0.987 TRUE TRUE TRUE TRUE 28 1.09 TRUE TRUE TRUE TRUE 0.991 TRUE TRUE TRUE TRUE 29 1.06 TRUE TRUE TRUE TRUE 0.987 TRUE TRUE TRUE TRUE 30 1.1 TRUE TRUE TRUE TRUE 0.998 TRUE TRUE TRUE TRUE 1.11 TRUE TRUE TRUE TRUE 0.998 TRUE TRUE TRUE TRUE
OCTOBER 2007 1 1.03 TRUE TRUE TRUE TRUE 0.997 TRUE TRUE TRUE TRUE 2 1.06 TRUE TRUE TRUE TRUE 0.996 TRUE TRUE TRUE TRUE 3 1.04 TRUE TRUE TRUE TRUE 0.996 TRUE TRUE TRUE TRUE 4 1.01 TRUE TRUE TRUE TRUE 0.996 TRUE TRUE TRUE TRUE 9 1.04 TRUE TRUE TRUE TRUE 0.997 TRUE TRUE TRUE TRUE 15 1.07 TRUE TRUE TRUE TRUE 0.997 TRUE TRUE TRUE TRUE 23 1.07 TRUE TRUE TRUE TRUE 0.996 TRUE TRUE TRUE TRUE 24 1.04 TRUE TRUE TRUE TRUE 0.998 TRUE TRUE TRUE TRUE 25 1.09 TRUE TRUE TRUE TRUE 0.998 TRUE TRUE TRUE TRUE 26 1.07 TRUE TRUE TRUE TRUE 0.996 TRUE TRUE TRUE TRUE 29 1.09 TRUE TRUE TRUE TRUE 0.997 TRUE TRUE TRUE TRUE
SEPTEMBER 2007
10 1.03 TRUE TRUE TRUE TRUE 0.997 TRUE TRUE TRUE TRUE
13 1.03 TRUE TRUE TRUE TRUE 0.997 TRUE TRUE TRUE TRUE 18 1.02 TRUE TRUE TRUE TRUE 0.995 TRUE TRUE TRUE TRUE 19 1.04 TRUE TRUE TRUE TRUE 0.997 TRUE TRUE TRUE TRUE
AUGUST 2007 7 1.03 TRUE TRUE TRUE TRUE 0.987 TRUE TRUE TRUE TRUE 8 1.02 TRUE TRUE TRUE TRUE 0.994 TRUE TRUE TRUE TRUE 14 1.01 TRUE TRUE TRUE TRUE 0.996 TRUE TRUE TRUE TRUE 15 1.01 TRUE TRUE TRUE TRUE 0.994 TRUE TRUE TRUE TRUE 16 1.02 TRUE TRUE TRUE TRUE 0.996 TRUE TRUE TRUE TRUE 21 1.03 TRUE TRUE TRUE TRUE 0.997 TRUE TRUE TRUE TRUE 27 1.02 TRUE TRUE TRUE TRUE 0.995 TRUE TRUE TRUE TRUE 28 1.02 TRUE TRUE TRUE TRUE 0.996 TRUE TRUE TRUE TRUE
JULY 2007 5 1.03 TRUE TRUE TRUE TRUE 0.998 TRUE TRUE TRUE TRUE 16 1.03 TRUE TRUE TRUE TRUE 0.996 TRUE TRUE TRUE TRUE 25 1.02 TRUE TRUE TRUE TRUE 0.996 TRUE TRUE TRUE TRUE
JUNE 2007 1 1.01 TRUE TRUE TRUE TRUE 0.997 TRUE TRUE TRUE TRUE 5 1.03 TRUE TRUE TRUE TRUE 0.997 TRUE TRUE TRUE TRUE 7 1.01 TRUE TRUE TRUE TRUE 0.998 TRUE TRUE TRUE TRUE 8 1 TRUE TRUE TRUE TRUE 0.996 TRUE TRUE TRUE TRUE 12 0.96 TRUE TRUE TRUE TRUE 0.987 TRUE TRUE TRUE TRUE 13 0.97 TRUE TRUE TRUE TRUE 0.997 TRUE TRUE TRUE TRUE 14 1.06 TRUE TRUE TRUE TRUE 0.997 TRUE TRUE TRUE TRUE 20 1.02 TRUE TRUE TRUE TRUE 0.997 TRUE TRUE TRUE TRUE 23 1.02 TRUE TRUE TRUE TRUE 0.996 TRUE TRUE TRUE TRUE 27 1.04 TRUE TRUE TRUE TRUE 0.995 TRUE TRUE TRUE TRUE
MAY 2007 2 1.04 TRUE TRUE TRUE TRUE 0.988 TRUE TRUE TRUE TRUE 15 1.03 TRUE TRUE TRUE TRUE 0.991 TRUE TRUE TRUE TRUE 16 1.07 TRUE TRUE TRUE TRUE 0.99 TRUE TRUE TRUE TRUE 18 1.09 TRUE TRUE TRUE TRUE 0.999 TRUE TRUE TRUE TRUE 23 1 TRUE TRUE TRUE TRUE 0.988 TRUE TRUE TRUE TRUE 25 0.98 TRUE TRUE TRUE TRUE 0.996 TRUE TRUE TRUE TRUE 28 1.01 TRUE TRUE TRUE TRUE 0.998 TRUE TRUE TRUE TRUE
lslatkov
Text Box
254

29 1.02 TRUE TRUE TRUE TRUE 0.997 TRUE TRUE TRUE TRUE 30 1.02 TRUE TRUE TRUE TRUE 0.999 TRUE TRUE TRUE TRUE 31 1 TRUE TRUE TRUE TRUE 0.995 TRUE TRUE TRUE TRUE
APRIL 2007 10 1.06 TRUE TRUE TRUE TRUE 0.998 TRUE TRUE TRUE TRUE 11 1.06 TRUE TRUE TRUE TRUE 0.999 TRUE TRUE TRUE TRUE 13 1.08 TRUE TRUE TRUE TRUE 0.992 TRUE TRUE TRUE TRUE 16 1.07 TRUE TRUE TRUE TRUE 0.992 TRUE TRUE TRUE TRUE 17 1.08 TRUE TRUE TRUE TRUE 0.999 TRUE TRUE TRUE TRUE 18 1.07 TRUE TRUE TRUE TRUE 0.997 TRUE TRUE TRUE TRUE 23 1.19 TRUE TRUE FALSE TRUE 0.999 TRUE TRUE TRUE TRUE 24 1.09 TRUE TRUE TRUE TRUE 0.999 TRUE TRUE TRUE TRUE 25 1.04 TRUE TRUE TRUE TRUE 0.998 TRUE TRUE TRUE TRUE 26 1.06 TRUE TRUE TRUE TRUE 0.997 TRUE TRUE TRUE TRUE
MARCH 2007 5 1.08 TRUE TRUE TRUE TRUE 0.987 TRUE TRUE TRUE TRUE 7 1.07 TRUE TRUE TRUE TRUE 0.988 TRUE TRUE TRUE TRUE 9 1.03 TRUE TRUE TRUE TRUE 0.988 TRUE TRUE TRUE TRUE 11 1.03 TRUE TRUE TRUE TRUE 0.989 TRUE TRUE TRUE TRUE 13 1.02 TRUE TRUE TRUE TRUE 1 TRUE TRUE TRUE TRUE 14 1.04 TRUE TRUE TRUE TRUE 0.993 TRUE TRUE TRUE TRUE 15 1.11 TRUE TRUE TRUE TRUE 0.999 TRUE TRUE TRUE TRUE 16 1.1 TRUE TRUE TRUE TRUE 0.997 TRUE TRUE TRUE TRUE 19 1.1 TRUE TRUE TRUE TRUE 0.999 TRUE TRUE TRUE TRUE 26 1.07 TRUE TRUE TRUE TRUE 0.995 TRUE TRUE TRUE TRUE 27 1.08 TRUE TRUE TRUE TRUE 0.988 TRUE TRUE TRUE TRUE 28 1.11 TRUE TRUE TRUE TRUE 0.998 TRUE TRUE TRUE TRUE
FEBRUARY 2007 1 1.08 TRUE TRUE TRUE TRUE 0.996 TRUE TRUE TRUE TRUE 2 1.1 TRUE TRUE TRUE TRUE 1.002 TRUE TRUE TRUE TRUE 5 1.11 TRUE TRUE TRUE TRUE 1 TRUE TRUE TRUE TRUE 6 1.1 TRUE TRUE TRUE TRUE 1 TRUE TRUE TRUE TRUE 7 1.09 TRUE TRUE TRUE TRUE 0.999 TRUE TRUE TRUE TRUE 8 1.11 TRUE TRUE TRUE TRUE 1.001 TRUE TRUE TRUE TRUE 12 1.07 TRUE TRUE TRUE TRUE 1.001 TRUE TRUE TRUE TRUE 14 1.08 TRUE TRUE TRUE TRUE 1 TRUE TRUE TRUE TRUE 15 1.1 TRUE TRUE TRUE TRUE 1 TRUE TRUE TRUE TRUE 20 1.05 TRUE TRUE TRUE TRUE 0.988 TRUE TRUE TRUE TRUE 21 1.07 TRUE TRUE TRUE TRUE 1.001 TRUE TRUE TRUE TRUE 22 1.09 TRUE TRUE TRUE TRUE 0.999 TRUE TRUE TRUE TRUE 26 1.07 TRUE TRUE TRUE TRUE 0.988 TRUE TRUE TRUE TRUE 27 1.07 TRUE TRUE TRUE TRUE 0.987 TRUE TRUE TRUE TRUE 28 1.09 TRUE TRUE TRUE TRUE 0.999 TRUE TRUE TRUE TRUE
JANUARY 2007 2 1.06 TRUE TRUE TRUE TRUE 0.997 TRUE TRUE TRUE TRUE 4 1.08 TRUE TRUE TRUE TRUE 1.001 TRUE TRUE TRUE TRUE 5 1.08 TRUE TRUE TRUE TRUE 0.999 TRUE TRUE TRUE TRUE 9 1.09 TRUE TRUE TRUE TRUE 0.998 TRUE TRUE TRUE TRUE 10 1.07 TRUE TRUE TRUE TRUE 1.002 TRUE TRUE TRUE TRUE 11 1.06 TRUE TRUE TRUE TRUE 1.001 TRUE TRUE TRUE TRUE 12 1.08 TRUE TRUE TRUE TRUE 1 TRUE TRUE TRUE TRUE 13 1.04 TRUE TRUE TRUE TRUE 0.989 TRUE TRUE TRUE TRUE 19 1.06 TRUE TRUE TRUE TRUE 0.999 TRUE TRUE TRUE TRUE 22 1.04 TRUE TRUE TRUE TRUE 1 TRUE TRUE TRUE TRUE 23 1.08 TRUE TRUE TRUE TRUE 1.002 TRUE TRUE TRUE TRUE 24 1.07 TRUE TRUE TRUE TRUE 0.987 TRUE TRUE TRUE TRUE 26 1.11 TRUE TRUE TRUE TRUE 1.004 TRUE TRUE TRUE TRUE 31 1.08 TRUE TRUE TRUE TRUE 0.998 TRUE TRUE TRUE TRUE
DECEMBER 2006
1 1.08 TRUE TRUE TRUE TRUE 1.002 TRUE TRUE TRUE TRUE
5 1.05 TRUE TRUE TRUE TRUE 0.989 TRUE TRUE TRUE TRUE 6 1.07 TRUE TRUE TRUE TRUE 1.002 TRUE TRUE TRUE TRUE 7 1.09 TRUE TRUE TRUE TRUE 1.002 TRUE TRUE TRUE TRUE 8 1.08 TRUE TRUE TRUE TRUE 0.988 TRUE TRUE TRUE TRUE 11 1.06 TRUE TRUE TRUE TRUE 0.987 TRUE TRUE TRUE TRUE 14 1.02 TRUE TRUE TRUE TRUE 0.988 TRUE TRUE TRUE TRUE
lslatkov
Text Box
255

15 1.06 TRUE TRUE TRUE TRUE 0.999 TRUE TRUE TRUE TRUE 18 1.05 TRUE TRUE TRUE TRUE 1.002 TRUE TRUE TRUE TRUE 19 1.04 TRUE TRUE TRUE TRUE 0.988 TRUE TRUE TRUE TRUE 20 1.07 TRUE TRUE TRUE TRUE 0.987 TRUE TRUE TRUE TRUE 21 1.08 TRUE TRUE TRUE TRUE 0.988 TRUE TRUE TRUE TRUE
NOVEMBER 2006
8 1.03 TRUE TRUE TRUE TRUE 0.988 TRUE TRUE TRUE TRUE
13 1.02 TRUE TRUE TRUE TRUE 0.987 TRUE TRUE TRUE TRUE 14 1.05 TRUE TRUE TRUE TRUE 0.987 TRUE TRUE TRUE TRUE 15 1.05 TRUE TRUE TRUE TRUE 0.99 TRUE TRUE TRUE TRUE 16 1.02 TRUE TRUE TRUE TRUE 0.989 TRUE TRUE TRUE TRUE 17 1.02 TRUE TRUE TRUE TRUE 0.987 TRUE TRUE TRUE TRUE 20 1.03 TRUE TRUE TRUE TRUE 1.001 TRUE TRUE TRUE TRUE 21 1.05 TRUE TRUE TRUE TRUE 1.001 TRUE TRUE TRUE TRUE 22 1 TRUE TRUE TRUE TRUE 0.987 TRUE TRUE TRUE TRUE 23 1.01 TRUE TRUE TRUE TRUE 0.989 TRUE TRUE TRUE TRUE 24 1.06 TRUE TRUE TRUE TRUE 0.987 TRUE TRUE TRUE TRUE 27 1.02 TRUE TRUE TRUE TRUE 0.988 TRUE TRUE TRUE TRUE 28 1.02 TRUE TRUE TRUE TRUE 0.987 TRUE TRUE TRUE TRUE 29 1.06 TRUE TRUE TRUE TRUE 1.001 TRUE TRUE TRUE TRUE 30 1.01 TRUE TRUE TRUE TRUE 0.999 TRUE TRUE TRUE TRUE MEAN 1.09 (~0.93‐1.07) 0.995 (~0.993‐1.007) SD 0.06 (~0.05) 0.009 (~0.005)
lslatkov
Text Box
256

257
CHAPTER THREE: ADDITIONAL RESULTS

Chapter 3 appendix table 1: Summary of missing or compromised QUS outcomes MISSING/COMPROMISED REASON PARTICIPANTS
MISSING PARTICIPANTS (#)
90Hz 30Hz CON Drop‐outs 2 3 2 021, 065, 100, 111, 140, 158, 163 HRT during study 1 1 053, 116 Not evaluable QUS scans Uncalibrated 3 1 3 004, 034, 149, 150, 160, 177, 186 Invalid measurement 4 3 030, 032, 036, 059, 084, 092, 147 Unattained final scan 3 1 078, 096, 104, 115 Suspected compromised study conduct
Improper WBV use 3 4 031, 046, 059, 129, 132, 134, 181
Unknown adherence 3 1 152, 163, 175, 177 Potentially compromised bone
metabolism during study 2 3 040, 058, 099, 103, 161
Late final visit (>3 months) 1 1 2 116, 117, 124, 125 Unknown WBV adherence Unreturned platform 1 163 Digital clock malfunction 3 152, 175, 177 Vitamin D – no recent medical record
5 4 6 003, 042, 053, 086, 092, 097, 104, 115, 117, 119, 120, 145, 151, 153, 196
Abbreviations: 90Hz, 90 Hz WBV group; 30Hz, 30 Hz WBV group; CON, control group. Chapter 3 appendix table 2: ANCOVA analyses summary
Adjusted least‐mean squares for BUA change (dB∙MHz‐1)*
Adjusted comparisons (p)
Adjusted variable n 90Hz
30Hz CON 90Hz x 30Hz x CON
90Hz x CON
30Hz x CON
90Hz + 30Hz x CON
Baseline physical activity level 175 ‐0.4 ‐0.7 1.3 0.126 0.115 0.056 0.045
Vitamin D level 164 ‐0.6 ‐0.9 1.2 0.100 0.083 0.048 0.033
Abbreviations: 90Hz, 90 Hz WBV group; 30Hz, 30 Hz WBV group; CON, control group. *Unadjusted per‐protocol means (n=175): 90Hz, ‐0.4 dB∙MHz‐1; 30Hz, ‐0.7 dB∙MHz‐1; CON, 1.3 dB∙MHz‐1 Chapter 3 appendix table 3: Sensitivity analyses
Absolute change in BUA (dB∙MHz‐1), mean (SD)
Main comparison
(p)
Significant contrasts (p)
N 90Hz
30Hz CON 90Hz x CON
30Hz x CON
90Hz + 30Hz x CON
Excluded due to compromised study conduct
159 ‐0.5 (6.0)
‐1.0 (6.3)
1.4 (5.0)
0.083 ‐ 0.034 0.029
ITT ‐ single imputation based on population mean
202 ‐0.3 (5.5)
‐0.6 (5.7)
1.1 (4.5)
0.108 ‐ 0.047 0.038
CON upper outlier excluded from per‐protocol2
174 ‐0.4 (5.9)
‐0.7 (4.7)
1.1 (4.5)
0.173 ‐ ‐ ‐
CON upper outlier excluded from adherence (duration) ≥80%2
112 ‐1.3 (4.5)
‐0.7 (4.7)
1.1 (4.5)
0.052 0.026 ‐ 0.018
BUA change outliers removed from per‐protocol analysis
167 ‐0.9 (4.2)
‐0.4 (5.0)
1.1 (4.5)
0.056 0.021 ‐ 0.020
Included compromised BUA measurements2
188 ‐0.7 (6.3)
‐1.2 (6.6)
1.1 (4.7)
0.078 ‐ 0.030 0.028
Excluded QC BUA outside of range3 152 ‐0.9 (5.4)
‐1.3 (6.2)
1.3 (4.7)
0.037 0.039 0.018 0.011
Abbreviations: 90Hz, 90 Hz WBV group; 30Hz, 30 Hz WBV group; CON, control group. 1CON upper outlier: Participant 052 was the only outlier for BUA change in the CON group (75yo, 21y PM, 55 kg, vitamin D 111 nmol/L, no significant change in exercise) 2Uncalibratied and invalid BUA measurements and fractured participant with ankle swelling. 3See Technical Appendix: QUS QC calibration log for those who were indicated as false (i.e., outside of BUA QC range; July 2009 to October 2009)
Luba
Typewritten Text
258