International research in preventing and treating infertility
Exercise for preventing and treating osteoporosis in
postmenopausal women (Review)
Howe TE, Shea B, Dawson LJ, Downie F, Murray A, Ross C, Harbour RT, Caldwell LM,
Creed G
This is a reprint of a Cochrane review, prepared and maintained by The Cochrane Collaboration and published in The Cochrane Library2011, Issue 7
http://www.thecochranelibrary.com
Exercise for preventing and treating osteoporosis in postmenopausal women (Review)
Copyright © 2011 The Cochrane Collaboration. Published by John Wiley & Sons, Ltd.
T A B L E O F C O N T E N T S
1HEADER . . . . . . . . . . . . . . . . . . . . . . . . . . . . . . . . . . . . . . .
1ABSTRACT . . . . . . . . . . . . . . . . . . . . . . . . . . . . . . . . . . . . . .
2PLAIN LANGUAGE SUMMARY . . . . . . . . . . . . . . . . . . . . . . . . . . . . . .
3SUMMARY OF FINDINGS FOR THE MAIN COMPARISON . . . . . . . . . . . . . . . . . . .
6BACKGROUND . . . . . . . . . . . . . . . . . . . . . . . . . . . . . . . . . . . .
6OBJECTIVES . . . . . . . . . . . . . . . . . . . . . . . . . . . . . . . . . . . . .
6METHODS . . . . . . . . . . . . . . . . . . . . . . . . . . . . . . . . . . . . . .
9RESULTS . . . . . . . . . . . . . . . . . . . . . . . . . . . . . . . . . . . . . . .
Figure 1. . . . . . . . . . . . . . . . . . . . . . . . . . . . . . . . . . . . . . 12
Figure 2. . . . . . . . . . . . . . . . . . . . . . . . . . . . . . . . . . . . . . 14
Figure 3. . . . . . . . . . . . . . . . . . . . . . . . . . . . . . . . . . . . . . 15
18DISCUSSION . . . . . . . . . . . . . . . . . . . . . . . . . . . . . . . . . . . . .
19AUTHORS’ CONCLUSIONS . . . . . . . . . . . . . . . . . . . . . . . . . . . . . . .
19ACKNOWLEDGEMENTS . . . . . . . . . . . . . . . . . . . . . . . . . . . . . . . .
20REFERENCES . . . . . . . . . . . . . . . . . . . . . . . . . . . . . . . . . . . . .
26CHARACTERISTICS OF STUDIES . . . . . . . . . . . . . . . . . . . . . . . . . . . . .
88DATA AND ANALYSES . . . . . . . . . . . . . . . . . . . . . . . . . . . . . . . . . .
Analysis 1.1. Comparison 1 Any exercise versus control, Outcome 1 Total number of fractures. . . . . . . . . 95
Analysis 1.2. Comparison 1 Any exercise versus control, Outcome 2 Bone mineral density % change: spine. . . . 96
Analysis 1.3. Comparison 1 Any exercise versus control, Outcome 3 Bone mineral density % change: femoral neck. . 97
Analysis 1.4. Comparison 1 Any exercise versus control, Outcome 4 Bone mineral density % change: Ward’s triangle. 98
Analysis 1.5. Comparison 1 Any exercise versus control, Outcome 5 Bone mineral density % change: hip. . . . . 99
Analysis 1.6. Comparison 1 Any exercise versus control, Outcome 6 Bone mineral density % change: trochanter. . . 100
Analysis 1.7. Comparison 1 Any exercise versus control, Outcome 7 Bone mineral content % change: spine. . . . 101
Analysis 1.8. Comparison 1 Any exercise versus control, Outcome 8 Bone mineral content % change: femoral neck. . 102
Analysis 2.1. Comparison 2 Static weight bearing exercise versus control, Outcome 1 Bone mineral density % change:
hip. . . . . . . . . . . . . . . . . . . . . . . . . . . . . . . . . . . . . . 102
Analysis 3.1. Comparison 3 Dynamic weight bearing exercise low force versus control, Outcome 1 Bone mineral density %
change: spine. . . . . . . . . . . . . . . . . . . . . . . . . . . . . . . . . . . 103
Analysis 3.2. Comparison 3 Dynamic weight bearing exercise low force versus control, Outcome 2 Bone mineral density %
change: femoral neck. . . . . . . . . . . . . . . . . . . . . . . . . . . . . . . . 104
Analysis 3.3. Comparison 3 Dynamic weight bearing exercise low force versus control, Outcome 3 Bone mineral density %
change: trochanter. . . . . . . . . . . . . . . . . . . . . . . . . . . . . . . . . 104
Analysis 3.4. Comparison 3 Dynamic weight bearing exercise low force versus control, Outcome 4 Bone mineral density %
change: Ward’s triangle. . . . . . . . . . . . . . . . . . . . . . . . . . . . . . . 105
Analysis 3.5. Comparison 3 Dynamic weight bearing exercise low force versus control, Outcome 5 Bone mineral density %
change: wrist. . . . . . . . . . . . . . . . . . . . . . . . . . . . . . . . . . . 105
Analysis 3.6. Comparison 3 Dynamic weight bearing exercise low force versus control, Outcome 6 Bone mineral density
mean regression slope % change: wrist. . . . . . . . . . . . . . . . . . . . . . . . . . 106
Analysis 3.7. Comparison 3 Dynamic weight bearing exercise low force versus control, Outcome 7 Fractures. . . . 107
Analysis 4.1. Comparison 4 Dynamic weight bearing exercise high force versus control, Outcome 1 Bone mineral density
% change: spine. . . . . . . . . . . . . . . . . . . . . . . . . . . . . . . . . . 108
Analysis 4.2. Comparison 4 Dynamic weight bearing exercise high force versus control, Outcome 2 Bone mineral density
% change: hip. . . . . . . . . . . . . . . . . . . . . . . . . . . . . . . . . . 109
Analysis 4.3. Comparison 4 Dynamic weight bearing exercise high force versus control, Outcome 3 Bone mineral density
% change: mid femur. . . . . . . . . . . . . . . . . . . . . . . . . . . . . . . . 109
Analysis 4.4. Comparison 4 Dynamic weight bearing exercise high force versus control, Outcome 4 Bone mineral density
% change: proximal tibia. . . . . . . . . . . . . . . . . . . . . . . . . . . . . . . 110
Analysis 4.5. Comparison 4 Dynamic weight bearing exercise high force versus control, Outcome 5 Calcium bone index %
change: trunk and upper thighs. . . . . . . . . . . . . . . . . . . . . . . . . . . . 110
iExercise for preventing and treating osteoporosis in postmenopausal women (Review)
Copyright © 2011 The Cochrane Collaboration. Published by John Wiley & Sons, Ltd.
Analysis 4.6. Comparison 4 Dynamic weight bearing exercise high force versus control, Outcome 6 Bone mineral density
% change: trochanter. . . . . . . . . . . . . . . . . . . . . . . . . . . . . . . . 111
Analysis 4.7. Comparison 4 Dynamic weight bearing exercise high force versus control, Outcome 7 Bone mineral density
% change: femoral neck. . . . . . . . . . . . . . . . . . . . . . . . . . . . . . . 111
Analysis 4.8. Comparison 4 Dynamic weight bearing exercise high force versus control, Outcome 8 Bone mineral content
% change: spine. . . . . . . . . . . . . . . . . . . . . . . . . . . . . . . . . . 112
Analysis 4.9. Comparison 4 Dynamic weight bearing exercise high force versus control, Outcome 9 Bone mineral content
% change: femoral neck. . . . . . . . . . . . . . . . . . . . . . . . . . . . . . . 113
Analysis 4.10. Comparison 4 Dynamic weight bearing exercise high force versus control, Outcome 10 Bone mineral
content % change: wrist. . . . . . . . . . . . . . . . . . . . . . . . . . . . . . . 114
Analysis 4.11. Comparison 4 Dynamic weight bearing exercise high force versus control, Outcome 11 Bone mineral
content % change: ankle. . . . . . . . . . . . . . . . . . . . . . . . . . . . . . . 114
Analysis 4.12. Comparison 4 Dynamic weight bearing exercise high force versus control, Outcome 12 Bone mineral
content % change: tibia. . . . . . . . . . . . . . . . . . . . . . . . . . . . . . . 115
Analysis 4.13. Comparison 4 Dynamic weight bearing exercise high force versus control, Outcome 13 Bone mineral density
% change: total body. . . . . . . . . . . . . . . . . . . . . . . . . . . . . . . . 115
Analysis 4.14. Comparison 4 Dynamic weight bearing exercise high force versus control, Outcome 14 Volumetric bone
density % change: tibial trabecular. . . . . . . . . . . . . . . . . . . . . . . . . . . 116
Analysis 4.15. Comparison 4 Dynamic weight bearing exercise high force versus control, Outcome 15 Volumetric bone
density % change: tibial cortical. . . . . . . . . . . . . . . . . . . . . . . . . . . . 116
Analysis 4.16. Comparison 4 Dynamic weight bearing exercise high force versus control, Outcome 16 Fractures. . . 117
Analysis 5.1. Comparison 5 Non-weight bearing exercise low force versus control, Outcome 1 Bone mineral density %
change: spine. . . . . . . . . . . . . . . . . . . . . . . . . . . . . . . . . . . 117
Analysis 5.2. Comparison 5 Non-weight bearing exercise low force versus control, Outcome 2 Bone mineral density %
change: total hip. . . . . . . . . . . . . . . . . . . . . . . . . . . . . . . . . 118
Analysis 5.3. Comparison 5 Non-weight bearing exercise low force versus control, Outcome 3 Bone mineral density %
change: femoral neck. . . . . . . . . . . . . . . . . . . . . . . . . . . . . . . . 119
Analysis 5.4. Comparison 5 Non-weight bearing exercise low force versus control, Outcome 4 Bone mineral density %
change: Ward’s triangle. . . . . . . . . . . . . . . . . . . . . . . . . . . . . . . 119
Analysis 5.5. Comparison 5 Non-weight bearing exercise low force versus control, Outcome 5 Bone mineral density %
change: trochanter. . . . . . . . . . . . . . . . . . . . . . . . . . . . . . . . . 120
Analysis 5.6. Comparison 5 Non-weight bearing exercise low force versus control, Outcome 6 Bone mineral density %
change: total body. . . . . . . . . . . . . . . . . . . . . . . . . . . . . . . . . 120
Analysis 6.1. Comparison 6 Non-weight bearing exercise high force versus control, Outcome 1 Bone mineral density %
change: spine. . . . . . . . . . . . . . . . . . . . . . . . . . . . . . . . . . . 121
Analysis 6.2. Comparison 6 Non-weight bearing exercise high force versus control, Outcome 2 Bone mineral density %
change: total hip. . . . . . . . . . . . . . . . . . . . . . . . . . . . . . . . . 122
Analysis 6.3. Comparison 6 Non-weight bearing exercise high force versus control, Outcome 3 Bone mineral density %
change: femoral neck. . . . . . . . . . . . . . . . . . . . . . . . . . . . . . . . 123
Analysis 6.4. Comparison 6 Non-weight bearing exercise high force versus control, Outcome 4 Bone mineral density %
change: Ward’s triangle. . . . . . . . . . . . . . . . . . . . . . . . . . . . . . . 124
Analysis 6.5. Comparison 6 Non-weight bearing exercise high force versus control, Outcome 5 Bone mineral density %
change: trochanter. . . . . . . . . . . . . . . . . . . . . . . . . . . . . . . . . 125
Analysis 6.6. Comparison 6 Non-weight bearing exercise high force versus control, Outcome 6 Bone mineral density %
change: total body. . . . . . . . . . . . . . . . . . . . . . . . . . . . . . . . . 125
Analysis 7.1. Comparison 7 Combination versus control, Outcome 1 Bone mineral density % change: spine. . . . 126
Analysis 7.2. Comparison 7 Combination versus control, Outcome 2 Bone mineral density % change: total hip. . . 127
Analysis 7.3. Comparison 7 Combination versus control, Outcome 3 Bone mineral density % change: trochanter. . 128
Analysis 7.4. Comparison 7 Combination versus control, Outcome 4 Bone mineral density % change: total body. . 129
Analysis 7.5. Comparison 7 Combination versus control, Outcome 5 Calcium bone index % change: trunk and upper
thighs. . . . . . . . . . . . . . . . . . . . . . . . . . . . . . . . . . . . . 129
Analysis 7.6. Comparison 7 Combination versus control, Outcome 6 Bone mineral density % change: neck of femur. 130
Analysis 7.7. Comparison 7 Combination versus control, Outcome 7 Bone mineral density % change: Ward’s triangle. 131
iiExercise for preventing and treating osteoporosis in postmenopausal women (Review)
Copyright © 2011 The Cochrane Collaboration. Published by John Wiley & Sons, Ltd.
Analysis 7.8. Comparison 7 Combination versus control, Outcome 8 Bone mineral density % change: arms. . . . 132
Analysis 7.9. Comparison 7 Combination versus control, Outcome 9 Fractures. . . . . . . . . . . . . . 132
Analysis 8.1. Comparison 8 Dynamic weight bearing exercise high force plus HRT versus HRT, Outcome 1 Bone mineral
density % change: proximal tibia. . . . . . . . . . . . . . . . . . . . . . . . . . . . 133
Analysis 8.2. Comparison 8 Dynamic weight bearing exercise high force plus HRT versus HRT, Outcome 2 Bone mineral
density % change: hip. . . . . . . . . . . . . . . . . . . . . . . . . . . . . . . . 133
Analysis 8.3. Comparison 8 Dynamic weight bearing exercise high force plus HRT versus HRT, Outcome 3 Bone mineral
density % change: mid femur. . . . . . . . . . . . . . . . . . . . . . . . . . . . . 134
Analysis 8.4. Comparison 8 Dynamic weight bearing exercise high force plus HRT versus HRT, Outcome 4 Bone mineral
density % change: spine. . . . . . . . . . . . . . . . . . . . . . . . . . . . . . . 134
Analysis 8.5. Comparison 8 Dynamic weight bearing exercise high force plus HRT versus HRT, Outcome 5 Bone mineral
density % change: trochanter. . . . . . . . . . . . . . . . . . . . . . . . . . . . . 135
Analysis 8.6. Comparison 8 Dynamic weight bearing exercise high force plus HRT versus HRT, Outcome 6 Bone mineral
density % change: femoral neck. . . . . . . . . . . . . . . . . . . . . . . . . . . . 135
Analysis 8.7. Comparison 8 Dynamic weight bearing exercise high force plus HRT versus HRT, Outcome 7 Bone mineral
density % change: total body. . . . . . . . . . . . . . . . . . . . . . . . . . . . . 136
Analysis 9.1. Comparison 9 Non-weight bearing exercise high force plus bisphosphonates versus bisphosphonates, Outcome
1 Bone mineral density % change: spine. . . . . . . . . . . . . . . . . . . . . . . . . 136
Analysis 9.2. Comparison 9 Non-weight bearing exercise high force plus bisphosphonates versus bisphosphonates, Outcome
2 Bone mineral density % change: hip. . . . . . . . . . . . . . . . . . . . . . . . . . 137
Analysis 9.3. Comparison 9 Non-weight bearing exercise high force plus bisphosphonates versus bisphosphonates, Outcome
3 Bone mineral density % change: femoral neck. . . . . . . . . . . . . . . . . . . . . . . 137
Analysis 9.4. Comparison 9 Non-weight bearing exercise high force plus bisphosphonates versus bisphosphonates, Outcome
4 Bone mineral density % change: trochanter. . . . . . . . . . . . . . . . . . . . . . . . 138
Analysis 9.5. Comparison 9 Non-weight bearing exercise high force plus bisphosphonates versus bisphosphonates, Outcome
5 Bone mineral density % change: Ward’s triangle. . . . . . . . . . . . . . . . . . . . . . 138
Analysis 9.6. Comparison 9 Non-weight bearing exercise high force plus bisphosphonates versus bisphosphonates, Outcome
6 Bone mineral density % change: total body. . . . . . . . . . . . . . . . . . . . . . . . 139
Analysis 9.7. Comparison 9 Non-weight bearing exercise high force plus bisphosphonates versus bisphosphonates, Outcome
7 Bone mineral content % change: total body. . . . . . . . . . . . . . . . . . . . . . . 139
Analysis 10.1. Comparison 10 Dynamic weight bearing exercise high force plus bisphosphonates versus bisphosphonates,
Outcome 1 Bone mineral content % change: spine. . . . . . . . . . . . . . . . . . . . . . 140
Analysis 10.2. Comparison 10 Dynamic weight bearing exercise high force plus bisphosphonates versus bisphosphonates,
Outcome 2 Bone mineral content % change: femoral neck. . . . . . . . . . . . . . . . . . . 141
Analysis 10.3. Comparison 10 Dynamic weight bearing exercise high force plus bisphosphonates versus bisphosphonates,
Outcome 3 Bone mineral content % change: wrist. . . . . . . . . . . . . . . . . . . . . . 142
Analysis 10.4. Comparison 10 Dynamic weight bearing exercise high force plus bisphosphonates versus bisphosphonates,
Outcome 4 Bone mineral content % change: distal tibia. . . . . . . . . . . . . . . . . . . . 142
Analysis 10.5. Comparison 10 Dynamic weight bearing exercise high force plus bisphosphonates versus bisphosphonates,
Outcome 5 Bone mineral content % change: tibial shaft. . . . . . . . . . . . . . . . . . . . 143
Analysis 11.1. Comparison 11 Non-weight bearing exercise high force plus antioxidants versus antioxidants, Outcome 1
Bone mineral density % change: spine. . . . . . . . . . . . . . . . . . . . . . . . . . 143
Analysis 11.2. Comparison 11 Non-weight bearing exercise high force plus antioxidants versus antioxidants, Outcome 2
Bone mineral density % change: femoral neck. . . . . . . . . . . . . . . . . . . . . . . 144
Analysis 12.1. Comparison 12 Dynamic weight bearing exercise low force plus Ca2+ versus Ca2+, Outcome 1 Bone mineral
density % change: femoral neck. . . . . . . . . . . . . . . . . . . . . . . . . . . . 144
Analysis 12.2. Comparison 12 Dynamic weight bearing exercise low force plus Ca2+ versus Ca2+, Outcome 2 Bone mineral
density % change: spine. . . . . . . . . . . . . . . . . . . . . . . . . . . . . . . 145
Analysis 12.3. Comparison 12 Dynamic weight bearing exercise low force plus Ca2+ versus Ca2+, Outcome 3 Bone mineral
density % change: trochanter. . . . . . . . . . . . . . . . . . . . . . . . . . . . . 145
Analysis 12.4. Comparison 12 Dynamic weight bearing exercise low force plus Ca2+ versus Ca2+, Outcome 4 Bone mineral
density % change: distal tibia. . . . . . . . . . . . . . . . . . . . . . . . . . . . . 146
iiiExercise for preventing and treating osteoporosis in postmenopausal women (Review)
Copyright © 2011 The Cochrane Collaboration. Published by John Wiley & Sons, Ltd.
Analysis 12.5. Comparison 12 Dynamic weight bearing exercise low force plus Ca2+ versus Ca2+, Outcome 5 Bone mineral
density % change: Ward’s triangle. . . . . . . . . . . . . . . . . . . . . . . . . . . . 146
Analysis 13.1. Comparison 13 Non-weight bearing exercise low force plus calcium versus calcium, Outcome 1 Bone
mineral density % change: spine. . . . . . . . . . . . . . . . . . . . . . . . . . . . 147
Analysis 13.2. Comparison 13 Non-weight bearing exercise low force plus calcium versus calcium, Outcome 2 Bone
mineral density % change: total hip. . . . . . . . . . . . . . . . . . . . . . . . . . . 147
Analysis 13.3. Comparison 13 Non-weight bearing exercise low force plus calcium versus calcium, Outcome 3 Bone
mineral density % change: femoral neck. . . . . . . . . . . . . . . . . . . . . . . . . 148
Analysis 13.4. Comparison 13 Non-weight bearing exercise low force plus calcium versus calcium, Outcome 4 Bone
mineral density % change: trochanter. . . . . . . . . . . . . . . . . . . . . . . . . . 148
Analysis 13.5. Comparison 13 Non-weight bearing exercise low force plus calcium versus calcium, Outcome 5 Bone
mineral density % change: total body. . . . . . . . . . . . . . . . . . . . . . . . . . 149
Analysis 14.1. Comparison 14 Non-weight bearing exercise high force plus calcium versus calcium, Outcome 1 Bone
mineral density % change: femoral neck. . . . . . . . . . . . . . . . . . . . . . . . . 149
Analysis 14.2. Comparison 14 Non-weight bearing exercise high force plus calcium versus calcium, Outcome 2 Bone
mineral density % change: trochanter. . . . . . . . . . . . . . . . . . . . . . . . . . 150
Analysis 14.3. Comparison 14 Non-weight bearing exercise high force plus calcium versus calcium, Outcome 3 Bone
mineral density % change: total hip. . . . . . . . . . . . . . . . . . . . . . . . . . . 150
Analysis 14.4. Comparison 14 Non-weight bearing exercise high force plus calcium versus calcium, Outcome 4 Bone
mineral density % change: spine. . . . . . . . . . . . . . . . . . . . . . . . . . . . 151
Analysis 14.5. Comparison 14 Non-weight bearing exercise high force plus calcium versus calcium, Outcome 5 Bone
mineral density % change: total body. . . . . . . . . . . . . . . . . . . . . . . . . . 151
Analysis 15.1. Comparison 15 Dynamic weight bearing exercise low force plus calcium/VitD versus calcium/VitD,
Outcome 1 Bone mineral density % change: spine. . . . . . . . . . . . . . . . . . . . . . 152
Analysis 15.2. Comparison 15 Dynamic weight bearing exercise low force plus calcium/VitD versus calcium/VitD,
Outcome 2 Bone mineral density % change:wrist. . . . . . . . . . . . . . . . . . . . . . 152
152APPENDICES . . . . . . . . . . . . . . . . . . . . . . . . . . . . . . . . . . . . .
158WHAT’S NEW . . . . . . . . . . . . . . . . . . . . . . . . . . . . . . . . . . . . .
158HISTORY . . . . . . . . . . . . . . . . . . . . . . . . . . . . . . . . . . . . . . .
159CONTRIBUTIONS OF AUTHORS . . . . . . . . . . . . . . . . . . . . . . . . . . . . .
159DECLARATIONS OF INTEREST . . . . . . . . . . . . . . . . . . . . . . . . . . . . . .
159SOURCES OF SUPPORT . . . . . . . . . . . . . . . . . . . . . . . . . . . . . . . . .
160INDEX TERMS . . . . . . . . . . . . . . . . . . . . . . . . . . . . . . . . . . . .
ivExercise for preventing and treating osteoporosis in postmenopausal women (Review)
Copyright © 2011 The Cochrane Collaboration. Published by John Wiley & Sons, Ltd.
[Intervention Review]
Exercise for preventing and treating osteoporosis inpostmenopausal women
Tracey E Howe1, Beverley Shea2, Lesley J Dawson3 , Fiona Downie3 , Ann Murray4, Craig Ross5, Robin T Harbour6 , Lynn M Caldwell7, Gisela Creed8
1School of Health & Life Sciences, Glasgow Caledonian University, Glasgow, UK. 2CIET, Institute of Population Health, University
of Ottawa, Ottawa, Canada. 3Department of Physiotherapy, NHS Forth Valley, Stirling, UK. 4NHS Ayrshire and Arran, Kilmarnock,
UK. 5Physiotherapy Service for Osteoporosis, NHS Greater Glasgow & Clyde, Glasgow, UK. 6Scottish Intercollegiate Guidelines
network (SIGN), Edinburgh, UK. 7Knowledge Services Group, NHS Education for Scotland, Glasgow, UK. 8Academic Department
of Geriatric Medicine, Glasgow University, Glasgow, UK
Contact address: Tracey E Howe, School of Health & Life Sciences, Glasgow Caledonian University, Scottish Centre for Evidence
Based Care of Older People, Glasgow, Scotland, G4 0BA, UK. [email protected].
Editorial group: Cochrane Musculoskeletal Group.
Publication status and date: New search for studies and content updated (conclusions changed), published in Issue 7, 2011.
Review content assessed as up-to-date: 2 January 2011.
Citation: Howe TE, Shea B, Dawson LJ, Downie F, Murray A, Ross C, Harbour RT, Caldwell LM, Creed G. Exercise for preventing
and treating osteoporosis in postmenopausal women. Cochrane Database of Systematic Reviews 2011, Issue 7. Art. No.: CD000333.
DOI: 10.1002/14651858.CD000333.pub2.
Copyright © 2011 The Cochrane Collaboration. Published by John Wiley & Sons, Ltd.
A B S T R A C T
Background
Osteoporosis is a condition resulting in an increased risk of skeletal fractures due to a reduction in the density of bone tissue. Treatment
of osteoporosis typically involves the use of pharmacological agents. In general it is thought that disuse (prolonged periods of inactivity)
and unloading of the skeleton promotes reduced bone mass, whereas mechanical loading through exercise increases bone mass.
Objectives
To examine the effectiveness of exercise interventions in preventing bone loss and fractures in postmenopausal women.
Search methods
During the update of this review we updated the original search strategy by searching up to December 2010 the following electronic
databases: the Cochrane Musculoskeletal Group’s Trials Register; the Cochrane Central Register of Controlled Trials (CENTRAL) (TheCochrane Library, 2010 Issue 12); MEDLINE; EMBASE; HealthSTAR; Sports Discus; CINAHL; PEDro; Web of Science; Controlled
Clinical Trials; and AMED. We attempted to identify other studies by contacting experts, searching reference lists and searching trial
registers.
Selection criteria
All randomised controlled trials (RCTs) that met our predetermined inclusion criteria.
Data collection and analysis
Pairs of members of the review team extracted the data and assessed trial quality using predetermined forms. For dichotomous outcomes
(fractures), we calculated risk ratios (RRs) using a fixed-effect model. For continuous data, we calculated mean differences (MDs) of
the percentage change from baseline. Where heterogeneity existed (determined by the I2 statistic), we used a random-effects model.
1Exercise for preventing and treating osteoporosis in postmenopausal women (Review)
Copyright © 2011 The Cochrane Collaboration. Published by John Wiley & Sons, Ltd.
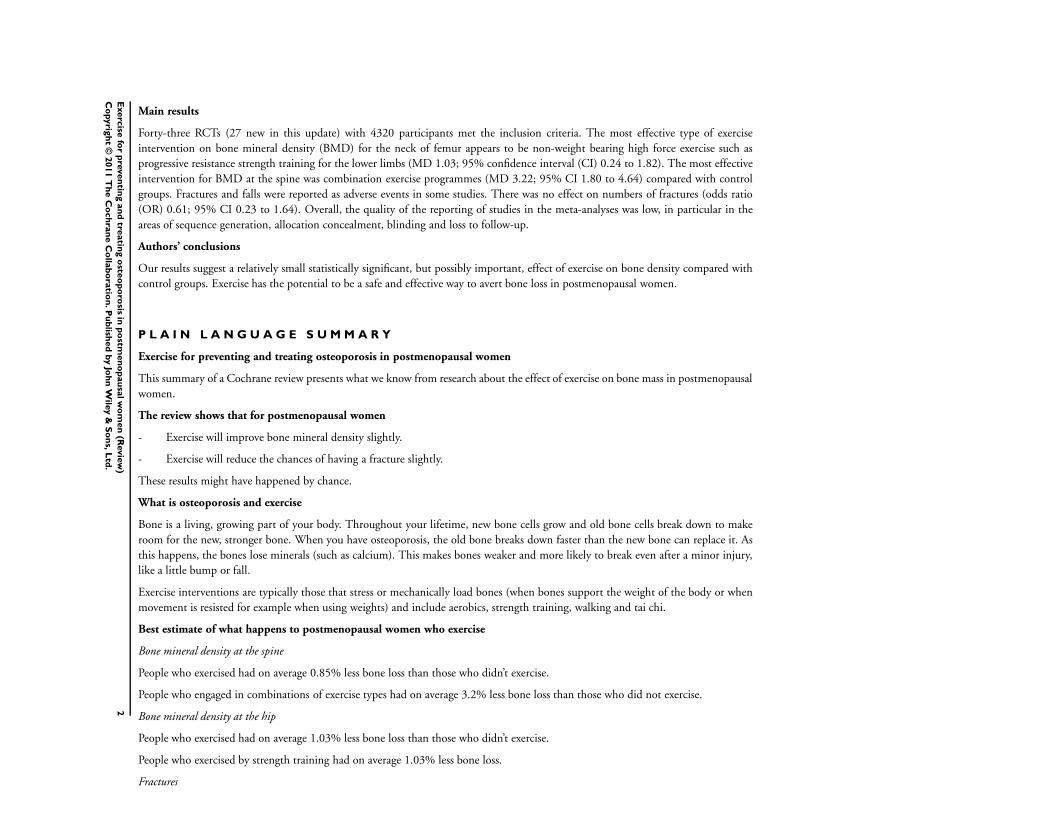
Main results
Forty-three RCTs (27 new in this update) with 4320 participants met the inclusion criteria. The most effective type of exercise
intervention on bone mineral density (BMD) for the neck of femur appears to be non-weight bearing high force exercise such as
progressive resistance strength training for the lower limbs (MD 1.03; 95% confidence interval (CI) 0.24 to 1.82). The most effective
intervention for BMD at the spine was combination exercise programmes (MD 3.22; 95% CI 1.80 to 4.64) compared with control
groups. Fractures and falls were reported as adverse events in some studies. There was no effect on numbers of fractures (odds ratio
(OR) 0.61; 95% CI 0.23 to 1.64). Overall, the quality of the reporting of studies in the meta-analyses was low, in particular in the
areas of sequence generation, allocation concealment, blinding and loss to follow-up.
Authors’ conclusions
Our results suggest a relatively small statistically significant, but possibly important, effect of exercise on bone density compared with
control groups. Exercise has the potential to be a safe and effective way to avert bone loss in postmenopausal women.
P L A I N L A N G U A G E S U M M A R Y
Exercise for preventing and treating osteoporosis in postmenopausal women
This summary of a Cochrane review presents what we know from research about the effect of exercise on bone mass in postmenopausal
women.
The review shows that for postmenopausal women
- Exercise will improve bone mineral density slightly.
- Exercise will reduce the chances of having a fracture slightly.
These results might have happened by chance.
What is osteoporosis and exercise
Bone is a living, growing part of your body. Throughout your lifetime, new bone cells grow and old bone cells break down to make
room for the new, stronger bone. When you have osteoporosis, the old bone breaks down faster than the new bone can replace it. As
this happens, the bones lose minerals (such as calcium). This makes bones weaker and more likely to break even after a minor injury,
like a little bump or fall.
Exercise interventions are typically those that stress or mechanically load bones (when bones support the weight of the body or when
movement is resisted for example when using weights) and include aerobics, strength training, walking and tai chi.
Best estimate of what happens to postmenopausal women who exercise
Bone mineral density at the spine
People who exercised had on average 0.85% less bone loss than those who didn’t exercise.
People who engaged in combinations of exercise types had on average 3.2% less bone loss than those who did not exercise.
Bone mineral density at the hip
People who exercised had on average 1.03% less bone loss than those who didn’t exercise.
People who exercised by strength training had on average 1.03% less bone loss.
Fractures
2E
xerc
isefo
rp
reven
ting
an
dtre
atin
go
steo
po
rosis
inp
ostm
en
op
au
salw
om
en
(Revie
w)
Co
pyrig
ht
©2011
Th
eC
och
ran
eC
olla
bo
ratio
n.P
ub
lished
by
Joh
nW
iley
&S
on
s,L
td.
S U M M A R Y O F F I N D I N G S F O R T H E M A I N C O M P A R I S O N [Explanation]
Exercise for preventing and treating osteoporosis in postmenopausal women
Patient or population: preventing and treating osteoporosis in postmenopausal women
Settings:
Intervention: exercise
Outcomes Illustrative comparative risks* (95% CI) Relative effect
(95% CI)
No. of Participants
(studies)
Quality of the evidence
(GRADE)
Comments
Assumed risk Corresponding risk
Control Exercise
Total number of frac-
tures
radiographs
Study population OR 0.61
(0.23 to 1.64)
539
(4 studies)
⊕⊕⊕⊕
high
Absolute difference = 4%
Not statistically signifi-
cant.106 per 1000 67 per 1000
(27 to 163)
Bone mineral density %
change: spine
The mean bone min-
eral density % change:
spine ranged across con-
trol groups from
-4.38 to 1.05 %
The mean bone mineral
density % change: spine
in the intervention groups
was
0.85 % higher
(0.62 to 1.07 higher)
1441
(24 studies)
⊕⊕⊕⊕
high
Bone mineral density %
change: femoral neck
The mean bone min-
eral density % change:
femoral neck ranged
across control groups
from
-3.19 to 3.12 %
The mean bone min-
eral density % change:
femoral neck in the inter-
vention groups was
0.08 % lower
(1.08 lower to 0.92
higher)
1338
(19 studies)
⊕⊕©©
low1
3E
xerc
isefo
rp
reven
ting
an
dtre
atin
go
steo
po
rosis
inp
ostm
en
op
au
salw
om
en
(Revie
w)
Co
pyrig
ht
©2011
Th
eC
och
ran
eC
olla
bo
ratio
n.P
ub
lished
by
Joh
nW
iley
&S
on
s,L
td.
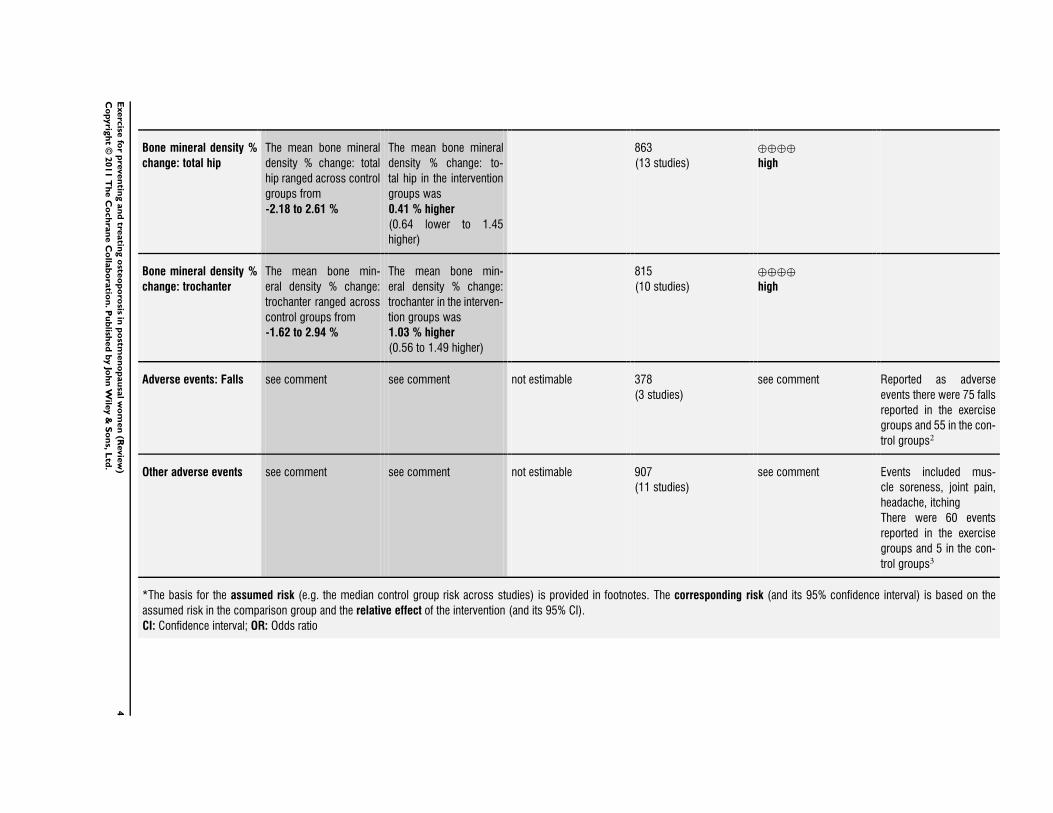
Bone mineral density %
change: total hip
The mean bone mineral
density % change: total
hip ranged across control
groups from
-2.18 to 2.61 %
The mean bone mineral
density % change: to-
tal hip in the intervention
groups was
0.41 % higher
(0.64 lower to 1.45
higher)
863
(13 studies)
⊕⊕⊕⊕
high
Bone mineral density %
change: trochanter
The mean bone min-
eral density % change:
trochanter ranged across
control groups from
-1.62 to 2.94 %
The mean bone min-
eral density % change:
trochanter in the interven-
tion groups was
1.03 % higher
(0.56 to 1.49 higher)
815
(10 studies)
⊕⊕⊕⊕
high
Adverse events: Falls see comment see comment not estimable 378
(3 studies)
see comment Reported as adverse
events there were 75 falls
reported in the exercise
groups and 55 in the con-
trol groups2
Other adverse events see comment see comment not estimable 907
(11 studies)
see comment Events included mus-
cle soreness, joint pain,
headache, itching
There were 60 events
reported in the exercise
groups and 5 in the con-
trol groups3
*The basis for the assumed risk (e.g. the median control group risk across studies) is provided in footnotes. The corresponding risk (and its 95% confidence interval) is based on the
assumed risk in the comparison group and the relative effect of the intervention (and its 95% CI).
CI: Confidence interval; OR: Odds ratio
4E
xerc
isefo
rp
reven
ting
an
dtre
atin
go
steo
po
rosis
inp
ostm
en
op
au
salw
om
en
(Revie
w)
Co
pyrig
ht
©2011
Th
eC
och
ran
eC
olla
bo
ratio
n.P
ub
lished
by
Joh
nW
iley
&S
on
s,L
td.
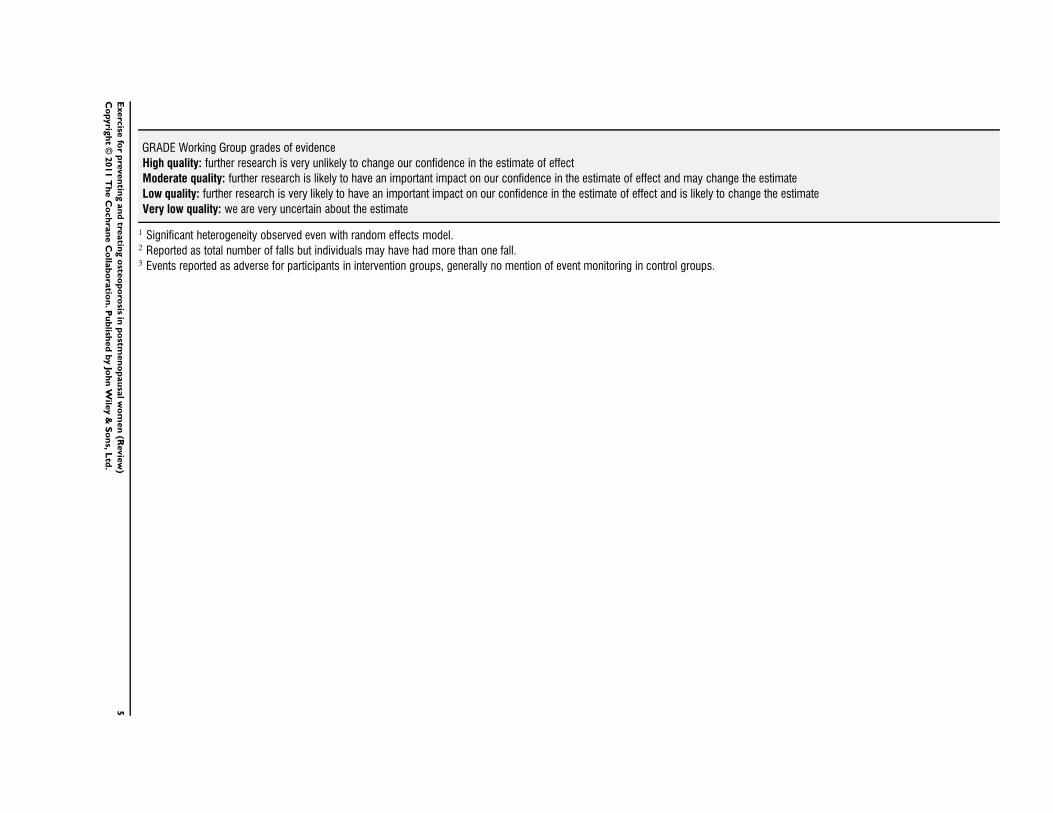
GRADE Working Group grades of evidence
High quality: further research is very unlikely to change our confidence in the estimate of effect
Moderate quality: further research is likely to have an important impact on our confidence in the estimate of effect and may change the estimate
Low quality: further research is very likely to have an important impact on our confidence in the estimate of effect and is likely to change the estimate
Very low quality: we are very uncertain about the estimate
1 Significant heterogeneity observed even with random effects model.2 Reported as total number of falls but individuals may have had more than one fall.3 Events reported as adverse for participants in intervention groups, generally no mention of event monitoring in control groups.
xxxxxxxxxxxxxxxxxxxxxxxxxxxxxxxxxxxxxxxxxxxxxxxxxxxxxxxxxxxxxxxxxxxxxxxxxxxxxxxxxxxxxxxxxxxxxxxxxxxxxxxxxxxxxxxxxxxxxxxxxxxxxxxxxxxxxxxxxxxxxxxxxxxxxxxxxxxxxxxxxxxxxxxxxxxxxxxxxxxxxxxxxxxxxxxx
5E
xerc
isefo
rp
reven
ting
an
dtre
atin
go
steo
po
rosis
inp
ostm
en
op
au
salw
om
en
(Revie
w)
Co
pyrig
ht
©2011
Th
eC
och
ran
eC
olla
bo
ratio
n.P
ub
lished
by
Joh
nW
iley
&S
on
s,L
td.
B A C K G R O U N D
Description of the condition
Osteoporosis is a condition resulting in an increased risk of skeletal
fractures due to a reduction in the density of bone tissue (CDC
1991). The most common clinical manifestations of osteoporosis
are fractures of the hip, vertebrae or wrist. Osteoporotic-related
fractures are responsible for excess mortality, morbidity, chronic
pain, reduction in quality of life, admission to long-term care and
health and social care costs (Papaioannou 2010). For women at
the age of 50 years in developed countries, the remaining lifetime
possibility of osteoporotic fractures exceeds 40%; the remaining
lifetime probability for hip fracture alone exceeds 20% (Bessette
2008). The excess mortality associated with a hip fracture has been
estimated to be 20% (Cooper 1993). The number of osteoporotic-
related fractures is certain to increase as a result of the ageing
population (WHO 1994).
Prevention of osteoporotic-related fractures is based on the abil-
ity to estimate fracture probability by means of risk factor assess-
ment. The quality of bone, (the total characteristics of the bone
that influence the bone’s resistance to fracture), is determined by
a number of factors including bone geometry, cortical thickness
and porosity, trabecular bone morphology and intrinsic properties
of bony tissue. Low bone mass, detected by bone densitometry,
is one of the most important risk factors. Bone mineral density
(BMD) measured by dual X-ray absorptiometry (DXA) is reported
to account for 60% to 70% of the variation in bone strength
(Ammann 2003), and prospective studies have documented that
the lifetime risk of an osteoporotic-related fracture increases 1.5
to 3 times with each standard deviation (SD) decrease in bone
density (Cummings 1993). However Zebaze 2010 reported that
most bone loss is cortical, not trabecular, and occurs after the age
of 65 years; and that the resulting structural decay, including the
magnitude of intracortical remodelling and intracortical porosity,
are poorly captured by current measurement methods. Although
measurements of BMD contribute to the prediction of fracture risk
they cannot identify individuals who will have a fracture (Marshall
1996) as many fractures, particularly in older populations, are re-
sults of falls which are influenced by environmental and other
medical causes, e.g. impaired visual function, muscle strength and
balance (Gillespie 2009).
The treatment of hip fracture and the hospitalisation required fol-
lowing all types of fracture account for most of the economic costs
associated with osteoporosis (Cooper 1993). Therefore, the pre-
vention of fractures is the primary goal of intervention. See other
Cochrane systematic reviews for pharmacological interventions
for osteoporosis: alendronate (Wells 2008a); etidronate (Wells
2008b); fluoride (Haguenauer 2004); risedronate (Wells 2008c);
and strontium renalate (Cranney 2006).
Description of the intervention
Various exercise interventions, designed to stimulate bone growth
and preserve bone mass have been described and evaluated. Inter-
ventions are typically those that stress or mechanically load bones
(when bones support the weight of the body or when movement
is resisted, for example when using weights) and include aerobics,
weight bearing and resistance exercises.
How the intervention might work
In general, it is thought that disuse (not using the limbs or pro-
longed periods of inactivity) and unloading of the skeleton pro-
motes reduced bone mass (Zerwekh 1998), whereas loading pro-
motes increased bone mass. The effects of mechanical loading
have been demonstrated in athletes undertaking high-impact ex-
ercise (Taaffe 1997) and in rats (Robling 2002). Mechanical load-
ing through exercise has the potential to be a safe and effective
way to avert or delay the onset of osteoporosis in postmenopausal
women. The previous version of this review (Bonaiuti 2002) con-
cluded that exercise has beneficial effects on bone density of the
hip and spine, although long term-studies including fracture data
are rare. In addition, strength and balance exercises contribute to
fracture risk reduction through their efficacy in reducing falls risk
(Gillespie 2009).
Why it is important to do this review
The high prevalence and staggering costs (Burge 2007) of osteo-
porotic-related fractures in postmenopausal women means pre-
vention and management of this disease is important. There con-
tinues to be much interest in the effects of exercise on bone as a
nonpharmacological intervention. A systematic review is required
to identify the number of new trials in this area and summarise the
evidence for healthcare professionals, policy makers, researchers
and others with an interest in this area.
O B J E C T I V E S
To examine the effectiveness of exercise in preventing bone loss in
postmenopausal women by determining whether or not exercise
slows bone loss and has a beneficial effect on the axial (the skull,
spine and rib cage) and appendicular (the bones of the limbs and
pelvis) bone density in postmenopausal women.
M E T H O D S
Criteria for considering studies for this review
6Exercise for preventing and treating osteoporosis in postmenopausal women (Review)
Copyright © 2011 The Cochrane Collaboration. Published by John Wiley & Sons, Ltd.
Types of studies
We considered all randomised controlled clinical trials (RCTs) of
exercise in healthy postmenopausal women.
Types of participants
We included studies where participants were healthy post-
menopausal women (including those with previous fractures) aged
between 45 and 70 years.
Types of interventions
We included all RCTs with an exercise programme (e.g. walking,
callisthenics and resisted strengthening) assumed to be adequate
to improve aerobic capacity, or both aerobic capacity and mus-
cle strength compared to standard therapy (e.g. usual activity or
placebo with or without pharmacological consumption).
Types of outcome measures
Major outcomes
• Number of incident fractures: vertebral and non-vertebral
(hip and wrist).
Secondary outcomes
• Bone mass including BMD, bone mineral content (BMC),
or calcium bone index (CaBI) immediately postintervention and
at follow-up.
BMD was measured by Single-Photon Absorptiometry (SPA),
Dual-Photon Absorptiometry (DPA), Quantitative Computerised
Tomography (QCT) or DXA at baseline, immediately postinter-
vention and at follow-up. All results were converted to the percent-
age change of BMD from baseline values. The difference between
the percentage lost in the exercise group and the percentage lost
in the control group was used as the measure of effect in pooling
the data.
• Serious adverse events including death.
• Minor adverse events including falls.
Search methods for identification of studies
Electronic searches
To identify exercise trials, we searched the following five electronic
databases: the Cochrane Musculoskeletal Group’s Trials Regis-
ter; the Cochrane Central Register of Controlled Trials (CEN-
TRAL) (The Cochrane Library); MEDLINE; EMBASE; and Cur-
rent Contents from 1966 to January 2000 with no language re-
strictions, according to the methods suggested by Dickersin 1994
and Haynes 1994 and the Cochrane Handbook for Systematic Re-views of Interventions (Higgins 2011). During this current up-
date of the review, we undertook a further search. We searched
the following electronic databases; the Cochrane Central Register
of Controlled Trials (CENTRAL) (The Cochrane Library, 2010);
MEDLINE (Appendix 1); EMBASE (Appendix 2); HealthSTAR;
Sports Discus; CINAHL (Appendix 3); PEDro (Appendix 4); Web
of Science; Controlled Clinical Trials (Appendix 5); and AMED
(Appendix 6) (all to December 2010).
Searching other resources
In addition, we searched the reference lists of included trials and
trials registers, and contacted content experts for additional studies
and data.
Data collection and analysis
Selection of studies
Following an a priori protocol, at least two review authors (BS,
TH, LD and FD) independently reviewed the eligibility criteria
for abstracts for inclusion in this review. We screened all titles
and/or abstracts generated by the searches for potentially relevant
studies based on the following criteria: the type of study; type of
participants; type of intervention; and type of outcome measure-
ments. We assessed the full-length articles of the selected titles
and/or abstracts for eligibility (for a full description see Criteria
for considering studies for this review). We resolved disagreements
by consensus or third-party adjudication.
Data extraction and management
Pairs of members of the review team used a customised data ex-
traction tool, tested prior to use, to independently extract data.
We resolved disagreements by consensus or third-party adjudica-
tion. We attempted to contact authors of studies where there was
inadequate reporting of data, to enable clarification and where
appropriate, to allow pooling. Where available and appropriate,
we presented quantitative data for the outcomes listed in the in-
clusion criteria in the analyses. Where studies reported standard
errors (SEs) of the means, we obtained SDs by multiplying SEs of
means by the square root of the sample size.
In order to assess efficacy, we extracted raw data for outcomes
of interest (means and SDs for continuous outcomes and num-
ber of events for dichotomous outcomes) where available in the
published reports. Wherever we converted or imputed reported
data, we recorded this in the notes section of the Characteristics
of included studies. All trials reported continuous outcomes as
end-point scores (i.e. mean and SD of the variable at follow-up,
assuming baseline comparability).
7Exercise for preventing and treating osteoporosis in postmenopausal women (Review)
Copyright © 2011 The Cochrane Collaboration. Published by John Wiley & Sons, Ltd.
Assessment of risk of bias in included studies
We assessed risk of bias for each included study using the Cochrane
Collaboration’s ’Risk of bias’ tool (Higgins 2011). Pairs of mem-
bers of the review team reported the following six key domains: se-
quence generation; allocation concealment; blinding; incomplete
outcome data; selective outcome reporting; and “other bias” (com-
parability of treatment and control group at entry, and appropri-
ateness of duration of surveillance). In cases of disagreement be-
tween the review authors, we used consensus to make a decision.
The final assessments for all included studies are presented in a
’risk of bias’ table (see Characteristics of included studies).
Measures of treatment effect
For each trial, we calculated risk ratios (RRs) and 95% CIs for
dichotomous outcomes, and mean differences (MDs) and 95%
CIs for continuous outcomes (reporting mean and SD or standard
error (SE) of the mean). Where appropriate, we pooled results of
comparable groups of trials using the fixed-effect model and 95%
CIs.
Unit of analysis issues
We reported the level at which randomisation occurred in the in-
cluded studies as specified by the Cochrane Handbook for SystematicReviews of Interventions (Deeks 2011). Possible variations in study
designs include cluster randomised trials, cross-over trials, mul-
tiple observations, re-occurring events, multiple treatments and
multiple intervention groups.
Dealing with missing data
If we discovered missing data during data extraction, we attempted
to contact the original investigators of the study to request the re-
quired information. We anticipated that it may also have been nec-
essary to conduct a sensitivity analysis if assumptions were made
(Deeks 2011). We have also described the potential effect of miss-
ing data upon conclusions drawn from this review.
Assessment of heterogeneity
We tested heterogeneity between comparable trials using a stan-
dard Chi2 test and considered heterogeneity statistically significant
at P < 0.1 after due consideration of the value of the I2 statistic; a
value greater than 50% may indicate substantial heterogeneity.
Assessment of reporting biases
If there were sufficient studies, we intended to assess the possibility
of publication bias with funnel plots.
Data synthesis
We used Cochrane Review Manager software to meta-analyse the
statistics as described below (RevMan 2011). We used 95% CIs
for all outcomes.
Continuous outcomes
We calculated mean differences (MDs) using a fixed-effect model
as we measured outcomes on standard scales. We explored possible
reasons for heterogeneity in terms of prevention versus treatment
studies (primary versus secondary prevention), trial quality, dif-
fering populations and exercise programmes. We used a random-
effects model to further analyse the results which were determined
to indicate substantial heterogeneity (i.e. after due consideration
of the value of the I2 statistic, a value greater than 50%).
Dichotomous outcomes
For interpretation of the dichotomous outcome measures in this
review, we selected the RR using a random-effects model, since this
is the most appropriate statistic for the interpretation of pooled
data where the event is common and where there is statistical
heterogeneity between trials (Deeks 1998).
We performed appropriate statistical analysis using Review Man-
ager (RevMan 2011) in accordance with the Cochrane Handbookfor Systematic Reviews of Interventions (Deeks 2011).
Subgroup analysis and investigation of heterogeneity
In the presence of heterogeneity, we pooled the results of compa-
rable groups using the random-effects model and 95% CIs.
We performed separate outcome analyses to determine the effec-
tiveness of different categories of exercise interventions versus con-
trol.
Where the data allowed, we also anticipated performing separate
outcome analyses to test the following hypotheses:
1. effectiveness is not dependent on the duration and/or
intensity of the physical activity/exercise intervention;
2. effectiveness is not dependent on the setting in which the
physical activity/exercise intervention is delivered; and
3. effectiveness is not dependent on the level or type of
supervision of the physical activity/exercise intervention.
Sensitivity analysis
We anticipated that we would undertake sensitivity analyses, when
indicated, to investigate the effects of methodological quality,
for example, allocation concealment and intention-to-treat (ITT)
analysis or where cluster randomised trials are combined with each
other or with other studies in a meta-analysis.
8Exercise for preventing and treating osteoporosis in postmenopausal women (Review)
Copyright © 2011 The Cochrane Collaboration. Published by John Wiley & Sons, Ltd.
Grading of evidence and summary of findings table
Major outcomes (including benefits and adverse events) are pre-
sented in the Summary of findings for the main comparison which
provides information on the quality of evidence and the magni-
tude of the intervention effect, as well as a summary of the main
outcome data. We have also presented an assessment of the overall
quality of evidence per outcome (high, moderate, low and very
low) using the GRADE approach as outlined in the CochraneHandbook for Systematic Reviews of Interventions (Schünemann
2011).
R E S U L T S
Description of studies
See: Characteristics of included studies; Characteristics of
excluded studies; Characteristics of studies awaiting classification;
Characteristics of ongoing studies.
Forty-three RCTs (27 new in this update) with 4320 participants
met the inclusion criteria. Although included in the original ver-
sion of this review, we excluded (Kerr 1996) from this update be-
cause participants were their own control, with one side of body
randomised to a different exercise type. Forty-one of the 43 in-
cluded studies were published in English, one in German (Von
Stengel 2009) and one in Italian (Tolomio 2009).
Exercise interventions
For details of the content of individual interventions see
Characteristics of included studies. Many factors influence the ef-
fectiveness of exercise interventions:
1. attendance;
2. adherence to the programme;
3. accuracy of the assessment system;
4. type of exercise; and
5. duration, intensity, frequency and length of exercise
programme.
The World Health Organization (WHO) defines adherence as
“the extent to which a person’s behavior such as taking medication,
following a diet, executing lifestyle changes like exercising, corre-
sponds with agreed recommendations from a health care provider”,
(WHO 2003) this is clearly different to attendance. The quality
of the reporting of these factors varied in the 43 studies included
in this review.
Compliance/adherence
Thirty-three studies reported compliance/adherence to the pro-
grammes and 10 did not (Bravo 1996; Brentano 2008; Chuin
2009; Hatori 1993; Iwamoto 2005; Lau 1992; Russo 2003; Sakai
2010; Sinaki 1989; Tolomio 2009). The attendance rate ranged
from 48% (Preisinger 1995) to 93% (Bemben 2000) and the ad-
herence rate to the exercise programmes ranged from 39% (Prince
1995) to 95% (Bocalini 2009).
Thirteen studies reported the accuracy of the assessing instrument
(i.e. the test-retest reliability) (Grove 1992; Hatori 1993; Lau
1992; Lord 1996; Martin 1993; Nelson 1994; Preisinger 1995;
Prince 1991; Prince 1995; Pruitt 1996; Revel 1993; Sinaki 1989;
Smidt 1992). Instrument accuracy ranged from 0.4% (Hatori
1993) to 3% (Grove 1992).
Setting
The studies included participants from North America (Bravo
1996; Bemben 2000; Chilibeck 2002; Chow 1987; Chubak 2006;
Chuin 2009; Going 2003; Grove 1992; Maddalozzo 2007; Martin
1993; Metcalfe 2001; Nelson 1994; Newstead 2004; Papaioannou
2003; Pruitt 1996; Rubin 2004; Russo 2003; Sinaki 1989; Smidt
1992), Australia (Kerr 2001; Lord 1996; Prince 1991; Prince
1995), Europe (Bergstrom 2008; Cheng 2002; Ebrahim 1997;
Englund 2005; Karinkanta 2007; Korpelainen 2006; Preisinger
1995; Revel 1993; Tolomio 2009; Uusi-Rasi 2003; Verschueren
2004; Von Stengel 2009), Japan (Hatori 1993; Iwamoto 2001;
Iwamoto 2005; Sakai 2010), China (Chan 2004; Lau 1992) and
Brazil (Bocalini 2009; Brentano 2008).
Length of exercise programmes
The length of the exercise programmes varied in the included stud-
ies; 10 were less than 12 months long (Bemben 2000; Bocalini
2009; Brentano 2008; Chuin 2009; Hatori 1993; Lau 1992; Russo
2003; Sakai 2010; Tolomio 2009; Verschueren 2004); 26 were 12
months long (Bergstrom 2008; Bravo 1996; Chan 2004; Chilibeck
2002; Chow 1987; Chubak 2006; Englund 2005; Going 2003;
Grove 1992; Iwamoto 2001; Iwamoto 2005; Karinkanta 2007;
Kerr 2001; Lord 1996; Maddalozzo 2007; Martin 1993; Metcalfe
2001; Nelson 1994; Newstead 2004; Papaioannou 2003; Pruitt
1996; Revel 1993; Rubin 2004; Smidt 1992; Uusi-Rasi 2003; Von
Stengel 2009); and seven were greater than 12 months (Ebrahim
1997; Kerr 2001; Korpelainen 2006; Preisinger 1995; Prince
1991; Prince 1995; Sinaki 1989).
Number of years postmenopausal
The number of years postmenopausal was reported in 15 studies
(Bemben 2000; Bravo 1996; Chan 2004; Chilibeck 2002; Chubak
2006; Going 2003; Grove 1992; Maddalozzo 2007; Nelson 1994;
Preisinger 1995; Prince 1991; Revel 1993; Russo 2003; Uusi-Rasi
2003; Verschueren 2004).
Exercise interventions
All the exercise interventions described were land based except in
one study (Tolomio 2008) which included both land and water
9Exercise for preventing and treating osteoporosis in postmenopausal women (Review)
Copyright © 2011 The Cochrane Collaboration. Published by John Wiley & Sons, Ltd.
based exercise. We categorised the exercise interventions into the
following six categories.
• Static weight bearing (SWB); including single leg standing.
• Dynamic weight bearing exercise low force (DWBLF);
including walking and Tai chi.
• Dynamic weight bearing exercise high force (DWBHF);
including jogging, jumping, running, dancing and vibration
platform.
• Non-weight bearing exercise low force (NWBLF); e.g. low
load, high repetition strength training.
• Non-weight bearing exercise high force (NWBHF); e.g.
progressive resisted strength training.
• Combination (COMB); more than one of the above
exercise interventions.
Exercise training consisted of: DWBLF in 12 studies (Bravo
1996; Chan 2004; Chow 1987; Ebrahim 1997; Grove 1992;
Hatori 1993; Lau 1992; Lord 1996; Martin 1993; Preisinger
1995; Prince 1991; Prince 1995); DWBHF in 11 studies (Cheng
2002; Going 2003; Grove 1992; Iwamoto 2005; Karinkanta
2007; Maddalozzo 2007; Newstead 2004; Rubin 2004; Russo
2003; Uusi-Rasi 2003; Verschueren 2004); NWBLF in six studies
(Bemben 2000; Brentano 2008; Kerr 2001; Pruitt 1996; Revel
1993; Sinaki 1989); NWBHF in nine studies (Bemben 2000;
Brentano 2008; Bocalini 2009; Chilibeck 2002; Chuin 2009; Kerr
2001; Nelson 1994; Pruitt 1996; Smidt 1992); COMB in 11 stud-
ies (Bergstrom 2008; Chow 1987; Chubak 2006; Englund 2005;
Iwamoto 2001; Karinkanta 2007; Korpelainen 2006; Metcalfe
2001; Papaioannou 2003; Tolomio 2009; Von Stengel 2009); and
SWB in one study (Sakai 2010).
It should be noted that some studies included more than one
exercise intervention arm.
Frequency of the exercise intervention
The frequency of the sessions for the majority of studies was two
or three times per week. The exception being three studies where
participants had daily exercise sessions (Iwamoto 2001; Revel
1993; Sakai 2010) and seven who had four to six sessions per week
(Bergstrom 2008; Chan 2004; Cheng 2002; Lau 1992; Prince
1995; Sinaki 1989; Smidt 1992).
Content of the exercise intervention
The content of the training session was reported in five studies (Lau
1992; Lord 1996; Preisinger 1995; Prince 1991; Prince 1995) and
two studies assessed the effect of the repetition of only one exercise
(Revel 1993; Sinaki 1989). There were five studies that described
that exercise intensity was determined by maximal heart rate (
Bravo 1996; Chow 1987; Ebrahim 1997; Hatori 1993; Martin
1993), and three studies reported how the maximum strength was
measured (Nelson 1994; Pruitt 1996; Smidt 1992). One study
measured the exercise intensity in relation to body weight (Grove
1992).
Controls
In all but twelve studies the controls were invited to continue
their usual activity without any exercise prescription. One study
reported the control group performing 45 minute stretching ses-
sions once a week (Chubak 2006); one performing upper limb
exercises only (Ebrahim 1997); and one performing gentle exer-
cise and relaxation (Von Stengel 2009). In five studies controls
were divided into usual activity with drug interventions or usual
activity alone (Lau 1992; Martin 1993; Maddalozzo 2007; Prince
1991; Prince 1995). A placebo device was used in only one study
(Rubin 2004), and there were three studies which did not report
on the control group (Englund 2005; Hatori 1993; Papaioannou
2003).
Outcome measures
Fracture rate was a primary outcome measure in only one trial
(Iwamoto 2005), but was reported as an adverse event at follow-
up in three (Chan 2004; Karinkanta 2007; Korpelainen 2006).
Falls were reported as adverse events in four trials (Chan 2004;
Ebrahim 1997; Iwamoto 2005; Karinkanta 2007).
BMD was measured at the lumbar spine in 30 studies (Bemben
2000; Bergstrom 2008; Bocalini 2009; Bravo 1996; Chan 2004;
Chilibeck 2002; Chuin 2009; Ebrahim 1997; Englund 2005;
Going 2003; Grove 1992; Hatori 1993; Iwamoto 2001; Kerr
2001; Lau 1992; Lord 1996; Maddalozzo 2007; Martin 1993;
Metcalfe 2001; Nelson 1994; Newstead 2004; Papaioannou 2003;
Prince 1995; Pruitt 1996; Revel 1993; Rubin 2004; Sinaki 1989;
Smidt 1992; Uusi-Rasi 2003; Von Stengel 2009).
BMD was measured at the hip in 30 studies (Bemben 2000;
Bergstrom 2008; Bocalini 2009; Bravo 1996; Brentano 2008;
Chan 2004; Cheng 2002; Chilibeck 2002; Chuin 2009; Ebrahim
1997; Englund 2005; Going 2003; Kerr 2001; Korpelainen
2006; Lau 1992; Lord 1996; Maddalozzo 2007; Metcalfe 2001;
Nelson 1994; Newstead 2004; Papaioannou 2003; Prince 1995;
Pruitt 1996; Rubin 2004; Sakai 2010; Smidt 1992; Tolomio
2009; Uusi-Rasi 2003; Verschueren 2004; Von Stengel 2009).
These were subdivided into the following sites: femoral neck
(Bemben 2000; Bocalini 2009; Bravo 1996; Brentano 2008;
Chan 2004; Chuin 2009; Ebrahim 1997; Englund 2005; Going
2003; Kerr 2001; Korpelainen 2006; Lau 1992; Lord 1996;
Maddalozzo 2007; Nelson 1994; Newstead 2004; Papaioannou
2003; Pruitt 1996; Sakai 2010; Tolomio 2009; Uusi-Rasi
2003); intertrochanteric (Brentano 2008; Sakai 2010); trochanter
(Bemben 2000; Brentano 2008; Chan 2004; Chilibeck 2002;
Englund 2005; Going 2003; Kerr 2001; Korpelainen 2006; Lord
1996; Maddalozzo 2007; Sakai 2010; Smidt 1992; Uusi-Rasi
2003); Ward’s Triangle (Bemben 2000; Brentano 2008; Chilibeck
2002; Englund 2005; Lau 1992; Pruitt 1996; Sakai 2010; Smidt
1992); and total hip (Bemben 2000; Bergstrom 2008; Chilibeck
2002; Kerr 2001; Korpelainen 2006; Maddalozzo 2007; Newstead
2004; Pruitt 1996; Tolomio 2009; Verschueren 2004; Von Stengel
10Exercise for preventing and treating osteoporosis in postmenopausal women (Review)
Copyright © 2011 The Cochrane Collaboration. Published by John Wiley & Sons, Ltd.
2009).
BMD was also measured at the distal radius (Korpelainen 2006;
Preisinger 1995; Rubin 2004; Uusi-Rasi 2003); forearm (Kerr
2001; Martin 1993; Prince 1991); tibia (Chan 2004; Cheng
2002); ankle (Prince 1995); and total body (Bemben 2000;
Chilibeck 2002; Chubak 2006; Englund 2005; Going 2003; Kerr
2001; Newstead 2004; Verschueren 2004).
Other outcome measures included: BMC (Englund 2005;
Karinkanta 2007; Nelson 1994; Uusi-Rasi 2003); cortical bone
density (Cheng 2002; Karinkanta 2007); trabecular bone density
(Russo 2003); CaBI (Chow 1987); body mass (Martin 1993);
muscle strength (Metcalfe 2001); and rate of falls (Von Stengel
2009).
Other adverse events were reported by 11 studies (Chow 1987;
Ebrahim 1997; Grove 1992; Karinkanta 2007; Korpelainen 2006;
Nelson 1994; Pruitt 1996; Revel 1993; Rubin 2004; Russo
2003; Uusi-Rasi 2003) and included muscle soreness, joint pain,
headache and itching.
Results of the search
From the search we found 936 references to potential studies. We
discussed and resolved disagreements by reading the full text of
the paper. We retrieved a total of 90 potential relevant trials for
further classification (see PRISMA flow chart Figure 1).
11Exercise for preventing and treating osteoporosis in postmenopausal women (Review)
Copyright © 2011 The Cochrane Collaboration. Published by John Wiley & Sons, Ltd.
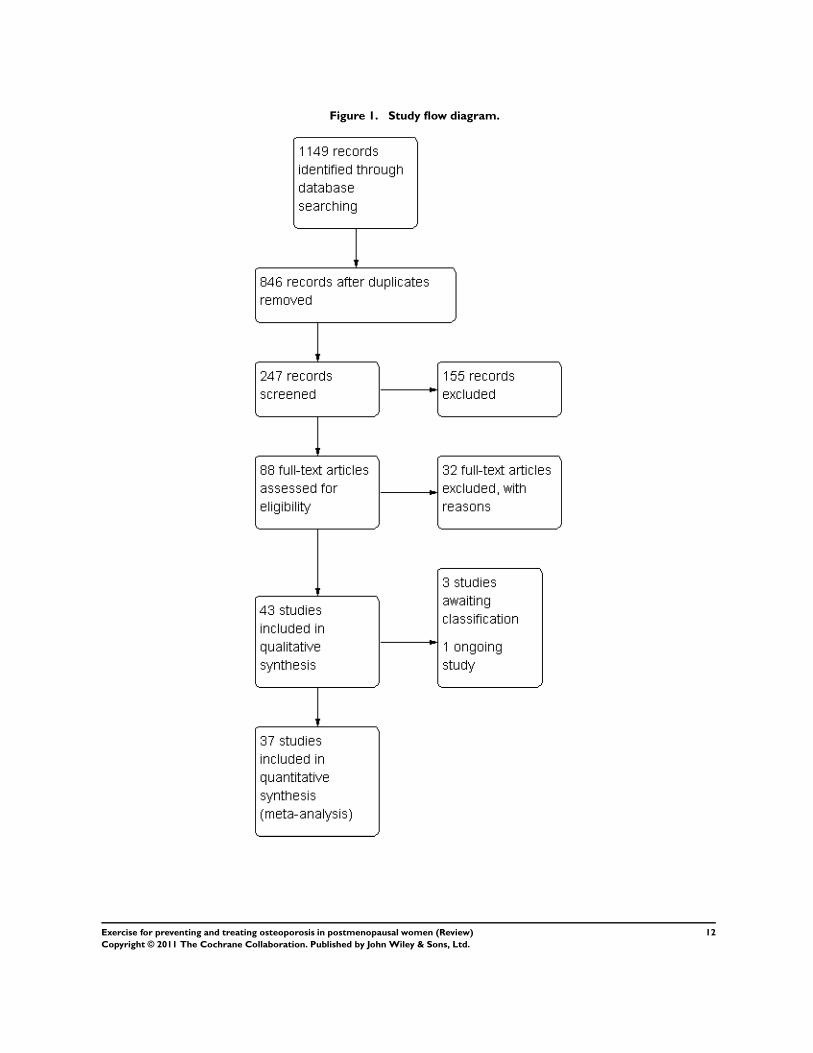
Figure 1. Study flow diagram.
12Exercise for preventing and treating osteoporosis in postmenopausal women (Review)
Copyright © 2011 The Cochrane Collaboration. Published by John Wiley & Sons, Ltd.
Included studies
Forty-three RCTs (27 new in this update) with 4320 participants
met the inclusion criteria. On further scrutiny of the included
studies from the original version (Mayoux-Benhamou 1997) was
actually follow-up data for another included study (Revel 1993).
Forty-one of these 43 included studies were published in English,
one in German (Von Stengel 2009) and one in Italian (Tolomio
2009). Three studies are awaiting classification and one trial is
ongoing. We assessed all study designs as not affecting unit of
analysis, for example we reported no cluster randomised trials or
cross-over trials.
Excluded studies
Thirty-one studies did not meet the inclusion criteria as published
in our a priori protocol. On further scrutiny of the included stud-
ies from the original version we excluded one study (Kerr 1996)
because participants were their own control, with one side of body
randomised to a different exercise type.
Risk of bias in included studies
Pairs of review authors judged the following key domains as ’low
risk’, ‘high risk’ or ‘unclear risk of bias’:
• random sequence generation;
• allocation concealment;
• incomplete outcome data;
• selective reporting;
• blinding (participant);
• blinding (assessor); and
• “other bias” (comparability of treatment and control group
at entry, and appropriateness of duration of surveillance).
In cases of disagreement between the review authors, we made a de-
cision based on consensus. The methodological quality summary
for each included study is presented in Figure 2 and the review
authors’ judgements about each methodological quality item are
presented as percentages across all included studies in Figure 3. We
assessed the overall risk of bias as ’low’ for 13 studies (Bergstrom
2008; Bravo 1996; Cheng 2002; Chilibeck 2002; Chow 1987;
Chubak 2006; Ebrahim 1997; Karinkanta 2007; Korpelainen
2006; Lau 1992; Lord 1996; Uusi-Rasi 2003; Verschueren 2004)
and ’high risk of bias’ for four studies (Metcalfe 2001; Prince 1991;
Prince 1995; Rubin 2004).
13Exercise for preventing and treating osteoporosis in postmenopausal women (Review)
Copyright © 2011 The Cochrane Collaboration. Published by John Wiley & Sons, Ltd.
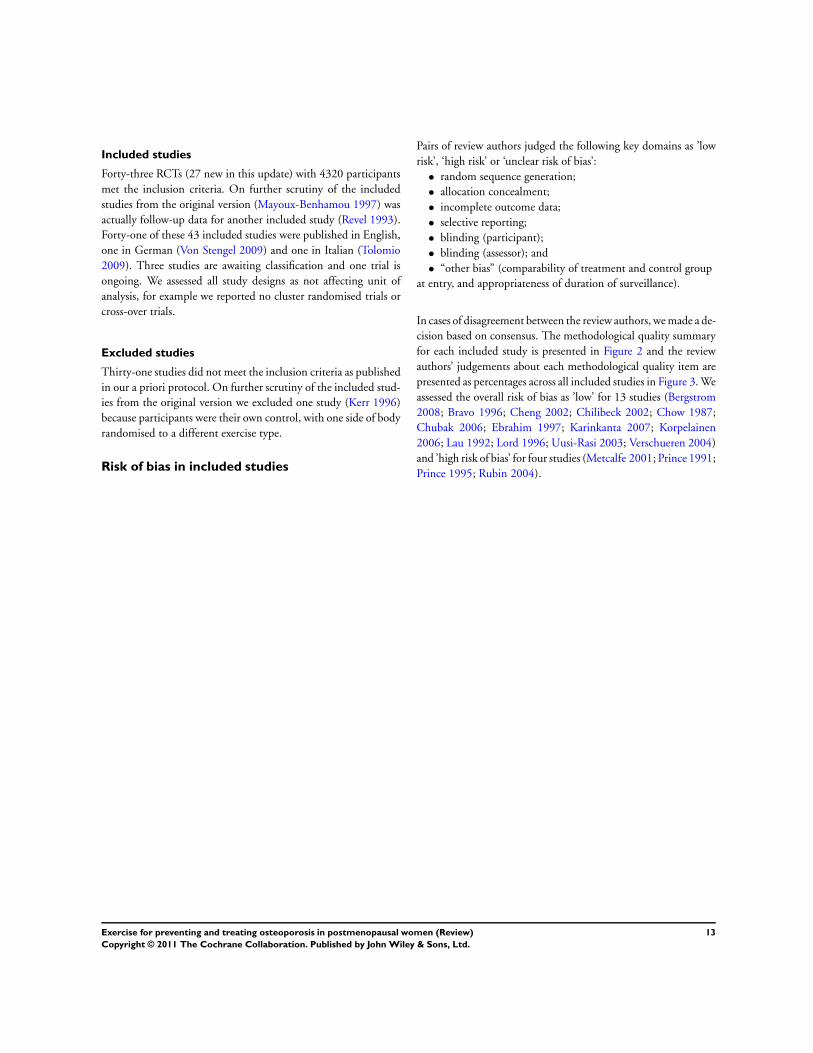
Figure 2. Methodological quality summary: review authors’ judgements about each methodological quality
item for each included study.
14Exercise for preventing and treating osteoporosis in postmenopausal women (Review)
Copyright © 2011 The Cochrane Collaboration. Published by John Wiley & Sons, Ltd.
Figure 3. Methodological quality graph: review authors’ judgements about each methodological quality
item presented as percentages across all included studies.
Allocation
In the original version of the review only one study had clearly
used a proper method of randomisation (Lau 1992). In this up-
date 16 studies adequately described sequence generation (’low
risk of bias’) (Bergstrom 2008; Bravo 1996; Cheng 2002; Chow
1987; Chubak 2006; Ebrahim 1997; Karinkanta 2007; Kerr 2001;
Korpelainen 2006; Lau 1992; Prince 1991; Prince 1995; Rubin
2004; Russo 2003; Sakai 2010; Verschueren 2004) and eleven
studies adequately described allocation concealment (’low risk
of bias’) (Chilibeck 2002; Chow 1987; Chubak 2006; Ebrahim
1997; Karinkanta 2007; Korpelainen 2006; Lau 1992; Lord 1996;
Prince 1991; Prince 1995; Rubin 2004). The other studies did
not clearly describe these methods (’unclear risk of bias’).
Blinding
It is difficult to ensure blinding of participants in studies of exer-
cise interventions. Only one study adequately blinded participants
for the type of exercise intervention (’low risk of bias’) (Rubin
2004), there was an ’unclear risk of bias’ in 15 studies (Bravo
1996; Brentano 2008; Cheng 2002; Chilibeck 2002; Chubak
2006; Ebrahim 1997; Going 2003; Hatori 1993; Iwamoto 2001;
Karinkanta 2007; Lau 1992; Lord 1996; Martin 1993; Nelson
1994; Uusi-Rasi 2003) and participants were not blinded in 27
studies (’high risk of bias’).
Fourteen studies adequately blinded assessors to type of ex-
ercise intervention (’low risk of bias’) (Bocalini 2009; Bravo
1996; Chilibeck 2002; Chow 1987; Chubak 2006; Hatori 1993;
Korpelainen 2006; Papaioannou 2003; Preisinger 1995; Revel
1993; Rubin 2004; Sinaki 1989; Uusi-Rasi 2003; Verschueren
2004), there was an ’unclear risk of bias’ in 28 studies and assessors
were not blinded in one study (’high risk of bias’) (Ebrahim 1997).
Incomplete outcome data
Fifteen studies were judged as appropriately addressing incom-
plete outcome data (’low risk of bias’) (Bergstrom 2008; Bravo
1996; Chow 1987; Chubak 2006; Ebrahim 1997; Going 2003;
Karinkanta 2007; Korpelainen 2006; Lord 1996; Metcalfe 2001;
Nelson 1994; Sinaki 1989; Tolomio 2009; Uusi-Rasi 2003;
Von Stengel 2009), there was an ’unclear risk of bias’ for 26
studies (Bocalini 2009; Brentano 2008; Chan 2004; Cheng
2002; Chilibeck 2002; Chuin 2009; Englund 2005; Grove
1992; Iwamoto 2001; Iwamoto 2005; Kerr 2001; Lau 1992;
15Exercise for preventing and treating osteoporosis in postmenopausal women (Review)
Copyright © 2011 The Cochrane Collaboration. Published by John Wiley & Sons, Ltd.
Maddalozzo 2007; Martin 1993; Newstead 2004; Papaioannou
2003; Preisinger 1995; Prince 1991; Prince 1995; Pruitt 1996;
Revel 1993; Rubin 2004; Russo 2003; Sakai 2010; Smidt 1992;
Verschueren 2004) and two studies were judged as not address-
ing incomplete outcome data (’high risk of bias’) (Bemben 2000;
Hatori 1993).
Selective reporting
Insufficient information was available to permit judgement of ’low
risk’ or ‘high risk of bias’ for selective reporting for any of the 43
studies.
Other potential sources of bias
Treatment and control groups were comparable at entry in 35
studies (’low risk of bias’), it was unclear in six studies (’unclear risk
of bias’) (Bergstrom 2008; Brentano 2008; Grove 1992; Metcalfe
2001; Newstead 2004; Sinaki 1989) and significant differences
were present in two studies indicating a ’high risk of bias’ (Prince
1991; Rubin 2004). Most studies only provided data at the end
of the intervention. Only eight studies provided follow-up data
(Englund 2005; Karinkanta 2007; Korpelainen 2006; Metcalfe
2001; Preisinger 1995; Prince 1991; Revel 1993; Uusi-Rasi 2003).
Effects of interventions
See: Summary of findings for the main comparison Exercise for
preventing and treating osteoporosis in postmenopausal women
1. All exercise types versus control (Analyses 1.1 to
1.8)
Thirty-one studies examining exercise programmes versus control
reported data for the seven outcomes selected as important to
decision making:
• total number of fractures;
• percentage change in BMD at the spine;
• percentage change in BMD at the femoral neck;
• percentage change in BMD in total hip;
• percentage change in BMD at the trochanter;
• adverse events (falls); and
• other adverse events (muscle soreness, joint pain, headache
and itching).
These results are reported in Summary of findings for the main
comparison. However, the nature of the exercise programmes were
heterogeneous and thus the results should be considered with cau-
tion. Among these studies 13 were considered to have ’low risk of
bias’.
Meta-analyses revealed significant differences between the exercise
and control groups in favour of exercise for percentage change in
BMD at the spine (MD 0.85; 95% CI 0.62 to 1.07), 24 studies
and 1441 participants (Analysis 1.2); and trochanter (MD 1.03;
95% CI 0.56 to 1.49), 10 studies and 815 participants (Analysis
1.6).
The risk of fracture in exercise groups was not significantly differ-
ent than that in controls (OR 0.61; 95% CI 0.23 to 1.64), four
studies and 539 participants. There was no significant difference
between the exercise and control groups for: percentage change in
BMD at the femoral neck (MD -0.08; 95% CI -1.08 to 0.92), 19
studies and 1338 participants; or total hip (MD 0.41; 95% CI -
0.64 to 1.45), 13 studies and 863 participants. Only one study
(Uusi-Rasi 2003), 76 participants, reported percentage change in
BMC for the spine and femoral neck and no significant differences
were observed between the exercise and control groups.
Three studies (Chan 2004; Ebrahim 1997; Karinkanta 2007) (n =
378) reported falls as adverse events. There were 75 falls reported
in the exercise groups and 55 in the control groups. Other adverse
events were reported in 11 studies (Chow 1987; Ebrahim 1997;
Grove 1992; Karinkanta 2007; Korpelainen 2006; Nelson 1994;
Pruitt 1996; Revel 1993; Rubin 2004; Russo 2003; Uusi-Rasi
2003); 60 events were reported in the exercise groups and five
in the control groups, and included muscle soreness, joint pain,
headache and itching.
2. Static weight bearing (SWB) (Analysis 2.1)
Only one study Sakai 2010 involving 31 participants examined
SWB (standing on one leg for three minutes per day). A significant
difference was reported for percentage change in BMD at the hip
(Analysis 2.1).
3. Dynamic weight bearing exercise low force
(DWBLF) (Analyses 3.1 to 3.7)
Nine studies examining DWBLF exercise (including walking and
Tai chi) reported data on 705 participants. Among these stud-
ies five were considered to have ’low risk of bias’ (Bravo 1996;
Chow 1987; Ebrahim 1997; Lau 1992; Lord 1996). The compli-
ance with exercise programmes, when reported, varied from 39%
(Prince 1995) to 79.2% (Martin 1993).
The results of meta-analysis showed that there was a statistically
significant effect on percentage change in BMD of the spine (MD
0.87; 95% CI 0.26 to 1.48), seven studies and 1119 participants
(Analysis 3.1), in favour of exercise. However there was no effect
on the femoral neck (MD -1.20; 95% CI -4.45 to 2.05), five
studies and 585 participants; trochanter (MD 0.39; 95% CI -0.59
to 1.38), two studies and 241 participants; or number of fractures
(OR 0.92; 95% CI 0.21 to 3.96), two studies and 229 participants.
Results of single studies indicate a significant difference in favour
of exercise for percentage change of mean regression slope in BMD
at the wrist (MD 1.40; 95% CI 0.85 to 1.95), 103 participants
(Preisinger 1995), and in favour of the control group for percentage
change in BMD in Ward’s triangle (MD -3.60; 95% CI -5.48 to
-1.72), 23 participants (Lau 1992).
16Exercise for preventing and treating osteoporosis in postmenopausal women (Review)
Copyright © 2011 The Cochrane Collaboration. Published by John Wiley & Sons, Ltd.
4. Dynamic weight bearing exercise high force
(DWBHF) (Analyses 4.1 to 4.16)
Ten studies examining DWBHF exercise (including jogging,
jumping, running, dancing and vibration platform) reported data
on 568 participants. Among these studies four were considered to
have ’low risk of bias’ (Cheng 2002; Karinkanta 2007; Uusi-Rasi
2003; Verschueren 2004). The compliance with exercise pro-
grammes, when reported, varied from 82.6% (Grove 1992) to
86.2% (Maddalozzo 2007).
The results of meta-analysis showed that there was a statistically
significant effect on percentage change in BMD of the hip (MD
1.55; 95% CI 1.41 to 1.69), four studies and 179 participants
(Analysis 4.2); and trochanter (MD 1.23; 95% CI -0.01 to 2.47),
two studies and 188 participants (Analysis 4.6) in favour of exer-
cise.
There was no effect on the percentage change in BMD of the spine
(MD -1.20; 95% CI -4.45 to 2.05); mid femur (MD 0.12; 95%
CI -4.84 to 5.08); proximal tibia (MD 3.31; 95% CI -20.22 to
26.84); femoral neck (MD 1.06; 95% CI -0.32 to 2.45); or on
CaBI at the trunk and upper thighs (MD 5.30; 95% CI -7.50 to
18.10).
Results of a single study (Uusi-Rasi 2003) with 76 participants
did not indicate any effect on percentage change in BMC at the
spine (MD 1.43; 95% CI -9.18 to 12.04); femoral neck (MD
0.00; 95% CI -9.11 to 9.11); or wrist (MD -3.41; 95% CI -15.64
to 8.82).
5. Non-weight bearing exercise low force (NWBLF)
(Analyses 5.1 to 5.6)
Five of six studies examining NWBLF exercise (e.g. low load, high
repetition strength training) reported data on 231 participants.
Among these studies none were considered to have ’low risk of
bias’. The compliance with exercise programmes, when reported,
varied from 65% (Pruitt 1996) to 90% (Kerr 2001). No significant
differences were observed for any outcome.
6. Non-weight bearing exercise high force (NWBHF)
(Analayses 6.1 to 6.6)
Nine studies examining NWBHF exercise (e.g. progressive re-
sisted strengthening exercise) reported data on 292 participants.
Among these studies one was considered to have ’low risk of
bias’ (Chilibeck 2002). The compliance with exercise programmes,
when reported, varied from 65% (Pruitt 1996) to 92% (Kerr
2001).
The results of meta-analysis showed that there was a statistically
significant effect on percentage change in BMD of the spine (MD
0.86; 95% CI 0.58 to 1.13), eight studies and 246 participants (
Analysis 6.1); and neck of femur (MD 1.03; 95% CI 0.24 to 1.82),
eight studies and 247 participants (Analysis 6.3). No significant
differences were observed for any other outcome.
7. Combination (COMB) (Analyses 7.1 to 7.9)
Ten studies examining combinations of exercise types (more than
one of the above exercise interventions) reported data on 823
participants. Among these studies five were considered to have
’low risk of bias’ (Bergstrom 2008; Chow 1987; Chubak 2006;
Karinkanta 2007; Korpelainen 2006). The compliance with exer-
cise programmes, when reported, varied from 62% (Papaioannou
2003) to 95% (Bergstrom 2008).
The results of meta-analysis showed that the risk of fractures in
exercise groups was significantly lower than that in controls (OR
0.33; 95% CI 0.13 to 0.85), two studies and 236 participants
(Analysis 7.9): in percentage change in BMD of the spine (MD
3.22; 95% CI 1.80 to 4.64), four studies and 258 participants
(Analysis 7.1); trochanter (MD 1.31; 95% CI 0.69 to 1.92), two
studies and 200 participants (Analysis 7.3); and neck of femur
(MD 0.45; 95% CI 0.08 to 0.82), three studies and 325 partici-
pants (Analysis 7.6).
However the results of meta-analysis showed that there was a statis-
tically significant effect in favour of control in percentage change
in BMD of the total hip (MD -1.07; 95% CI -1.58 to -0.56), four
studies and 468 participants (Analysis 7.2).
8. Exercise and pharmacological products versus
control and pharmacological products (Analyses 8.1
to 15.2)
Ten studies examining exercise and pharmacological products ver-
sus control and pharmacological products reported data on 598
participants. Among these studies four were considered to have
’low risk of bias’. The pharmacological products were hormone
replacement therapy (HRT) (Cheng 2002; Maddalozzo 2007;
Going 2003), bisphosphonates (Chilibeck 2002; Iwamoto 2005;
Uusi-Rasi 2003), antioxidants (Chuin 2009), calcium (Kerr 2001;
Lau 1992; Prince 1995) and calcium plus vitamin D (Martin
1993). Exercise types included DWBHF (Cheng 2002; Going
2003; Iwamoto 2005; Maddalozzo 2007; Uusi-Rasi 2003), DW-
BLF and NWBLF (Kerr 2001), and NWBHF (Chilibeck 2002;
Chuin 2009; Kerr 2001). Compliance with exercise programmes,
when reported, varied from 39% (Prince 1995) to 92% (Kerr
2001).
On the whole data for these eight comparisons comprised small
single studies. DWBHF plus HRT versus HRT demonstrated a
significant effect in favour of exercise in percentage change in
BMD at the trochanter (MD 1.86; 95% CI 0.60 to 3.13), 2 studies
and 203 participants; spine NWBHF plus bisphosphonates versus
bisphosphonates (Chilibeck 2002), 26 participants; distal tibia
and Ward’s triangle DWBLF plus calcium versus calcium (MD
0.60; 95% CI 0.46 to 0.74) (Prince 1995) and (MD 14.50; 95%
CI 10.05 to 18.95) (Lau 1992). However a significant difference
in favour of calcium was seen for DWBLF plus calcium versus
calcium (MD -1.02; 95% CI -1.36 to -0.68) (Lau 1992).
17Exercise for preventing and treating osteoporosis in postmenopausal women (Review)
Copyright © 2011 The Cochrane Collaboration. Published by John Wiley & Sons, Ltd.
No significant differences were observed for any outcome for any
exercise type and pharmacological products versus control and
pharmacological products as listed above.
D I S C U S S I O N
Summary of main results
We have summarised the data from 43 RCTs comparing exercise
with usual activity and exercise plus pharmacological products
versus pharmacological products. We also separately examined the
effect of different categories of exercise.
Our results suggest a relatively small statistically significant, but
possibly important, effect of exercise on bone density in post-
menopausal women compared with control groups. The risk of
fracture in exercise groups was not significantly different than that
in controls (OR 0.61; 95% CI 0.23 to 1.64). Our inference is
strengthened by the consistency of significant findings in favour
of exercise for percentage change in BMD across three sites; spine
(MD 0.85; 95% CI 0.62 to 1.07); total hip (MD 0.41; 95% CI -
0.64 to 1.45); and trochanter (MD 1.03; 95% CI 0.56 to 1.49).
This inference is, however, weakened by methodological limita-
tions such as small sample sizes, loss to follow-up in most studies
and by the unexplained heterogeneity of results across studies. Few
studies provided follow-up data to determine the effect of exercise
beyond the end of the intervention. Falls were reported as adverse
events as numbers of falls rather than number of fallers; one study
reported more events than people, indicating repeat falls. Other
adverse events were reported for participants mainly in interven-
tion groups and included muscle soreness, joint pain, headache
and itching. There was generally no mention of event monitoring
in control groups.
COMB exercise programmes (comprising more than one exercise
type) had a significant effect on BMD at three sites: neck of femur;
spine; and trochanter. The risk of fracture in exercise groups was
lower than that of controls. However there was a significant dif-
ference in BMD in total hip measurement in favour of the control
group.
DWBHF exercise (jogging, jumping and vibration platforms) had
a significant effect on BMD at two sites; total hip and trochanter,
compared to the control groups, but no effect at any other site
(neck of femur, spine, mid femur, tibia, trunk and thighs, or BMC
at neck of femur and spine).
DWBLF exercise (walking or Tai chi) had a significant effect on
BMD at two sites; spine and wrist compared to the control groups.
NWBHF exercise (progressive resistance exercise) had a significant
effect on BMD at two sites; neck of femur and spine compared to
the control groups.
SWB exercise (e.g. single leg standing) had a significant effect on
BMD at the hip.
NWBLF exercise (low load high repetition strength training) had
no significant difference on any outcomes reported.
On the whole, comparisons of exercise plus pharmacological prod-
ucts versus pharmacological products were small single studies and
thus conclusions on their findings are limited.
The population included in these studies was heterogeneous but
results should be reviewed with caution due to differences in eth-
nicity. However, the lack of reporting of exercise characteristics
(type, intensity, frequency, duration and mode) of the study ex-
ercise interventions also limits the conclusions that can be drawn
from this review.
Overall completeness and applicability ofevidence
It is important for future research in this area to have standard-
ised recommendations for conducting exercise interventions and
reporting of exercise outcomes. We cannot currently determine if
the effect of the varied exercises was different in the first and in
the second period of the postmenopausal time period. The short
time of the follow-up of all the studies limits our ability to predict
the long-term effects exercise may or may not have on bone loss.
Quality of the evidence
The 43 studies (27 new studies in this update) included in this
review were predominantly in the English language and originate
mainly from North America and Europe (n = 32). Whilst this may
be seen to limit the applicability of the evidence to these healthcare
systems and social environments the evidence has potential gener-
alisability; the majority of participants were healthy community-
dwelling women.
The overall quality of the included studies was variable and should
be taken into account when interpreting the results of this review.
The risk of bias was assessed as ’low’ for only 13 studies (Bergstrom
2008; Bravo 1996; Cheng 2002; Chilibeck 2002; Chow 1987;
Chubak 2006; Ebrahim 1997; Karinkanta 2007; Korpelainen
2006; Lau 1992; Lord 1996; Uusi-Rasi 2003; Verschueren 2004).
Only one study included in this review blinded the patients (
Rubin 2004) and few blinded the assessors (Bocalini 2009; Bravo
1996; Chilibeck 2002; Chow 1987; Chubak 2006; Hatori 1993;
Korpelainen 2006; Papaioannou 2003; Preisinger 1995; Revel
1993; Rubin 2004; Sinaki 1989; Uusi-Rasi 2003; Verschueren
2004).
It is very difficult and maybe impossible to blind patients and care
providers in exercise therapy. Nevertheless, this bias is unlikely to
have influenced the BMD measurements.
Potential biases in the review process
18Exercise for preventing and treating osteoporosis in postmenopausal women (Review)
Copyright © 2011 The Cochrane Collaboration. Published by John Wiley & Sons, Ltd.
The review was restricted to RCTs; we excluded clinical con-
trolled trials CCTs) thus limiting the potential for bias. All stud-
ies described themselves as randomised mostly without giving de-
tails of how the randomisation sequence was generated and what
precautions were taken in relation to concealment of allocation.
Only eight studies adequately deal with incomplete outcome data
(Englund 2005; Karinkanta 2007; Korpelainen 2006; Metcalfe
2001; Preisinger 1995; Prince 1991; Revel 1993; Uusi-Rasi 2003)
the remainder reporting the results for only those participants
who completed all post-treatment assessments. Fractures, falls and
other adverse events were reported as adverse events and were
mainly monitored for the exercise groups only.
Agreements and disagreements with otherstudies or reviews
Few meta-analyses have been published in this area (Berard 1997;
Hind 2007; Wolff 1999). These meta-analyses included RCTs and
CCTs, one (Wolff 1999) also included studies on premenopausal
women. All authors subdivided the studies depending on the exer-
cise characteristics and meta-analysed all exercise programmes to-
gether. While Wolff 1999 concluded that exercises prevent femoral
and lumbar bone loss, Berard 1997 concluded that weight bearing
exercises are effective mainly on the spine, but there may be some
evidence of efficacy on femoral bone and forearm bone. Weight
bearing exercise also appears to enhance bone mineral accrual in
children, particularly during early puberty (Hind 2007). The re-
sults of a meta-analysis in Nikander 2010 indicate that exercise
can significantly enhance bone strength at loaded sites in children
but not in adults.
Other reviews with limited quality evidence suggest that Tai chi
(Wayne 2007) and physical activity (Schmitt 2009) may be effec-
tive and safe methods of maintaining BMD in postmenopausal
women. Furthermore an overview of the literature (Winett 2001)
purports the benefits of resistance training on BMD. The results
of this current review suggest that high force resistance training
increases BMD whereas low force does not, indicating the impor-
tance of intensity of exercise.
This current review reported on bone mass as an outcome of ef-
fectiveness and included BMC, CaBI and BMD. Zebaze 2010 re-
ported that most bone loss is cortical, not trabecular, and occurs
after 65 years of age, and the resulting structural decay, includ-
ing the magnitude of intracortical remodelling and intracortical
porosity are poorly captured by current measurement methods.
Nikander 2010 recommends that further research is required to
quantify the effects of exercise on whole bone strength and its
structural determinants throughout life.
A U T H O R S ’ C O N C L U S I O N S
Implications for practice
Our results suggest a relatively small statistically significant, but
possibly important, effect of exercise on bone density in post-
menopausal women compared with control groups. The most ef-
fective type of exercise intervention on BMD for the neck of fe-
mur appears to be NWBHF exercise such as progressive resistance
strength training for the lower limbs. The most effective inter-
vention for BMD at the spine was COMB exercise programmes
(comprising more than one exercise type) (MD 3.22; 95% CI 1.80
to 4.64), with a change of over 3% compared with control groups.
However the risk of fracture across all exercise groups was not sig-
nificantly different than that in controls with 4 more women out
of 100 who did not exercise sustaining a fracture (absolute differ-
ence 4%).
These exercise types should be considered as preferred interven-
tions in clinical practice, however, it remains unclear as to what
constitutes an optimal exercise programme.
Implications for research
On the whole the quality of the reporting of studies in the meta-
analyses in this review was low, in particular in the areas of se-
quence generation, allocation concealment, blinding and loss to
follow-up. Future research needs to focus on standardised out-
come measures and exercise programmes, better reporting of all
the parameters of exercise programmes and, the accuracy of mea-
surements. Fracture and fall data, and adverse event reporting for
all participants regardless of group allocation should be included
for all future studies. Measuring the BMD changes for both the
hip (particularly neck of femur) and spine is important as fractures
at these sites result in high mortality and morbidity. Adequate fol-
low-up of participants is required to determine long-term effects
of exercise.
A C K N O W L E D G E M E N T S
We would like to acknowledge the following for their contribution
to the original systematic review: Donatella Bonaituti, Lovine R,
Negrini S, Welch V, Kemper HHCG, Wells GA, Tugwell P, Cran-
ney A. We would also like to thank Louise Falzon and Tamara
Rader for their assistance with the literature search. A special
thanks to Jon Godwin for his helpful advice on data queries, com-
ments and suggestions, Sarah Mitchell for assistance with data ex-
traction and to Elizabeth Ghogomu and the Cochrane Muscu-
loskeletal Group for their ongoing support and their help with the
preparation of this manuscript.
19Exercise for preventing and treating osteoporosis in postmenopausal women (Review)
Copyright © 2011 The Cochrane Collaboration. Published by John Wiley & Sons, Ltd.
R E F E R E N C E S
References to studies included in this review
Bemben 2000 {published data only}
Bemben DA, Fetters NL, Bemben MG, Nabavi N, Koh
ET. Musculoskeletal responses to high- and low-intensity
resistance training in early postmenopausal women.
Medicine and Science in Sports and Exercise 2000;32(11):
1949–57.
Bergstrom 2008 {published data only}
Bergstrom I, Landgren B, Brinck J, Freyschuss B. Physical
training preserves bone mineral density in postmenopausal
women with forearm fractures and low bone mineral
density. Osteoporosis International 2008;19(2):177–83.
Bocalini 2009 {published data only}
Bocalini DS, Serra AJ, Dos Santos L, Murad N, Levy RF.
Strength training preserves the bone mineral density of
postmenopausal women without hormone replacement
therapy. Journal of Aging and Health 2009;21(3):519–27.
Bravo 1996 {published data only}
Bravo G, Gauthier P, Roy PM, Payette H, Gaulin P, Harvey
M, et al.Impact of a 12-month exercise program on the
physical and psychological health of osteopenic women.
Journal of the American Geriatrics Society 1996;44(7):
756–762.
Brentano 2008 {published data only}
Brentano Cadore EL, Da Silva EM, Ambrosini AB,
Coertjens M, Petkowicz R, Viero I, et al.National Strength
and Conditioning Association. Physiological adaptations
to strength and circuit training in postmenopausal women
with bone loss. Journal of Strength and Conditioning Research
2008;22(6):1816–25.
Chan 2004 {published data only}
Chan K, Qin L, Lau M, Woo J, Au S, Choy W, et al.A
randomized, prospective study of the effects of Tai Chi
Chun exercise on bone mineral density in postmenopausal
women. Archives of Physical Medicine and Rehabilitation
2004;85(5):717–22.
Cheng 2002 {published data only}
Cheng S, Sipila S, Taaffe DR, Puolakka J, Suominen H.
Change in bone mass distribution induced by hormone
replacement therapy and high-impact physical exercise in
post-menopausal women. Bone 2002;31(1):126–35.
Chilibeck 2002 {published data only}
Chilibeck PD, Davison KS, Whiting SJ, Suzuki Y, Janzen
CL, Peloso P. The effect of strength training combined with
bisphosphonate (etidronate) therapy on bone mineral, lean
tissue, and fat mass in postmenopausal women. Canadian
Journal of Physiology and Pharmacology 2002;80(10):
941–50.
Chow 1987 {published data only}
Chow R, Harrison JE, Notarius C. Effect of two
randomised exercise programmes on bone mass of healthy
postmenopausal women. British Medical Journal 1987;295:
1441–4.
Chubak 2006 {published data only}
Chubak J, Ulrich CM, Tworoger SS, Sorensen B, Yasui Y,
Irwin ML, et al.Effect of exercise on bone mineral density
and lean mass in postmenopausal women. Medicine and
Science in Sports and Exercise 2006;38(7):1236–44.
Chuin 2009 {published data only}
Chuin A, Labonte M, Tessier D, Khalil A, Bobeuf F, Doyon
CY, et al.Effect of antioxidants combined to resistance
training on BMD in elderly women: A pilot study.
Osteoporosis International 2009;20(7):1253–8.
Ebrahim 1997 {published data only}
Ebrahim S, Thompson PW, Baskaran V, Evans K.
Randomized placebo-controlled trial of brisk walking in the
prevention of postmenopausal osteoporosis. Age and Aging
1997;26(4):253–260.
Englund 2005 {published data only}
Englund U, Littbrand H, Sondell A, Bucht G, Pettersson
U. The beneficial effects of exercise on BMD are lost after
cessation: a 5-year follow-up in older post-menopausal
women. Scandinavian Journal of Medicine and Science in
Sports 2009;19(3):381–8.∗ Englund U, Littbrand H, Sondell A, Pettersson U, Bucht
G. A 1-year combined weight-bearing training program
is beneficial for bone mineral density and neuromuscular
function in older women. Osteoporosis International 2005;
16(9):1117–23.
Going 2003 {published data only}
Going S, Lohman T, Houtkooper L, Metcalfe L, Flint-
Wagner H, Blew R, et al.Effects of exercise on bone mineral
density in calcium-replete postmenopausal women with
and without hormone replacement therapy. Osteoporosis
International 2003;14(8):637–43.
Grove 1992 {published data only}
Grove KA, Londeree BR. Bone density in postmenopausal
women: high impact vs low impact exercise. Medicine and
Science in Sports and Exercise 1992;24(11):1190–4.
Hatori 1993 {published data only}
Hatori M, Hasegawa A, Adachi H, Shinozaki A, Hayashi
R, Okano H, et al.The effects of walking at the anaerobic
threshold level on vertebral bone loss in postmenopausal
women. Calcified Tissue International 1993;52:411–14.
Iwamoto 2001 {published data only}
Iwamoto J, Takeda T, Ichimura S. Effect of exercise training
and detraining on bone mineral density in postmenopausal
women with osteoporosis. Journal of Orthopaedic Science
2001;6(2):128–32.
Iwamoto 2005 {published data only}
Iwamoto J, Takeda T, Sato Y, Uzawa M. Effect of whole-
body vibration exercise on lumbar bone mineral density,
bone turnover, and chronic back pain in post-menopausal
osteoporotic women treated with alendronate. AgingClinical
and Experimental Research 2005;17(2):157–63.
20Exercise for preventing and treating osteoporosis in postmenopausal women (Review)
Copyright © 2011 The Cochrane Collaboration. Published by John Wiley & Sons, Ltd.
Karinkanta 2007 {published data only}
Karinkanta S, Heinonen A, Sievanen H, Uusi-Rasi K,
Fogelholm M, Kannus P. Maintenance of exercise-induced
benefits in physical functioning and bone among elderly
women. Osteoporosis International 2009;20(4):665–74.∗ Karinkanta S, Heinonen A, Sievanen H, UusiRasi K,
Pasanen M, Ojala K, et al.European Foundation for
Osteoporosis and the National Osteoporosis Foundation of
the USA. A multi-component exercise regimen to prevent
functional decline and bone fragility in home-dwelling
elderly women: randomized, controlled trial. Osteoporosis
International 2007;18(4):453–62.
Kerr 2001 {published data only}
Kerr D, Ackland T, Maslen B, Morton A, Prince R.
Resistance training over 2 years increases bone mass in
calcium-replete postmenopausal women. Journal of Bone
and Mineral Research 2001;16(1):175–81.
Korpelainen 2006 {published data only}∗ Keinanen-Kiukaanniemi S, Heikkinen J, Vaananen K,
Korpelainen J. Effect of impact exercise on bone mineral
density in elderly women with low BMD: a population-
based randomized controlled 30-month intervention.
Osteoporosis International 2006;17(1):109–18.
Korpelainen R, Keinanen-Kiukaanniemi S, Nieminen
P, Heikkinen J, Vaananen K, Korpelainen J. Long-term
outcomes of exercise: follow-up of a randomized trial in
older women with osteopenia. Archives of Internal Medicine
2010;170(17):1548–56.
Lau 1992 {published data only}
Lau EMC, Woo J, Leung PC, Swaminathan R, Leung
D. The effects of calcium supplementation and exercise
on bone density in elderly Chinese women. Osteoporosis
International 1992;2(4):168–73.
Lord 1996 {published data only}
Lord SR, Ward JA, Williams P, Zivanovic E. The effects of
a community exercise program on fracture risk factors in
older women. Osteoporosis International 1996;6(5):361–7.
Maddalozzo 2007 {published data only}
Maddalozzo GF, Widrick JJ, Cardinal BJ, Winters-Stone
KM, Hoffman MA, Snow CM. The effects of hormone
replacement therapy and resistance training on spine bone
mineral density in early postmenopausal women. Bone
2007;40(5):1244–51.
Martin 1993 {published data only}
Martin D, Notelovitz M. Effects of aerobic training on bone
mineral density of postmenopausal women. Journal of Bone
and Mineral Research 1993;8(8):931–6.
Metcalfe 2001 {published data only}
Houtkooper LB, Stanford VA, Metcalfe LL, Lohman TG,
Going SB. Preventing osteoporosis the bone estrogen
strength training way. ACSM’s Health and Fitness Journal
2007;11(1):21.
Metcalfe L. The BEST exercise program for osteoporosis
prevention. Functional U 2007;5(2):1.∗ Metcalfe L, Lohman T, Going S, Houtkooper L, Ferriera
D, Flint-Wagner H, et al.Postmenopausal women and
exercise for prevention of osteoporosis: the Bone, Estrogen,
Strength Training (BEST) study. ACSM’s Health & Fitness
Journal 2001;5(3):6.
Nelson 1994 {published data only}
Nelson ME, Fiatarone MA, Morganti CM, Trice I,
Greenberg RA, Evans WJ. Effects of high-intensity strength
training on multiple risk factors for osteoporotic fractures.
JAMA 1994;272(24):1909–14.
Newstead 2004 {published data only}
Newstead A, Smith KI, Bruder J, Keller C. The effect of
a jumping exercise intervention on bone mineral density
in postmenopausal women. Journal of Geriatric Physical
Therapy 2004;27(2):47–52.
Papaioannou 2003 {published data only}∗ Papaioannou A, Adachi JD, Winegard K, Ferko N,
Parkinson W, Cook RJ, et al.Efficacy of home-based
exercise for improving quality of life among elderly women
with symptomatic osteoporosis-related vertebral fractures.
Osteoporosis International 2003;14(8):677–82.
Webber CE, Papaioannou A, Winegard KJ, Adachi JD,
Parkinson W, Ferko NC, et al.A 6-mo home-based exercise
program may slow vertebral height loss. Journal of Clinical
Densitometry 2003;6(4):391–400.
Preisinger 1995 {published data only}∗ Preisinger E, Alacamlioglu Y, Pils K, Saradeth T, Schneider
B. Therapeutic exercise in the prevention of bone loss. A
controlled trial with women after menopause. American
Journal of Physical Medicine and Rehabilitation 1995;74(2):
120–3.
Preisinger E, Kerschan-Schindl K, Wober C, Kollmitzer J,
Ebenbichler G, Hamwi A, et al.The effect of calisthenic
home exercises on postmenopausal fractures-a long-term
observational study. Maturitas 2001;40(1):61–7.
Prince 1991 {published data only}
Prince RL, Smith M, Dick IM, Price RI, Webb PG,
Henderson NK, et al.Prevention of postmenopausal
osteoporosis: a comparative study of exercise, calcium
supplementation, and hormone-replacement therapy. New
England Journal of Medicine 1991;325(17):1189–95.
Prince 1995 {published data only}
Prince R, Devine A, Dick I, Criddle A, Kerr D, Kent N, et
al.The effects of calcium supplementation (milk powder
or tablets) and exercise on one ensity in postmenopausal
women. Journal of Bone and Mineral Research 1995;10(7):
1068–75.
Pruitt 1996 {published data only}
Pruitt LA, Taaffe DR, Marcus R. Effects of a one-year high-
intensity versus low-intensity resistance training program
on bone mineral density in older women. Journal of Bone
and Mineral Research 1996;10(11):1788–95.
Revel 1993 {published data only}
Mayoux-Benhamou MA, Bagheri F, Roux C, Auleley
GR, Rabourdin JP, Revel M. Effect of Ppsoas training on
21Exercise for preventing and treating osteoporosis in postmenopausal women (Review)
Copyright © 2011 The Cochrane Collaboration. Published by John Wiley & Sons, Ltd.
postmenopausal lumbar bone loss: a 3-year follow-up study.
Calcified Tissue International 1997;60(4):348–53.∗ Revel M, Mayoux-Benhamou MA, Rabourdin JP, Bagheri
F, Roux C. One-year psoas training can prevent lumbar bone
loss in postmenopausal women: a randomized controlled
trial. Calcified Tissue International 1993;53(5):307–11.
Rubin 2004 {published data only}
Rubin C, Recker R, Cullen D, Ryaby J, McCabe J, McLeod
K. Prevention of postmenopausal bone loss by a low-
magnitude, high-frequency mechanical stimuli: a clinical
trial assessing compliance, efficacy, and safety. Journal of
Bone and Mineral Research 2004;19(3):343–51.
Russo 2003 {published data only}
Russo CR, Lauretani F, Bandinelli S, Bartali B, Cavazzini
C, Guralnik JM, et al.High-frequency vibration training
increases muscle power in postmenopausal women. Archives
of Physical Medicine and Rehabilitation 2003;84(12):
1854–7.
Sakai 2010 {published data only}
Sakai A, Oshige T, Zenke Y, Yamanaka Y, Nagaishi H,
Nakamura T. Unipedal standing exercise and hip bone
mineral density in postmenopausal women: a randomized
controlled trial. Journal of Bone and Mineral Metabolism
2010;28(1):42–8.
Sinaki 1989 {published data only}
Sinaki M, Wahner HW, Offord KP, Hodgson SF. Efficacy
of nonloading exercises in prevention of vertebral bone loss
in postmenopausal women: a controlled trial. Mayo Clinic
Proceedings 1989;64(7):762–9.
Smidt 1992 {published data only}
Smidt GL, Lin SY, O’Dwyer KD, Blanpied PR. The effect
of high-intensity trunk exercise on bone mineral density of
postmenopausal women. Spine 1992;17(3):280.
Tolomio 2009 {published data only}
Tolomio S, Lalli A, Travain G, Zaccaria M. Effects of a
combined weight- and non weight-bearing (water) exercise
program on bone mass and quality in postmenopausal
women with low bone mineral density. Clinica Terapeutica
2009;160(2):105–9.
Uusi-Rasi 2003 {published data only}∗ Uusi-Rasi K, Kannus P, Cheng S, Sievanen H, Pasanen
M, Heinonen A, et al.Effect of alendronate and exercise on
bone and physical performance of postmenopausal women:
A randomized controlled trial. Bone 2003;33(1):132–43.
Uusi-Rasi K, Sievanen H, Heinonen A, Kannus P, Vuori
I. Effect of discontinuation of alendronate treatment and
exercise on bone mass and physical fitness: 15-month
follow-up of a randomized, controlled trial. Bone 2004;35
(3):799–805.
Verschueren 2004 {published data only}
Verschueren SM, Roelants M, Delecluse C, Swinnen S,
Vanderschueren D, Boonen S. Effect of 6-month whole
body vibration training on hip density, muscle strength, and
postural control in postmenopausal women: a randomized
controlled pilot study. Journal of Bone and Mineral Research
2004;19(3):352–9.
Von Stengel 2009 {published data only}
Von Stengel S, Kemmler W, Mayer S, Engelke K, Klarner
A, Kalender WA. Effect of whole body vibration exercise
on osteoporotic risk factors. Deutsche Medizinische
Wochenschrift (1946) 2009;134(30):1511–6.
References to studies excluded from this review
Ay 2005 {published data only}
Ay A, Yurtkuran M. Influence of aquatic and weight-
bearing exercises on quantitative ultrasound variables in
postmenopausal women. American Journal of Physical
Medicine and Rehabilitation 2005;84(1):52–61.
Bebenek 2010 {published data only}
Bebenek M, Kemmler W, Von Stengel S, Engelke K,
Kalender WA. Effect of exercise and Cimicifuga racemosa
(CR BNO 1055) on bone mineral density, 10-year
coronary heart disease risk, and menopausal complaints: the
randomized controlled Training and Cimicifuga racemosa
Erlangen (TRACE) study. Menopause (10723714) 2010;17
(4):791–800.
Bemben 2010 {published data only}
Bemben DA, Palmer IJ, Bemben MG, Knehans AW.
Effects of combined whole-body vibration and resistance
training on muscular strength and bone metabolism in
postmenopausal women. Bone 2010;47(3):650–6.
Cao 2009 {published data only}
Cao ZB, Tabata I, Nishizono H. Good maintenance of
physical benefits in a 12-month exercise and nutritional
intervention by voluntary, home-based exercise: a 6-month
follow-up of a randomized controlled trial. Journal of Bone
and Mineral Metabolism 2009;27(2):182–9.
De Matos 2009 {published data only}
De Matos O, Da Silva DJL, De Oliveira JM, Castelo-
Branco C. Effect of specific exercise training on bone
mineral density in women with postmenopausal osteopenia
or osteoporosis. Gynecological Endocrinology 2009;25(9):
616–20.
Engelke 2006 {published data only}
Engelke K, Kemmler W, Lauber D, Beeskow C, Pintag R,
Kalender WA. Exercise maintains bone density at spine
and hip EFOPS: a 3-year longitudinal study in early
postmenopausal women. Osteoporosis International 2006;17
(1):133–42.
Hans 2002 {published data only}
Hans D, Genton L, Drezner MK, Schott AM, Pacifici R,
Avioli L, et al.Monitored impact loading of the hip: initial
testing of a home-use device. Calcified Tissue International
2002;71(2):112–20.
Hawkins 2002 {published data only}
Hawkins SA, Wiswell RA, Schroeder ET. The relationship
between bone adaptations to resistance exercise and
reproductive-hormone levels. Journal of Aging and Physical
Activity 2002;10(1):64–75.
Heinonen 1996 {published data only}
Heinonen A, Kannus P, Sievanen H, Oja P, Pasanen M,
Rinne M, et al.Randomised controlled trial of effect of
22Exercise for preventing and treating osteoporosis in postmenopausal women (Review)
Copyright © 2011 The Cochrane Collaboration. Published by John Wiley & Sons, Ltd.
high-impact exercise on selected risk factors for osteoporotic
fractures. Lancet 1996;348(9038):1343–7.
Kemmler 2003 {published data only}∗ Kemmler W, Engelke K, Weineck J, Hensen J, Kalender
WA. The Erlangen Fitness Osteoporosis Prevention Study:
a controlled exercise trial in early postmenopausal women
with low bone density - first-year results. Archives of Physical
Medicine and Rehabilitation 2003;84(5):673–82.
Kemmler W, Lauber D, Weineck J, Hensen J, Kalender
W, Engelke K. Benefits of 2 years of intense exercise on
bone density, physical fitness, and blood lipids in early
postmenopausal osteopenic women: Results of the Erlangen
Fitness Osteoporosis Prevention Study (EFOPS). Archives of
Internal Medicine 2004;164(10):1084–91.
Kemmler W, Von Stengel S, Weineck J, Lauber D, Kalender
W, Engelke K. Exercise effects on menopausal risk factors
of early postmenopausal women: 3-Yr erlangen fitness
osteoporosis prevention study results. Medicine and Science
in Sports and Exercise 2005;37(2):194–203.
Kerr 1996 {published data only}
Kerr D, Morton A, Dick I, Prince R. Exercise effects on
bone mass in postmenopausal women are site-specific and
load-dependent. Journal of Bone and Mineral Research 1996;
11(2):218–25.
Kerschan-Schindl 2000 {published data only}
Kerschan-Schindl K, Uher E, Kainberger F, Kaider A,
Ghanem AH, Preisinger E. Long-term home exercise
program: Effect in women at high risk of fracture. Archives
of Physical Medicine and Rehabilitation 2000;81(3):319–23.
Kohrt 1995 {published data only}
Kohrt WM, Snead DB, Slatopolsky E, Birge S. Additive
effects of weight-bearing exercise and estrogen on bone
mineral density in older women. Journal of Bone and
Mineral Research 1995;10(9):1303–11.
Kontulainen 2004 {published data only}
Kontulainen S, Heinonen A, Kannus P, Pasanen M,
Sievanen H, Vuori I. Former exercisers of an 18-month
intervention display residual aBMD benefits compared with
control women 3.5 years post-intervention: a follow-up
of a randomized controlled high-impact trial. Osteoporosis
International 2004;15(3):248–51.
Kriska 1986 {published data only}
Kriska AM, Bayles C, Cauley JA, Laporte RE, Sandler RB,
Pambianco G. A randomized exercise trial in older women:
increased activity over two years and the factors associated
with compliance. Medicine and Science in Sports and Exercise
1986;18(5):557–62.
Leichter 1989 {published data only}
Leichter I, Simkin A, Margulies JY, Bivas A, Steinberg R,
Giladi M, et al.Gain in mass density of bone following
strenuous physical activity. Journal of Orthopaedic Research
1989;7(1):86–90.
Lohman 1995 {published data only}
Lohman T, Going S, Pamenter R, Hall M, Boyden T,
Houtkooper L, et al.Effects of resistance training on regional
and total bone mineral density in premenopausal women: a
randomized prospective study. Journal of Bone and Mineral
Research 1995;10(7):1015–24.
Mayoux-Benhamou 1995 {published data only}
Mayoux-Benhamou MA, Rabourdin JP, Bagheri F, Roux C,
Revel M. Effet de l’exercice physique sur la densité osseuse
lombaire chez la femme ménopausée. Ann Readaptation
Med Phys 1995;38:117–124.
Nelson 1991 {published data only}
Nelson ME, Fisher EC, Dilmanian FA, Dallal GE, Evans
WJ. A 1-year walking program and increased dietary
calcium in postmenopausal women: effects on bone.
American Journal of Clinical Nutrition 1991;53(5):1304–11.
Notelovitz 1991 {published data only}
Notelovitz M, Martin D, Tesar R, Khan FY, Probart C,
Fields C, et al.Estrogen therapy and variable-resistance
weight training increase bone mineral in surgically
menopausal women. Journal of Bone and Mineral Research
1991;6(6):583–4.
Pruitt 1992 {published data only}
Pruitt LA, Jackson RD, Bartels RL, Lehnhard HL.
Weight-training effects on bone mineral density in early
postmenopausal women. Journal of Bone and Mineral
Research 1992;7(2):179–85.
Rikli 1990 {published data only}
Rikli RE, McManis BG. Effects of exercise on bone mineral
content in postmenopausal women. Research Quarterly for
Exercise and Sport 1990;61(3):243–9.
Ruan 2008 {published data only}
Ruan XY, Jin FY, Liu YL, Peng ZL, Sun YG. Effects
of vibration therapy on bone mineral density in
postmenopausal women with osteoporosis. Chinese Medical
Journal 2008;121(13):1155–8.
Shen 2009 {published data only}
Shen CL, Chyu MC, Yeh JK, Felton CK, Xu KT, Pence BC,
et al.Green tea polyphenols and Tai Chi for bone health:
designing a placebo-controlled randomized trial. BMC
Musculoskeletal Disorders 2009;10:110.
Snow 2000 {published data only}
Snow CM, Shaw JM, Winters KM, Witzke KA. Long-
term exercise using weighted vests prevents hip bone loss
in postmenopausal women. Journals of Gerontology - Series
A Biological Sciences and Medical Sciences 2000;55(9):
M489–91.
Song 2010 {published data only}
Song R, Roberts BL, Lee E, Lam P, Bae S. A randomized
study of the effects of t’ai chi on muscle strength, bone
mineral density, and fear of falling in women with
osteoarthritis. Journal of Alternative and Complementary
Medicine 2010;16(3):227–33.
Tolomio 2008 {published data only}
Tolomio S, Ermolao A, Travain G, Zacearia M. Short-term
adapted physical activity program improves bone quality in
osteopenic/osteoporotic postmenopausal women. Journal of
Physical Activity and Health 2008;5(6):844–53.
23Exercise for preventing and treating osteoporosis in postmenopausal women (Review)
Copyright © 2011 The Cochrane Collaboration. Published by John Wiley & Sons, Ltd.
Uusi-Rasi 2005 {published data only}
Uusi-Rasi K, Sievänen H, Heinonen A, Beck TJ, Vuori I.
Determinants of changes in bone mass and femoral neck
structure, and physical performance after menopause:
a 9-year follow-up of initially peri-menopausal women.
Osteoporosis International 2005;16(6):616–22.
Villareal 2003 {published data only}
Villareal DT, Binder EF, Yarasheski KE, Williams DB,
Brown M, Sinacore DR, et al.Effects of exercise training
added to ongoing hormone replacement therapy on bone
mineral density in frail elderly women. Journal of the
American Geriatrics Society 2003;51(7):985–90.
White 1984 {published data only}
White MK, Martin RB, Yeater RA, Butcher RL, Radin EL.
The effects of exercise on the bones of postmenopausal
women. International Orthopaedics 1984;7(4):209–214.
Xu 2004 {published data only}
Xu H, Lawson D, Kras A. A study on Tai Ji exercise and
traditional Chinese medical modalities in relation to bone
structure, bone function and menopausal symptoms.
Journal of Chinese Medicine 2004;74:10–14.
Yamazaki 2004 {published data only}
Yamazaki S, Ichimura S, Iwamoto J, Takeda T, Toyama
Y. Effect of walking exercise on bone metabolism in
postmenopausal women with osteopenia/osteoporosis.
Journal of Bone and Mineral Metabolism 2004;22(5):500–8.
References to studies awaiting assessment
Ilona 2010 {published data only}
Ilinca I, Avramescu T, Shaao M, Rosulescu E, Zavaleanu
M. The role of high - impact exercises in improve bone
mineral density in postmenopausal women with osteopenia
or osteoporosis. Journal of Physical Education and Sport
2010;27(2):110.
Karaarslan 2010 {published data only}
Karaarslan S, Buyukyazi G, Taneli F, Ulmans C, Tikiz
C, Gumuser G, et al.Effects of different intensity
resistance exercise programs on bone turnover markers,
osteoprotegerin and receptor activator of nuclear factor
kappa ligand in post-menopausal women. Turkiye Klinikleri
Journal of Medical Sciences 2010;30(1):123–34.
Kemmler 2004a {published data only}
Kemmler W, Von Stengel S, Beeskow C, Pintag R, Lauber
D, Weineck J, et al.Optimization of bone anabolic exercise
in early postmenopausal women according to results from
animal and athletic studies. Osteologie 2004;13(2):65–77.
References to ongoing studies
Wayne 2010 {published data only}
Wayne PM, Buring JE, Davis RB, Connors EM, Bonato P,
Patritti B, et al.Tai Chi for osteopenic women: design and
rationale of a pragmatic randomized controlled trial. BMC
Musculoskeletal Disorders 2010;11:40.
Additional references
Ammann 2003
Ammann P, Rizzoli R. Bone strength and its determinants.
Osteoporosis International 2003;14 Suppl 3:13–8.
Berard 1997
Berard A, Bravo G, Gauthier P. Meta-analysis of the
effectiveness of physical activity for the prevention of bone
loss in postmenopausal women. Osteoporosis International
1997;7(4):331–7.
Bessette 2008
Bessette L, Ste-Marie LG, Jean S, Davison KS, Beaulieu M,
Baranci M, et al.The care gap in diagnosis and treatment of
women with a fragility fracture. Osteoporosis International
2008;19(1):79–86.
Bonaiuti 2002
Bonaiuti D, Shea B, Lovine R, Negrini S, Welch V,
Kemper HHCG. Exercise for preventing and treating
osteoporosis in postmenopausal women. Cochrane Database
of Systematic Reviews 2002, Issue 3. [DOI: 10.1002/
14651858.CD000333]
Burge 2007
Burge R, Dawson-Hughes B, Solomon DH, Wong J B,
King A, Tosteson A. Incidence and Economic Burden of
Osteoporosis-Related Fractures in the United States, 2005-
2025. Journal of Bone and Mineral Research 2007;22(3):
465–475. [DOI: 10.1359/jbmr.061113]
CDC 1991
Consensus Development Conference. Propylaxis and
treatment of osteoporosis. Osteoporosis International 1991;
1:114–7.
Cooper 1993
Cooper C. The epidemiology of fragility fractures: is there a
role for bone quality?. Calcified Tissue International 1993;
53(Suppl 1):S23–6.
Cranney 2006
O’Donnell S, Cranney A, Wells GA, Adachi J, Reginster
JY. Strontium ranelate for preventing and treating
postmenopausal osteoporosis. Cochrane Database of
Systematic Reviews 2006, Issue 4. [DOI: 10.1002/
14651858.CD005326.pub3]
Cummings 1993
Cummings SR, Black DM, Nevitt MC, Browner W, Cauley
J, Ensrud K, et al.The Study of Osteoporotic Fractures
Research Group. Bone density at various sites for prediction
of hip fractures. Lancet 1993;341(8837):72–5.
Deeks 1998
Deeks J. Odds ratios should be used only in case-control
studies and logistic regression analysis (letter). BMJ 1998;
317:1115.
Deeks 2011
Deeks JJ, Higgins JPT, Altman DG (editors). Chapter 9:
Analysing data and undertaking meta-analyses. In: Higgins
JPT, Green S (editors). Cochrane Handbook for Systematic
Reviews of Interventions. Version 5.1.0 [updated March
24Exercise for preventing and treating osteoporosis in postmenopausal women (Review)
Copyright © 2011 The Cochrane Collaboration. Published by John Wiley & Sons, Ltd.
2011]. The Cochrane Collaboration, 2011.. Available from
www.cochrane-handbook.org.
Dickersin 1994
Dickersin K, Scherer R, Lefebvre C. Identifying relevant
studies for systematic reviews. BMJ 1994;309(6964):
1286–91.
Gillespie 2009
Gillespie LD, Robertson MC, Gillespie WJ, Lamb SE,
Gates S, Cumming RG, et al.Interventions for preventing
falls in older people living in the community. Cochrane
Database of Systematic Reviews 2009, Issue 2. [DOI:
10.1002/14651858.CD007146.pub2]
Haguenauer 2004
Haguenauer D, Shea B, Tugwell P, Wells GA, Welch
V. Fluoride for treating postmenopausal osteoporosis.
Cochrane Database of Systematic Reviews 2000, Issue 4.
[DOI: 10.1002/14651858.CD002825]
Haynes 1994
Haynes R, Wilczynski N, McKibbon KA, Walker CJ,
Sinclair JC. Developing optimal search strategies for
detecting clinically sound studies in MEDLINE. Journal of
the American Medical Informatics Association 1994;1:447–8.
Higgins 2011
Higgins JPT, Green S (editors). Cochrane Handbook
for Systematic Reviews of Interventions Version 5.1.0
[updated March 2011]. The Cochrane Collaboration,
2011. Available from www.cochrane-handbook.org.
Hind 2007
Hind K, Burrows M. Weight-bearing exercise and bone
mineral accrual in children and adolescents: a review of
controlled trials. Bone 2007;40(1):14–27. [PUBMED:
16956802]
Marshall 1996
Marshall D, Hans Wedel O. Meta-analysis of how well
measures of bone mineral density predict occurrence of
osteoporotic fractures. BMJ 1996;312(7041):1254–39.
Mayoux-Benhamou 1997
Mayoux-Benhamou MA, Bagheri F, Roux C, Auleley
GR, Rabourdin JP, Revel M. Effect of Ppsoas training on
postmenopausal lumbar bone loss: a 3-year follow-up study.
Calcified Tissue International 1997;60(4):348–53.
Nikander 2010
Nikander R, Sievänen H, Heinonen A, Daly RM, Uusi-
Rasi K, Kannus P. Targeted exercise against osteoporosis: A
systematic review and meta-analysis for optimising bone
strength throughout life. BMC Medicine 2010;8:47. [DOI:
10.1186/1741-7015-8-47]
Papaioannou 2010
Papaioannou A, Morin S, Cheung A, Atkinson S, Brown
JP, Feldman S, et al.2010 clinical practice guidelines for
the diagnosis and management of osteoporosis in Canada:
summary. Canadian Medical Association Journal 2010;182
(17):1829–30. [DOI: 10.1503/cmaj.100771]
RevMan 2011
The Nordic Cochrane Centre, The Cochrane Collaboration.
Review Manager (RevMan).. 5.1. Copenhagen: The
Nordic Cochrane Centre, The Cochrane Collaboration,
2011.
Robling 2002
Robling AG, Hinant FM, Burr DB, Turner CH. Shorter,
more frequent mechanical loading sessions enhance bone
mass. Medicine and Science in Sports and Exercise 2002;34
(2):196–201.
Schmitt 2009
Schmitt NM, Schmitt J, Dören M. The role of physical
activity in the prevention of osteoporosis in postmenopausal
women-An update. Maturitas 2009;63(1):34–8.
Schünemann 2011
Schünemann HJ, Oxman AD, Higgins JPT, Vist GE,
Glasziou P, Guyatt GH. Chapter 11: Presenting results
and ’Summary of findings’ tables In: Higgins JPT, Green
S (editors). Cochrane Handbook for Systematic Reviews
of Interventions. Version 5.1.0 [updated March 2011].
The Cochrane Collaboration, 2011. Available from
www.cochrane-handbook.org.
Taaffe 1997
Taaffe DR, Robinson TL, Snow CM, Marcus R. High-
impact exercise promotes bone gain in well-trained female
athletes. Journal of Bone and Mineral Research 1997;12(2):
255–60. [DOI: 10.1359/jbmr.1997.12.2.255]
Wayne 2007
Wayne PM, Kiel DP, Krebs DE, Davis RB, Savetsky-
German J, Connelly M, et al.The effects of Tai Chi on bone
mineral density in postmenopausal women: A systematic
review. Archives of Physical Medicine and Rehabilitation
2007;88(5):673–80.
Wells 2008a
Wells GA, Cranney A, Peterson J, Boucher M, Shea B,
Welch V, et al.Alendronate for the primary and secondary
prevention of osteoporotic fractures in postmenopausal
women. Cochrane Database of Systematic Reviews 2008,
Issue 1. [DOI: 10.1002/14651858.CD001155.pub2]
Wells 2008b
Wells GA, Cranney A, Peterson J, Boucher M, Shea B,
Welch V, et al.Etidronate for the primary and secondary
prevention of osteoporotic fractures in postmenopausal
women. Cochrane Database of Systematic Reviews 2008,
Issue 1. [DOI: 10.1002/14651858.CD003376.pub3]
Wells 2008c
Wells GA, Cranney A, Peterson J, Boucher M, Shea B,
Welch V, et al.Risedronate for the primary and secondary
prevention of osteoporotic fractures in postmenopausal
women. Cochrane Database of Systematic Reviews 2008,
Issue 1. [DOI: 10.1002/14651858.CD004523.pub3]
WHO 1994
Report of a WHO Study Group. Assessment of fracture
risk and its application to screening for postmenopausal
25Exercise for preventing and treating osteoporosis in postmenopausal women (Review)
Copyright © 2011 The Cochrane Collaboration. Published by John Wiley & Sons, Ltd.
osteoporosis. World Health Organization Technical Report
Series 1994;843:1–129.
WHO 2003
World Health Organisation. Adherence to long term
therapies: evidence for action. World Health Organisation,
Geneva, Switzerland 2003:3–4.
Winett 2001
Winett RA, Carpinelli RN. Potential health related benefits
of resistance training. Preventative Medicine 2001;33:
503–13. [DOI: 10.1006/pmed.2001.0909]
Wolff 1999
Wolff I, Van Croonenborg JJ, Kemper HC, Kostense PJ,
Twisk JW. The effect of exercise training programs on bone
mass: a meta-analysis of published controlled trials in pre-
and postmenopausal women. Osteoporosis International
1999;9(1):1–12.
Zebaze 2010
Zebaze R, Ghasem-Zadeh A, Bohte A, Iuliano-Burns S,
Mirams M, Price RI, Mackie EJ, Seeman E. Intracortical
remodelling and porosity in the distal radius and post-
mortem femurs of women: a cross-sectional study. The
Lancet 2010;375(9727):1729–36. [DOI: 10.1016/
S0140-6736(10)60320-0.]
Zerwekh 1998
Zerwekh JE, Ruml LA, Gottschalk F, Pak CYC. The effects
of twelve eeks of bed rest on bone histology, biochemical
markers of bone turnover, and calcium homeostasis in
eleven normal subjects. Journal of Bone and Mineral
Research 1998;13(10):1594-1601. [DOI: 10.1359/
jbmr.1998.13.10.1594]∗ Indicates the major publication for the study
26Exercise for preventing and treating osteoporosis in postmenopausal women (Review)
Copyright © 2011 The Cochrane Collaboration. Published by John Wiley & Sons, Ltd.
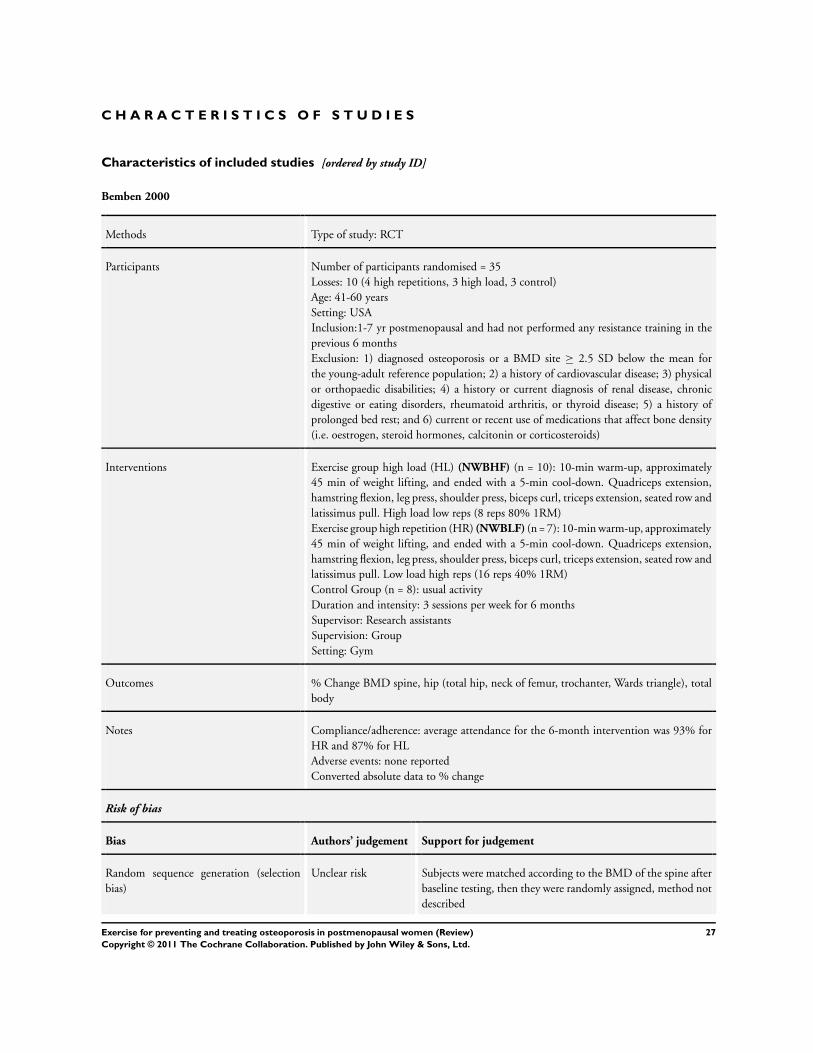
C H A R A C T E R I S T I C S O F S T U D I E S
Characteristics of included studies [ordered by study ID]
Bemben 2000
Methods Type of study: RCT
Participants Number of participants randomised = 35
Losses: 10 (4 high repetitions, 3 high load, 3 control)
Age: 41-60 years
Setting: USA
Inclusion:1-7 yr postmenopausal and had not performed any resistance training in the
previous 6 months
Exclusion: 1) diagnosed osteoporosis or a BMD site ≥ 2.5 SD below the mean for
the young-adult reference population; 2) a history of cardiovascular disease; 3) physical
or orthopaedic disabilities; 4) a history or current diagnosis of renal disease, chronic
digestive or eating disorders, rheumatoid arthritis, or thyroid disease; 5) a history of
prolonged bed rest; and 6) current or recent use of medications that affect bone density
(i.e. oestrogen, steroid hormones, calcitonin or corticosteroids)
Interventions Exercise group high load (HL) (NWBHF) (n = 10): 10-min warm-up, approximately
45 min of weight lifting, and ended with a 5-min cool-down. Quadriceps extension,
hamstring flexion, leg press, shoulder press, biceps curl, triceps extension, seated row and
latissimus pull. High load low reps (8 reps 80% 1RM)
Exercise group high repetition (HR) (NWBLF) (n = 7): 10-min warm-up, approximately
45 min of weight lifting, and ended with a 5-min cool-down. Quadriceps extension,
hamstring flexion, leg press, shoulder press, biceps curl, triceps extension, seated row and
latissimus pull. Low load high reps (16 reps 40% 1RM)
Control Group (n = 8): usual activity
Duration and intensity: 3 sessions per week for 6 months
Supervisor: Research assistants
Supervision: Group
Setting: Gym
Outcomes % Change BMD spine, hip (total hip, neck of femur, trochanter, Wards triangle), total
body
Notes Compliance/adherence: average attendance for the 6-month intervention was 93% for
HR and 87% for HL
Adverse events: none reported
Converted absolute data to % change
Risk of bias
Bias Authors’ judgement Support for judgement
Random sequence generation (selection
bias)
Unclear risk Subjects were matched according to the BMD of the spine after
baseline testing, then they were randomly assigned, method not
described
27Exercise for preventing and treating osteoporosis in postmenopausal women (Review)
Copyright © 2011 The Cochrane Collaboration. Published by John Wiley & Sons, Ltd.
Bemben 2000 (Continued)
Allocation concealment (selection bias) Unclear risk Insufficient information to permit judgement of ’high risk’ or
’low risk’
Incomplete outcome data (attrition bias)
All outcomes
High risk ’As-treated’ analysis done, drop-outs mentioned but not ac-
counted for in analysis
Selective reporting (reporting bias) Unclear risk Insufficient information to permit judgement of ’high risk’ or
’low risk’
Other bias Low risk The study appears to be free of other sources of bias
Blinding (participant) High risk Not possible
Blinding (assessor) Unclear risk Not reported
Comparability of exercise and control
group at entry
Low risk No significant group differences existed in number of years post-
menopausal or in body composition variables
Appropriateness of duration of surveillance High risk Only immediately postintervention data at 6 months, no follow-
up data reported
Bergstrom 2008
Methods Type of study: RCT
Participants Number of participants randomised = 112
Losses: 20 (Exercise: 1 failed to attend DXA, 11 did not start training or trained less
than 6 months, Control: 8 undertook other exercise)
Age: 59.6 Exercise, 58.9 control
Setting: Sweden
Inclusion: postmenopausal women 45 to 65 years with forearm fractures and T-scores
from −1.0 to −3.0 (total hip or spine)
Exclusion: T-score lower than −3 at any site, had any disease known to interfere with
bone metabolism, were on cortisone therapy or anti-resorptive medication, including
hormone replacement therapy, had a BMI lower than 19.9 or higher than 30.9, or were
already training at the level of or above that of the intervention
Interventions Exercise group (COMB) (n = 48): 3 fast 30-minute, walks and two sessions of one-
hour training per week. 5-minute warm-up, 25 minutes of strengthening exercises for
the arms, legs, back and stomach, 25 minutes of aerobic exercise, and 5 minutes of
stretching. Individuals chose own level and intensity and encouraged to increase level if
possible
Control Group (n = 44): usual activity
Duration and intensity: 5 sessions per week for 12 months
Supervisor: nurses
Supervision: group
Setting: clinic
28Exercise for preventing and treating osteoporosis in postmenopausal women (Review)
Copyright © 2011 The Cochrane Collaboration. Published by John Wiley & Sons, Ltd.
Bergstrom 2008 (Continued)
Outcomes % change BMD DEXA spine, total hip
Notes Compliance/adherence: controlled by study nurse (compliance was 95%)
Adverse events: none reported
80% power difference, 3% with 64 in each group
Converted absolute data to % change
Risk of bias
Bias Authors’ judgement Support for judgement
Random sequence generation (selection
bias)
Low risk Predefined random number table
Allocation concealment (selection bias) Unclear risk Insufficient information to permit judgement of ’high risk’ or
’low risk’
Incomplete outcome data (attrition bias)
All outcomes
Low risk Per protocol and intention-to-treat analysis
Selective reporting (reporting bias) Unclear risk Insufficient information to permit judgement of ’high risk’ or
’low risk’
Other bias Low risk The study appears to be free of other sources of bias
Blinding (participant) High risk Not possible
Blinding (assessor) Unclear risk Not reported
Comparability of exercise and control
group at entry
Unclear risk Insufficient information to permit judgement of ’high risk’ or
’low risk’
Appropriateness of duration of surveillance High risk Only immediately postintervention data at 1 year, no follow-up
data reported
Bocalini 2009
Methods Type of study: RCT
Participants Number of participants randomised = 35
Losses: 10 (3 exercise, 2 control, plus 5 in exercise did not achieve 90% participation)
Age: range 57-75 years
Setting: Brazil
Inclusion: women older than 55 years (and able to train 3 x per week for 24 weeks)
Exclusion: participation in a regular and structured physical activity for the last 3 months;
recent hospitalisation; motor deficiency; symptomatic cardiorespiratory disease; non con-
trolled hypertension or metabolic syndrome; severe renal or hepatic disease; cognitive
29Exercise for preventing and treating osteoporosis in postmenopausal women (Review)
Copyright © 2011 The Cochrane Collaboration. Published by John Wiley & Sons, Ltd.
Bocalini 2009 (Continued)
impairment or debilitating conditions; marked obesity with inability to exercise; recent
bone fracture (during the past 2 years); use of any medication that may alter calcium or
bone metabolism; other medical contraindications to exercise
Interventions Exercise group strength training (NWBHF) (n = 15): Eccentric muscle action was em-
phasised for leg press, chest press, leg curl, latissimus pull down, elbow flexion, elbow
extension, leg extension, upper back row, military press, hip abductor, hip adductor and
abdominal curls. 10-minute warm-up, (running with low impact at 50% MHR), one
set 50% 1 RM, progressing to 3 sets 85% 1 RM
Control Group (n = 10): usual activity
Duration and intensity: 1 hr sessions 3 x per week in non-consecutive days for 24 weeks
Supervisor: fitness instructor and researchers
Supervision: probably group
Setting: gym
Outcomes % change BMD DEXA lumbar spine, femoral neck
Notes Compliance/adherence: all completers required to participate in 90% of programme
Adverse events: none reported
Converted SE to SD
Risk of bias
Bias Authors’ judgement Support for judgement
Random sequence generation (selection
bias)
Unclear risk Randomisation mentioned but insufficient information to per-
mit judgement of ’high risk’ or ’low risk’
Allocation concealment (selection bias) Unclear risk Insufficient information to permit judgement of ’high risk’ or
’low risk’
Incomplete outcome data (attrition bias)
All outcomes
Unclear risk ’As-treated’ analysis done, drop outs mentioned and 5 in exercise
group did not achieve 90% participation, thus were excluded
Selective reporting (reporting bias) Unclear risk Insufficient information to permit judgement of ’high risk’ or
’low risk’
Other bias Low risk The study appears to be free of other sources of bias
Blinding (participant) High risk Participants not blinded
Blinding (assessor) Low risk Investigator blind to subject condition
Comparability of exercise and control
group at entry
Low risk No differences were identified between groups, concerning bio-
metric characteristics, muscle strength or bone densitometry pa-
rameters
30Exercise for preventing and treating osteoporosis in postmenopausal women (Review)
Copyright © 2011 The Cochrane Collaboration. Published by John Wiley & Sons, Ltd.
Bocalini 2009 (Continued)
Appropriateness of duration of surveillance High risk Outcomes only on immediately postintervention (24 weeks), no
follow-up data reported
Bravo 1996
Methods RCT
Participants Number of participants randomised = 142
Losses: 18 (equally divided across groups)
Age: mean 60±6 years
Setting: Canada
Inclusion: menopausal (> 12 months) community-dwelling women between the ages
of 50 and 70, with low bone mass (spine > 1g/cm2, proximal femur >0.9g/cm2), no
contradictions to undertaking physical exercise without supervision
Exclusion: not stated
Interventions Exercise group (DWBLF) (n = 61): warm up, 25 min of rapid walking: 15 min of
stepping down and up or aerobic dancing, each had to progressively reach 60-70% of her
heart rate reserve, localised exercise: 10-15 min of exercises in sitting, standing, prone
position, involving the muscles of upper limbs, abdominals and the back, cool down
period with relaxation movements, stretching, balancing and coordination exercises
Control group (n = 63): to continue their daily routine activities plus education
Duration and intensity: 1 hour long exercise classes, 3/week per 12 months
Supervisor: exercise leaders
Supervision: group
Setting: gym
Outcomes BMD spine, BMD neck of femur
Notes Compliance/adherence: not reported
Adverse events: none reported
Converted absolute data to % change.
Risk of bias
Bias Authors’ judgement Support for judgement
Random sequence generation (selection
bias)
Low risk Random number tables, block randomisation and stratified by
age and HRT use
Allocation concealment (selection bias) Unclear risk Insufficient information to permit judgement of ’high risk’ or
’low risk’
Incomplete outcome data (attrition bias)
All outcomes
Low risk Missing outcome data balanced in numbers across intervention
groups, with similar reasons for missing data across groups In-
tention-to-treat analysis performed
31Exercise for preventing and treating osteoporosis in postmenopausal women (Review)
Copyright © 2011 The Cochrane Collaboration. Published by John Wiley & Sons, Ltd.
Bravo 1996 (Continued)
Selective reporting (reporting bias) Unclear risk Insufficient information to permit judgement of ’high risk’ or
’low risk’
Other bias Low risk The study appears to be free of other sources of bias
Blinding (participant) Unclear risk Insufficient information to permit judgement of ’high risk’ or
’low risk’ but exercise is difficult to blind
Blinding (assessor) Low risk Three assessors blind to group allocation
Comparability of exercise and control
group at entry
Low risk No significant differences between groups apart from years post-
menopause (longer in control group) and use of oestrogen (more
in exercise group)
Appropriateness of duration of surveillance High risk Only immediately postintervention data at 12 months, no fol-
low-up data reported
Brentano 2008
Methods Type of study: RCT
Participants Number of participants randomised = 28
Losses: not stated
Age: not stated
Setting: Brazil
Inclusion: not stated
Exclusion: not stated
Interventions Exercise group Circuit training (NWBLF) (n = 9): No rest between exercises; progression
of loads. Warm-up: 5 minutes cycloergometer or treadmill, 20-10 repetitions and 45-
60% 1RM, performing 2-3 sets for each exercise, leg press, hip abduction, hip adduction,
knee extension, chest fly, reverse fly, arm curl, triceps push-down, sit-ups and back
extension
Exrcise group High intensity (NWBHF) (n = 10): 2 min rest between exercises; pro-
gression of loads. Warm-up: 5 minutes cycloergometer or treadmill. 20-6 repetitions
and 45-80% 1RM, performing 2-4 sets for each exercise, leg press, hip abduction, hip
adduction, knee extension, chest fly, reverse fly, arm curl, triceps push-down, sit-ups and
back extension
Control Group (n = 9): usual activity
Duration and intensity: 1 hr 3 x week for 24 weeks
Supervisor: not stated
Supervision: group
Setting: gym
Outcomes BMD femoral neck, femoral trochanter, Ward’s triangle, intertrochanter
32Exercise for preventing and treating osteoporosis in postmenopausal women (Review)
Copyright © 2011 The Cochrane Collaboration. Published by John Wiley & Sons, Ltd.
Brentano 2008 (Continued)
Notes Compliance/adherence: not stated
Adverse events: none reported
Data presented graphically only
Risk of bias
Bias Authors’ judgement Support for judgement
Random sequence generation (selection
bias)
Unclear risk Subjects were divided into 2 subgroups: taking HRT (n = 14) and
not taking HRT (n = 14). Then, the subgroups were randomly
divided but insufficient information to permit judgement of
’high risk’ or ’low risk’
Allocation concealment (selection bias) Unclear risk Insufficient information to permit judgement of ’high risk’ or
’low risk’
Incomplete outcome data (attrition bias)
All outcomes
Unclear risk Insufficient information to permit judgement of ’high risk’ or
’low risk’
Selective reporting (reporting bias) Unclear risk Insufficient information to permit judgement of ’high risk’ or
’low risk’
Other bias Low risk The study appears to be free of other sources of bias
Blinding (participant) Unclear risk Not possible
Blinding (assessor) Unclear risk Insufficient information to permit judgement of ’high risk’ or
’low risk’
Comparability of exercise and control
group at entry
Unclear risk Insufficient information to permit judgement of ’high risk’ or
’low risk’
Appropriateness of duration of surveillance High risk Only immediately postintervention data, no follow-up data re-
ported
Chan 2004
Methods Type of study: RCT
Participants Number of participants randomised = 132
Losses: 24 (13 Exercise, 11 control)
Age: 54 (±3.5) years
Setting: Hong Kong
Inclusion: ceased menstruation between 1 and 10 years (1) no regular participation in
physical exercise (not > 0.5h/wk); (2) no hormone replacement therapy or drug treatment
known to affect bone metabolism or cause spontaneous bone loss; (3) no conditions
such as hypo- or hyperparathyroidism and hypo- or hyperthyroidism, or renal or liver
disease; (4) no history of fractures; and (5) a body mass index (BMI) above 30kg/m2
33Exercise for preventing and treating osteoporosis in postmenopausal women (Review)
Copyright © 2011 The Cochrane Collaboration. Published by John Wiley & Sons, Ltd.
Chan 2004 (Continued)
Exclusion:
Interventions Exercise group (DWBLF) (n = 67): Yang Tau Chi Chuan style emphasises slow and
smooth movement involving major muscle groups, at a constant speed while practicing
Control Group (n = 65): usual activity
Duration and intensity: 50 mins 5x week for 12 months
Supervisor: not reported
Supervision: group
Setting: community
Outcomes % change BMD DXA lumbar spine, neck of femur, total hip, trochanter, distal tibia
Fracture rate
Notes Compliance/adherence: Average attendance rate of the TCC exercise was 4.2±0.9 days
per week
Adverse events: Fractures occurred during the follow-up. During the 12-month study
period, a total of 4 fracture cases were documented, including 3 fracture in the control
group (1 vertebral fracture, 1 Colles’ fractures, 1 fracture at the fifth metacarpal) and 1
in the TCC group (proximal fibular fracture). All injury cases resulted from overloading
during work (the case with vertebral fracture) or falls (the other 3 cases)
Sample size of 45 for each group was estimated to achieve a statistical power of 0.8 after
excluding a dropout rate of approximately 25% during 12-month follow-up
Converted absolute data to % change
Risk of bias
Bias Authors’ judgement Support for judgement
Random sequence generation (selection
bias)
Unclear risk Randomisation mentioned but insufficient information to per-
mit judgement of ’high risk’ or ’low risk’
Allocation concealment (selection bias) Unclear risk Insufficient information to permit judgement of ’high risk’ or
’low risk’
Incomplete outcome data (attrition bias)
All outcomes
Unclear risk ’As-treated’ analysis done drop-outs mentioned
Selective reporting (reporting bias) Unclear risk Insufficient information to permit judgement of ’high risk’ or
’low risk’
Other bias Low risk The study appears to be free of other sources of bias
Blinding (participant) High risk Not possible
Blinding (assessor) Unclear risk Not reported
Comparability of exercise and control
group at entry
Low risk No significant differences in characteristics at baseline
34Exercise for preventing and treating osteoporosis in postmenopausal women (Review)
Copyright © 2011 The Cochrane Collaboration. Published by John Wiley & Sons, Ltd.
Chan 2004 (Continued)
Appropriateness of duration of surveillance High risk Only immediately postintervention data 12 months, no follow-
up data reported
Cheng 2002
Methods Type of study: RCT
Participants Number of participants randomised = 80
Losses: 28 (non HRT 8 exercise, 5 control; HRT 10 exercise, 5 control)
Age: 50-57 years
Setting: Finland
Inclusion: 50 -55-year-old women, no serious cardiovascular or locomotor system prob-
lems, a body mass index of 33 kg/m2, and not currently or previously (no longer than 6
months and at least 2 years prior to screening) using medications including oestrogen,
fluoride, calcitonin, bisphosphonate’s, and steroids, last menstruation at least 0.5 years
but not more than 5 years ago
Exclusion: not reported
Interventions No HRT Exercise group (DWBHF) (n = 20): 5 circuit-training periods, each lasting 8
-10 weeks. These periods were interrupted by three high-impact aerobic dance periods,
each of 2 week duration, and a summer pause for 5 weeks. Each session commenced
with a 10 min warm-up period and concluded with stretching activities. During the
first two circuit training periods, three rotations were performed of skipping (30 sec)
, bounding over soft hurdles (13-16 cm), drop jumping (10-15 cm), and hopping (on
one leg 10 times, added during the second training period). The following three periods
comprised four rotations of bounding (19-25 cm), drop jumping (20-25 cm), hopping
(10 times per leg) and leaping (10 times). In addition, all circuit training sessions included
3 or 4 of the following resistance exercises for the upper body: chest fly, latissimus pull
down, military press, seated row and biceps curl. The home exercise programme was
also designed as a circuit training routine comprising three rotations of skipping (30
sec), hopping (10 times per leg) and drop jumping (15 cm). In addition, exercises to
strengthen the abdominal and lower back region were included. Average GRF was 4.3
times body weight (BW) for drop-landing from a 10 cm height, and 5.2 times BW from
20 and 25 cm heights; bounding over the hurdles 4.9-5.1 BW, skipping, hopping, and
leaping 3.8, 3.4, and 4.8 BW, respectively
No HRT Control Group (n = 20): usual activity
HRT Exercise group (DWBHF) (n = 20): as exercise group above
HRT Control Group (n = 20): usual activity
Duration and intensity: 2 x supervised and 4 non supervised sessions per week 12 months
Supervisor: not stated
Supervision: group/individual
Setting: gym/home
Outcomes BMD DXA proximal femur, tibial shaft
Cortical tibia
35Exercise for preventing and treating osteoporosis in postmenopausal women (Review)
Copyright © 2011 The Cochrane Collaboration. Published by John Wiley & Sons, Ltd.
Cheng 2002 (Continued)
Notes Compliance/adherence: average attendance 1 x per week
Adverse events: none reported
Converted absolute data to % change
Risk of bias
Bias Authors’ judgement Support for judgement
Random sequence generation (selection
bias)
Low risk Randomisation by drawing lots
Allocation concealment (selection bias) Unclear risk Insufficient information to permit judgement of ’high risk’ or
’low risk’
Incomplete outcome data (attrition bias)
All outcomes
Unclear risk ’As-treated’ analysis done drop-outs mentioned but not con-
trolled for
Selective reporting (reporting bias) Unclear risk Insufficient information to permit judgement of ’high risk’ or
’low risk’
Other bias Low risk The study appears to be free of other sources of bias
Blinding (participant) Unclear risk Stated double-blind (may be related to the HRT component)
but insufficient information to permit judgement of ’high risk’
or ’low risk’
Blinding (assessor) Unclear risk Stated double-blind (may be related to the HRT component)
but insufficient information to permit judgement of ’high risk’
or ’low risk’
Comparability of exercise and control
group at entry
Low risk No significant differences in physical characteristics at baseline
Appropriateness of duration of surveillance High risk Only immediately postintervention data at 12 months, no fol-
low-up data reported
Chilibeck 2002
Methods Type of study: RCT
Participants Number of participants randomised = 57
Losses: 9 (4 non bisphosphonate exercise, 3 bisphosphonate exercise, 2 non bisphospho-
nate control)
Age: mean age of groups ranged from 55.9 to 58.8 years
Setting: Canada
Inclusion: postmenopausal status (cessation of bleeding status for one year)
Exclusion: skeletal; disorders, kidney disease or bone related disorders, chronic disease or
chronic medication likely to affect metabolism or calcium imbalance. BMD z-score < -2.
36Exercise for preventing and treating osteoporosis in postmenopausal women (Review)
Copyright © 2011 The Cochrane Collaboration. Published by John Wiley & Sons, Ltd.
Chilibeck 2002 (Continued)
0, HRT, bisphosphonate therapy in last year, recent participation in exercise programmes,
history of cardiac disease or high blood pressure
Interventions All received 10 µg vitamin D/d and those in non bisphosphonate received 500 mg
calcium carbonate/d
Non bisphosphonate exercise group (NWBHF) (n = 10): warm up cycling and stretching,
2 sets 8-10 reps of; bench press, latissimus dorsi pull down, shoulder press, biceps curl,
back extension, hip extension, flexion, adduction and abduction, knee flexion, knee
extension and leg press. initially 70% 1RM then progressed
Non bisphosphonate control Group (n = 12): usual activity
Bisphosphonate exercise group (NWBHF) (n = 12): as above
Bisphosphonate control group (n = 14): usual activity
Duration and intensity: 3 days per week for 12 months
Supervisor: not stated
Supervision: individual
Setting: gym
Outcomes % change BMD spine, total hip, femoral neck, trochanter, Ward’s triangle, whole body
% change whole body BMC
Notes Compliance/adherence: Non bisphosphonate exercise group 77.6%, bisphosphonate
exercise group 74.8% of training sessions
Adverse events: none reported
9 subjects per group would demonstrate change α of 0.05 with 80% power
Converted SE to SD
Risk of bias
Bias Authors’ judgement Support for judgement
Random sequence generation (selection
bias)
Unclear risk Randomisation mentioned but insufficient information to per-
mit judgement of ’high risk’ or ’low risk’
Allocation concealment (selection bias) Low risk Insufficient information although mentions double-blind
Incomplete outcome data (attrition bias)
All outcomes
Unclear risk ’As-treated’ analysis done drop-outs mentioned but not con-
trolled for
Selective reporting (reporting bias) Unclear risk Insufficient information to permit judgement of ’high risk’ or
’low risk’
Other bias Low risk The study appears to be free of other sources of bias
Blinding (participant) Unclear risk Mentions double-blind but probably relates to medication status
Blinding (assessor) Low risk States double-blind
37Exercise for preventing and treating osteoporosis in postmenopausal women (Review)
Copyright © 2011 The Cochrane Collaboration. Published by John Wiley & Sons, Ltd.
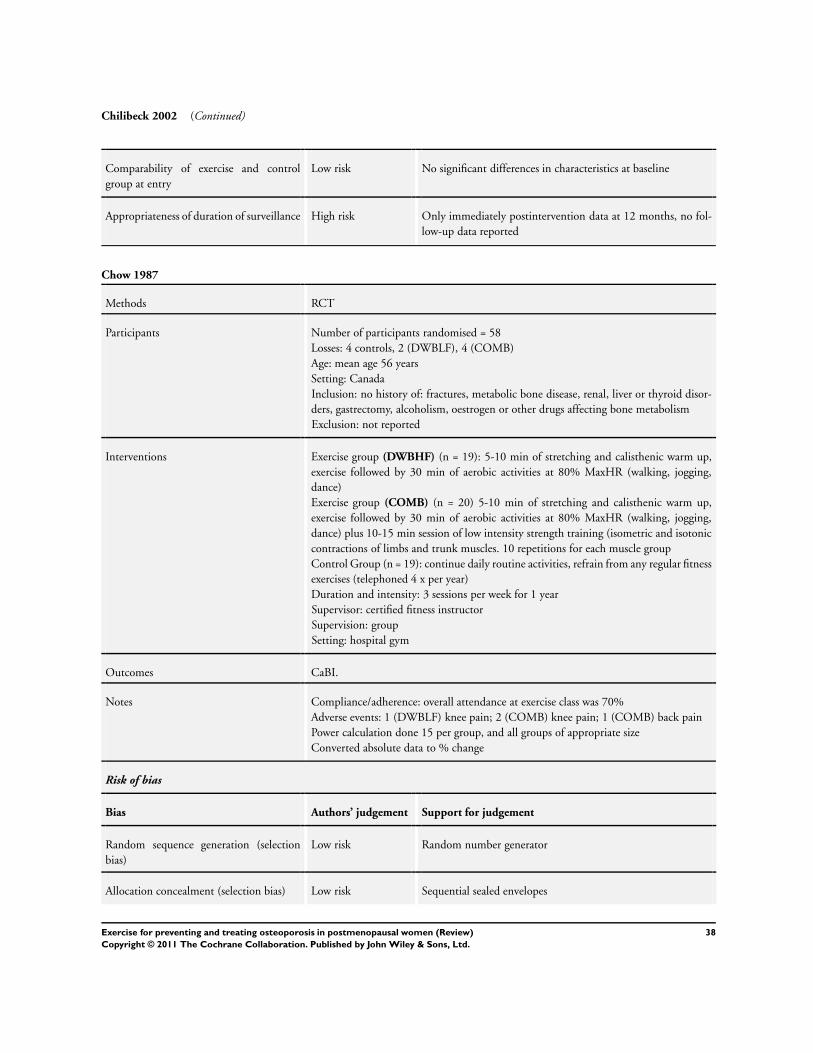
Chilibeck 2002 (Continued)
Comparability of exercise and control
group at entry
Low risk No significant differences in characteristics at baseline
Appropriateness of duration of surveillance High risk Only immediately postintervention data at 12 months, no fol-
low-up data reported
Chow 1987
Methods RCT
Participants Number of participants randomised = 58
Losses: 4 controls, 2 (DWBLF), 4 (COMB)
Age: mean age 56 years
Setting: Canada
Inclusion: no history of: fractures, metabolic bone disease, renal, liver or thyroid disor-
ders, gastrectomy, alcoholism, oestrogen or other drugs affecting bone metabolism
Exclusion: not reported
Interventions Exercise group (DWBHF) (n = 19): 5-10 min of stretching and calisthenic warm up,
exercise followed by 30 min of aerobic activities at 80% MaxHR (walking, jogging,
dance)
Exercise group (COMB) (n = 20) 5-10 min of stretching and calisthenic warm up,
exercise followed by 30 min of aerobic activities at 80% MaxHR (walking, jogging,
dance) plus 10-15 min session of low intensity strength training (isometric and isotonic
contractions of limbs and trunk muscles. 10 repetitions for each muscle group
Control Group (n = 19): continue daily routine activities, refrain from any regular fitness
exercises (telephoned 4 x per year)
Duration and intensity: 3 sessions per week for 1 year
Supervisor: certified fitness instructor
Supervision: group
Setting: hospital gym
Outcomes CaBI.
Notes Compliance/adherence: overall attendance at exercise class was 70%
Adverse events: 1 (DWBLF) knee pain; 2 (COMB) knee pain; 1 (COMB) back pain
Power calculation done 15 per group, and all groups of appropriate size
Converted absolute data to % change
Risk of bias
Bias Authors’ judgement Support for judgement
Random sequence generation (selection
bias)
Low risk Random number generator
Allocation concealment (selection bias) Low risk Sequential sealed envelopes
38Exercise for preventing and treating osteoporosis in postmenopausal women (Review)
Copyright © 2011 The Cochrane Collaboration. Published by John Wiley & Sons, Ltd.
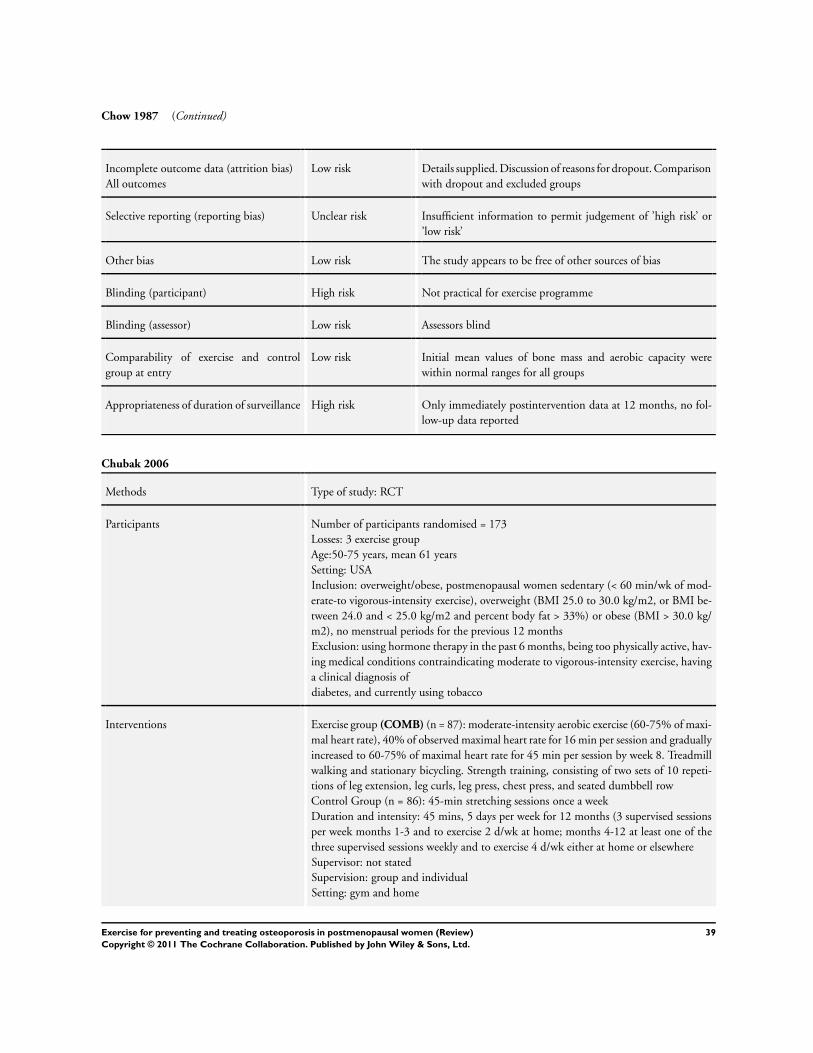
Chow 1987 (Continued)
Incomplete outcome data (attrition bias)
All outcomes
Low risk Details supplied. Discussion of reasons for dropout. Comparison
with dropout and excluded groups
Selective reporting (reporting bias) Unclear risk Insufficient information to permit judgement of ’high risk’ or
’low risk’
Other bias Low risk The study appears to be free of other sources of bias
Blinding (participant) High risk Not practical for exercise programme
Blinding (assessor) Low risk Assessors blind
Comparability of exercise and control
group at entry
Low risk Initial mean values of bone mass and aerobic capacity were
within normal ranges for all groups
Appropriateness of duration of surveillance High risk Only immediately postintervention data at 12 months, no fol-
low-up data reported
Chubak 2006
Methods Type of study: RCT
Participants Number of participants randomised = 173
Losses: 3 exercise group
Age:50-75 years, mean 61 years
Setting: USA
Inclusion: overweight/obese, postmenopausal women sedentary (< 60 min/wk of mod-
erate-to vigorous-intensity exercise), overweight (BMI 25.0 to 30.0 kg/m2, or BMI be-
tween 24.0 and < 25.0 kg/m2 and percent body fat > 33%) or obese (BMI > 30.0 kg/
m2), no menstrual periods for the previous 12 months
Exclusion: using hormone therapy in the past 6 months, being too physically active, hav-
ing medical conditions contraindicating moderate to vigorous-intensity exercise, having
a clinical diagnosis of
diabetes, and currently using tobacco
Interventions Exercise group (COMB) (n = 87): moderate-intensity aerobic exercise (60-75% of maxi-
mal heart rate), 40% of observed maximal heart rate for 16 min per session and gradually
increased to 60-75% of maximal heart rate for 45 min per session by week 8. Treadmill
walking and stationary bicycling. Strength training, consisting of two sets of 10 repeti-
tions of leg extension, leg curls, leg press, chest press, and seated dumbbell row
Control Group (n = 86): 45-min stretching sessions once a week
Duration and intensity: 45 mins, 5 days per week for 12 months (3 supervised sessions
per week months 1-3 and to exercise 2 d/wk at home; months 4-12 at least one of the
three supervised sessions weekly and to exercise 4 d/wk either at home or elsewhere
Supervisor: not stated
Supervision: group and individual
Setting: gym and home
39Exercise for preventing and treating osteoporosis in postmenopausal women (Review)
Copyright © 2011 The Cochrane Collaboration. Published by John Wiley & Sons, Ltd.
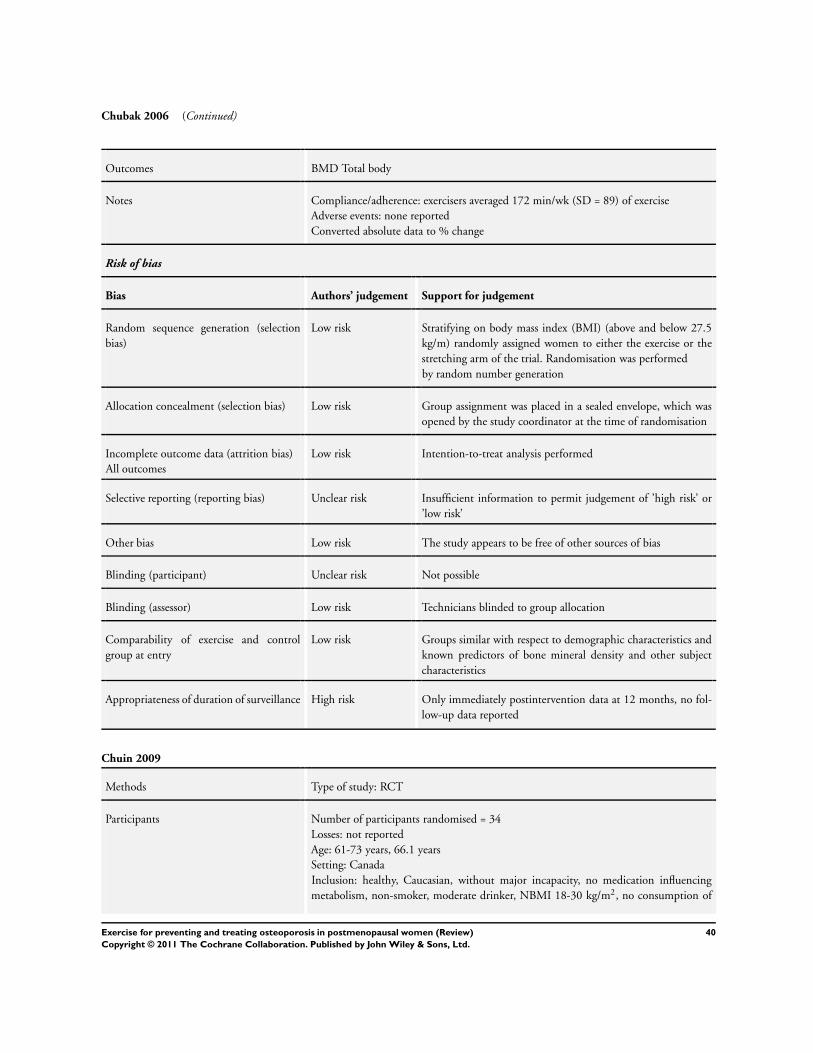
Chubak 2006 (Continued)
Outcomes BMD Total body
Notes Compliance/adherence: exercisers averaged 172 min/wk (SD = 89) of exercise
Adverse events: none reported
Converted absolute data to % change
Risk of bias
Bias Authors’ judgement Support for judgement
Random sequence generation (selection
bias)
Low risk Stratifying on body mass index (BMI) (above and below 27.5
kg/m) randomly assigned women to either the exercise or the
stretching arm of the trial. Randomisation was performed
by random number generation
Allocation concealment (selection bias) Low risk Group assignment was placed in a sealed envelope, which was
opened by the study coordinator at the time of randomisation
Incomplete outcome data (attrition bias)
All outcomes
Low risk Intention-to-treat analysis performed
Selective reporting (reporting bias) Unclear risk Insufficient information to permit judgement of ’high risk’ or
’low risk’
Other bias Low risk The study appears to be free of other sources of bias
Blinding (participant) Unclear risk Not possible
Blinding (assessor) Low risk Technicians blinded to group allocation
Comparability of exercise and control
group at entry
Low risk Groups similar with respect to demographic characteristics and
known predictors of bone mineral density and other subject
characteristics
Appropriateness of duration of surveillance High risk Only immediately postintervention data at 12 months, no fol-
low-up data reported
Chuin 2009
Methods Type of study: RCT
Participants Number of participants randomised = 34
Losses: not reported
Age: 61-73 years, 66.1 years
Setting: Canada
Inclusion: healthy, Caucasian, without major incapacity, no medication influencing
metabolism, non-smoker, moderate drinker, NBMI 18-30 kg/m2, no consumption of
40Exercise for preventing and treating osteoporosis in postmenopausal women (Review)
Copyright © 2011 The Cochrane Collaboration. Published by John Wiley & Sons, Ltd.
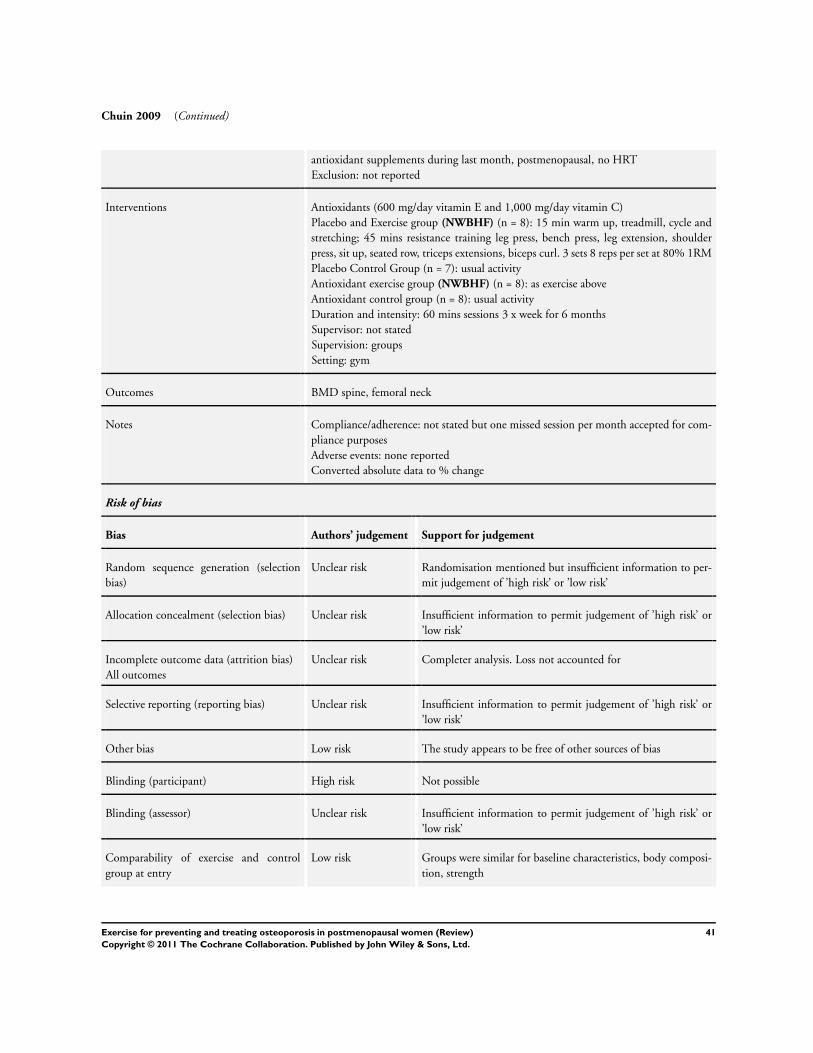
Chuin 2009 (Continued)
antioxidant supplements during last month, postmenopausal, no HRT
Exclusion: not reported
Interventions Antioxidants (600 mg/day vitamin E and 1,000 mg/day vitamin C)
Placebo and Exercise group (NWBHF) (n = 8): 15 min warm up, treadmill, cycle and
stretching; 45 mins resistance training leg press, bench press, leg extension, shoulder
press, sit up, seated row, triceps extensions, biceps curl. 3 sets 8 reps per set at 80% 1RM
Placebo Control Group (n = 7): usual activity
Antioxidant exercise group (NWBHF) (n = 8): as exercise above
Antioxidant control group (n = 8): usual activity
Duration and intensity: 60 mins sessions 3 x week for 6 months
Supervisor: not stated
Supervision: groups
Setting: gym
Outcomes BMD spine, femoral neck
Notes Compliance/adherence: not stated but one missed session per month accepted for com-
pliance purposes
Adverse events: none reported
Converted absolute data to % change
Risk of bias
Bias Authors’ judgement Support for judgement
Random sequence generation (selection
bias)
Unclear risk Randomisation mentioned but insufficient information to per-
mit judgement of ’high risk’ or ’low risk’
Allocation concealment (selection bias) Unclear risk Insufficient information to permit judgement of ’high risk’ or
’low risk’
Incomplete outcome data (attrition bias)
All outcomes
Unclear risk Completer analysis. Loss not accounted for
Selective reporting (reporting bias) Unclear risk Insufficient information to permit judgement of ’high risk’ or
’low risk’
Other bias Low risk The study appears to be free of other sources of bias
Blinding (participant) High risk Not possible
Blinding (assessor) Unclear risk Insufficient information to permit judgement of ’high risk’ or
’low risk’
Comparability of exercise and control
group at entry
Low risk Groups were similar for baseline characteristics, body composi-
tion, strength
41Exercise for preventing and treating osteoporosis in postmenopausal women (Review)
Copyright © 2011 The Cochrane Collaboration. Published by John Wiley & Sons, Ltd.
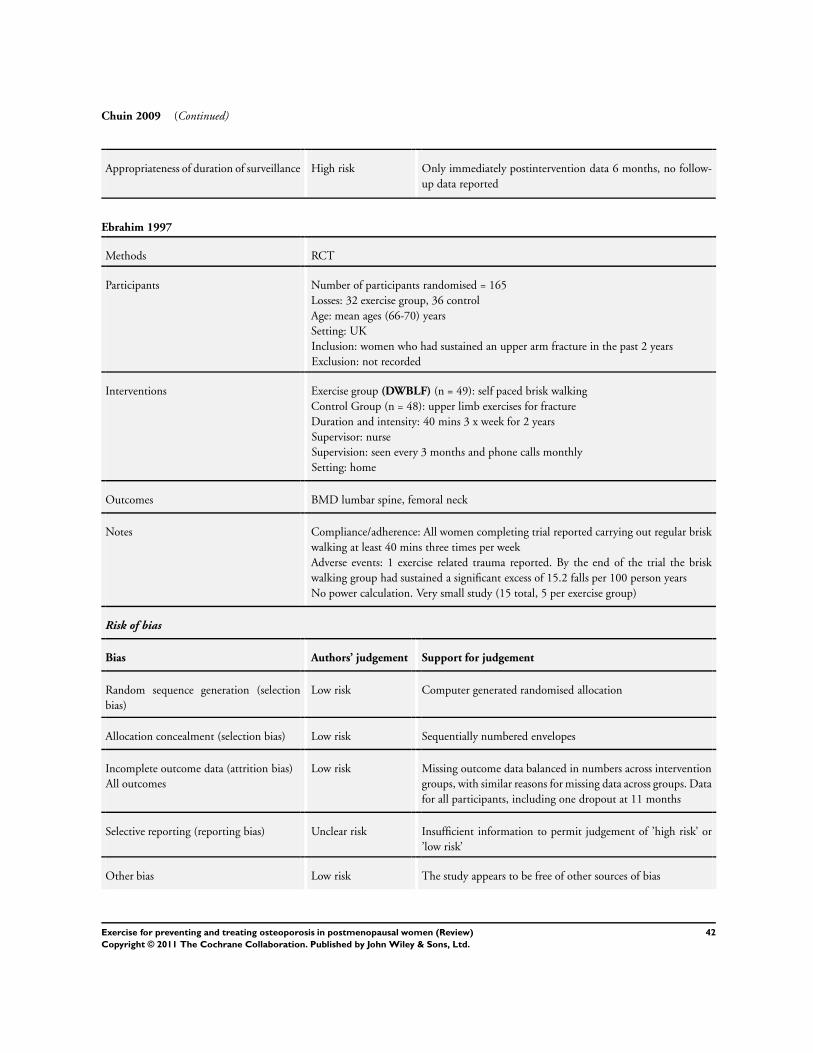
Chuin 2009 (Continued)
Appropriateness of duration of surveillance High risk Only immediately postintervention data 6 months, no follow-
up data reported
Ebrahim 1997
Methods RCT
Participants Number of participants randomised = 165
Losses: 32 exercise group, 36 control
Age: mean ages (66-70) years
Setting: UK
Inclusion: women who had sustained an upper arm fracture in the past 2 years
Exclusion: not recorded
Interventions Exercise group (DWBLF) (n = 49): self paced brisk walking
Control Group (n = 48): upper limb exercises for fracture
Duration and intensity: 40 mins 3 x week for 2 years
Supervisor: nurse
Supervision: seen every 3 months and phone calls monthly
Setting: home
Outcomes BMD lumbar spine, femoral neck
Notes Compliance/adherence: All women completing trial reported carrying out regular brisk
walking at least 40 mins three times per week
Adverse events: 1 exercise related trauma reported. By the end of the trial the brisk
walking group had sustained a significant excess of 15.2 falls per 100 person years
No power calculation. Very small study (15 total, 5 per exercise group)
Risk of bias
Bias Authors’ judgement Support for judgement
Random sequence generation (selection
bias)
Low risk Computer generated randomised allocation
Allocation concealment (selection bias) Low risk Sequentially numbered envelopes
Incomplete outcome data (attrition bias)
All outcomes
Low risk Missing outcome data balanced in numbers across intervention
groups, with similar reasons for missing data across groups. Data
for all participants, including one dropout at 11 months
Selective reporting (reporting bias) Unclear risk Insufficient information to permit judgement of ’high risk’ or
’low risk’
Other bias Low risk The study appears to be free of other sources of bias
42Exercise for preventing and treating osteoporosis in postmenopausal women (Review)
Copyright © 2011 The Cochrane Collaboration. Published by John Wiley & Sons, Ltd.
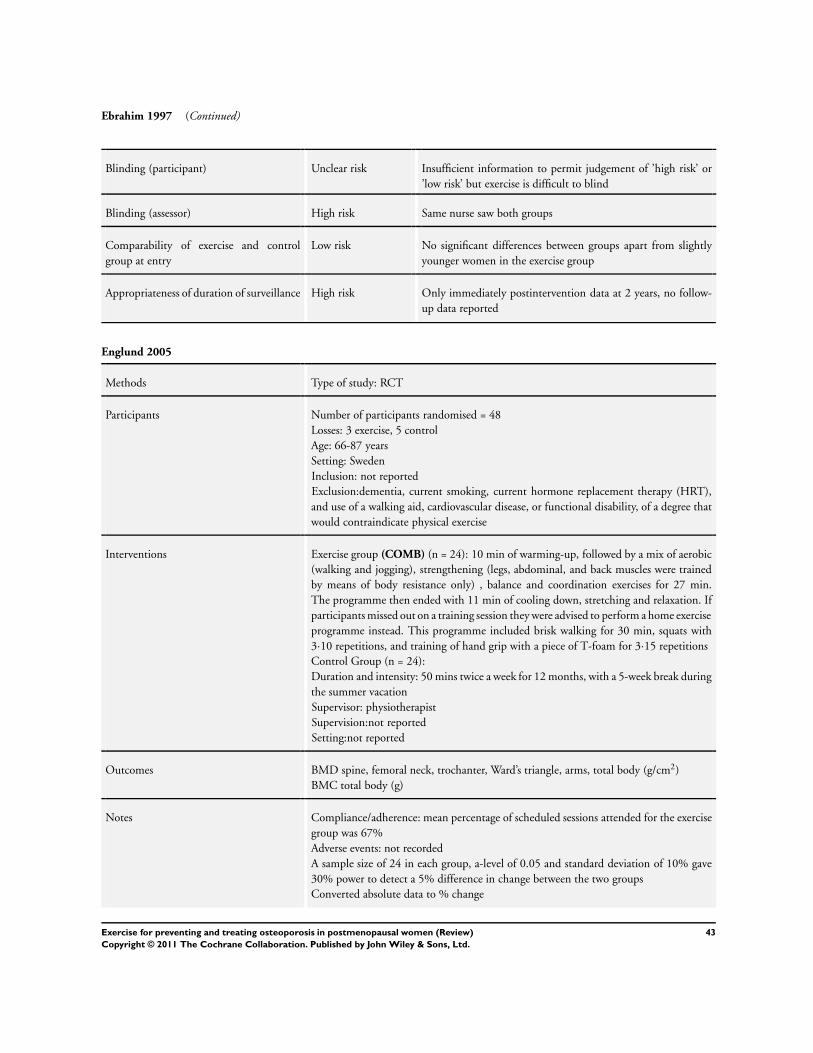
Ebrahim 1997 (Continued)
Blinding (participant) Unclear risk Insufficient information to permit judgement of ’high risk’ or
’low risk’ but exercise is difficult to blind
Blinding (assessor) High risk Same nurse saw both groups
Comparability of exercise and control
group at entry
Low risk No significant differences between groups apart from slightly
younger women in the exercise group
Appropriateness of duration of surveillance High risk Only immediately postintervention data at 2 years, no follow-
up data reported
Englund 2005
Methods Type of study: RCT
Participants Number of participants randomised = 48
Losses: 3 exercise, 5 control
Age: 66-87 years
Setting: Sweden
Inclusion: not reported
Exclusion:dementia, current smoking, current hormone replacement therapy (HRT),
and use of a walking aid, cardiovascular disease, or functional disability, of a degree that
would contraindicate physical exercise
Interventions Exercise group (COMB) (n = 24): 10 min of warming-up, followed by a mix of aerobic
(walking and jogging), strengthening (legs, abdominal, and back muscles were trained
by means of body resistance only) , balance and coordination exercises for 27 min.
The programme then ended with 11 min of cooling down, stretching and relaxation. If
participants missed out on a training session they were advised to perform a home exercise
programme instead. This programme included brisk walking for 30 min, squats with
3·10 repetitions, and training of hand grip with a piece of T-foam for 3·15 repetitions
Control Group (n = 24):
Duration and intensity: 50 mins twice a week for 12 months, with a 5-week break during
the summer vacation
Supervisor: physiotherapist
Supervision:not reported
Setting:not reported
Outcomes BMD spine, femoral neck, trochanter, Ward’s triangle, arms, total body (g/cm2)
BMC total body (g)
Notes Compliance/adherence: mean percentage of scheduled sessions attended for the exercise
group was 67%
Adverse events: not recorded
A sample size of 24 in each group, a-level of 0.05 and standard deviation of 10% gave
30% power to detect a 5% difference in change between the two groups
Converted absolute data to % change
43Exercise for preventing and treating osteoporosis in postmenopausal women (Review)
Copyright © 2011 The Cochrane Collaboration. Published by John Wiley & Sons, Ltd.
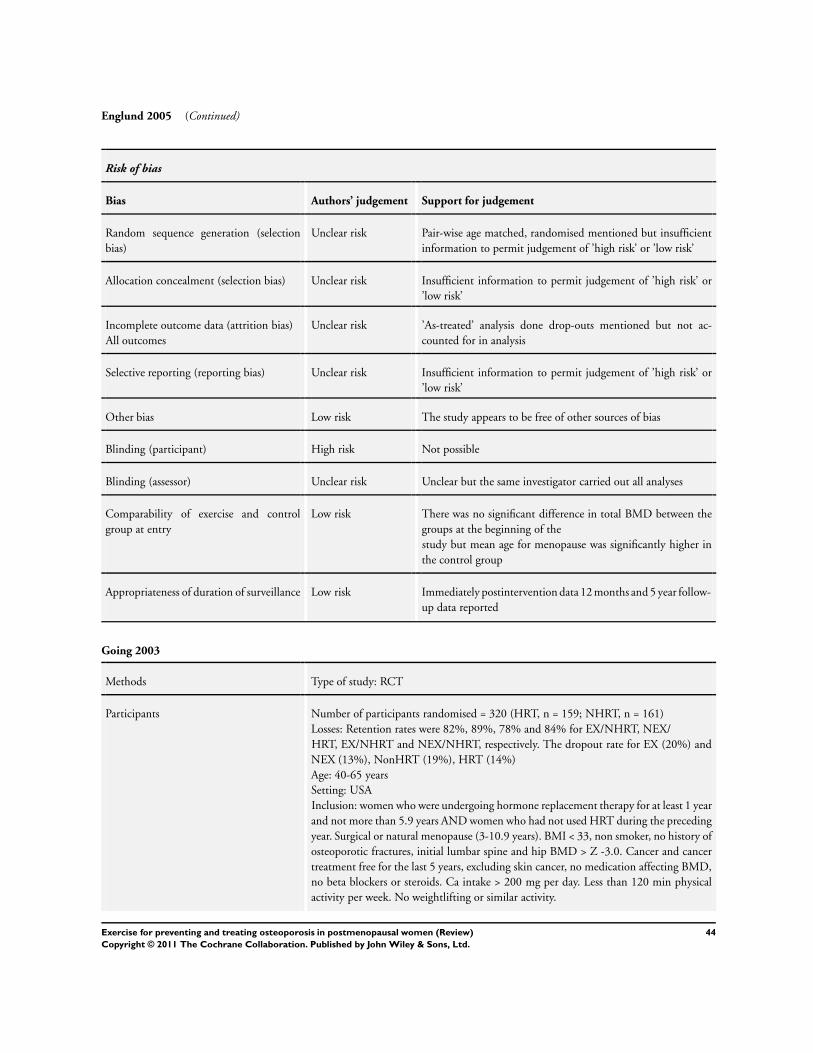
Englund 2005 (Continued)
Risk of bias
Bias Authors’ judgement Support for judgement
Random sequence generation (selection
bias)
Unclear risk Pair-wise age matched, randomised mentioned but insufficient
information to permit judgement of ’high risk’ or ’low risk’
Allocation concealment (selection bias) Unclear risk Insufficient information to permit judgement of ’high risk’ or
’low risk’
Incomplete outcome data (attrition bias)
All outcomes
Unclear risk ’As-treated’ analysis done drop-outs mentioned but not ac-
counted for in analysis
Selective reporting (reporting bias) Unclear risk Insufficient information to permit judgement of ’high risk’ or
’low risk’
Other bias Low risk The study appears to be free of other sources of bias
Blinding (participant) High risk Not possible
Blinding (assessor) Unclear risk Unclear but the same investigator carried out all analyses
Comparability of exercise and control
group at entry
Low risk There was no significant difference in total BMD between the
groups at the beginning of the
study but mean age for menopause was significantly higher in
the control group
Appropriateness of duration of surveillance Low risk Immediately postintervention data 12 months and 5 year follow-
up data reported
Going 2003
Methods Type of study: RCT
Participants Number of participants randomised = 320 (HRT, n = 159; NHRT, n = 161)
Losses: Retention rates were 82%, 89%, 78% and 84% for EX/NHRT, NEX/
HRT, EX/NHRT and NEX/NHRT, respectively. The dropout rate for EX (20%) and
NEX (13%), NonHRT (19%), HRT (14%)
Age: 40-65 years
Setting: USA
Inclusion: women who were undergoing hormone replacement therapy for at least 1 year
and not more than 5.9 years AND women who had not used HRT during the preceding
year. Surgical or natural menopause (3-10.9 years). BMI < 33, non smoker, no history of
osteoporotic fractures, initial lumbar spine and hip BMD > Z -3.0. Cancer and cancer
treatment free for the last 5 years, excluding skin cancer, no medication affecting BMD,
no beta blockers or steroids. Ca intake > 200 mg per day. Less than 120 min physical
activity per week. No weightlifting or similar activity.
44Exercise for preventing and treating osteoporosis in postmenopausal women (Review)
Copyright © 2011 The Cochrane Collaboration. Published by John Wiley & Sons, Ltd.
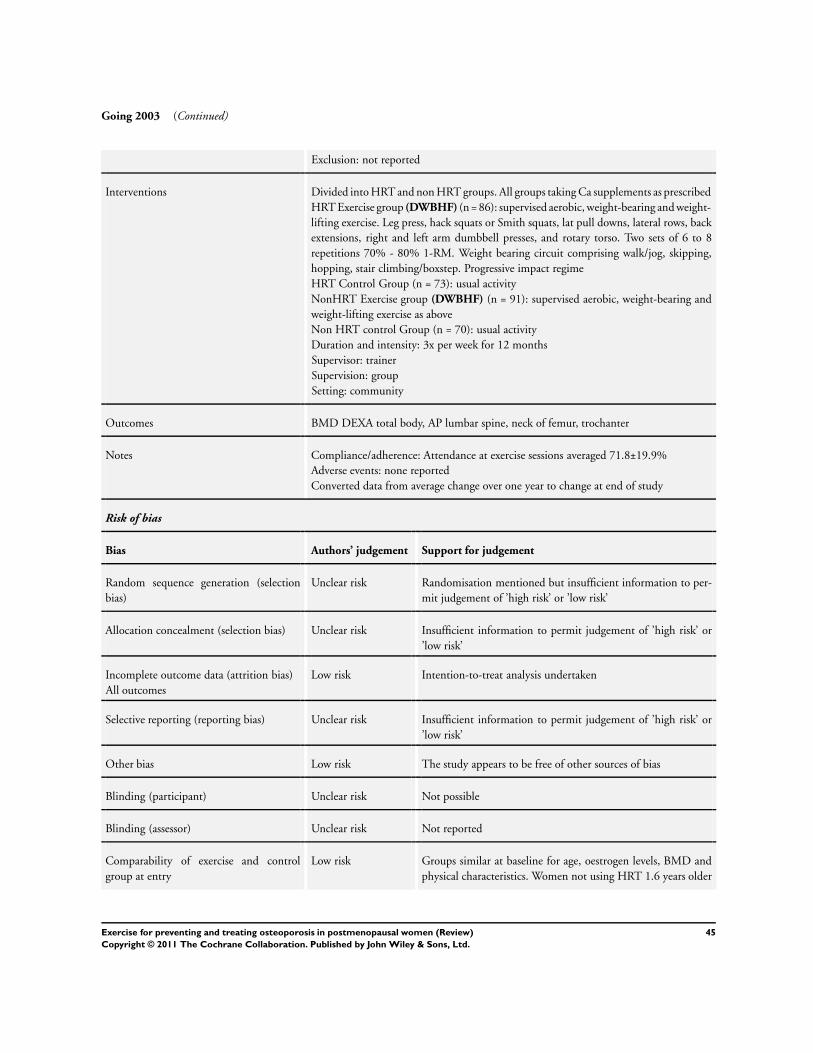
Going 2003 (Continued)
Exclusion: not reported
Interventions Divided into HRT and non HRT groups. All groups taking Ca supplements as prescribed
HRT Exercise group (DWBHF) (n = 86): supervised aerobic, weight-bearing and weight-
lifting exercise. Leg press, hack squats or Smith squats, lat pull downs, lateral rows, back
extensions, right and left arm dumbbell presses, and rotary torso. Two sets of 6 to 8
repetitions 70% - 80% 1-RM. Weight bearing circuit comprising walk/jog, skipping,
hopping, stair climbing/boxstep. Progressive impact regime
HRT Control Group (n = 73): usual activity
NonHRT Exercise group (DWBHF) (n = 91): supervised aerobic, weight-bearing and
weight-lifting exercise as above
Non HRT control Group (n = 70): usual activity
Duration and intensity: 3x per week for 12 months
Supervisor: trainer
Supervision: group
Setting: community
Outcomes BMD DEXA total body, AP lumbar spine, neck of femur, trochanter
Notes Compliance/adherence: Attendance at exercise sessions averaged 71.8±19.9%
Adverse events: none reported
Converted data from average change over one year to change at end of study
Risk of bias
Bias Authors’ judgement Support for judgement
Random sequence generation (selection
bias)
Unclear risk Randomisation mentioned but insufficient information to per-
mit judgement of ’high risk’ or ’low risk’
Allocation concealment (selection bias) Unclear risk Insufficient information to permit judgement of ’high risk’ or
’low risk’
Incomplete outcome data (attrition bias)
All outcomes
Low risk Intention-to-treat analysis undertaken
Selective reporting (reporting bias) Unclear risk Insufficient information to permit judgement of ’high risk’ or
’low risk’
Other bias Low risk The study appears to be free of other sources of bias
Blinding (participant) Unclear risk Not possible
Blinding (assessor) Unclear risk Not reported
Comparability of exercise and control
group at entry
Low risk Groups similar at baseline for age, oestrogen levels, BMD and
physical characteristics. Women not using HRT 1.6 years older
45Exercise for preventing and treating osteoporosis in postmenopausal women (Review)
Copyright © 2011 The Cochrane Collaboration. Published by John Wiley & Sons, Ltd.
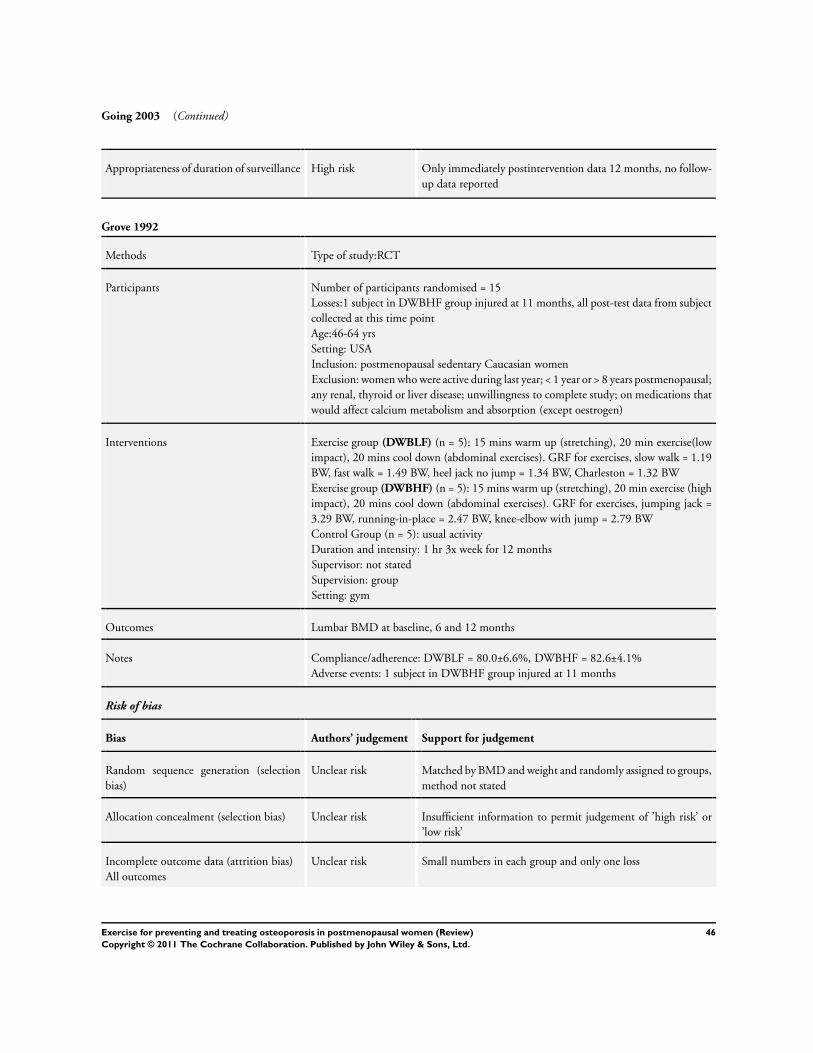
Going 2003 (Continued)
Appropriateness of duration of surveillance High risk Only immediately postintervention data 12 months, no follow-
up data reported
Grove 1992
Methods Type of study:RCT
Participants Number of participants randomised = 15
Losses:1 subject in DWBHF group injured at 11 months, all post-test data from subject
collected at this time point
Age:46-64 yrs
Setting: USA
Inclusion: postmenopausal sedentary Caucasian women
Exclusion: women who were active during last year; < 1 year or > 8 years postmenopausal;
any renal, thyroid or liver disease; unwillingness to complete study; on medications that
would affect calcium metabolism and absorption (except oestrogen)
Interventions Exercise group (DWBLF) (n = 5): 15 mins warm up (stretching), 20 min exercise(low
impact), 20 mins cool down (abdominal exercises). GRF for exercises, slow walk = 1.19
BW, fast walk = 1.49 BW, heel jack no jump = 1.34 BW, Charleston = 1.32 BW
Exercise group (DWBHF) (n = 5): 15 mins warm up (stretching), 20 min exercise (high
impact), 20 mins cool down (abdominal exercises). GRF for exercises, jumping jack =
3.29 BW, running-in-place = 2.47 BW, knee-elbow with jump = 2.79 BW
Control Group (n = 5): usual activity
Duration and intensity: 1 hr 3x week for 12 months
Supervisor: not stated
Supervision: group
Setting: gym
Outcomes Lumbar BMD at baseline, 6 and 12 months
Notes Compliance/adherence: DWBLF = 80.0±6.6%, DWBHF = 82.6±4.1%
Adverse events: 1 subject in DWBHF group injured at 11 months
Risk of bias
Bias Authors’ judgement Support for judgement
Random sequence generation (selection
bias)
Unclear risk Matched by BMD and weight and randomly assigned to groups,
method not stated
Allocation concealment (selection bias) Unclear risk Insufficient information to permit judgement of ’high risk’ or
’low risk’
Incomplete outcome data (attrition bias)
All outcomes
Unclear risk Small numbers in each group and only one loss
46Exercise for preventing and treating osteoporosis in postmenopausal women (Review)
Copyright © 2011 The Cochrane Collaboration. Published by John Wiley & Sons, Ltd.
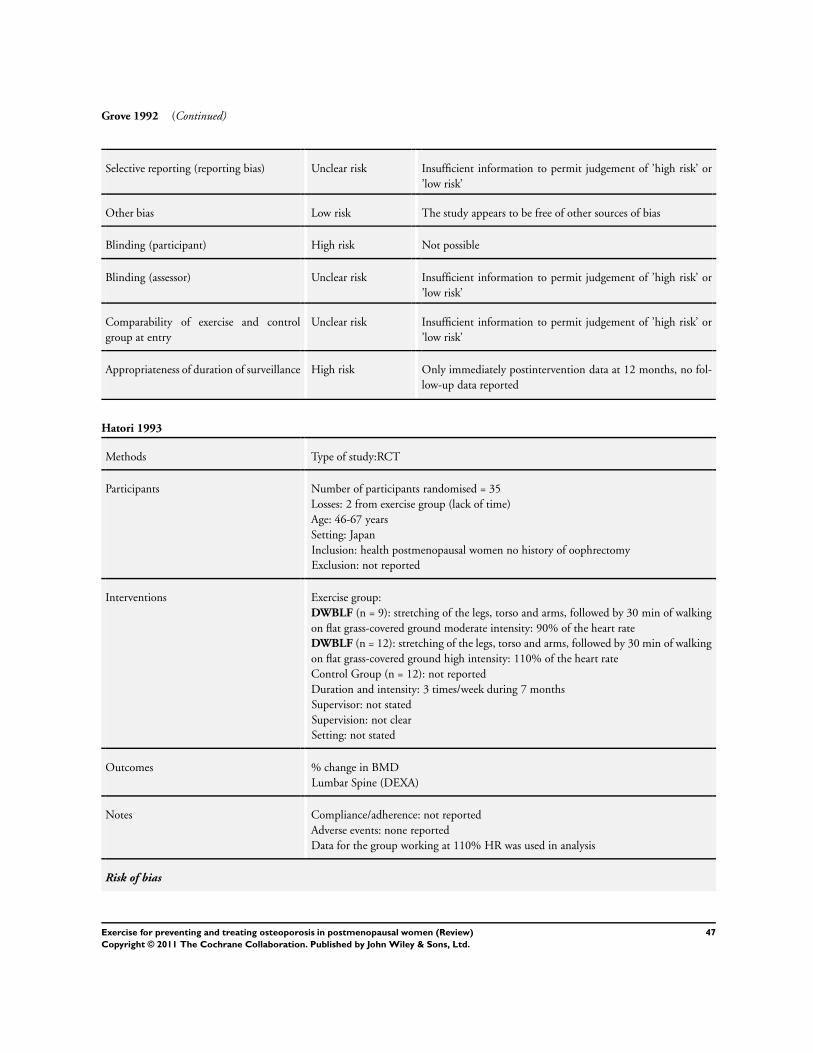
Grove 1992 (Continued)
Selective reporting (reporting bias) Unclear risk Insufficient information to permit judgement of ’high risk’ or
’low risk’
Other bias Low risk The study appears to be free of other sources of bias
Blinding (participant) High risk Not possible
Blinding (assessor) Unclear risk Insufficient information to permit judgement of ’high risk’ or
’low risk’
Comparability of exercise and control
group at entry
Unclear risk Insufficient information to permit judgement of ’high risk’ or
’low risk’
Appropriateness of duration of surveillance High risk Only immediately postintervention data at 12 months, no fol-
low-up data reported
Hatori 1993
Methods Type of study:RCT
Participants Number of participants randomised = 35
Losses: 2 from exercise group (lack of time)
Age: 46-67 years
Setting: Japan
Inclusion: health postmenopausal women no history of oophrectomy
Exclusion: not reported
Interventions Exercise group:
DWBLF (n = 9): stretching of the legs, torso and arms, followed by 30 min of walking
on flat grass-covered ground moderate intensity: 90% of the heart rate
DWBLF (n = 12): stretching of the legs, torso and arms, followed by 30 min of walking
on flat grass-covered ground high intensity: 110% of the heart rate
Control Group (n = 12): not reported
Duration and intensity: 3 times/week during 7 months
Supervisor: not stated
Supervision: not clear
Setting: not stated
Outcomes % change in BMD
Lumbar Spine (DEXA)
Notes Compliance/adherence: not reported
Adverse events: none reported
Data for the group working at 110% HR was used in analysis
Risk of bias
47Exercise for preventing and treating osteoporosis in postmenopausal women (Review)
Copyright © 2011 The Cochrane Collaboration. Published by John Wiley & Sons, Ltd.
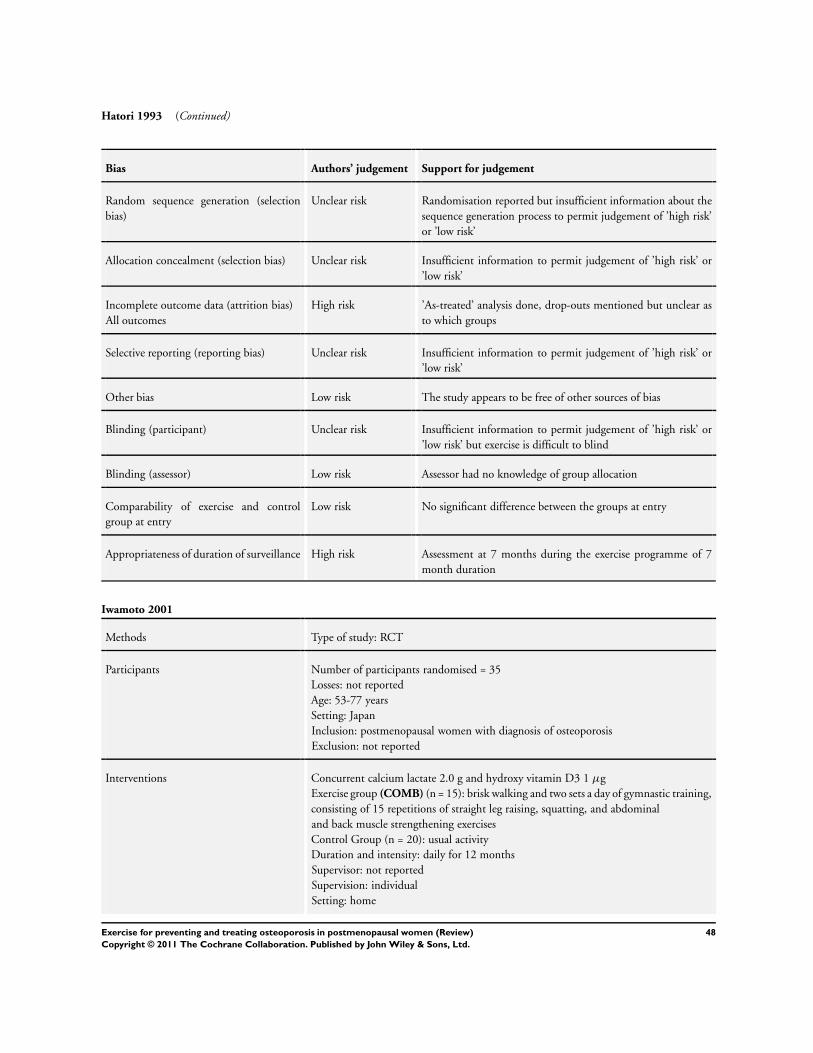
Hatori 1993 (Continued)
Bias Authors’ judgement Support for judgement
Random sequence generation (selection
bias)
Unclear risk Randomisation reported but insufficient information about the
sequence generation process to permit judgement of ’high risk’
or ’low risk’
Allocation concealment (selection bias) Unclear risk Insufficient information to permit judgement of ’high risk’ or
’low risk’
Incomplete outcome data (attrition bias)
All outcomes
High risk ’As-treated’ analysis done, drop-outs mentioned but unclear as
to which groups
Selective reporting (reporting bias) Unclear risk Insufficient information to permit judgement of ’high risk’ or
’low risk’
Other bias Low risk The study appears to be free of other sources of bias
Blinding (participant) Unclear risk Insufficient information to permit judgement of ’high risk’ or
’low risk’ but exercise is difficult to blind
Blinding (assessor) Low risk Assessor had no knowledge of group allocation
Comparability of exercise and control
group at entry
Low risk No significant difference between the groups at entry
Appropriateness of duration of surveillance High risk Assessment at 7 months during the exercise programme of 7
month duration
Iwamoto 2001
Methods Type of study: RCT
Participants Number of participants randomised = 35
Losses: not reported
Age: 53-77 years
Setting: Japan
Inclusion: postmenopausal women with diagnosis of osteoporosis
Exclusion: not reported
Interventions Concurrent calcium lactate 2.0 g and hydroxy vitamin D3 1 µg
Exercise group (COMB) (n = 15): brisk walking and two sets a day of gymnastic training,
consisting of 15 repetitions of straight leg raising, squatting, and abdominal
and back muscle strengthening exercises
Control Group (n = 20): usual activity
Duration and intensity: daily for 12 months
Supervisor: not reported
Supervision: individual
Setting: home
48Exercise for preventing and treating osteoporosis in postmenopausal women (Review)
Copyright © 2011 The Cochrane Collaboration. Published by John Wiley & Sons, Ltd.
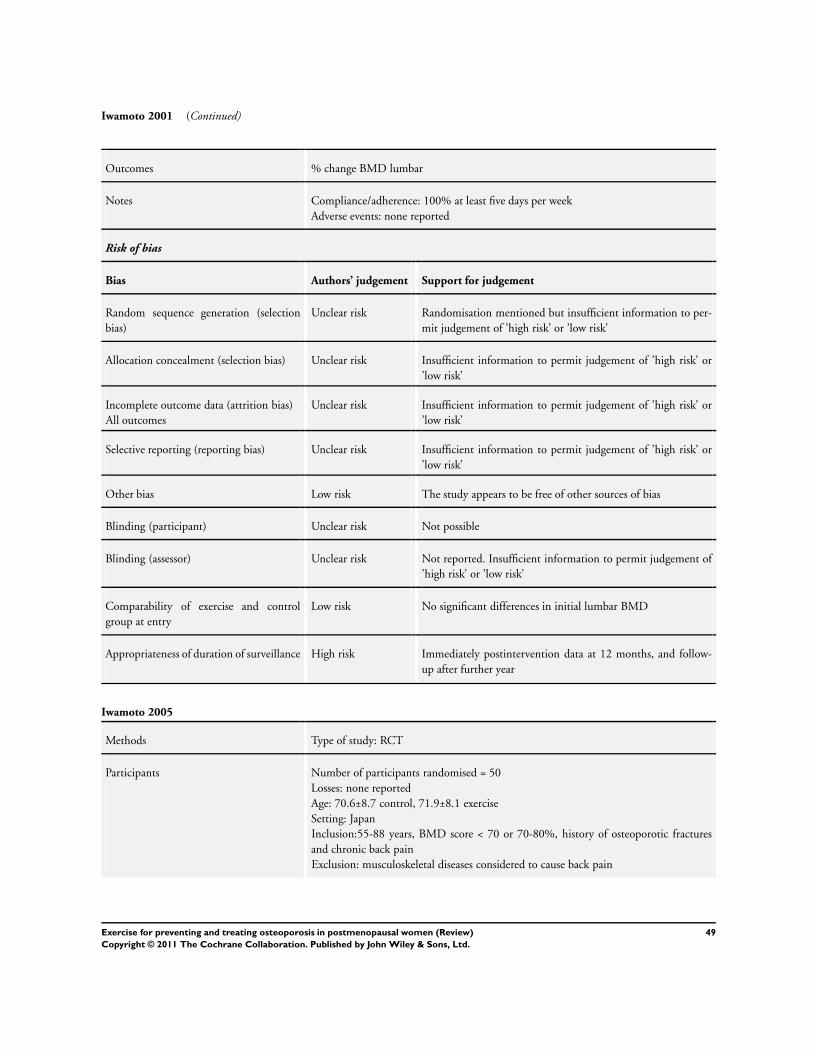
Iwamoto 2001 (Continued)
Outcomes % change BMD lumbar
Notes Compliance/adherence: 100% at least five days per week
Adverse events: none reported
Risk of bias
Bias Authors’ judgement Support for judgement
Random sequence generation (selection
bias)
Unclear risk Randomisation mentioned but insufficient information to per-
mit judgement of ’high risk’ or ’low risk’
Allocation concealment (selection bias) Unclear risk Insufficient information to permit judgement of ’high risk’ or
’low risk’
Incomplete outcome data (attrition bias)
All outcomes
Unclear risk Insufficient information to permit judgement of ’high risk’ or
’low risk’
Selective reporting (reporting bias) Unclear risk Insufficient information to permit judgement of ’high risk’ or
’low risk’
Other bias Low risk The study appears to be free of other sources of bias
Blinding (participant) Unclear risk Not possible
Blinding (assessor) Unclear risk Not reported. Insufficient information to permit judgement of
’high risk’ or ’low risk’
Comparability of exercise and control
group at entry
Low risk No significant differences in initial lumbar BMD
Appropriateness of duration of surveillance High risk Immediately postintervention data at 12 months, and follow-
up after further year
Iwamoto 2005
Methods Type of study: RCT
Participants Number of participants randomised = 50
Losses: none reported
Age: 70.6±8.7 control, 71.9±8.1 exercise
Setting: Japan
Inclusion:55-88 years, BMD score < 70 or 70-80%, history of osteoporotic fractures
and chronic back pain
Exclusion: musculoskeletal diseases considered to cause back pain
49Exercise for preventing and treating osteoporosis in postmenopausal women (Review)
Copyright © 2011 The Cochrane Collaboration. Published by John Wiley & Sons, Ltd.
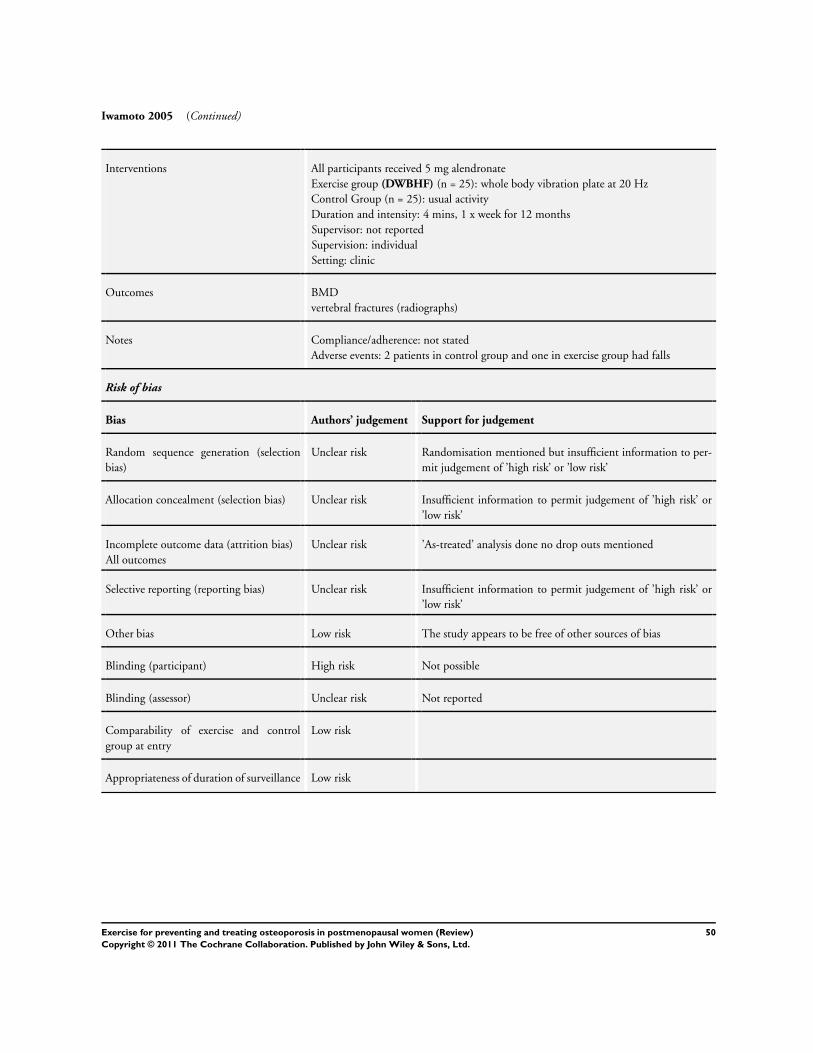
Iwamoto 2005 (Continued)
Interventions All participants received 5 mg alendronate
Exercise group (DWBHF) (n = 25): whole body vibration plate at 20 Hz
Control Group (n = 25): usual activity
Duration and intensity: 4 mins, 1 x week for 12 months
Supervisor: not reported
Supervision: individual
Setting: clinic
Outcomes BMD
vertebral fractures (radiographs)
Notes Compliance/adherence: not stated
Adverse events: 2 patients in control group and one in exercise group had falls
Risk of bias
Bias Authors’ judgement Support for judgement
Random sequence generation (selection
bias)
Unclear risk Randomisation mentioned but insufficient information to per-
mit judgement of ’high risk’ or ’low risk’
Allocation concealment (selection bias) Unclear risk Insufficient information to permit judgement of ’high risk’ or
’low risk’
Incomplete outcome data (attrition bias)
All outcomes
Unclear risk ’As-treated’ analysis done no drop outs mentioned
Selective reporting (reporting bias) Unclear risk Insufficient information to permit judgement of ’high risk’ or
’low risk’
Other bias Low risk The study appears to be free of other sources of bias
Blinding (participant) High risk Not possible
Blinding (assessor) Unclear risk Not reported
Comparability of exercise and control
group at entry
Low risk
Appropriateness of duration of surveillance Low risk
50Exercise for preventing and treating osteoporosis in postmenopausal women (Review)
Copyright © 2011 The Cochrane Collaboration. Published by John Wiley & Sons, Ltd.
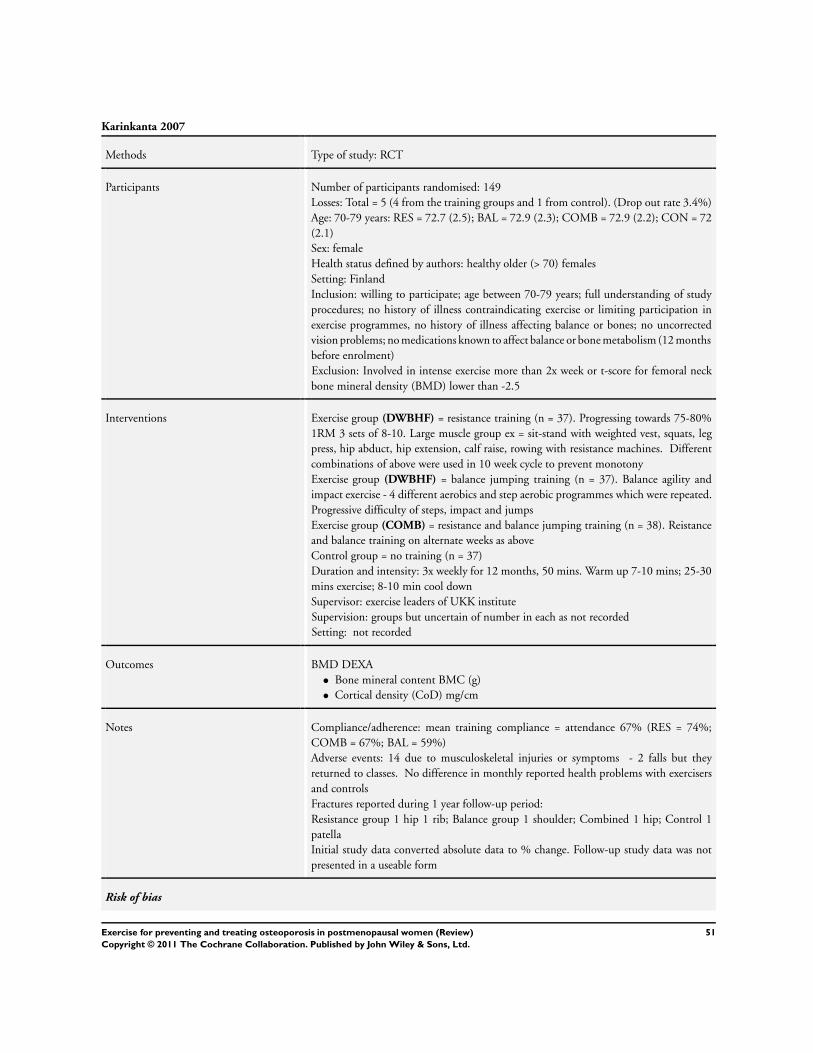
Karinkanta 2007
Methods Type of study: RCT
Participants Number of participants randomised: 149
Losses: Total = 5 (4 from the training groups and 1 from control). (Drop out rate 3.4%)
Age: 70-79 years: RES = 72.7 (2.5); BAL = 72.9 (2.3); COMB = 72.9 (2.2); CON = 72
(2.1)
Sex: female
Health status defined by authors: healthy older (> 70) females
Setting: Finland
Inclusion: willing to participate; age between 70-79 years; full understanding of study
procedures; no history of illness contraindicating exercise or limiting participation in
exercise programmes, no history of illness affecting balance or bones; no uncorrected
vision problems; no medications known to affect balance or bone metabolism (12 months
before enrolment)
Exclusion: Involved in intense exercise more than 2x week or t-score for femoral neck
bone mineral density (BMD) lower than -2.5
Interventions Exercise group (DWBHF) = resistance training (n = 37). Progressing towards 75-80%
1RM 3 sets of 8-10. Large muscle group ex = sit-stand with weighted vest, squats, leg
press, hip abduct, hip extension, calf raise, rowing with resistance machines. Different
combinations of above were used in 10 week cycle to prevent monotony
Exercise group (DWBHF) = balance jumping training (n = 37). Balance agility and
impact exercise - 4 different aerobics and step aerobic programmes which were repeated.
Progressive difficulty of steps, impact and jumps
Exercise group (COMB) = resistance and balance jumping training (n = 38). Reistance
and balance training on alternate weeks as above
Control group = no training (n = 37)
Duration and intensity: 3x weekly for 12 months, 50 mins. Warm up 7-10 mins; 25-30
mins exercise; 8-10 min cool down
Supervisor: exercise leaders of UKK institute
Supervision: groups but uncertain of number in each as not recorded
Setting: not recorded
Outcomes BMD DEXA
• Bone mineral content BMC (g)
• Cortical density (CoD) mg/cm
Notes Compliance/adherence: mean training compliance = attendance 67% (RES = 74%;
COMB = 67%; BAL = 59%)
Adverse events: 14 due to musculoskeletal injuries or symptoms - 2 falls but they
returned to classes. No difference in monthly reported health problems with exercisers
and controls
Fractures reported during 1 year follow-up period:
Resistance group 1 hip 1 rib; Balance group 1 shoulder; Combined 1 hip; Control 1
patella
Initial study data converted absolute data to % change. Follow-up study data was not
presented in a useable form
Risk of bias
51Exercise for preventing and treating osteoporosis in postmenopausal women (Review)
Copyright © 2011 The Cochrane Collaboration. Published by John Wiley & Sons, Ltd.
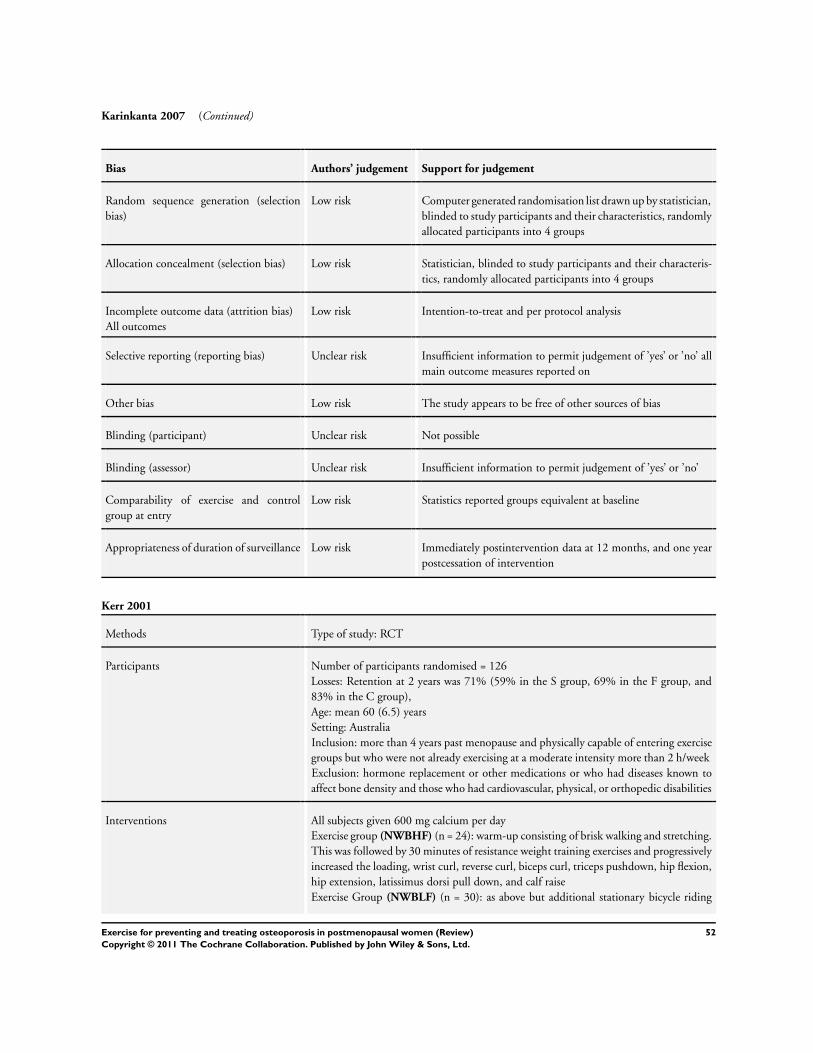
Karinkanta 2007 (Continued)
Bias Authors’ judgement Support for judgement
Random sequence generation (selection
bias)
Low risk Computer generated randomisation list drawn up by statistician,
blinded to study participants and their characteristics, randomly
allocated participants into 4 groups
Allocation concealment (selection bias) Low risk Statistician, blinded to study participants and their characteris-
tics, randomly allocated participants into 4 groups
Incomplete outcome data (attrition bias)
All outcomes
Low risk Intention-to-treat and per protocol analysis
Selective reporting (reporting bias) Unclear risk Insufficient information to permit judgement of ’yes’ or ’no’ all
main outcome measures reported on
Other bias Low risk The study appears to be free of other sources of bias
Blinding (participant) Unclear risk Not possible
Blinding (assessor) Unclear risk Insufficient information to permit judgement of ’yes’ or ’no’
Comparability of exercise and control
group at entry
Low risk Statistics reported groups equivalent at baseline
Appropriateness of duration of surveillance Low risk Immediately postintervention data at 12 months, and one year
postcessation of intervention
Kerr 2001
Methods Type of study: RCT
Participants Number of participants randomised = 126
Losses: Retention at 2 years was 71% (59% in the S group, 69% in the F group, and
83% in the C group),
Age: mean 60 (6.5) years
Setting: Australia
Inclusion: more than 4 years past menopause and physically capable of entering exercise
groups but who were not already exercising at a moderate intensity more than 2 h/week
Exclusion: hormone replacement or other medications or who had diseases known to
affect bone density and those who had cardiovascular, physical, or orthopedic disabilities
Interventions All subjects given 600 mg calcium per day
Exercise group (NWBHF) (n = 24): warm-up consisting of brisk walking and stretching.
This was followed by 30 minutes of resistance weight training exercises and progressively
increased the loading, wrist curl, reverse curl, biceps curl, triceps pushdown, hip flexion,
hip extension, latissimus dorsi pull down, and calf raise
Exercise Group (NWBLF) (n = 30): as above but additional stationary bicycle riding
52Exercise for preventing and treating osteoporosis in postmenopausal women (Review)
Copyright © 2011 The Cochrane Collaboration. Published by John Wiley & Sons, Ltd.
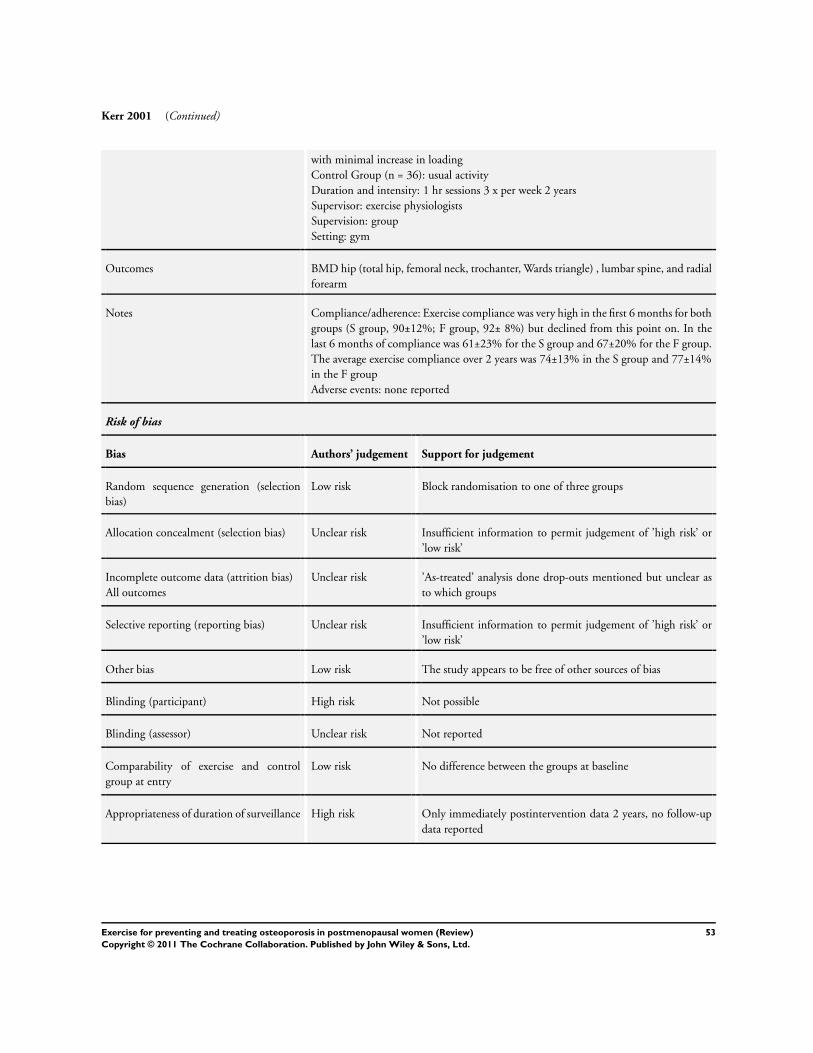
Kerr 2001 (Continued)
with minimal increase in loading
Control Group (n = 36): usual activity
Duration and intensity: 1 hr sessions 3 x per week 2 years
Supervisor: exercise physiologists
Supervision: group
Setting: gym
Outcomes BMD hip (total hip, femoral neck, trochanter, Wards triangle) , lumbar spine, and radial
forearm
Notes Compliance/adherence: Exercise compliance was very high in the first 6 months for both
groups (S group, 90±12%; F group, 92± 8%) but declined from this point on. In the
last 6 months of compliance was 61±23% for the S group and 67±20% for the F group.
The average exercise compliance over 2 years was 74±13% in the S group and 77±14%
in the F group
Adverse events: none reported
Risk of bias
Bias Authors’ judgement Support for judgement
Random sequence generation (selection
bias)
Low risk Block randomisation to one of three groups
Allocation concealment (selection bias) Unclear risk Insufficient information to permit judgement of ’high risk’ or
’low risk’
Incomplete outcome data (attrition bias)
All outcomes
Unclear risk ’As-treated’ analysis done drop-outs mentioned but unclear as
to which groups
Selective reporting (reporting bias) Unclear risk Insufficient information to permit judgement of ’high risk’ or
’low risk’
Other bias Low risk The study appears to be free of other sources of bias
Blinding (participant) High risk Not possible
Blinding (assessor) Unclear risk Not reported
Comparability of exercise and control
group at entry
Low risk No difference between the groups at baseline
Appropriateness of duration of surveillance High risk Only immediately postintervention data 2 years, no follow-up
data reported
53Exercise for preventing and treating osteoporosis in postmenopausal women (Review)
Copyright © 2011 The Cochrane Collaboration. Published by John Wiley & Sons, Ltd.
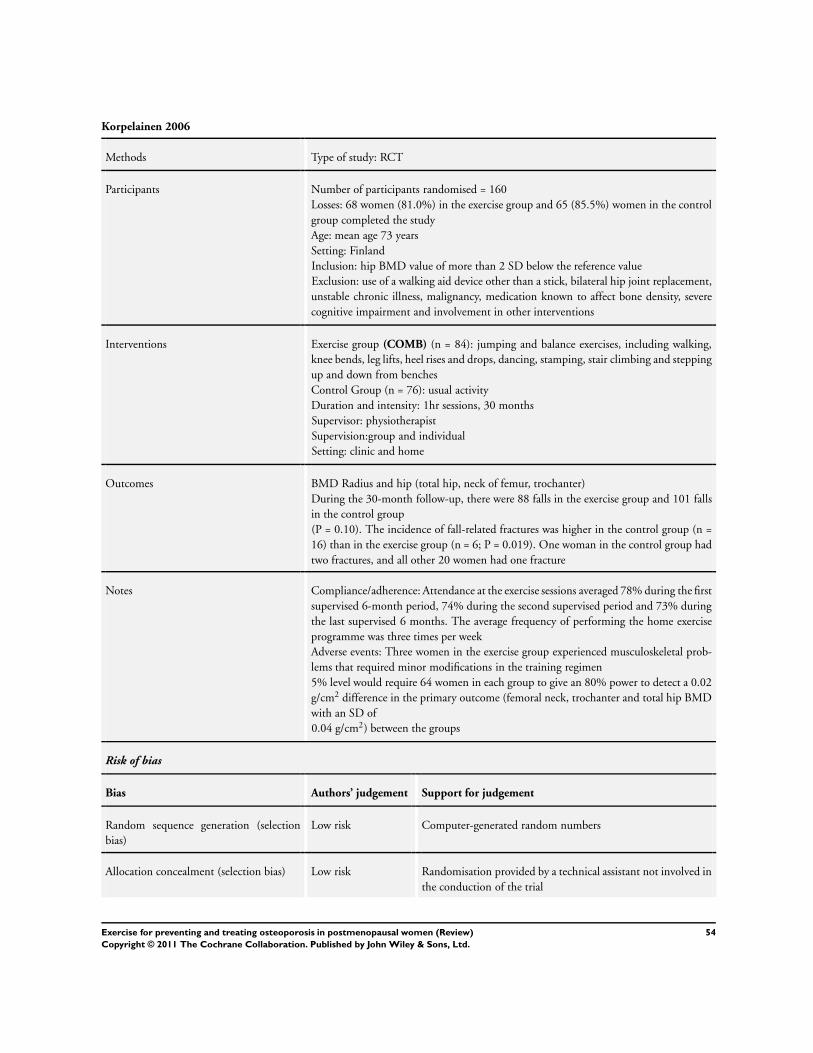
Korpelainen 2006
Methods Type of study: RCT
Participants Number of participants randomised = 160
Losses: 68 women (81.0%) in the exercise group and 65 (85.5%) women in the control
group completed the study
Age: mean age 73 years
Setting: Finland
Inclusion: hip BMD value of more than 2 SD below the reference value
Exclusion: use of a walking aid device other than a stick, bilateral hip joint replacement,
unstable chronic illness, malignancy, medication known to affect bone density, severe
cognitive impairment and involvement in other interventions
Interventions Exercise group (COMB) (n = 84): jumping and balance exercises, including walking,
knee bends, leg lifts, heel rises and drops, dancing, stamping, stair climbing and stepping
up and down from benches
Control Group (n = 76): usual activity
Duration and intensity: 1hr sessions, 30 months
Supervisor: physiotherapist
Supervision:group and individual
Setting: clinic and home
Outcomes BMD Radius and hip (total hip, neck of femur, trochanter)
During the 30-month follow-up, there were 88 falls in the exercise group and 101 falls
in the control group
(P = 0.10). The incidence of fall-related fractures was higher in the control group (n =
16) than in the exercise group (n = 6; P = 0.019). One woman in the control group had
two fractures, and all other 20 women had one fracture
Notes Compliance/adherence: Attendance at the exercise sessions averaged 78% during the first
supervised 6-month period, 74% during the second supervised period and 73% during
the last supervised 6 months. The average frequency of performing the home exercise
programme was three times per week
Adverse events: Three women in the exercise group experienced musculoskeletal prob-
lems that required minor modifications in the training regimen
5% level would require 64 women in each group to give an 80% power to detect a 0.02
g/cm2 difference in the primary outcome (femoral neck, trochanter and total hip BMD
with an SD of
0.04 g/cm2) between the groups
Risk of bias
Bias Authors’ judgement Support for judgement
Random sequence generation (selection
bias)
Low risk Computer-generated random numbers
Allocation concealment (selection bias) Low risk Randomisation provided by a technical assistant not involved in
the conduction of the trial
54Exercise for preventing and treating osteoporosis in postmenopausal women (Review)
Copyright © 2011 The Cochrane Collaboration. Published by John Wiley & Sons, Ltd.
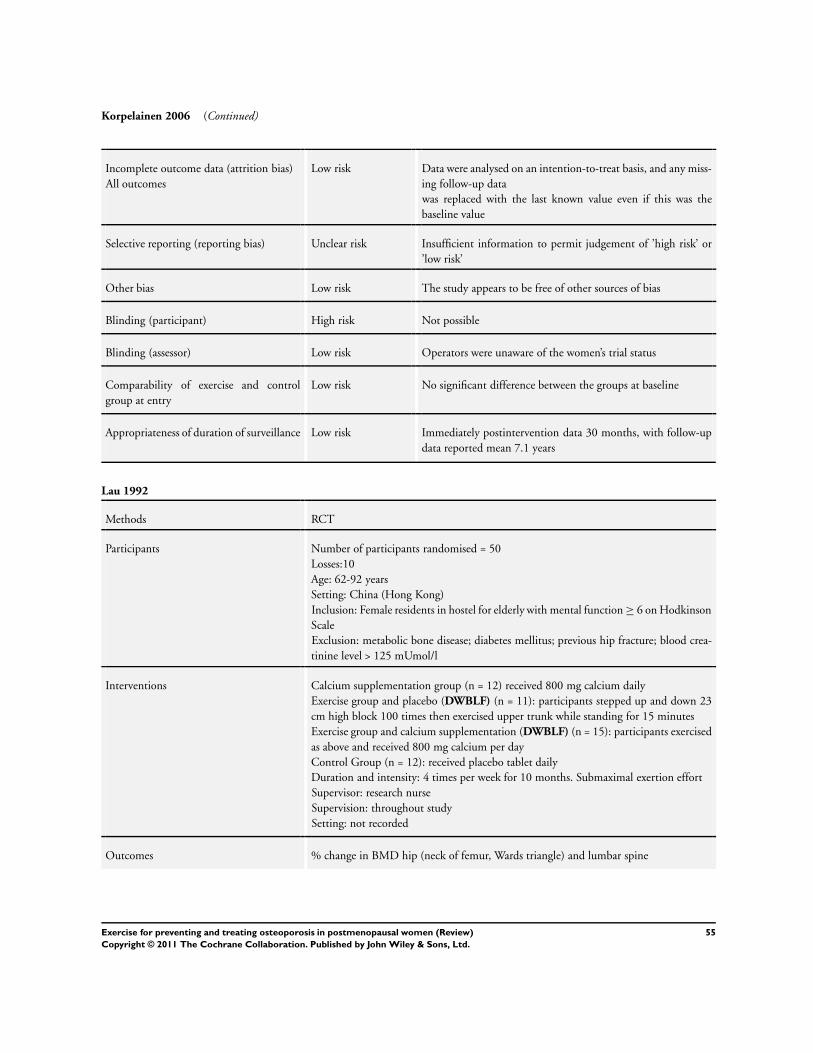
Korpelainen 2006 (Continued)
Incomplete outcome data (attrition bias)
All outcomes
Low risk Data were analysed on an intention-to-treat basis, and any miss-
ing follow-up data
was replaced with the last known value even if this was the
baseline value
Selective reporting (reporting bias) Unclear risk Insufficient information to permit judgement of ’high risk’ or
’low risk’
Other bias Low risk The study appears to be free of other sources of bias
Blinding (participant) High risk Not possible
Blinding (assessor) Low risk Operators were unaware of the women’s trial status
Comparability of exercise and control
group at entry
Low risk No significant difference between the groups at baseline
Appropriateness of duration of surveillance Low risk Immediately postintervention data 30 months, with follow-up
data reported mean 7.1 years
Lau 1992
Methods RCT
Participants Number of participants randomised = 50
Losses:10
Age: 62-92 years
Setting: China (Hong Kong)
Inclusion: Female residents in hostel for elderly with mental function ≥ 6 on Hodkinson
Scale
Exclusion: metabolic bone disease; diabetes mellitus; previous hip fracture; blood crea-
tinine level > 125 mUmol/l
Interventions Calcium supplementation group (n = 12) received 800 mg calcium daily
Exercise group and placebo (DWBLF) (n = 11): participants stepped up and down 23
cm high block 100 times then exercised upper trunk while standing for 15 minutes
Exercise group and calcium supplementation (DWBLF) (n = 15): participants exercised
as above and received 800 mg calcium per day
Control Group (n = 12): received placebo tablet daily
Duration and intensity: 4 times per week for 10 months. Submaximal exertion effort
Supervisor: research nurse
Supervision: throughout study
Setting: not recorded
Outcomes % change in BMD hip (neck of femur, Wards triangle) and lumbar spine
55Exercise for preventing and treating osteoporosis in postmenopausal women (Review)
Copyright © 2011 The Cochrane Collaboration. Published by John Wiley & Sons, Ltd.
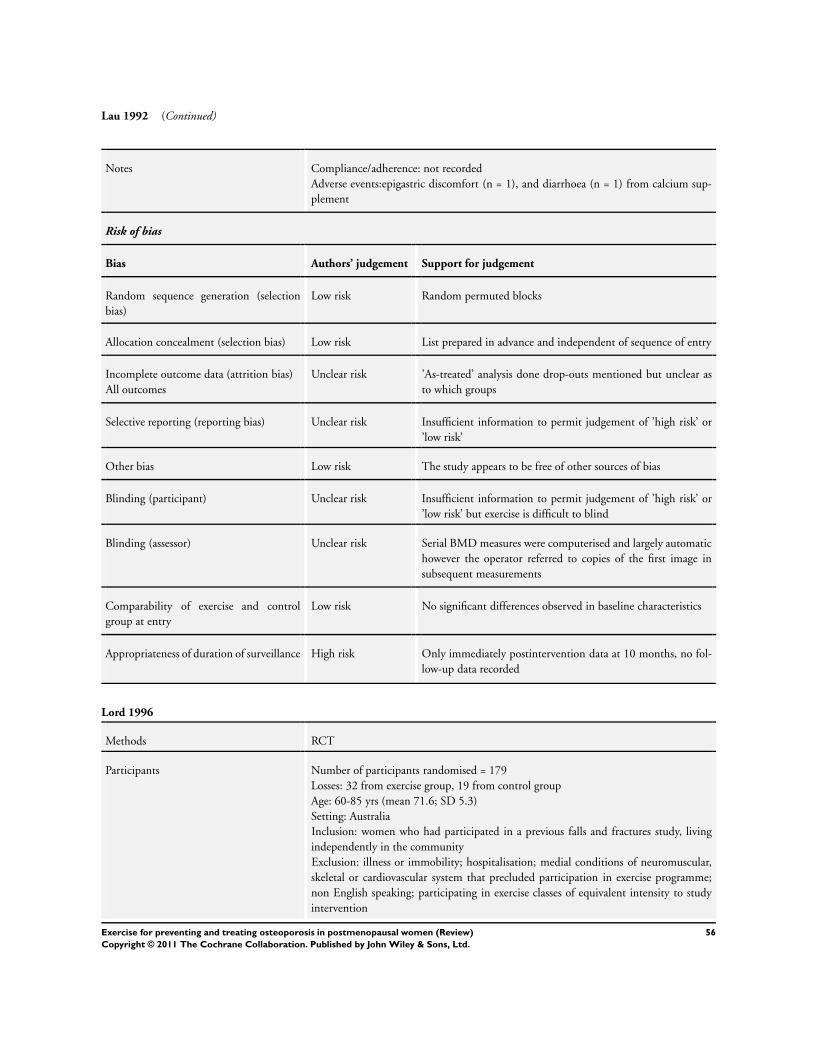
Lau 1992 (Continued)
Notes Compliance/adherence: not recorded
Adverse events:epigastric discomfort (n = 1), and diarrhoea (n = 1) from calcium sup-
plement
Risk of bias
Bias Authors’ judgement Support for judgement
Random sequence generation (selection
bias)
Low risk Random permuted blocks
Allocation concealment (selection bias) Low risk List prepared in advance and independent of sequence of entry
Incomplete outcome data (attrition bias)
All outcomes
Unclear risk ’As-treated’ analysis done drop-outs mentioned but unclear as
to which groups
Selective reporting (reporting bias) Unclear risk Insufficient information to permit judgement of ’high risk’ or
’low risk’
Other bias Low risk The study appears to be free of other sources of bias
Blinding (participant) Unclear risk Insufficient information to permit judgement of ’high risk’ or
’low risk’ but exercise is difficult to blind
Blinding (assessor) Unclear risk Serial BMD measures were computerised and largely automatic
however the operator referred to copies of the first image in
subsequent measurements
Comparability of exercise and control
group at entry
Low risk No significant differences observed in baseline characteristics
Appropriateness of duration of surveillance High risk Only immediately postintervention data at 10 months, no fol-
low-up data recorded
Lord 1996
Methods RCT
Participants Number of participants randomised = 179
Losses: 32 from exercise group, 19 from control group
Age: 60-85 yrs (mean 71.6; SD 5.3)
Setting: Australia
Inclusion: women who had participated in a previous falls and fractures study, living
independently in the community
Exclusion: illness or immobility; hospitalisation; medial conditions of neuromuscular,
skeletal or cardiovascular system that precluded participation in exercise programme;
non English speaking; participating in exercise classes of equivalent intensity to study
intervention
56Exercise for preventing and treating osteoporosis in postmenopausal women (Review)
Copyright © 2011 The Cochrane Collaboration. Published by John Wiley & Sons, Ltd.
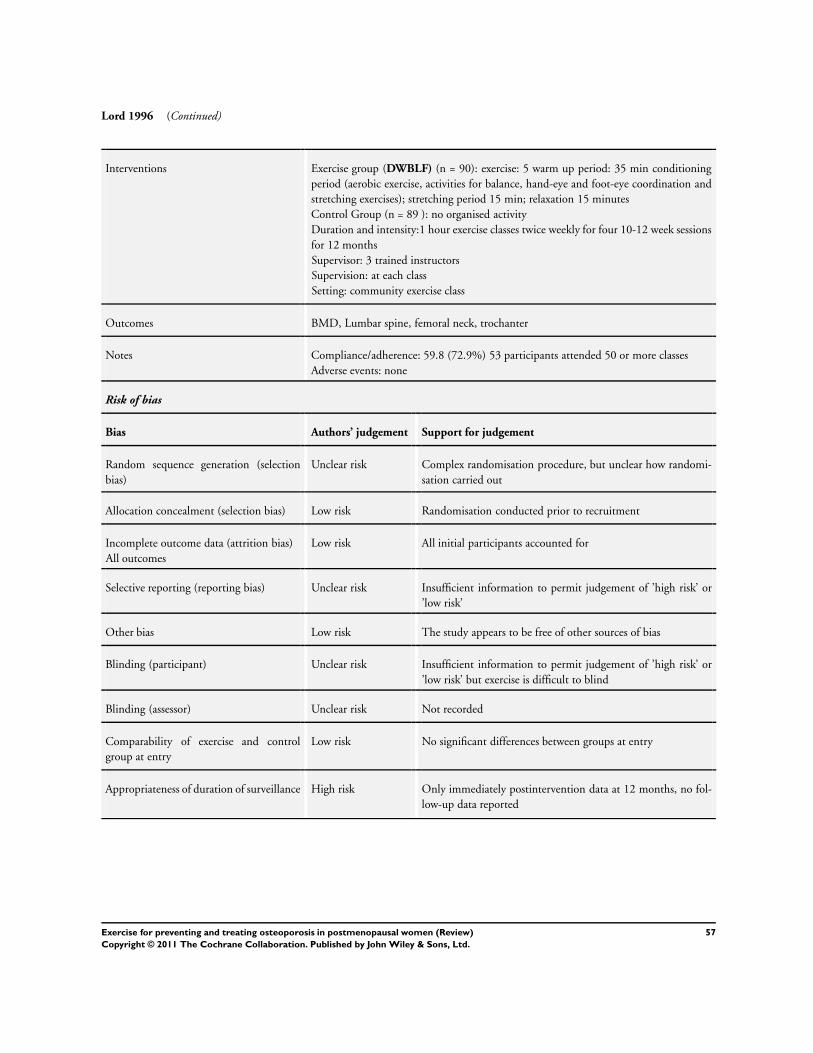
Lord 1996 (Continued)
Interventions Exercise group (DWBLF) (n = 90): exercise: 5 warm up period: 35 min conditioning
period (aerobic exercise, activities for balance, hand-eye and foot-eye coordination and
stretching exercises); stretching period 15 min; relaxation 15 minutes
Control Group (n = 89 ): no organised activity
Duration and intensity:1 hour exercise classes twice weekly for four 10-12 week sessions
for 12 months
Supervisor: 3 trained instructors
Supervision: at each class
Setting: community exercise class
Outcomes BMD, Lumbar spine, femoral neck, trochanter
Notes Compliance/adherence: 59.8 (72.9%) 53 participants attended 50 or more classes
Adverse events: none
Risk of bias
Bias Authors’ judgement Support for judgement
Random sequence generation (selection
bias)
Unclear risk Complex randomisation procedure, but unclear how randomi-
sation carried out
Allocation concealment (selection bias) Low risk Randomisation conducted prior to recruitment
Incomplete outcome data (attrition bias)
All outcomes
Low risk All initial participants accounted for
Selective reporting (reporting bias) Unclear risk Insufficient information to permit judgement of ’high risk’ or
’low risk’
Other bias Low risk The study appears to be free of other sources of bias
Blinding (participant) Unclear risk Insufficient information to permit judgement of ’high risk’ or
’low risk’ but exercise is difficult to blind
Blinding (assessor) Unclear risk Not recorded
Comparability of exercise and control
group at entry
Low risk No significant differences between groups at entry
Appropriateness of duration of surveillance High risk Only immediately postintervention data at 12 months, no fol-
low-up data reported
57Exercise for preventing and treating osteoporosis in postmenopausal women (Review)
Copyright © 2011 The Cochrane Collaboration. Published by John Wiley & Sons, Ltd.
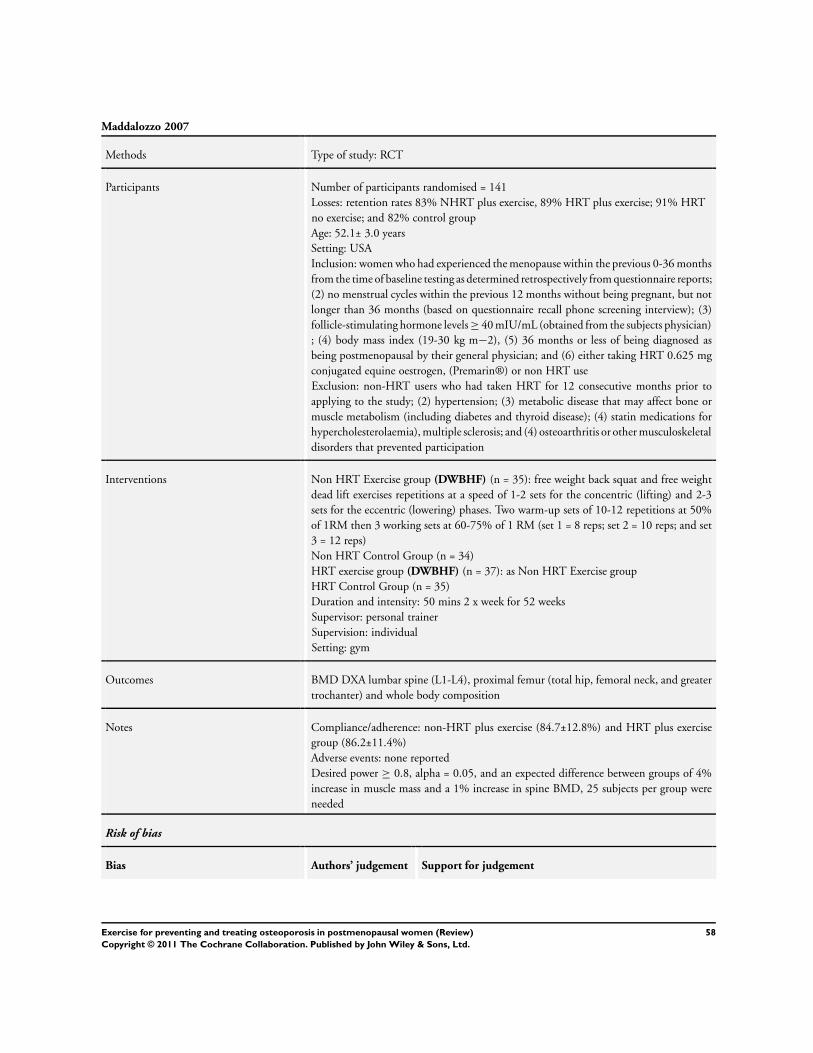
Maddalozzo 2007
Methods Type of study: RCT
Participants Number of participants randomised = 141
Losses: retention rates 83% NHRT plus exercise, 89% HRT plus exercise; 91% HRT
no exercise; and 82% control group
Age: 52.1± 3.0 years
Setting: USA
Inclusion: women who had experienced the menopause within the previous 0-36 months
from the time of baseline testing as determined retrospectively from questionnaire reports;
(2) no menstrual cycles within the previous 12 months without being pregnant, but not
longer than 36 months (based on questionnaire recall phone screening interview); (3)
follicle-stimulating hormone levels ≥ 40 mIU/mL (obtained from the subjects physician)
; (4) body mass index (19-30 kg m−2), (5) 36 months or less of being diagnosed as
being postmenopausal by their general physician; and (6) either taking HRT 0.625 mg
conjugated equine oestrogen, (Premarin®) or non HRT use
Exclusion: non-HRT users who had taken HRT for 12 consecutive months prior to
applying to the study; (2) hypertension; (3) metabolic disease that may affect bone or
muscle metabolism (including diabetes and thyroid disease); (4) statin medications for
hypercholesterolaemia), multiple sclerosis; and (4) osteoarthritis or other musculoskeletal
disorders that prevented participation
Interventions Non HRT Exercise group (DWBHF) (n = 35): free weight back squat and free weight
dead lift exercises repetitions at a speed of 1-2 sets for the concentric (lifting) and 2-3
sets for the eccentric (lowering) phases. Two warm-up sets of 10-12 repetitions at 50%
of 1RM then 3 working sets at 60-75% of 1 RM (set 1 = 8 reps; set 2 = 10 reps; and set
3 = 12 reps)
Non HRT Control Group (n = 34)
HRT exercise group (DWBHF) (n = 37): as Non HRT Exercise group
HRT Control Group (n = 35)
Duration and intensity: 50 mins 2 x week for 52 weeks
Supervisor: personal trainer
Supervision: individual
Setting: gym
Outcomes BMD DXA lumbar spine (L1-L4), proximal femur (total hip, femoral neck, and greater
trochanter) and whole body composition
Notes Compliance/adherence: non-HRT plus exercise (84.7±12.8%) and HRT plus exercise
group (86.2±11.4%)
Adverse events: none reported
Desired power ≥ 0.8, alpha = 0.05, and an expected difference between groups of 4%
increase in muscle mass and a 1% increase in spine BMD, 25 subjects per group were
needed
Risk of bias
Bias Authors’ judgement Support for judgement
58Exercise for preventing and treating osteoporosis in postmenopausal women (Review)
Copyright © 2011 The Cochrane Collaboration. Published by John Wiley & Sons, Ltd.
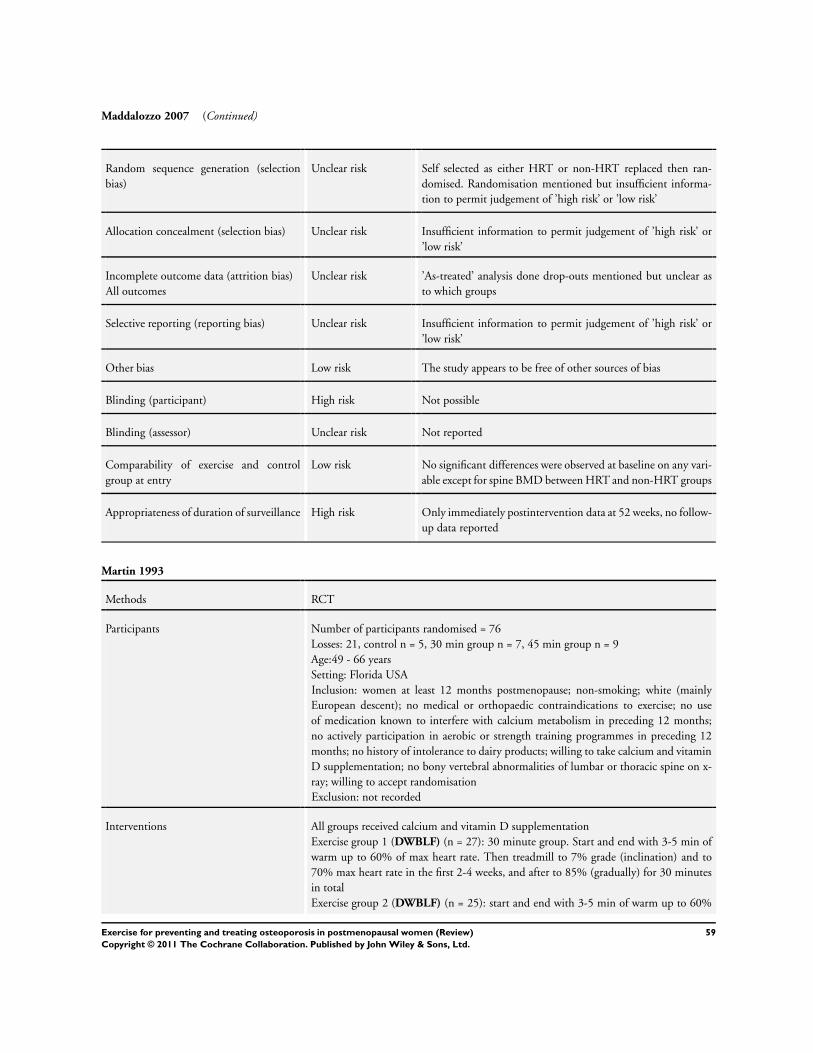
Maddalozzo 2007 (Continued)
Random sequence generation (selection
bias)
Unclear risk Self selected as either HRT or non-HRT replaced then ran-
domised. Randomisation mentioned but insufficient informa-
tion to permit judgement of ’high risk’ or ’low risk’
Allocation concealment (selection bias) Unclear risk Insufficient information to permit judgement of ’high risk’ or
’low risk’
Incomplete outcome data (attrition bias)
All outcomes
Unclear risk ’As-treated’ analysis done drop-outs mentioned but unclear as
to which groups
Selective reporting (reporting bias) Unclear risk Insufficient information to permit judgement of ’high risk’ or
’low risk’
Other bias Low risk The study appears to be free of other sources of bias
Blinding (participant) High risk Not possible
Blinding (assessor) Unclear risk Not reported
Comparability of exercise and control
group at entry
Low risk No significant differences were observed at baseline on any vari-
able except for spine BMD between HRT and non-HRT groups
Appropriateness of duration of surveillance High risk Only immediately postintervention data at 52 weeks, no follow-
up data reported
Martin 1993
Methods RCT
Participants Number of participants randomised = 76
Losses: 21, control n = 5, 30 min group n = 7, 45 min group n = 9
Age:49 - 66 years
Setting: Florida USA
Inclusion: women at least 12 months postmenopause; non-smoking; white (mainly
European descent); no medical or orthopaedic contraindications to exercise; no use
of medication known to interfere with calcium metabolism in preceding 12 months;
no actively participation in aerobic or strength training programmes in preceding 12
months; no history of intolerance to dairy products; willing to take calcium and vitamin
D supplementation; no bony vertebral abnormalities of lumbar or thoracic spine on x-
ray; willing to accept randomisation
Exclusion: not recorded
Interventions All groups received calcium and vitamin D supplementation
Exercise group 1 (DWBLF) (n = 27): 30 minute group. Start and end with 3-5 min of
warm up to 60% of max heart rate. Then treadmill to 7% grade (inclination) and to
70% max heart rate in the first 2-4 weeks, and after to 85% (gradually) for 30 minutes
in total
Exercise group 2 (DWBLF) (n = 25): start and end with 3-5 min of warm up to 60%
59Exercise for preventing and treating osteoporosis in postmenopausal women (Review)
Copyright © 2011 The Cochrane Collaboration. Published by John Wiley & Sons, Ltd.
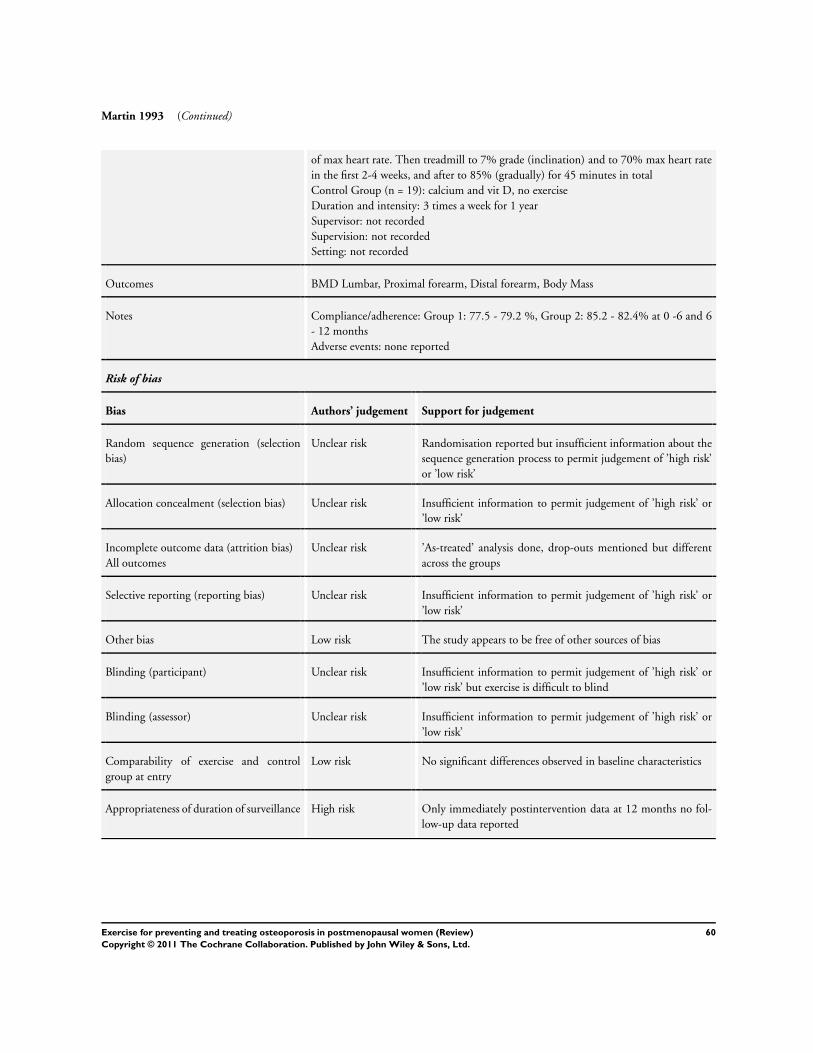
Martin 1993 (Continued)
of max heart rate. Then treadmill to 7% grade (inclination) and to 70% max heart rate
in the first 2-4 weeks, and after to 85% (gradually) for 45 minutes in total
Control Group (n = 19): calcium and vit D, no exercise
Duration and intensity: 3 times a week for 1 year
Supervisor: not recorded
Supervision: not recorded
Setting: not recorded
Outcomes BMD Lumbar, Proximal forearm, Distal forearm, Body Mass
Notes Compliance/adherence: Group 1: 77.5 - 79.2 %, Group 2: 85.2 - 82.4% at 0 -6 and 6
- 12 months
Adverse events: none reported
Risk of bias
Bias Authors’ judgement Support for judgement
Random sequence generation (selection
bias)
Unclear risk Randomisation reported but insufficient information about the
sequence generation process to permit judgement of ’high risk’
or ’low risk’
Allocation concealment (selection bias) Unclear risk Insufficient information to permit judgement of ’high risk’ or
’low risk’
Incomplete outcome data (attrition bias)
All outcomes
Unclear risk ’As-treated’ analysis done, drop-outs mentioned but different
across the groups
Selective reporting (reporting bias) Unclear risk Insufficient information to permit judgement of ’high risk’ or
’low risk’
Other bias Low risk The study appears to be free of other sources of bias
Blinding (participant) Unclear risk Insufficient information to permit judgement of ’high risk’ or
’low risk’ but exercise is difficult to blind
Blinding (assessor) Unclear risk Insufficient information to permit judgement of ’high risk’ or
’low risk’
Comparability of exercise and control
group at entry
Low risk No significant differences observed in baseline characteristics
Appropriateness of duration of surveillance High risk Only immediately postintervention data at 12 months no fol-
low-up data reported
60Exercise for preventing and treating osteoporosis in postmenopausal women (Review)
Copyright © 2011 The Cochrane Collaboration. Published by John Wiley & Sons, Ltd.
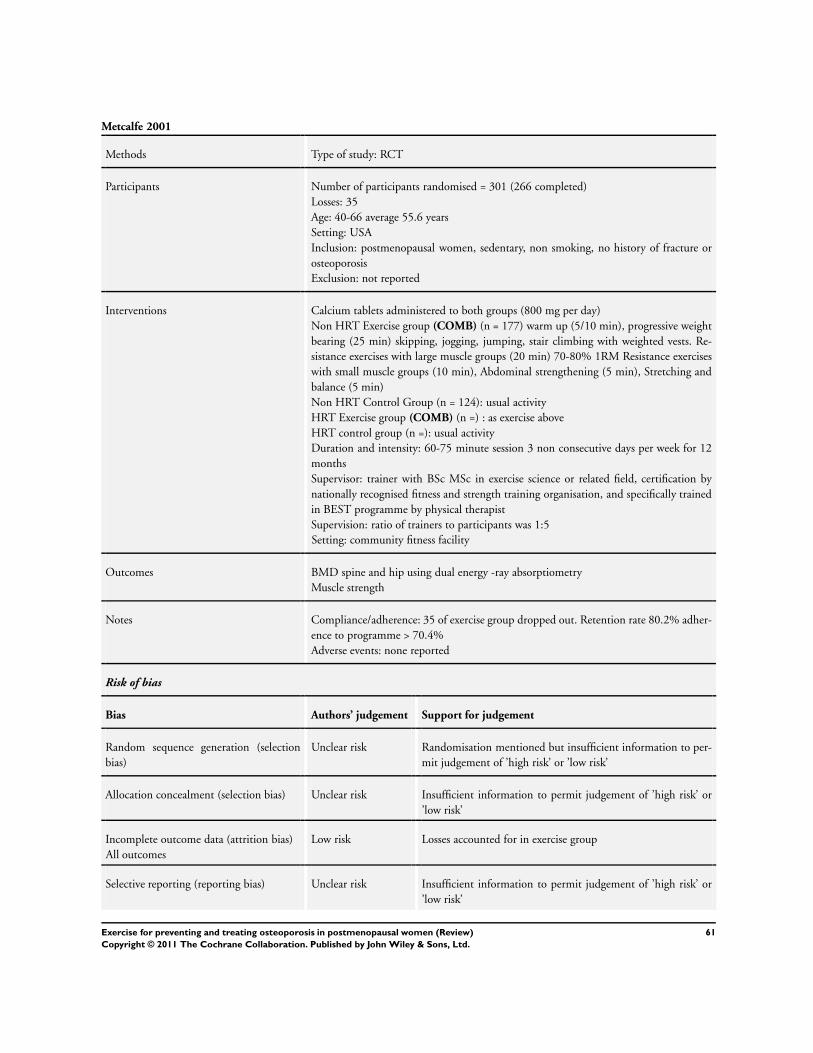
Metcalfe 2001
Methods Type of study: RCT
Participants Number of participants randomised = 301 (266 completed)
Losses: 35
Age: 40-66 average 55.6 years
Setting: USA
Inclusion: postmenopausal women, sedentary, non smoking, no history of fracture or
osteoporosis
Exclusion: not reported
Interventions Calcium tablets administered to both groups (800 mg per day)
Non HRT Exercise group (COMB) (n = 177) warm up (5/10 min), progressive weight
bearing (25 min) skipping, jogging, jumping, stair climbing with weighted vests. Re-
sistance exercises with large muscle groups (20 min) 70-80% 1RM Resistance exercises
with small muscle groups (10 min), Abdominal strengthening (5 min), Stretching and
balance (5 min)
Non HRT Control Group (n = 124): usual activity
HRT Exercise group (COMB) (n =) : as exercise above
HRT control group (n =): usual activity
Duration and intensity: 60-75 minute session 3 non consecutive days per week for 12
months
Supervisor: trainer with BSc MSc in exercise science or related field, certification by
nationally recognised fitness and strength training organisation, and specifically trained
in BEST programme by physical therapist
Supervision: ratio of trainers to participants was 1:5
Setting: community fitness facility
Outcomes BMD spine and hip using dual energy -ray absorptiometry
Muscle strength
Notes Compliance/adherence: 35 of exercise group dropped out. Retention rate 80.2% adher-
ence to programme > 70.4%
Adverse events: none reported
Risk of bias
Bias Authors’ judgement Support for judgement
Random sequence generation (selection
bias)
Unclear risk Randomisation mentioned but insufficient information to per-
mit judgement of ’high risk’ or ’low risk’
Allocation concealment (selection bias) Unclear risk Insufficient information to permit judgement of ’high risk’ or
’low risk’
Incomplete outcome data (attrition bias)
All outcomes
Low risk Losses accounted for in exercise group
Selective reporting (reporting bias) Unclear risk Insufficient information to permit judgement of ’high risk’ or
’low risk’
61Exercise for preventing and treating osteoporosis in postmenopausal women (Review)
Copyright © 2011 The Cochrane Collaboration. Published by John Wiley & Sons, Ltd.
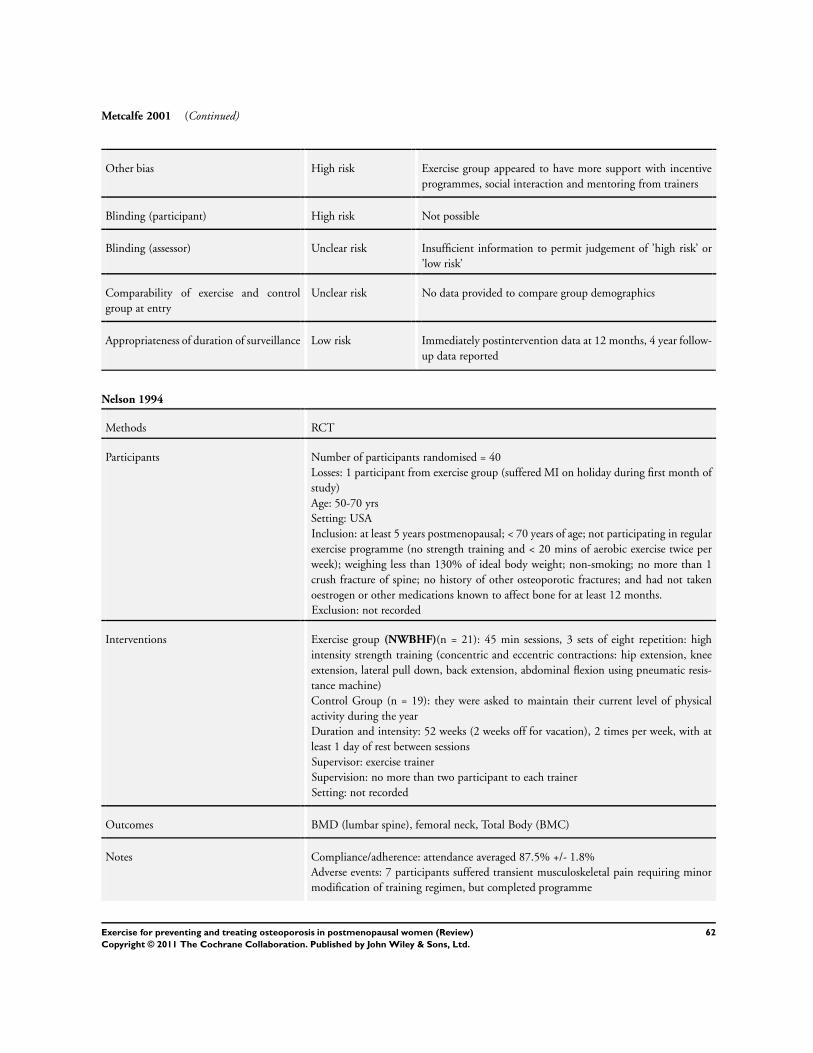
Metcalfe 2001 (Continued)
Other bias High risk Exercise group appeared to have more support with incentive
programmes, social interaction and mentoring from trainers
Blinding (participant) High risk Not possible
Blinding (assessor) Unclear risk Insufficient information to permit judgement of ’high risk’ or
’low risk’
Comparability of exercise and control
group at entry
Unclear risk No data provided to compare group demographics
Appropriateness of duration of surveillance Low risk Immediately postintervention data at 12 months, 4 year follow-
up data reported
Nelson 1994
Methods RCT
Participants Number of participants randomised = 40
Losses: 1 participant from exercise group (suffered MI on holiday during first month of
study)
Age: 50-70 yrs
Setting: USA
Inclusion: at least 5 years postmenopausal; < 70 years of age; not participating in regular
exercise programme (no strength training and < 20 mins of aerobic exercise twice per
week); weighing less than 130% of ideal body weight; non-smoking; no more than 1
crush fracture of spine; no history of other osteoporotic fractures; and had not taken
oestrogen or other medications known to affect bone for at least 12 months.
Exclusion: not recorded
Interventions Exercise group (NWBHF)(n = 21): 45 min sessions, 3 sets of eight repetition: high
intensity strength training (concentric and eccentric contractions: hip extension, knee
extension, lateral pull down, back extension, abdominal flexion using pneumatic resis-
tance machine)
Control Group (n = 19): they were asked to maintain their current level of physical
activity during the year
Duration and intensity: 52 weeks (2 weeks off for vacation), 2 times per week, with at
least 1 day of rest between sessions
Supervisor: exercise trainer
Supervision: no more than two participant to each trainer
Setting: not recorded
Outcomes BMD (lumbar spine), femoral neck, Total Body (BMC)
Notes Compliance/adherence: attendance averaged 87.5% +/- 1.8%
Adverse events: 7 participants suffered transient musculoskeletal pain requiring minor
modification of training regimen, but completed programme
62Exercise for preventing and treating osteoporosis in postmenopausal women (Review)
Copyright © 2011 The Cochrane Collaboration. Published by John Wiley & Sons, Ltd.
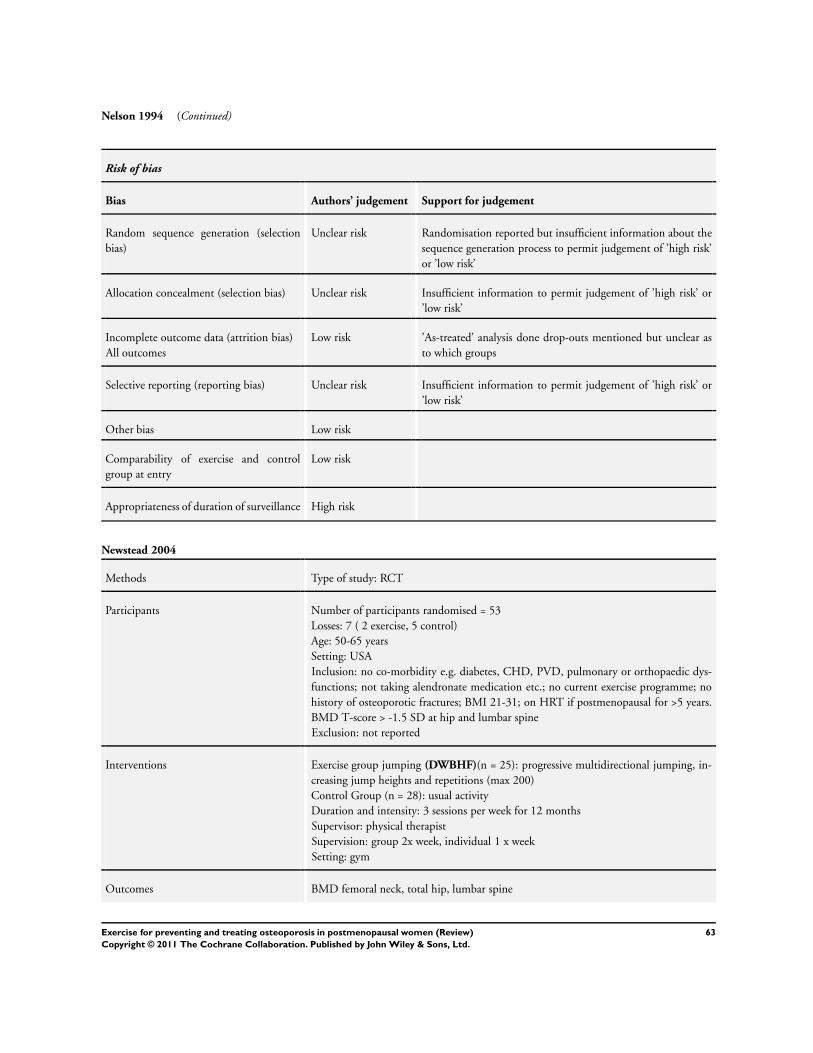
Nelson 1994 (Continued)
Risk of bias
Bias Authors’ judgement Support for judgement
Random sequence generation (selection
bias)
Unclear risk Randomisation reported but insufficient information about the
sequence generation process to permit judgement of ’high risk’
or ’low risk’
Allocation concealment (selection bias) Unclear risk Insufficient information to permit judgement of ’high risk’ or
’low risk’
Incomplete outcome data (attrition bias)
All outcomes
Low risk ’As-treated’ analysis done drop-outs mentioned but unclear as
to which groups
Selective reporting (reporting bias) Unclear risk Insufficient information to permit judgement of ’high risk’ or
’low risk’
Other bias Low risk
Comparability of exercise and control
group at entry
Low risk
Appropriateness of duration of surveillance High risk
Newstead 2004
Methods Type of study: RCT
Participants Number of participants randomised = 53
Losses: 7 ( 2 exercise, 5 control)
Age: 50-65 years
Setting: USA
Inclusion: no co-morbidity e.g. diabetes, CHD, PVD, pulmonary or orthopaedic dys-
functions; not taking alendronate medication etc.; no current exercise programme; no
history of osteoporotic fractures; BMI 21-31; on HRT if postmenopausal for >5 years.
BMD T-score > -1.5 SD at hip and lumbar spine
Exclusion: not reported
Interventions Exercise group jumping (DWBHF)(n = 25): progressive multidirectional jumping, in-
creasing jump heights and repetitions (max 200)
Control Group (n = 28): usual activity
Duration and intensity: 3 sessions per week for 12 months
Supervisor: physical therapist
Supervision: group 2x week, individual 1 x week
Setting: gym
Outcomes BMD femoral neck, total hip, lumbar spine
63Exercise for preventing and treating osteoporosis in postmenopausal women (Review)
Copyright © 2011 The Cochrane Collaboration. Published by John Wiley & Sons, Ltd.
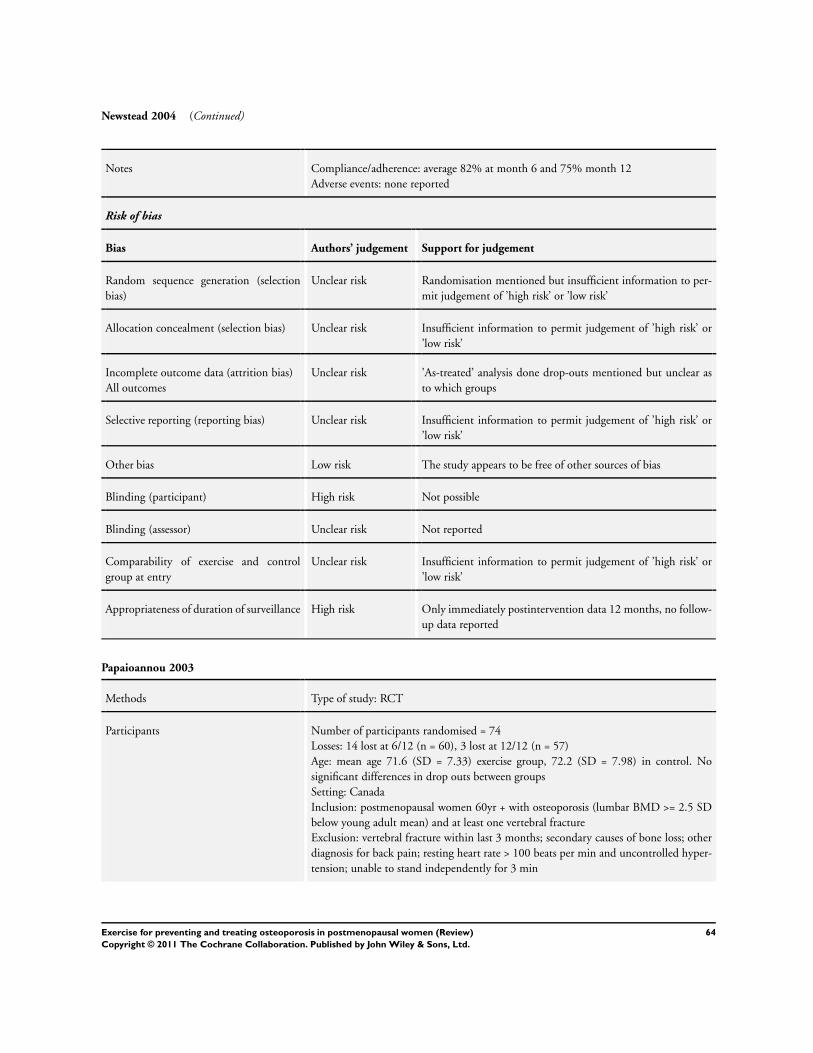
Newstead 2004 (Continued)
Notes Compliance/adherence: average 82% at month 6 and 75% month 12
Adverse events: none reported
Risk of bias
Bias Authors’ judgement Support for judgement
Random sequence generation (selection
bias)
Unclear risk Randomisation mentioned but insufficient information to per-
mit judgement of ’high risk’ or ’low risk’
Allocation concealment (selection bias) Unclear risk Insufficient information to permit judgement of ’high risk’ or
’low risk’
Incomplete outcome data (attrition bias)
All outcomes
Unclear risk ’As-treated’ analysis done drop-outs mentioned but unclear as
to which groups
Selective reporting (reporting bias) Unclear risk Insufficient information to permit judgement of ’high risk’ or
’low risk’
Other bias Low risk The study appears to be free of other sources of bias
Blinding (participant) High risk Not possible
Blinding (assessor) Unclear risk Not reported
Comparability of exercise and control
group at entry
Unclear risk Insufficient information to permit judgement of ’high risk’ or
’low risk’
Appropriateness of duration of surveillance High risk Only immediately postintervention data 12 months, no follow-
up data reported
Papaioannou 2003
Methods Type of study: RCT
Participants Number of participants randomised = 74
Losses: 14 lost at 6/12 (n = 60), 3 lost at 12/12 (n = 57)
Age: mean age 71.6 (SD = 7.33) exercise group, 72.2 (SD = 7.98) in control. No
significant differences in drop outs between groups
Setting: Canada
Inclusion: postmenopausal women 60yr + with osteoporosis (lumbar BMD >= 2.5 SD
below young adult mean) and at least one vertebral fracture
Exclusion: vertebral fracture within last 3 months; secondary causes of bone loss; other
diagnosis for back pain; resting heart rate > 100 beats per min and uncontrolled hyper-
tension; unable to stand independently for 3 min
64Exercise for preventing and treating osteoporosis in postmenopausal women (Review)
Copyright © 2011 The Cochrane Collaboration. Published by John Wiley & Sons, Ltd.
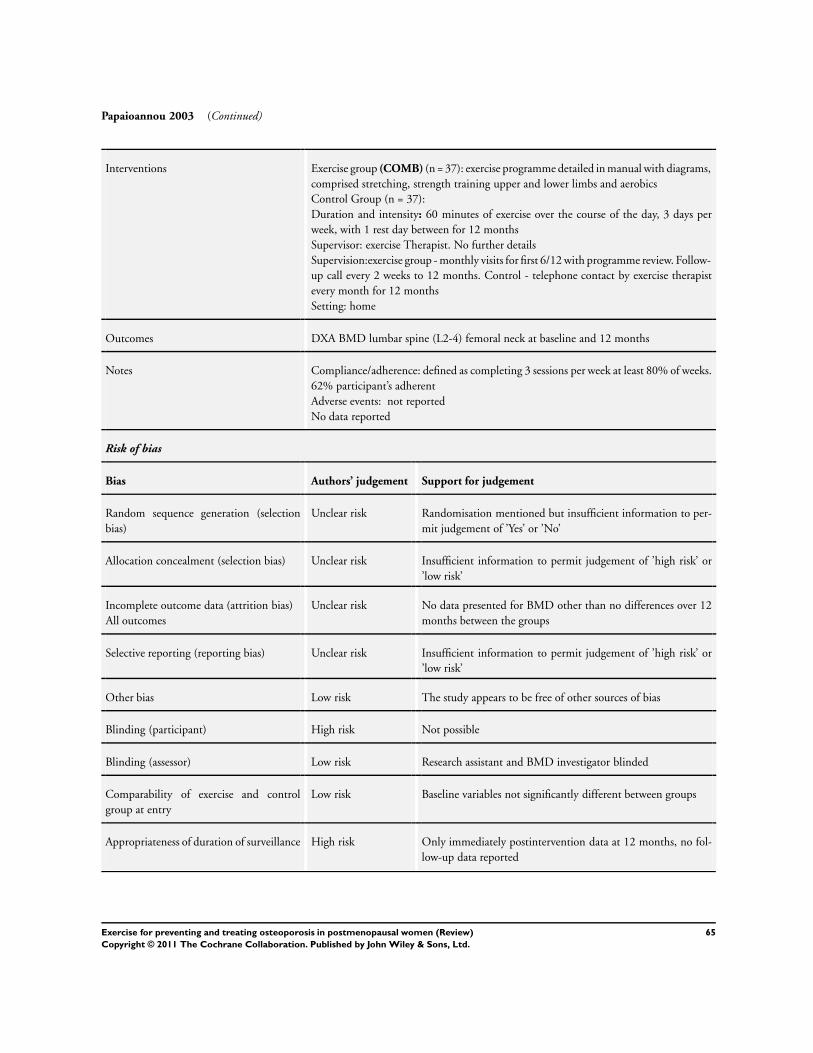
Papaioannou 2003 (Continued)
Interventions Exercise group (COMB) (n = 37): exercise programme detailed in manual with diagrams,
comprised stretching, strength training upper and lower limbs and aerobics
Control Group (n = 37):
Duration and intensity: 60 minutes of exercise over the course of the day, 3 days per
week, with 1 rest day between for 12 months
Supervisor: exercise Therapist. No further details
Supervision:exercise group - monthly visits for first 6/12 with programme review. Follow-
up call every 2 weeks to 12 months. Control - telephone contact by exercise therapist
every month for 12 months
Setting: home
Outcomes DXA BMD lumbar spine (L2-4) femoral neck at baseline and 12 months
Notes Compliance/adherence: defined as completing 3 sessions per week at least 80% of weeks.
62% participant’s adherent
Adverse events: not reported
No data reported
Risk of bias
Bias Authors’ judgement Support for judgement
Random sequence generation (selection
bias)
Unclear risk Randomisation mentioned but insufficient information to per-
mit judgement of ’Yes’ or ’No’
Allocation concealment (selection bias) Unclear risk Insufficient information to permit judgement of ’high risk’ or
’low risk’
Incomplete outcome data (attrition bias)
All outcomes
Unclear risk No data presented for BMD other than no differences over 12
months between the groups
Selective reporting (reporting bias) Unclear risk Insufficient information to permit judgement of ’high risk’ or
’low risk’
Other bias Low risk The study appears to be free of other sources of bias
Blinding (participant) High risk Not possible
Blinding (assessor) Low risk Research assistant and BMD investigator blinded
Comparability of exercise and control
group at entry
Low risk Baseline variables not significantly different between groups
Appropriateness of duration of surveillance High risk Only immediately postintervention data at 12 months, no fol-
low-up data reported
65Exercise for preventing and treating osteoporosis in postmenopausal women (Review)
Copyright © 2011 The Cochrane Collaboration. Published by John Wiley & Sons, Ltd.
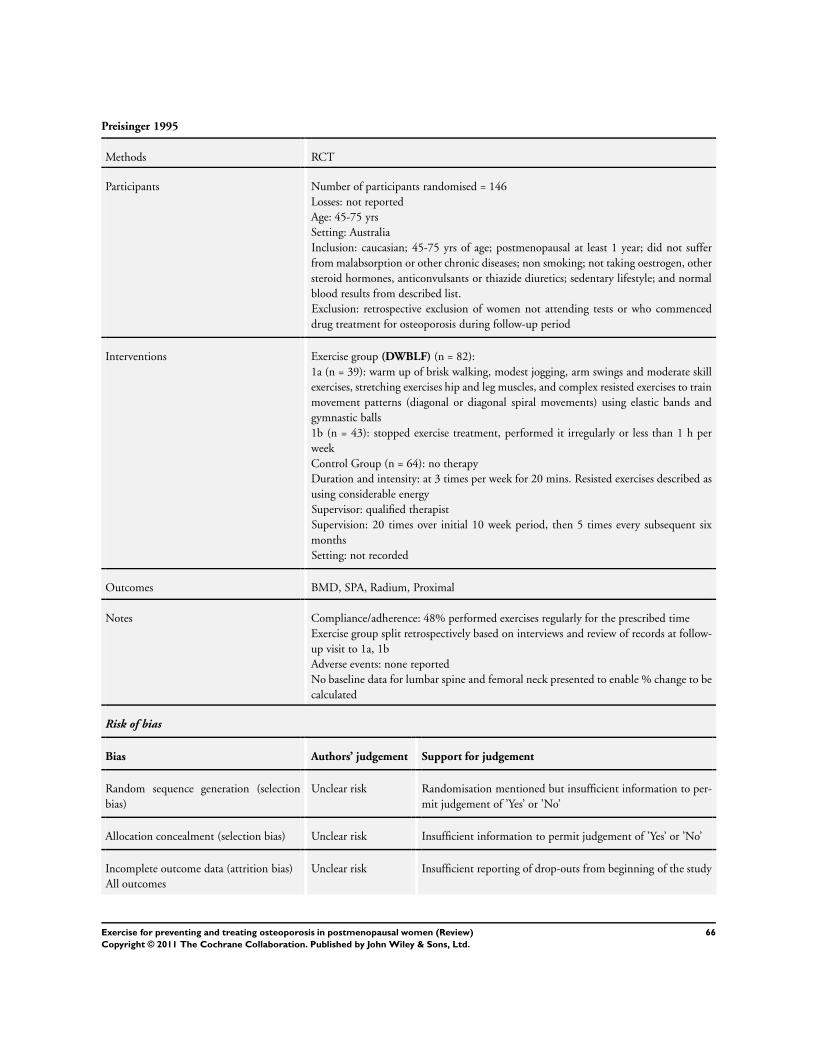
Preisinger 1995
Methods RCT
Participants Number of participants randomised = 146
Losses: not reported
Age: 45-75 yrs
Setting: Australia
Inclusion: caucasian; 45-75 yrs of age; postmenopausal at least 1 year; did not suffer
from malabsorption or other chronic diseases; non smoking; not taking oestrogen, other
steroid hormones, anticonvulsants or thiazide diuretics; sedentary lifestyle; and normal
blood results from described list.
Exclusion: retrospective exclusion of women not attending tests or who commenced
drug treatment for osteoporosis during follow-up period
Interventions Exercise group (DWBLF) (n = 82):
1a (n = 39): warm up of brisk walking, modest jogging, arm swings and moderate skill
exercises, stretching exercises hip and leg muscles, and complex resisted exercises to train
movement patterns (diagonal or diagonal spiral movements) using elastic bands and
gymnastic balls
1b (n = 43): stopped exercise treatment, performed it irregularly or less than 1 h per
week
Control Group (n = 64): no therapy
Duration and intensity: at 3 times per week for 20 mins. Resisted exercises described as
using considerable energy
Supervisor: qualified therapist
Supervision: 20 times over initial 10 week period, then 5 times every subsequent six
months
Setting: not recorded
Outcomes BMD, SPA, Radium, Proximal
Notes Compliance/adherence: 48% performed exercises regularly for the prescribed time
Exercise group split retrospectively based on interviews and review of records at follow-
up visit to 1a, 1b
Adverse events: none reported
No baseline data for lumbar spine and femoral neck presented to enable % change to be
calculated
Risk of bias
Bias Authors’ judgement Support for judgement
Random sequence generation (selection
bias)
Unclear risk Randomisation mentioned but insufficient information to per-
mit judgement of ’Yes’ or ’No’
Allocation concealment (selection bias) Unclear risk Insufficient information to permit judgement of ’Yes’ or ’No’
Incomplete outcome data (attrition bias)
All outcomes
Unclear risk Insufficient reporting of drop-outs from beginning of the study
66Exercise for preventing and treating osteoporosis in postmenopausal women (Review)
Copyright © 2011 The Cochrane Collaboration. Published by John Wiley & Sons, Ltd.
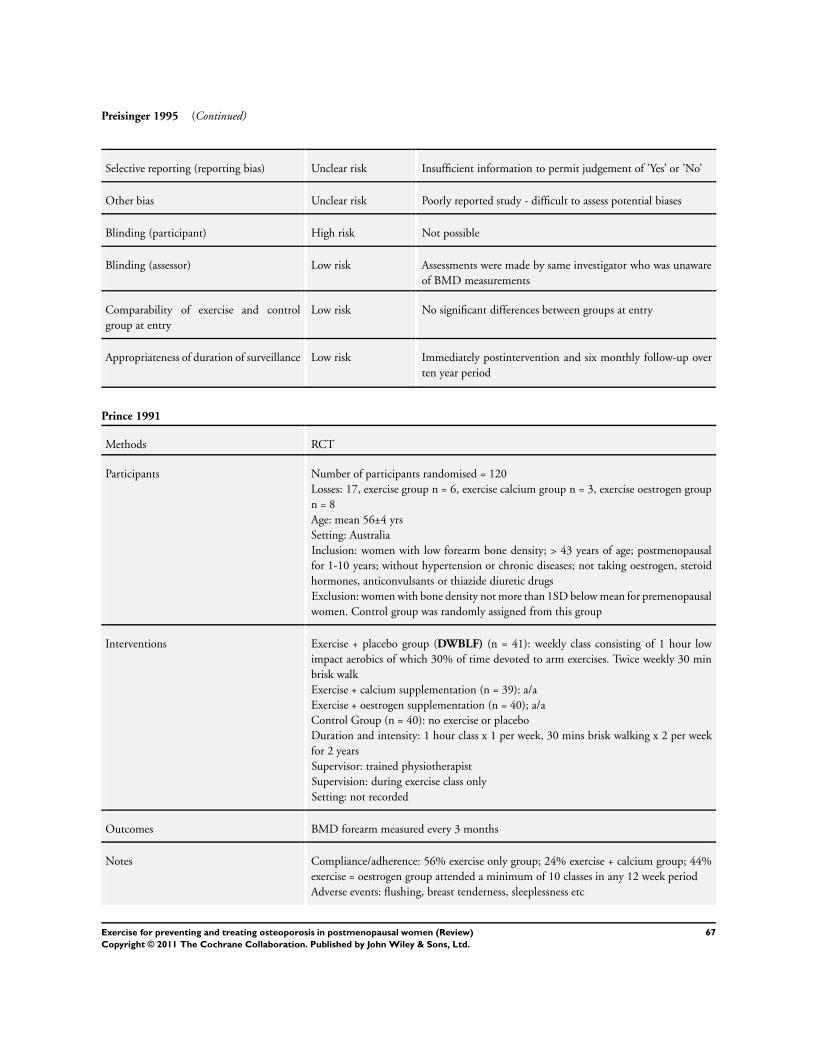
Preisinger 1995 (Continued)
Selective reporting (reporting bias) Unclear risk Insufficient information to permit judgement of ’Yes’ or ’No’
Other bias Unclear risk Poorly reported study - difficult to assess potential biases
Blinding (participant) High risk Not possible
Blinding (assessor) Low risk Assessments were made by same investigator who was unaware
of BMD measurements
Comparability of exercise and control
group at entry
Low risk No significant differences between groups at entry
Appropriateness of duration of surveillance Low risk Immediately postintervention and six monthly follow-up over
ten year period
Prince 1991
Methods RCT
Participants Number of participants randomised = 120
Losses: 17, exercise group n = 6, exercise calcium group n = 3, exercise oestrogen group
n = 8
Age: mean 56±4 yrs
Setting: Australia
Inclusion: women with low forearm bone density; > 43 years of age; postmenopausal
for 1-10 years; without hypertension or chronic diseases; not taking oestrogen, steroid
hormones, anticonvulsants or thiazide diuretic drugs
Exclusion: women with bone density not more than 1SD below mean for premenopausal
women. Control group was randomly assigned from this group
Interventions Exercise + placebo group (DWBLF) (n = 41): weekly class consisting of 1 hour low
impact aerobics of which 30% of time devoted to arm exercises. Twice weekly 30 min
brisk walk
Exercise + calcium supplementation (n = 39): a/a
Exercise + oestrogen supplementation (n = 40); a/a
Control Group (n = 40): no exercise or placebo
Duration and intensity: 1 hour class x 1 per week, 30 mins brisk walking x 2 per week
for 2 years
Supervisor: trained physiotherapist
Supervision: during exercise class only
Setting: not recorded
Outcomes BMD forearm measured every 3 months
Notes Compliance/adherence: 56% exercise only group; 24% exercise + calcium group; 44%
exercise = oestrogen group attended a minimum of 10 classes in any 12 week period
Adverse events: flushing, breast tenderness, sleeplessness etc
67Exercise for preventing and treating osteoporosis in postmenopausal women (Review)
Copyright © 2011 The Cochrane Collaboration. Published by John Wiley & Sons, Ltd.
Prince 1991 (Continued)
Risk of bias
Bias Authors’ judgement Support for judgement
Random sequence generation (selection
bias)
Low risk Shuffling of sealed envelopes
Allocation concealment (selection bias) Low risk Only pharmacist knew assignments
Incomplete outcome data (attrition bias)
All outcomes
Unclear risk Unclear why so many of the exercise groups dropped out or did
not complete sufficient exercise classes
Selective reporting (reporting bias) Unclear risk Insufficient information to permit judgement of ’Yes’ or ’No’
Other bias High risk Drug company Upjohn Australia supplied medication and sup-
ported research
Blinding (participant) High risk Not possible
Blinding (assessor) Unclear risk Insufficient information to permit judgement of ’Yes’ or ’No’
Comparability of exercise and control
group at entry
High risk Control group had normal BMD, and had been postmenopausal
for less time (5.8±2.6 v 4.5±2.1)
Appropriateness of duration of surveillance Low risk Only immediately postintervention data at 2 years, no follow-
up data recorded
Prince 1995
Methods RCT
Participants Number of participants randomised = 168
Losses: not recorded
Age: 50-70 yrs
Setting: Australia
Inclusion: 50-70 yrs of age, > 10 yrs postmenopausal
Exclusion: significant chronic diseases, had received oestrogen, other steroid hormones,
anticonvulsants, thiazide diuretic drugs or medications that could influence calcium
metabolism
Interventions Exercise group + calcium (DWBLF) (n = 42): 2 x 1 hour supervised classes comprising
weight bearing exercise (not specified)
Calcium group (n = 42): no exercise
Milk powder group (n = 42): no exercise
Control Group (n = 42): placebo medication only
Duration and intensity: 4 hours per week, at 60% of peak maximal heart rate for age for
2 years
68Exercise for preventing and treating osteoporosis in postmenopausal women (Review)
Copyright © 2011 The Cochrane Collaboration. Published by John Wiley & Sons, Ltd.
Prince 1995 (Continued)
Supervisor: not recorded
Supervision: supervision during exercise class
Setting: not stated
Outcomes BMD lumbar spine, hip, distal tibia/fibula at baseline, 6, 12 18 and 24 months
Notes Compliance/adherence: 39% of exercise group exercised for 3 hours per week at 60%
peak heart rate
Adverse events: not reported
Risk of bias
Bias Authors’ judgement Support for judgement
Random sequence generation (selection
bias)
Low risk Block randomisation with sealed envelopes prior to study com-
mencing
Allocation concealment (selection bias) Low risk Sealed envelopes
Incomplete outcome data (attrition bias)
All outcomes
Unclear risk ’As-treated’ analysis done no drop-outs mentioned and no indi-
cation of numbers in each group
Selective reporting (reporting bias) Unclear risk Insufficient information to permit judgement of ’high risk’ or
’low risk’
Other bias High risk Drug company supplied placebo and calcium tablets
Blinding (participant) High risk Not possible
Comparability of exercise and control
group at entry
Low risk
Appropriateness of duration of surveillance High risk
Pruitt 1996
Methods RCT
Participants Number of participants randomised = 40
Losses: 14
Age: 65-82 years
Setting: America
Inclusion: Healthy caucasian women not currently taking HRT, or those on HRT for 1
year or more
Exclusion: evidence of acute or uncontrolled chronic illness or conditions that would
prevent participation in exercise class, vertebral compression fractures, disorders affecting
bone metabolism
69Exercise for preventing and treating osteoporosis in postmenopausal women (Review)
Copyright © 2011 The Cochrane Collaboration. Published by John Wiley & Sons, Ltd.
Pruitt 1996 (Continued)
Interventions Exercise group 1 (NWBHF) (n = 15): supervised exercise session comprising bench press,
lateral pull down, military press, biceps curl, knee extension, knee flexion, hip abduction
and adduction, leg press, back extension. 1 set 14 reps at 40% 1RM, 2 sets 7 reps at 80%
1RM
Exercise group 2 (NWBLF) (n = 13): a/a 3 sets 12 reps at 40% 1RM
Control Group (n = 12): no exercises
Duration and intensity: 3 times per week for 12 months, lifting time 50 -55mins. 1RM
tests administered every 2 weeks for first 3 months then every 3 weeks to adjust workload
Supervisor: not recorded
Supervision: every session
Setting: Gym
Outcomes BMD lumbar spine, hip (total hip, neck of femur, Wards triangle) at baseline and 12
months
Notes Compliance/adherence: 65%
Adverse events: aggravation of pre-existing back or knee condition (n = 2)
Risk of bias
Bias Authors’ judgement Support for judgement
Random sequence generation (selection
bias)
Unclear risk Randomisation reported but insufficient information about the
sequence generation process to permit judgement of ’high risk’
or ’low risk’
Allocation concealment (selection bias) Unclear risk Insufficient information to permit judgement of ’high risk’ or
’low risk’
Incomplete outcome data (attrition bias)
All outcomes
Unclear risk ’As-treated’ analysis done drop-outs mentioned but different
across the groups
Selective reporting (reporting bias) Unclear risk Insufficient information to permit judgement of ’high risk’ or
’low risk’. One outlier whose spinal BMD was more than 4SD
from group mean was not included in analysis
Other bias Low risk The study appears to be free of other sources of bias
Blinding (participant) High risk Not possible
Blinding (assessor) Unclear risk Insufficient information to permit judgement of ’high risk’ or
’low risk’
Comparability of exercise and control
group at entry
Low risk No significant differences observed in baseline characteristics
Appropriateness of duration of surveillance High risk Only immediately postintervention data at 12 months, no fol-
low-up data reported
70Exercise for preventing and treating osteoporosis in postmenopausal women (Review)
Copyright © 2011 The Cochrane Collaboration. Published by John Wiley & Sons, Ltd.
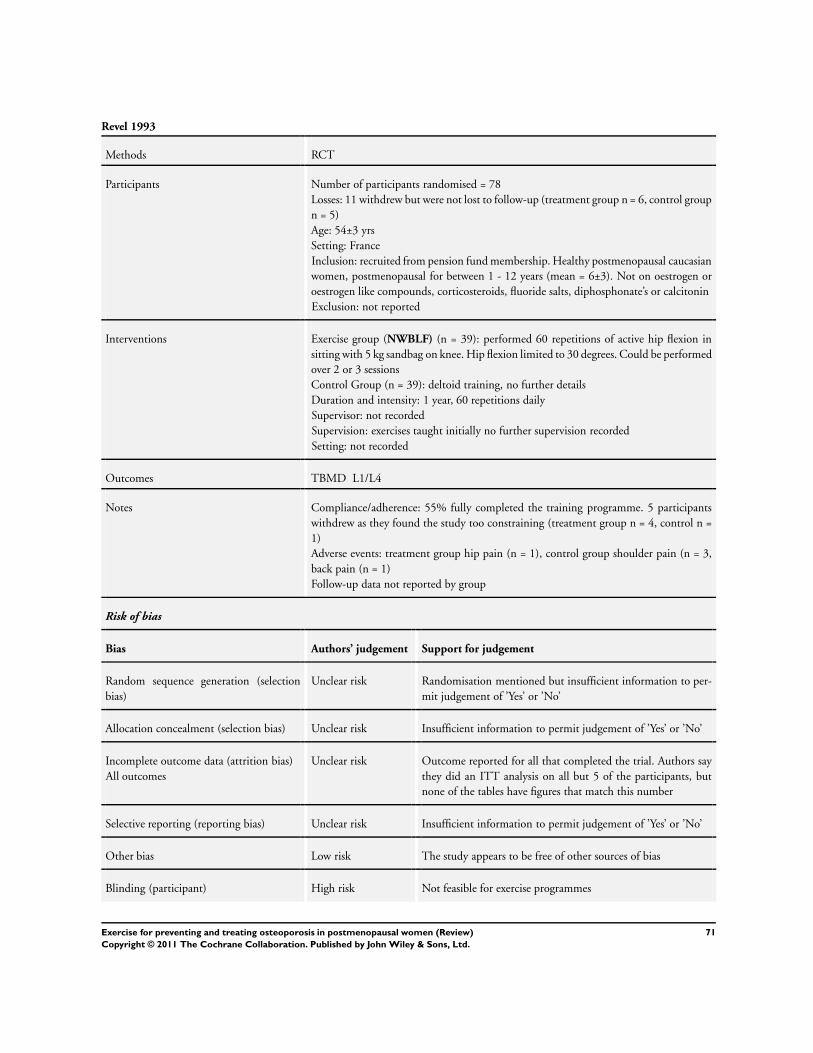
Revel 1993
Methods RCT
Participants Number of participants randomised = 78
Losses: 11 withdrew but were not lost to follow-up (treatment group n = 6, control group
n = 5)
Age: 54±3 yrs
Setting: France
Inclusion: recruited from pension fund membership. Healthy postmenopausal caucasian
women, postmenopausal for between 1 - 12 years (mean = 6±3). Not on oestrogen or
oestrogen like compounds, corticosteroids, fluoride salts, diphosphonate’s or calcitonin
Exclusion: not reported
Interventions Exercise group (NWBLF) (n = 39): performed 60 repetitions of active hip flexion in
sitting with 5 kg sandbag on knee. Hip flexion limited to 30 degrees. Could be performed
over 2 or 3 sessions
Control Group (n = 39): deltoid training, no further details
Duration and intensity: 1 year, 60 repetitions daily
Supervisor: not recorded
Supervision: exercises taught initially no further supervision recorded
Setting: not recorded
Outcomes TBMD L1/L4
Notes Compliance/adherence: 55% fully completed the training programme. 5 participants
withdrew as they found the study too constraining (treatment group n = 4, control n =
1)
Adverse events: treatment group hip pain (n = 1), control group shoulder pain (n = 3,
back pain (n = 1)
Follow-up data not reported by group
Risk of bias
Bias Authors’ judgement Support for judgement
Random sequence generation (selection
bias)
Unclear risk Randomisation mentioned but insufficient information to per-
mit judgement of ’Yes’ or ’No’
Allocation concealment (selection bias) Unclear risk Insufficient information to permit judgement of ’Yes’ or ’No’
Incomplete outcome data (attrition bias)
All outcomes
Unclear risk Outcome reported for all that completed the trial. Authors say
they did an ITT analysis on all but 5 of the participants, but
none of the tables have figures that match this number
Selective reporting (reporting bias) Unclear risk Insufficient information to permit judgement of ’Yes’ or ’No’
Other bias Low risk The study appears to be free of other sources of bias
Blinding (participant) High risk Not feasible for exercise programmes
71Exercise for preventing and treating osteoporosis in postmenopausal women (Review)
Copyright © 2011 The Cochrane Collaboration. Published by John Wiley & Sons, Ltd.
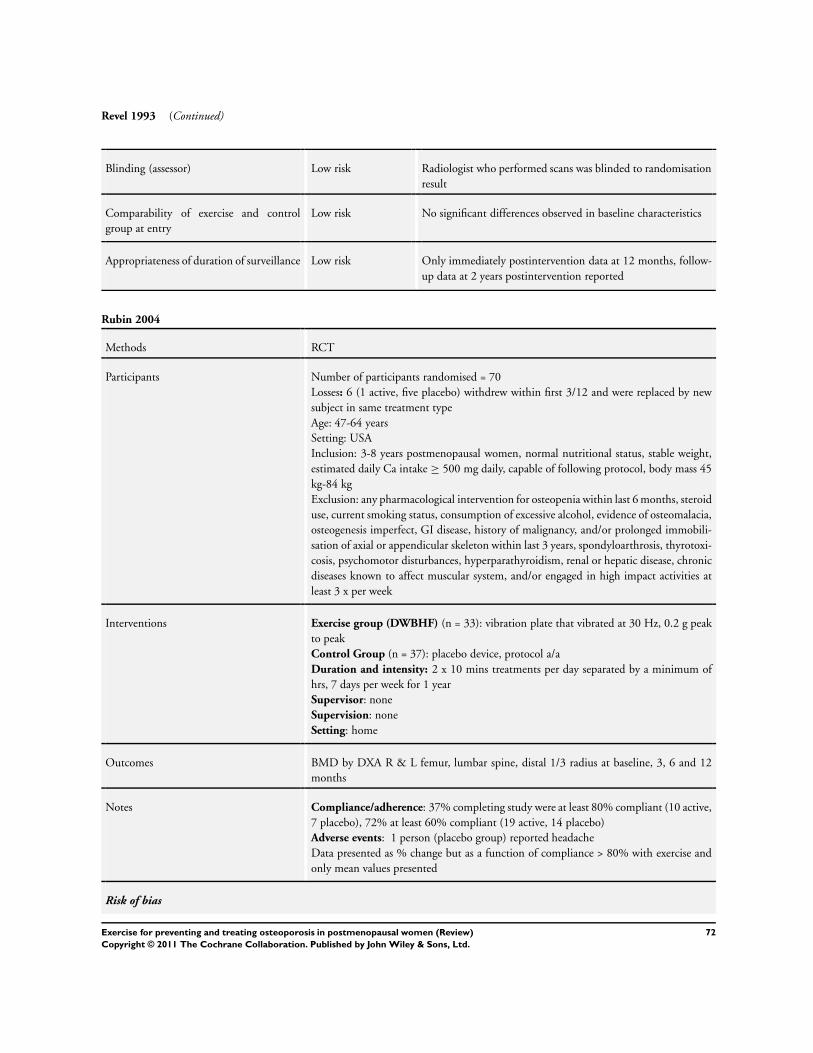
Revel 1993 (Continued)
Blinding (assessor) Low risk Radiologist who performed scans was blinded to randomisation
result
Comparability of exercise and control
group at entry
Low risk No significant differences observed in baseline characteristics
Appropriateness of duration of surveillance Low risk Only immediately postintervention data at 12 months, follow-
up data at 2 years postintervention reported
Rubin 2004
Methods RCT
Participants Number of participants randomised = 70
Losses: 6 (1 active, five placebo) withdrew within first 3/12 and were replaced by new
subject in same treatment type
Age: 47-64 years
Setting: USA
Inclusion: 3-8 years postmenopausal women, normal nutritional status, stable weight,
estimated daily Ca intake ≥ 500 mg daily, capable of following protocol, body mass 45
kg-84 kg
Exclusion: any pharmacological intervention for osteopenia within last 6 months, steroid
use, current smoking status, consumption of excessive alcohol, evidence of osteomalacia,
osteogenesis imperfect, GI disease, history of malignancy, and/or prolonged immobili-
sation of axial or appendicular skeleton within last 3 years, spondyloarthrosis, thyrotoxi-
cosis, psychomotor disturbances, hyperparathyroidism, renal or hepatic disease, chronic
diseases known to affect muscular system, and/or engaged in high impact activities at
least 3 x per week
Interventions Exercise group (DWBHF) (n = 33): vibration plate that vibrated at 30 Hz, 0.2 g peak
to peak
Control Group (n = 37): placebo device, protocol a/a
Duration and intensity: 2 x 10 mins treatments per day separated by a minimum of
hrs, 7 days per week for 1 year
Supervisor: none
Supervision: none
Setting: home
Outcomes BMD by DXA R & L femur, lumbar spine, distal 1/3 radius at baseline, 3, 6 and 12
months
Notes Compliance/adherence: 37% completing study were at least 80% compliant (10 active,
7 placebo), 72% at least 60% compliant (19 active, 14 placebo)
Adverse events: 1 person (placebo group) reported headache
Data presented as % change but as a function of compliance > 80% with exercise and
only mean values presented
Risk of bias
72Exercise for preventing and treating osteoporosis in postmenopausal women (Review)
Copyright © 2011 The Cochrane Collaboration. Published by John Wiley & Sons, Ltd.
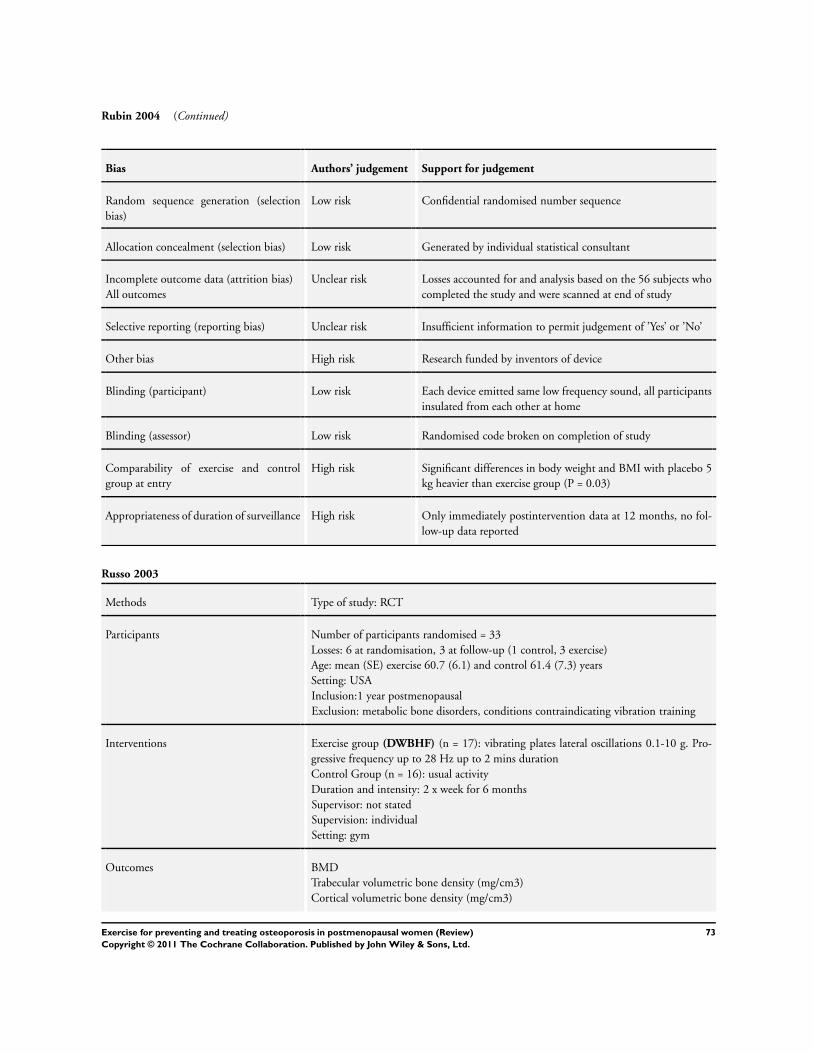
Rubin 2004 (Continued)
Bias Authors’ judgement Support for judgement
Random sequence generation (selection
bias)
Low risk Confidential randomised number sequence
Allocation concealment (selection bias) Low risk Generated by individual statistical consultant
Incomplete outcome data (attrition bias)
All outcomes
Unclear risk Losses accounted for and analysis based on the 56 subjects who
completed the study and were scanned at end of study
Selective reporting (reporting bias) Unclear risk Insufficient information to permit judgement of ’Yes’ or ’No’
Other bias High risk Research funded by inventors of device
Blinding (participant) Low risk Each device emitted same low frequency sound, all participants
insulated from each other at home
Blinding (assessor) Low risk Randomised code broken on completion of study
Comparability of exercise and control
group at entry
High risk Significant differences in body weight and BMI with placebo 5
kg heavier than exercise group (P = 0.03)
Appropriateness of duration of surveillance High risk Only immediately postintervention data at 12 months, no fol-
low-up data reported
Russo 2003
Methods Type of study: RCT
Participants Number of participants randomised = 33
Losses: 6 at randomisation, 3 at follow-up (1 control, 3 exercise)
Age: mean (SE) exercise 60.7 (6.1) and control 61.4 (7.3) years
Setting: USA
Inclusion:1 year postmenopausal
Exclusion: metabolic bone disorders, conditions contraindicating vibration training
Interventions Exercise group (DWBHF) (n = 17): vibrating plates lateral oscillations 0.1-10 g. Pro-
gressive frequency up to 28 Hz up to 2 mins duration
Control Group (n = 16): usual activity
Duration and intensity: 2 x week for 6 months
Supervisor: not stated
Supervision: individual
Setting: gym
Outcomes BMD
Trabecular volumetric bone density (mg/cm3)
Cortical volumetric bone density (mg/cm3)
73Exercise for preventing and treating osteoporosis in postmenopausal women (Review)
Copyright © 2011 The Cochrane Collaboration. Published by John Wiley & Sons, Ltd.
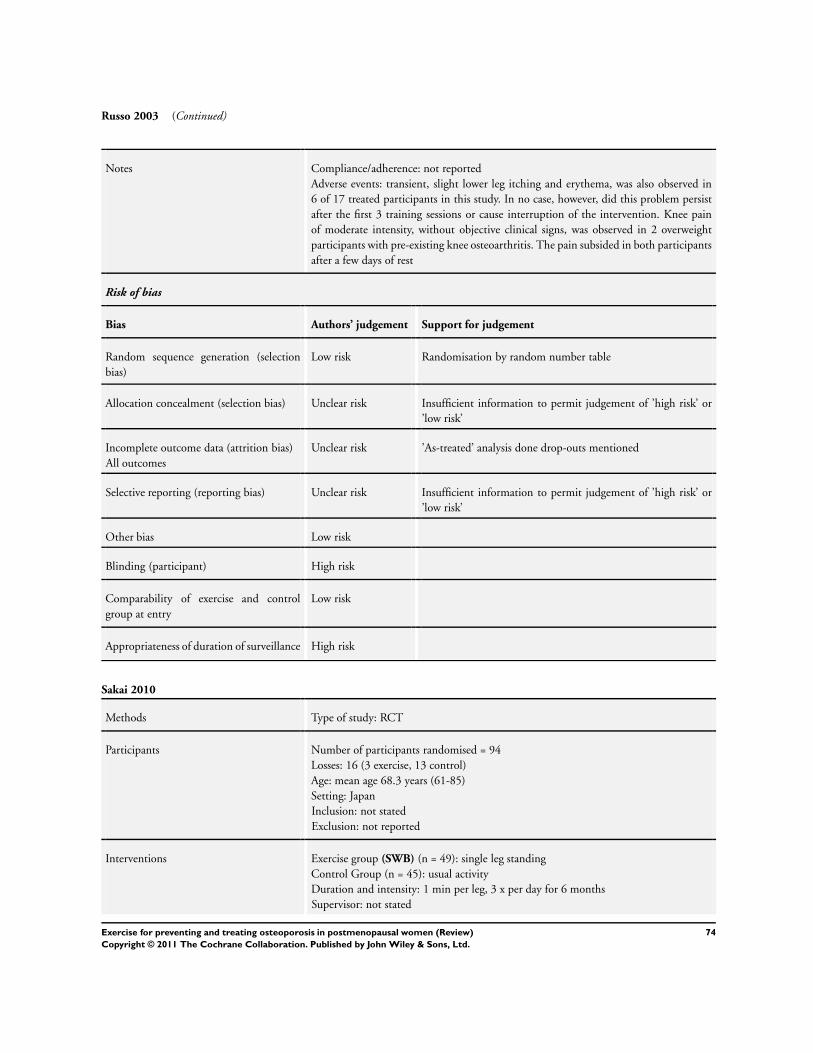
Russo 2003 (Continued)
Notes Compliance/adherence: not reported
Adverse events: transient, slight lower leg itching and erythema, was also observed in
6 of 17 treated participants in this study. In no case, however, did this problem persist
after the first 3 training sessions or cause interruption of the intervention. Knee pain
of moderate intensity, without objective clinical signs, was observed in 2 overweight
participants with pre-existing knee osteoarthritis. The pain subsided in both participants
after a few days of rest
Risk of bias
Bias Authors’ judgement Support for judgement
Random sequence generation (selection
bias)
Low risk Randomisation by random number table
Allocation concealment (selection bias) Unclear risk Insufficient information to permit judgement of ’high risk’ or
’low risk’
Incomplete outcome data (attrition bias)
All outcomes
Unclear risk ’As-treated’ analysis done drop-outs mentioned
Selective reporting (reporting bias) Unclear risk Insufficient information to permit judgement of ’high risk’ or
’low risk’
Other bias Low risk
Blinding (participant) High risk
Comparability of exercise and control
group at entry
Low risk
Appropriateness of duration of surveillance High risk
Sakai 2010
Methods Type of study: RCT
Participants Number of participants randomised = 94
Losses: 16 (3 exercise, 13 control)
Age: mean age 68.3 years (61-85)
Setting: Japan
Inclusion: not stated
Exclusion: not reported
Interventions Exercise group (SWB) (n = 49): single leg standing
Control Group (n = 45): usual activity
Duration and intensity: 1 min per leg, 3 x per day for 6 months
Supervisor: not stated
74Exercise for preventing and treating osteoporosis in postmenopausal women (Review)
Copyright © 2011 The Cochrane Collaboration. Published by John Wiley & Sons, Ltd.
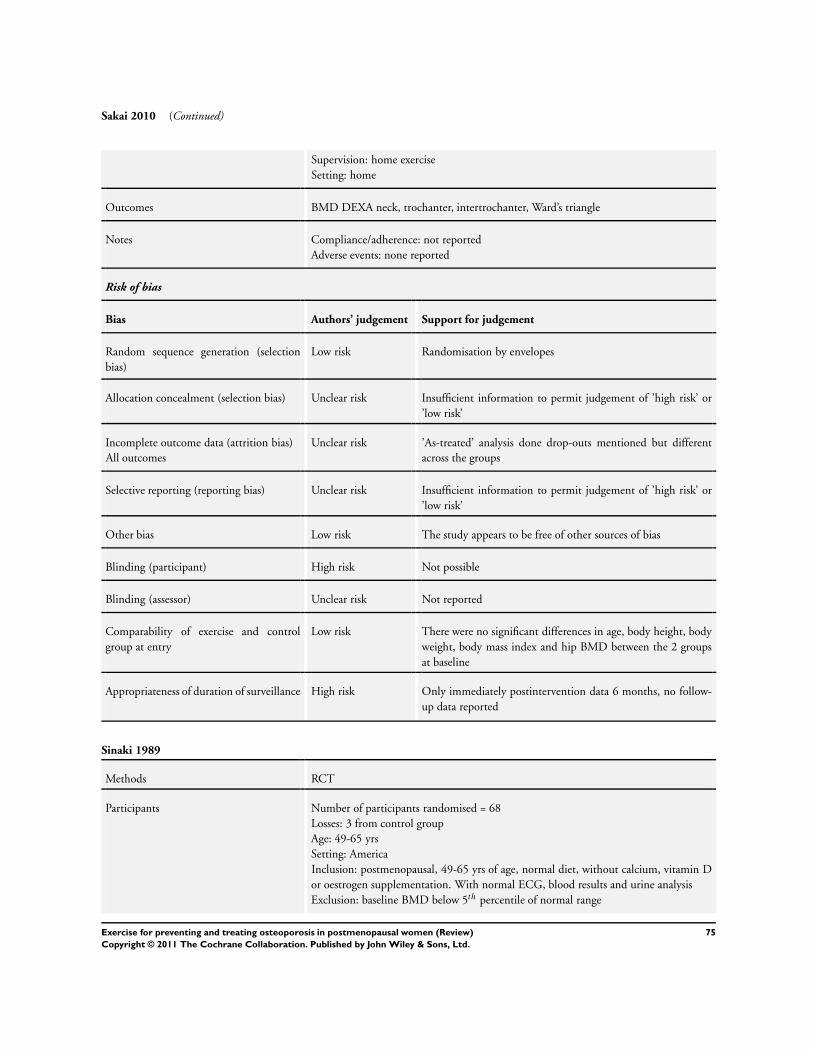
Sakai 2010 (Continued)
Supervision: home exercise
Setting: home
Outcomes BMD DEXA neck, trochanter, intertrochanter, Ward’s triangle
Notes Compliance/adherence: not reported
Adverse events: none reported
Risk of bias
Bias Authors’ judgement Support for judgement
Random sequence generation (selection
bias)
Low risk Randomisation by envelopes
Allocation concealment (selection bias) Unclear risk Insufficient information to permit judgement of ’high risk’ or
’low risk’
Incomplete outcome data (attrition bias)
All outcomes
Unclear risk ’As-treated’ analysis done drop-outs mentioned but different
across the groups
Selective reporting (reporting bias) Unclear risk Insufficient information to permit judgement of ’high risk’ or
’low risk’
Other bias Low risk The study appears to be free of other sources of bias
Blinding (participant) High risk Not possible
Blinding (assessor) Unclear risk Not reported
Comparability of exercise and control
group at entry
Low risk There were no significant differences in age, body height, body
weight, body mass index and hip BMD between the 2 groups
at baseline
Appropriateness of duration of surveillance High risk Only immediately postintervention data 6 months, no follow-
up data reported
Sinaki 1989
Methods RCT
Participants Number of participants randomised = 68
Losses: 3 from control group
Age: 49-65 yrs
Setting: America
Inclusion: postmenopausal, 49-65 yrs of age, normal diet, without calcium, vitamin D
or oestrogen supplementation. With normal ECG, blood results and urine analysis
Exclusion: baseline BMD below 5th percentile of normal range
75Exercise for preventing and treating osteoporosis in postmenopausal women (Review)
Copyright © 2011 The Cochrane Collaboration. Published by John Wiley & Sons, Ltd.
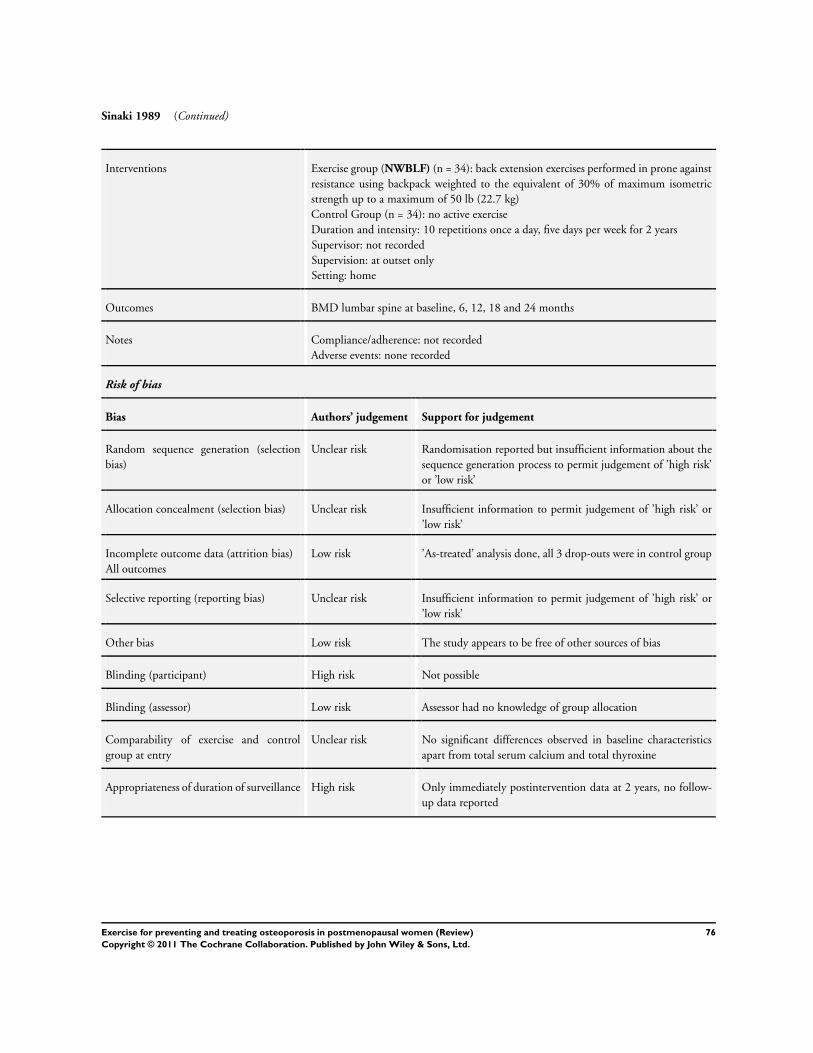
Sinaki 1989 (Continued)
Interventions Exercise group (NWBLF) (n = 34): back extension exercises performed in prone against
resistance using backpack weighted to the equivalent of 30% of maximum isometric
strength up to a maximum of 50 lb (22.7 kg)
Control Group (n = 34): no active exercise
Duration and intensity: 10 repetitions once a day, five days per week for 2 years
Supervisor: not recorded
Supervision: at outset only
Setting: home
Outcomes BMD lumbar spine at baseline, 6, 12, 18 and 24 months
Notes Compliance/adherence: not recorded
Adverse events: none recorded
Risk of bias
Bias Authors’ judgement Support for judgement
Random sequence generation (selection
bias)
Unclear risk Randomisation reported but insufficient information about the
sequence generation process to permit judgement of ’high risk’
or ’low risk’
Allocation concealment (selection bias) Unclear risk Insufficient information to permit judgement of ’high risk’ or
’low risk’
Incomplete outcome data (attrition bias)
All outcomes
Low risk ’As-treated’ analysis done, all 3 drop-outs were in control group
Selective reporting (reporting bias) Unclear risk Insufficient information to permit judgement of ’high risk’ or
’low risk’
Other bias Low risk The study appears to be free of other sources of bias
Blinding (participant) High risk Not possible
Blinding (assessor) Low risk Assessor had no knowledge of group allocation
Comparability of exercise and control
group at entry
Unclear risk No significant differences observed in baseline characteristics
apart from total serum calcium and total thyroxine
Appropriateness of duration of surveillance High risk Only immediately postintervention data at 2 years, no follow-
up data reported
76Exercise for preventing and treating osteoporosis in postmenopausal women (Review)
Copyright © 2011 The Cochrane Collaboration. Published by John Wiley & Sons, Ltd.
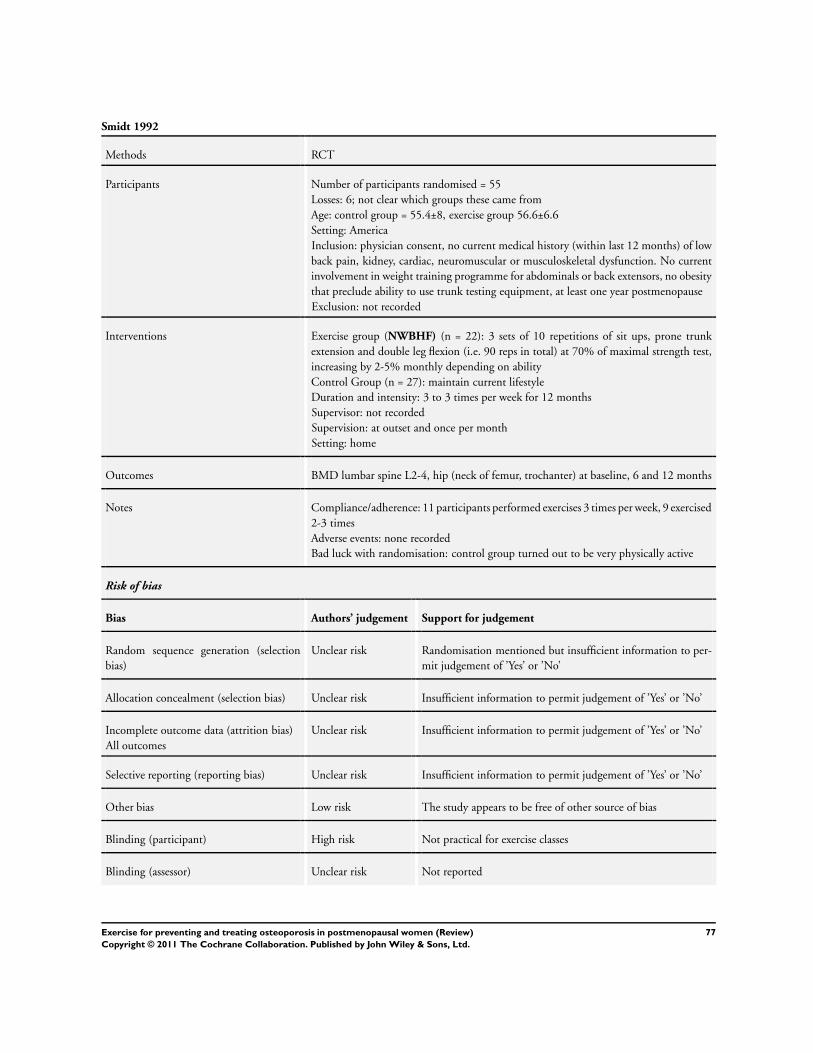
Smidt 1992
Methods RCT
Participants Number of participants randomised = 55
Losses: 6; not clear which groups these came from
Age: control group = 55.4±8, exercise group 56.6±6.6
Setting: America
Inclusion: physician consent, no current medical history (within last 12 months) of low
back pain, kidney, cardiac, neuromuscular or musculoskeletal dysfunction. No current
involvement in weight training programme for abdominals or back extensors, no obesity
that preclude ability to use trunk testing equipment, at least one year postmenopause
Exclusion: not recorded
Interventions Exercise group (NWBHF) (n = 22): 3 sets of 10 repetitions of sit ups, prone trunk
extension and double leg flexion (i.e. 90 reps in total) at 70% of maximal strength test,
increasing by 2-5% monthly depending on ability
Control Group (n = 27): maintain current lifestyle
Duration and intensity: 3 to 3 times per week for 12 months
Supervisor: not recorded
Supervision: at outset and once per month
Setting: home
Outcomes BMD lumbar spine L2-4, hip (neck of femur, trochanter) at baseline, 6 and 12 months
Notes Compliance/adherence: 11 participants performed exercises 3 times per week, 9 exercised
2-3 times
Adverse events: none recorded
Bad luck with randomisation: control group turned out to be very physically active
Risk of bias
Bias Authors’ judgement Support for judgement
Random sequence generation (selection
bias)
Unclear risk Randomisation mentioned but insufficient information to per-
mit judgement of ’Yes’ or ’No’
Allocation concealment (selection bias) Unclear risk Insufficient information to permit judgement of ’Yes’ or ’No’
Incomplete outcome data (attrition bias)
All outcomes
Unclear risk Insufficient information to permit judgement of ’Yes’ or ’No’
Selective reporting (reporting bias) Unclear risk Insufficient information to permit judgement of ’Yes’ or ’No’
Other bias Low risk The study appears to be free of other source of bias
Blinding (participant) High risk Not practical for exercise classes
Blinding (assessor) Unclear risk Not reported
77Exercise for preventing and treating osteoporosis in postmenopausal women (Review)
Copyright © 2011 The Cochrane Collaboration. Published by John Wiley & Sons, Ltd.
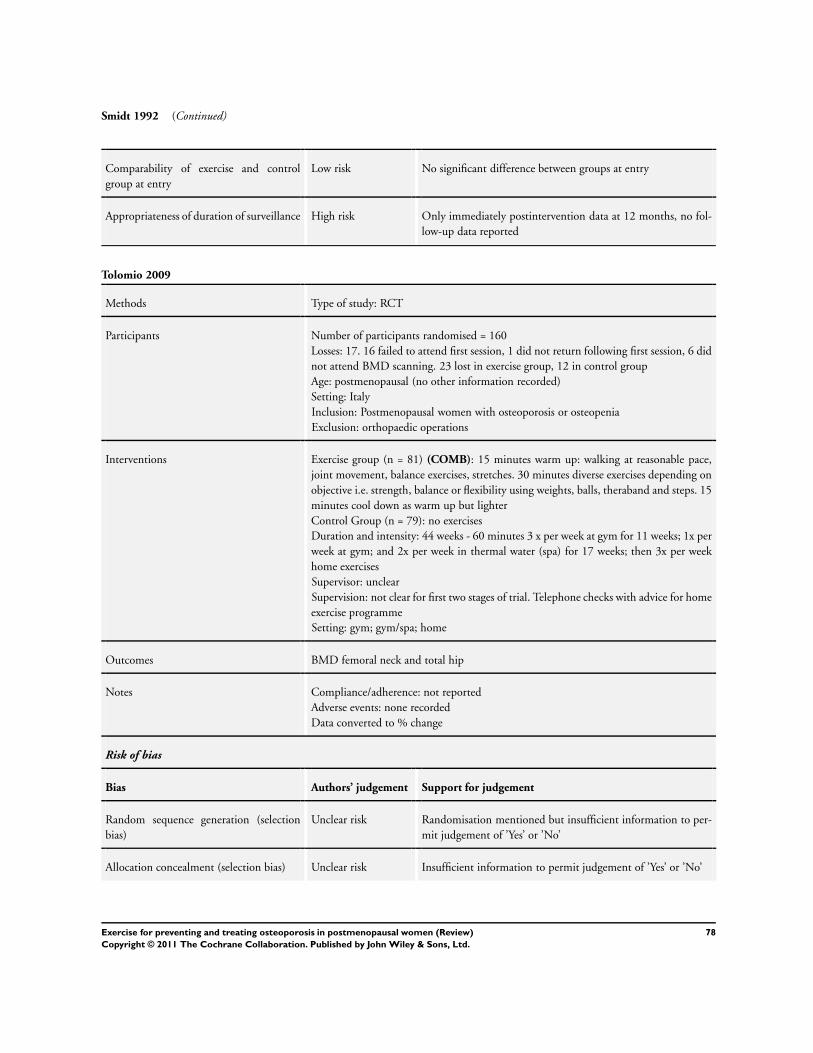
Smidt 1992 (Continued)
Comparability of exercise and control
group at entry
Low risk No significant difference between groups at entry
Appropriateness of duration of surveillance High risk Only immediately postintervention data at 12 months, no fol-
low-up data reported
Tolomio 2009
Methods Type of study: RCT
Participants Number of participants randomised = 160
Losses: 17. 16 failed to attend first session, 1 did not return following first session, 6 did
not attend BMD scanning. 23 lost in exercise group, 12 in control group
Age: postmenopausal (no other information recorded)
Setting: Italy
Inclusion: Postmenopausal women with osteoporosis or osteopenia
Exclusion: orthopaedic operations
Interventions Exercise group (n = 81) (COMB): 15 minutes warm up: walking at reasonable pace,
joint movement, balance exercises, stretches. 30 minutes diverse exercises depending on
objective i.e. strength, balance or flexibility using weights, balls, theraband and steps. 15
minutes cool down as warm up but lighter
Control Group (n = 79): no exercises
Duration and intensity: 44 weeks - 60 minutes 3 x per week at gym for 11 weeks; 1x per
week at gym; and 2x per week in thermal water (spa) for 17 weeks; then 3x per week
home exercises
Supervisor: unclear
Supervision: not clear for first two stages of trial. Telephone checks with advice for home
exercise programme
Setting: gym; gym/spa; home
Outcomes BMD femoral neck and total hip
Notes Compliance/adherence: not reported
Adverse events: none recorded
Data converted to % change
Risk of bias
Bias Authors’ judgement Support for judgement
Random sequence generation (selection
bias)
Unclear risk Randomisation mentioned but insufficient information to per-
mit judgement of ’Yes’ or ’No’
Allocation concealment (selection bias) Unclear risk Insufficient information to permit judgement of ’Yes’ or ’No’
78Exercise for preventing and treating osteoporosis in postmenopausal women (Review)
Copyright © 2011 The Cochrane Collaboration. Published by John Wiley & Sons, Ltd.
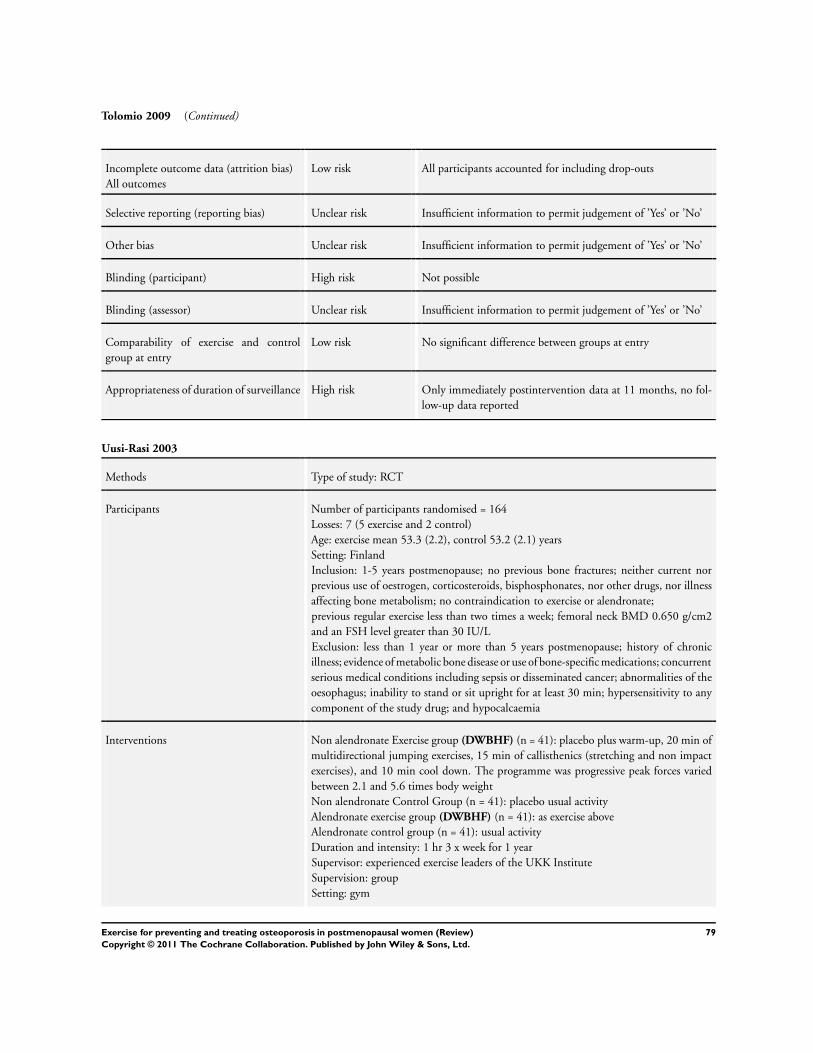
Tolomio 2009 (Continued)
Incomplete outcome data (attrition bias)
All outcomes
Low risk All participants accounted for including drop-outs
Selective reporting (reporting bias) Unclear risk Insufficient information to permit judgement of ’Yes’ or ’No’
Other bias Unclear risk Insufficient information to permit judgement of ’Yes’ or ’No’
Blinding (participant) High risk Not possible
Blinding (assessor) Unclear risk Insufficient information to permit judgement of ’Yes’ or ’No’
Comparability of exercise and control
group at entry
Low risk No significant difference between groups at entry
Appropriateness of duration of surveillance High risk Only immediately postintervention data at 11 months, no fol-
low-up data reported
Uusi-Rasi 2003
Methods Type of study: RCT
Participants Number of participants randomised = 164
Losses: 7 (5 exercise and 2 control)
Age: exercise mean 53.3 (2.2), control 53.2 (2.1) years
Setting: Finland
Inclusion: 1-5 years postmenopause; no previous bone fractures; neither current nor
previous use of oestrogen, corticosteroids, bisphosphonates, nor other drugs, nor illness
affecting bone metabolism; no contraindication to exercise or alendronate;
previous regular exercise less than two times a week; femoral neck BMD 0.650 g/cm2
and an FSH level greater than 30 IU/L
Exclusion: less than 1 year or more than 5 years postmenopause; history of chronic
illness; evidence of metabolic bone disease or use of bone-specific medications; concurrent
serious medical conditions including sepsis or disseminated cancer; abnormalities of the
oesophagus; inability to stand or sit upright for at least 30 min; hypersensitivity to any
component of the study drug; and hypocalcaemia
Interventions Non alendronate Exercise group (DWBHF) (n = 41): placebo plus warm-up, 20 min of
multidirectional jumping exercises, 15 min of callisthenics (stretching and non impact
exercises), and 10 min cool down. The programme was progressive peak forces varied
between 2.1 and 5.6 times body weight
Non alendronate Control Group (n = 41): placebo usual activity
Alendronate exercise group (DWBHF) (n = 41): as exercise above
Alendronate control group (n = 41): usual activity
Duration and intensity: 1 hr 3 x week for 1 year
Supervisor: experienced exercise leaders of the UKK Institute
Supervision: group
Setting: gym
79Exercise for preventing and treating osteoporosis in postmenopausal women (Review)
Copyright © 2011 The Cochrane Collaboration. Published by John Wiley & Sons, Ltd.
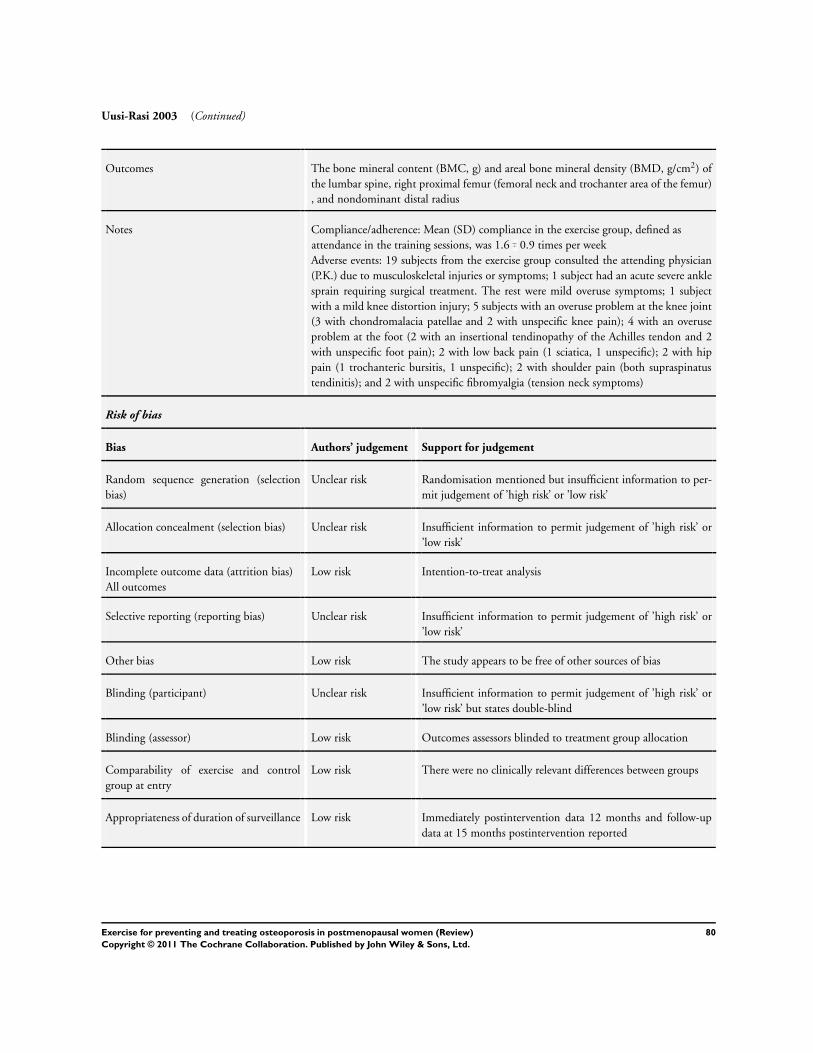
Uusi-Rasi 2003 (Continued)
Outcomes The bone mineral content (BMC, g) and areal bone mineral density (BMD, g/cm2) of
the lumbar spine, right proximal femur (femoral neck and trochanter area of the femur)
, and nondominant distal radius
Notes Compliance/adherence: Mean (SD) compliance in the exercise group, defined as
attendance in the training sessions, was 1.6 0.9 times per week
Adverse events: 19 subjects from the exercise group consulted the attending physician
(P.K.) due to musculoskeletal injuries or symptoms; 1 subject had an acute severe ankle
sprain requiring surgical treatment. The rest were mild overuse symptoms; 1 subject
with a mild knee distortion injury; 5 subjects with an overuse problem at the knee joint
(3 with chondromalacia patellae and 2 with unspecific knee pain); 4 with an overuse
problem at the foot (2 with an insertional tendinopathy of the Achilles tendon and 2
with unspecific foot pain); 2 with low back pain (1 sciatica, 1 unspecific); 2 with hip
pain (1 trochanteric bursitis, 1 unspecific); 2 with shoulder pain (both supraspinatus
tendinitis); and 2 with unspecific fibromyalgia (tension neck symptoms)
Risk of bias
Bias Authors’ judgement Support for judgement
Random sequence generation (selection
bias)
Unclear risk Randomisation mentioned but insufficient information to per-
mit judgement of ’high risk’ or ’low risk’
Allocation concealment (selection bias) Unclear risk Insufficient information to permit judgement of ’high risk’ or
’low risk’
Incomplete outcome data (attrition bias)
All outcomes
Low risk Intention-to-treat analysis
Selective reporting (reporting bias) Unclear risk Insufficient information to permit judgement of ’high risk’ or
’low risk’
Other bias Low risk The study appears to be free of other sources of bias
Blinding (participant) Unclear risk Insufficient information to permit judgement of ’high risk’ or
’low risk’ but states double-blind
Blinding (assessor) Low risk Outcomes assessors blinded to treatment group allocation
Comparability of exercise and control
group at entry
Low risk There were no clinically relevant differences between groups
Appropriateness of duration of surveillance Low risk Immediately postintervention data 12 months and follow-up
data at 15 months postintervention reported
80Exercise for preventing and treating osteoporosis in postmenopausal women (Review)
Copyright © 2011 The Cochrane Collaboration. Published by John Wiley & Sons, Ltd.
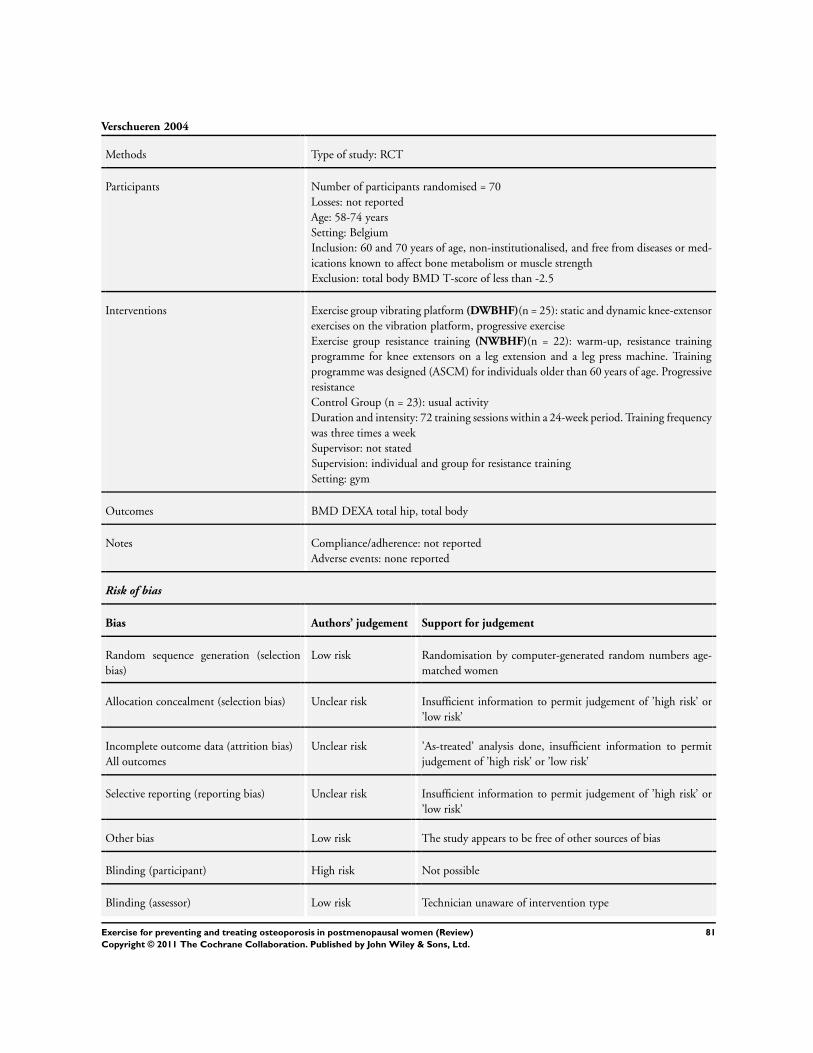
Verschueren 2004
Methods Type of study: RCT
Participants Number of participants randomised = 70
Losses: not reported
Age: 58-74 years
Setting: Belgium
Inclusion: 60 and 70 years of age, non-institutionalised, and free from diseases or med-
ications known to affect bone metabolism or muscle strength
Exclusion: total body BMD T-score of less than -2.5
Interventions Exercise group vibrating platform (DWBHF)(n = 25): static and dynamic knee-extensor
exercises on the vibration platform, progressive exercise
Exercise group resistance training (NWBHF)(n = 22): warm-up, resistance training
programme for knee extensors on a leg extension and a leg press machine. Training
programme was designed (ASCM) for individuals older than 60 years of age. Progressive
resistance
Control Group (n = 23): usual activity
Duration and intensity: 72 training sessions within a 24-week period. Training frequency
was three times a week
Supervisor: not stated
Supervision: individual and group for resistance training
Setting: gym
Outcomes BMD DEXA total hip, total body
Notes Compliance/adherence: not reported
Adverse events: none reported
Risk of bias
Bias Authors’ judgement Support for judgement
Random sequence generation (selection
bias)
Low risk Randomisation by computer-generated random numbers age-
matched women
Allocation concealment (selection bias) Unclear risk Insufficient information to permit judgement of ’high risk’ or
’low risk’
Incomplete outcome data (attrition bias)
All outcomes
Unclear risk ’As-treated’ analysis done, insufficient information to permit
judgement of ’high risk’ or ’low risk’
Selective reporting (reporting bias) Unclear risk Insufficient information to permit judgement of ’high risk’ or
’low risk’
Other bias Low risk The study appears to be free of other sources of bias
Blinding (participant) High risk Not possible
Blinding (assessor) Low risk Technician unaware of intervention type
81Exercise for preventing and treating osteoporosis in postmenopausal women (Review)
Copyright © 2011 The Cochrane Collaboration. Published by John Wiley & Sons, Ltd.
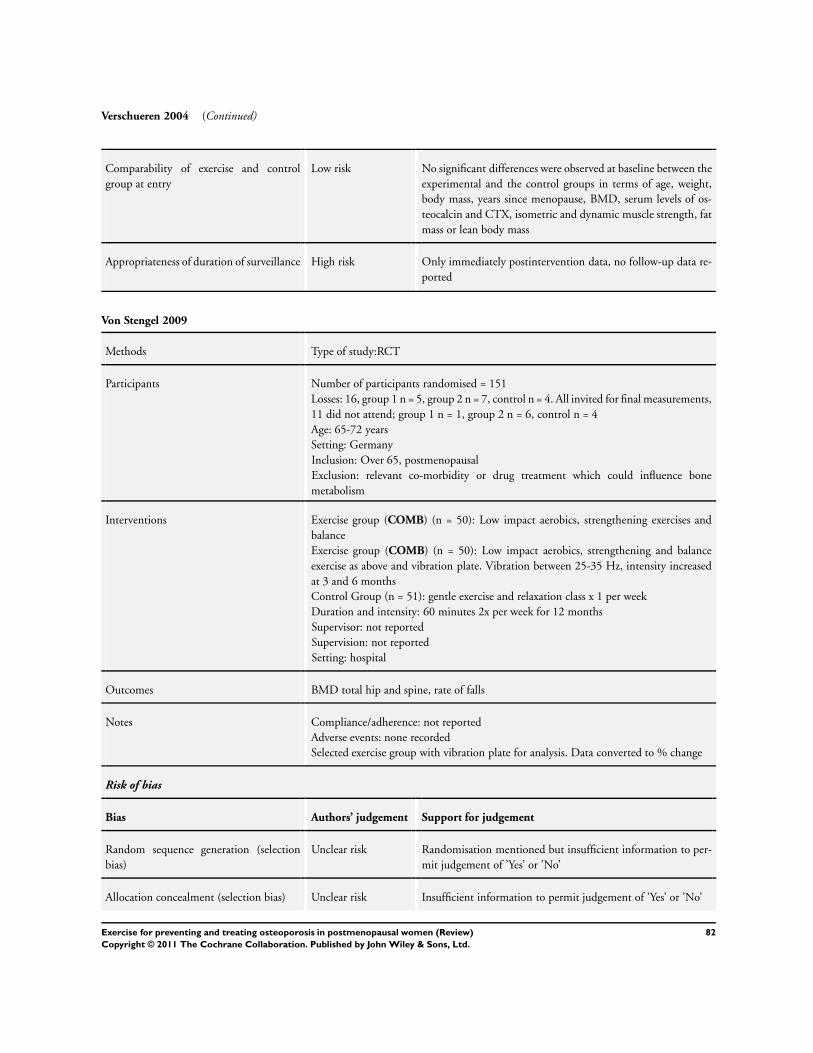
Verschueren 2004 (Continued)
Comparability of exercise and control
group at entry
Low risk No significant differences were observed at baseline between the
experimental and the control groups in terms of age, weight,
body mass, years since menopause, BMD, serum levels of os-
teocalcin and CTX, isometric and dynamic muscle strength, fat
mass or lean body mass
Appropriateness of duration of surveillance High risk Only immediately postintervention data, no follow-up data re-
ported
Von Stengel 2009
Methods Type of study:RCT
Participants Number of participants randomised = 151
Losses: 16, group 1 n = 5, group 2 n = 7, control n = 4. All invited for final measurements,
11 did not attend; group 1 n = 1, group 2 n = 6, control n = 4
Age: 65-72 years
Setting: Germany
Inclusion: Over 65, postmenopausal
Exclusion: relevant co-morbidity or drug treatment which could influence bone
metabolism
Interventions Exercise group (COMB) (n = 50): Low impact aerobics, strengthening exercises and
balance
Exercise group (COMB) (n = 50): Low impact aerobics, strengthening and balance
exercise as above and vibration plate. Vibration between 25-35 Hz, intensity increased
at 3 and 6 months
Control Group (n = 51): gentle exercise and relaxation class x 1 per week
Duration and intensity: 60 minutes 2x per week for 12 months
Supervisor: not reported
Supervision: not reported
Setting: hospital
Outcomes BMD total hip and spine, rate of falls
Notes Compliance/adherence: not reported
Adverse events: none recorded
Selected exercise group with vibration plate for analysis. Data converted to % change
Risk of bias
Bias Authors’ judgement Support for judgement
Random sequence generation (selection
bias)
Unclear risk Randomisation mentioned but insufficient information to per-
mit judgement of ’Yes’ or ’No’
Allocation concealment (selection bias) Unclear risk Insufficient information to permit judgement of ’Yes’ or ’No’
82Exercise for preventing and treating osteoporosis in postmenopausal women (Review)
Copyright © 2011 The Cochrane Collaboration. Published by John Wiley & Sons, Ltd.
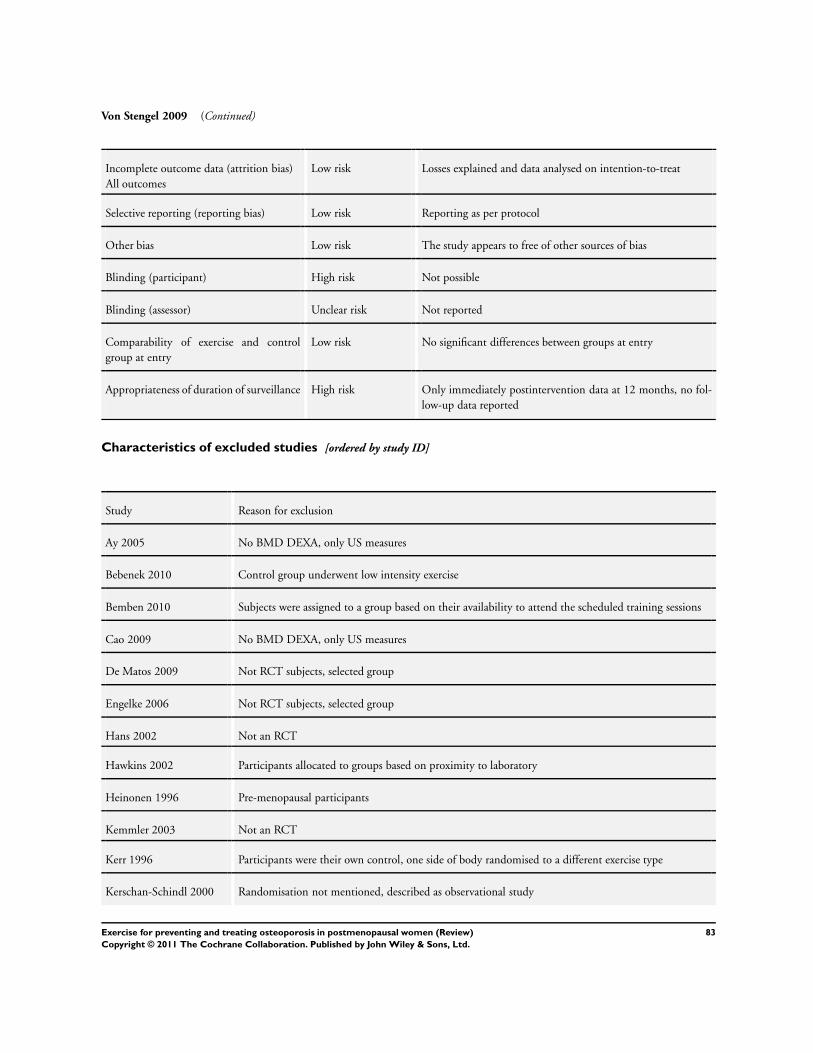
Von Stengel 2009 (Continued)
Incomplete outcome data (attrition bias)
All outcomes
Low risk Losses explained and data analysed on intention-to-treat
Selective reporting (reporting bias) Low risk Reporting as per protocol
Other bias Low risk The study appears to free of other sources of bias
Blinding (participant) High risk Not possible
Blinding (assessor) Unclear risk Not reported
Comparability of exercise and control
group at entry
Low risk No significant differences between groups at entry
Appropriateness of duration of surveillance High risk Only immediately postintervention data at 12 months, no fol-
low-up data reported
Characteristics of excluded studies [ordered by study ID]
Study Reason for exclusion
Ay 2005 No BMD DEXA, only US measures
Bebenek 2010 Control group underwent low intensity exercise
Bemben 2010 Subjects were assigned to a group based on their availability to attend the scheduled training sessions
Cao 2009 No BMD DEXA, only US measures
De Matos 2009 Not RCT subjects, selected group
Engelke 2006 Not RCT subjects, selected group
Hans 2002 Not an RCT
Hawkins 2002 Participants allocated to groups based on proximity to laboratory
Heinonen 1996 Pre-menopausal participants
Kemmler 2003 Not an RCT
Kerr 1996 Participants were their own control, one side of body randomised to a different exercise type
Kerschan-Schindl 2000 Randomisation not mentioned, described as observational study
83Exercise for preventing and treating osteoporosis in postmenopausal women (Review)
Copyright © 2011 The Cochrane Collaboration. Published by John Wiley & Sons, Ltd.
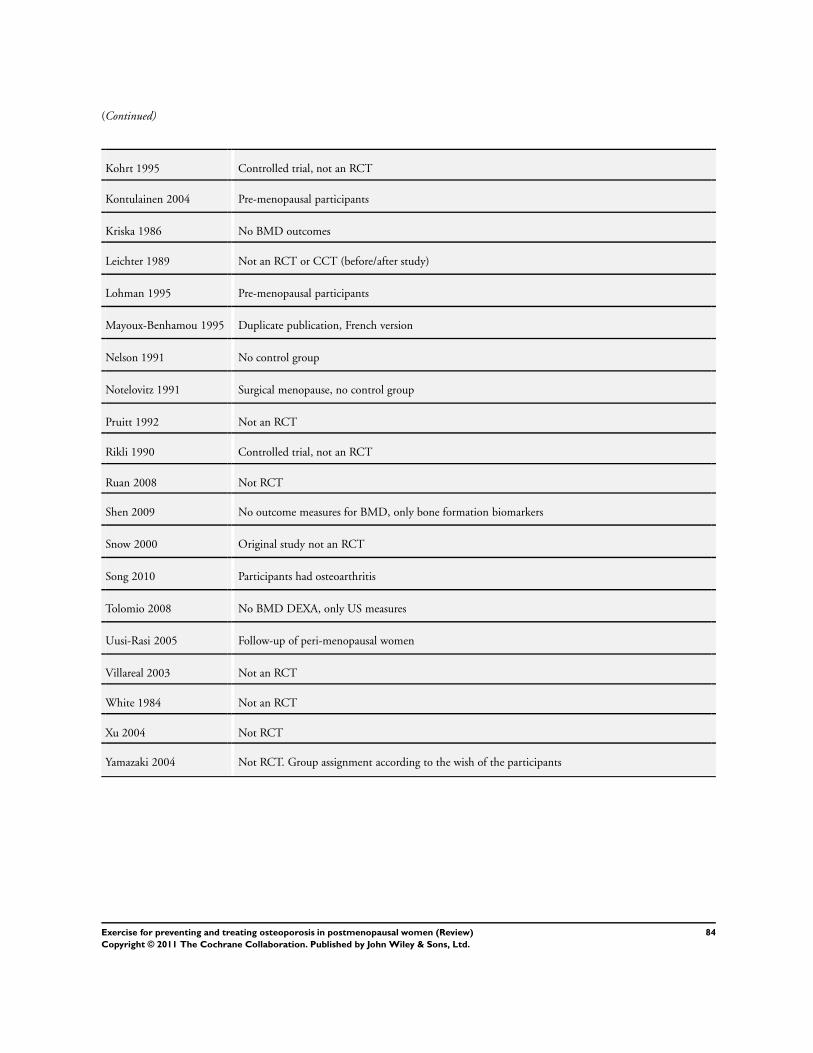
(Continued)
Kohrt 1995 Controlled trial, not an RCT
Kontulainen 2004 Pre-menopausal participants
Kriska 1986 No BMD outcomes
Leichter 1989 Not an RCT or CCT (before/after study)
Lohman 1995 Pre-menopausal participants
Mayoux-Benhamou 1995 Duplicate publication, French version
Nelson 1991 No control group
Notelovitz 1991 Surgical menopause, no control group
Pruitt 1992 Not an RCT
Rikli 1990 Controlled trial, not an RCT
Ruan 2008 Not RCT
Shen 2009 No outcome measures for BMD, only bone formation biomarkers
Snow 2000 Original study not an RCT
Song 2010 Participants had osteoarthritis
Tolomio 2008 No BMD DEXA, only US measures
Uusi-Rasi 2005 Follow-up of peri-menopausal women
Villareal 2003 Not an RCT
White 1984 Not an RCT
Xu 2004 Not RCT
Yamazaki 2004 Not RCT. Group assignment according to the wish of the participants
84Exercise for preventing and treating osteoporosis in postmenopausal women (Review)
Copyright © 2011 The Cochrane Collaboration. Published by John Wiley & Sons, Ltd.
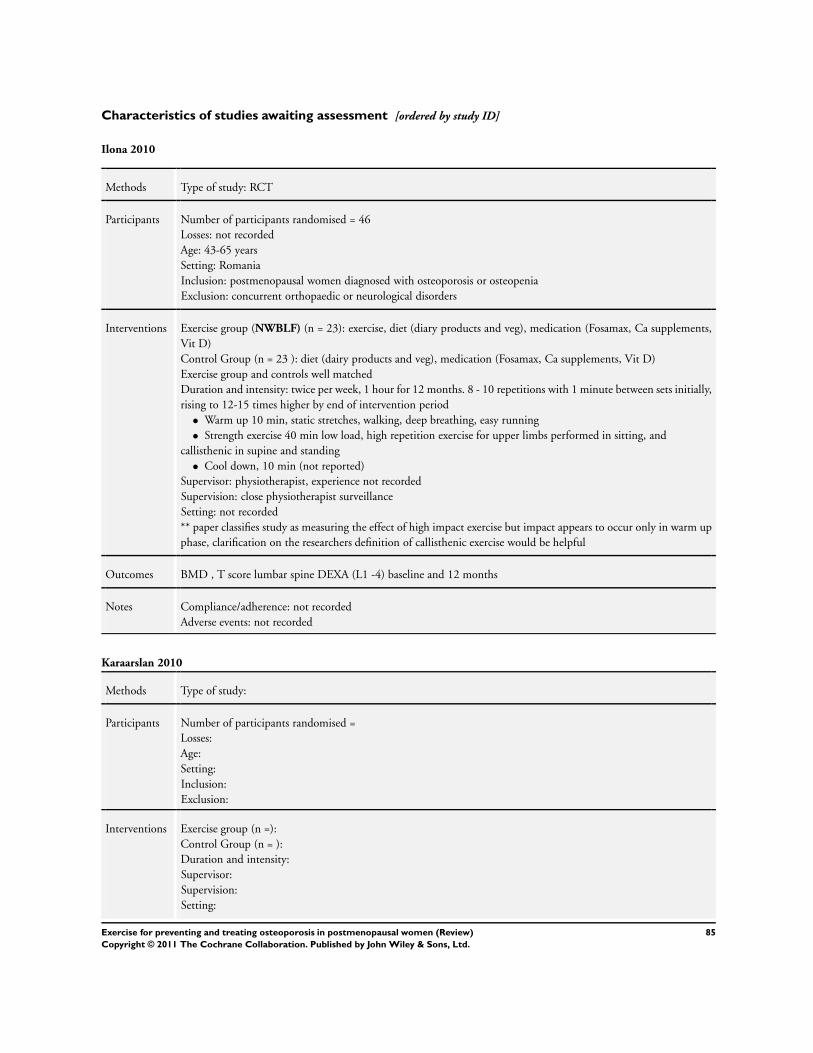
Characteristics of studies awaiting assessment [ordered by study ID]
Ilona 2010
Methods Type of study: RCT
Participants Number of participants randomised = 46
Losses: not recorded
Age: 43-65 years
Setting: Romania
Inclusion: postmenopausal women diagnosed with osteoporosis or osteopenia
Exclusion: concurrent orthopaedic or neurological disorders
Interventions Exercise group (NWBLF) (n = 23): exercise, diet (diary products and veg), medication (Fosamax, Ca supplements,
Vit D)
Control Group (n = 23 ): diet (dairy products and veg), medication (Fosamax, Ca supplements, Vit D)
Exercise group and controls well matched
Duration and intensity: twice per week, 1 hour for 12 months. 8 - 10 repetitions with 1 minute between sets initially,
rising to 12-15 times higher by end of intervention period
• Warm up 10 min, static stretches, walking, deep breathing, easy running
• Strength exercise 40 min low load, high repetition exercise for upper limbs performed in sitting, and
callisthenic in supine and standing
• Cool down, 10 min (not reported)
Supervisor: physiotherapist, experience not recorded
Supervision: close physiotherapist surveillance
Setting: not recorded
** paper classifies study as measuring the effect of high impact exercise but impact appears to occur only in warm up
phase, clarification on the researchers definition of callisthenic exercise would be helpful
Outcomes BMD , T score lumbar spine DEXA (L1 -4) baseline and 12 months
Notes Compliance/adherence: not recorded
Adverse events: not recorded
Karaarslan 2010
Methods Type of study:
Participants Number of participants randomised =
Losses:
Age:
Setting:
Inclusion:
Exclusion:
Interventions Exercise group (n =):
Control Group (n = ):
Duration and intensity:
Supervisor:
Supervision:
Setting:
85Exercise for preventing and treating osteoporosis in postmenopausal women (Review)
Copyright © 2011 The Cochrane Collaboration. Published by John Wiley & Sons, Ltd.
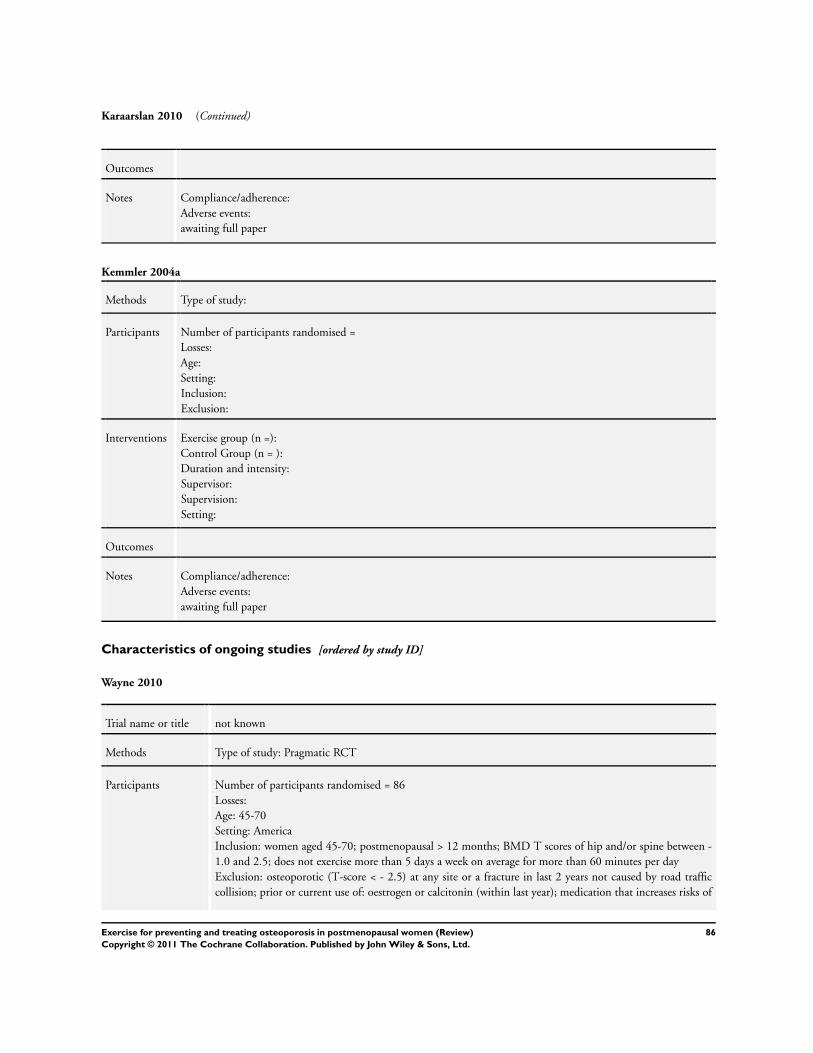
Karaarslan 2010 (Continued)
Outcomes
Notes Compliance/adherence:
Adverse events:
awaiting full paper
Kemmler 2004a
Methods Type of study:
Participants Number of participants randomised =
Losses:
Age:
Setting:
Inclusion:
Exclusion:
Interventions Exercise group (n =):
Control Group (n = ):
Duration and intensity:
Supervisor:
Supervision:
Setting:
Outcomes
Notes Compliance/adherence:
Adverse events:
awaiting full paper
Characteristics of ongoing studies [ordered by study ID]
Wayne 2010
Trial name or title not known
Methods Type of study: Pragmatic RCT
Participants Number of participants randomised = 86
Losses:
Age: 45-70
Setting: America
Inclusion: women aged 45-70; postmenopausal > 12 months; BMD T scores of hip and/or spine between -
1.0 and 2.5; does not exercise more than 5 days a week on average for more than 60 minutes per day
Exclusion: osteoporotic (T-score < - 2.5) at any site or a fracture in last 2 years not caused by road traffic
collision; prior or current use of: oestrogen or calcitonin (within last year); medication that increases risks of
86Exercise for preventing and treating osteoporosis in postmenopausal women (Review)
Copyright © 2011 The Cochrane Collaboration. Published by John Wiley & Sons, Ltd.
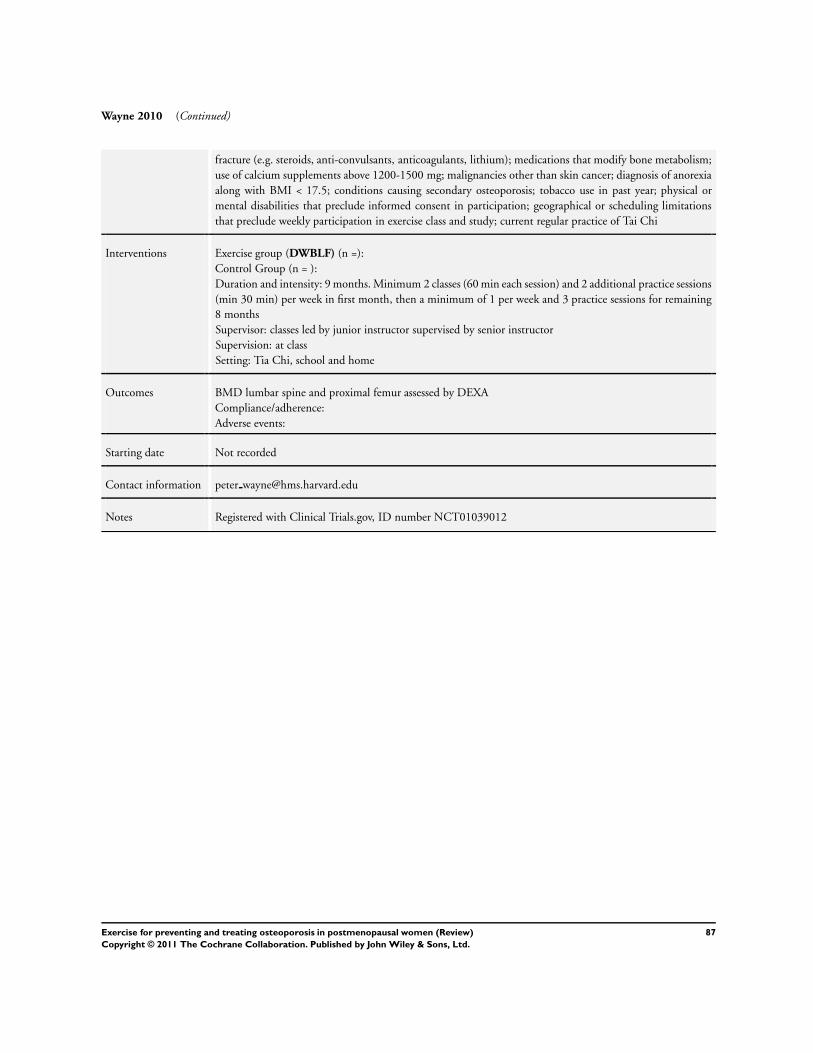
Wayne 2010 (Continued)
fracture (e.g. steroids, anti-convulsants, anticoagulants, lithium); medications that modify bone metabolism;
use of calcium supplements above 1200-1500 mg; malignancies other than skin cancer; diagnosis of anorexia
along with BMI < 17.5; conditions causing secondary osteoporosis; tobacco use in past year; physical or
mental disabilities that preclude informed consent in participation; geographical or scheduling limitations
that preclude weekly participation in exercise class and study; current regular practice of Tai Chi
Interventions Exercise group (DWBLF) (n =):
Control Group (n = ):
Duration and intensity: 9 months. Minimum 2 classes (60 min each session) and 2 additional practice sessions
(min 30 min) per week in first month, then a minimum of 1 per week and 3 practice sessions for remaining
8 months
Supervisor: classes led by junior instructor supervised by senior instructor
Supervision: at class
Setting: Tia Chi, school and home
Outcomes BMD lumbar spine and proximal femur assessed by DEXA
Compliance/adherence:
Adverse events:
Starting date Not recorded
Contact information peter [email protected]
Notes Registered with Clinical Trials.gov, ID number NCT01039012
87Exercise for preventing and treating osteoporosis in postmenopausal women (Review)
Copyright © 2011 The Cochrane Collaboration. Published by John Wiley & Sons, Ltd.
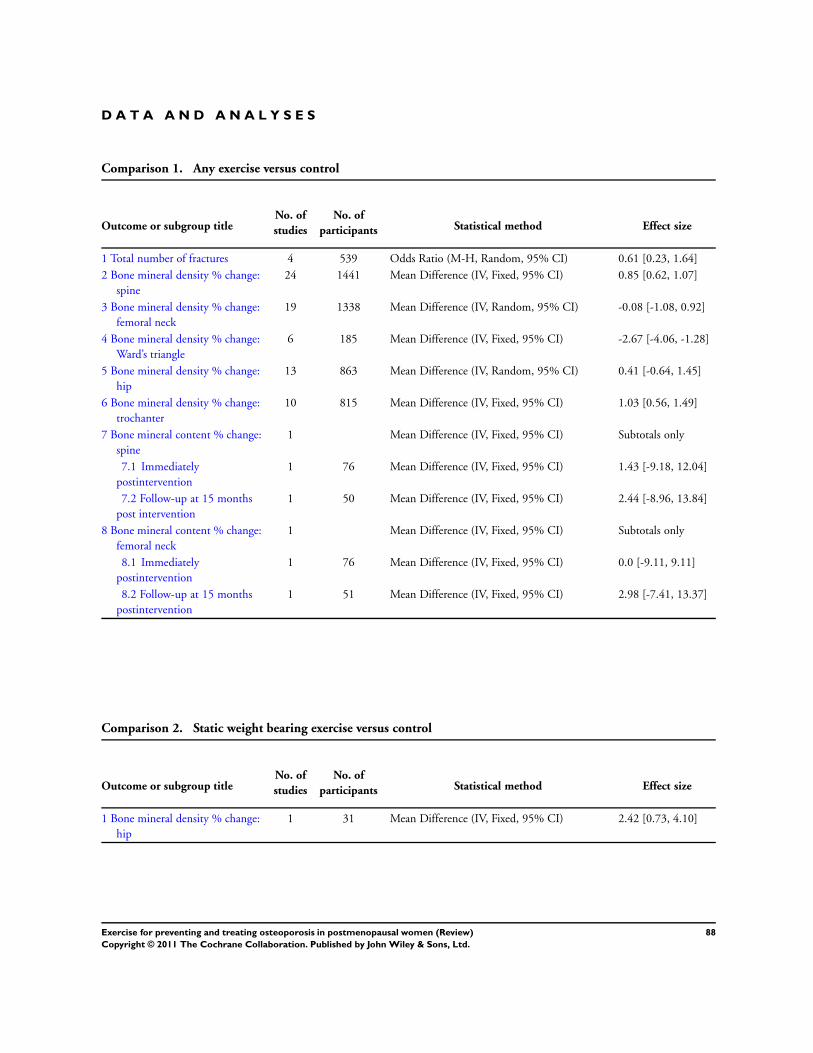
D A T A A N D A N A L Y S E S
Comparison 1. Any exercise versus control
Outcome or subgroup titleNo. of
studies
No. of
participants Statistical method Effect size
1 Total number of fractures 4 539 Odds Ratio (M-H, Random, 95% CI) 0.61 [0.23, 1.64]
2 Bone mineral density % change:
spine
24 1441 Mean Difference (IV, Fixed, 95% CI) 0.85 [0.62, 1.07]
3 Bone mineral density % change:
femoral neck
19 1338 Mean Difference (IV, Random, 95% CI) -0.08 [-1.08, 0.92]
4 Bone mineral density % change:
Ward’s triangle
6 185 Mean Difference (IV, Fixed, 95% CI) -2.67 [-4.06, -1.28]
5 Bone mineral density % change:
hip
13 863 Mean Difference (IV, Random, 95% CI) 0.41 [-0.64, 1.45]
6 Bone mineral density % change:
trochanter
10 815 Mean Difference (IV, Fixed, 95% CI) 1.03 [0.56, 1.49]
7 Bone mineral content % change:
spine
1 Mean Difference (IV, Fixed, 95% CI) Subtotals only
7.1 Immediately
postintervention
1 76 Mean Difference (IV, Fixed, 95% CI) 1.43 [-9.18, 12.04]
7.2 Follow-up at 15 months
post intervention
1 50 Mean Difference (IV, Fixed, 95% CI) 2.44 [-8.96, 13.84]
8 Bone mineral content % change:
femoral neck
1 Mean Difference (IV, Fixed, 95% CI) Subtotals only
8.1 Immediately
postintervention
1 76 Mean Difference (IV, Fixed, 95% CI) 0.0 [-9.11, 9.11]
8.2 Follow-up at 15 months
postintervention
1 51 Mean Difference (IV, Fixed, 95% CI) 2.98 [-7.41, 13.37]
Comparison 2. Static weight bearing exercise versus control
Outcome or subgroup titleNo. of
studies
No. of
participants Statistical method Effect size
1 Bone mineral density % change:
hip
1 31 Mean Difference (IV, Fixed, 95% CI) 2.42 [0.73, 4.10]
88Exercise for preventing and treating osteoporosis in postmenopausal women (Review)
Copyright © 2011 The Cochrane Collaboration. Published by John Wiley & Sons, Ltd.
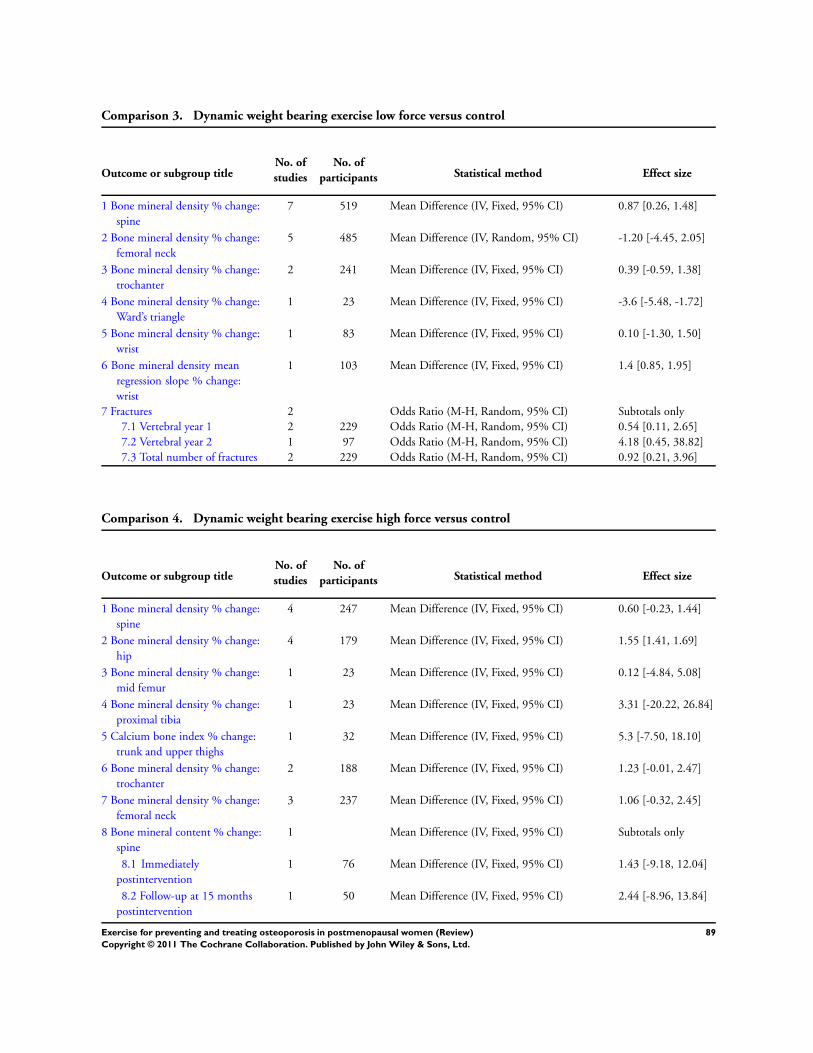
Comparison 3. Dynamic weight bearing exercise low force versus control
Outcome or subgroup titleNo. of
studies
No. of
participants Statistical method Effect size
1 Bone mineral density % change:
spine
7 519 Mean Difference (IV, Fixed, 95% CI) 0.87 [0.26, 1.48]
2 Bone mineral density % change:
femoral neck
5 485 Mean Difference (IV, Random, 95% CI) -1.20 [-4.45, 2.05]
3 Bone mineral density % change:
trochanter
2 241 Mean Difference (IV, Fixed, 95% CI) 0.39 [-0.59, 1.38]
4 Bone mineral density % change:
Ward’s triangle
1 23 Mean Difference (IV, Fixed, 95% CI) -3.6 [-5.48, -1.72]
5 Bone mineral density % change:
wrist
1 83 Mean Difference (IV, Fixed, 95% CI) 0.10 [-1.30, 1.50]
6 Bone mineral density mean
regression slope % change:
wrist
1 103 Mean Difference (IV, Fixed, 95% CI) 1.4 [0.85, 1.95]
7 Fractures 2 Odds Ratio (M-H, Random, 95% CI) Subtotals only
7.1 Vertebral year 1 2 229 Odds Ratio (M-H, Random, 95% CI) 0.54 [0.11, 2.65]
7.2 Vertebral year 2 1 97 Odds Ratio (M-H, Random, 95% CI) 4.18 [0.45, 38.82]
7.3 Total number of fractures 2 229 Odds Ratio (M-H, Random, 95% CI) 0.92 [0.21, 3.96]
Comparison 4. Dynamic weight bearing exercise high force versus control
Outcome or subgroup titleNo. of
studies
No. of
participants Statistical method Effect size
1 Bone mineral density % change:
spine
4 247 Mean Difference (IV, Fixed, 95% CI) 0.60 [-0.23, 1.44]
2 Bone mineral density % change:
hip
4 179 Mean Difference (IV, Fixed, 95% CI) 1.55 [1.41, 1.69]
3 Bone mineral density % change:
mid femur
1 23 Mean Difference (IV, Fixed, 95% CI) 0.12 [-4.84, 5.08]
4 Bone mineral density % change:
proximal tibia
1 23 Mean Difference (IV, Fixed, 95% CI) 3.31 [-20.22, 26.84]
5 Calcium bone index % change:
trunk and upper thighs
1 32 Mean Difference (IV, Fixed, 95% CI) 5.3 [-7.50, 18.10]
6 Bone mineral density % change:
trochanter
2 188 Mean Difference (IV, Fixed, 95% CI) 1.23 [-0.01, 2.47]
7 Bone mineral density % change:
femoral neck
3 237 Mean Difference (IV, Fixed, 95% CI) 1.06 [-0.32, 2.45]
8 Bone mineral content % change:
spine
1 Mean Difference (IV, Fixed, 95% CI) Subtotals only
8.1 Immediately
postintervention
1 76 Mean Difference (IV, Fixed, 95% CI) 1.43 [-9.18, 12.04]
8.2 Follow-up at 15 months
postintervention
1 50 Mean Difference (IV, Fixed, 95% CI) 2.44 [-8.96, 13.84]
89Exercise for preventing and treating osteoporosis in postmenopausal women (Review)
Copyright © 2011 The Cochrane Collaboration. Published by John Wiley & Sons, Ltd.
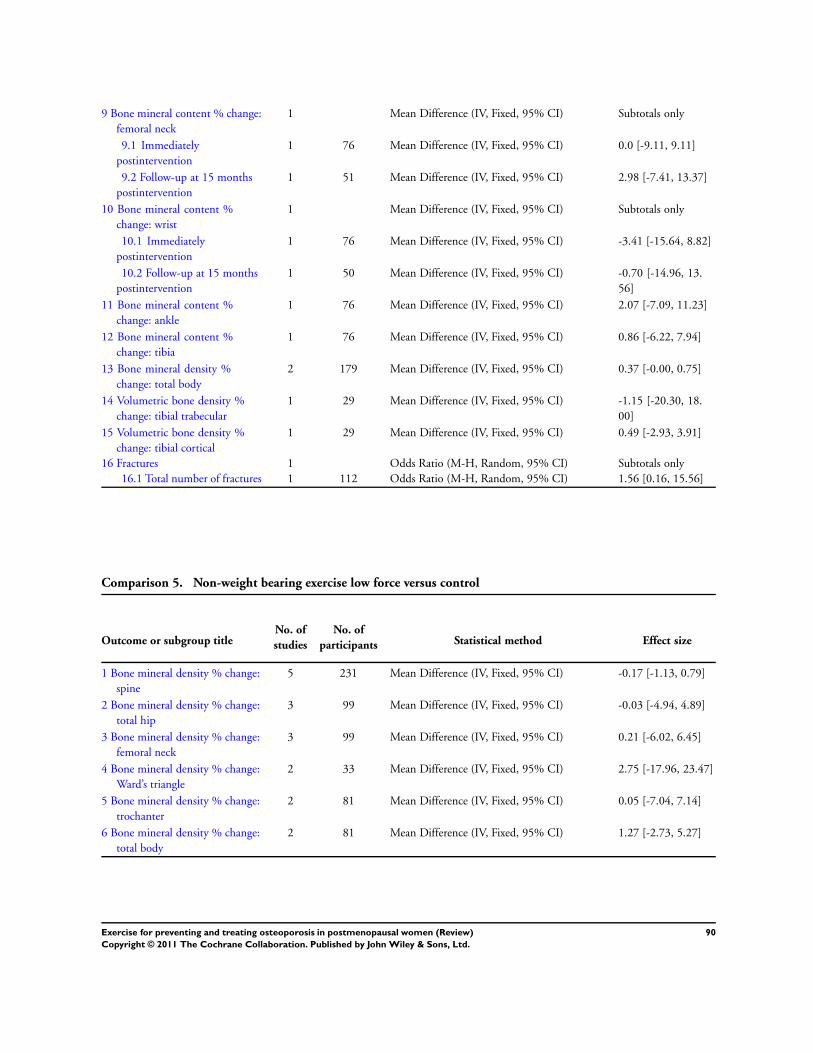
9 Bone mineral content % change:
femoral neck
1 Mean Difference (IV, Fixed, 95% CI) Subtotals only
9.1 Immediately
postintervention
1 76 Mean Difference (IV, Fixed, 95% CI) 0.0 [-9.11, 9.11]
9.2 Follow-up at 15 months
postintervention
1 51 Mean Difference (IV, Fixed, 95% CI) 2.98 [-7.41, 13.37]
10 Bone mineral content %
change: wrist
1 Mean Difference (IV, Fixed, 95% CI) Subtotals only
10.1 Immediately
postintervention
1 76 Mean Difference (IV, Fixed, 95% CI) -3.41 [-15.64, 8.82]
10.2 Follow-up at 15 months
postintervention
1 50 Mean Difference (IV, Fixed, 95% CI) -0.70 [-14.96, 13.
56]
11 Bone mineral content %
change: ankle
1 76 Mean Difference (IV, Fixed, 95% CI) 2.07 [-7.09, 11.23]
12 Bone mineral content %
change: tibia
1 76 Mean Difference (IV, Fixed, 95% CI) 0.86 [-6.22, 7.94]
13 Bone mineral density %
change: total body
2 179 Mean Difference (IV, Fixed, 95% CI) 0.37 [-0.00, 0.75]
14 Volumetric bone density %
change: tibial trabecular
1 29 Mean Difference (IV, Fixed, 95% CI) -1.15 [-20.30, 18.
00]
15 Volumetric bone density %
change: tibial cortical
1 29 Mean Difference (IV, Fixed, 95% CI) 0.49 [-2.93, 3.91]
16 Fractures 1 Odds Ratio (M-H, Random, 95% CI) Subtotals only
16.1 Total number of fractures 1 112 Odds Ratio (M-H, Random, 95% CI) 1.56 [0.16, 15.56]
Comparison 5. Non-weight bearing exercise low force versus control
Outcome or subgroup titleNo. of
studies
No. of
participants Statistical method Effect size
1 Bone mineral density % change:
spine
5 231 Mean Difference (IV, Fixed, 95% CI) -0.17 [-1.13, 0.79]
2 Bone mineral density % change:
total hip
3 99 Mean Difference (IV, Fixed, 95% CI) -0.03 [-4.94, 4.89]
3 Bone mineral density % change:
femoral neck
3 99 Mean Difference (IV, Fixed, 95% CI) 0.21 [-6.02, 6.45]
4 Bone mineral density % change:
Ward’s triangle
2 33 Mean Difference (IV, Fixed, 95% CI) 2.75 [-17.96, 23.47]
5 Bone mineral density % change:
trochanter
2 81 Mean Difference (IV, Fixed, 95% CI) 0.05 [-7.04, 7.14]
6 Bone mineral density % change:
total body
2 81 Mean Difference (IV, Fixed, 95% CI) 1.27 [-2.73, 5.27]
90Exercise for preventing and treating osteoporosis in postmenopausal women (Review)
Copyright © 2011 The Cochrane Collaboration. Published by John Wiley & Sons, Ltd.
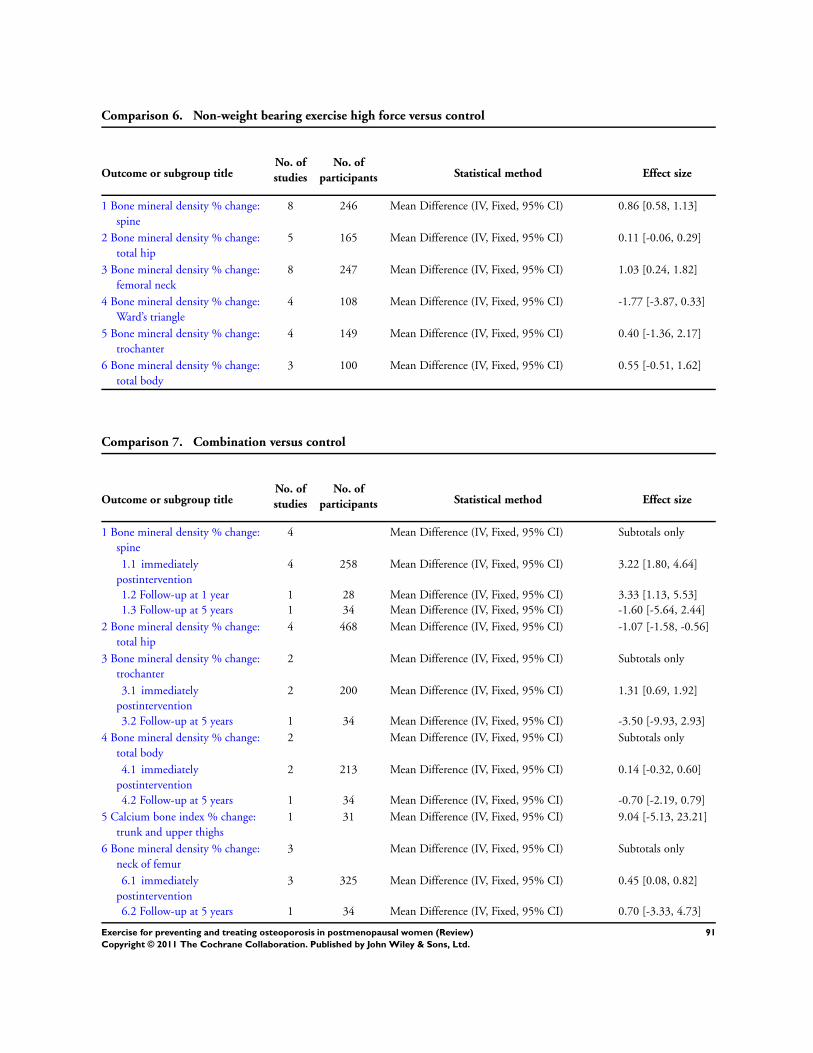
Comparison 6. Non-weight bearing exercise high force versus control
Outcome or subgroup titleNo. of
studies
No. of
participants Statistical method Effect size
1 Bone mineral density % change:
spine
8 246 Mean Difference (IV, Fixed, 95% CI) 0.86 [0.58, 1.13]
2 Bone mineral density % change:
total hip
5 165 Mean Difference (IV, Fixed, 95% CI) 0.11 [-0.06, 0.29]
3 Bone mineral density % change:
femoral neck
8 247 Mean Difference (IV, Fixed, 95% CI) 1.03 [0.24, 1.82]
4 Bone mineral density % change:
Ward’s triangle
4 108 Mean Difference (IV, Fixed, 95% CI) -1.77 [-3.87, 0.33]
5 Bone mineral density % change:
trochanter
4 149 Mean Difference (IV, Fixed, 95% CI) 0.40 [-1.36, 2.17]
6 Bone mineral density % change:
total body
3 100 Mean Difference (IV, Fixed, 95% CI) 0.55 [-0.51, 1.62]
Comparison 7. Combination versus control
Outcome or subgroup titleNo. of
studies
No. of
participants Statistical method Effect size
1 Bone mineral density % change:
spine
4 Mean Difference (IV, Fixed, 95% CI) Subtotals only
1.1 immediately
postintervention
4 258 Mean Difference (IV, Fixed, 95% CI) 3.22 [1.80, 4.64]
1.2 Follow-up at 1 year 1 28 Mean Difference (IV, Fixed, 95% CI) 3.33 [1.13, 5.53]
1.3 Follow-up at 5 years 1 34 Mean Difference (IV, Fixed, 95% CI) -1.60 [-5.64, 2.44]
2 Bone mineral density % change:
total hip
4 468 Mean Difference (IV, Fixed, 95% CI) -1.07 [-1.58, -0.56]
3 Bone mineral density % change:
trochanter
2 Mean Difference (IV, Fixed, 95% CI) Subtotals only
3.1 immediately
postintervention
2 200 Mean Difference (IV, Fixed, 95% CI) 1.31 [0.69, 1.92]
3.2 Follow-up at 5 years 1 34 Mean Difference (IV, Fixed, 95% CI) -3.50 [-9.93, 2.93]
4 Bone mineral density % change:
total body
2 Mean Difference (IV, Fixed, 95% CI) Subtotals only
4.1 immediately
postintervention
2 213 Mean Difference (IV, Fixed, 95% CI) 0.14 [-0.32, 0.60]
4.2 Follow-up at 5 years 1 34 Mean Difference (IV, Fixed, 95% CI) -0.70 [-2.19, 0.79]
5 Calcium bone index % change:
trunk and upper thighs
1 31 Mean Difference (IV, Fixed, 95% CI) 9.04 [-5.13, 23.21]
6 Bone mineral density % change:
neck of femur
3 Mean Difference (IV, Fixed, 95% CI) Subtotals only
6.1 immediately
postintervention
3 325 Mean Difference (IV, Fixed, 95% CI) 0.45 [0.08, 0.82]
6.2 Follow-up at 5 years 1 34 Mean Difference (IV, Fixed, 95% CI) 0.70 [-3.33, 4.73]
91Exercise for preventing and treating osteoporosis in postmenopausal women (Review)
Copyright © 2011 The Cochrane Collaboration. Published by John Wiley & Sons, Ltd.
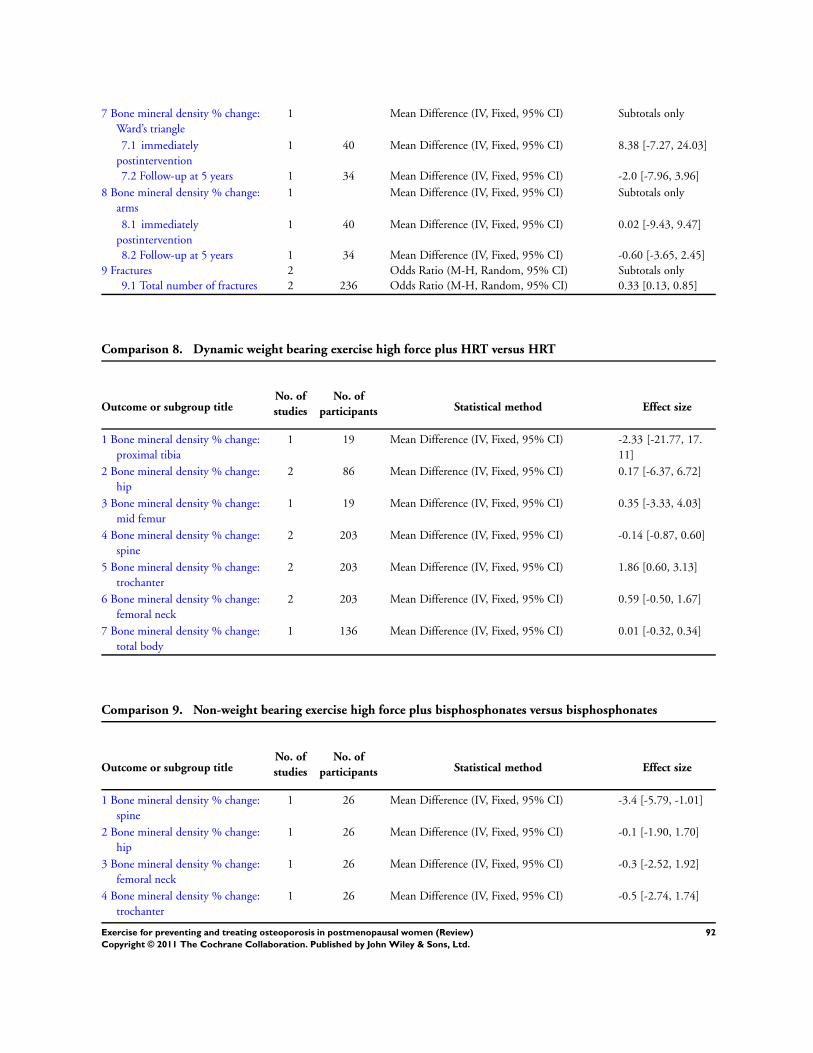
7 Bone mineral density % change:
Ward’s triangle
1 Mean Difference (IV, Fixed, 95% CI) Subtotals only
7.1 immediately
postintervention
1 40 Mean Difference (IV, Fixed, 95% CI) 8.38 [-7.27, 24.03]
7.2 Follow-up at 5 years 1 34 Mean Difference (IV, Fixed, 95% CI) -2.0 [-7.96, 3.96]
8 Bone mineral density % change:
arms
1 Mean Difference (IV, Fixed, 95% CI) Subtotals only
8.1 immediately
postintervention
1 40 Mean Difference (IV, Fixed, 95% CI) 0.02 [-9.43, 9.47]
8.2 Follow-up at 5 years 1 34 Mean Difference (IV, Fixed, 95% CI) -0.60 [-3.65, 2.45]
9 Fractures 2 Odds Ratio (M-H, Random, 95% CI) Subtotals only
9.1 Total number of fractures 2 236 Odds Ratio (M-H, Random, 95% CI) 0.33 [0.13, 0.85]
Comparison 8. Dynamic weight bearing exercise high force plus HRT versus HRT
Outcome or subgroup titleNo. of
studies
No. of
participants Statistical method Effect size
1 Bone mineral density % change:
proximal tibia
1 19 Mean Difference (IV, Fixed, 95% CI) -2.33 [-21.77, 17.
11]
2 Bone mineral density % change:
hip
2 86 Mean Difference (IV, Fixed, 95% CI) 0.17 [-6.37, 6.72]
3 Bone mineral density % change:
mid femur
1 19 Mean Difference (IV, Fixed, 95% CI) 0.35 [-3.33, 4.03]
4 Bone mineral density % change:
spine
2 203 Mean Difference (IV, Fixed, 95% CI) -0.14 [-0.87, 0.60]
5 Bone mineral density % change:
trochanter
2 203 Mean Difference (IV, Fixed, 95% CI) 1.86 [0.60, 3.13]
6 Bone mineral density % change:
femoral neck
2 203 Mean Difference (IV, Fixed, 95% CI) 0.59 [-0.50, 1.67]
7 Bone mineral density % change:
total body
1 136 Mean Difference (IV, Fixed, 95% CI) 0.01 [-0.32, 0.34]
Comparison 9. Non-weight bearing exercise high force plus bisphosphonates versus bisphosphonates
Outcome or subgroup titleNo. of
studies
No. of
participants Statistical method Effect size
1 Bone mineral density % change:
spine
1 26 Mean Difference (IV, Fixed, 95% CI) -3.4 [-5.79, -1.01]
2 Bone mineral density % change:
hip
1 26 Mean Difference (IV, Fixed, 95% CI) -0.1 [-1.90, 1.70]
3 Bone mineral density % change:
femoral neck
1 26 Mean Difference (IV, Fixed, 95% CI) -0.3 [-2.52, 1.92]
4 Bone mineral density % change:
trochanter
1 26 Mean Difference (IV, Fixed, 95% CI) -0.5 [-2.74, 1.74]
92Exercise for preventing and treating osteoporosis in postmenopausal women (Review)
Copyright © 2011 The Cochrane Collaboration. Published by John Wiley & Sons, Ltd.
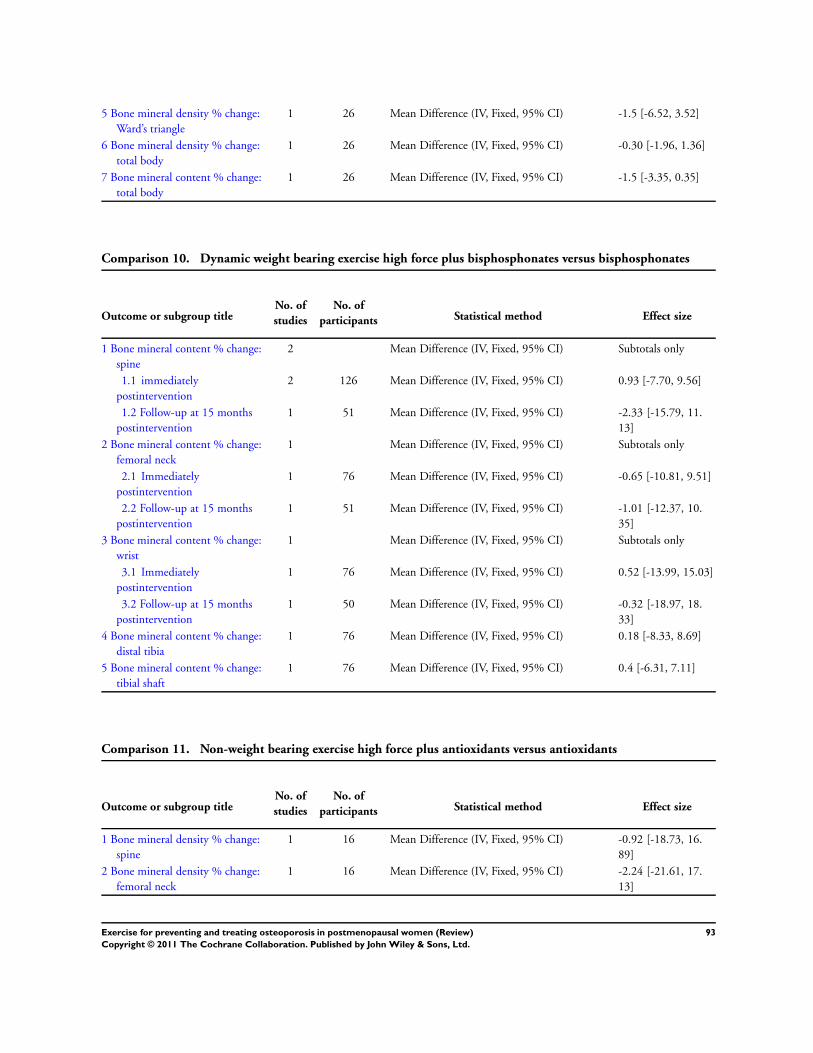
5 Bone mineral density % change:
Ward’s triangle
1 26 Mean Difference (IV, Fixed, 95% CI) -1.5 [-6.52, 3.52]
6 Bone mineral density % change:
total body
1 26 Mean Difference (IV, Fixed, 95% CI) -0.30 [-1.96, 1.36]
7 Bone mineral content % change:
total body
1 26 Mean Difference (IV, Fixed, 95% CI) -1.5 [-3.35, 0.35]
Comparison 10. Dynamic weight bearing exercise high force plus bisphosphonates versus bisphosphonates
Outcome or subgroup titleNo. of
studies
No. of
participants Statistical method Effect size
1 Bone mineral content % change:
spine
2 Mean Difference (IV, Fixed, 95% CI) Subtotals only
1.1 immediately
postintervention
2 126 Mean Difference (IV, Fixed, 95% CI) 0.93 [-7.70, 9.56]
1.2 Follow-up at 15 months
postintervention
1 51 Mean Difference (IV, Fixed, 95% CI) -2.33 [-15.79, 11.
13]
2 Bone mineral content % change:
femoral neck
1 Mean Difference (IV, Fixed, 95% CI) Subtotals only
2.1 Immediately
postintervention
1 76 Mean Difference (IV, Fixed, 95% CI) -0.65 [-10.81, 9.51]
2.2 Follow-up at 15 months
postintervention
1 51 Mean Difference (IV, Fixed, 95% CI) -1.01 [-12.37, 10.
35]
3 Bone mineral content % change:
wrist
1 Mean Difference (IV, Fixed, 95% CI) Subtotals only
3.1 Immediately
postintervention
1 76 Mean Difference (IV, Fixed, 95% CI) 0.52 [-13.99, 15.03]
3.2 Follow-up at 15 months
postintervention
1 50 Mean Difference (IV, Fixed, 95% CI) -0.32 [-18.97, 18.
33]
4 Bone mineral content % change:
distal tibia
1 76 Mean Difference (IV, Fixed, 95% CI) 0.18 [-8.33, 8.69]
5 Bone mineral content % change:
tibial shaft
1 76 Mean Difference (IV, Fixed, 95% CI) 0.4 [-6.31, 7.11]
Comparison 11. Non-weight bearing exercise high force plus antioxidants versus antioxidants
Outcome or subgroup titleNo. of
studies
No. of
participants Statistical method Effect size
1 Bone mineral density % change:
spine
1 16 Mean Difference (IV, Fixed, 95% CI) -0.92 [-18.73, 16.
89]
2 Bone mineral density % change:
femoral neck
1 16 Mean Difference (IV, Fixed, 95% CI) -2.24 [-21.61, 17.
13]
93Exercise for preventing and treating osteoporosis in postmenopausal women (Review)
Copyright © 2011 The Cochrane Collaboration. Published by John Wiley & Sons, Ltd.
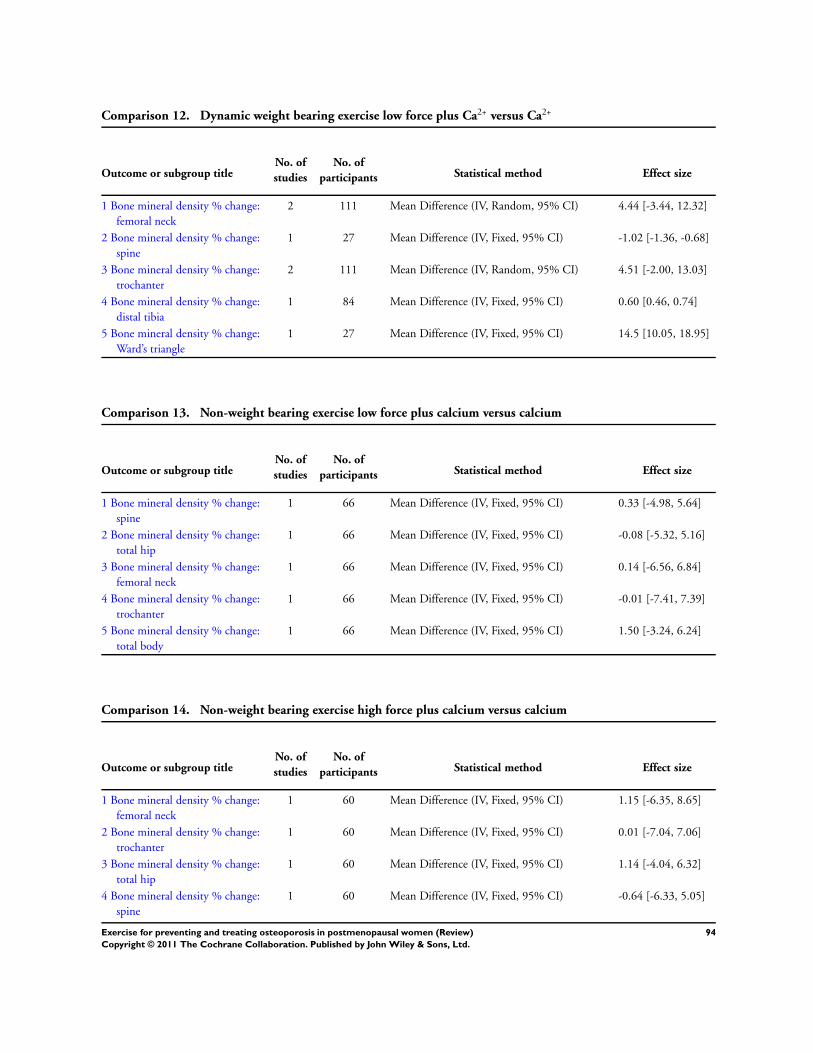
Comparison 12. Dynamic weight bearing exercise low force plus Ca2+ versus Ca2+
Outcome or subgroup titleNo. of
studies
No. of
participants Statistical method Effect size
1 Bone mineral density % change:
femoral neck
2 111 Mean Difference (IV, Random, 95% CI) 4.44 [-3.44, 12.32]
2 Bone mineral density % change:
spine
1 27 Mean Difference (IV, Fixed, 95% CI) -1.02 [-1.36, -0.68]
3 Bone mineral density % change:
trochanter
2 111 Mean Difference (IV, Random, 95% CI) 4.51 [-2.00, 13.03]
4 Bone mineral density % change:
distal tibia
1 84 Mean Difference (IV, Fixed, 95% CI) 0.60 [0.46, 0.74]
5 Bone mineral density % change:
Ward’s triangle
1 27 Mean Difference (IV, Fixed, 95% CI) 14.5 [10.05, 18.95]
Comparison 13. Non-weight bearing exercise low force plus calcium versus calcium
Outcome or subgroup titleNo. of
studies
No. of
participants Statistical method Effect size
1 Bone mineral density % change:
spine
1 66 Mean Difference (IV, Fixed, 95% CI) 0.33 [-4.98, 5.64]
2 Bone mineral density % change:
total hip
1 66 Mean Difference (IV, Fixed, 95% CI) -0.08 [-5.32, 5.16]
3 Bone mineral density % change:
femoral neck
1 66 Mean Difference (IV, Fixed, 95% CI) 0.14 [-6.56, 6.84]
4 Bone mineral density % change:
trochanter
1 66 Mean Difference (IV, Fixed, 95% CI) -0.01 [-7.41, 7.39]
5 Bone mineral density % change:
total body
1 66 Mean Difference (IV, Fixed, 95% CI) 1.50 [-3.24, 6.24]
Comparison 14. Non-weight bearing exercise high force plus calcium versus calcium
Outcome or subgroup titleNo. of
studies
No. of
participants Statistical method Effect size
1 Bone mineral density % change:
femoral neck
1 60 Mean Difference (IV, Fixed, 95% CI) 1.15 [-6.35, 8.65]
2 Bone mineral density % change:
trochanter
1 60 Mean Difference (IV, Fixed, 95% CI) 0.01 [-7.04, 7.06]
3 Bone mineral density % change:
total hip
1 60 Mean Difference (IV, Fixed, 95% CI) 1.14 [-4.04, 6.32]
4 Bone mineral density % change:
spine
1 60 Mean Difference (IV, Fixed, 95% CI) -0.64 [-6.33, 5.05]
94Exercise for preventing and treating osteoporosis in postmenopausal women (Review)
Copyright © 2011 The Cochrane Collaboration. Published by John Wiley & Sons, Ltd.
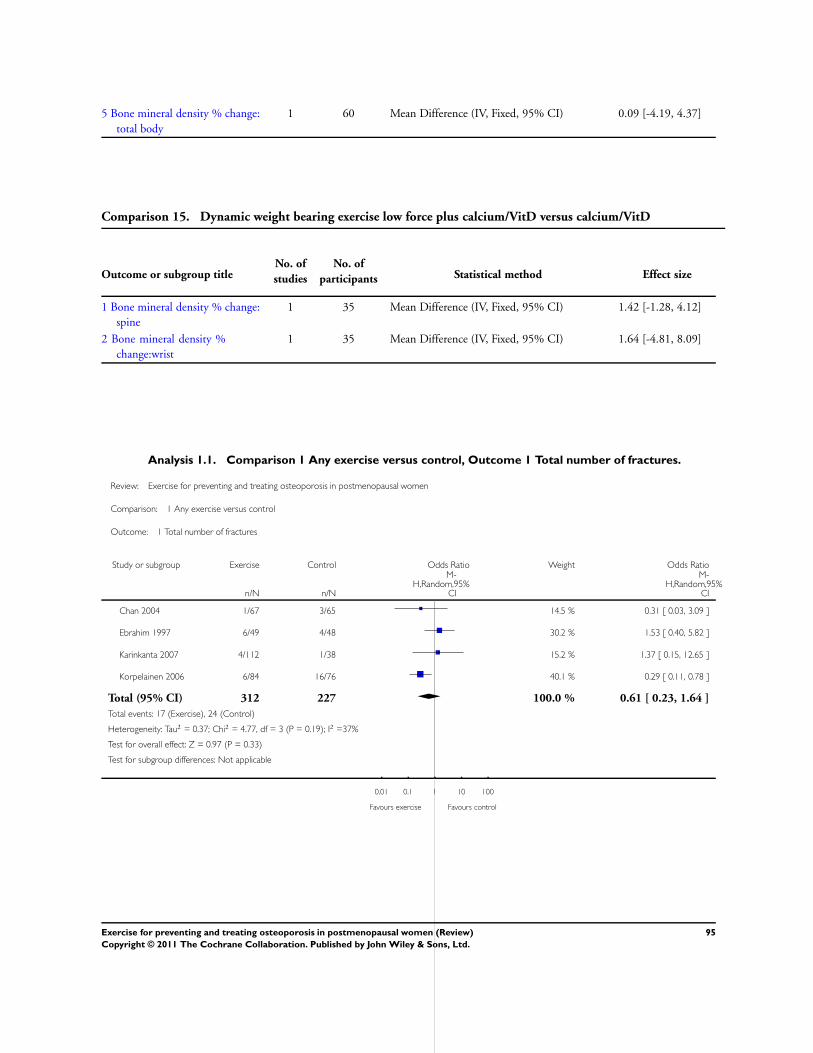
5 Bone mineral density % change:
total body
1 60 Mean Difference (IV, Fixed, 95% CI) 0.09 [-4.19, 4.37]
Comparison 15. Dynamic weight bearing exercise low force plus calcium/VitD versus calcium/VitD
Outcome or subgroup titleNo. of
studies
No. of
participants Statistical method Effect size
1 Bone mineral density % change:
spine
1 35 Mean Difference (IV, Fixed, 95% CI) 1.42 [-1.28, 4.12]
2 Bone mineral density %
change:wrist
1 35 Mean Difference (IV, Fixed, 95% CI) 1.64 [-4.81, 8.09]
Analysis 1.1. Comparison 1 Any exercise versus control, Outcome 1 Total number of fractures.
Review: Exercise for preventing and treating osteoporosis in postmenopausal women
Comparison: 1 Any exercise versus control
Outcome: 1 Total number of fractures
Study or subgroup Exercise Control Odds Ratio Weight Odds Ratio
n/N n/N
M-H,Random,95%
CI
M-H,Random,95%
CI
Chan 2004 1/67 3/65 14.5 % 0.31 [ 0.03, 3.09 ]
Ebrahim 1997 6/49 4/48 30.2 % 1.53 [ 0.40, 5.82 ]
Karinkanta 2007 4/112 1/38 15.2 % 1.37 [ 0.15, 12.65 ]
Korpelainen 2006 6/84 16/76 40.1 % 0.29 [ 0.11, 0.78 ]
Total (95% CI) 312 227 100.0 % 0.61 [ 0.23, 1.64 ]
Total events: 17 (Exercise), 24 (Control)
Heterogeneity: Tau2 = 0.37; Chi2 = 4.77, df = 3 (P = 0.19); I2 =37%
Test for overall effect: Z = 0.97 (P = 0.33)
Test for subgroup differences: Not applicable
0.01 0.1 1 10 100
Favours exercise Favours control
95Exercise for preventing and treating osteoporosis in postmenopausal women (Review)
Copyright © 2011 The Cochrane Collaboration. Published by John Wiley & Sons, Ltd.
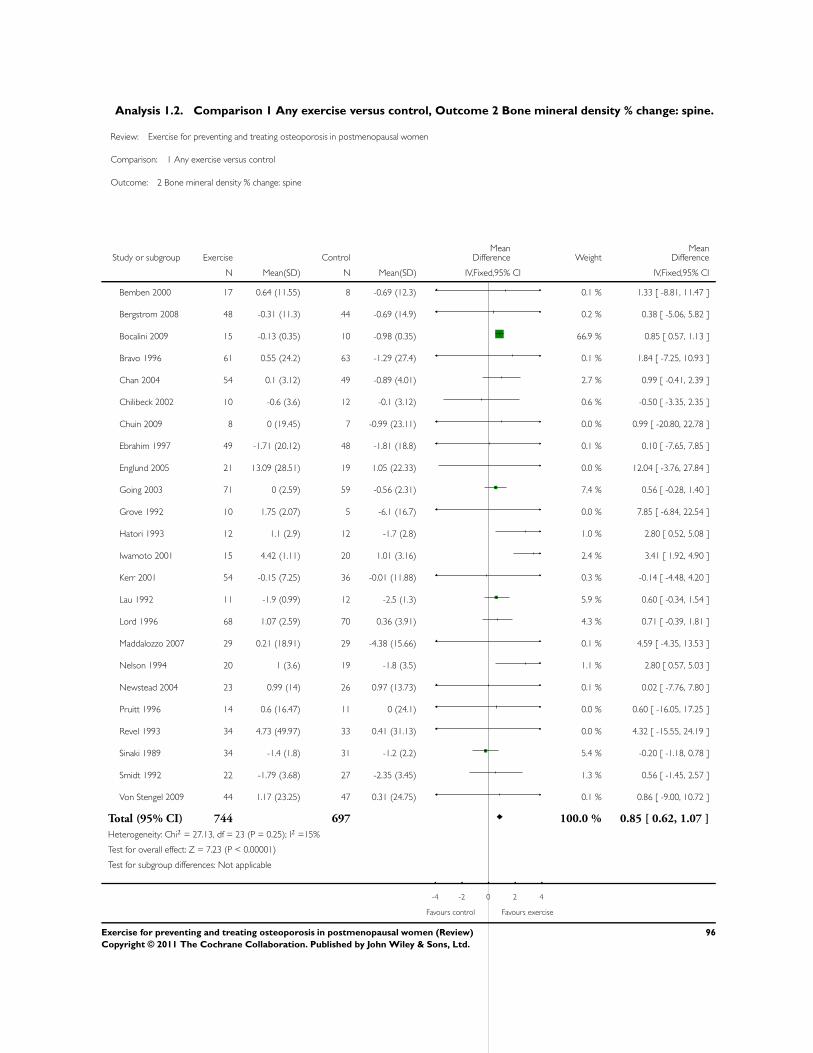
Analysis 1.2. Comparison 1 Any exercise versus control, Outcome 2 Bone mineral density % change: spine.
Review: Exercise for preventing and treating osteoporosis in postmenopausal women
Comparison: 1 Any exercise versus control
Outcome: 2 Bone mineral density % change: spine
Study or subgroup Exercise ControlMean
Difference WeightMean
Difference
N Mean(SD) N Mean(SD) IV,Fixed,95% CI IV,Fixed,95% CI
Bemben 2000 17 0.64 (11.55) 8 -0.69 (12.3) 0.1 % 1.33 [ -8.81, 11.47 ]
Bergstrom 2008 48 -0.31 (11.3) 44 -0.69 (14.9) 0.2 % 0.38 [ -5.06, 5.82 ]
Bocalini 2009 15 -0.13 (0.35) 10 -0.98 (0.35) 66.9 % 0.85 [ 0.57, 1.13 ]
Bravo 1996 61 0.55 (24.2) 63 -1.29 (27.4) 0.1 % 1.84 [ -7.25, 10.93 ]
Chan 2004 54 0.1 (3.12) 49 -0.89 (4.01) 2.7 % 0.99 [ -0.41, 2.39 ]
Chilibeck 2002 10 -0.6 (3.6) 12 -0.1 (3.12) 0.6 % -0.50 [ -3.35, 2.35 ]
Chuin 2009 8 0 (19.45) 7 -0.99 (23.11) 0.0 % 0.99 [ -20.80, 22.78 ]
Ebrahim 1997 49 -1.71 (20.12) 48 -1.81 (18.8) 0.1 % 0.10 [ -7.65, 7.85 ]
Englund 2005 21 13.09 (28.51) 19 1.05 (22.33) 0.0 % 12.04 [ -3.76, 27.84 ]
Going 2003 71 0 (2.59) 59 -0.56 (2.31) 7.4 % 0.56 [ -0.28, 1.40 ]
Grove 1992 10 1.75 (2.07) 5 -6.1 (16.7) 0.0 % 7.85 [ -6.84, 22.54 ]
Hatori 1993 12 1.1 (2.9) 12 -1.7 (2.8) 1.0 % 2.80 [ 0.52, 5.08 ]
Iwamoto 2001 15 4.42 (1.11) 20 1.01 (3.16) 2.4 % 3.41 [ 1.92, 4.90 ]
Kerr 2001 54 -0.15 (7.25) 36 -0.01 (11.88) 0.3 % -0.14 [ -4.48, 4.20 ]
Lau 1992 11 -1.9 (0.99) 12 -2.5 (1.3) 5.9 % 0.60 [ -0.34, 1.54 ]
Lord 1996 68 1.07 (2.59) 70 0.36 (3.91) 4.3 % 0.71 [ -0.39, 1.81 ]
Maddalozzo 2007 29 0.21 (18.91) 29 -4.38 (15.66) 0.1 % 4.59 [ -4.35, 13.53 ]
Nelson 1994 20 1 (3.6) 19 -1.8 (3.5) 1.1 % 2.80 [ 0.57, 5.03 ]
Newstead 2004 23 0.99 (14) 26 0.97 (13.73) 0.1 % 0.02 [ -7.76, 7.80 ]
Pruitt 1996 14 0.6 (16.47) 11 0 (24.1) 0.0 % 0.60 [ -16.05, 17.25 ]
Revel 1993 34 4.73 (49.97) 33 0.41 (31.13) 0.0 % 4.32 [ -15.55, 24.19 ]
Sinaki 1989 34 -1.4 (1.8) 31 -1.2 (2.2) 5.4 % -0.20 [ -1.18, 0.78 ]
Smidt 1992 22 -1.79 (3.68) 27 -2.35 (3.45) 1.3 % 0.56 [ -1.45, 2.57 ]
Von Stengel 2009 44 1.17 (23.25) 47 0.31 (24.75) 0.1 % 0.86 [ -9.00, 10.72 ]
Total (95% CI) 744 697 100.0 % 0.85 [ 0.62, 1.07 ]
Heterogeneity: Chi2 = 27.13, df = 23 (P = 0.25); I2 =15%
Test for overall effect: Z = 7.23 (P < 0.00001)
Test for subgroup differences: Not applicable
-4 -2 0 2 4
Favours control Favours exercise
96Exercise for preventing and treating osteoporosis in postmenopausal women (Review)
Copyright © 2011 The Cochrane Collaboration. Published by John Wiley & Sons, Ltd.
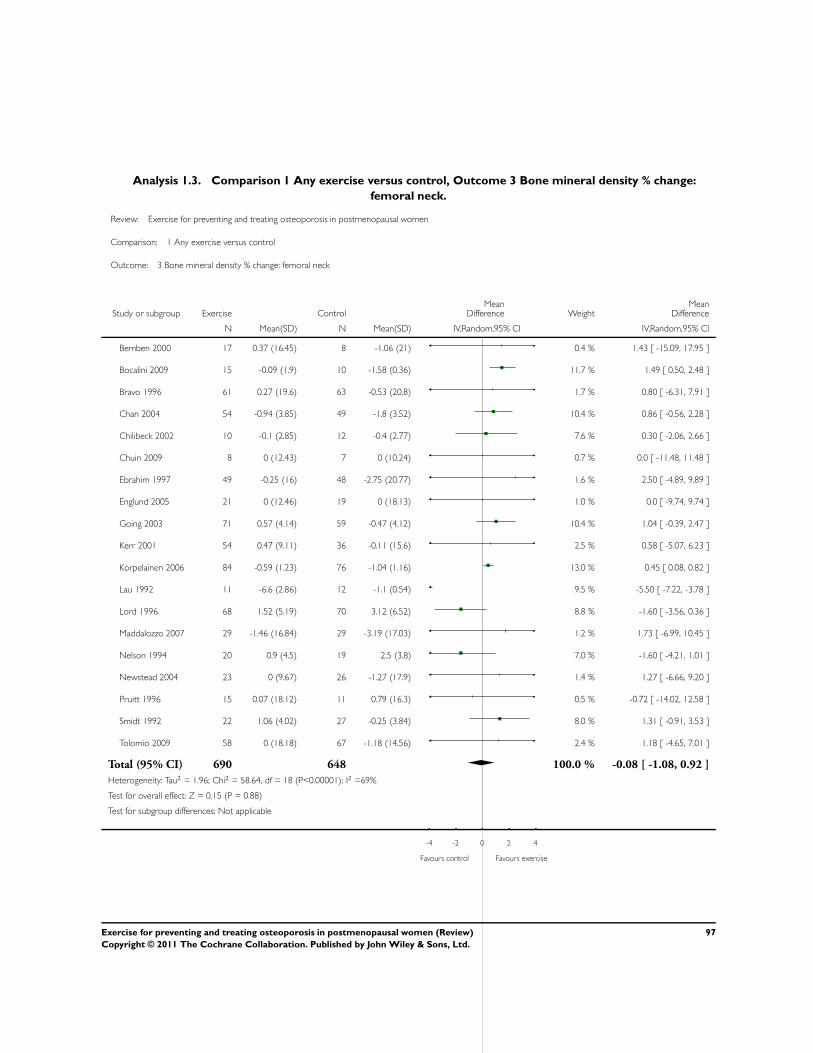
Analysis 1.3. Comparison 1 Any exercise versus control, Outcome 3 Bone mineral density % change:
femoral neck.
Review: Exercise for preventing and treating osteoporosis in postmenopausal women
Comparison: 1 Any exercise versus control
Outcome: 3 Bone mineral density % change: femoral neck
Study or subgroup Exercise ControlMean
Difference WeightMean
Difference
N Mean(SD) N Mean(SD) IV,Random,95% CI IV,Random,95% CI
Bemben 2000 17 0.37 (16.45) 8 -1.06 (21) 0.4 % 1.43 [ -15.09, 17.95 ]
Bocalini 2009 15 -0.09 (1.9) 10 -1.58 (0.36) 11.7 % 1.49 [ 0.50, 2.48 ]
Bravo 1996 61 0.27 (19.6) 63 -0.53 (20.8) 1.7 % 0.80 [ -6.31, 7.91 ]
Chan 2004 54 -0.94 (3.85) 49 -1.8 (3.52) 10.4 % 0.86 [ -0.56, 2.28 ]
Chilibeck 2002 10 -0.1 (2.85) 12 -0.4 (2.77) 7.6 % 0.30 [ -2.06, 2.66 ]
Chuin 2009 8 0 (12.43) 7 0 (10.24) 0.7 % 0.0 [ -11.48, 11.48 ]
Ebrahim 1997 49 -0.25 (16) 48 -2.75 (20.77) 1.6 % 2.50 [ -4.89, 9.89 ]
Englund 2005 21 0 (12.46) 19 0 (18.13) 1.0 % 0.0 [ -9.74, 9.74 ]
Going 2003 71 0.57 (4.14) 59 -0.47 (4.12) 10.4 % 1.04 [ -0.39, 2.47 ]
Kerr 2001 54 0.47 (9.11) 36 -0.11 (15.6) 2.5 % 0.58 [ -5.07, 6.23 ]
Korpelainen 2006 84 -0.59 (1.23) 76 -1.04 (1.16) 13.0 % 0.45 [ 0.08, 0.82 ]
Lau 1992 11 -6.6 (2.86) 12 -1.1 (0.54) 9.5 % -5.50 [ -7.22, -3.78 ]
Lord 1996 68 1.52 (5.19) 70 3.12 (6.52) 8.8 % -1.60 [ -3.56, 0.36 ]
Maddalozzo 2007 29 -1.46 (16.84) 29 -3.19 (17.03) 1.2 % 1.73 [ -6.99, 10.45 ]
Nelson 1994 20 0.9 (4.5) 19 2.5 (3.8) 7.0 % -1.60 [ -4.21, 1.01 ]
Newstead 2004 23 0 (9.67) 26 -1.27 (17.9) 1.4 % 1.27 [ -6.66, 9.20 ]
Pruitt 1996 15 0.07 (18.12) 11 0.79 (16.3) 0.5 % -0.72 [ -14.02, 12.58 ]
Smidt 1992 22 1.06 (4.02) 27 -0.25 (3.84) 8.0 % 1.31 [ -0.91, 3.53 ]
Tolomio 2009 58 0 (18.18) 67 -1.18 (14.56) 2.4 % 1.18 [ -4.65, 7.01 ]
Total (95% CI) 690 648 100.0 % -0.08 [ -1.08, 0.92 ]
Heterogeneity: Tau2 = 1.96; Chi2 = 58.64, df = 18 (P<0.00001); I2 =69%
Test for overall effect: Z = 0.15 (P = 0.88)
Test for subgroup differences: Not applicable
-4 -2 0 2 4
Favours control Favours exercise
97Exercise for preventing and treating osteoporosis in postmenopausal women (Review)
Copyright © 2011 The Cochrane Collaboration. Published by John Wiley & Sons, Ltd.
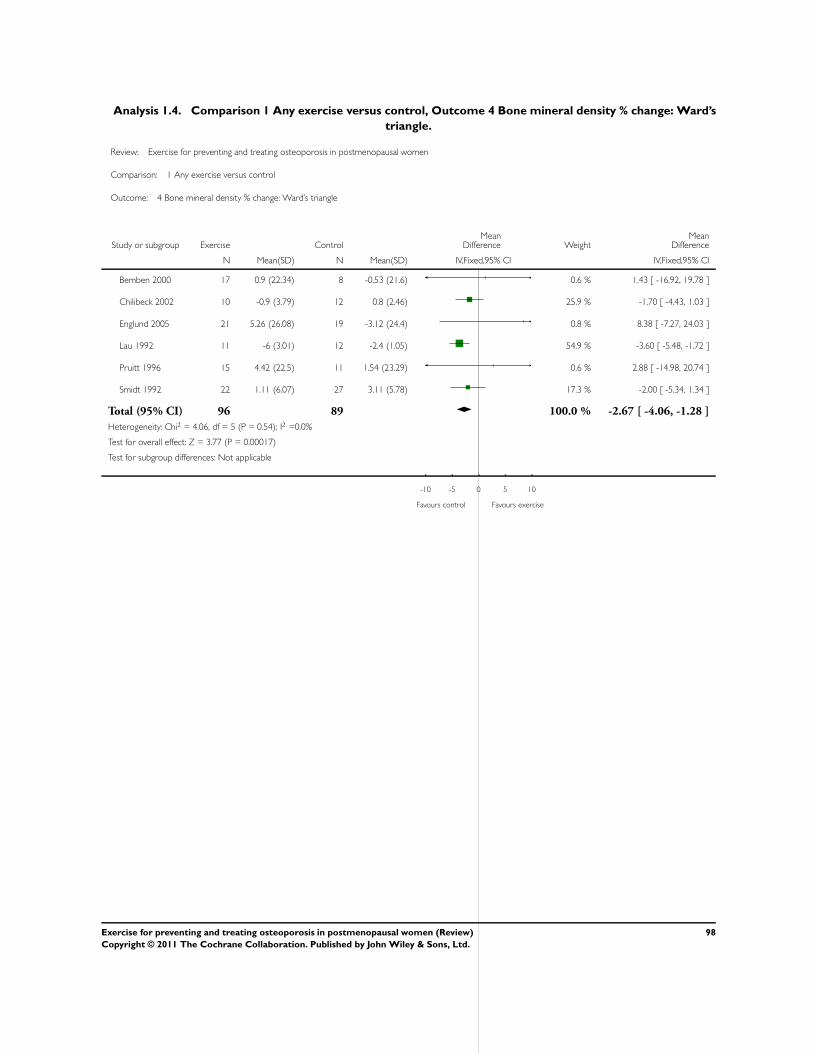
Analysis 1.4. Comparison 1 Any exercise versus control, Outcome 4 Bone mineral density % change: Ward’s
triangle.
Review: Exercise for preventing and treating osteoporosis in postmenopausal women
Comparison: 1 Any exercise versus control
Outcome: 4 Bone mineral density % change: Ward’s triangle
Study or subgroup Exercise ControlMean
Difference WeightMean
Difference
N Mean(SD) N Mean(SD) IV,Fixed,95% CI IV,Fixed,95% CI
Bemben 2000 17 0.9 (22.34) 8 -0.53 (21.6) 0.6 % 1.43 [ -16.92, 19.78 ]
Chilibeck 2002 10 -0.9 (3.79) 12 0.8 (2.46) 25.9 % -1.70 [ -4.43, 1.03 ]
Englund 2005 21 5.26 (26.08) 19 -3.12 (24.4) 0.8 % 8.38 [ -7.27, 24.03 ]
Lau 1992 11 -6 (3.01) 12 -2.4 (1.05) 54.9 % -3.60 [ -5.48, -1.72 ]
Pruitt 1996 15 4.42 (22.5) 11 1.54 (23.29) 0.6 % 2.88 [ -14.98, 20.74 ]
Smidt 1992 22 1.11 (6.07) 27 3.11 (5.78) 17.3 % -2.00 [ -5.34, 1.34 ]
Total (95% CI) 96 89 100.0 % -2.67 [ -4.06, -1.28 ]
Heterogeneity: Chi2 = 4.06, df = 5 (P = 0.54); I2 =0.0%
Test for overall effect: Z = 3.77 (P = 0.00017)
Test for subgroup differences: Not applicable
-10 -5 0 5 10
Favours control Favours exercise
98Exercise for preventing and treating osteoporosis in postmenopausal women (Review)
Copyright © 2011 The Cochrane Collaboration. Published by John Wiley & Sons, Ltd.
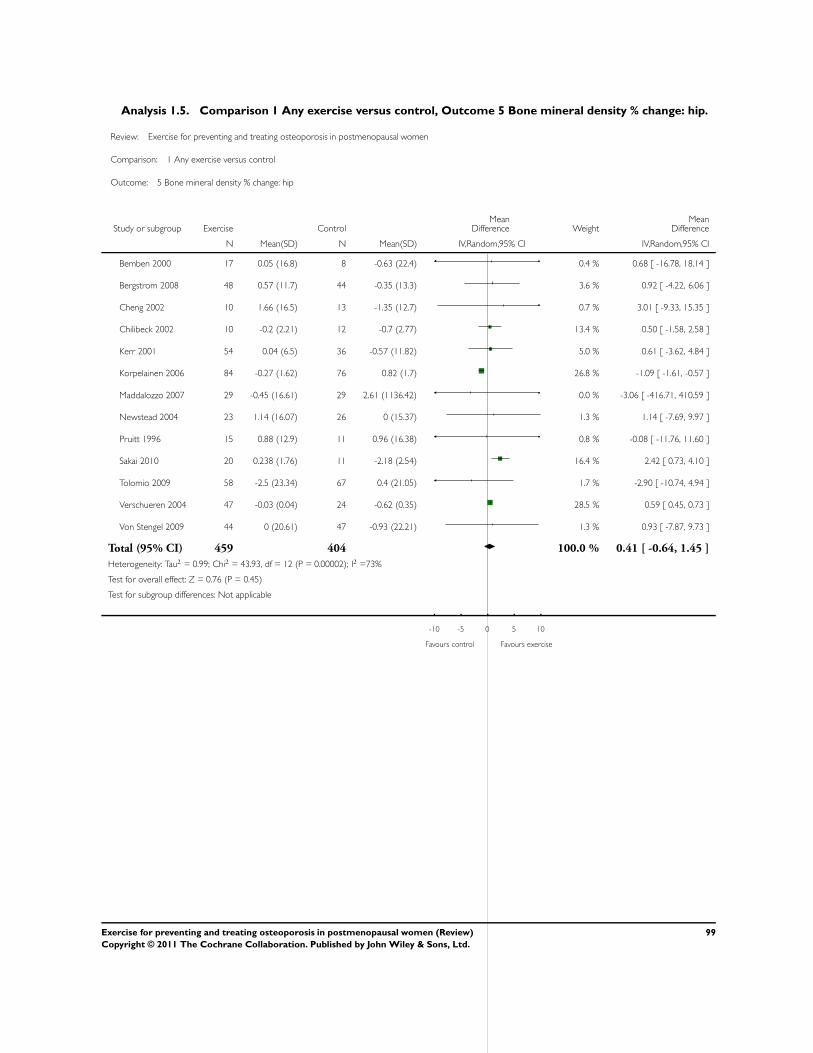
Analysis 1.5. Comparison 1 Any exercise versus control, Outcome 5 Bone mineral density % change: hip.
Review: Exercise for preventing and treating osteoporosis in postmenopausal women
Comparison: 1 Any exercise versus control
Outcome: 5 Bone mineral density % change: hip
Study or subgroup Exercise ControlMean
Difference WeightMean
Difference
N Mean(SD) N Mean(SD) IV,Random,95% CI IV,Random,95% CI
Bemben 2000 17 0.05 (16.8) 8 -0.63 (22.4) 0.4 % 0.68 [ -16.78, 18.14 ]
Bergstrom 2008 48 0.57 (11.7) 44 -0.35 (13.3) 3.6 % 0.92 [ -4.22, 6.06 ]
Cheng 2002 10 1.66 (16.5) 13 -1.35 (12.7) 0.7 % 3.01 [ -9.33, 15.35 ]
Chilibeck 2002 10 -0.2 (2.21) 12 -0.7 (2.77) 13.4 % 0.50 [ -1.58, 2.58 ]
Kerr 2001 54 0.04 (6.5) 36 -0.57 (11.82) 5.0 % 0.61 [ -3.62, 4.84 ]
Korpelainen 2006 84 -0.27 (1.62) 76 0.82 (1.7) 26.8 % -1.09 [ -1.61, -0.57 ]
Maddalozzo 2007 29 -0.45 (16.61) 29 2.61 (1136.42) 0.0 % -3.06 [ -416.71, 410.59 ]
Newstead 2004 23 1.14 (16.07) 26 0 (15.37) 1.3 % 1.14 [ -7.69, 9.97 ]
Pruitt 1996 15 0.88 (12.9) 11 0.96 (16.38) 0.8 % -0.08 [ -11.76, 11.60 ]
Sakai 2010 20 0.238 (1.76) 11 -2.18 (2.54) 16.4 % 2.42 [ 0.73, 4.10 ]
Tolomio 2009 58 -2.5 (23.34) 67 0.4 (21.05) 1.7 % -2.90 [ -10.74, 4.94 ]
Verschueren 2004 47 -0.03 (0.04) 24 -0.62 (0.35) 28.5 % 0.59 [ 0.45, 0.73 ]
Von Stengel 2009 44 0 (20.61) 47 -0.93 (22.21) 1.3 % 0.93 [ -7.87, 9.73 ]
Total (95% CI) 459 404 100.0 % 0.41 [ -0.64, 1.45 ]
Heterogeneity: Tau2 = 0.99; Chi2 = 43.93, df = 12 (P = 0.00002); I2 =73%
Test for overall effect: Z = 0.76 (P = 0.45)
Test for subgroup differences: Not applicable
-10 -5 0 5 10
Favours control Favours exercise
99Exercise for preventing and treating osteoporosis in postmenopausal women (Review)
Copyright © 2011 The Cochrane Collaboration. Published by John Wiley & Sons, Ltd.
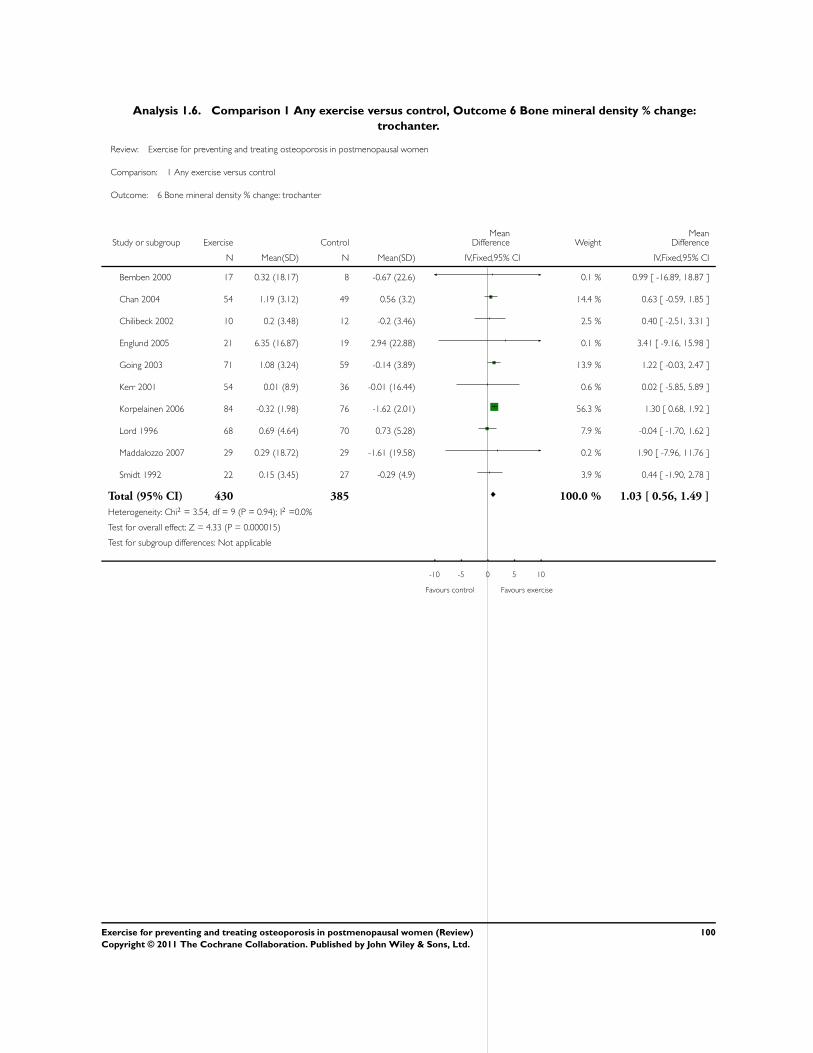
Analysis 1.6. Comparison 1 Any exercise versus control, Outcome 6 Bone mineral density % change:
trochanter.
Review: Exercise for preventing and treating osteoporosis in postmenopausal women
Comparison: 1 Any exercise versus control
Outcome: 6 Bone mineral density % change: trochanter
Study or subgroup Exercise ControlMean
Difference WeightMean
Difference
N Mean(SD) N Mean(SD) IV,Fixed,95% CI IV,Fixed,95% CI
Bemben 2000 17 0.32 (18.17) 8 -0.67 (22.6) 0.1 % 0.99 [ -16.89, 18.87 ]
Chan 2004 54 1.19 (3.12) 49 0.56 (3.2) 14.4 % 0.63 [ -0.59, 1.85 ]
Chilibeck 2002 10 0.2 (3.48) 12 -0.2 (3.46) 2.5 % 0.40 [ -2.51, 3.31 ]
Englund 2005 21 6.35 (16.87) 19 2.94 (22.88) 0.1 % 3.41 [ -9.16, 15.98 ]
Going 2003 71 1.08 (3.24) 59 -0.14 (3.89) 13.9 % 1.22 [ -0.03, 2.47 ]
Kerr 2001 54 0.01 (8.9) 36 -0.01 (16.44) 0.6 % 0.02 [ -5.85, 5.89 ]
Korpelainen 2006 84 -0.32 (1.98) 76 -1.62 (2.01) 56.3 % 1.30 [ 0.68, 1.92 ]
Lord 1996 68 0.69 (4.64) 70 0.73 (5.28) 7.9 % -0.04 [ -1.70, 1.62 ]
Maddalozzo 2007 29 0.29 (18.72) 29 -1.61 (19.58) 0.2 % 1.90 [ -7.96, 11.76 ]
Smidt 1992 22 0.15 (3.45) 27 -0.29 (4.9) 3.9 % 0.44 [ -1.90, 2.78 ]
Total (95% CI) 430 385 100.0 % 1.03 [ 0.56, 1.49 ]
Heterogeneity: Chi2 = 3.54, df = 9 (P = 0.94); I2 =0.0%
Test for overall effect: Z = 4.33 (P = 0.000015)
Test for subgroup differences: Not applicable
-10 -5 0 5 10
Favours control Favours exercise
100Exercise for preventing and treating osteoporosis in postmenopausal women (Review)
Copyright © 2011 The Cochrane Collaboration. Published by John Wiley & Sons, Ltd.
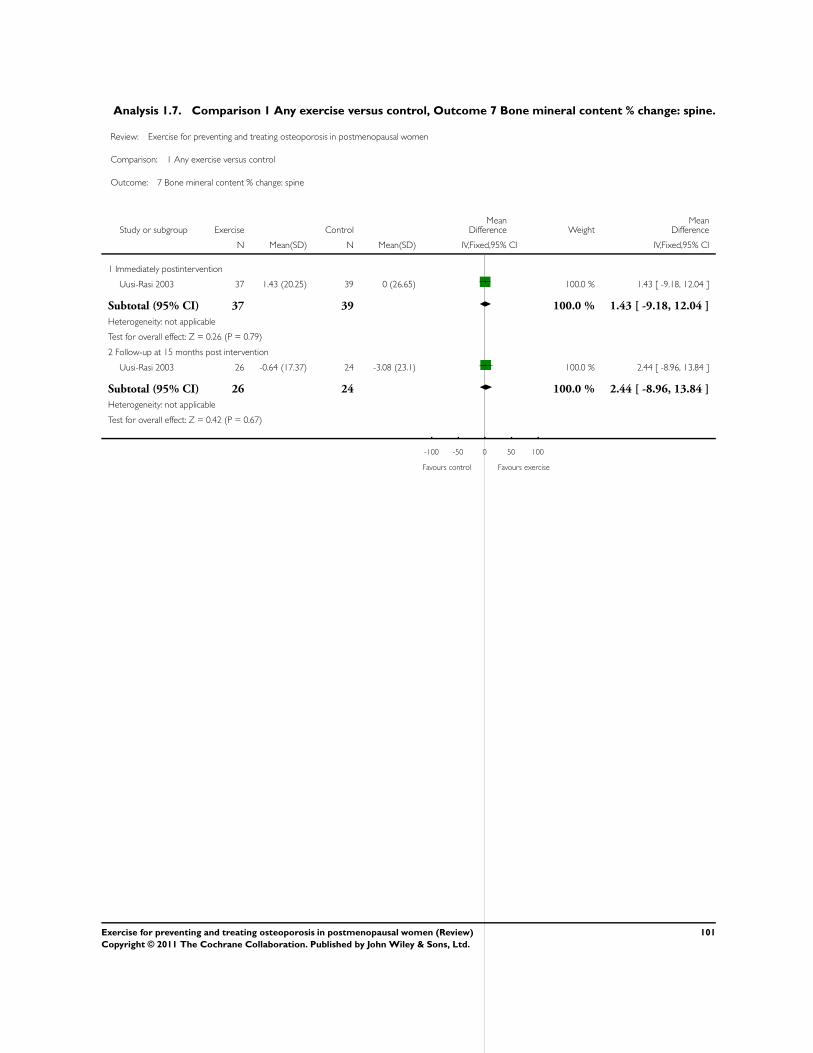
Analysis 1.7. Comparison 1 Any exercise versus control, Outcome 7 Bone mineral content % change: spine.
Review: Exercise for preventing and treating osteoporosis in postmenopausal women
Comparison: 1 Any exercise versus control
Outcome: 7 Bone mineral content % change: spine
Study or subgroup Exercise ControlMean
Difference WeightMean
Difference
N Mean(SD) N Mean(SD) IV,Fixed,95% CI IV,Fixed,95% CI
1 Immediately postintervention
Uusi-Rasi 2003 37 1.43 (20.25) 39 0 (26.65) 100.0 % 1.43 [ -9.18, 12.04 ]
Subtotal (95% CI) 37 39 100.0 % 1.43 [ -9.18, 12.04 ]
Heterogeneity: not applicable
Test for overall effect: Z = 0.26 (P = 0.79)
2 Follow-up at 15 months post intervention
Uusi-Rasi 2003 26 -0.64 (17.37) 24 -3.08 (23.1) 100.0 % 2.44 [ -8.96, 13.84 ]
Subtotal (95% CI) 26 24 100.0 % 2.44 [ -8.96, 13.84 ]
Heterogeneity: not applicable
Test for overall effect: Z = 0.42 (P = 0.67)
-100 -50 0 50 100
Favours control Favours exercise
101Exercise for preventing and treating osteoporosis in postmenopausal women (Review)
Copyright © 2011 The Cochrane Collaboration. Published by John Wiley & Sons, Ltd.
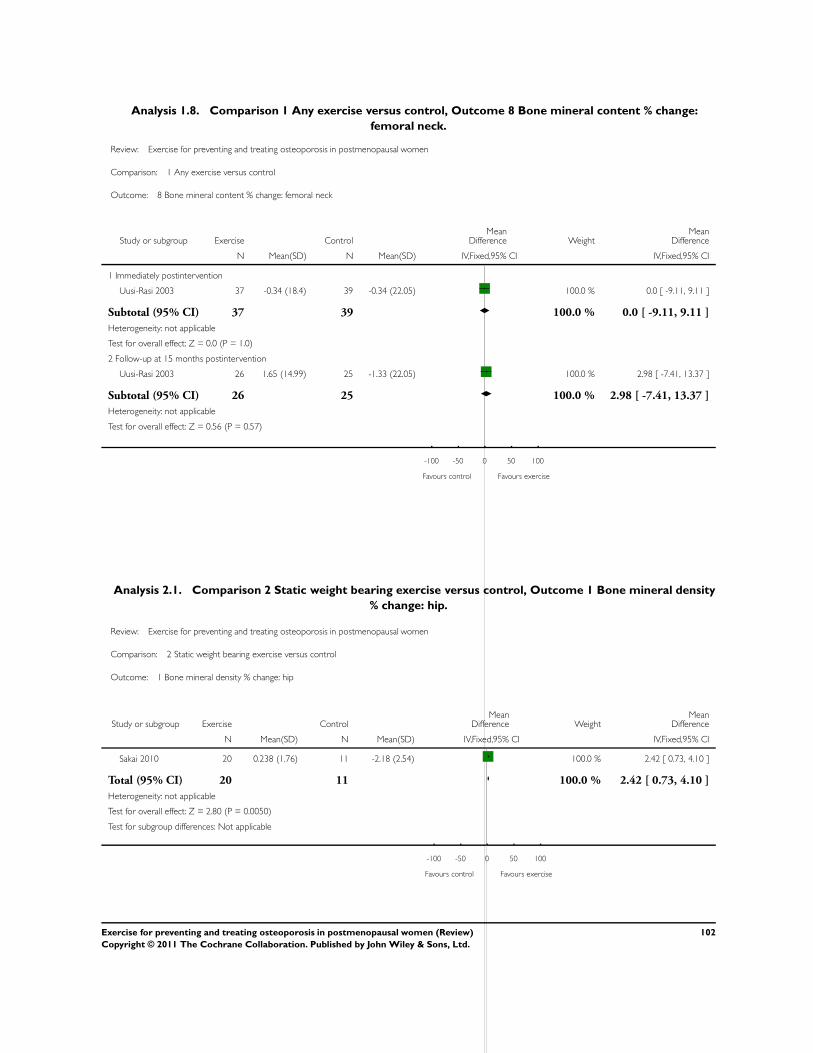
Analysis 1.8. Comparison 1 Any exercise versus control, Outcome 8 Bone mineral content % change:
femoral neck.
Review: Exercise for preventing and treating osteoporosis in postmenopausal women
Comparison: 1 Any exercise versus control
Outcome: 8 Bone mineral content % change: femoral neck
Study or subgroup Exercise ControlMean
Difference WeightMean
Difference
N Mean(SD) N Mean(SD) IV,Fixed,95% CI IV,Fixed,95% CI
1 Immediately postintervention
Uusi-Rasi 2003 37 -0.34 (18.4) 39 -0.34 (22.05) 100.0 % 0.0 [ -9.11, 9.11 ]
Subtotal (95% CI) 37 39 100.0 % 0.0 [ -9.11, 9.11 ]
Heterogeneity: not applicable
Test for overall effect: Z = 0.0 (P = 1.0)
2 Follow-up at 15 months postintervention
Uusi-Rasi 2003 26 1.65 (14.99) 25 -1.33 (22.05) 100.0 % 2.98 [ -7.41, 13.37 ]
Subtotal (95% CI) 26 25 100.0 % 2.98 [ -7.41, 13.37 ]
Heterogeneity: not applicable
Test for overall effect: Z = 0.56 (P = 0.57)
-100 -50 0 50 100
Favours control Favours exercise
Analysis 2.1. Comparison 2 Static weight bearing exercise versus control, Outcome 1 Bone mineral density
% change: hip.
Review: Exercise for preventing and treating osteoporosis in postmenopausal women
Comparison: 2 Static weight bearing exercise versus control
Outcome: 1 Bone mineral density % change: hip
Study or subgroup Exercise ControlMean
Difference WeightMean
Difference
N Mean(SD) N Mean(SD) IV,Fixed,95% CI IV,Fixed,95% CI
Sakai 2010 20 0.238 (1.76) 11 -2.18 (2.54) 100.0 % 2.42 [ 0.73, 4.10 ]
Total (95% CI) 20 11 100.0 % 2.42 [ 0.73, 4.10 ]
Heterogeneity: not applicable
Test for overall effect: Z = 2.80 (P = 0.0050)
Test for subgroup differences: Not applicable
-100 -50 0 50 100
Favours control Favours exercise
102Exercise for preventing and treating osteoporosis in postmenopausal women (Review)
Copyright © 2011 The Cochrane Collaboration. Published by John Wiley & Sons, Ltd.
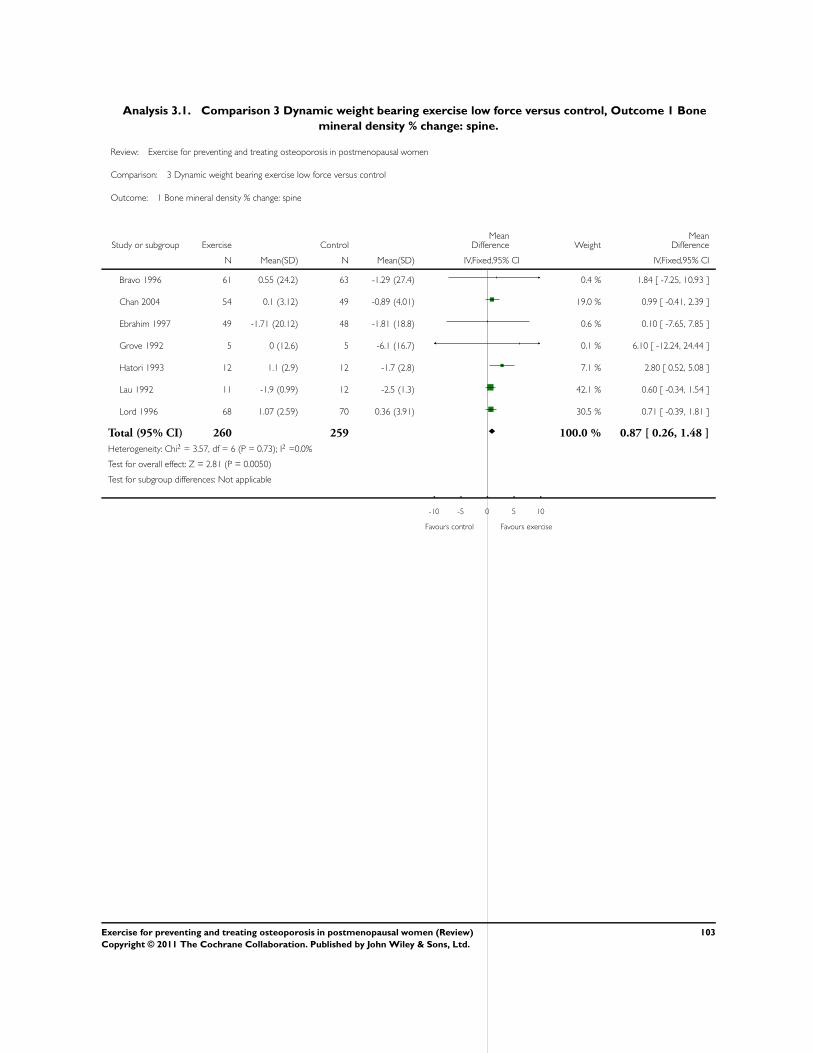
Analysis 3.1. Comparison 3 Dynamic weight bearing exercise low force versus control, Outcome 1 Bone
mineral density % change: spine.
Review: Exercise for preventing and treating osteoporosis in postmenopausal women
Comparison: 3 Dynamic weight bearing exercise low force versus control
Outcome: 1 Bone mineral density % change: spine
Study or subgroup Exercise ControlMean
Difference WeightMean
Difference
N Mean(SD) N Mean(SD) IV,Fixed,95% CI IV,Fixed,95% CI
Bravo 1996 61 0.55 (24.2) 63 -1.29 (27.4) 0.4 % 1.84 [ -7.25, 10.93 ]
Chan 2004 54 0.1 (3.12) 49 -0.89 (4.01) 19.0 % 0.99 [ -0.41, 2.39 ]
Ebrahim 1997 49 -1.71 (20.12) 48 -1.81 (18.8) 0.6 % 0.10 [ -7.65, 7.85 ]
Grove 1992 5 0 (12.6) 5 -6.1 (16.7) 0.1 % 6.10 [ -12.24, 24.44 ]
Hatori 1993 12 1.1 (2.9) 12 -1.7 (2.8) 7.1 % 2.80 [ 0.52, 5.08 ]
Lau 1992 11 -1.9 (0.99) 12 -2.5 (1.3) 42.1 % 0.60 [ -0.34, 1.54 ]
Lord 1996 68 1.07 (2.59) 70 0.36 (3.91) 30.5 % 0.71 [ -0.39, 1.81 ]
Total (95% CI) 260 259 100.0 % 0.87 [ 0.26, 1.48 ]
Heterogeneity: Chi2 = 3.57, df = 6 (P = 0.73); I2 =0.0%
Test for overall effect: Z = 2.81 (P = 0.0050)
Test for subgroup differences: Not applicable
-10 -5 0 5 10
Favours control Favours exercise
103Exercise for preventing and treating osteoporosis in postmenopausal women (Review)
Copyright © 2011 The Cochrane Collaboration. Published by John Wiley & Sons, Ltd.
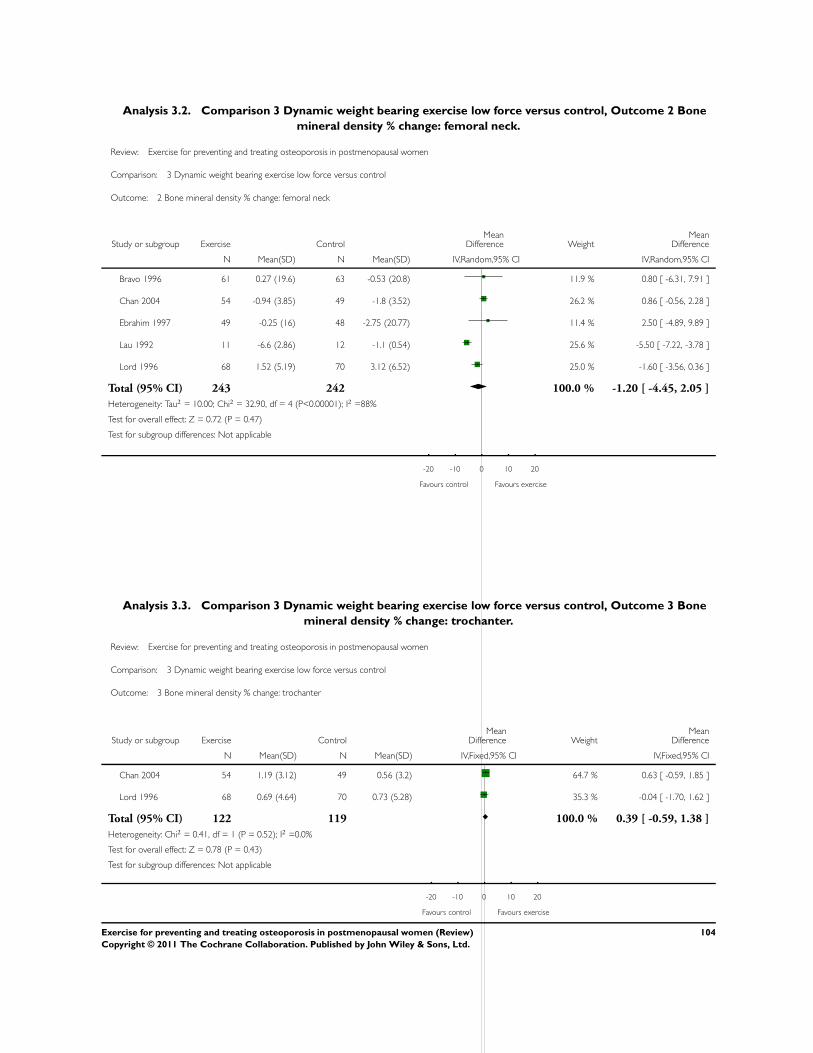
Analysis 3.2. Comparison 3 Dynamic weight bearing exercise low force versus control, Outcome 2 Bone
mineral density % change: femoral neck.
Review: Exercise for preventing and treating osteoporosis in postmenopausal women
Comparison: 3 Dynamic weight bearing exercise low force versus control
Outcome: 2 Bone mineral density % change: femoral neck
Study or subgroup Exercise ControlMean
Difference WeightMean
Difference
N Mean(SD) N Mean(SD) IV,Random,95% CI IV,Random,95% CI
Bravo 1996 61 0.27 (19.6) 63 -0.53 (20.8) 11.9 % 0.80 [ -6.31, 7.91 ]
Chan 2004 54 -0.94 (3.85) 49 -1.8 (3.52) 26.2 % 0.86 [ -0.56, 2.28 ]
Ebrahim 1997 49 -0.25 (16) 48 -2.75 (20.77) 11.4 % 2.50 [ -4.89, 9.89 ]
Lau 1992 11 -6.6 (2.86) 12 -1.1 (0.54) 25.6 % -5.50 [ -7.22, -3.78 ]
Lord 1996 68 1.52 (5.19) 70 3.12 (6.52) 25.0 % -1.60 [ -3.56, 0.36 ]
Total (95% CI) 243 242 100.0 % -1.20 [ -4.45, 2.05 ]
Heterogeneity: Tau2 = 10.00; Chi2 = 32.90, df = 4 (P<0.00001); I2 =88%
Test for overall effect: Z = 0.72 (P = 0.47)
Test for subgroup differences: Not applicable
-20 -10 0 10 20
Favours control Favours exercise
Analysis 3.3. Comparison 3 Dynamic weight bearing exercise low force versus control, Outcome 3 Bone
mineral density % change: trochanter.
Review: Exercise for preventing and treating osteoporosis in postmenopausal women
Comparison: 3 Dynamic weight bearing exercise low force versus control
Outcome: 3 Bone mineral density % change: trochanter
Study or subgroup Exercise ControlMean
Difference WeightMean
Difference
N Mean(SD) N Mean(SD) IV,Fixed,95% CI IV,Fixed,95% CI
Chan 2004 54 1.19 (3.12) 49 0.56 (3.2) 64.7 % 0.63 [ -0.59, 1.85 ]
Lord 1996 68 0.69 (4.64) 70 0.73 (5.28) 35.3 % -0.04 [ -1.70, 1.62 ]
Total (95% CI) 122 119 100.0 % 0.39 [ -0.59, 1.38 ]
Heterogeneity: Chi2 = 0.41, df = 1 (P = 0.52); I2 =0.0%
Test for overall effect: Z = 0.78 (P = 0.43)
Test for subgroup differences: Not applicable
-20 -10 0 10 20
Favours control Favours exercise
104Exercise for preventing and treating osteoporosis in postmenopausal women (Review)
Copyright © 2011 The Cochrane Collaboration. Published by John Wiley & Sons, Ltd.
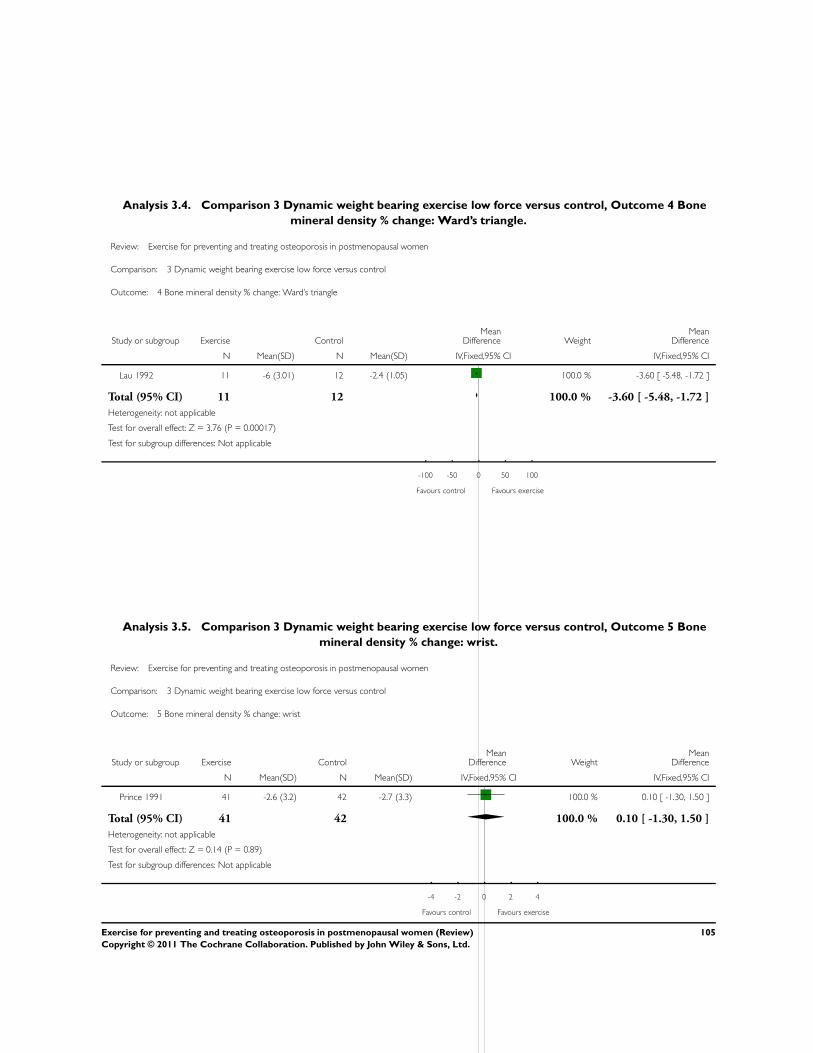
Analysis 3.4. Comparison 3 Dynamic weight bearing exercise low force versus control, Outcome 4 Bone
mineral density % change: Ward’s triangle.
Review: Exercise for preventing and treating osteoporosis in postmenopausal women
Comparison: 3 Dynamic weight bearing exercise low force versus control
Outcome: 4 Bone mineral density % change: Ward’s triangle
Study or subgroup Exercise ControlMean
Difference WeightMean
Difference
N Mean(SD) N Mean(SD) IV,Fixed,95% CI IV,Fixed,95% CI
Lau 1992 11 -6 (3.01) 12 -2.4 (1.05) 100.0 % -3.60 [ -5.48, -1.72 ]
Total (95% CI) 11 12 100.0 % -3.60 [ -5.48, -1.72 ]
Heterogeneity: not applicable
Test for overall effect: Z = 3.76 (P = 0.00017)
Test for subgroup differences: Not applicable
-100 -50 0 50 100
Favours control Favours exercise
Analysis 3.5. Comparison 3 Dynamic weight bearing exercise low force versus control, Outcome 5 Bone
mineral density % change: wrist.
Review: Exercise for preventing and treating osteoporosis in postmenopausal women
Comparison: 3 Dynamic weight bearing exercise low force versus control
Outcome: 5 Bone mineral density % change: wrist
Study or subgroup Exercise ControlMean
Difference WeightMean
Difference
N Mean(SD) N Mean(SD) IV,Fixed,95% CI IV,Fixed,95% CI
Prince 1991 41 -2.6 (3.2) 42 -2.7 (3.3) 100.0 % 0.10 [ -1.30, 1.50 ]
Total (95% CI) 41 42 100.0 % 0.10 [ -1.30, 1.50 ]
Heterogeneity: not applicable
Test for overall effect: Z = 0.14 (P = 0.89)
Test for subgroup differences: Not applicable
-4 -2 0 2 4
Favours control Favours exercise
105Exercise for preventing and treating osteoporosis in postmenopausal women (Review)
Copyright © 2011 The Cochrane Collaboration. Published by John Wiley & Sons, Ltd.
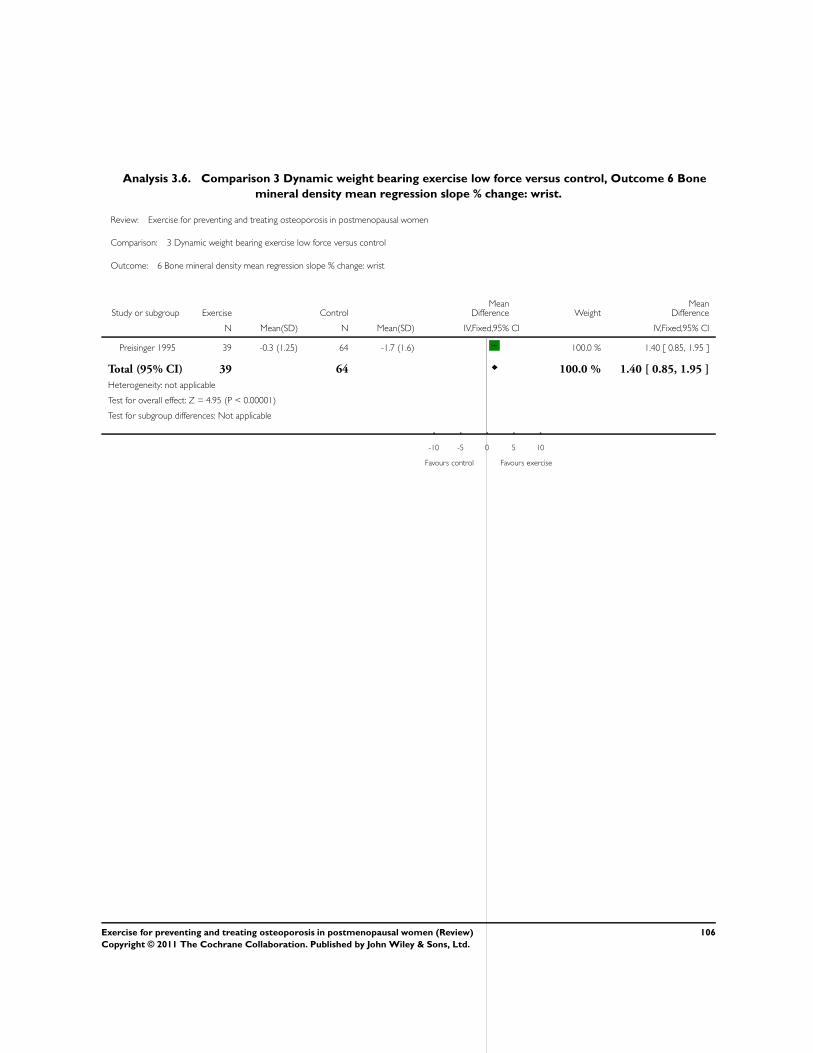
Analysis 3.6. Comparison 3 Dynamic weight bearing exercise low force versus control, Outcome 6 Bone
mineral density mean regression slope % change: wrist.
Review: Exercise for preventing and treating osteoporosis in postmenopausal women
Comparison: 3 Dynamic weight bearing exercise low force versus control
Outcome: 6 Bone mineral density mean regression slope % change: wrist
Study or subgroup Exercise ControlMean
Difference WeightMean
Difference
N Mean(SD) N Mean(SD) IV,Fixed,95% CI IV,Fixed,95% CI
Preisinger 1995 39 -0.3 (1.25) 64 -1.7 (1.6) 100.0 % 1.40 [ 0.85, 1.95 ]
Total (95% CI) 39 64 100.0 % 1.40 [ 0.85, 1.95 ]
Heterogeneity: not applicable
Test for overall effect: Z = 4.95 (P < 0.00001)
Test for subgroup differences: Not applicable
-10 -5 0 5 10
Favours control Favours exercise
106Exercise for preventing and treating osteoporosis in postmenopausal women (Review)
Copyright © 2011 The Cochrane Collaboration. Published by John Wiley & Sons, Ltd.
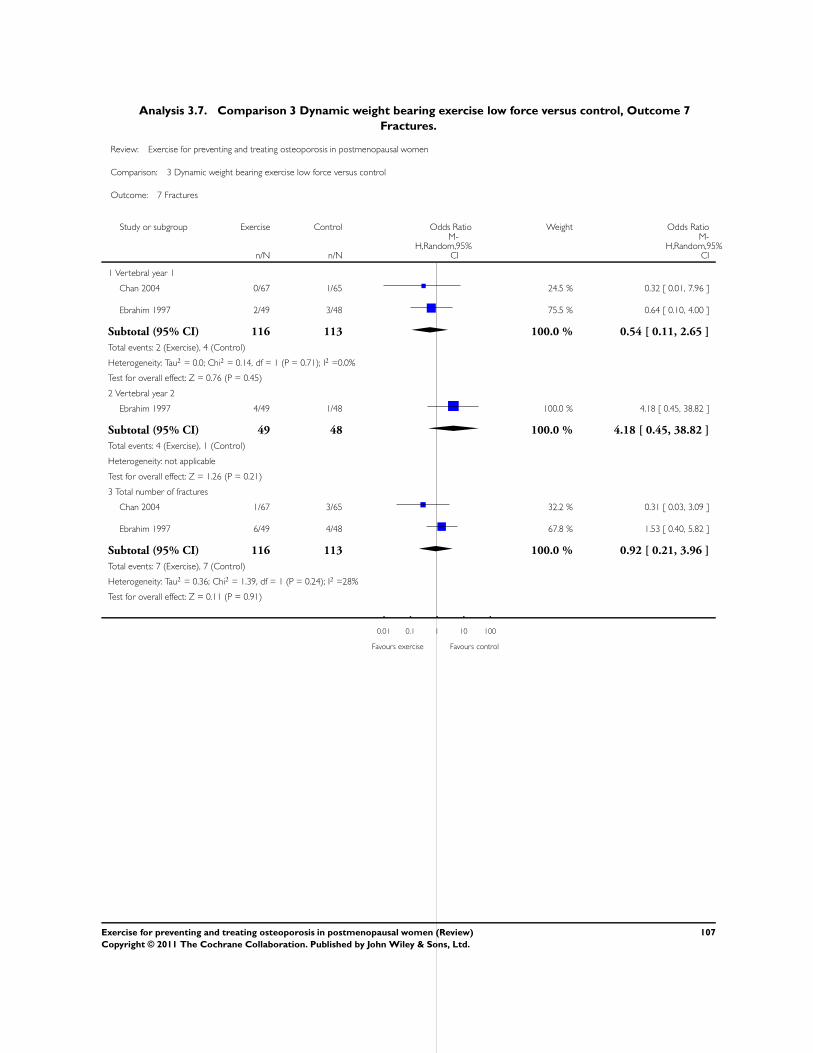
Analysis 3.7. Comparison 3 Dynamic weight bearing exercise low force versus control, Outcome 7
Fractures.
Review: Exercise for preventing and treating osteoporosis in postmenopausal women
Comparison: 3 Dynamic weight bearing exercise low force versus control
Outcome: 7 Fractures
Study or subgroup Exercise Control Odds Ratio Weight Odds Ratio
n/N n/N
M-H,Random,95%
CI
M-H,Random,95%
CI
1 Vertebral year 1
Chan 2004 0/67 1/65 24.5 % 0.32 [ 0.01, 7.96 ]
Ebrahim 1997 2/49 3/48 75.5 % 0.64 [ 0.10, 4.00 ]
Subtotal (95% CI) 116 113 100.0 % 0.54 [ 0.11, 2.65 ]
Total events: 2 (Exercise), 4 (Control)
Heterogeneity: Tau2 = 0.0; Chi2 = 0.14, df = 1 (P = 0.71); I2 =0.0%
Test for overall effect: Z = 0.76 (P = 0.45)
2 Vertebral year 2
Ebrahim 1997 4/49 1/48 100.0 % 4.18 [ 0.45, 38.82 ]
Subtotal (95% CI) 49 48 100.0 % 4.18 [ 0.45, 38.82 ]
Total events: 4 (Exercise), 1 (Control)
Heterogeneity: not applicable
Test for overall effect: Z = 1.26 (P = 0.21)
3 Total number of fractures
Chan 2004 1/67 3/65 32.2 % 0.31 [ 0.03, 3.09 ]
Ebrahim 1997 6/49 4/48 67.8 % 1.53 [ 0.40, 5.82 ]
Subtotal (95% CI) 116 113 100.0 % 0.92 [ 0.21, 3.96 ]
Total events: 7 (Exercise), 7 (Control)
Heterogeneity: Tau2 = 0.36; Chi2 = 1.39, df = 1 (P = 0.24); I2 =28%
Test for overall effect: Z = 0.11 (P = 0.91)
0.01 0.1 1 10 100
Favours exercise Favours control
107Exercise for preventing and treating osteoporosis in postmenopausal women (Review)
Copyright © 2011 The Cochrane Collaboration. Published by John Wiley & Sons, Ltd.
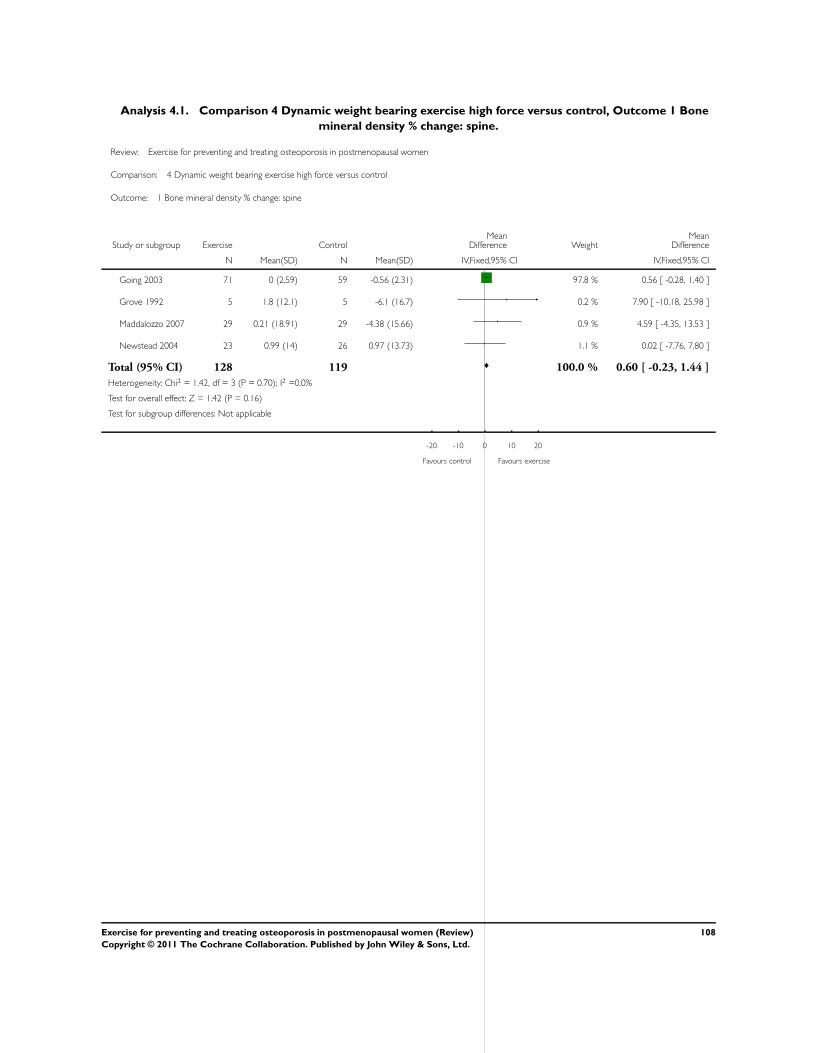
Analysis 4.1. Comparison 4 Dynamic weight bearing exercise high force versus control, Outcome 1 Bone
mineral density % change: spine.
Review: Exercise for preventing and treating osteoporosis in postmenopausal women
Comparison: 4 Dynamic weight bearing exercise high force versus control
Outcome: 1 Bone mineral density % change: spine
Study or subgroup Exercise ControlMean
Difference WeightMean
Difference
N Mean(SD) N Mean(SD) IV,Fixed,95% CI IV,Fixed,95% CI
Going 2003 71 0 (2.59) 59 -0.56 (2.31) 97.8 % 0.56 [ -0.28, 1.40 ]
Grove 1992 5 1.8 (12.1) 5 -6.1 (16.7) 0.2 % 7.90 [ -10.18, 25.98 ]
Maddalozzo 2007 29 0.21 (18.91) 29 -4.38 (15.66) 0.9 % 4.59 [ -4.35, 13.53 ]
Newstead 2004 23 0.99 (14) 26 0.97 (13.73) 1.1 % 0.02 [ -7.76, 7.80 ]
Total (95% CI) 128 119 100.0 % 0.60 [ -0.23, 1.44 ]
Heterogeneity: Chi2 = 1.42, df = 3 (P = 0.70); I2 =0.0%
Test for overall effect: Z = 1.42 (P = 0.16)
Test for subgroup differences: Not applicable
-20 -10 0 10 20
Favours control Favours exercise
108Exercise for preventing and treating osteoporosis in postmenopausal women (Review)
Copyright © 2011 The Cochrane Collaboration. Published by John Wiley & Sons, Ltd.
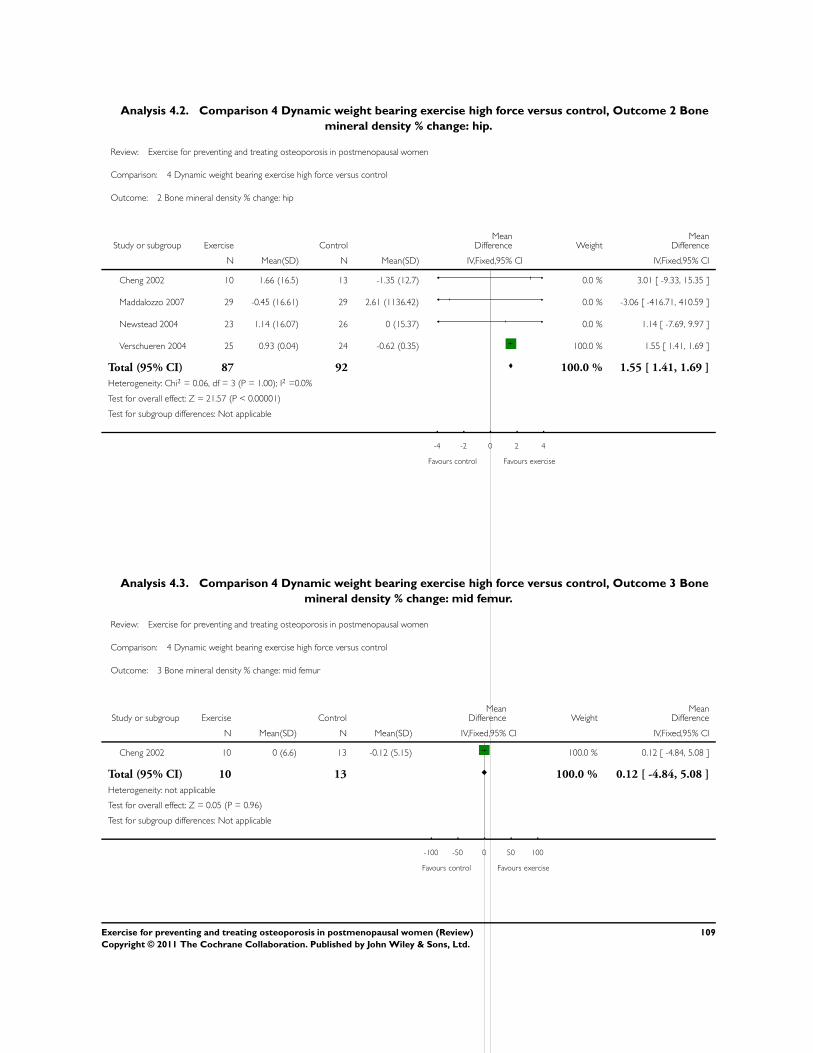
Analysis 4.2. Comparison 4 Dynamic weight bearing exercise high force versus control, Outcome 2 Bone
mineral density % change: hip.
Review: Exercise for preventing and treating osteoporosis in postmenopausal women
Comparison: 4 Dynamic weight bearing exercise high force versus control
Outcome: 2 Bone mineral density % change: hip
Study or subgroup Exercise ControlMean
Difference WeightMean
Difference
N Mean(SD) N Mean(SD) IV,Fixed,95% CI IV,Fixed,95% CI
Cheng 2002 10 1.66 (16.5) 13 -1.35 (12.7) 0.0 % 3.01 [ -9.33, 15.35 ]
Maddalozzo 2007 29 -0.45 (16.61) 29 2.61 (1136.42) 0.0 % -3.06 [ -416.71, 410.59 ]
Newstead 2004 23 1.14 (16.07) 26 0 (15.37) 0.0 % 1.14 [ -7.69, 9.97 ]
Verschueren 2004 25 0.93 (0.04) 24 -0.62 (0.35) 100.0 % 1.55 [ 1.41, 1.69 ]
Total (95% CI) 87 92 100.0 % 1.55 [ 1.41, 1.69 ]
Heterogeneity: Chi2 = 0.06, df = 3 (P = 1.00); I2 =0.0%
Test for overall effect: Z = 21.57 (P < 0.00001)
Test for subgroup differences: Not applicable
-4 -2 0 2 4
Favours control Favours exercise
Analysis 4.3. Comparison 4 Dynamic weight bearing exercise high force versus control, Outcome 3 Bone
mineral density % change: mid femur.
Review: Exercise for preventing and treating osteoporosis in postmenopausal women
Comparison: 4 Dynamic weight bearing exercise high force versus control
Outcome: 3 Bone mineral density % change: mid femur
Study or subgroup Exercise ControlMean
Difference WeightMean
Difference
N Mean(SD) N Mean(SD) IV,Fixed,95% CI IV,Fixed,95% CI
Cheng 2002 10 0 (6.6) 13 -0.12 (5.15) 100.0 % 0.12 [ -4.84, 5.08 ]
Total (95% CI) 10 13 100.0 % 0.12 [ -4.84, 5.08 ]
Heterogeneity: not applicable
Test for overall effect: Z = 0.05 (P = 0.96)
Test for subgroup differences: Not applicable
-100 -50 0 50 100
Favours control Favours exercise
109Exercise for preventing and treating osteoporosis in postmenopausal women (Review)
Copyright © 2011 The Cochrane Collaboration. Published by John Wiley & Sons, Ltd.
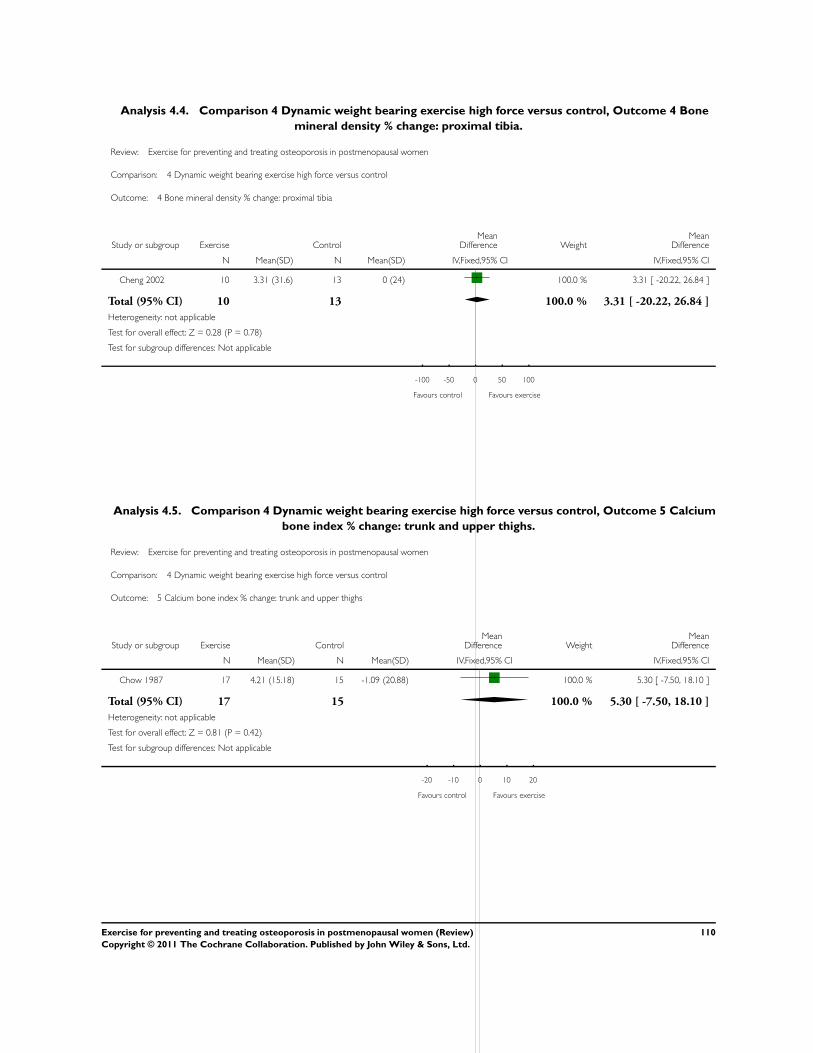
Analysis 4.4. Comparison 4 Dynamic weight bearing exercise high force versus control, Outcome 4 Bone
mineral density % change: proximal tibia.
Review: Exercise for preventing and treating osteoporosis in postmenopausal women
Comparison: 4 Dynamic weight bearing exercise high force versus control
Outcome: 4 Bone mineral density % change: proximal tibia
Study or subgroup Exercise ControlMean
Difference WeightMean
Difference
N Mean(SD) N Mean(SD) IV,Fixed,95% CI IV,Fixed,95% CI
Cheng 2002 10 3.31 (31.6) 13 0 (24) 100.0 % 3.31 [ -20.22, 26.84 ]
Total (95% CI) 10 13 100.0 % 3.31 [ -20.22, 26.84 ]
Heterogeneity: not applicable
Test for overall effect: Z = 0.28 (P = 0.78)
Test for subgroup differences: Not applicable
-100 -50 0 50 100
Favours control Favours exercise
Analysis 4.5. Comparison 4 Dynamic weight bearing exercise high force versus control, Outcome 5 Calcium
bone index % change: trunk and upper thighs.
Review: Exercise for preventing and treating osteoporosis in postmenopausal women
Comparison: 4 Dynamic weight bearing exercise high force versus control
Outcome: 5 Calcium bone index % change: trunk and upper thighs
Study or subgroup Exercise ControlMean
Difference WeightMean
Difference
N Mean(SD) N Mean(SD) IV,Fixed,95% CI IV,Fixed,95% CI
Chow 1987 17 4.21 (15.18) 15 -1.09 (20.88) 100.0 % 5.30 [ -7.50, 18.10 ]
Total (95% CI) 17 15 100.0 % 5.30 [ -7.50, 18.10 ]
Heterogeneity: not applicable
Test for overall effect: Z = 0.81 (P = 0.42)
Test for subgroup differences: Not applicable
-20 -10 0 10 20
Favours control Favours exercise
110Exercise for preventing and treating osteoporosis in postmenopausal women (Review)
Copyright © 2011 The Cochrane Collaboration. Published by John Wiley & Sons, Ltd.
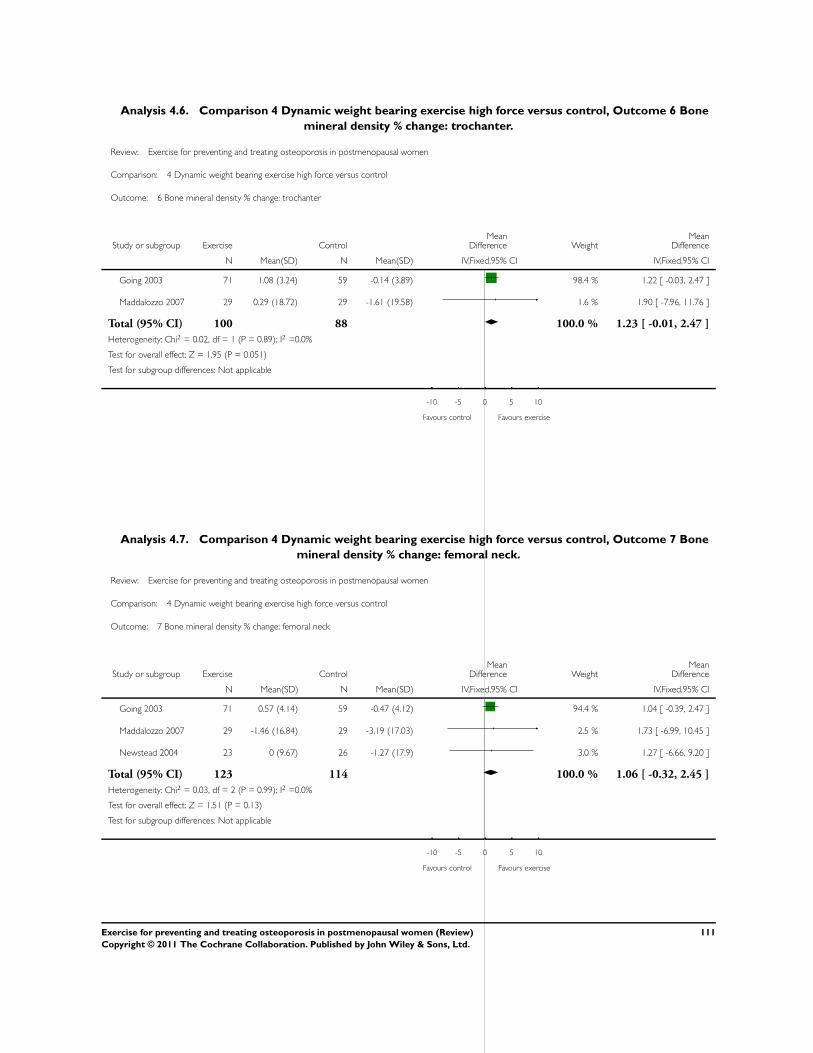
Analysis 4.6. Comparison 4 Dynamic weight bearing exercise high force versus control, Outcome 6 Bone
mineral density % change: trochanter.
Review: Exercise for preventing and treating osteoporosis in postmenopausal women
Comparison: 4 Dynamic weight bearing exercise high force versus control
Outcome: 6 Bone mineral density % change: trochanter
Study or subgroup Exercise ControlMean
Difference WeightMean
Difference
N Mean(SD) N Mean(SD) IV,Fixed,95% CI IV,Fixed,95% CI
Going 2003 71 1.08 (3.24) 59 -0.14 (3.89) 98.4 % 1.22 [ -0.03, 2.47 ]
Maddalozzo 2007 29 0.29 (18.72) 29 -1.61 (19.58) 1.6 % 1.90 [ -7.96, 11.76 ]
Total (95% CI) 100 88 100.0 % 1.23 [ -0.01, 2.47 ]
Heterogeneity: Chi2 = 0.02, df = 1 (P = 0.89); I2 =0.0%
Test for overall effect: Z = 1.95 (P = 0.051)
Test for subgroup differences: Not applicable
-10 -5 0 5 10
Favours control Favours exercise
Analysis 4.7. Comparison 4 Dynamic weight bearing exercise high force versus control, Outcome 7 Bone
mineral density % change: femoral neck.
Review: Exercise for preventing and treating osteoporosis in postmenopausal women
Comparison: 4 Dynamic weight bearing exercise high force versus control
Outcome: 7 Bone mineral density % change: femoral neck
Study or subgroup Exercise ControlMean
Difference WeightMean
Difference
N Mean(SD) N Mean(SD) IV,Fixed,95% CI IV,Fixed,95% CI
Going 2003 71 0.57 (4.14) 59 -0.47 (4.12) 94.4 % 1.04 [ -0.39, 2.47 ]
Maddalozzo 2007 29 -1.46 (16.84) 29 -3.19 (17.03) 2.5 % 1.73 [ -6.99, 10.45 ]
Newstead 2004 23 0 (9.67) 26 -1.27 (17.9) 3.0 % 1.27 [ -6.66, 9.20 ]
Total (95% CI) 123 114 100.0 % 1.06 [ -0.32, 2.45 ]
Heterogeneity: Chi2 = 0.03, df = 2 (P = 0.99); I2 =0.0%
Test for overall effect: Z = 1.51 (P = 0.13)
Test for subgroup differences: Not applicable
-10 -5 0 5 10
Favours control Favours exercise
111Exercise for preventing and treating osteoporosis in postmenopausal women (Review)
Copyright © 2011 The Cochrane Collaboration. Published by John Wiley & Sons, Ltd.
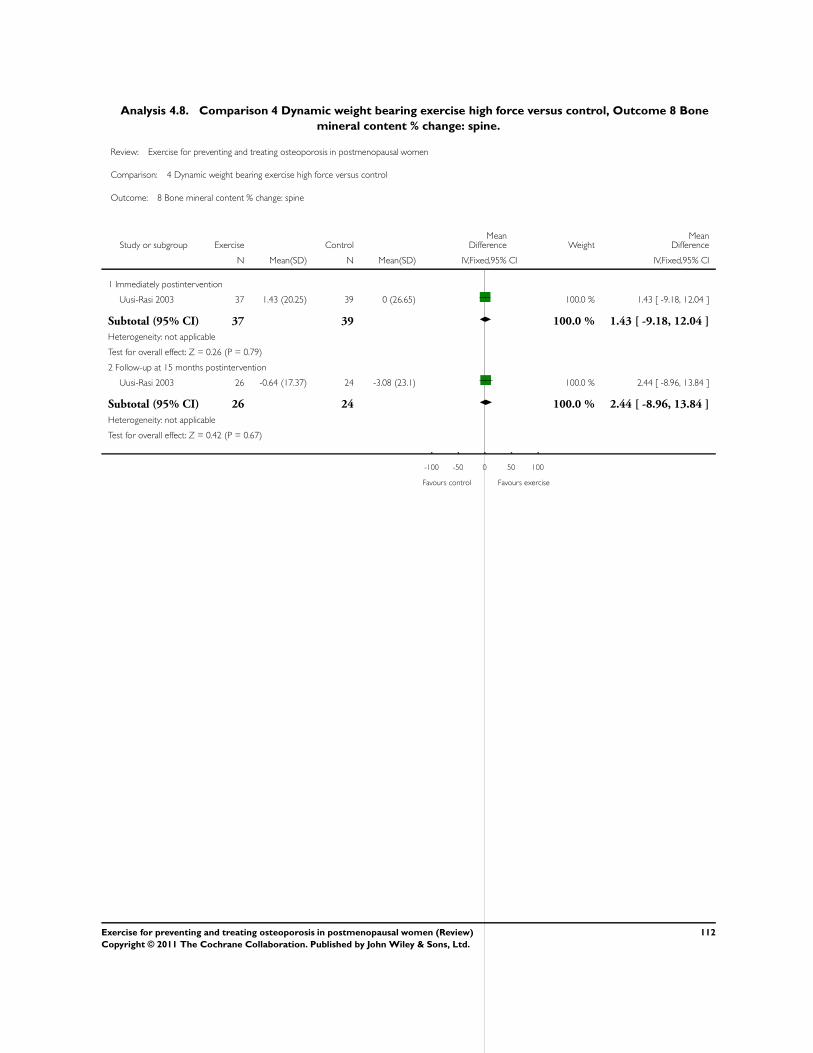
Analysis 4.8. Comparison 4 Dynamic weight bearing exercise high force versus control, Outcome 8 Bone
mineral content % change: spine.
Review: Exercise for preventing and treating osteoporosis in postmenopausal women
Comparison: 4 Dynamic weight bearing exercise high force versus control
Outcome: 8 Bone mineral content % change: spine
Study or subgroup Exercise ControlMean
Difference WeightMean
Difference
N Mean(SD) N Mean(SD) IV,Fixed,95% CI IV,Fixed,95% CI
1 Immediately postintervention
Uusi-Rasi 2003 37 1.43 (20.25) 39 0 (26.65) 100.0 % 1.43 [ -9.18, 12.04 ]
Subtotal (95% CI) 37 39 100.0 % 1.43 [ -9.18, 12.04 ]
Heterogeneity: not applicable
Test for overall effect: Z = 0.26 (P = 0.79)
2 Follow-up at 15 months postintervention
Uusi-Rasi 2003 26 -0.64 (17.37) 24 -3.08 (23.1) 100.0 % 2.44 [ -8.96, 13.84 ]
Subtotal (95% CI) 26 24 100.0 % 2.44 [ -8.96, 13.84 ]
Heterogeneity: not applicable
Test for overall effect: Z = 0.42 (P = 0.67)
-100 -50 0 50 100
Favours control Favours exercise
112Exercise for preventing and treating osteoporosis in postmenopausal women (Review)
Copyright © 2011 The Cochrane Collaboration. Published by John Wiley & Sons, Ltd.
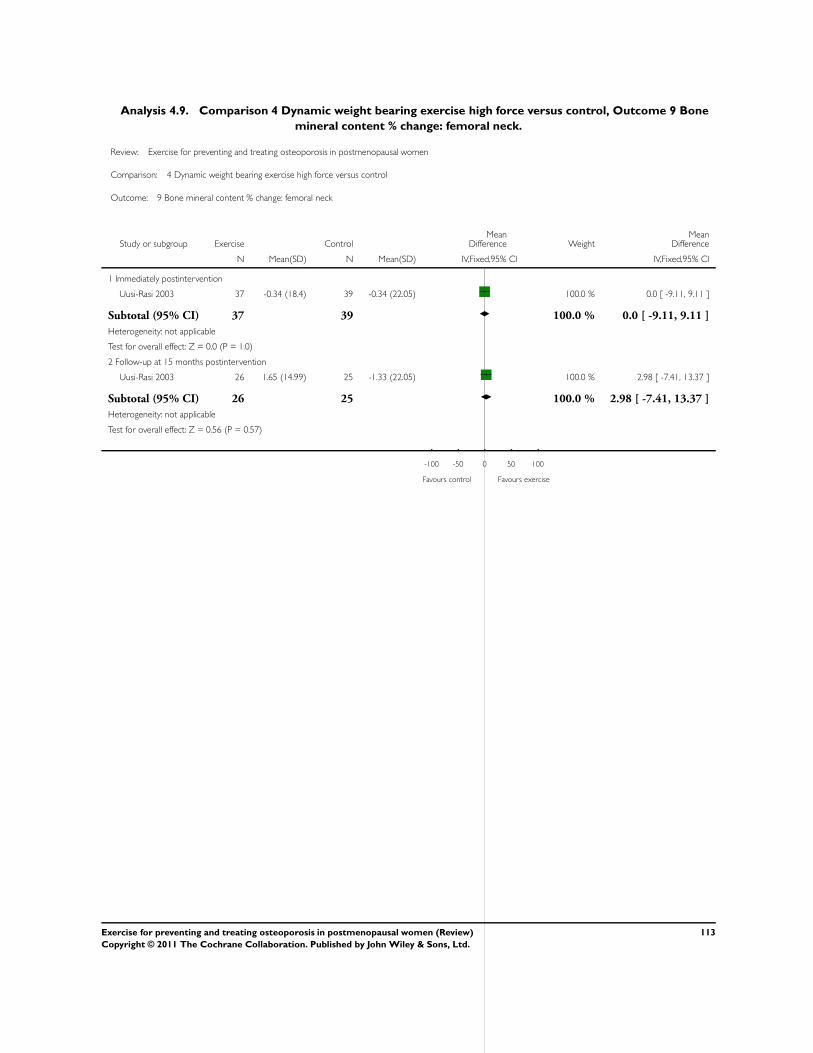
Analysis 4.9. Comparison 4 Dynamic weight bearing exercise high force versus control, Outcome 9 Bone
mineral content % change: femoral neck.
Review: Exercise for preventing and treating osteoporosis in postmenopausal women
Comparison: 4 Dynamic weight bearing exercise high force versus control
Outcome: 9 Bone mineral content % change: femoral neck
Study or subgroup Exercise ControlMean
Difference WeightMean
Difference
N Mean(SD) N Mean(SD) IV,Fixed,95% CI IV,Fixed,95% CI
1 Immediately postintervention
Uusi-Rasi 2003 37 -0.34 (18.4) 39 -0.34 (22.05) 100.0 % 0.0 [ -9.11, 9.11 ]
Subtotal (95% CI) 37 39 100.0 % 0.0 [ -9.11, 9.11 ]
Heterogeneity: not applicable
Test for overall effect: Z = 0.0 (P = 1.0)
2 Follow-up at 15 months postintervention
Uusi-Rasi 2003 26 1.65 (14.99) 25 -1.33 (22.05) 100.0 % 2.98 [ -7.41, 13.37 ]
Subtotal (95% CI) 26 25 100.0 % 2.98 [ -7.41, 13.37 ]
Heterogeneity: not applicable
Test for overall effect: Z = 0.56 (P = 0.57)
-100 -50 0 50 100
Favours control Favours exercise
113Exercise for preventing and treating osteoporosis in postmenopausal women (Review)
Copyright © 2011 The Cochrane Collaboration. Published by John Wiley & Sons, Ltd.
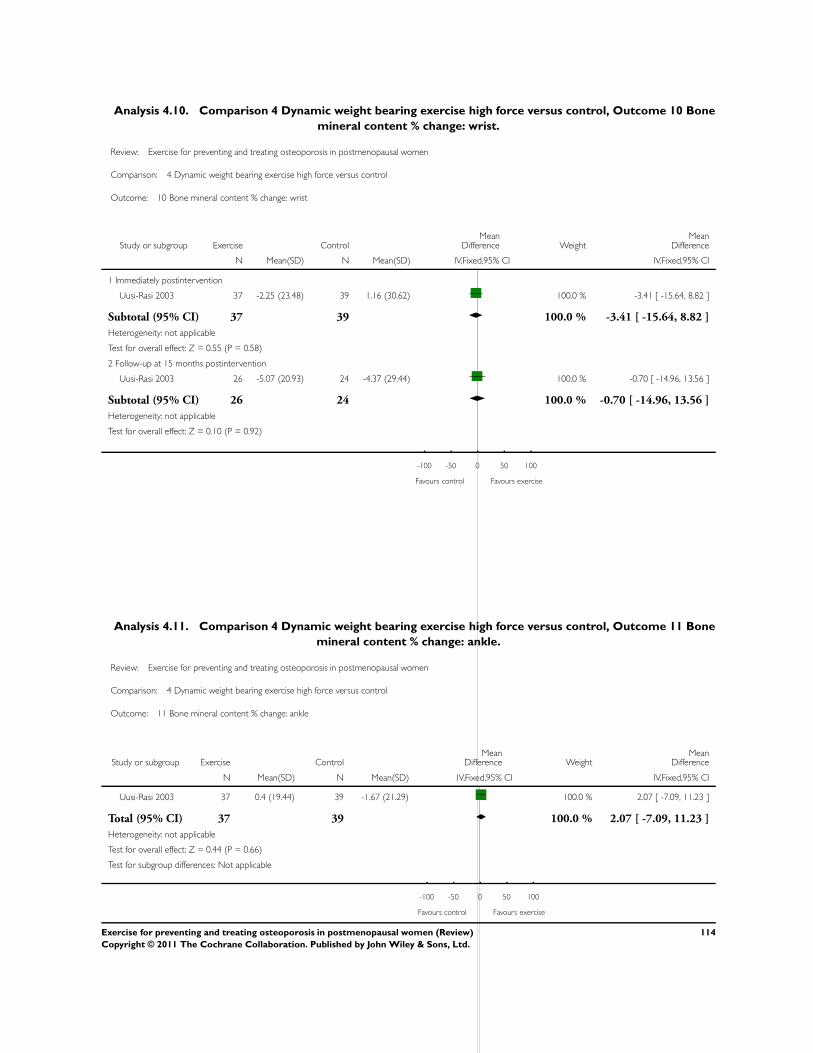
Analysis 4.10. Comparison 4 Dynamic weight bearing exercise high force versus control, Outcome 10 Bone
mineral content % change: wrist.
Review: Exercise for preventing and treating osteoporosis in postmenopausal women
Comparison: 4 Dynamic weight bearing exercise high force versus control
Outcome: 10 Bone mineral content % change: wrist
Study or subgroup Exercise ControlMean
Difference WeightMean
Difference
N Mean(SD) N Mean(SD) IV,Fixed,95% CI IV,Fixed,95% CI
1 Immediately postintervention
Uusi-Rasi 2003 37 -2.25 (23.48) 39 1.16 (30.62) 100.0 % -3.41 [ -15.64, 8.82 ]
Subtotal (95% CI) 37 39 100.0 % -3.41 [ -15.64, 8.82 ]
Heterogeneity: not applicable
Test for overall effect: Z = 0.55 (P = 0.58)
2 Follow-up at 15 months postintervention
Uusi-Rasi 2003 26 -5.07 (20.93) 24 -4.37 (29.44) 100.0 % -0.70 [ -14.96, 13.56 ]
Subtotal (95% CI) 26 24 100.0 % -0.70 [ -14.96, 13.56 ]
Heterogeneity: not applicable
Test for overall effect: Z = 0.10 (P = 0.92)
-100 -50 0 50 100
Favours control Favours exercise
Analysis 4.11. Comparison 4 Dynamic weight bearing exercise high force versus control, Outcome 11 Bone
mineral content % change: ankle.
Review: Exercise for preventing and treating osteoporosis in postmenopausal women
Comparison: 4 Dynamic weight bearing exercise high force versus control
Outcome: 11 Bone mineral content % change: ankle
Study or subgroup Exercise ControlMean
Difference WeightMean
Difference
N Mean(SD) N Mean(SD) IV,Fixed,95% CI IV,Fixed,95% CI
Uusi-Rasi 2003 37 0.4 (19.44) 39 -1.67 (21.29) 100.0 % 2.07 [ -7.09, 11.23 ]
Total (95% CI) 37 39 100.0 % 2.07 [ -7.09, 11.23 ]
Heterogeneity: not applicable
Test for overall effect: Z = 0.44 (P = 0.66)
Test for subgroup differences: Not applicable
-100 -50 0 50 100
Favours control Favours exercise
114Exercise for preventing and treating osteoporosis in postmenopausal women (Review)
Copyright © 2011 The Cochrane Collaboration. Published by John Wiley & Sons, Ltd.

Analysis 4.12. Comparison 4 Dynamic weight bearing exercise high force versus control, Outcome 12 Bone
mineral content % change: tibia.
Review: Exercise for preventing and treating osteoporosis in postmenopausal women
Comparison: 4 Dynamic weight bearing exercise high force versus control
Outcome: 12 Bone mineral content % change: tibia
Study or subgroup Exercise ControlMean
Difference WeightMean
Difference
N Mean(SD) N Mean(SD) IV,Fixed,95% CI IV,Fixed,95% CI
Uusi-Rasi 2003 37 -0.13 (16.09) 39 -0.99 (15.35) 100.0 % 0.86 [ -6.22, 7.94 ]
Total (95% CI) 37 39 100.0 % 0.86 [ -6.22, 7.94 ]
Heterogeneity: not applicable
Test for overall effect: Z = 0.24 (P = 0.81)
Test for subgroup differences: Not applicable
-100 -50 0 50 100
Favours control Favours exercise
Analysis 4.13. Comparison 4 Dynamic weight bearing exercise high force versus control, Outcome 13 Bone
mineral density % change: total body.
Review: Exercise for preventing and treating osteoporosis in postmenopausal women
Comparison: 4 Dynamic weight bearing exercise high force versus control
Outcome: 13 Bone mineral density % change: total body
Study or subgroup Exercise ControlMean
Difference WeightMean
Difference
N Mean(SD) N Mean(SD) IV,Fixed,95% CI IV,Fixed,95% CI
Going 2003 71 0 (1.17) 59 -0.37 (1.01) 99.8 % 0.37 [ 0.00, 0.74 ]
Newstead 2004 23 1.14 (16.07) 26 0 (15.37) 0.2 % 1.14 [ -7.69, 9.97 ]
Total (95% CI) 94 85 100.0 % 0.37 [ 0.00, 0.75 ]
Heterogeneity: Chi2 = 0.03, df = 1 (P = 0.86); I2 =0.0%
Test for overall effect: Z = 1.94 (P = 0.052)
Test for subgroup differences: Not applicable
-10 -5 0 5 10
Favours control Favours exercise
115Exercise for preventing and treating osteoporosis in postmenopausal women (Review)
Copyright © 2011 The Cochrane Collaboration. Published by John Wiley & Sons, Ltd.
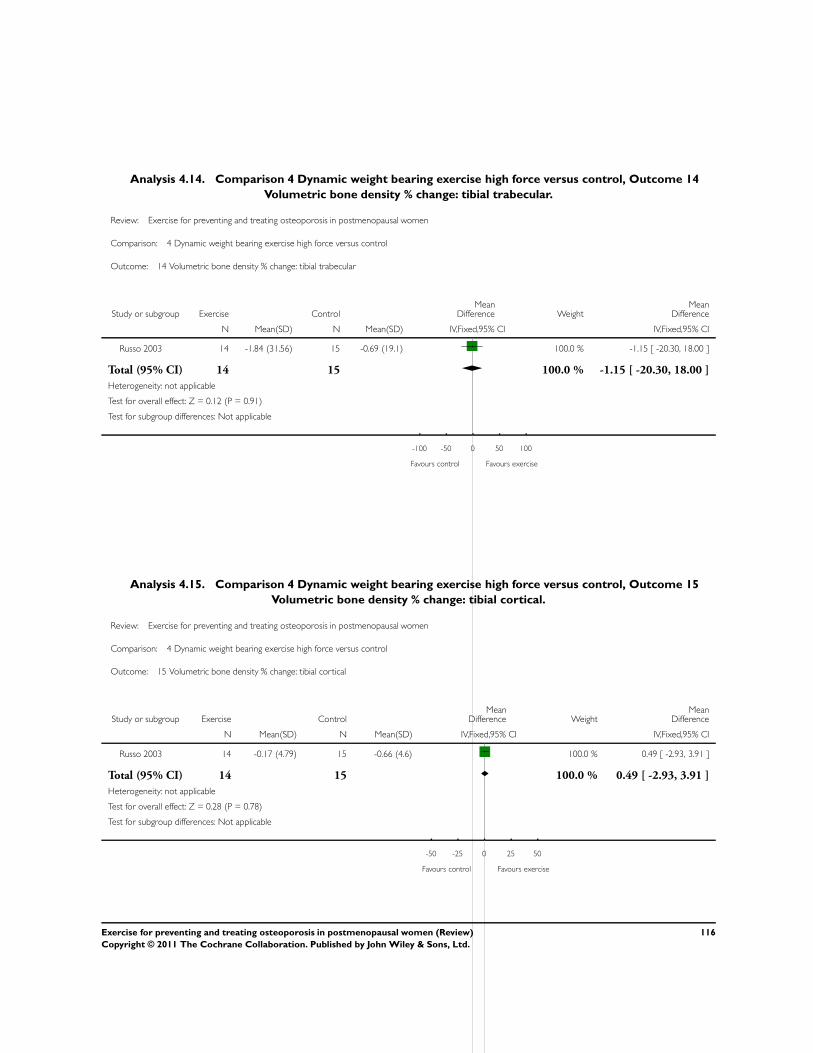
Analysis 4.14. Comparison 4 Dynamic weight bearing exercise high force versus control, Outcome 14
Volumetric bone density % change: tibial trabecular.
Review: Exercise for preventing and treating osteoporosis in postmenopausal women
Comparison: 4 Dynamic weight bearing exercise high force versus control
Outcome: 14 Volumetric bone density % change: tibial trabecular
Study or subgroup Exercise ControlMean
Difference WeightMean
Difference
N Mean(SD) N Mean(SD) IV,Fixed,95% CI IV,Fixed,95% CI
Russo 2003 14 -1.84 (31.56) 15 -0.69 (19.1) 100.0 % -1.15 [ -20.30, 18.00 ]
Total (95% CI) 14 15 100.0 % -1.15 [ -20.30, 18.00 ]
Heterogeneity: not applicable
Test for overall effect: Z = 0.12 (P = 0.91)
Test for subgroup differences: Not applicable
-100 -50 0 50 100
Favours control Favours exercise
Analysis 4.15. Comparison 4 Dynamic weight bearing exercise high force versus control, Outcome 15
Volumetric bone density % change: tibial cortical.
Review: Exercise for preventing and treating osteoporosis in postmenopausal women
Comparison: 4 Dynamic weight bearing exercise high force versus control
Outcome: 15 Volumetric bone density % change: tibial cortical
Study or subgroup Exercise ControlMean
Difference WeightMean
Difference
N Mean(SD) N Mean(SD) IV,Fixed,95% CI IV,Fixed,95% CI
Russo 2003 14 -0.17 (4.79) 15 -0.66 (4.6) 100.0 % 0.49 [ -2.93, 3.91 ]
Total (95% CI) 14 15 100.0 % 0.49 [ -2.93, 3.91 ]
Heterogeneity: not applicable
Test for overall effect: Z = 0.28 (P = 0.78)
Test for subgroup differences: Not applicable
-50 -25 0 25 50
Favours control Favours exercise
116Exercise for preventing and treating osteoporosis in postmenopausal women (Review)
Copyright © 2011 The Cochrane Collaboration. Published by John Wiley & Sons, Ltd.
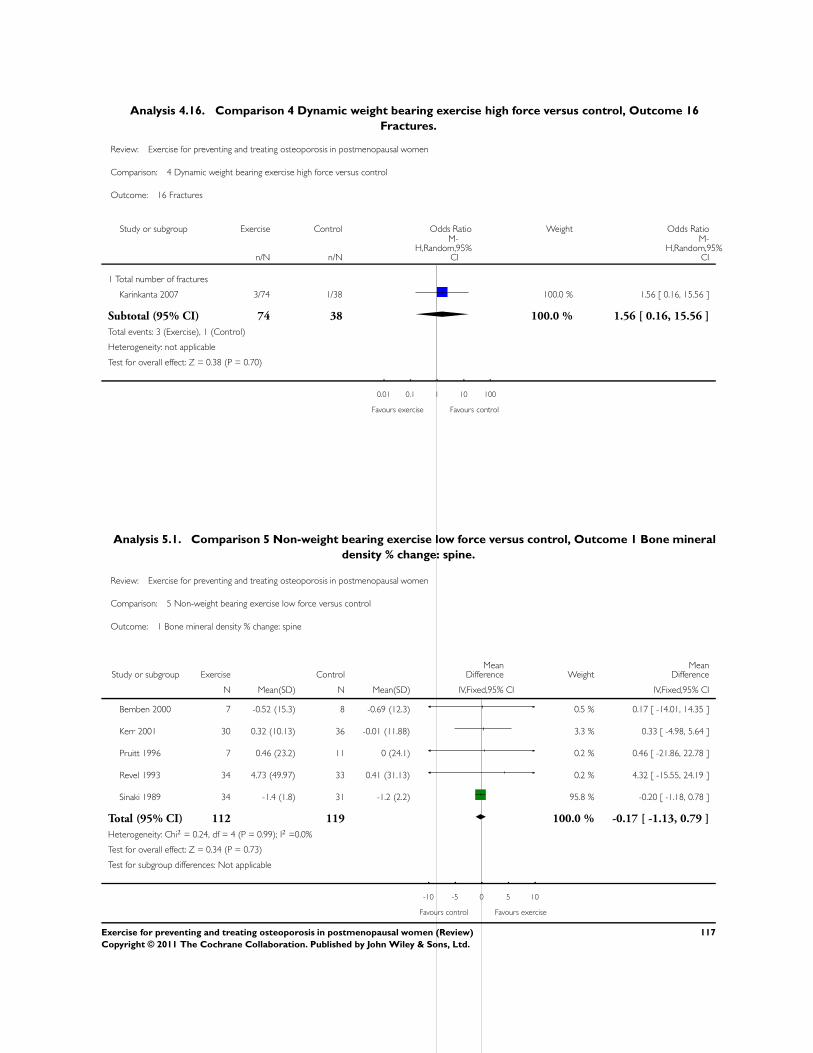
Analysis 4.16. Comparison 4 Dynamic weight bearing exercise high force versus control, Outcome 16
Fractures.
Review: Exercise for preventing and treating osteoporosis in postmenopausal women
Comparison: 4 Dynamic weight bearing exercise high force versus control
Outcome: 16 Fractures
Study or subgroup Exercise Control Odds Ratio Weight Odds Ratio
n/N n/N
M-H,Random,95%
CI
M-H,Random,95%
CI
1 Total number of fractures
Karinkanta 2007 3/74 1/38 100.0 % 1.56 [ 0.16, 15.56 ]
Subtotal (95% CI) 74 38 100.0 % 1.56 [ 0.16, 15.56 ]
Total events: 3 (Exercise), 1 (Control)
Heterogeneity: not applicable
Test for overall effect: Z = 0.38 (P = 0.70)
0.01 0.1 1 10 100
Favours exercise Favours control
Analysis 5.1. Comparison 5 Non-weight bearing exercise low force versus control, Outcome 1 Bone mineral
density % change: spine.
Review: Exercise for preventing and treating osteoporosis in postmenopausal women
Comparison: 5 Non-weight bearing exercise low force versus control
Outcome: 1 Bone mineral density % change: spine
Study or subgroup Exercise ControlMean
Difference WeightMean
Difference
N Mean(SD) N Mean(SD) IV,Fixed,95% CI IV,Fixed,95% CI
Bemben 2000 7 -0.52 (15.3) 8 -0.69 (12.3) 0.5 % 0.17 [ -14.01, 14.35 ]
Kerr 2001 30 0.32 (10.13) 36 -0.01 (11.88) 3.3 % 0.33 [ -4.98, 5.64 ]
Pruitt 1996 7 0.46 (23.2) 11 0 (24.1) 0.2 % 0.46 [ -21.86, 22.78 ]
Revel 1993 34 4.73 (49.97) 33 0.41 (31.13) 0.2 % 4.32 [ -15.55, 24.19 ]
Sinaki 1989 34 -1.4 (1.8) 31 -1.2 (2.2) 95.8 % -0.20 [ -1.18, 0.78 ]
Total (95% CI) 112 119 100.0 % -0.17 [ -1.13, 0.79 ]
Heterogeneity: Chi2 = 0.24, df = 4 (P = 0.99); I2 =0.0%
Test for overall effect: Z = 0.34 (P = 0.73)
Test for subgroup differences: Not applicable
-10 -5 0 5 10
Favours control Favours exercise
117Exercise for preventing and treating osteoporosis in postmenopausal women (Review)
Copyright © 2011 The Cochrane Collaboration. Published by John Wiley & Sons, Ltd.
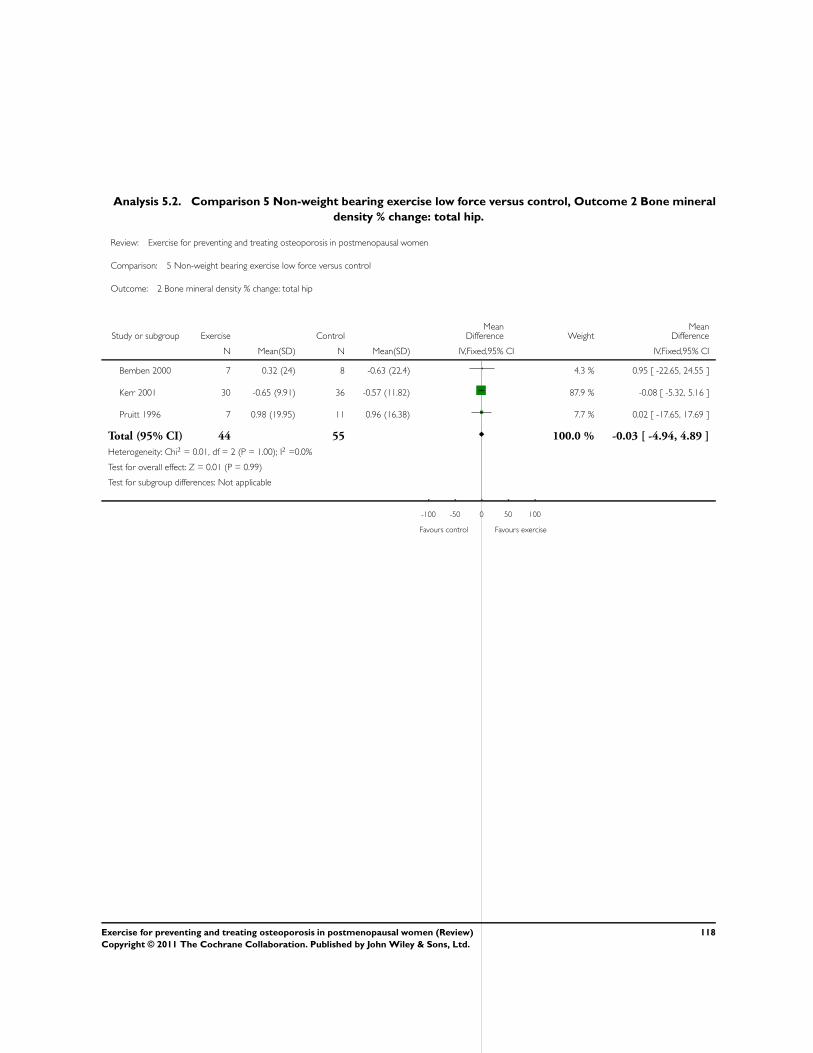
Analysis 5.2. Comparison 5 Non-weight bearing exercise low force versus control, Outcome 2 Bone mineral
density % change: total hip.
Review: Exercise for preventing and treating osteoporosis in postmenopausal women
Comparison: 5 Non-weight bearing exercise low force versus control
Outcome: 2 Bone mineral density % change: total hip
Study or subgroup Exercise ControlMean
Difference WeightMean
Difference
N Mean(SD) N Mean(SD) IV,Fixed,95% CI IV,Fixed,95% CI
Bemben 2000 7 0.32 (24) 8 -0.63 (22.4) 4.3 % 0.95 [ -22.65, 24.55 ]
Kerr 2001 30 -0.65 (9.91) 36 -0.57 (11.82) 87.9 % -0.08 [ -5.32, 5.16 ]
Pruitt 1996 7 0.98 (19.95) 11 0.96 (16.38) 7.7 % 0.02 [ -17.65, 17.69 ]
Total (95% CI) 44 55 100.0 % -0.03 [ -4.94, 4.89 ]
Heterogeneity: Chi2 = 0.01, df = 2 (P = 1.00); I2 =0.0%
Test for overall effect: Z = 0.01 (P = 0.99)
Test for subgroup differences: Not applicable
-100 -50 0 50 100
Favours control Favours exercise
118Exercise for preventing and treating osteoporosis in postmenopausal women (Review)
Copyright © 2011 The Cochrane Collaboration. Published by John Wiley & Sons, Ltd.
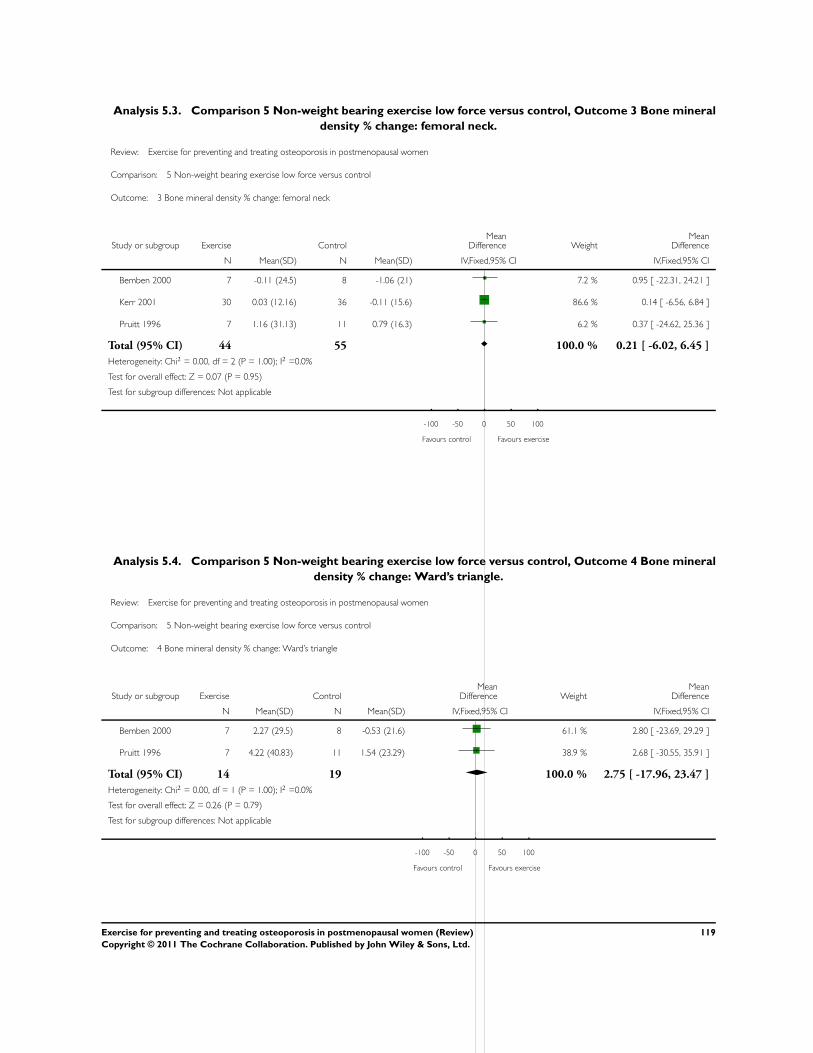
Analysis 5.3. Comparison 5 Non-weight bearing exercise low force versus control, Outcome 3 Bone mineral
density % change: femoral neck.
Review: Exercise for preventing and treating osteoporosis in postmenopausal women
Comparison: 5 Non-weight bearing exercise low force versus control
Outcome: 3 Bone mineral density % change: femoral neck
Study or subgroup Exercise ControlMean
Difference WeightMean
Difference
N Mean(SD) N Mean(SD) IV,Fixed,95% CI IV,Fixed,95% CI
Bemben 2000 7 -0.11 (24.5) 8 -1.06 (21) 7.2 % 0.95 [ -22.31, 24.21 ]
Kerr 2001 30 0.03 (12.16) 36 -0.11 (15.6) 86.6 % 0.14 [ -6.56, 6.84 ]
Pruitt 1996 7 1.16 (31.13) 11 0.79 (16.3) 6.2 % 0.37 [ -24.62, 25.36 ]
Total (95% CI) 44 55 100.0 % 0.21 [ -6.02, 6.45 ]
Heterogeneity: Chi2 = 0.00, df = 2 (P = 1.00); I2 =0.0%
Test for overall effect: Z = 0.07 (P = 0.95)
Test for subgroup differences: Not applicable
-100 -50 0 50 100
Favours control Favours exercise
Analysis 5.4. Comparison 5 Non-weight bearing exercise low force versus control, Outcome 4 Bone mineral
density % change: Ward’s triangle.
Review: Exercise for preventing and treating osteoporosis in postmenopausal women
Comparison: 5 Non-weight bearing exercise low force versus control
Outcome: 4 Bone mineral density % change: Ward’s triangle
Study or subgroup Exercise ControlMean
Difference WeightMean
Difference
N Mean(SD) N Mean(SD) IV,Fixed,95% CI IV,Fixed,95% CI
Bemben 2000 7 2.27 (29.5) 8 -0.53 (21.6) 61.1 % 2.80 [ -23.69, 29.29 ]
Pruitt 1996 7 4.22 (40.83) 11 1.54 (23.29) 38.9 % 2.68 [ -30.55, 35.91 ]
Total (95% CI) 14 19 100.0 % 2.75 [ -17.96, 23.47 ]
Heterogeneity: Chi2 = 0.00, df = 1 (P = 1.00); I2 =0.0%
Test for overall effect: Z = 0.26 (P = 0.79)
Test for subgroup differences: Not applicable
-100 -50 0 50 100
Favours control Favours exercise
119Exercise for preventing and treating osteoporosis in postmenopausal women (Review)
Copyright © 2011 The Cochrane Collaboration. Published by John Wiley & Sons, Ltd.
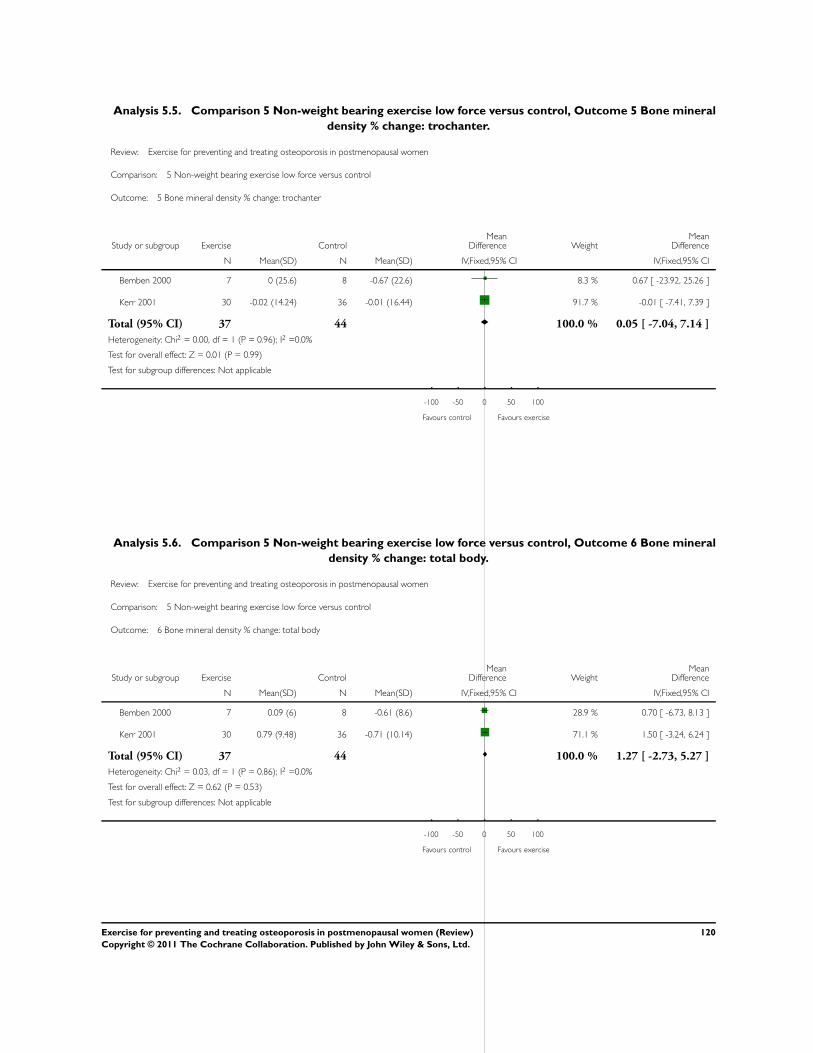
Analysis 5.5. Comparison 5 Non-weight bearing exercise low force versus control, Outcome 5 Bone mineral
density % change: trochanter.
Review: Exercise for preventing and treating osteoporosis in postmenopausal women
Comparison: 5 Non-weight bearing exercise low force versus control
Outcome: 5 Bone mineral density % change: trochanter
Study or subgroup Exercise ControlMean
Difference WeightMean
Difference
N Mean(SD) N Mean(SD) IV,Fixed,95% CI IV,Fixed,95% CI
Bemben 2000 7 0 (25.6) 8 -0.67 (22.6) 8.3 % 0.67 [ -23.92, 25.26 ]
Kerr 2001 30 -0.02 (14.24) 36 -0.01 (16.44) 91.7 % -0.01 [ -7.41, 7.39 ]
Total (95% CI) 37 44 100.0 % 0.05 [ -7.04, 7.14 ]
Heterogeneity: Chi2 = 0.00, df = 1 (P = 0.96); I2 =0.0%
Test for overall effect: Z = 0.01 (P = 0.99)
Test for subgroup differences: Not applicable
-100 -50 0 50 100
Favours control Favours exercise
Analysis 5.6. Comparison 5 Non-weight bearing exercise low force versus control, Outcome 6 Bone mineral
density % change: total body.
Review: Exercise for preventing and treating osteoporosis in postmenopausal women
Comparison: 5 Non-weight bearing exercise low force versus control
Outcome: 6 Bone mineral density % change: total body
Study or subgroup Exercise ControlMean
Difference WeightMean
Difference
N Mean(SD) N Mean(SD) IV,Fixed,95% CI IV,Fixed,95% CI
Bemben 2000 7 0.09 (6) 8 -0.61 (8.6) 28.9 % 0.70 [ -6.73, 8.13 ]
Kerr 2001 30 0.79 (9.48) 36 -0.71 (10.14) 71.1 % 1.50 [ -3.24, 6.24 ]
Total (95% CI) 37 44 100.0 % 1.27 [ -2.73, 5.27 ]
Heterogeneity: Chi2 = 0.03, df = 1 (P = 0.86); I2 =0.0%
Test for overall effect: Z = 0.62 (P = 0.53)
Test for subgroup differences: Not applicable
-100 -50 0 50 100
Favours control Favours exercise
120Exercise for preventing and treating osteoporosis in postmenopausal women (Review)
Copyright © 2011 The Cochrane Collaboration. Published by John Wiley & Sons, Ltd.
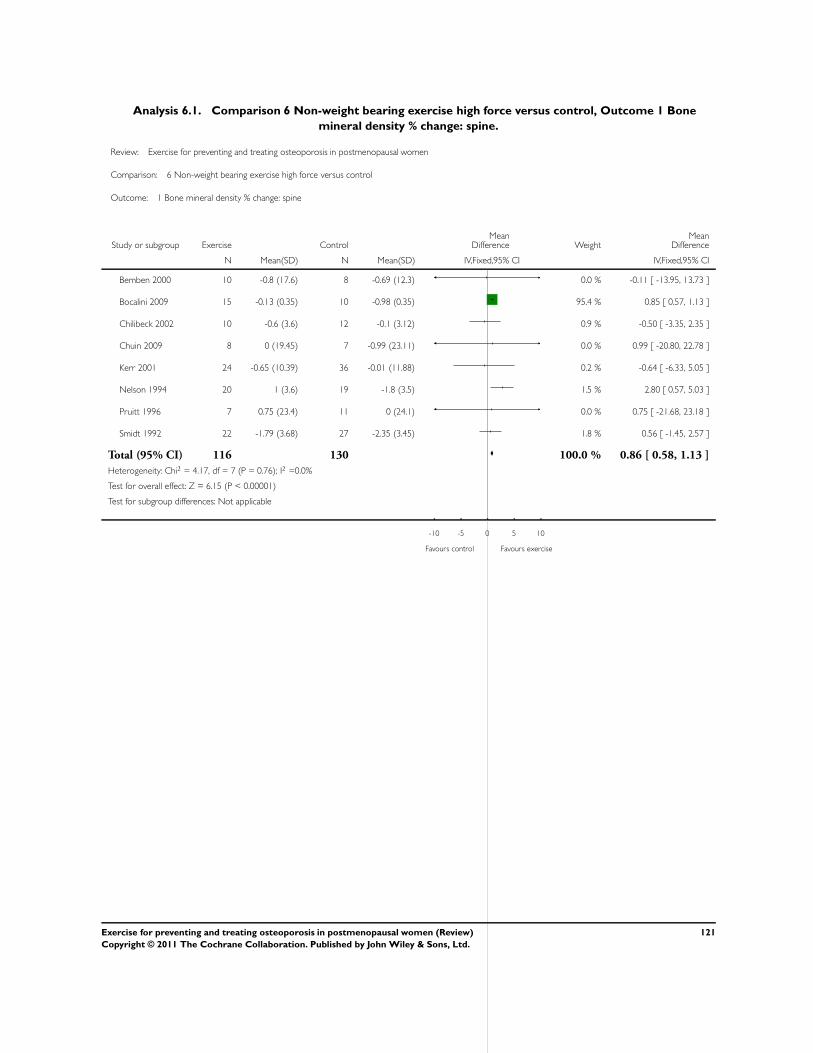
Analysis 6.1. Comparison 6 Non-weight bearing exercise high force versus control, Outcome 1 Bone
mineral density % change: spine.
Review: Exercise for preventing and treating osteoporosis in postmenopausal women
Comparison: 6 Non-weight bearing exercise high force versus control
Outcome: 1 Bone mineral density % change: spine
Study or subgroup Exercise ControlMean
Difference WeightMean
Difference
N Mean(SD) N Mean(SD) IV,Fixed,95% CI IV,Fixed,95% CI
Bemben 2000 10 -0.8 (17.6) 8 -0.69 (12.3) 0.0 % -0.11 [ -13.95, 13.73 ]
Bocalini 2009 15 -0.13 (0.35) 10 -0.98 (0.35) 95.4 % 0.85 [ 0.57, 1.13 ]
Chilibeck 2002 10 -0.6 (3.6) 12 -0.1 (3.12) 0.9 % -0.50 [ -3.35, 2.35 ]
Chuin 2009 8 0 (19.45) 7 -0.99 (23.11) 0.0 % 0.99 [ -20.80, 22.78 ]
Kerr 2001 24 -0.65 (10.39) 36 -0.01 (11.88) 0.2 % -0.64 [ -6.33, 5.05 ]
Nelson 1994 20 1 (3.6) 19 -1.8 (3.5) 1.5 % 2.80 [ 0.57, 5.03 ]
Pruitt 1996 7 0.75 (23.4) 11 0 (24.1) 0.0 % 0.75 [ -21.68, 23.18 ]
Smidt 1992 22 -1.79 (3.68) 27 -2.35 (3.45) 1.8 % 0.56 [ -1.45, 2.57 ]
Total (95% CI) 116 130 100.0 % 0.86 [ 0.58, 1.13 ]
Heterogeneity: Chi2 = 4.17, df = 7 (P = 0.76); I2 =0.0%
Test for overall effect: Z = 6.15 (P < 0.00001)
Test for subgroup differences: Not applicable
-10 -5 0 5 10
Favours control Favours exercise
121Exercise for preventing and treating osteoporosis in postmenopausal women (Review)
Copyright © 2011 The Cochrane Collaboration. Published by John Wiley & Sons, Ltd.
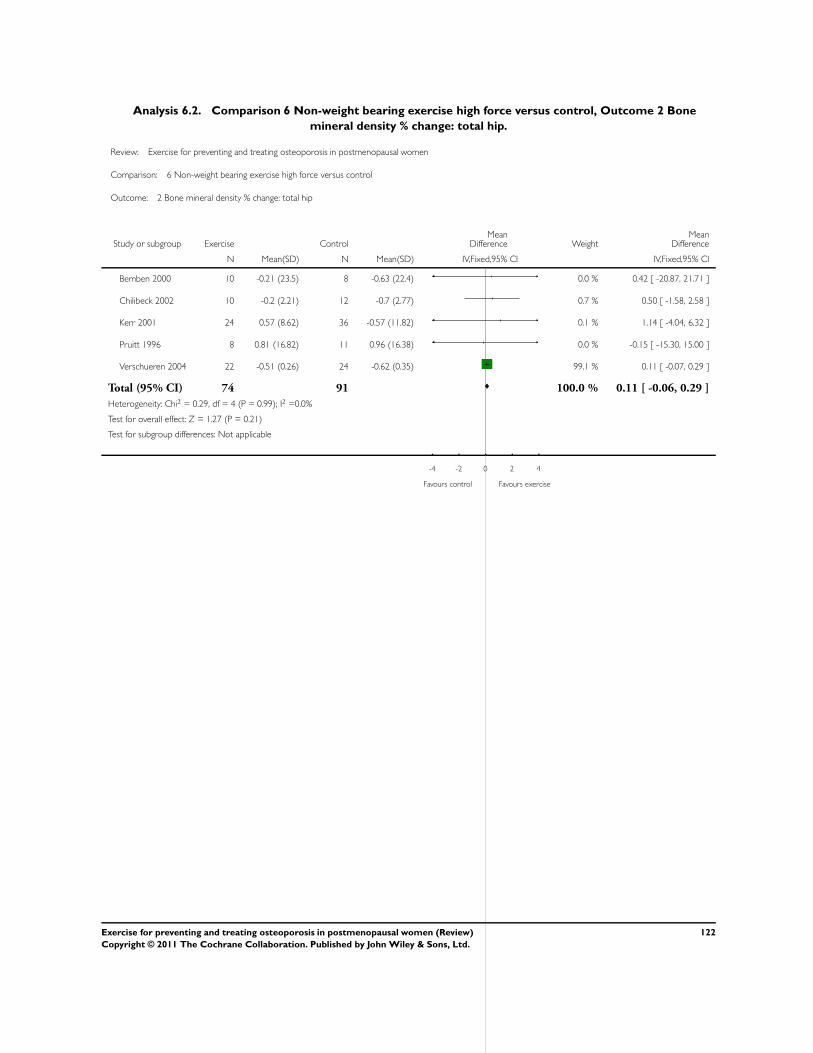
Analysis 6.2. Comparison 6 Non-weight bearing exercise high force versus control, Outcome 2 Bone
mineral density % change: total hip.
Review: Exercise for preventing and treating osteoporosis in postmenopausal women
Comparison: 6 Non-weight bearing exercise high force versus control
Outcome: 2 Bone mineral density % change: total hip
Study or subgroup Exercise ControlMean
Difference WeightMean
Difference
N Mean(SD) N Mean(SD) IV,Fixed,95% CI IV,Fixed,95% CI
Bemben 2000 10 -0.21 (23.5) 8 -0.63 (22.4) 0.0 % 0.42 [ -20.87, 21.71 ]
Chilibeck 2002 10 -0.2 (2.21) 12 -0.7 (2.77) 0.7 % 0.50 [ -1.58, 2.58 ]
Kerr 2001 24 0.57 (8.62) 36 -0.57 (11.82) 0.1 % 1.14 [ -4.04, 6.32 ]
Pruitt 1996 8 0.81 (16.82) 11 0.96 (16.38) 0.0 % -0.15 [ -15.30, 15.00 ]
Verschueren 2004 22 -0.51 (0.26) 24 -0.62 (0.35) 99.1 % 0.11 [ -0.07, 0.29 ]
Total (95% CI) 74 91 100.0 % 0.11 [ -0.06, 0.29 ]
Heterogeneity: Chi2 = 0.29, df = 4 (P = 0.99); I2 =0.0%
Test for overall effect: Z = 1.27 (P = 0.21)
Test for subgroup differences: Not applicable
-4 -2 0 2 4
Favours control Favours exercise
122Exercise for preventing and treating osteoporosis in postmenopausal women (Review)
Copyright © 2011 The Cochrane Collaboration. Published by John Wiley & Sons, Ltd.
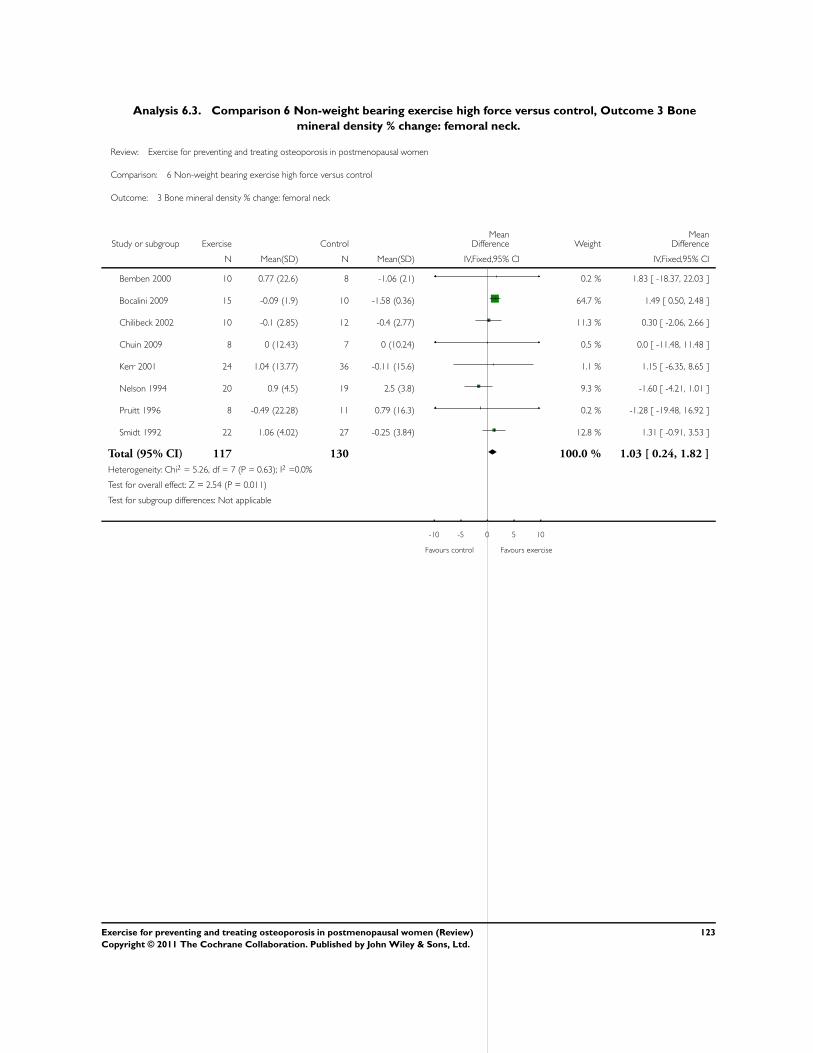
Analysis 6.3. Comparison 6 Non-weight bearing exercise high force versus control, Outcome 3 Bone
mineral density % change: femoral neck.
Review: Exercise for preventing and treating osteoporosis in postmenopausal women
Comparison: 6 Non-weight bearing exercise high force versus control
Outcome: 3 Bone mineral density % change: femoral neck
Study or subgroup Exercise ControlMean
Difference WeightMean
Difference
N Mean(SD) N Mean(SD) IV,Fixed,95% CI IV,Fixed,95% CI
Bemben 2000 10 0.77 (22.6) 8 -1.06 (21) 0.2 % 1.83 [ -18.37, 22.03 ]
Bocalini 2009 15 -0.09 (1.9) 10 -1.58 (0.36) 64.7 % 1.49 [ 0.50, 2.48 ]
Chilibeck 2002 10 -0.1 (2.85) 12 -0.4 (2.77) 11.3 % 0.30 [ -2.06, 2.66 ]
Chuin 2009 8 0 (12.43) 7 0 (10.24) 0.5 % 0.0 [ -11.48, 11.48 ]
Kerr 2001 24 1.04 (13.77) 36 -0.11 (15.6) 1.1 % 1.15 [ -6.35, 8.65 ]
Nelson 1994 20 0.9 (4.5) 19 2.5 (3.8) 9.3 % -1.60 [ -4.21, 1.01 ]
Pruitt 1996 8 -0.49 (22.28) 11 0.79 (16.3) 0.2 % -1.28 [ -19.48, 16.92 ]
Smidt 1992 22 1.06 (4.02) 27 -0.25 (3.84) 12.8 % 1.31 [ -0.91, 3.53 ]
Total (95% CI) 117 130 100.0 % 1.03 [ 0.24, 1.82 ]
Heterogeneity: Chi2 = 5.26, df = 7 (P = 0.63); I2 =0.0%
Test for overall effect: Z = 2.54 (P = 0.011)
Test for subgroup differences: Not applicable
-10 -5 0 5 10
Favours control Favours exercise
123Exercise for preventing and treating osteoporosis in postmenopausal women (Review)
Copyright © 2011 The Cochrane Collaboration. Published by John Wiley & Sons, Ltd.
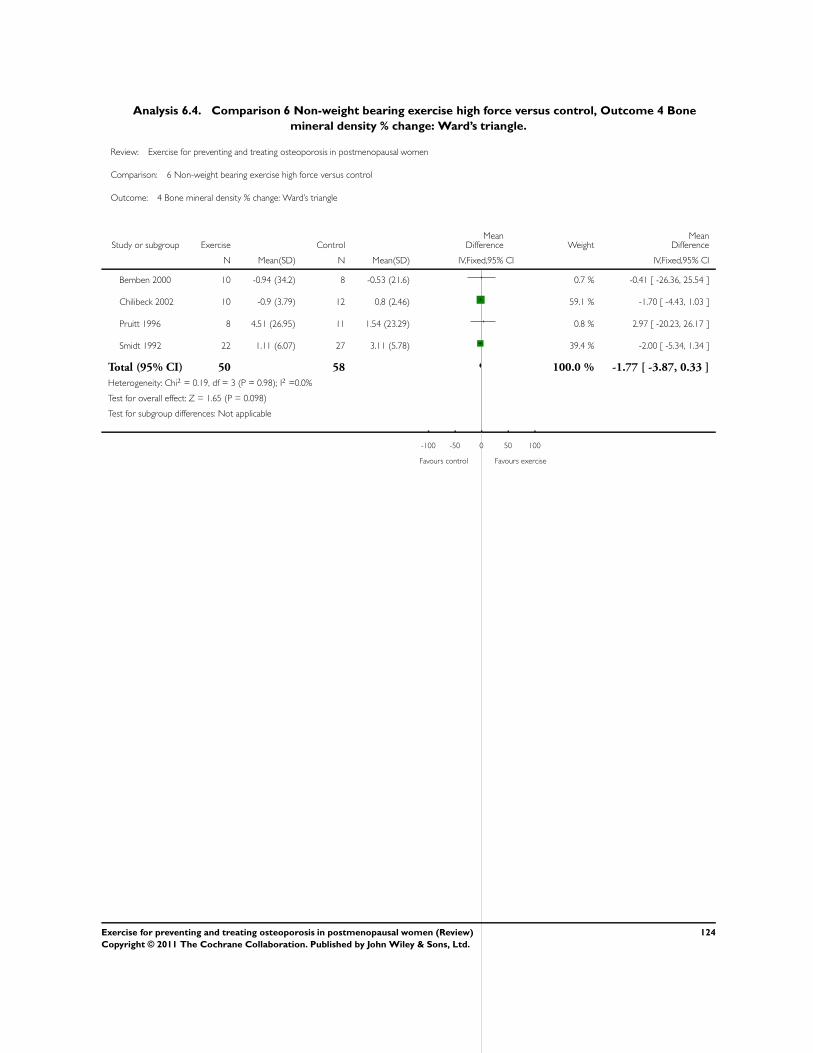
Analysis 6.4. Comparison 6 Non-weight bearing exercise high force versus control, Outcome 4 Bone
mineral density % change: Ward’s triangle.
Review: Exercise for preventing and treating osteoporosis in postmenopausal women
Comparison: 6 Non-weight bearing exercise high force versus control
Outcome: 4 Bone mineral density % change: Ward’s triangle
Study or subgroup Exercise ControlMean
Difference WeightMean
Difference
N Mean(SD) N Mean(SD) IV,Fixed,95% CI IV,Fixed,95% CI
Bemben 2000 10 -0.94 (34.2) 8 -0.53 (21.6) 0.7 % -0.41 [ -26.36, 25.54 ]
Chilibeck 2002 10 -0.9 (3.79) 12 0.8 (2.46) 59.1 % -1.70 [ -4.43, 1.03 ]
Pruitt 1996 8 4.51 (26.95) 11 1.54 (23.29) 0.8 % 2.97 [ -20.23, 26.17 ]
Smidt 1992 22 1.11 (6.07) 27 3.11 (5.78) 39.4 % -2.00 [ -5.34, 1.34 ]
Total (95% CI) 50 58 100.0 % -1.77 [ -3.87, 0.33 ]
Heterogeneity: Chi2 = 0.19, df = 3 (P = 0.98); I2 =0.0%
Test for overall effect: Z = 1.65 (P = 0.098)
Test for subgroup differences: Not applicable
-100 -50 0 50 100
Favours control Favours exercise
124Exercise for preventing and treating osteoporosis in postmenopausal women (Review)
Copyright © 2011 The Cochrane Collaboration. Published by John Wiley & Sons, Ltd.
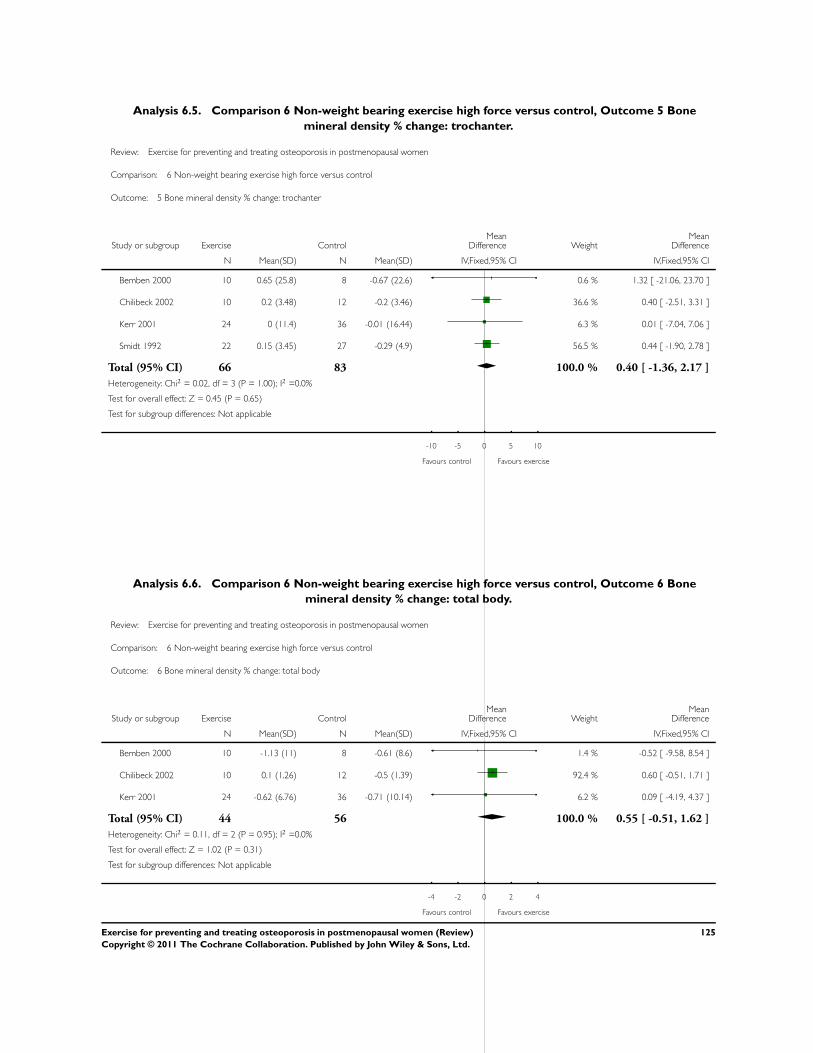
Analysis 6.5. Comparison 6 Non-weight bearing exercise high force versus control, Outcome 5 Bone
mineral density % change: trochanter.
Review: Exercise for preventing and treating osteoporosis in postmenopausal women
Comparison: 6 Non-weight bearing exercise high force versus control
Outcome: 5 Bone mineral density % change: trochanter
Study or subgroup Exercise ControlMean
Difference WeightMean
Difference
N Mean(SD) N Mean(SD) IV,Fixed,95% CI IV,Fixed,95% CI
Bemben 2000 10 0.65 (25.8) 8 -0.67 (22.6) 0.6 % 1.32 [ -21.06, 23.70 ]
Chilibeck 2002 10 0.2 (3.48) 12 -0.2 (3.46) 36.6 % 0.40 [ -2.51, 3.31 ]
Kerr 2001 24 0 (11.4) 36 -0.01 (16.44) 6.3 % 0.01 [ -7.04, 7.06 ]
Smidt 1992 22 0.15 (3.45) 27 -0.29 (4.9) 56.5 % 0.44 [ -1.90, 2.78 ]
Total (95% CI) 66 83 100.0 % 0.40 [ -1.36, 2.17 ]
Heterogeneity: Chi2 = 0.02, df = 3 (P = 1.00); I2 =0.0%
Test for overall effect: Z = 0.45 (P = 0.65)
Test for subgroup differences: Not applicable
-10 -5 0 5 10
Favours control Favours exercise
Analysis 6.6. Comparison 6 Non-weight bearing exercise high force versus control, Outcome 6 Bone
mineral density % change: total body.
Review: Exercise for preventing and treating osteoporosis in postmenopausal women
Comparison: 6 Non-weight bearing exercise high force versus control
Outcome: 6 Bone mineral density % change: total body
Study or subgroup Exercise ControlMean
Difference WeightMean
Difference
N Mean(SD) N Mean(SD) IV,Fixed,95% CI IV,Fixed,95% CI
Bemben 2000 10 -1.13 (11) 8 -0.61 (8.6) 1.4 % -0.52 [ -9.58, 8.54 ]
Chilibeck 2002 10 0.1 (1.26) 12 -0.5 (1.39) 92.4 % 0.60 [ -0.51, 1.71 ]
Kerr 2001 24 -0.62 (6.76) 36 -0.71 (10.14) 6.2 % 0.09 [ -4.19, 4.37 ]
Total (95% CI) 44 56 100.0 % 0.55 [ -0.51, 1.62 ]
Heterogeneity: Chi2 = 0.11, df = 2 (P = 0.95); I2 =0.0%
Test for overall effect: Z = 1.02 (P = 0.31)
Test for subgroup differences: Not applicable
-4 -2 0 2 4
Favours control Favours exercise
125Exercise for preventing and treating osteoporosis in postmenopausal women (Review)
Copyright © 2011 The Cochrane Collaboration. Published by John Wiley & Sons, Ltd.
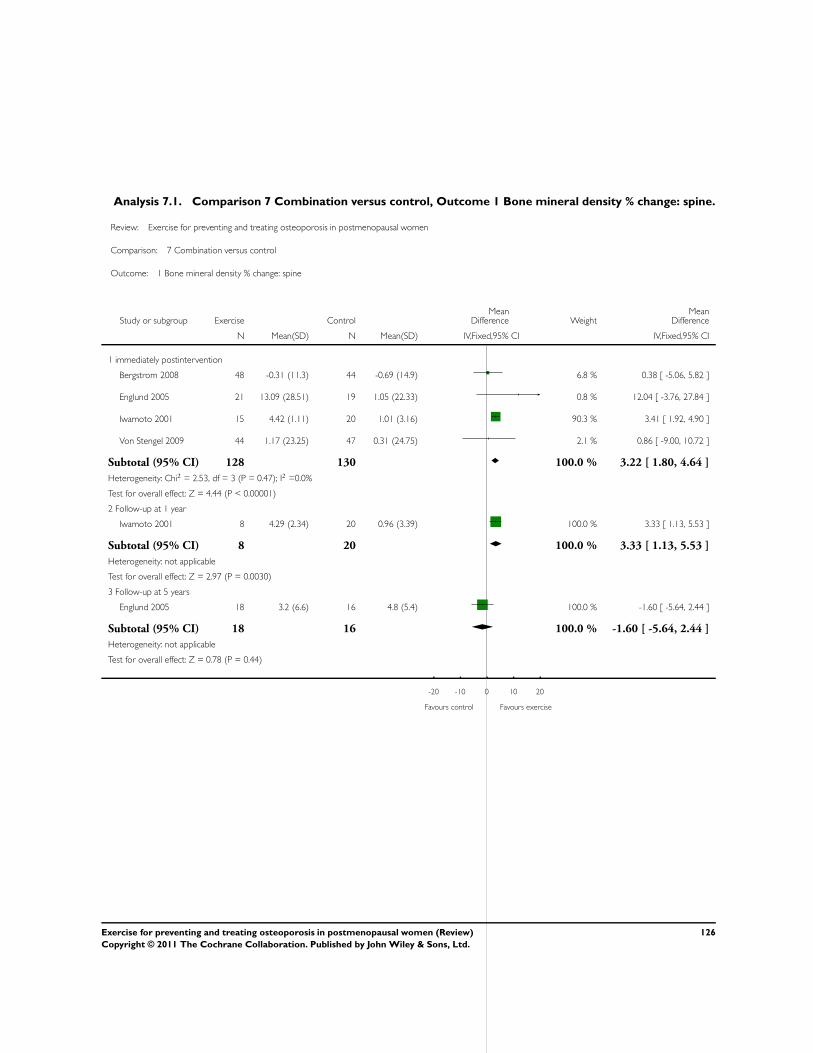
Analysis 7.1. Comparison 7 Combination versus control, Outcome 1 Bone mineral density % change: spine.
Review: Exercise for preventing and treating osteoporosis in postmenopausal women
Comparison: 7 Combination versus control
Outcome: 1 Bone mineral density % change: spine
Study or subgroup Exercise ControlMean
Difference WeightMean
Difference
N Mean(SD) N Mean(SD) IV,Fixed,95% CI IV,Fixed,95% CI
1 immediately postintervention
Bergstrom 2008 48 -0.31 (11.3) 44 -0.69 (14.9) 6.8 % 0.38 [ -5.06, 5.82 ]
Englund 2005 21 13.09 (28.51) 19 1.05 (22.33) 0.8 % 12.04 [ -3.76, 27.84 ]
Iwamoto 2001 15 4.42 (1.11) 20 1.01 (3.16) 90.3 % 3.41 [ 1.92, 4.90 ]
Von Stengel 2009 44 1.17 (23.25) 47 0.31 (24.75) 2.1 % 0.86 [ -9.00, 10.72 ]
Subtotal (95% CI) 128 130 100.0 % 3.22 [ 1.80, 4.64 ]
Heterogeneity: Chi2 = 2.53, df = 3 (P = 0.47); I2 =0.0%
Test for overall effect: Z = 4.44 (P < 0.00001)
2 Follow-up at 1 year
Iwamoto 2001 8 4.29 (2.34) 20 0.96 (3.39) 100.0 % 3.33 [ 1.13, 5.53 ]
Subtotal (95% CI) 8 20 100.0 % 3.33 [ 1.13, 5.53 ]
Heterogeneity: not applicable
Test for overall effect: Z = 2.97 (P = 0.0030)
3 Follow-up at 5 years
Englund 2005 18 3.2 (6.6) 16 4.8 (5.4) 100.0 % -1.60 [ -5.64, 2.44 ]
Subtotal (95% CI) 18 16 100.0 % -1.60 [ -5.64, 2.44 ]
Heterogeneity: not applicable
Test for overall effect: Z = 0.78 (P = 0.44)
-20 -10 0 10 20
Favours control Favours exercise
126Exercise for preventing and treating osteoporosis in postmenopausal women (Review)
Copyright © 2011 The Cochrane Collaboration. Published by John Wiley & Sons, Ltd.
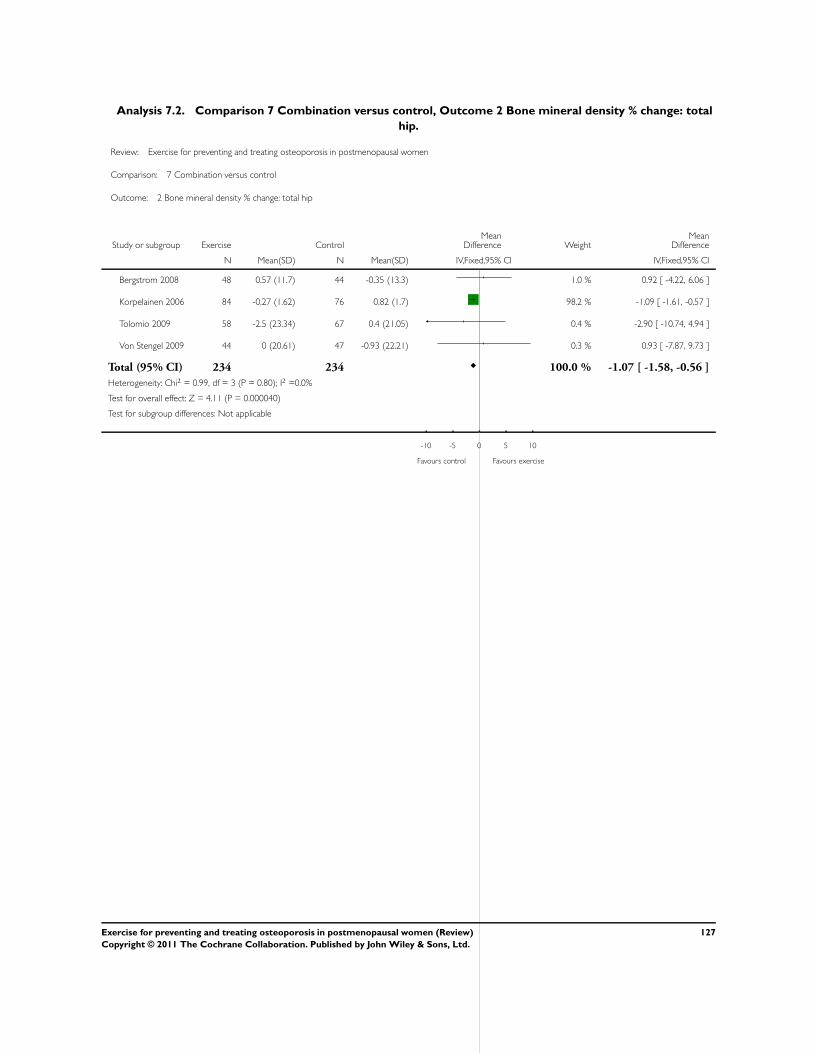
Analysis 7.2. Comparison 7 Combination versus control, Outcome 2 Bone mineral density % change: total
hip.
Review: Exercise for preventing and treating osteoporosis in postmenopausal women
Comparison: 7 Combination versus control
Outcome: 2 Bone mineral density % change: total hip
Study or subgroup Exercise ControlMean
Difference WeightMean
Difference
N Mean(SD) N Mean(SD) IV,Fixed,95% CI IV,Fixed,95% CI
Bergstrom 2008 48 0.57 (11.7) 44 -0.35 (13.3) 1.0 % 0.92 [ -4.22, 6.06 ]
Korpelainen 2006 84 -0.27 (1.62) 76 0.82 (1.7) 98.2 % -1.09 [ -1.61, -0.57 ]
Tolomio 2009 58 -2.5 (23.34) 67 0.4 (21.05) 0.4 % -2.90 [ -10.74, 4.94 ]
Von Stengel 2009 44 0 (20.61) 47 -0.93 (22.21) 0.3 % 0.93 [ -7.87, 9.73 ]
Total (95% CI) 234 234 100.0 % -1.07 [ -1.58, -0.56 ]
Heterogeneity: Chi2 = 0.99, df = 3 (P = 0.80); I2 =0.0%
Test for overall effect: Z = 4.11 (P = 0.000040)
Test for subgroup differences: Not applicable
-10 -5 0 5 10
Favours control Favours exercise
127Exercise for preventing and treating osteoporosis in postmenopausal women (Review)
Copyright © 2011 The Cochrane Collaboration. Published by John Wiley & Sons, Ltd.
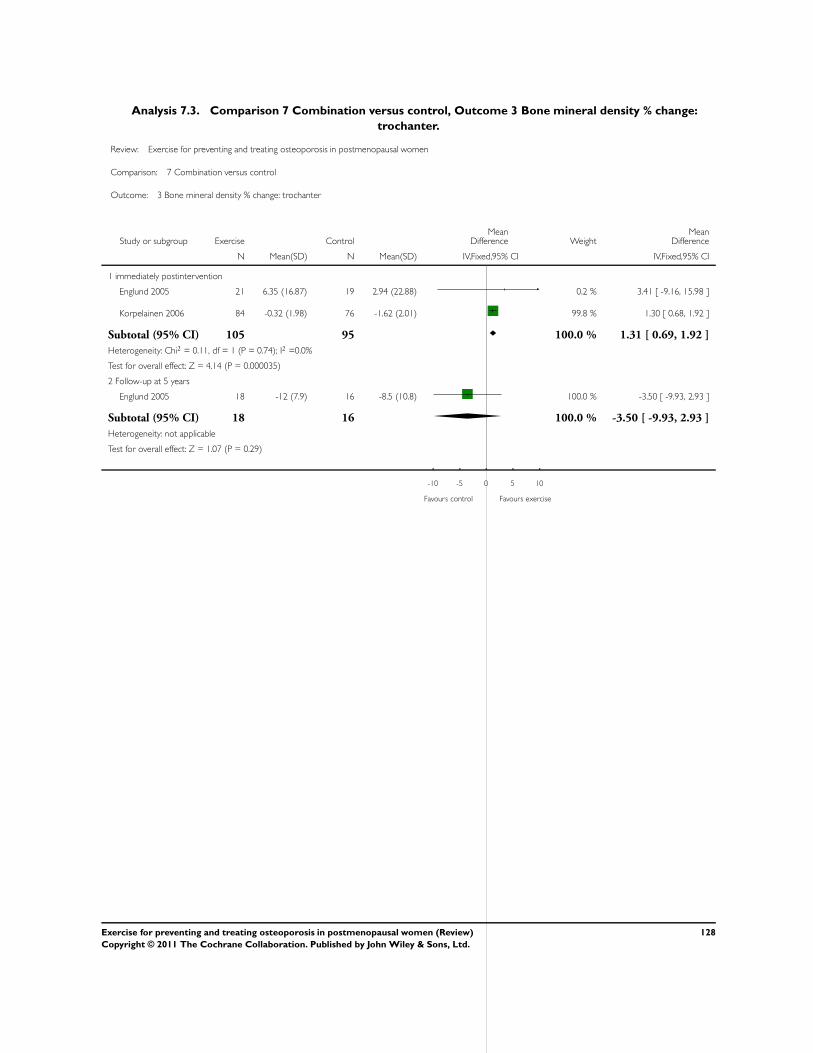
Analysis 7.3. Comparison 7 Combination versus control, Outcome 3 Bone mineral density % change:
trochanter.
Review: Exercise for preventing and treating osteoporosis in postmenopausal women
Comparison: 7 Combination versus control
Outcome: 3 Bone mineral density % change: trochanter
Study or subgroup Exercise ControlMean
Difference WeightMean
Difference
N Mean(SD) N Mean(SD) IV,Fixed,95% CI IV,Fixed,95% CI
1 immediately postintervention
Englund 2005 21 6.35 (16.87) 19 2.94 (22.88) 0.2 % 3.41 [ -9.16, 15.98 ]
Korpelainen 2006 84 -0.32 (1.98) 76 -1.62 (2.01) 99.8 % 1.30 [ 0.68, 1.92 ]
Subtotal (95% CI) 105 95 100.0 % 1.31 [ 0.69, 1.92 ]
Heterogeneity: Chi2 = 0.11, df = 1 (P = 0.74); I2 =0.0%
Test for overall effect: Z = 4.14 (P = 0.000035)
2 Follow-up at 5 years
Englund 2005 18 -12 (7.9) 16 -8.5 (10.8) 100.0 % -3.50 [ -9.93, 2.93 ]
Subtotal (95% CI) 18 16 100.0 % -3.50 [ -9.93, 2.93 ]
Heterogeneity: not applicable
Test for overall effect: Z = 1.07 (P = 0.29)
-10 -5 0 5 10
Favours control Favours exercise
128Exercise for preventing and treating osteoporosis in postmenopausal women (Review)
Copyright © 2011 The Cochrane Collaboration. Published by John Wiley & Sons, Ltd.
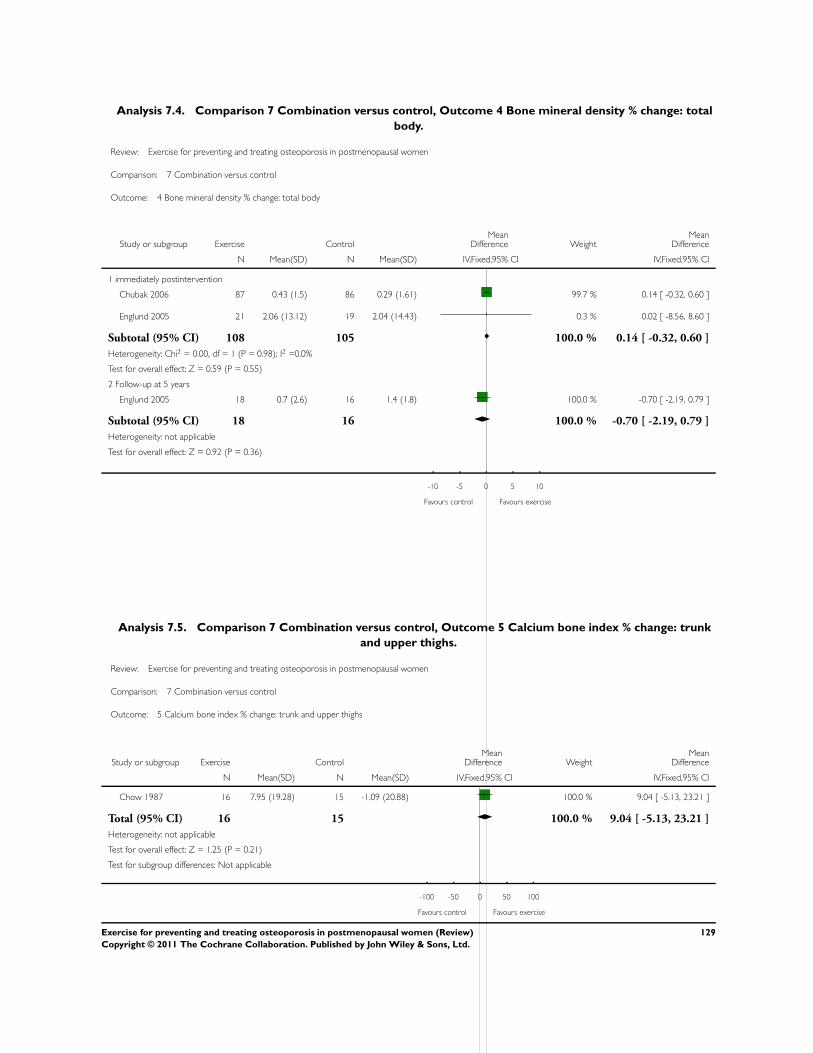
Analysis 7.4. Comparison 7 Combination versus control, Outcome 4 Bone mineral density % change: total
body.
Review: Exercise for preventing and treating osteoporosis in postmenopausal women
Comparison: 7 Combination versus control
Outcome: 4 Bone mineral density % change: total body
Study or subgroup Exercise ControlMean
Difference WeightMean
Difference
N Mean(SD) N Mean(SD) IV,Fixed,95% CI IV,Fixed,95% CI
1 immediately postintervention
Chubak 2006 87 0.43 (1.5) 86 0.29 (1.61) 99.7 % 0.14 [ -0.32, 0.60 ]
Englund 2005 21 2.06 (13.12) 19 2.04 (14.43) 0.3 % 0.02 [ -8.56, 8.60 ]
Subtotal (95% CI) 108 105 100.0 % 0.14 [ -0.32, 0.60 ]
Heterogeneity: Chi2 = 0.00, df = 1 (P = 0.98); I2 =0.0%
Test for overall effect: Z = 0.59 (P = 0.55)
2 Follow-up at 5 years
Englund 2005 18 0.7 (2.6) 16 1.4 (1.8) 100.0 % -0.70 [ -2.19, 0.79 ]
Subtotal (95% CI) 18 16 100.0 % -0.70 [ -2.19, 0.79 ]
Heterogeneity: not applicable
Test for overall effect: Z = 0.92 (P = 0.36)
-10 -5 0 5 10
Favours control Favours exercise
Analysis 7.5. Comparison 7 Combination versus control, Outcome 5 Calcium bone index % change: trunk
and upper thighs.
Review: Exercise for preventing and treating osteoporosis in postmenopausal women
Comparison: 7 Combination versus control
Outcome: 5 Calcium bone index % change: trunk and upper thighs
Study or subgroup Exercise ControlMean
Difference WeightMean
Difference
N Mean(SD) N Mean(SD) IV,Fixed,95% CI IV,Fixed,95% CI
Chow 1987 16 7.95 (19.28) 15 -1.09 (20.88) 100.0 % 9.04 [ -5.13, 23.21 ]
Total (95% CI) 16 15 100.0 % 9.04 [ -5.13, 23.21 ]
Heterogeneity: not applicable
Test for overall effect: Z = 1.25 (P = 0.21)
Test for subgroup differences: Not applicable
-100 -50 0 50 100
Favours control Favours exercise
129Exercise for preventing and treating osteoporosis in postmenopausal women (Review)
Copyright © 2011 The Cochrane Collaboration. Published by John Wiley & Sons, Ltd.
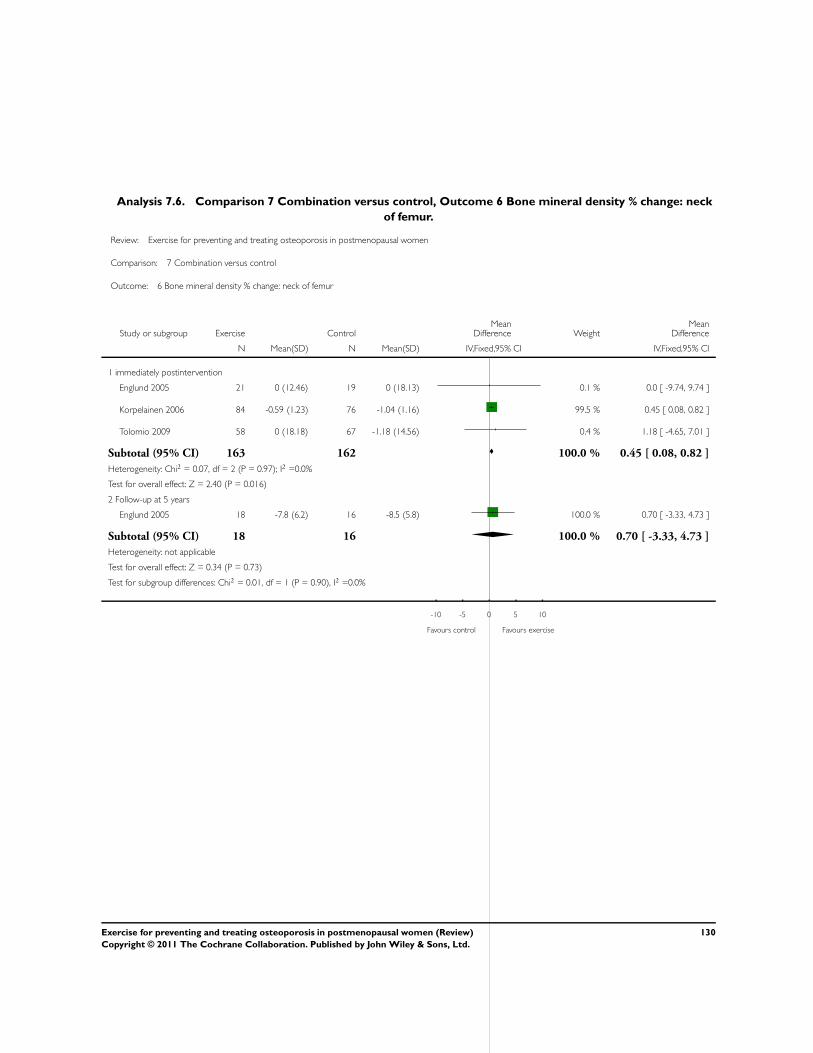
Analysis 7.6. Comparison 7 Combination versus control, Outcome 6 Bone mineral density % change: neck
of femur.
Review: Exercise for preventing and treating osteoporosis in postmenopausal women
Comparison: 7 Combination versus control
Outcome: 6 Bone mineral density % change: neck of femur
Study or subgroup Exercise ControlMean
Difference WeightMean
Difference
N Mean(SD) N Mean(SD) IV,Fixed,95% CI IV,Fixed,95% CI
1 immediately postintervention
Englund 2005 21 0 (12.46) 19 0 (18.13) 0.1 % 0.0 [ -9.74, 9.74 ]
Korpelainen 2006 84 -0.59 (1.23) 76 -1.04 (1.16) 99.5 % 0.45 [ 0.08, 0.82 ]
Tolomio 2009 58 0 (18.18) 67 -1.18 (14.56) 0.4 % 1.18 [ -4.65, 7.01 ]
Subtotal (95% CI) 163 162 100.0 % 0.45 [ 0.08, 0.82 ]
Heterogeneity: Chi2 = 0.07, df = 2 (P = 0.97); I2 =0.0%
Test for overall effect: Z = 2.40 (P = 0.016)
2 Follow-up at 5 years
Englund 2005 18 -7.8 (6.2) 16 -8.5 (5.8) 100.0 % 0.70 [ -3.33, 4.73 ]
Subtotal (95% CI) 18 16 100.0 % 0.70 [ -3.33, 4.73 ]
Heterogeneity: not applicable
Test for overall effect: Z = 0.34 (P = 0.73)
Test for subgroup differences: Chi2 = 0.01, df = 1 (P = 0.90), I2 =0.0%
-10 -5 0 5 10
Favours control Favours exercise
130Exercise for preventing and treating osteoporosis in postmenopausal women (Review)
Copyright © 2011 The Cochrane Collaboration. Published by John Wiley & Sons, Ltd.
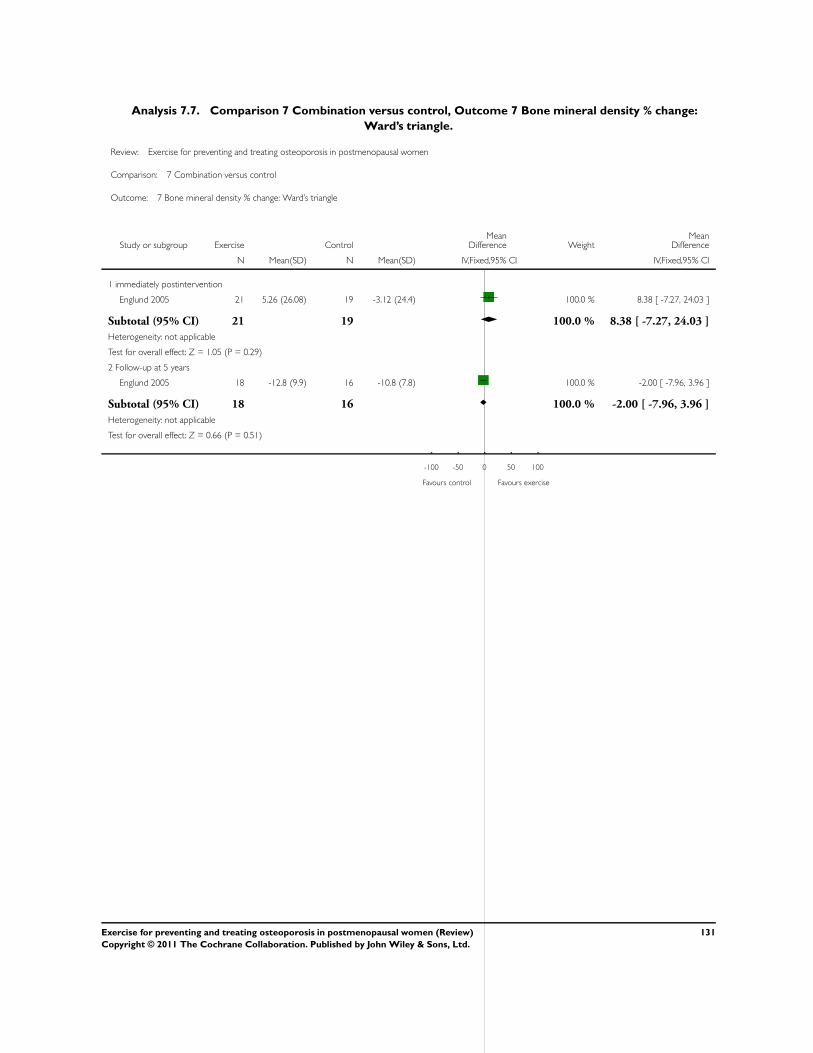
Analysis 7.7. Comparison 7 Combination versus control, Outcome 7 Bone mineral density % change:
Ward’s triangle.
Review: Exercise for preventing and treating osteoporosis in postmenopausal women
Comparison: 7 Combination versus control
Outcome: 7 Bone mineral density % change: Ward’s triangle
Study or subgroup Exercise ControlMean
Difference WeightMean
Difference
N Mean(SD) N Mean(SD) IV,Fixed,95% CI IV,Fixed,95% CI
1 immediately postintervention
Englund 2005 21 5.26 (26.08) 19 -3.12 (24.4) 100.0 % 8.38 [ -7.27, 24.03 ]
Subtotal (95% CI) 21 19 100.0 % 8.38 [ -7.27, 24.03 ]
Heterogeneity: not applicable
Test for overall effect: Z = 1.05 (P = 0.29)
2 Follow-up at 5 years
Englund 2005 18 -12.8 (9.9) 16 -10.8 (7.8) 100.0 % -2.00 [ -7.96, 3.96 ]
Subtotal (95% CI) 18 16 100.0 % -2.00 [ -7.96, 3.96 ]
Heterogeneity: not applicable
Test for overall effect: Z = 0.66 (P = 0.51)
-100 -50 0 50 100
Favours control Favours exercise
131Exercise for preventing and treating osteoporosis in postmenopausal women (Review)
Copyright © 2011 The Cochrane Collaboration. Published by John Wiley & Sons, Ltd.
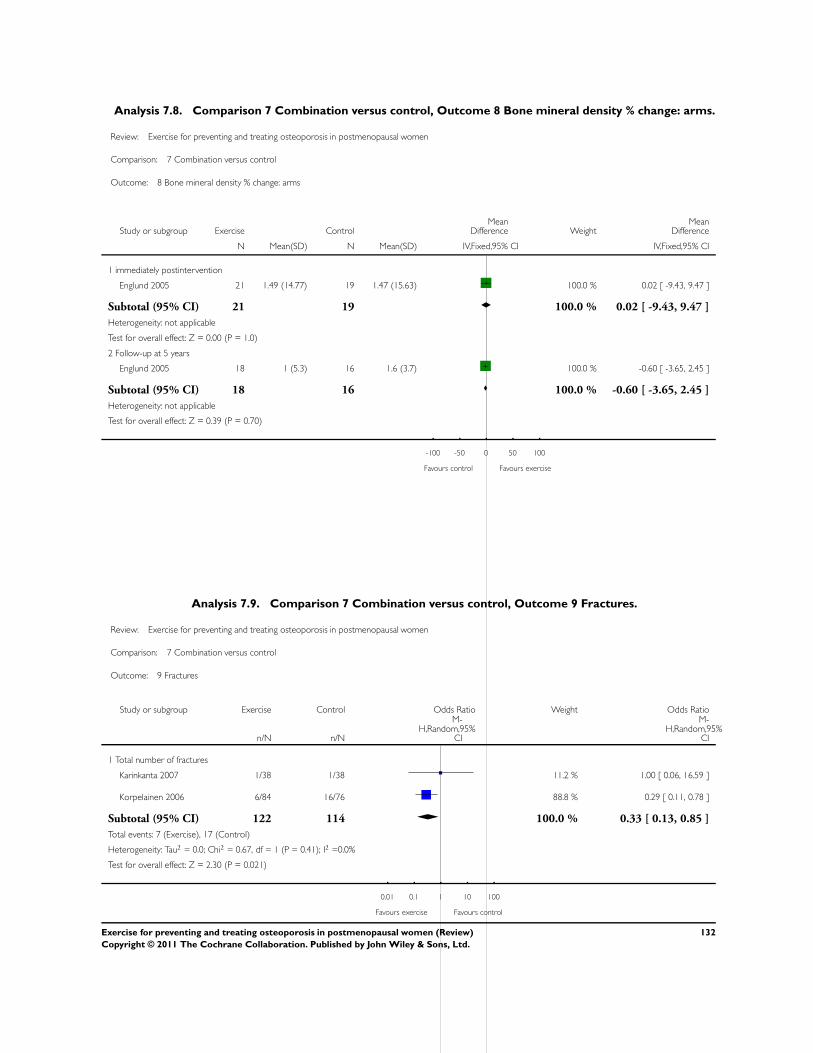
Analysis 7.8. Comparison 7 Combination versus control, Outcome 8 Bone mineral density % change: arms.
Review: Exercise for preventing and treating osteoporosis in postmenopausal women
Comparison: 7 Combination versus control
Outcome: 8 Bone mineral density % change: arms
Study or subgroup Exercise ControlMean
Difference WeightMean
Difference
N Mean(SD) N Mean(SD) IV,Fixed,95% CI IV,Fixed,95% CI
1 immediately postintervention
Englund 2005 21 1.49 (14.77) 19 1.47 (15.63) 100.0 % 0.02 [ -9.43, 9.47 ]
Subtotal (95% CI) 21 19 100.0 % 0.02 [ -9.43, 9.47 ]
Heterogeneity: not applicable
Test for overall effect: Z = 0.00 (P = 1.0)
2 Follow-up at 5 years
Englund 2005 18 1 (5.3) 16 1.6 (3.7) 100.0 % -0.60 [ -3.65, 2.45 ]
Subtotal (95% CI) 18 16 100.0 % -0.60 [ -3.65, 2.45 ]
Heterogeneity: not applicable
Test for overall effect: Z = 0.39 (P = 0.70)
-100 -50 0 50 100
Favours control Favours exercise
Analysis 7.9. Comparison 7 Combination versus control, Outcome 9 Fractures.
Review: Exercise for preventing and treating osteoporosis in postmenopausal women
Comparison: 7 Combination versus control
Outcome: 9 Fractures
Study or subgroup Exercise Control Odds Ratio Weight Odds Ratio
n/N n/N
M-H,Random,95%
CI
M-H,Random,95%
CI
1 Total number of fractures
Karinkanta 2007 1/38 1/38 11.2 % 1.00 [ 0.06, 16.59 ]
Korpelainen 2006 6/84 16/76 88.8 % 0.29 [ 0.11, 0.78 ]
Subtotal (95% CI) 122 114 100.0 % 0.33 [ 0.13, 0.85 ]
Total events: 7 (Exercise), 17 (Control)
Heterogeneity: Tau2 = 0.0; Chi2 = 0.67, df = 1 (P = 0.41); I2 =0.0%
Test for overall effect: Z = 2.30 (P = 0.021)
0.01 0.1 1 10 100
Favours exercise Favours control
132Exercise for preventing and treating osteoporosis in postmenopausal women (Review)
Copyright © 2011 The Cochrane Collaboration. Published by John Wiley & Sons, Ltd.
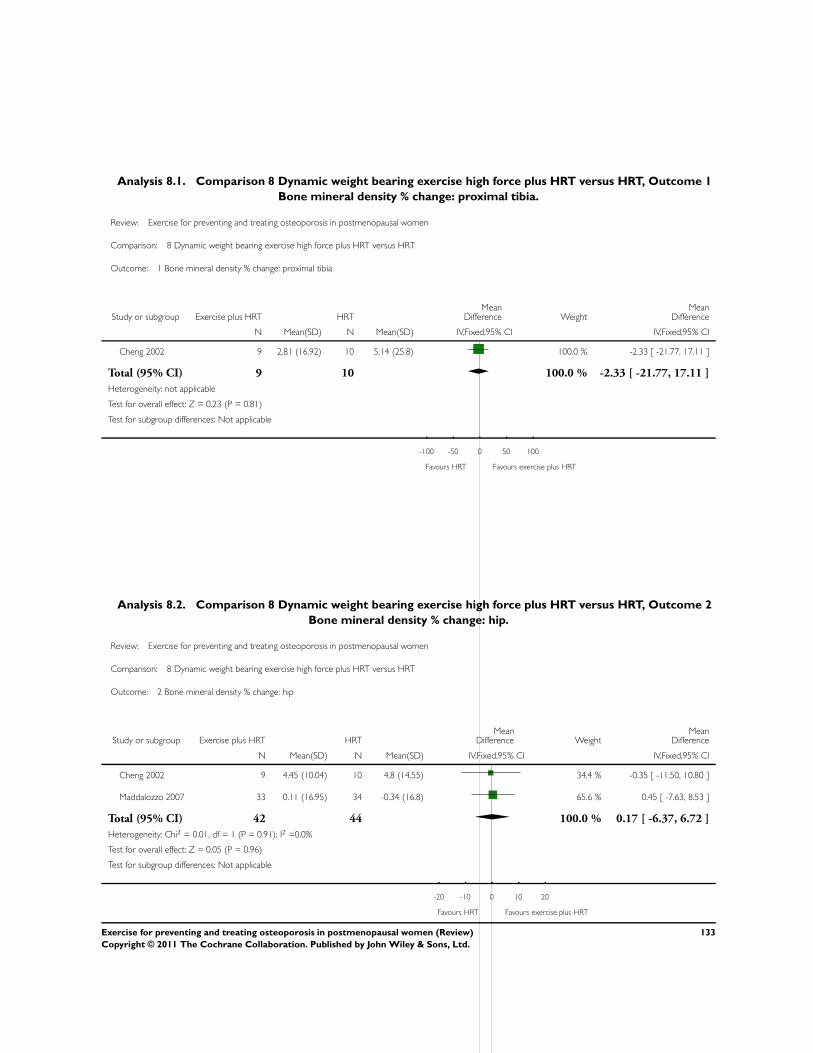
Analysis 8.1. Comparison 8 Dynamic weight bearing exercise high force plus HRT versus HRT, Outcome 1
Bone mineral density % change: proximal tibia.
Review: Exercise for preventing and treating osteoporosis in postmenopausal women
Comparison: 8 Dynamic weight bearing exercise high force plus HRT versus HRT
Outcome: 1 Bone mineral density % change: proximal tibia
Study or subgroup Exercise plus HRT HRTMean
Difference WeightMean
Difference
N Mean(SD) N Mean(SD) IV,Fixed,95% CI IV,Fixed,95% CI
Cheng 2002 9 2.81 (16.92) 10 5.14 (25.8) 100.0 % -2.33 [ -21.77, 17.11 ]
Total (95% CI) 9 10 100.0 % -2.33 [ -21.77, 17.11 ]
Heterogeneity: not applicable
Test for overall effect: Z = 0.23 (P = 0.81)
Test for subgroup differences: Not applicable
-100 -50 0 50 100
Favours HRT Favours exercise plus HRT
Analysis 8.2. Comparison 8 Dynamic weight bearing exercise high force plus HRT versus HRT, Outcome 2
Bone mineral density % change: hip.
Review: Exercise for preventing and treating osteoporosis in postmenopausal women
Comparison: 8 Dynamic weight bearing exercise high force plus HRT versus HRT
Outcome: 2 Bone mineral density % change: hip
Study or subgroup Exercise plus HRT HRTMean
Difference WeightMean
Difference
N Mean(SD) N Mean(SD) IV,Fixed,95% CI IV,Fixed,95% CI
Cheng 2002 9 4.45 (10.04) 10 4.8 (14.55) 34.4 % -0.35 [ -11.50, 10.80 ]
Maddalozzo 2007 33 0.11 (16.95) 34 -0.34 (16.8) 65.6 % 0.45 [ -7.63, 8.53 ]
Total (95% CI) 42 44 100.0 % 0.17 [ -6.37, 6.72 ]
Heterogeneity: Chi2 = 0.01, df = 1 (P = 0.91); I2 =0.0%
Test for overall effect: Z = 0.05 (P = 0.96)
Test for subgroup differences: Not applicable
-20 -10 0 10 20
Favours HRT Favours exercise plus HRT
133Exercise for preventing and treating osteoporosis in postmenopausal women (Review)
Copyright © 2011 The Cochrane Collaboration. Published by John Wiley & Sons, Ltd.
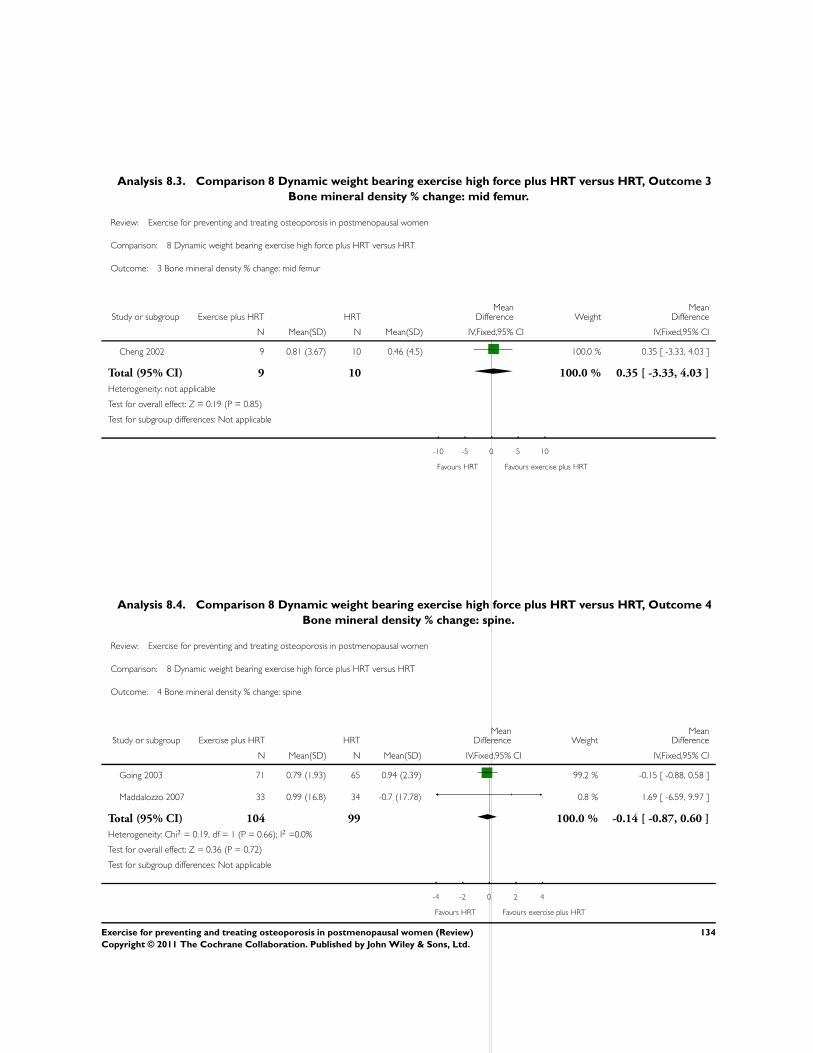
Analysis 8.3. Comparison 8 Dynamic weight bearing exercise high force plus HRT versus HRT, Outcome 3
Bone mineral density % change: mid femur.
Review: Exercise for preventing and treating osteoporosis in postmenopausal women
Comparison: 8 Dynamic weight bearing exercise high force plus HRT versus HRT
Outcome: 3 Bone mineral density % change: mid femur
Study or subgroup Exercise plus HRT HRTMean
Difference WeightMean
Difference
N Mean(SD) N Mean(SD) IV,Fixed,95% CI IV,Fixed,95% CI
Cheng 2002 9 0.81 (3.67) 10 0.46 (4.5) 100.0 % 0.35 [ -3.33, 4.03 ]
Total (95% CI) 9 10 100.0 % 0.35 [ -3.33, 4.03 ]
Heterogeneity: not applicable
Test for overall effect: Z = 0.19 (P = 0.85)
Test for subgroup differences: Not applicable
-10 -5 0 5 10
Favours HRT Favours exercise plus HRT
Analysis 8.4. Comparison 8 Dynamic weight bearing exercise high force plus HRT versus HRT, Outcome 4
Bone mineral density % change: spine.
Review: Exercise for preventing and treating osteoporosis in postmenopausal women
Comparison: 8 Dynamic weight bearing exercise high force plus HRT versus HRT
Outcome: 4 Bone mineral density % change: spine
Study or subgroup Exercise plus HRT HRTMean
Difference WeightMean
Difference
N Mean(SD) N Mean(SD) IV,Fixed,95% CI IV,Fixed,95% CI
Going 2003 71 0.79 (1.93) 65 0.94 (2.39) 99.2 % -0.15 [ -0.88, 0.58 ]
Maddalozzo 2007 33 0.99 (16.8) 34 -0.7 (17.78) 0.8 % 1.69 [ -6.59, 9.97 ]
Total (95% CI) 104 99 100.0 % -0.14 [ -0.87, 0.60 ]
Heterogeneity: Chi2 = 0.19, df = 1 (P = 0.66); I2 =0.0%
Test for overall effect: Z = 0.36 (P = 0.72)
Test for subgroup differences: Not applicable
-4 -2 0 2 4
Favours HRT Favours exercise plus HRT
134Exercise for preventing and treating osteoporosis in postmenopausal women (Review)
Copyright © 2011 The Cochrane Collaboration. Published by John Wiley & Sons, Ltd.
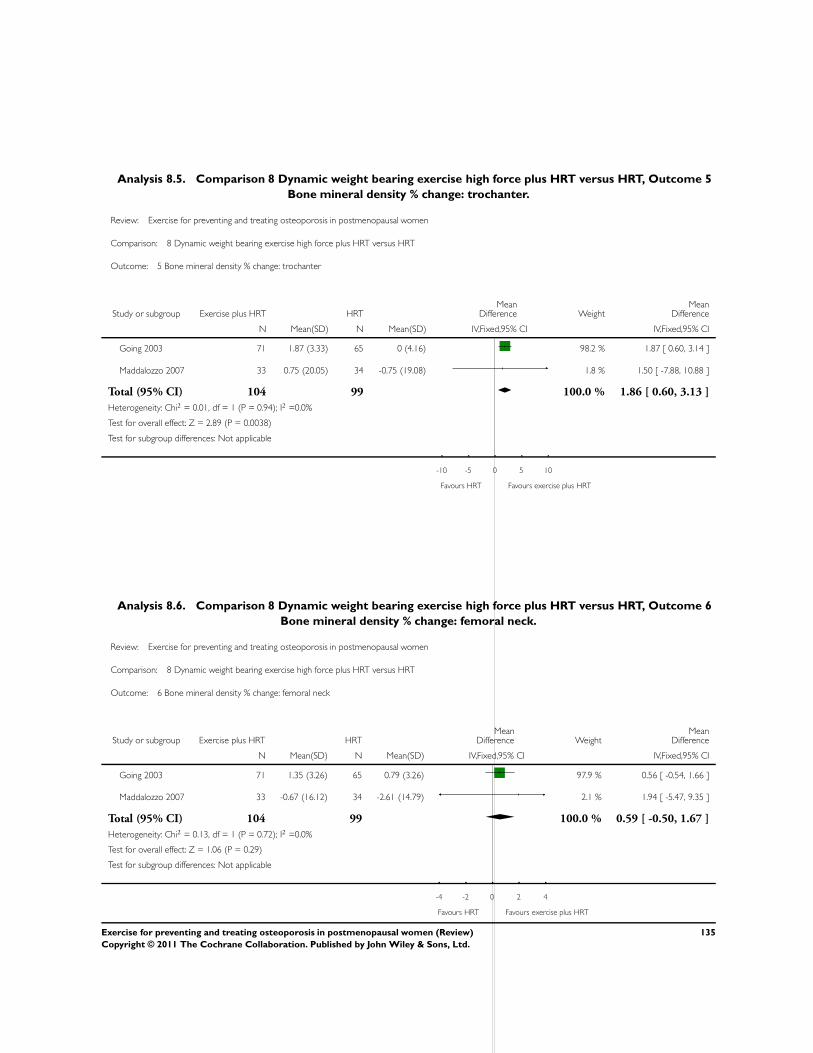
Analysis 8.5. Comparison 8 Dynamic weight bearing exercise high force plus HRT versus HRT, Outcome 5
Bone mineral density % change: trochanter.
Review: Exercise for preventing and treating osteoporosis in postmenopausal women
Comparison: 8 Dynamic weight bearing exercise high force plus HRT versus HRT
Outcome: 5 Bone mineral density % change: trochanter
Study or subgroup Exercise plus HRT HRTMean
Difference WeightMean
Difference
N Mean(SD) N Mean(SD) IV,Fixed,95% CI IV,Fixed,95% CI
Going 2003 71 1.87 (3.33) 65 0 (4.16) 98.2 % 1.87 [ 0.60, 3.14 ]
Maddalozzo 2007 33 0.75 (20.05) 34 -0.75 (19.08) 1.8 % 1.50 [ -7.88, 10.88 ]
Total (95% CI) 104 99 100.0 % 1.86 [ 0.60, 3.13 ]
Heterogeneity: Chi2 = 0.01, df = 1 (P = 0.94); I2 =0.0%
Test for overall effect: Z = 2.89 (P = 0.0038)
Test for subgroup differences: Not applicable
-10 -5 0 5 10
Favours HRT Favours exercise plus HRT
Analysis 8.6. Comparison 8 Dynamic weight bearing exercise high force plus HRT versus HRT, Outcome 6
Bone mineral density % change: femoral neck.
Review: Exercise for preventing and treating osteoporosis in postmenopausal women
Comparison: 8 Dynamic weight bearing exercise high force plus HRT versus HRT
Outcome: 6 Bone mineral density % change: femoral neck
Study or subgroup Exercise plus HRT HRTMean
Difference WeightMean
Difference
N Mean(SD) N Mean(SD) IV,Fixed,95% CI IV,Fixed,95% CI
Going 2003 71 1.35 (3.26) 65 0.79 (3.26) 97.9 % 0.56 [ -0.54, 1.66 ]
Maddalozzo 2007 33 -0.67 (16.12) 34 -2.61 (14.79) 2.1 % 1.94 [ -5.47, 9.35 ]
Total (95% CI) 104 99 100.0 % 0.59 [ -0.50, 1.67 ]
Heterogeneity: Chi2 = 0.13, df = 1 (P = 0.72); I2 =0.0%
Test for overall effect: Z = 1.06 (P = 0.29)
Test for subgroup differences: Not applicable
-4 -2 0 2 4
Favours HRT Favours exercise plus HRT
135Exercise for preventing and treating osteoporosis in postmenopausal women (Review)
Copyright © 2011 The Cochrane Collaboration. Published by John Wiley & Sons, Ltd.
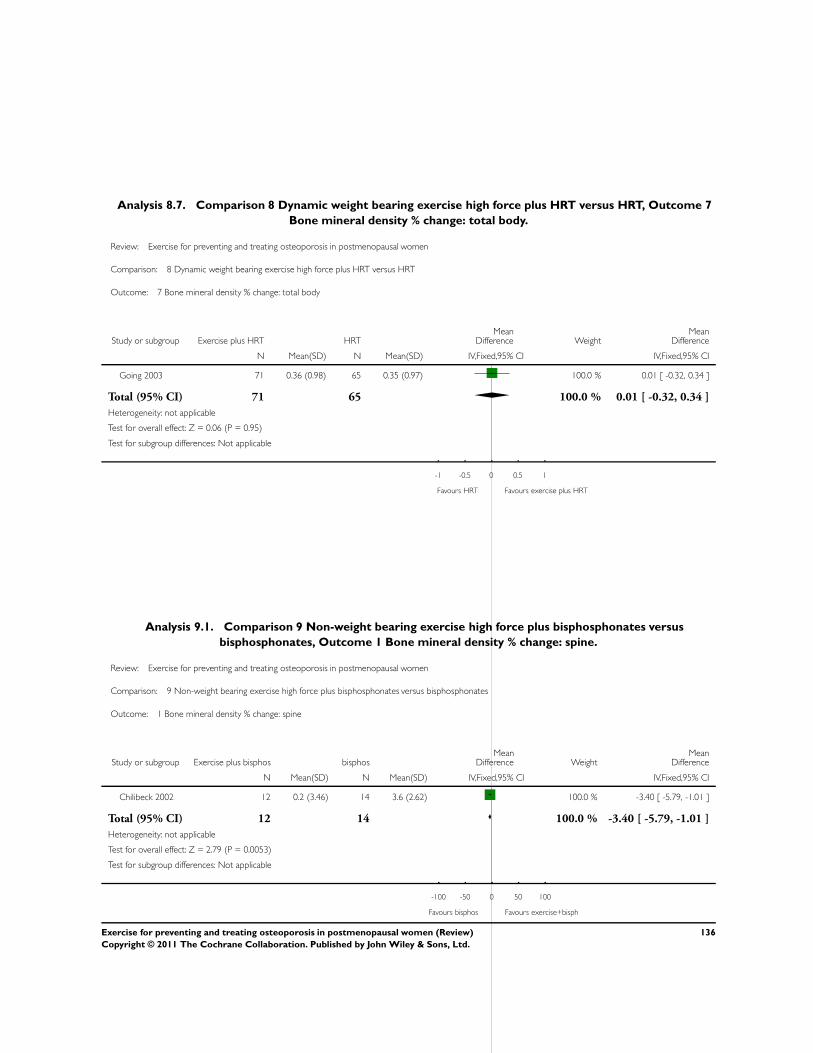
Analysis 8.7. Comparison 8 Dynamic weight bearing exercise high force plus HRT versus HRT, Outcome 7
Bone mineral density % change: total body.
Review: Exercise for preventing and treating osteoporosis in postmenopausal women
Comparison: 8 Dynamic weight bearing exercise high force plus HRT versus HRT
Outcome: 7 Bone mineral density % change: total body
Study or subgroup Exercise plus HRT HRTMean
Difference WeightMean
Difference
N Mean(SD) N Mean(SD) IV,Fixed,95% CI IV,Fixed,95% CI
Going 2003 71 0.36 (0.98) 65 0.35 (0.97) 100.0 % 0.01 [ -0.32, 0.34 ]
Total (95% CI) 71 65 100.0 % 0.01 [ -0.32, 0.34 ]
Heterogeneity: not applicable
Test for overall effect: Z = 0.06 (P = 0.95)
Test for subgroup differences: Not applicable
-1 -0.5 0 0.5 1
Favours HRT Favours exercise plus HRT
Analysis 9.1. Comparison 9 Non-weight bearing exercise high force plus bisphosphonates versus
bisphosphonates, Outcome 1 Bone mineral density % change: spine.
Review: Exercise for preventing and treating osteoporosis in postmenopausal women
Comparison: 9 Non-weight bearing exercise high force plus bisphosphonates versus bisphosphonates
Outcome: 1 Bone mineral density % change: spine
Study or subgroup Exercise plus bisphos bisphosMean
Difference WeightMean
Difference
N Mean(SD) N Mean(SD) IV,Fixed,95% CI IV,Fixed,95% CI
Chilibeck 2002 12 0.2 (3.46) 14 3.6 (2.62) 100.0 % -3.40 [ -5.79, -1.01 ]
Total (95% CI) 12 14 100.0 % -3.40 [ -5.79, -1.01 ]
Heterogeneity: not applicable
Test for overall effect: Z = 2.79 (P = 0.0053)
Test for subgroup differences: Not applicable
-100 -50 0 50 100
Favours bisphos Favours exercise+bisph
136Exercise for preventing and treating osteoporosis in postmenopausal women (Review)
Copyright © 2011 The Cochrane Collaboration. Published by John Wiley & Sons, Ltd.
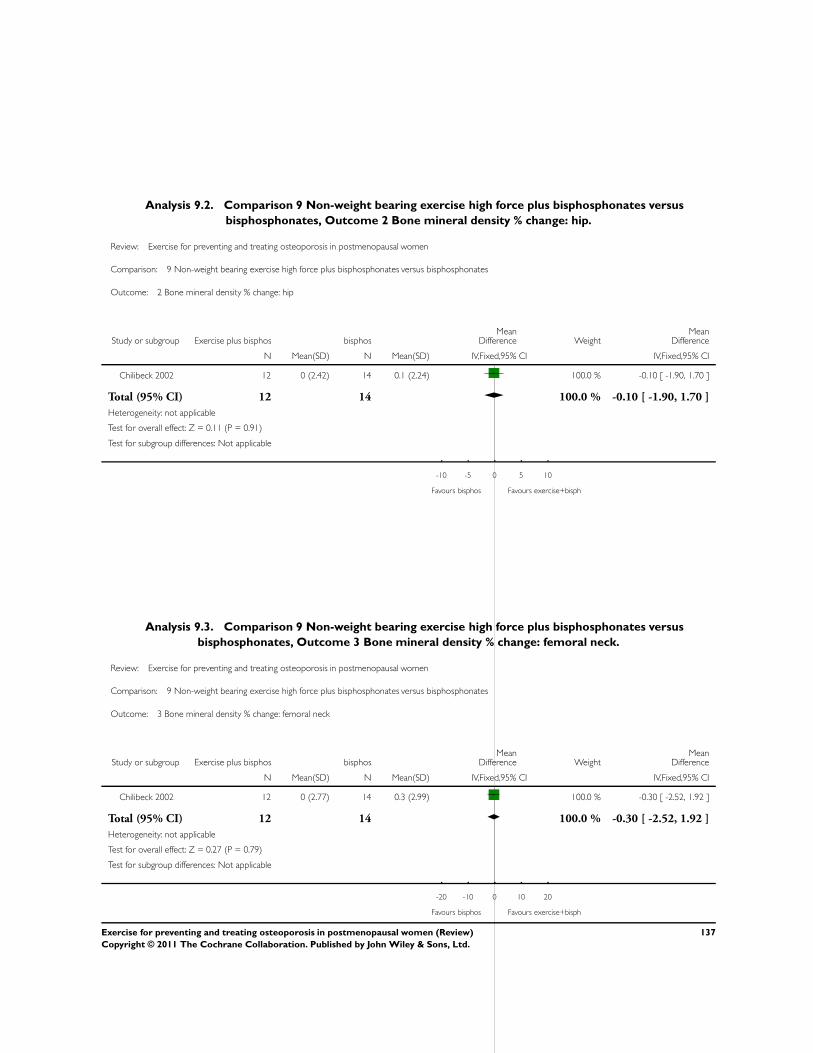
Analysis 9.2. Comparison 9 Non-weight bearing exercise high force plus bisphosphonates versus
bisphosphonates, Outcome 2 Bone mineral density % change: hip.
Review: Exercise for preventing and treating osteoporosis in postmenopausal women
Comparison: 9 Non-weight bearing exercise high force plus bisphosphonates versus bisphosphonates
Outcome: 2 Bone mineral density % change: hip
Study or subgroup Exercise plus bisphos bisphosMean
Difference WeightMean
Difference
N Mean(SD) N Mean(SD) IV,Fixed,95% CI IV,Fixed,95% CI
Chilibeck 2002 12 0 (2.42) 14 0.1 (2.24) 100.0 % -0.10 [ -1.90, 1.70 ]
Total (95% CI) 12 14 100.0 % -0.10 [ -1.90, 1.70 ]
Heterogeneity: not applicable
Test for overall effect: Z = 0.11 (P = 0.91)
Test for subgroup differences: Not applicable
-10 -5 0 5 10
Favours bisphos Favours exercise+bisph
Analysis 9.3. Comparison 9 Non-weight bearing exercise high force plus bisphosphonates versus
bisphosphonates, Outcome 3 Bone mineral density % change: femoral neck.
Review: Exercise for preventing and treating osteoporosis in postmenopausal women
Comparison: 9 Non-weight bearing exercise high force plus bisphosphonates versus bisphosphonates
Outcome: 3 Bone mineral density % change: femoral neck
Study or subgroup Exercise plus bisphos bisphosMean
Difference WeightMean
Difference
N Mean(SD) N Mean(SD) IV,Fixed,95% CI IV,Fixed,95% CI
Chilibeck 2002 12 0 (2.77) 14 0.3 (2.99) 100.0 % -0.30 [ -2.52, 1.92 ]
Total (95% CI) 12 14 100.0 % -0.30 [ -2.52, 1.92 ]
Heterogeneity: not applicable
Test for overall effect: Z = 0.27 (P = 0.79)
Test for subgroup differences: Not applicable
-20 -10 0 10 20
Favours bisphos Favours exercise+bisph
137Exercise for preventing and treating osteoporosis in postmenopausal women (Review)
Copyright © 2011 The Cochrane Collaboration. Published by John Wiley & Sons, Ltd.
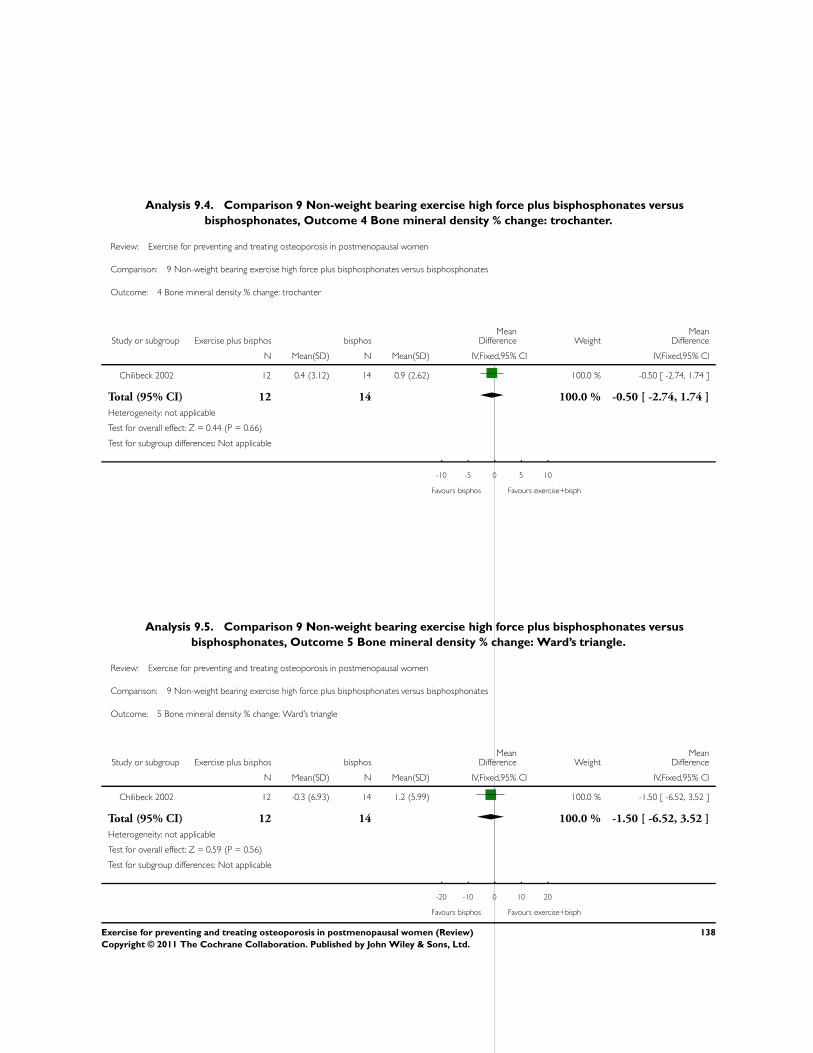
Analysis 9.4. Comparison 9 Non-weight bearing exercise high force plus bisphosphonates versus
bisphosphonates, Outcome 4 Bone mineral density % change: trochanter.
Review: Exercise for preventing and treating osteoporosis in postmenopausal women
Comparison: 9 Non-weight bearing exercise high force plus bisphosphonates versus bisphosphonates
Outcome: 4 Bone mineral density % change: trochanter
Study or subgroup Exercise plus bisphos bisphosMean
Difference WeightMean
Difference
N Mean(SD) N Mean(SD) IV,Fixed,95% CI IV,Fixed,95% CI
Chilibeck 2002 12 0.4 (3.12) 14 0.9 (2.62) 100.0 % -0.50 [ -2.74, 1.74 ]
Total (95% CI) 12 14 100.0 % -0.50 [ -2.74, 1.74 ]
Heterogeneity: not applicable
Test for overall effect: Z = 0.44 (P = 0.66)
Test for subgroup differences: Not applicable
-10 -5 0 5 10
Favours bisphos Favours exercise+bisph
Analysis 9.5. Comparison 9 Non-weight bearing exercise high force plus bisphosphonates versus
bisphosphonates, Outcome 5 Bone mineral density % change: Ward’s triangle.
Review: Exercise for preventing and treating osteoporosis in postmenopausal women
Comparison: 9 Non-weight bearing exercise high force plus bisphosphonates versus bisphosphonates
Outcome: 5 Bone mineral density % change: Ward’s triangle
Study or subgroup Exercise plus bisphos bisphosMean
Difference WeightMean
Difference
N Mean(SD) N Mean(SD) IV,Fixed,95% CI IV,Fixed,95% CI
Chilibeck 2002 12 -0.3 (6.93) 14 1.2 (5.99) 100.0 % -1.50 [ -6.52, 3.52 ]
Total (95% CI) 12 14 100.0 % -1.50 [ -6.52, 3.52 ]
Heterogeneity: not applicable
Test for overall effect: Z = 0.59 (P = 0.56)
Test for subgroup differences: Not applicable
-20 -10 0 10 20
Favours bisphos Favours exercise+bisph
138Exercise for preventing and treating osteoporosis in postmenopausal women (Review)
Copyright © 2011 The Cochrane Collaboration. Published by John Wiley & Sons, Ltd.
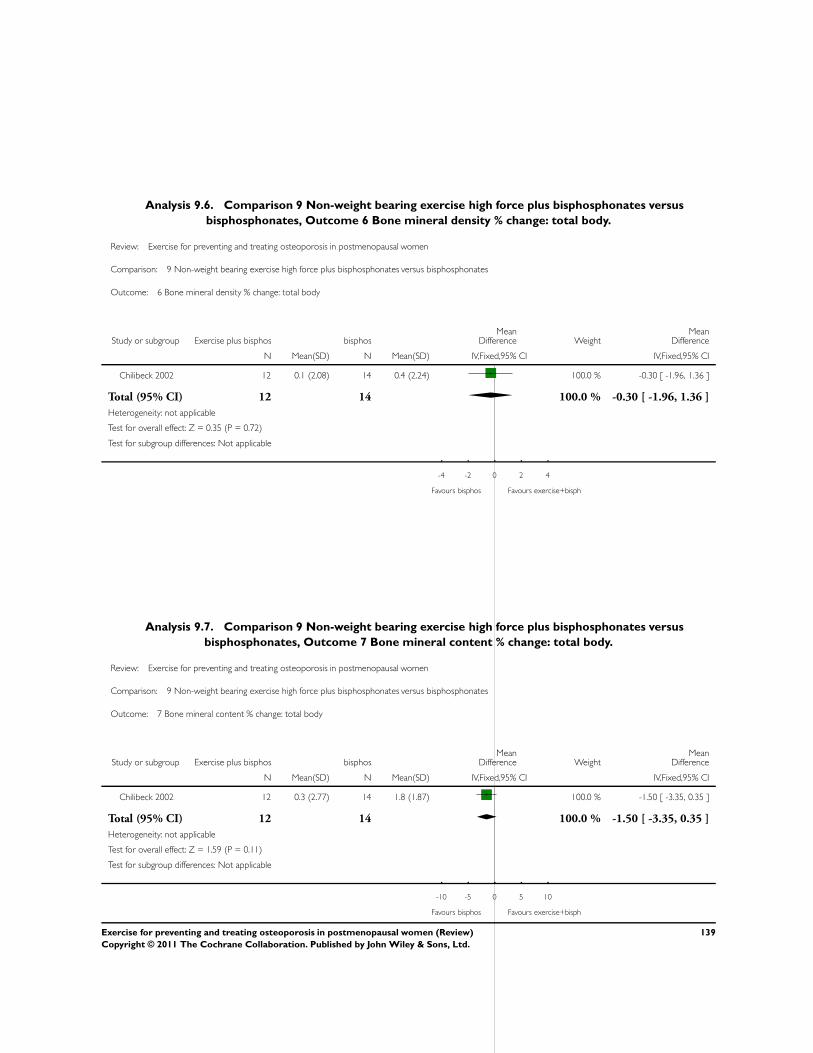
Analysis 9.6. Comparison 9 Non-weight bearing exercise high force plus bisphosphonates versus
bisphosphonates, Outcome 6 Bone mineral density % change: total body.
Review: Exercise for preventing and treating osteoporosis in postmenopausal women
Comparison: 9 Non-weight bearing exercise high force plus bisphosphonates versus bisphosphonates
Outcome: 6 Bone mineral density % change: total body
Study or subgroup Exercise plus bisphos bisphosMean
Difference WeightMean
Difference
N Mean(SD) N Mean(SD) IV,Fixed,95% CI IV,Fixed,95% CI
Chilibeck 2002 12 0.1 (2.08) 14 0.4 (2.24) 100.0 % -0.30 [ -1.96, 1.36 ]
Total (95% CI) 12 14 100.0 % -0.30 [ -1.96, 1.36 ]
Heterogeneity: not applicable
Test for overall effect: Z = 0.35 (P = 0.72)
Test for subgroup differences: Not applicable
-4 -2 0 2 4
Favours bisphos Favours exercise+bisph
Analysis 9.7. Comparison 9 Non-weight bearing exercise high force plus bisphosphonates versus
bisphosphonates, Outcome 7 Bone mineral content % change: total body.
Review: Exercise for preventing and treating osteoporosis in postmenopausal women
Comparison: 9 Non-weight bearing exercise high force plus bisphosphonates versus bisphosphonates
Outcome: 7 Bone mineral content % change: total body
Study or subgroup Exercise plus bisphos bisphosMean
Difference WeightMean
Difference
N Mean(SD) N Mean(SD) IV,Fixed,95% CI IV,Fixed,95% CI
Chilibeck 2002 12 0.3 (2.77) 14 1.8 (1.87) 100.0 % -1.50 [ -3.35, 0.35 ]
Total (95% CI) 12 14 100.0 % -1.50 [ -3.35, 0.35 ]
Heterogeneity: not applicable
Test for overall effect: Z = 1.59 (P = 0.11)
Test for subgroup differences: Not applicable
-10 -5 0 5 10
Favours bisphos Favours exercise+bisph
139Exercise for preventing and treating osteoporosis in postmenopausal women (Review)
Copyright © 2011 The Cochrane Collaboration. Published by John Wiley & Sons, Ltd.
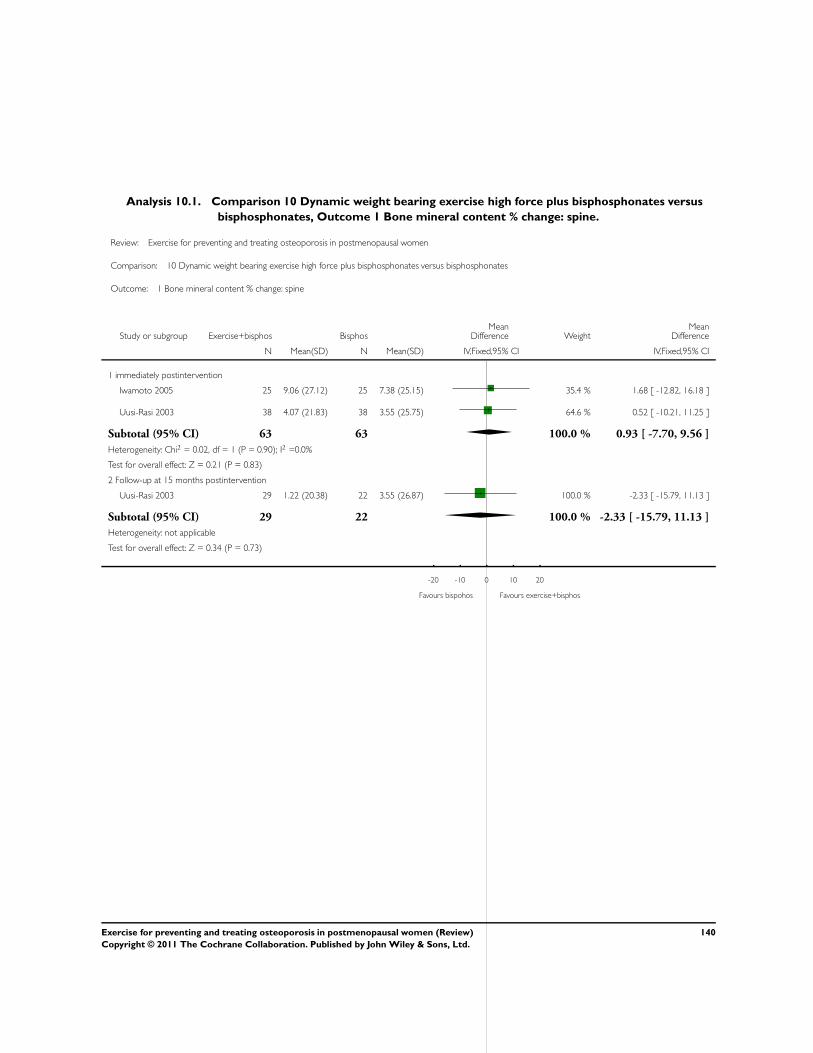
Analysis 10.1. Comparison 10 Dynamic weight bearing exercise high force plus bisphosphonates versus
bisphosphonates, Outcome 1 Bone mineral content % change: spine.
Review: Exercise for preventing and treating osteoporosis in postmenopausal women
Comparison: 10 Dynamic weight bearing exercise high force plus bisphosphonates versus bisphosphonates
Outcome: 1 Bone mineral content % change: spine
Study or subgroup Exercise+bisphos BisphosMean
Difference WeightMean
Difference
N Mean(SD) N Mean(SD) IV,Fixed,95% CI IV,Fixed,95% CI
1 immediately postintervention
Iwamoto 2005 25 9.06 (27.12) 25 7.38 (25.15) 35.4 % 1.68 [ -12.82, 16.18 ]
Uusi-Rasi 2003 38 4.07 (21.83) 38 3.55 (25.75) 64.6 % 0.52 [ -10.21, 11.25 ]
Subtotal (95% CI) 63 63 100.0 % 0.93 [ -7.70, 9.56 ]
Heterogeneity: Chi2 = 0.02, df = 1 (P = 0.90); I2 =0.0%
Test for overall effect: Z = 0.21 (P = 0.83)
2 Follow-up at 15 months postintervention
Uusi-Rasi 2003 29 1.22 (20.38) 22 3.55 (26.87) 100.0 % -2.33 [ -15.79, 11.13 ]
Subtotal (95% CI) 29 22 100.0 % -2.33 [ -15.79, 11.13 ]
Heterogeneity: not applicable
Test for overall effect: Z = 0.34 (P = 0.73)
-20 -10 0 10 20
Favours bispohos Favours exercise+bisphos
140Exercise for preventing and treating osteoporosis in postmenopausal women (Review)
Copyright © 2011 The Cochrane Collaboration. Published by John Wiley & Sons, Ltd.
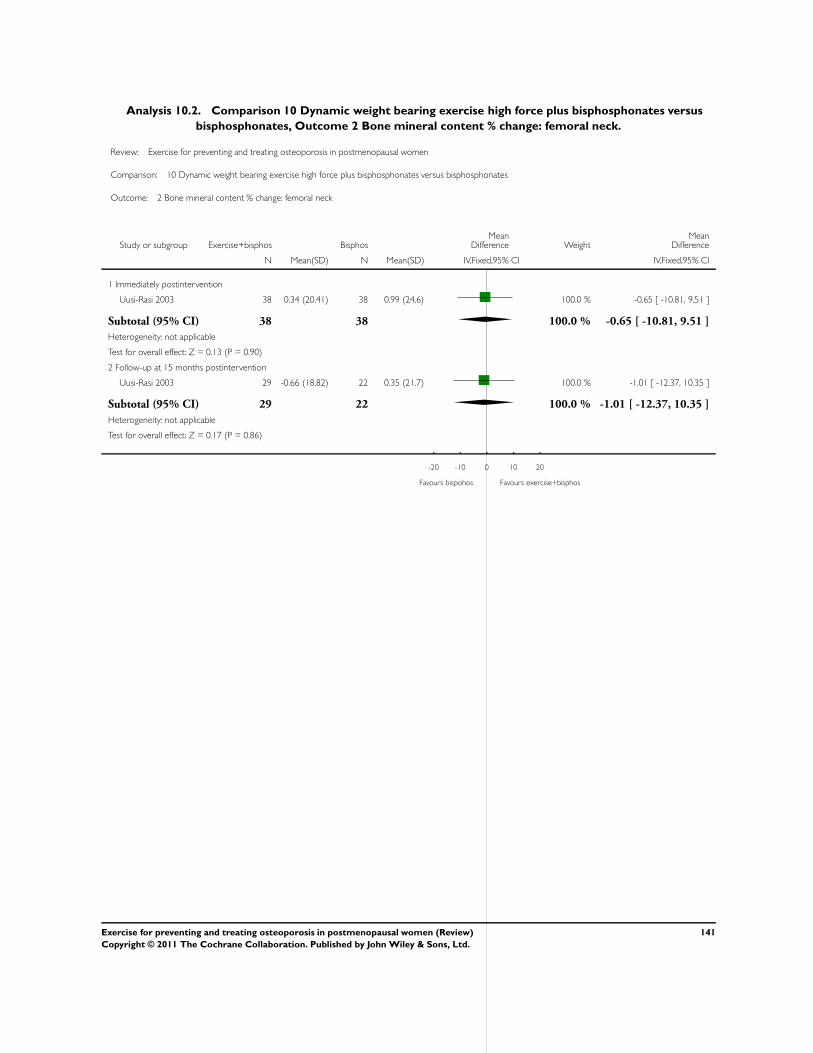
Analysis 10.2. Comparison 10 Dynamic weight bearing exercise high force plus bisphosphonates versus
bisphosphonates, Outcome 2 Bone mineral content % change: femoral neck.
Review: Exercise for preventing and treating osteoporosis in postmenopausal women
Comparison: 10 Dynamic weight bearing exercise high force plus bisphosphonates versus bisphosphonates
Outcome: 2 Bone mineral content % change: femoral neck
Study or subgroup Exercise+bisphos BisphosMean
Difference WeightMean
Difference
N Mean(SD) N Mean(SD) IV,Fixed,95% CI IV,Fixed,95% CI
1 Immediately postintervention
Uusi-Rasi 2003 38 0.34 (20.41) 38 0.99 (24.6) 100.0 % -0.65 [ -10.81, 9.51 ]
Subtotal (95% CI) 38 38 100.0 % -0.65 [ -10.81, 9.51 ]
Heterogeneity: not applicable
Test for overall effect: Z = 0.13 (P = 0.90)
2 Follow-up at 15 months postintervention
Uusi-Rasi 2003 29 -0.66 (18.82) 22 0.35 (21.7) 100.0 % -1.01 [ -12.37, 10.35 ]
Subtotal (95% CI) 29 22 100.0 % -1.01 [ -12.37, 10.35 ]
Heterogeneity: not applicable
Test for overall effect: Z = 0.17 (P = 0.86)
-20 -10 0 10 20
Favours bispohos Favours exercise+bisphos
141Exercise for preventing and treating osteoporosis in postmenopausal women (Review)
Copyright © 2011 The Cochrane Collaboration. Published by John Wiley & Sons, Ltd.
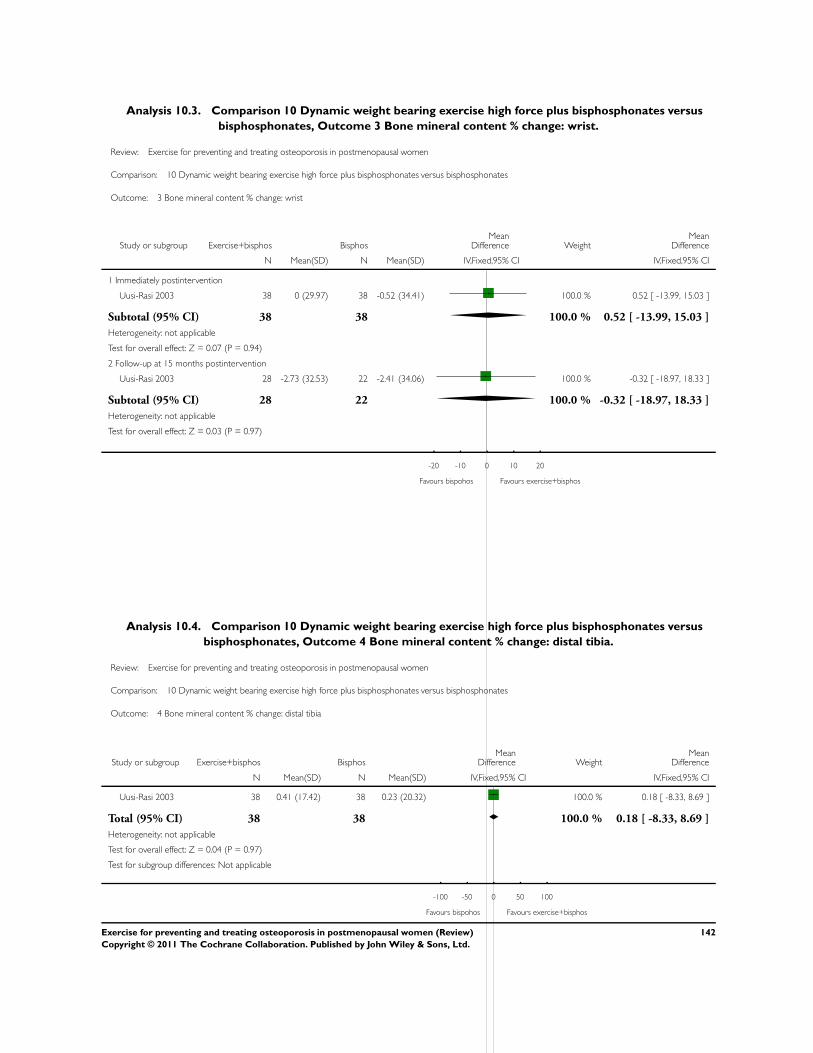
Analysis 10.3. Comparison 10 Dynamic weight bearing exercise high force plus bisphosphonates versus
bisphosphonates, Outcome 3 Bone mineral content % change: wrist.
Review: Exercise for preventing and treating osteoporosis in postmenopausal women
Comparison: 10 Dynamic weight bearing exercise high force plus bisphosphonates versus bisphosphonates
Outcome: 3 Bone mineral content % change: wrist
Study or subgroup Exercise+bisphos BisphosMean
Difference WeightMean
Difference
N Mean(SD) N Mean(SD) IV,Fixed,95% CI IV,Fixed,95% CI
1 Immediately postintervention
Uusi-Rasi 2003 38 0 (29.97) 38 -0.52 (34.41) 100.0 % 0.52 [ -13.99, 15.03 ]
Subtotal (95% CI) 38 38 100.0 % 0.52 [ -13.99, 15.03 ]
Heterogeneity: not applicable
Test for overall effect: Z = 0.07 (P = 0.94)
2 Follow-up at 15 months postintervention
Uusi-Rasi 2003 28 -2.73 (32.53) 22 -2.41 (34.06) 100.0 % -0.32 [ -18.97, 18.33 ]
Subtotal (95% CI) 28 22 100.0 % -0.32 [ -18.97, 18.33 ]
Heterogeneity: not applicable
Test for overall effect: Z = 0.03 (P = 0.97)
-20 -10 0 10 20
Favours bispohos Favours exercise+bisphos
Analysis 10.4. Comparison 10 Dynamic weight bearing exercise high force plus bisphosphonates versus
bisphosphonates, Outcome 4 Bone mineral content % change: distal tibia.
Review: Exercise for preventing and treating osteoporosis in postmenopausal women
Comparison: 10 Dynamic weight bearing exercise high force plus bisphosphonates versus bisphosphonates
Outcome: 4 Bone mineral content % change: distal tibia
Study or subgroup Exercise+bisphos BisphosMean
Difference WeightMean
Difference
N Mean(SD) N Mean(SD) IV,Fixed,95% CI IV,Fixed,95% CI
Uusi-Rasi 2003 38 0.41 (17.42) 38 0.23 (20.32) 100.0 % 0.18 [ -8.33, 8.69 ]
Total (95% CI) 38 38 100.0 % 0.18 [ -8.33, 8.69 ]
Heterogeneity: not applicable
Test for overall effect: Z = 0.04 (P = 0.97)
Test for subgroup differences: Not applicable
-100 -50 0 50 100
Favours bispohos Favours exercise+bisphos
142Exercise for preventing and treating osteoporosis in postmenopausal women (Review)
Copyright © 2011 The Cochrane Collaboration. Published by John Wiley & Sons, Ltd.
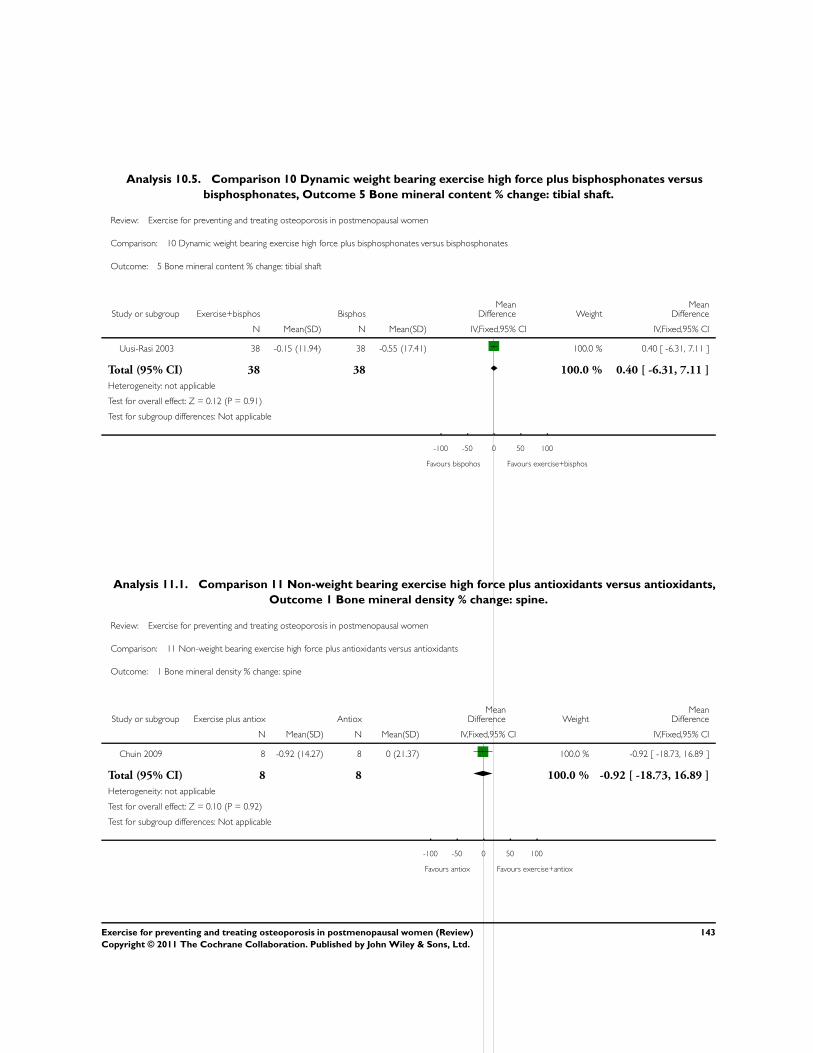
Analysis 10.5. Comparison 10 Dynamic weight bearing exercise high force plus bisphosphonates versus
bisphosphonates, Outcome 5 Bone mineral content % change: tibial shaft.
Review: Exercise for preventing and treating osteoporosis in postmenopausal women
Comparison: 10 Dynamic weight bearing exercise high force plus bisphosphonates versus bisphosphonates
Outcome: 5 Bone mineral content % change: tibial shaft
Study or subgroup Exercise+bisphos BisphosMean
Difference WeightMean
Difference
N Mean(SD) N Mean(SD) IV,Fixed,95% CI IV,Fixed,95% CI
Uusi-Rasi 2003 38 -0.15 (11.94) 38 -0.55 (17.41) 100.0 % 0.40 [ -6.31, 7.11 ]
Total (95% CI) 38 38 100.0 % 0.40 [ -6.31, 7.11 ]
Heterogeneity: not applicable
Test for overall effect: Z = 0.12 (P = 0.91)
Test for subgroup differences: Not applicable
-100 -50 0 50 100
Favours bispohos Favours exercise+bisphos
Analysis 11.1. Comparison 11 Non-weight bearing exercise high force plus antioxidants versus antioxidants,
Outcome 1 Bone mineral density % change: spine.
Review: Exercise for preventing and treating osteoporosis in postmenopausal women
Comparison: 11 Non-weight bearing exercise high force plus antioxidants versus antioxidants
Outcome: 1 Bone mineral density % change: spine
Study or subgroup Exercise plus antiox AntioxMean
Difference WeightMean
Difference
N Mean(SD) N Mean(SD) IV,Fixed,95% CI IV,Fixed,95% CI
Chuin 2009 8 -0.92 (14.27) 8 0 (21.37) 100.0 % -0.92 [ -18.73, 16.89 ]
Total (95% CI) 8 8 100.0 % -0.92 [ -18.73, 16.89 ]
Heterogeneity: not applicable
Test for overall effect: Z = 0.10 (P = 0.92)
Test for subgroup differences: Not applicable
-100 -50 0 50 100
Favours antiox Favours exercise+antiox
143Exercise for preventing and treating osteoporosis in postmenopausal women (Review)
Copyright © 2011 The Cochrane Collaboration. Published by John Wiley & Sons, Ltd.
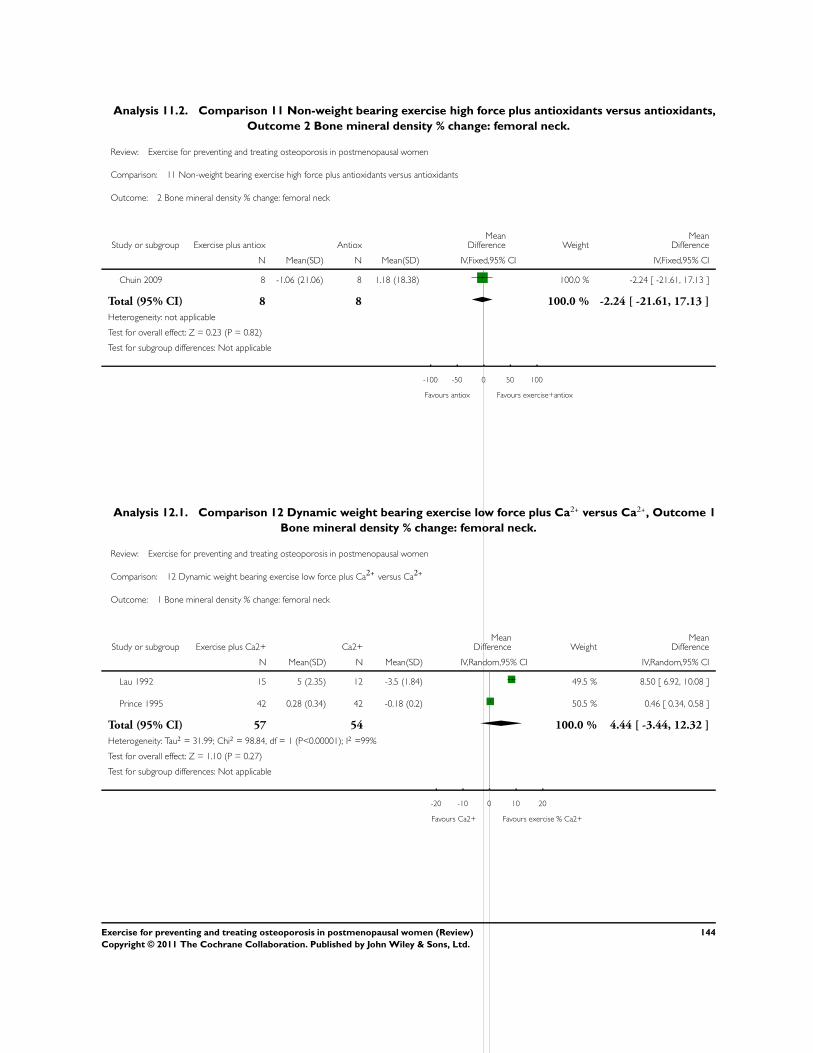
Analysis 11.2. Comparison 11 Non-weight bearing exercise high force plus antioxidants versus antioxidants,
Outcome 2 Bone mineral density % change: femoral neck.
Review: Exercise for preventing and treating osteoporosis in postmenopausal women
Comparison: 11 Non-weight bearing exercise high force plus antioxidants versus antioxidants
Outcome: 2 Bone mineral density % change: femoral neck
Study or subgroup Exercise plus antiox AntioxMean
Difference WeightMean
Difference
N Mean(SD) N Mean(SD) IV,Fixed,95% CI IV,Fixed,95% CI
Chuin 2009 8 -1.06 (21.06) 8 1.18 (18.38) 100.0 % -2.24 [ -21.61, 17.13 ]
Total (95% CI) 8 8 100.0 % -2.24 [ -21.61, 17.13 ]
Heterogeneity: not applicable
Test for overall effect: Z = 0.23 (P = 0.82)
Test for subgroup differences: Not applicable
-100 -50 0 50 100
Favours antiox Favours exercise+antiox
Analysis 12.1. Comparison 12 Dynamic weight bearing exercise low force plus Ca2+ versus Ca2+, Outcome 1
Bone mineral density % change: femoral neck.
Review: Exercise for preventing and treating osteoporosis in postmenopausal women
Comparison: 12 Dynamic weight bearing exercise low force plus Ca2+
versus Ca2+
Outcome: 1 Bone mineral density % change: femoral neck
Study or subgroup Exercise plus Ca2+ Ca2+Mean
Difference WeightMean
Difference
N Mean(SD) N Mean(SD) IV,Random,95% CI IV,Random,95% CI
Lau 1992 15 5 (2.35) 12 -3.5 (1.84) 49.5 % 8.50 [ 6.92, 10.08 ]
Prince 1995 42 0.28 (0.34) 42 -0.18 (0.2) 50.5 % 0.46 [ 0.34, 0.58 ]
Total (95% CI) 57 54 100.0 % 4.44 [ -3.44, 12.32 ]
Heterogeneity: Tau2 = 31.99; Chi2 = 98.84, df = 1 (P<0.00001); I2 =99%
Test for overall effect: Z = 1.10 (P = 0.27)
Test for subgroup differences: Not applicable
-20 -10 0 10 20
Favours Ca2+ Favours exercise % Ca2+
144Exercise for preventing and treating osteoporosis in postmenopausal women (Review)
Copyright © 2011 The Cochrane Collaboration. Published by John Wiley & Sons, Ltd.
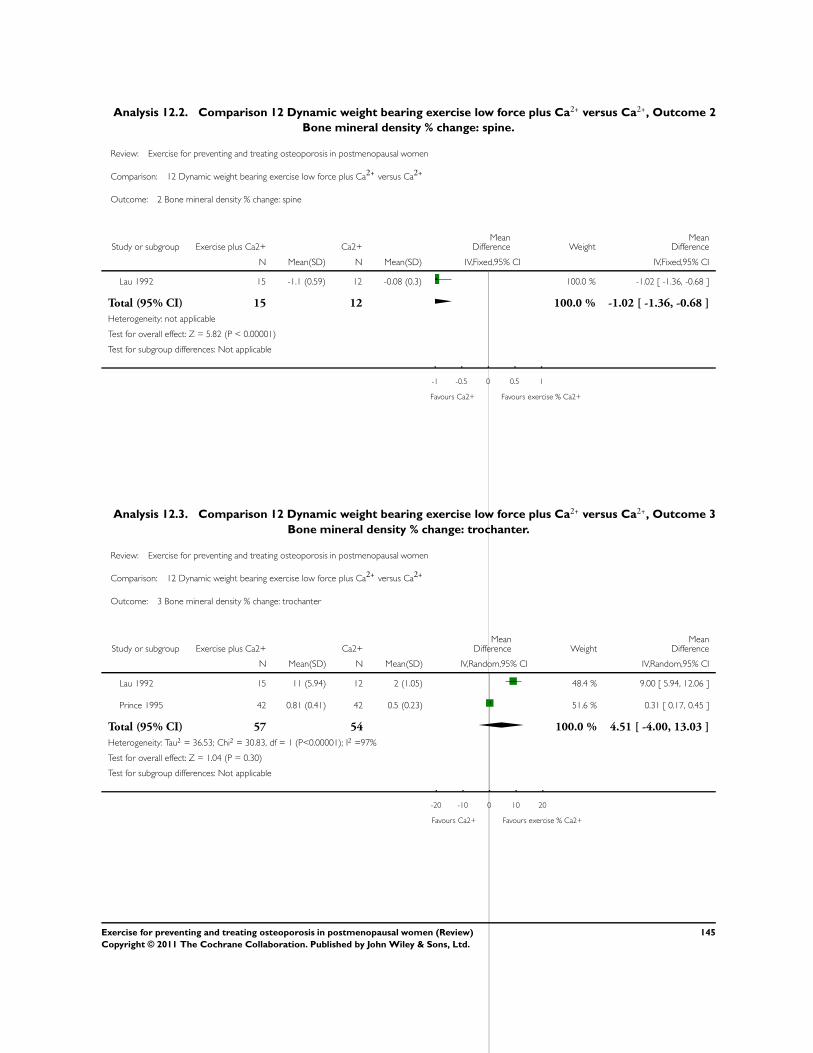
Analysis 12.2. Comparison 12 Dynamic weight bearing exercise low force plus Ca2+ versus Ca2+, Outcome 2
Bone mineral density % change: spine.
Review: Exercise for preventing and treating osteoporosis in postmenopausal women
Comparison: 12 Dynamic weight bearing exercise low force plus Ca2+
versus Ca2+
Outcome: 2 Bone mineral density % change: spine
Study or subgroup Exercise plus Ca2+ Ca2+Mean
Difference WeightMean
Difference
N Mean(SD) N Mean(SD) IV,Fixed,95% CI IV,Fixed,95% CI
Lau 1992 15 -1.1 (0.59) 12 -0.08 (0.3) 100.0 % -1.02 [ -1.36, -0.68 ]
Total (95% CI) 15 12 100.0 % -1.02 [ -1.36, -0.68 ]
Heterogeneity: not applicable
Test for overall effect: Z = 5.82 (P < 0.00001)
Test for subgroup differences: Not applicable
-1 -0.5 0 0.5 1
Favours Ca2+ Favours exercise % Ca2+
Analysis 12.3. Comparison 12 Dynamic weight bearing exercise low force plus Ca2+ versus Ca2+, Outcome 3
Bone mineral density % change: trochanter.
Review: Exercise for preventing and treating osteoporosis in postmenopausal women
Comparison: 12 Dynamic weight bearing exercise low force plus Ca2+
versus Ca2+
Outcome: 3 Bone mineral density % change: trochanter
Study or subgroup Exercise plus Ca2+ Ca2+Mean
Difference WeightMean
Difference
N Mean(SD) N Mean(SD) IV,Random,95% CI IV,Random,95% CI
Lau 1992 15 11 (5.94) 12 2 (1.05) 48.4 % 9.00 [ 5.94, 12.06 ]
Prince 1995 42 0.81 (0.41) 42 0.5 (0.23) 51.6 % 0.31 [ 0.17, 0.45 ]
Total (95% CI) 57 54 100.0 % 4.51 [ -4.00, 13.03 ]
Heterogeneity: Tau2 = 36.53; Chi2 = 30.83, df = 1 (P<0.00001); I2 =97%
Test for overall effect: Z = 1.04 (P = 0.30)
Test for subgroup differences: Not applicable
-20 -10 0 10 20
Favours Ca2+ Favours exercise % Ca2+
145Exercise for preventing and treating osteoporosis in postmenopausal women (Review)
Copyright © 2011 The Cochrane Collaboration. Published by John Wiley & Sons, Ltd.
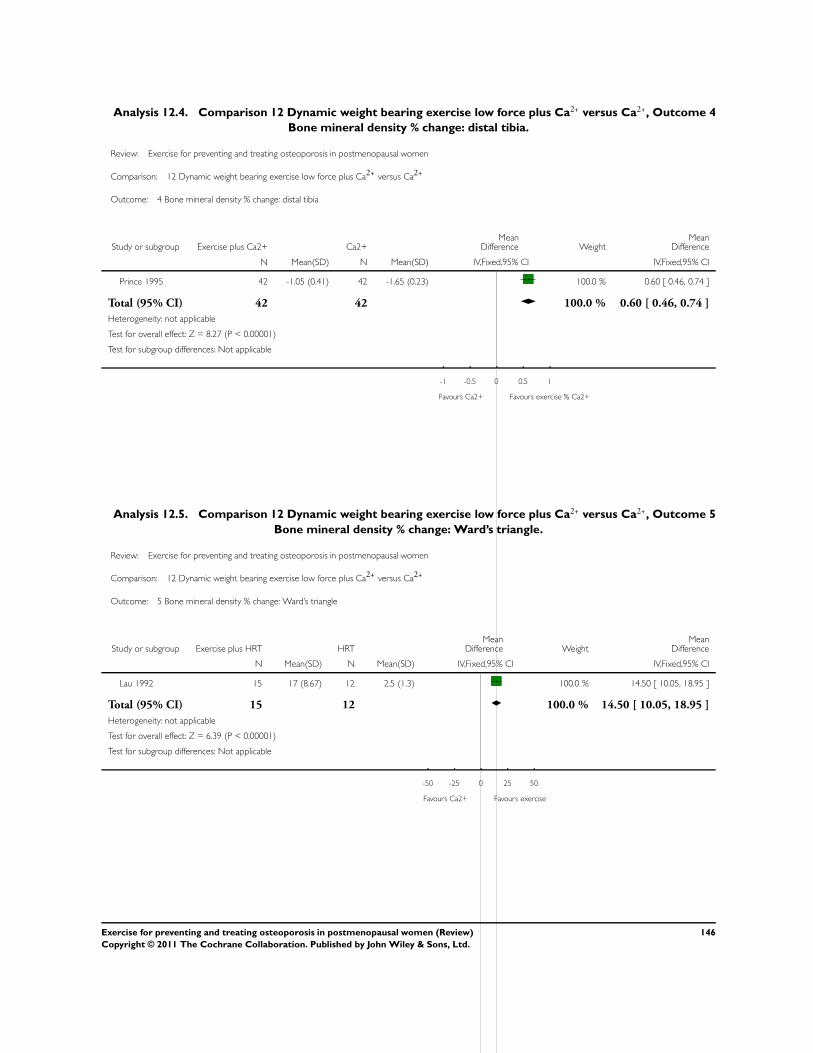
Analysis 12.4. Comparison 12 Dynamic weight bearing exercise low force plus Ca2+ versus Ca2+, Outcome 4
Bone mineral density % change: distal tibia.
Review: Exercise for preventing and treating osteoporosis in postmenopausal women
Comparison: 12 Dynamic weight bearing exercise low force plus Ca2+
versus Ca2+
Outcome: 4 Bone mineral density % change: distal tibia
Study or subgroup Exercise plus Ca2+ Ca2+Mean
Difference WeightMean
Difference
N Mean(SD) N Mean(SD) IV,Fixed,95% CI IV,Fixed,95% CI
Prince 1995 42 -1.05 (0.41) 42 -1.65 (0.23) 100.0 % 0.60 [ 0.46, 0.74 ]
Total (95% CI) 42 42 100.0 % 0.60 [ 0.46, 0.74 ]
Heterogeneity: not applicable
Test for overall effect: Z = 8.27 (P < 0.00001)
Test for subgroup differences: Not applicable
-1 -0.5 0 0.5 1
Favours Ca2+ Favours exercise % Ca2+
Analysis 12.5. Comparison 12 Dynamic weight bearing exercise low force plus Ca2+ versus Ca2+, Outcome 5
Bone mineral density % change: Ward’s triangle.
Review: Exercise for preventing and treating osteoporosis in postmenopausal women
Comparison: 12 Dynamic weight bearing exercise low force plus Ca2+
versus Ca2+
Outcome: 5 Bone mineral density % change: Ward’s triangle
Study or subgroup Exercise plus HRT HRTMean
Difference WeightMean
Difference
N Mean(SD) N Mean(SD) IV,Fixed,95% CI IV,Fixed,95% CI
Lau 1992 15 17 (8.67) 12 2.5 (1.3) 100.0 % 14.50 [ 10.05, 18.95 ]
Total (95% CI) 15 12 100.0 % 14.50 [ 10.05, 18.95 ]
Heterogeneity: not applicable
Test for overall effect: Z = 6.39 (P < 0.00001)
Test for subgroup differences: Not applicable
-50 -25 0 25 50
Favours Ca2+ Favours exercise
146Exercise for preventing and treating osteoporosis in postmenopausal women (Review)
Copyright © 2011 The Cochrane Collaboration. Published by John Wiley & Sons, Ltd.
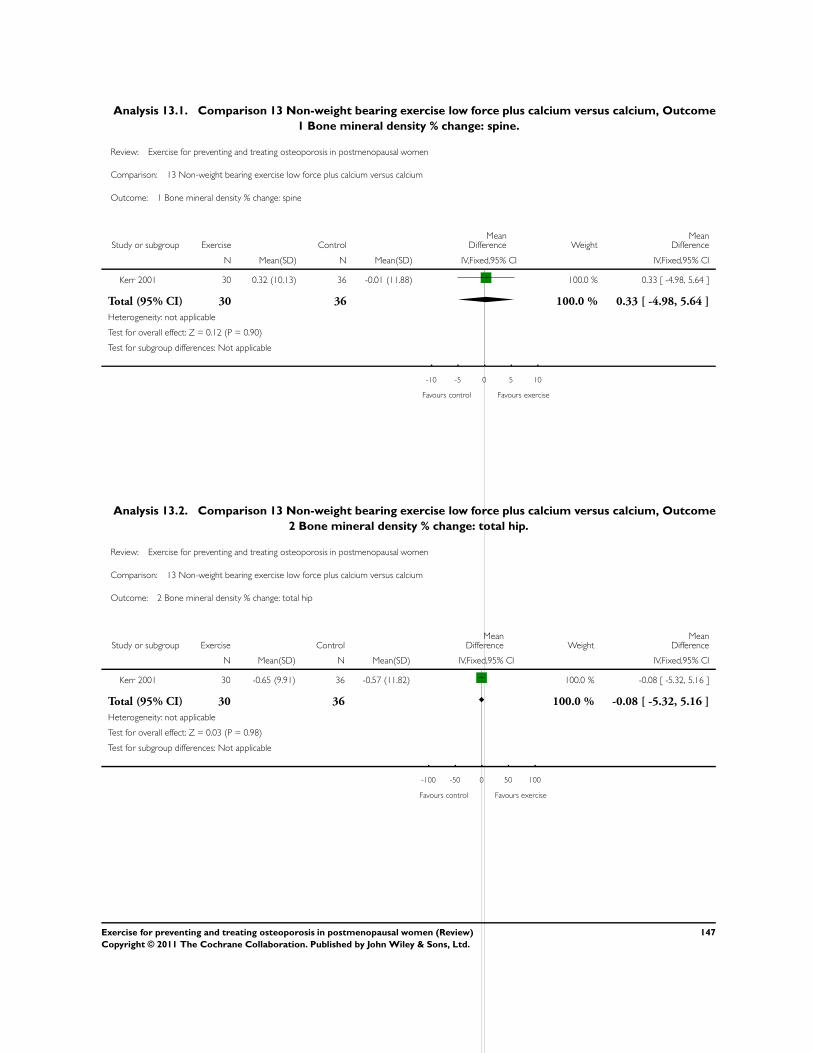
Analysis 13.1. Comparison 13 Non-weight bearing exercise low force plus calcium versus calcium, Outcome
1 Bone mineral density % change: spine.
Review: Exercise for preventing and treating osteoporosis in postmenopausal women
Comparison: 13 Non-weight bearing exercise low force plus calcium versus calcium
Outcome: 1 Bone mineral density % change: spine
Study or subgroup Exercise ControlMean
Difference WeightMean
Difference
N Mean(SD) N Mean(SD) IV,Fixed,95% CI IV,Fixed,95% CI
Kerr 2001 30 0.32 (10.13) 36 -0.01 (11.88) 100.0 % 0.33 [ -4.98, 5.64 ]
Total (95% CI) 30 36 100.0 % 0.33 [ -4.98, 5.64 ]
Heterogeneity: not applicable
Test for overall effect: Z = 0.12 (P = 0.90)
Test for subgroup differences: Not applicable
-10 -5 0 5 10
Favours control Favours exercise
Analysis 13.2. Comparison 13 Non-weight bearing exercise low force plus calcium versus calcium, Outcome
2 Bone mineral density % change: total hip.
Review: Exercise for preventing and treating osteoporosis in postmenopausal women
Comparison: 13 Non-weight bearing exercise low force plus calcium versus calcium
Outcome: 2 Bone mineral density % change: total hip
Study or subgroup Exercise ControlMean
Difference WeightMean
Difference
N Mean(SD) N Mean(SD) IV,Fixed,95% CI IV,Fixed,95% CI
Kerr 2001 30 -0.65 (9.91) 36 -0.57 (11.82) 100.0 % -0.08 [ -5.32, 5.16 ]
Total (95% CI) 30 36 100.0 % -0.08 [ -5.32, 5.16 ]
Heterogeneity: not applicable
Test for overall effect: Z = 0.03 (P = 0.98)
Test for subgroup differences: Not applicable
-100 -50 0 50 100
Favours control Favours exercise
147Exercise for preventing and treating osteoporosis in postmenopausal women (Review)
Copyright © 2011 The Cochrane Collaboration. Published by John Wiley & Sons, Ltd.
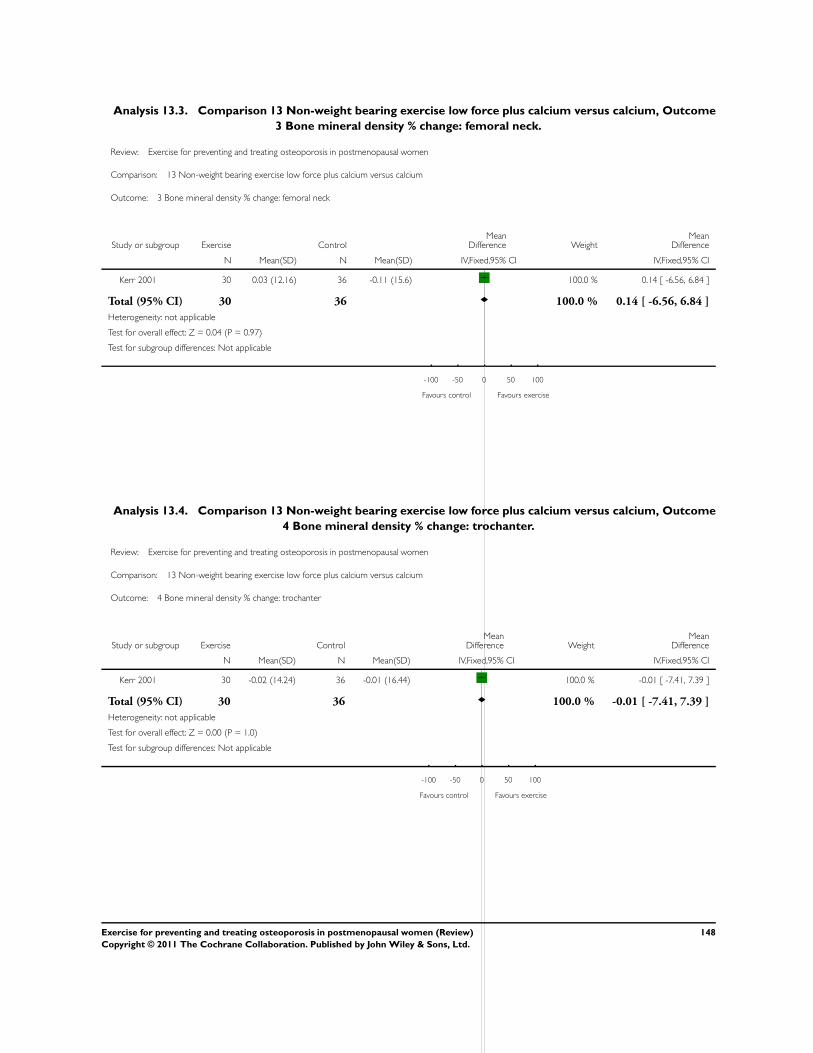
Analysis 13.3. Comparison 13 Non-weight bearing exercise low force plus calcium versus calcium, Outcome
3 Bone mineral density % change: femoral neck.
Review: Exercise for preventing and treating osteoporosis in postmenopausal women
Comparison: 13 Non-weight bearing exercise low force plus calcium versus calcium
Outcome: 3 Bone mineral density % change: femoral neck
Study or subgroup Exercise ControlMean
Difference WeightMean
Difference
N Mean(SD) N Mean(SD) IV,Fixed,95% CI IV,Fixed,95% CI
Kerr 2001 30 0.03 (12.16) 36 -0.11 (15.6) 100.0 % 0.14 [ -6.56, 6.84 ]
Total (95% CI) 30 36 100.0 % 0.14 [ -6.56, 6.84 ]
Heterogeneity: not applicable
Test for overall effect: Z = 0.04 (P = 0.97)
Test for subgroup differences: Not applicable
-100 -50 0 50 100
Favours control Favours exercise
Analysis 13.4. Comparison 13 Non-weight bearing exercise low force plus calcium versus calcium, Outcome
4 Bone mineral density % change: trochanter.
Review: Exercise for preventing and treating osteoporosis in postmenopausal women
Comparison: 13 Non-weight bearing exercise low force plus calcium versus calcium
Outcome: 4 Bone mineral density % change: trochanter
Study or subgroup Exercise ControlMean
Difference WeightMean
Difference
N Mean(SD) N Mean(SD) IV,Fixed,95% CI IV,Fixed,95% CI
Kerr 2001 30 -0.02 (14.24) 36 -0.01 (16.44) 100.0 % -0.01 [ -7.41, 7.39 ]
Total (95% CI) 30 36 100.0 % -0.01 [ -7.41, 7.39 ]
Heterogeneity: not applicable
Test for overall effect: Z = 0.00 (P = 1.0)
Test for subgroup differences: Not applicable
-100 -50 0 50 100
Favours control Favours exercise
148Exercise for preventing and treating osteoporosis in postmenopausal women (Review)
Copyright © 2011 The Cochrane Collaboration. Published by John Wiley & Sons, Ltd.
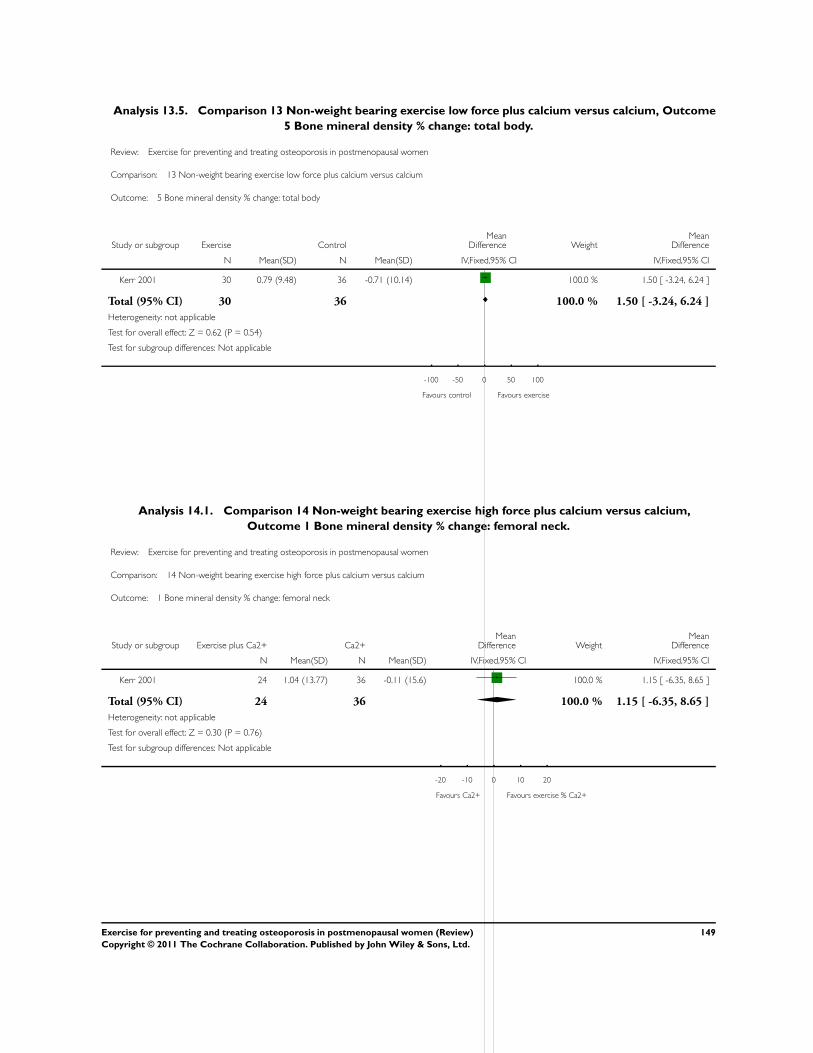
Analysis 13.5. Comparison 13 Non-weight bearing exercise low force plus calcium versus calcium, Outcome
5 Bone mineral density % change: total body.
Review: Exercise for preventing and treating osteoporosis in postmenopausal women
Comparison: 13 Non-weight bearing exercise low force plus calcium versus calcium
Outcome: 5 Bone mineral density % change: total body
Study or subgroup Exercise ControlMean
Difference WeightMean
Difference
N Mean(SD) N Mean(SD) IV,Fixed,95% CI IV,Fixed,95% CI
Kerr 2001 30 0.79 (9.48) 36 -0.71 (10.14) 100.0 % 1.50 [ -3.24, 6.24 ]
Total (95% CI) 30 36 100.0 % 1.50 [ -3.24, 6.24 ]
Heterogeneity: not applicable
Test for overall effect: Z = 0.62 (P = 0.54)
Test for subgroup differences: Not applicable
-100 -50 0 50 100
Favours control Favours exercise
Analysis 14.1. Comparison 14 Non-weight bearing exercise high force plus calcium versus calcium,
Outcome 1 Bone mineral density % change: femoral neck.
Review: Exercise for preventing and treating osteoporosis in postmenopausal women
Comparison: 14 Non-weight bearing exercise high force plus calcium versus calcium
Outcome: 1 Bone mineral density % change: femoral neck
Study or subgroup Exercise plus Ca2+ Ca2+Mean
Difference WeightMean
Difference
N Mean(SD) N Mean(SD) IV,Fixed,95% CI IV,Fixed,95% CI
Kerr 2001 24 1.04 (13.77) 36 -0.11 (15.6) 100.0 % 1.15 [ -6.35, 8.65 ]
Total (95% CI) 24 36 100.0 % 1.15 [ -6.35, 8.65 ]
Heterogeneity: not applicable
Test for overall effect: Z = 0.30 (P = 0.76)
Test for subgroup differences: Not applicable
-20 -10 0 10 20
Favours Ca2+ Favours exercise % Ca2+
149Exercise for preventing and treating osteoporosis in postmenopausal women (Review)
Copyright © 2011 The Cochrane Collaboration. Published by John Wiley & Sons, Ltd.
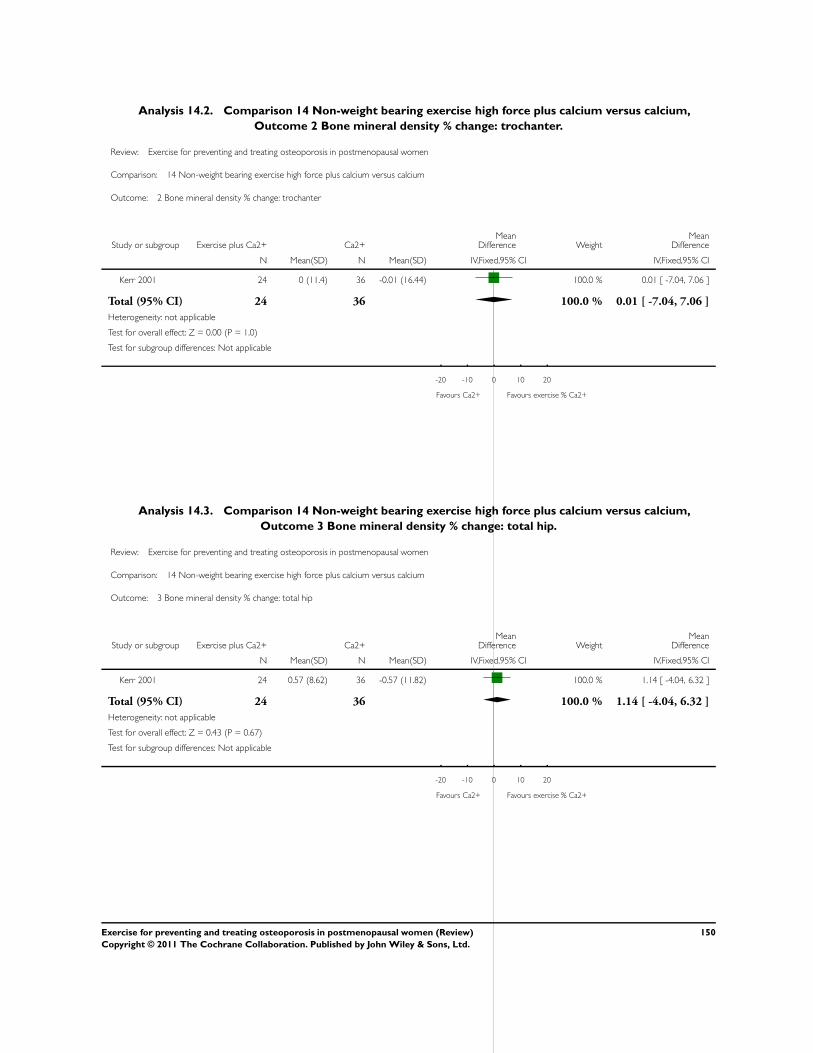
Analysis 14.2. Comparison 14 Non-weight bearing exercise high force plus calcium versus calcium,
Outcome 2 Bone mineral density % change: trochanter.
Review: Exercise for preventing and treating osteoporosis in postmenopausal women
Comparison: 14 Non-weight bearing exercise high force plus calcium versus calcium
Outcome: 2 Bone mineral density % change: trochanter
Study or subgroup Exercise plus Ca2+ Ca2+Mean
Difference WeightMean
Difference
N Mean(SD) N Mean(SD) IV,Fixed,95% CI IV,Fixed,95% CI
Kerr 2001 24 0 (11.4) 36 -0.01 (16.44) 100.0 % 0.01 [ -7.04, 7.06 ]
Total (95% CI) 24 36 100.0 % 0.01 [ -7.04, 7.06 ]
Heterogeneity: not applicable
Test for overall effect: Z = 0.00 (P = 1.0)
Test for subgroup differences: Not applicable
-20 -10 0 10 20
Favours Ca2+ Favours exercise % Ca2+
Analysis 14.3. Comparison 14 Non-weight bearing exercise high force plus calcium versus calcium,
Outcome 3 Bone mineral density % change: total hip.
Review: Exercise for preventing and treating osteoporosis in postmenopausal women
Comparison: 14 Non-weight bearing exercise high force plus calcium versus calcium
Outcome: 3 Bone mineral density % change: total hip
Study or subgroup Exercise plus Ca2+ Ca2+Mean
Difference WeightMean
Difference
N Mean(SD) N Mean(SD) IV,Fixed,95% CI IV,Fixed,95% CI
Kerr 2001 24 0.57 (8.62) 36 -0.57 (11.82) 100.0 % 1.14 [ -4.04, 6.32 ]
Total (95% CI) 24 36 100.0 % 1.14 [ -4.04, 6.32 ]
Heterogeneity: not applicable
Test for overall effect: Z = 0.43 (P = 0.67)
Test for subgroup differences: Not applicable
-20 -10 0 10 20
Favours Ca2+ Favours exercise % Ca2+
150Exercise for preventing and treating osteoporosis in postmenopausal women (Review)
Copyright © 2011 The Cochrane Collaboration. Published by John Wiley & Sons, Ltd.
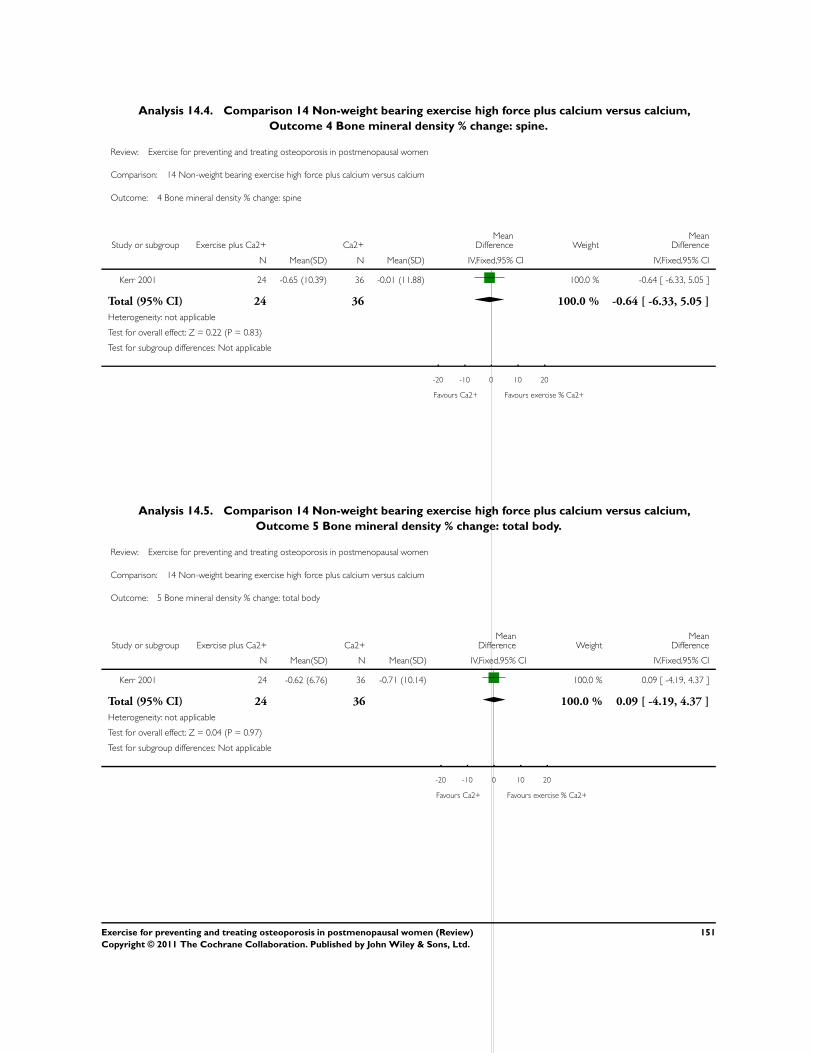
Analysis 14.4. Comparison 14 Non-weight bearing exercise high force plus calcium versus calcium,
Outcome 4 Bone mineral density % change: spine.
Review: Exercise for preventing and treating osteoporosis in postmenopausal women
Comparison: 14 Non-weight bearing exercise high force plus calcium versus calcium
Outcome: 4 Bone mineral density % change: spine
Study or subgroup Exercise plus Ca2+ Ca2+Mean
Difference WeightMean
Difference
N Mean(SD) N Mean(SD) IV,Fixed,95% CI IV,Fixed,95% CI
Kerr 2001 24 -0.65 (10.39) 36 -0.01 (11.88) 100.0 % -0.64 [ -6.33, 5.05 ]
Total (95% CI) 24 36 100.0 % -0.64 [ -6.33, 5.05 ]
Heterogeneity: not applicable
Test for overall effect: Z = 0.22 (P = 0.83)
Test for subgroup differences: Not applicable
-20 -10 0 10 20
Favours Ca2+ Favours exercise % Ca2+
Analysis 14.5. Comparison 14 Non-weight bearing exercise high force plus calcium versus calcium,
Outcome 5 Bone mineral density % change: total body.
Review: Exercise for preventing and treating osteoporosis in postmenopausal women
Comparison: 14 Non-weight bearing exercise high force plus calcium versus calcium
Outcome: 5 Bone mineral density % change: total body
Study or subgroup Exercise plus Ca2+ Ca2+Mean
Difference WeightMean
Difference
N Mean(SD) N Mean(SD) IV,Fixed,95% CI IV,Fixed,95% CI
Kerr 2001 24 -0.62 (6.76) 36 -0.71 (10.14) 100.0 % 0.09 [ -4.19, 4.37 ]
Total (95% CI) 24 36 100.0 % 0.09 [ -4.19, 4.37 ]
Heterogeneity: not applicable
Test for overall effect: Z = 0.04 (P = 0.97)
Test for subgroup differences: Not applicable
-20 -10 0 10 20
Favours Ca2+ Favours exercise % Ca2+
151Exercise for preventing and treating osteoporosis in postmenopausal women (Review)
Copyright © 2011 The Cochrane Collaboration. Published by John Wiley & Sons, Ltd.
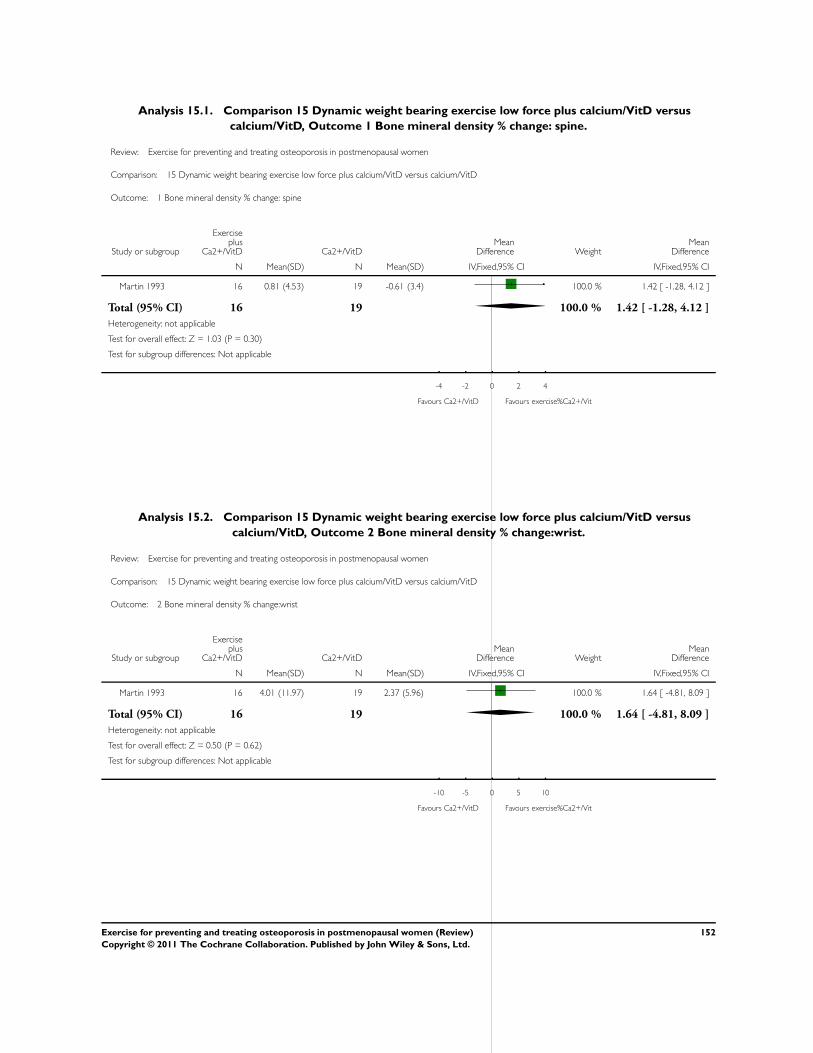
Analysis 15.1. Comparison 15 Dynamic weight bearing exercise low force plus calcium/VitD versus
calcium/VitD, Outcome 1 Bone mineral density % change: spine.
Review: Exercise for preventing and treating osteoporosis in postmenopausal women
Comparison: 15 Dynamic weight bearing exercise low force plus calcium/VitD versus calcium/VitD
Outcome: 1 Bone mineral density % change: spine
Study or subgroup
Exerciseplus
Ca2+/VitD Ca2+/VitDMean
Difference WeightMean
Difference
N Mean(SD) N Mean(SD) IV,Fixed,95% CI IV,Fixed,95% CI
Martin 1993 16 0.81 (4.53) 19 -0.61 (3.4) 100.0 % 1.42 [ -1.28, 4.12 ]
Total (95% CI) 16 19 100.0 % 1.42 [ -1.28, 4.12 ]
Heterogeneity: not applicable
Test for overall effect: Z = 1.03 (P = 0.30)
Test for subgroup differences: Not applicable
-4 -2 0 2 4
Favours Ca2+/VitD Favours exercise%Ca2+/Vit
Analysis 15.2. Comparison 15 Dynamic weight bearing exercise low force plus calcium/VitD versus
calcium/VitD, Outcome 2 Bone mineral density % change:wrist.
Review: Exercise for preventing and treating osteoporosis in postmenopausal women
Comparison: 15 Dynamic weight bearing exercise low force plus calcium/VitD versus calcium/VitD
Outcome: 2 Bone mineral density % change:wrist
Study or subgroup
Exerciseplus
Ca2+/VitD Ca2+/VitDMean
Difference WeightMean
Difference
N Mean(SD) N Mean(SD) IV,Fixed,95% CI IV,Fixed,95% CI
Martin 1993 16 4.01 (11.97) 19 2.37 (5.96) 100.0 % 1.64 [ -4.81, 8.09 ]
Total (95% CI) 16 19 100.0 % 1.64 [ -4.81, 8.09 ]
Heterogeneity: not applicable
Test for overall effect: Z = 0.50 (P = 0.62)
Test for subgroup differences: Not applicable
-10 -5 0 5 10
Favours Ca2+/VitD Favours exercise%Ca2+/Vit
152Exercise for preventing and treating osteoporosis in postmenopausal women (Review)
Copyright © 2011 The Cochrane Collaboration. Published by John Wiley & Sons, Ltd.
A P P E N D I C E S
Appendix 1. MEDLINE search strategy
MEDLINE (searched 10/12/2010)
1 osteoporosis/
2 osteoporo$.mp.
3 osteopenia.mp.
4 bone density/
5 bone densit$.mp.
6 exp “bone and bones”/
7 bone loss$.mp.
8 bone mass$.mp.
9 bone mineral densit$.mp.
10 bone mineral content$.mp.
11 bone age.mp.
12 bone defect$.mp.
13 bone deminerali?ation.mp.
14 bone mineral$.mp.
15 bone strength.mp.
16 decalcifi$.mp.
17 deminerali?ed bone.mp.
18 or/1-17
19 randomized controlled trial.pt.
20 controlled clinical trial.pt.
21 randomi?ed.ab.
22 placebo.ab.
23 clinical trials as topic.sh.
24 randomly.ab.
25 trial.ti.
26 or/19-25
27 (animals not (humans and animals)).sh.
28 26 not 27
29 exp exercise/
30 exp exercise therapy/
31 exerci$.mp.
32 exp sports/
33 sport$.mp.
34 physical fitness/
35 physical fitness.mp.
36 physical activit$.mp.
37 vibration/tu
38 vibration therap$.mp.
39 or/29-38
40 exp menopause/
41 (menopaus$ or postmenopaus$ or post-menopaus$ or (post adj menopause$)).mp.
42 or/40-41
43 18 and 28 and 39 and 42
44 limit 43 to yr=“2000-Current”
153Exercise for preventing and treating osteoporosis in postmenopausal women (Review)
Copyright © 2011 The Cochrane Collaboration. Published by John Wiley & Sons, Ltd.
Appendix 2. EMBASE search strategy
EMBASE (searched 10/12/2010)
1 osteoporosis/
2 osteoporo$.mp.
3 osteopenia.mp.
4 bone density/
5 bone mass/
6 bone densit$.mp.
7 exp bone/
8 bone loss$.mp.
9 bone mass$.mp.
10 bone mineral/
11 bone mineral densit$.mp.
12 bone mineral content$.mp.
13 or/1-12
14 Randomized Controlled Trial/
15 Double Blind Procedure/
16 Single Blind Procedure/
17 Triple Blind Procedure/
18 randomi?ed.ti,ab.
19 randomisation/
20 Placebo/
21 placebo$.mp.
22 ((controlled or comparative or placebo or randomi?ed) adj3 (trial or study)).mp.
23 (random$ adj7 (allocat$ or allot$ or assign$ or basis$ or divid$ or order$)).mp.
24 ((singl$ or doubl$ or trebl$ or tripl$) adj7 (blind$ or mask$)).mp.
25 or/14-24
26 limit 25 to human
27 exp exercise/
28 exp sport/
29 fitness/
30 exp physical activity/
31 sport$.mp.
32 exercis$.mp.
33 physical fitness.mp.
34 physical activit$.mp.
35 vibration therapy/
36 vibration therap$.mp.
37 or/27-36
38 postmenopause/
39 postmenopause osteoporosis/
40 menopause/
41 (menopaus$ or postmenopaus$ or post-menopaus$ or (post adj menopause$)).mp.
42 or/38-41
43 42 and 37 and 26 and 13
44 limit 43 to yr=“2000 -Current”
154Exercise for preventing and treating osteoporosis in postmenopausal women (Review)
Copyright © 2011 The Cochrane Collaboration. Published by John Wiley & Sons, Ltd.
Appendix 3. CINAHL search strategy
CINAHL (Searched 17/12/2010)
1 (MH “Osteoporosis+”)
2 TI osteoporosis OR AB osteoporosis
3 TI osteopenia OR AB osteopenia
4 MH bone density
5 TI bone densit* OR AB bone densit*
6 (MH “Bone and Bones+”)
7 TI bone loss* OR AB bone loss*
8 TI bone mass* OR AB bone mass*
9 TI bone mineral densit* OR AB bone mineral densit*
10 TI bone mineral content* OR AB bone mineral content*
11 TI bone age OR AB bone age
12 TI bone defect* OR AB bone defect*
13 TI bone deminerali?ation OR AB bone deminerali?ation
14 TI bone mineral* OR AB bone mineral*
15 TI bone strength OR AB bone strength
16 TI decalcifi* OR AB decalcifi*
17 TI deminerali?ed bone OR AB deminerali?ed bone
18 S1 or S2 or S3 or S4 or S5 or S6 or S7 or S8 or S9 or S10 or S11 or S12 or S13 or S14 or S15 or S16 or S17
19 (MH “double-blind studies”)
20 (MH “single-blind studies”)
21 (MH “triple-blind studies”)
22 TI randomi?ed OR AB randomi?ed
23 (MH “random assignment”)
24 (MH “crossover design”)
25 (MH “placebos”)
26 TI placebo* OR AB placebo*
27 TI controlled N3 trial OR TI controlled N3 study OR TI comparative N3 trial OR TI comparative N3 study OR TI placebo
N3 trial OR TI placebo N3 study OR TI randomi?ed N3 trial OR TI randomi?ed N3 study
28 AB controlled N3 trial OR AB controlled N3 study OR AB comparative N3 trial OR AB comparative N3 study OR AB
placebo N3 trial OR AB placebo N3 study OR AB randomi?ed N3 trial OR AB randomi?ed N3 study
29 TI random* N7 allocat* OR TI random* N7 allot* OR TI random* N7 assign* OR TI random* N7 basis* OR TI random*
N7 divid* OR TI random* N7 order*
30 AB random* N7 allocat* OR AB random* N7 allot* OR AB random* N7 assign* OR AB random* N7 basis* OR AB
random* N7 divid* OR AB random* N7 order*
31 TI singl* N7 blind* OR TI doubl* N7 blind* OR TI trebl* N7 blind* OR TI tripl* N7 blind* OR TI singl* N7 mask* OR
TI doubl* N7 mask* OR TI trebl* N7 mask* OR TI tripl* N7 mask*
32 AB singl* N7 blind* OR AB doubl* N7 blind* OR AB trebl* N7 blind* OR AB tripl* N7 blind* OR AB singl* N7 mask*
OR AB doubl* N7 mask* OR AB trebl* N7 mask* OR AB tripl* N7 mask*
33 S19 or S20 or S21 or S22 or S23 or S24 or S25 or S26 or S27 or S28 or S29 or S30 or S31 or S32
34 (MH “animals”)
35 33 not 34
36 (MH “exercise+”)
37 TI exerci* OR AB exerci*
38 (MH “sports+”)
39 TI sport* OR AB sport*
40 MH “physical fitness+”
41 MH physical activity
42 TI physical fitness OR AB physical fitness
43 TI physical activit* OR AB physical activit*
44 MH vibration/tu
155Exercise for preventing and treating osteoporosis in postmenopausal women (Review)
Copyright © 2011 The Cochrane Collaboration. Published by John Wiley & Sons, Ltd.
45 TI vibration therap* OR AB vibration therap*
46 S36 or S37 or S38 or S39 or S40 or S41 or S42 or S43 or S44 or S45
47 MH menopause
48 MH postmenopause
49 TI menopaus* OR AB menopaus* OR TI post-menopaus* OR AB post-menopaus* OR TI postmenopaus* OR AB
postmenopaus* OR TI post N1 menopaus* OR AB post N1 menopaus*
50 S47 OR S48 OR S49
51 S18 AND S35 AND S46 AND S50
52 S18 AND S35 AND S46 AND S50 Limiters - Published Date from: 20000101-20101231
Appendix 4. PEDro keyword and text word search strategy
PEDro (Searched December 15, 2010)
Search 1
Osteoporo* or bone in Abstract & Title AND
Fitness training in Therapy
Search 2
Osteoporo* or bone in Abstract & Title AND
Strength training in Therapy
Appendix 5. CCTR search strategy
CCTR (Searched 10/12/2010)
1 osteoporosis/
2 osteoporo$.mp.
3 osteopenia.mp.
4 bone density/
5 bone densit$.mp.
6 exp “bone and bones”/
7 bone loss$.mp.
8 bone mass$.mp.
9 bone mineral densit$.mp.
10 bone mineral content$.mp.
11 bone age.mp.
12 bone defect$.mp.
13 bone deminerali?ation.mp.
14 bone mineral$.mp.
15 bone strength.mp.
16 decalcifi$.mp.
17 deminerali?ed bone.mp.
18 or/1-17
19 randomized controlled trial.pt.
20 controlled clinical trial.pt.
21 randomi?ed.ab.
22 placebo.ab.
23 clinical trials as topic.sh.
156Exercise for preventing and treating osteoporosis in postmenopausal women (Review)
Copyright © 2011 The Cochrane Collaboration. Published by John Wiley & Sons, Ltd.
24 randomly.ab.
25 trial.ti.
26 or/19-25
27 animals/
28 26 not 27
29 exp exercise/
30 exp exercise therapy/
31 exerci$.mp.
32 exp sports/
33 sport$.mp.
34 physical fitness/
35 physical fitness.mp.
36 physical activit$.mp.
37 vibration/tu
38 vibration therap$.mp.
39 or/29-38
40 exp menopause/
41 (menopaus$ or postmenopaus$ or post-menopaus$ or (post adj menopause$)).mp.
42 or/40-41
43 18 and 28 and 39 and 42
44 limit 43 to yr=“2000-Current”
Appendix 6. AMED search strategy
AMED (Searched 10/12/2010)
1 osteoporosis/
2 osteoporo$.mp.
3 osteopenia.mp.
4 bone density/
5 bone densit$.mp.
6 exp bones/
7 bone loss$.mp.
8 bone mass$.mp.
9 bone mineral densit$.mp.
10 bone mineral content$.mp.
11 or/1-10
12 randomized controlled trial.pt.
13 controlled clinical trial.pt.
14 randomi?ed.ti,ab.
15 Placebos/
16 placebo$.ti,ab.
17 double-blind method/
18 single-blind method/
19 random allocation/
20 ((controlled or comparative or placebo or randomi?ed) adj3 (trial or study)).mp.
21 (random$ adj7 (allocat$ or allot$ or assign$ or basis$ or divid$ or order$)).mp.
22 ((singl$ or doubl$ or trebl$ or tripl$) adj7 (blind$ or mask$)).mp.
23 or/12-22
24 animals/
25 23 not 24
26 exp exercise/
27 exp Sports/
157Exercise for preventing and treating osteoporosis in postmenopausal women (Review)
Copyright © 2011 The Cochrane Collaboration. Published by John Wiley & Sons, Ltd.
28 Physical Fitness/
29 sport$.mp.
30 exerci$.mp.
31 physical fitness.mp.
32 physical activit$.mp.
33 vibration/
34 vibration therapy.mp.
35 or/26-34
36 exp menopause/
37 (menopaus$ or postmenopaus$ or post-menopaus$ or (post adj menopause$)).mp.
38 or/36-37
39 11 and 25 and 35 and 38
40 limit 39 to yr=“2000-Current”
W H A T ’ S N E W
Last assessed as up-to-date: 2 January 2011.
Date Event Description
17 May 2011 New search has been performed The methodology has been updated to include risk of bias
and summary of findings tables. The exercise interventions
have been re-categorised which included reclassification of
interventions from the original studies. The search was up-
dated to include vibrations plates and included all studies up
to Jan 2011. Of the 43 included studies 27 are new stud-
ies; and on further scrutiny of the included studies from
the original version one was excluded and a further study
was actually follow-up data for another included study. New
comparisons are based on the reclassification of exercise cat-
egories. All analyses are new, based on the new categories of
exercise interventions and the conclusions have changed
17 May 2011 New citation required and conclusions have changed This review update involves new authors and conclusions
have changed
H I S T O R Y
Protocol first published: Issue 3, 1997
Review first published: Issue 3, 2002
158Exercise for preventing and treating osteoporosis in postmenopausal women (Review)
Copyright © 2011 The Cochrane Collaboration. Published by John Wiley & Sons, Ltd.
Date Event Description
27 September 2008 Amended Converted to new review format.
CMSG ID: C035-R
C O N T R I B U T I O N S O F A U T H O R S
TEH - designed and reviewed the protocol for the updated review; extracted and entered data and assessed quality; conducted
methodological analysis; and wrote and reviewed the manuscript.
BS - designed and reviewed the protocol for the review; extracted data and assessed quality; conducted methodological analysis; and
wrote and reviewed the manuscript.
LD - applied the inclusion and exclusion criteria for accepting studies in the review; classified the studies; helped with classifying the
interventions; extracted and entered data and assessed quality; and contributed to and reviewed the manuscript.
FD - applied the inclusion and exclusion criteria for accepting studies in the review; classified the studies; helped with classifying the
interventions; extracted data and assessed quality; and contributed to and reviewed the manuscript.
AM - applied the inclusion and exclusion criteria for accepting studies in the review; classified the studies; helped with classifying the
interventions; extracted data and assessed quality; and contributed to and reviewed the manuscript.
CR - applied the inclusion and exclusion criteria for accepting studies into the review; classified the studies; helped with classifying the
interventions; extracted data and assessed quality; and provided critical comments on drafts of the review.
RH - contributed methodological expertise and reviewed early drafts of the document.
LC - wrote the search strategies and identified the literature.
GS - applied the inclusion and exclusion criteria for accepting studies into the review; classified the studies; helped with classifying the
interventions; extracted data and assessed quality; and reviewed earlier drafts of the review; provided translation into English.
D E C L A R A T I O N S O F I N T E R E S T
None known
S O U R C E S O F S U P P O R T
Internal sources
• University of Ottawa, Canada.
• Clinical Epidemiology Unit, Ottawa Hospital, Civic Campus, Canada.
• Institute of Population Health, Canada.
• Glasgow Caledonian University, UK.
159Exercise for preventing and treating osteoporosis in postmenopausal women (Review)
Copyright © 2011 The Cochrane Collaboration. Published by John Wiley & Sons, Ltd.
External sources
• The Chartered Society of Physiotherapy, UK.
• National Institute for Health Research, UK.
Cochrane Incentive Award 2010
I N D E X T E R M S
Medical Subject Headings (MeSH)
∗Exercise [physiology]; Bone Density [physiology]; Fractures, Bone [∗prevention & control; therapy]; Osteoporosis, Postmenopausal
[∗prevention & control; therapy]; Randomized Controlled Trials as Topic
MeSH check words
Female; Humans
160Exercise for preventing and treating osteoporosis in postmenopausal women (Review)
Copyright © 2011 The Cochrane Collaboration. Published by John Wiley & Sons, Ltd.