![The Actin Cytoskeleton: Functional Arrays forUpdate on the Actin Cytoskeleton The Actin Cytoskeleton: Functional Arrays for Cytoplasmic Organization and Cell Shape Control1[OPEN] Dan](https://static.fdocuments.us/doc/165x107/5f0830197e708231d420c69d/the-actin-cytoskeleton-functional-arrays-update-on-the-actin-cytoskeleton-the-actin.jpg)
The Role of the Actin Cytoskeleton in Asymmetric Cell ...
46
APPROVED: Amanda J. Wright, Major Professor Robert Benjamin, Committee Member Stevens Brumbley, Committee Member Art Goven, Chair of the Department of Biological Sciences Mark Wardell, Dean of the Toulouse Graduate School THE ROLE OF THE ACTIN CYTOSKELETON IN ASYMMETRIC CELL DIVISION IN MAIZE Hassan Hamdan Alhassan Thesis Prepared for the Degree of MASTER OF SCIENCE UNIVERSITY OF NORTH TEXAS August 2014
Transcript of The Role of the Actin Cytoskeleton in Asymmetric Cell ...

APPROVED:
Amanda J. Wright, Major Professor Robert Benjamin, Committee Member Stevens Brumbley, Committee Member Art Goven, Chair of the Department of
Biological Sciences Mark Wardell, Dean of the Toulouse Graduate
School
THE ROLE OF THE ACTIN CYTOSKELETON IN ASYMMETRIC CELL DIVISION IN MAIZE
Hassan Hamdan Alhassan
Thesis Prepared for the Degree of
MASTER OF SCIENCE
UNIVERSITY OF NORTH TEXAS
August 2014
Alhassan, Hassan Hamdan. The Role of the Actin Cytoskeleton in Asymmetric Cell Division
in Maize. Master of Science (Biochemistry and Molecular Biology), August 2014, 39 pp., 6
tables, 12 figures, references, 29 titles.
Stomata are specialized plant structures required for gaseous exchange with the outer
environment. During stomata formation, the cytoskeleton plays an important role in controlling
the division of the individual cells leading to the generation of the stomata complex. Two
mutants that affect microfilament and microtubule organization in subsidiary mother cells
include brk1 and dcd1. While only 20% of the subsidiary cells in the brk1 and dcd1 single
mutants are abnormally shaped, it was reported that there is a synergistic effect between the
brk1 and dcd1 mutations in the brk1; dcd1 double mutant since 100% of the subsidiary cells are
abnormal. The focus of this research is to try to understand this synergistic effect by
investigating the actin cytoskeleton and nuclear position in the single and double mutants.
The reported results include the observation that the size of actin patch was largest in
the wild-type subsidiary mother cells (SMCs) and smallest in dcd1 and brk1; dcd1 SMCs and that
brk1 and brk1; dcd1 double mutants had fewer actin patches than wild-type and dcd1 SMCs.
Additionally, we observed that some SMCs that did not have actin patches still underwent
nuclear migration suggesting that nuclear migration may not be solely dependent on actin
patch formation. Finally, during SMC cytokinesis, a large percentage of double mutant (brk1;
dcd1) cells showed an off-track development of the phragmoplast as compared to the single
mutants and the wild-type plant explaining the large number of abnormally shaped subsidiary
cells in the double mutants.

ii
Copyright 2014
By
Hassan Hamdan Alhassan

iii
ACKNOWLEDGMENTS
First of all I would like to acknowledge and thank Dr. Wright for all her support both
mentally and technically. You have truly been an inspiration to me for the hard work and
dedication you taught me. I would also like to extend a special thanks to Dr. Lon for all the help
he gave me working on the confocal microscope. I would never have been able to do the work I
have done without his help and mentorship. I would like also to thank my committee members.
Above all, I would like to thank my wife and daughter for the support and inspiration
that I draw from them. I have done all this work for them. I would like to also thank my parents
for their patience and inspiration. Without their encouragement I would not been able to pull
through all the hours that I have put in in order to complete this work on time.
I would also like to give my special thanks to all my friends and family for all the
encouragement that I got and for the help they provided. One truly can’t go on in this life
without people to relay on, so special thanks to everyone who has crossed my path during my
studies and affected me in a way or another.

iv
TABLE OF CONTENTS
Page
ACKNOWLEDGMENTS ..................................................................................................................... iii LIST OF TABLES ................................................................................................................................. v LIST OF FIGURES .............................................................................................................................. vi CHAPTER 1 INTRODUCTION ............................................................................................................ 1
1.1 Cell Cycle and Emergence of Cytoskeletal Elements .............................................. 2
1.2 Stomata Development in Maize ............................................................................. 3
1.3 Goal of the Project .................................................................................................. 8 CHAPTER 2 MATERIALS AND METHODS ....................................................................................... 10
2.1 Growth and Identification of the Mutants ........................................................... 10
2.2 DNA Extraction for Use in Genotyping ................................................................. 11
2.3 PCR Setup: Genotyping Using dcd1 Primers ......................................................... 12
2.4 Whole Mount Actin Staining in Developing Maize Leaves ................................... 13
2.5 Confocal Microscopy Image Processing and Analysis .......................................... 13 CHAPTER 3 RESULTS ...................................................................................................................... 15
3.1 Identification of brk1; dcd1 (Double) Mutants ..................................................... 15
3.2 Analysis of Nuclear Position and Actin Organization in Subsidiary Mother Cells in Wild-Type, brk1, dcd1 and brk1; dcd1 Mutants ................................................... 15
3.3 Are Actin Patches Required for Nuclear Migration? ............................................ 27
3.4 Phragmoplast Orientation in SMCs ....................................................................... 31 CHAPTER 4 DISCUSSION ................................................................................................................ 33 REFERENCES .................................................................................................................................. 37

v
LIST OF TABLES
Page
Table 3.1. Percentage of subsidiary mother cells with a polarized nucleus in wild type, dcd1, brk1, and brk1; dcd1. SEM (standard error of the mean). n= number of the cells evaluated. .... 17
Table 3.2. Percentage of SMCs (all stages of mitosis) with an actin patch. ................................. 21
Table 3.3. Percentage genotypes showing presence of actin patch during metaphase, anaphase, and divided .................................................................................................................................... 23
Table 3.4. Average size of the actin patch for each genotype in relation to size of adjacent GMC. SEM (standard error of the mean). ............................................................................................... 26
Table 3.5. Percentage of preprophase SMCs with a polarized nucleus and an actin patch. SEM (standard error of the mean). n= number of the cells. ................................................................ 27
Table 3.6. Percentage of prophase SMCs with a polarized nucleus and an actin patch. SEM (standard error of the mean). n= number of the cells. ................................................................ 29

vi
LIST OF FIGURES
Page
Figure 1.1. Cell cycle phases and the timing of cytoskeletal structure formation within plant cells. ................................................................................................................................................ 2
Figure 1.2. Stages of stomata development. .................................................................................. 3
Figure 2.1. Confocal microscope (UNT source). ........................................................................... 14
Figure 3.1. Genotyping of plants using dcd1 markers. ................................................................. 16
Figure 3.2. Average percentage of subsidiary mother cells with a polarized nucleus ................. 18
Figure 3.3. Examples of polarized and unpolarized SMC nuclei ................................................... 19
Figure 3.4. Presence and absence of actin patches in different genotypes. ................................ 21
Figure 3.5. Percentage SMC with an actin patch in wild type, dcd1, brk1 and brk1; dcd1 plants........................................................................................................................................................ 23
Figure 3.6. Percentage of SMCs with an actin patch in wild-type, dcd1, brk1 and brk1; dcd1 plants at various stages of cell division cycle................................................................................ 25
Figure 3.7. Graphical representation of actin patch size in wild type, brk1, dcd1 and brk1; dcd1 mutants in relation to size of GMC. .............................................................................................. 26
Figure 3.8. Percentage of preprophase SMCs, with respect to the size of the adjacent GMC, with polarized nuclei and the percentage of the cells with polarized nuclei that have an actin patch........................................................................................................................................................ 29
Figure 3.9. Percentage of prophase SMCs, with respect to the size of the adjacent GMC, with polarized nuclei and the percentage of the cells with polarized nuclei that have an actin patch........................................................................................................................................................ 31
Figure 3.10. Phragmoplast orientation in wild-type, dcd1, brk1 and brk1; dcd1 SMCs. (A) arrow indicates wild type normal phragmoplast. ................................................................................... 32

1
CHAPTER 1
INTRODUCTION
Plants have stomata and other epidermal structures for protection and interaction with
the environment. Stomata have a special role in a plant's gaseous exchange with its
surroundings. They help in the maintenance of transpiration rates and temperature regulation
in plants. Abnormalities in stomata development can lead to obstruction of plant growth and
development (Galatis et al. 2004). In plants, stomata are formed through asymmetric cell
divisions where the daughter cells generated have different fates and/or sizes (Facette and
Smith. 2012). Other key asymmetric cell divisions critical to plant development include
asymmetric cell divisions during Arabidopsis embryogenesis and asymmetric cell divisions that
establish the layers of the root (Abrash and Bergmann. 2009).
The four major stages of the cell division cycle are G1, S, G2, and M phase (Figure 1.1).
G1 is a growth phase and is often the longest phase of the cell cycle. During S (synthesis) phase
the parental genome is copied via DNA replication. G2 phase is a checkpoint stage that the cell
does not precede through until it is confirmed that the genome was replicated in its entirety
and any DNA damage was repaired. In M (mitosis) phase, the spindle is formed and it separates
the sister chromatids (Taiz et al. 2006). M phase concludes with cytokinesis.

2
1.1 Cell Cycle and Emergence of Cytoskeletal Elements
Figure 1.1. Cell cycle phases and the timing of cytoskeletal structure formation within plant cells. During plant cell cytokinesis, cell wall placement is determined by the position of the
preprophase band (PPB) and the subsequent expansion of phragmoplast (Figures 1.1 and 1.2).
PPBs are cortical rings of parallel microtubules and actin microfilaments that circumscribe the
future plane of division in most somatic cells of the plant (Palevitz 1987, McCundy and Gunning
1990). They form at the end of G2 and exist throughout prophase. The PPB is thought to
modify the mother cell cortex to create a cortical division site that is later recognized by the
phragmoplast, which acts as the cytokinetic apparatus (Ambrose et al. 2008).
As mitosis progresses, the PPB breaks down and the mitotic spindle forms during
prometaphase. After anaphase the spindle is re-arranged to form the phragmoplast array,
which consists of 2 antiparallel groups of microtubules, oriented perpendicular to the cell
division plane (Ivakov et al. 2013). During phragmoplast expansion the phragmoplast grows
centrifugally towards mother cell wall and mediates the linkage of the new cell plate with the
mother cell cortex at the cortical division site. Actin filaments present in the phragmoplast
serve to guide vesicles containing precursors for cell wall material to the growing cell plate
formation site (Raven et al. 2005).
Cell Cycle phase
G1 S G2 M
Nuclear polarization, actin patch
DNA replication
PPBs Spindle & Phragmoplast

3
1.2 Stomata Development in Maize
Early phragmoplast
Late Phragmoplast
Actin patch
SMC
GMC
SMC
SC SC
GG
A
B
C
PPB Spindle
D
Figure 1.2. Stages of stomata development. A) After the GMC signals the adjoining SMC, an actin patch forms in the SMC and migration of SMCs nuclei towards the GMC is initiated. B) The preprophase band (PPB) and spindle form sequentially. C) As the phragmoplast expands, it tracks back to the cortical division site established by the PPB D) Breakdown of actin patch assembly and symmetric division of GMC to complete stomata formation. SC: subsidiary cell. GC: guard cell. SMC: subsidiary mother cell. GMC: guard mother cell.

4
Stomatal complexes in moncots consist of 4 cells; two guard cells that surround the
stomatal pore and two subsidiary cells the flank the guard cells. Development of the stomata is
a complex process associated with several intrinsic and extrinsic factors responsible for the
coordinated and controlled development of these specialized cells (Grannoutsou et al. 2011,
Facette and Smith 2012). Figure 1.2 depicts the development of stomata in maize and the
positioning of critical cytoskeletal elements throughout mitosis. Formation of the accessory
subsidiary cells begins with a signal originating from the guard mother cell (GMC) and perceived
by the subsidiary mother cell (SMC), in part due to the activity of two receptor-like kinases,
PAN1 and PAN2 (Cartwright et al. 2009; Humphries et al. 2011; Zhang et al. 2012;
Sutimantanapi et al. 2014). The first manifestation of the signal in the SMC is the formation of
an actin patch adjacent to the GMC. The formation of the actin patch is correlated with the
polarization and migration of the SMC nucleus towards the GMC. A preprophase band that
encircles the SMC forms adjacent to the GMC forecasting an asymmetric division. The PPB
establishes the cortical division site, a group of proteins that serves as a memory of the position
of the PPB. As the PPB breaks down, the mitotic spindle forms and separates the duplicated
chromosomes. In Fig 2C an early phragmoplast forms and as it expands, it tracks to the cortical
division site. The phragmoplast mediates the deposition of cell wall and membranes forming
the new cell plate that separates the daughter cells in to a smaller subsidiary cell and a much
larger, sister epidermal cell. The phragmoplast coordinates the fusion of the new cell plate with
the cortical division site of the mother cell. The stomatal complex is completed with the
symmetric division of the GMC to form two guard cells that flank the stomatal pore (Figure
1.2D).

5
F-actin patches similar to those observed in SMCs of grasses have also been found in
SMCs of other monocotyledons (Hussey et al. 2002). The cortical actin patches and endoplasmic
actin filaments are reported to have roles in nuclear migration and anchoring of nucleus to the
polarized cell site adjacent to the inducing GMCs (Humpheries et al. 2011). Considering this
information, preprophase organization of microtubule and actin filaments in SMCs in Zea mays
was studied, and it was found that the prophase nucleus is bound to microtubule monopolar
“half spindle” that forms uniting the structure with preprophase band (Panteris et al. 2006).
These observations suggest a critical role of F-actin and microtubules outside the obvious PPB,
spindle, and phragmoplast structures.
Mutant analysis has shed considerable light on understanding how microtubules and
actin filaments are regulated during mitosis and cytokinesis. In particular, several maize
mutants have been identified that disrupts the microfilament and microtubule assembly in
asymmetric cell division of the SMCs (Muller et al. 2009). One group of mutants are the
pangloss mutants. In these mutants, there are defects in actin patch formation and the SMC
nucleus fails to polarize leading to a symmetric division of the SMC. As discussed earlier, the
pangloss genes encode receptors needed to perceive the GMC signal (Cartwright et al. 2009;
Humphries et al. 2011; Zhang et al. 2012; Sutimantanapi et al. 2014).
Another group of maize mutants with defects in subsidiary cell formation are the
discordia mutants (Smith and Gallagher. 1999). The discordia1 (dcd1) and discordia (dcd2)
mutants have abnormally shaped subsidiary cells, which stem from a failure of the
phragmoplast to track to the cortical division site during cytokinesis. In the dcd1 and dcd2

6
mutants, 30% - 50% of SMC divisions are misoriented producing abnormal stomata complexes
(Frank et al. 2002).
While the molecular identity of the dcd2 mutant remains unknown, dcd1 and its
paralogue, alternative discordia1 (add1), are the maize homologs of the Arabidopsis fass
mutant. These genes all encode B'' regulatory subunits of the PP2A phosphatase (Camelleri et
al. 2002, Wright et al. 2009). B'' subunits are responsible for targeting the PP2A phosphatase
activity to a particular target and subcellular localization (Camelleri et al. 2002). Maize plants
deficient in both DCD1 and ADD1 have a severe phenotype characterized by a complete lack of
PPBs while plants lacking just DCD1 have disorganized PPBs in SMCs. This suggests that the SMC
phragmoplast guidance defects seen in the dcd1 mutant stem from a failure to establish the
cortical division site due to abnormal PPBs. The DCD1/ADD1 proteins accumulate at the PPBs
and cortical division site through metaphase stage (Wright et al. 2009).
Another group of mutants that affects SMC divisions in maize are the brick (brk) mutants
(brk1, brk2, and brk3). The brk mutants also have defects in the formation of lobes that are
characteristic of maize leaf epidermal cells (Frank et al. 2002). Of these brk1 is the best studied
and the only one that has been cloned. In expanding brk1 epidermal cells, mutant cells expand
to same length, but fail to establish the polar growth sites from which the lobes arise, thus the
cells have flat sides instead of lobed sides explaining the choice of the name "brick" for the
mutants. There is an absence of F-actin at the lobe site in brk1 mutants as compared to wild
type cells, indicating brk1 is needed for organized F-actin. In addition the epidermal pavement
cells defects, brk1 mutants have 20 – 40 % abnormal subsidiary cells (Gallagher and Smith.

7
2000). It was noted that the brk1 mutants have a decreased numbers of actin patches in
dividing SMCs (Gallagher and Smith. 2000).
These observations suggest that BRK1 promotes multiple actin dependent cell
polarization events in the developing leaf epidermis (Frank et al. 2003). A study revealed that
brk1, brk2, and brk3 act in common pathway by using a combination of double mutants and a
comparison of subsidiary cell development between the single and double mutants (Frank et al.
2003). The molecular identity of brk1 reveals it is highly conserved in animals and plants
suggesting conserved roles. The APR2/3 (Actin Related Protein) complex is responsible for
regulation of actin cytoskeleton. ARP2/3 nucleates new actin filaments thus indirectly
promoting cell morphogenesis. Efficient nucleation of actin requires activator genes such as
SCAR/WAVE and HSPC300. Maize BRK1 is the homolog of HSPC300 (Djakovic et al. 2006).
Double mutant analysis with other members of the ARP2/3 regulatory complex revealed that
BRK1 plays an essential role in ARP2/3 function and that they act in a common pathway
(Djakovic et al. 2006).
Based on the observation that SMCs in brk1 mutants occasionally lack PPBs (Gallagher
and Smith. 2000) and that the addition of drugs that inhibit actin polymerization enhances the
dcd1 phenotype (Gallagher and Smith. 1999), the dcd1; brk1 double mutant was created. While
the dcd1 single mutant has on average, 26% abnormal subsidiary cells and the brk1 mutant has
on average, 18% abnormal subsidiary cells, the dcd1; brk1 double mutant had 98% abnormal
subsidiary cells (Malhotra. 2014). This suggests that the brk1 and dcd1 mutations are synergistic
as opposed to additive. The microtubule cytoskeleton in dividing SMCs was compared between
wild-type, brk1, dcd1, and brk1; dcd1 plants in an effort to understand the dramatic increase in

8
the number of abnormally shaped subsidiary cells in the double mutant. Malhotra (2014) found
that nuclear migration was equivalent in all genotypes when considering SMCs next to
immature GMCs (Immature GMCs have with a width less than 6um and are less likely to have
signaled to the adjacent SMCs, while mature GMC have a width greater than 6 um and are
more likely to have signaled to the adjacent SMCs.) However in SMCs next to mature GMCs,
nuclear polarization was less likely to have occurred the brk1 and brk1; dcd1 mutants. When
examining PPB orientation and organization, PPBs were normally organized and orientated in
91% of wild-type SMCs, 37% of dcd1 SMCs, 64% of brk1 SMCs, and 7% of brk1; dcd1 double
mutants. Spindles were normally orientated in 100% of wild-type SMCs, 65% of dcd1 SMCs,
47% of brk1 SMCs, and 0% of brk1; dcd1 double mutants. Finally phragmoplasts were normally
oriented in 100% of wild-type SMCs, 65% of dcd1 SMCs, 75% of brk1 SMCs, and 18% brk1; dcd1
double mutants. In all cases, the double mutant had an increased level of defects relative to
the individual single mutants (Malhotra. 2014). Because brk1 directly affects the actin
cytoskeleton, it is important to examine the organization of the actin cytoskeleton in all 4
genotypes in addition to the microtubule cytoskeleton to gain a complete understanding of the
nature of the subsidiary mother cell division defects.
1.3 Goal of the Project
The cell wall of the plant cell is an important structure necessary for the maintenance
and establishment of plant cell shape and to withstand the external forces exerted on the plant
body through maintenance of turgor pressure inside the cell. An inability to alter cellular
position after cytokinesis is one consequence of having a cell wall; hence correct orientation of

9
the division plane is critical for the organization and development of different plant structures,
tissues, and organs. Research in this direction has focused on identifying different proteins
needed for division plane orientation and the localization of these proteins within cells. In the
research presented here, focus is centered on two cytoskeletal elements, actin filaments and
microtubules and their related roles in division plane orientation during asymmetric cell
divisions. This research uses stomata formation in Zea mays leaves, which are essential for
gaseous exchange with the environment through the stomata pore. This small opening is
surrounded by guard cells that govern its opening and closure via changes in internal
environment within these cell's protoplasm. In monocots, including maize, guard cells are
flanked by subsidiary cells that act to assist and protect the guard cells during gaseous
exchange as the process involves contraction and swelling of sensitive guard cells. Research in
this arena will provide us with more details on the organization of these different cytoskeletal
elements during formation of this specialized epidermal leaf structure. This research will enable
us to understand the regulation of microtubules and actin filament orientation during mitosis.
The outcome of this research will answer questions about how the timely placement of actin
and microtubule elements contributes to the division of stomatal complex cells. This could be
of great help in the refinement of experimental techniques in maize, a crop plant.

10
CHAPTER 2
MATERIALS AND METHODS
2.1 Growth and Identification of the Mutants
Around 60 seeds from the ears segregating the brk1-O, dcd1-O, and brk1-O; dcd1-O
double mutants were planted in rounded pots with 15 inches of Metro-mix 900 soil in the
EESAT greenhouse at University of North Texas. In each pot approximately one tablespoon of
Osmocote fertilizer was sprinkled onto the top soil layer in each pot. Seeds were spaced in soil
in four rows with the uppermost row containing two seeds, the middle rows containing four
seeds, and the bottom row containing two seeds with even spacing. Each seed was pressed 2
cm deep into the soil and pots were well-watered immediately after planting two times. Each
pot was monitored for water content and drenched every 5 days initially and later every two
days. Seeds germinated in 3-4 days. When the seedlings had 3-5 leaves, plants were numbered
and one leaf from each plant was detached for analysis. Detached leaf blades were then
analyzed for the presence and/or absence of phenotypes associated with the brk1, dcd1 or
brk1: dcd1 mutations by screening Loctite Cynoacrylate glue impressions of the leaf surface for
epidermal cell and subsidiary cell shape defects. To make the glue impressions, the three
stripes of glue were spread on a microscope glass slide and the detached leaf blade was pressed
against the glue surface on the slide. To make an even impression, the slide was turned upside
down and a light weight was applied by putting an empty glass bottle on each slide. After 3
minutes, the leaf was gently removed from the slide leaving an impression of the leaf surface.
The slides were then observed under a light microscope at 5X and 10 X objective powers to
study shape of the cells. For each set of experiments, 60 seeds were planted, glue impression
11
analysis was carried out and the plants were classified as wild type, dcd1, brk1 and brk1; dcd1.
Roughly 4 plants from each group were selected and grown until at least the 8th leaf was visible.
The phenotypic observations were partially confirmed by doing the genotyping analysis as
described in the next section.
2.2 DNA Extraction for Use in Genotyping
Genomic DNA was extracted from plants identified as wild type, dcd1, brk1 and brk1;
dcd1. For extraction of DNA, extraction buffer was prepared by combining 20 ml 0.5 M EDTA, 5
ml 4M NaCl, 20 ml 1M Tris, and 155 ml ultra-pure ddH2O. Prior to use, 0.7 µl of BME (Beta-
mercaptoethanol) was added per 1 ml of extraction buffer. Fresh leaf tips were ground in 500 µl
of extraction buffer in 1.5 ml eppendorf tube with a pestle until the tissue was completely
disrupted. 35 µl 20% SDS was added to each tube and inverted to mix, then the DNA extraction
was incubated at 65˚C for 10 minutes. 130 µl 5M Potassium acetate was added, the tube was
incubated on ice for 5 minutes, then centrifuged at 13000 rpm for 10 minutes. After
centrifugation, the clear supernatant was transferred to a clean Eppendorf tube. To this tube
was added an equal amount of ice-cold isopropanol and 1/10 volume of 3M sodium acetate.
Tubes were incubated for overnight at -20˚C. To form pellets of precipitated DNA, the tubes
were centrifuged at 13000 rpm for 10 minutes. The supernatant was discarded and pellet was
washed with 1 ml 70% ethanol by centrifuging the tube at 13000 rpm for 5 minutes. All traces
of ethanol were removed by evaporation and the DNA pellet was re-suspended in 50-100 µl of
RNAse solution (10 ng/µl) and kept overnight at 4˚C to ensure the DNA had gone into solution.
12
Finally the tube containing the DNA solution was incubated at 37˚C for 30 minutes to allow the
RNAse to degrade the RNA. The DNA was then stored at -20˚C for future use.
2.3 PCR Setup: Genotyping Using dcd1 Primers
DNA extracted from the mutants was used for genotyping for the presence of the dcd1-
O mutation. The dCAPfor (GTGGTGACCTGGAGAATATCG) and dCAPrev2
(ATTAACAATAATTCCAGCTGGGATA) primers were used for amplification. Each reaction
contained 2 µl 2.5 mM dNTPs, 2 µl 10X Thermal Pol buffer (New England Biolabs), 1 µl DMSO,
0.1 µl Taq Polymerase (New England Biolobs), 1.25 µl 100 ng/µl dCAP for/rev2 primers, 12.65 µl
ddH₂O, and 1 µl of DNA. PCR amplification conditions included an initial DNA denaturation step
at 94˚C for 2 minutes. The following steps were repeated 35 times: 94˚C for 1 minute, 56˚C for
1 minute, and elongation at 68˚ C for 1 minute 30 seconds. The reaction concluded with
extension at 68˚C for 10 minutes and a hold at 10˚C. The PCR products were digested and run
on 12% polyacrylamide gels. For each digest, 0.4 µl EcoRV HF (New England Biolabs), 2 µl of NEB
buffer #4, and 7.6 µl of ddH2O were combined with 10 µl of PCR product and the reactions
were incubated for 2-3 hours at 37˚C. Meanwhile, a 12% acrylamide gel was prepared by using
6 ml acrylamide (dilution 29:1) , 3 ml 5X TBE buffer, 100 µl 10% APS (freshly prepared) and 10 µl
TEMED. 4 µl of loading dye was added to each restriction digest product and a total of 24 µl of
sample was loaded into each well and analyzed using 1 Kb plus ladder (Life Technologies). The
products were electrophoresed on the gel for 2-3 hours at 100 Volts in 1XTAE. The DNA
fragments were visualized by staining the gel in 1:10000 dilution of Syber Safe (Life

13
Technologies) for 30-45 minutes. The gel was observed and photographed under blue light
using a Cannon Photoshop digital camera.
2.4 Whole Mount Actin Staining in Developing Maize Leaves
Actin was visualized with phalloidin-AlexaFluor 488 (Life Technologies) and DNA was
visualized with propidium iodide. The staining procedure was performed on plants with adult
leaves visible (leaf 8 or older) and the plants were sacrificed for the procedure. Immature leaf
blades (the basal 3 cm of each developing leaf) were cut into 1 cm strips and fixed in 2ml 2X
PME, 40 µl 30 mM MBS, 40 µl DMSO, and 1.88 ml water for 30 minutes. 2X PME was prepared
by dissolving 15.11 g PIPES, 1.9 g EGTA and 0.49 g MgSO4 in 500 ml ddH2O and adjusting the pH
to 6.8. Next the leaves were incubated in 1 ml 16% formaldehyde, 2ml 2X PME, 40 µl 10%
Triton-X, and 960 µl water for 1 hour. After fixing, the leaf strips were washed in 1X PME with
0.5% Triton-X. The leaves were extracted in a solution of 5% DMSO and 1% Triton-X for 10
minutes. The phalloidin was prepared by evaporating off the storage methanol then
resuspending it in the same amount of 1X PME. Prepared phalloidin was diluted 1:10 in 1X PME
and leaf strips were incubated in this solution for 1 hour at 37˚C. After incubation, the leaf
strips were washed in 1x PME with 0.5% Triton-X for 10 minutes. To visualize DNA, the leaf
stripes were incubated for 10 minutes in 10 µg/ml propodium iodide then washed with 1X PME
with 0.5% Triton-X.
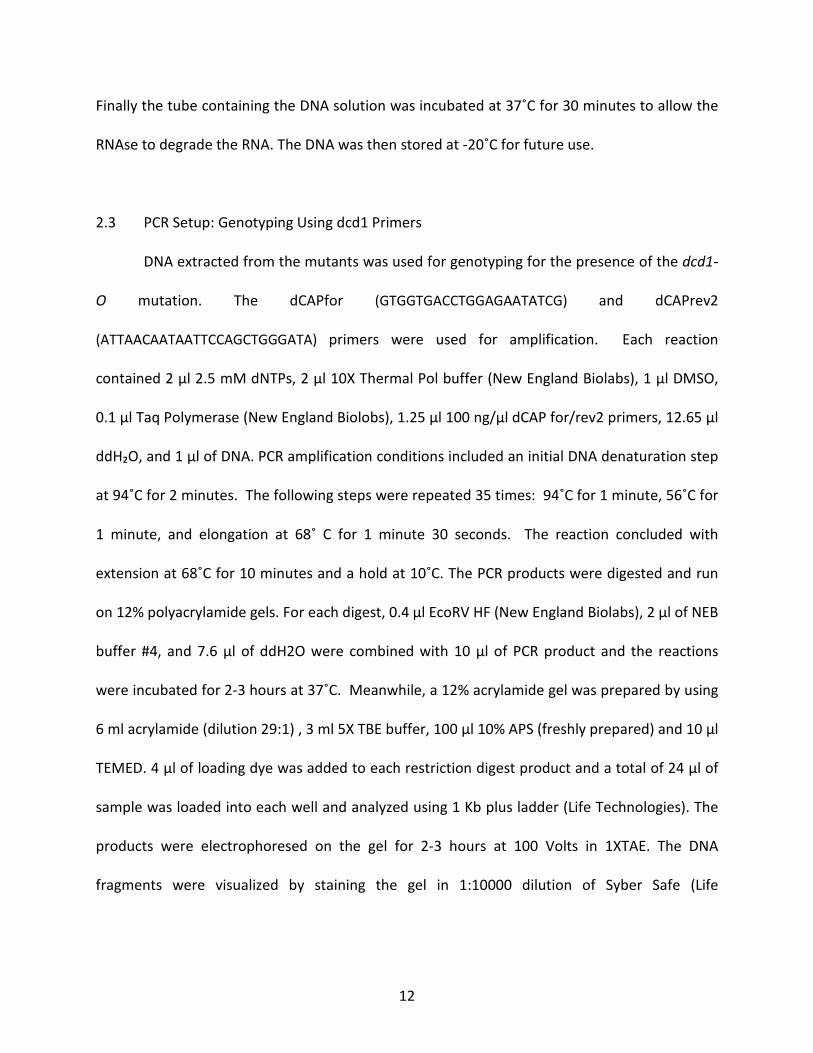
2.5 Confocal Microscopy Image Processing and Analysis
Confocal microscopy was carried out under the supervision of Dr. Lon Turnbull at the
14
UNT microscopy facility. The machine used was a Zeiss LSM710. The argon 488 nm laser was
used to excite the phalloidin 488 and propidium iodide. Z stacks of dividing subsidiary cells were
captured and analyzed using the Zeiss Zen computer software platform. Image processing was
accomplished using Image J software.
Figure 2.1. Confocal microscope (UNT source).

15
CHAPTER 3
RESULTS
3.1 Identification of brk1; dcd1 (Double) Mutants
Maize ears segregating the brk1 and dcd1 alleles were generated by crossing brk1-O and
dcd1-O homozygotes and then selfing the resulting F1 heterozygotes. brk1 encodes a protein
required for ARP2/3 to function and aids in the organization of the actin cytoskeleton. dcd1 is
responsible for normal PPB formation and organization of the interphase microtubule
cytoskeleton. The individual and double mutants were examined via a combination of
phenotypic and genotypic approaches. Glue impressions of the epidermal leaf surface of each
plant were observed by light microscopy. Wild-type plants showed normal epidermal cell lobes
and normal subsidiary cells. dcd1 mutants had normal epidermal cell lobes, but the subsidiary
cells were abnormally shaped. brk1 and brk1; dcd1 double mutants had both abnormal
epidermal cell lobes and abnormally shaped subsidiary cells. After the phenotypic
observations, each plant was genotyped for the presence/absence of the dcd1-O allele. The
genotyping results distinguished between the brk1 single mutants and the brk1; dcd1 double
mutants and confirmed the identity of the dcd1 and wild-type plants (Figure 3.1).
3.2 Analysis of Nuclear Position and Actin Organization in Subsidiary Mother Cells in Wild-Type, brk1, dcd1 and brk1; dcd1 Mutants
The cause of abnormal subsidiary cell development in brk1; dcd1 mutant was studied by
observing the organization of actin microfilaments in SMCs (subsidiary mother cells) undergoing
cell division. Phallodian-488, a molecule fused to Alexflour 488 that binds actin filaments, was
used to visualize the actin microfilaments, and a nucleic acid stain, propodium iodide, was used
16
to observe the nuclear position of dividing SMCs as well as to assess the progress of the cell
through the cell cycle. Cells in the subsidiary mother cell division zone cells were observed and
the state of the cell cycle, position of the nucleus, presence/absence of actin patch, size of actin
patch, and size of the adjacent guard mother cell (GMC) were noted. Data was collected for
SMCs adjacent to GMCs having a width less than 6 µm and a width greater than 6 µm size.
Guard mother cells send a signal that results in the polarization of the nucleus in adjacent
SMCs. Current evidence suggests that mature GMCs (width > 6 µm) are more likely to be
competent to signal the adjoining SMCs that immature GMCs (width < 6 µm; Humphries et al
2009). For each genotype, dividing cells in 4 plants were evaluated and the standard error of
mean (SEM) was calculated for the average of each measurement across the 4 plants.
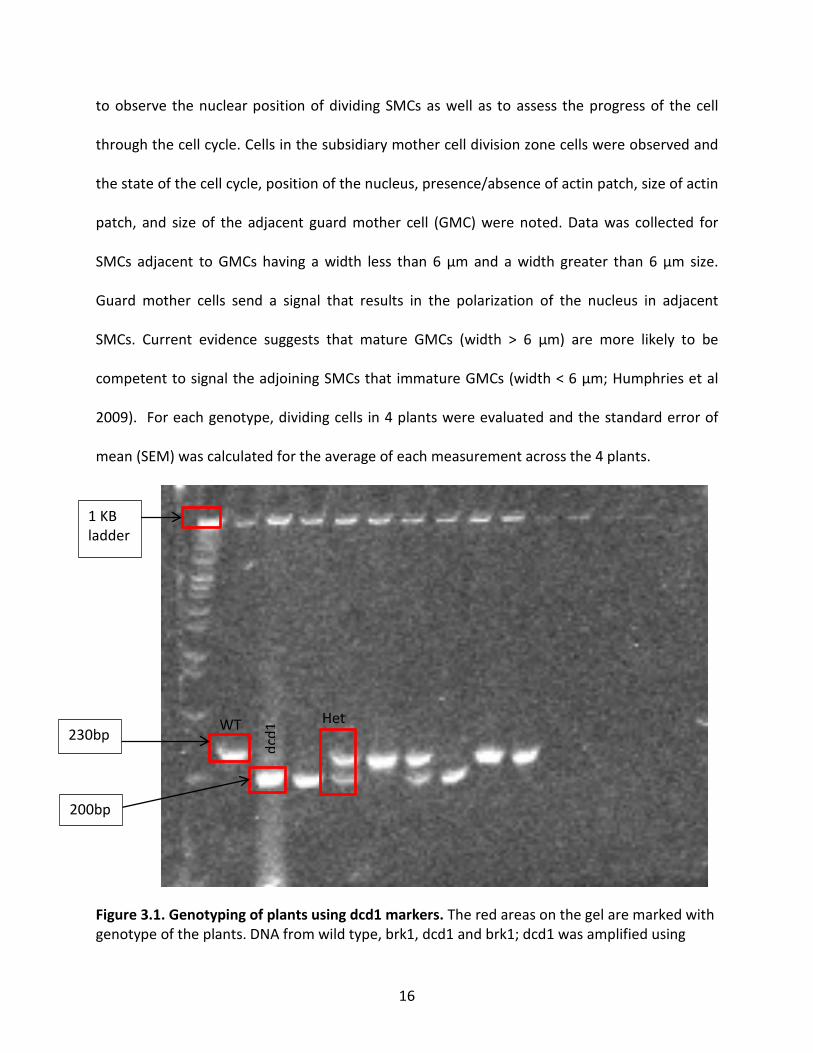
Figure 3.1. Genotyping of plants using dcd1 markers. The red areas on the gel are marked with genotype of the plants. DNA from wild type, brk1, dcd1 and brk1; dcd1 was amplified using
1 KB ladder
230bp
200bp
dcd
1 WT Het
17
specific primers and digested with Eco RV HF. The 1 kb ladder was used to size the products of the restriction digest on the acrylamide gel. The 230 bp and 200 bp bands corresponds to the wild-type and dcd1 alleles. The het box on the gel indicates a heterozygote since the wild-type and dcd1 mutant bands are both present.
3.2.1 Nuclear Migration
The first step in the asymmetric cell division of a SMC is the polarization of its nucleus
towards the adjacent GMC. The migration of the nucleus occurs when an extrinsic signal is
received from the adjacent GMC (Stebbins and Shah, 1960). Table 3.1 and Figure 3.2 show the
percentage of polarized SMC nuclei in relation to the width of the guard mother cells (GMCs)
for SMCs in preprophase and prophase for each genotype. Examples of polarized and
unpolarized nuclei are shown in Figure 3.3. A polarized nucleus is defined as a SMC nucleus
touching the SMC cell wall directly opposed to the nearby GMC; all other positions were
considered non-polarized. The results suggest equivalent levels of nuclear migration across all
genotypes.
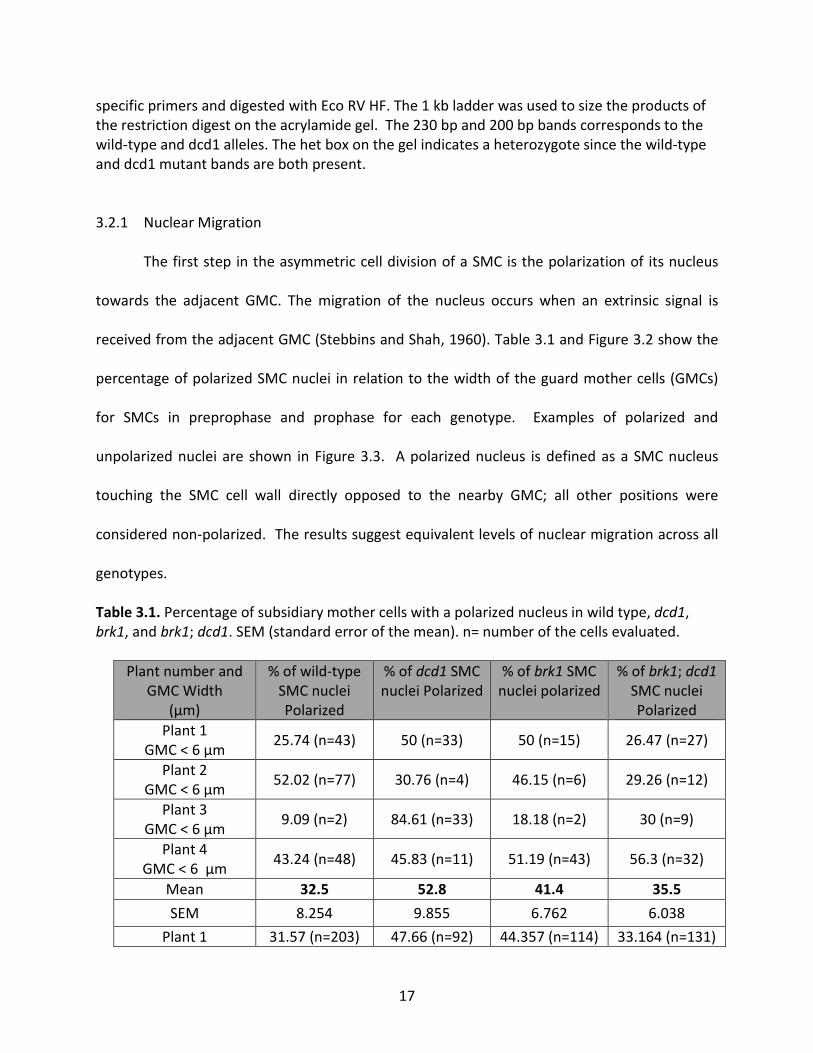
Table 3.1. Percentage of subsidiary mother cells with a polarized nucleus in wild type, dcd1, brk1, and brk1; dcd1. SEM (standard error of the mean). n= number of the cells evaluated.
Plant number and GMC Width
(µm)
% of wild-type SMC nuclei Polarized
% of dcd1 SMC nuclei Polarized
% of brk1 SMC nuclei polarized
% of brk1; dcd1 SMC nuclei Polarized
Plant 1 GMC < 6 µm 25.74 (n=43) 50 (n=33) 50 (n=15) 26.47 (n=27)
Plant 2 GMC < 6 µm 52.02 (n=77) 30.76 (n=4) 46.15 (n=6) 29.26 (n=12)
Plant 3 GMC < 6 µm 9.09 (n=2) 84.61 (n=33) 18.18 (n=2) 30 (n=9)
Plant 4 GMC < 6 µm 43.24 (n=48) 45.83 (n=11) 51.19 (n=43) 56.3 (n=32)
Mean 32.5 52.8 41.4 35.5 SEM 8.254 9.855 6.762 6.038
Plant 1 31.57 (n=203) 47.66 (n=92) 44.357 (n=114) 33.164 (n=131)

18
GMC ˃ 6 µm Plant 2
GMC ˃6 µm 78.57 (n=99) 67.53 (n=52) 68.62 (n=70) 31.37 (n=16)
Plant 3 GMC ˃ 6 µm 25 (n=44) 83.7 (n=113) 46.57 (n=34) 50.87 (n=29)
Plant 4 GMC ˃ 6 µm 63.56 (n=82) 40.93 (n=61) 52.7 (n=39) 55.1 (n=153)
Mean 49.7 60.0 53.1 42.6
SEM 1.11 8.4 4.7 5.2
Figure 3.2. Average percentage of subsidiary mother cells with a polarized nucleus. A) Average percentage of SMC nuclei polarized in relation to the size of the adjacent GMCs with a width less than 6 µm. B) Average percentage of SMC nuclei polarized in relation to the size of the
0
0.1
0.2
0.3
0.4
0.5
0.6
0.7
wild type dcd1 brk1 brk1; dcd1
Average percentage of polarized SMC nuclei associated with a GMC < 6 µm
A
0
0.1
0.2
0.3
0.4
0.5
0.6
0.7
0.8
wild type dcd1 brk1 brk1; dcd1
Average percentage of polarized SMC nuclei associated with a GMC > 6 µm
B
19
adjacent GMC with a width greater than 6 µm. Error bars represent the SEM (standard error of the mean).
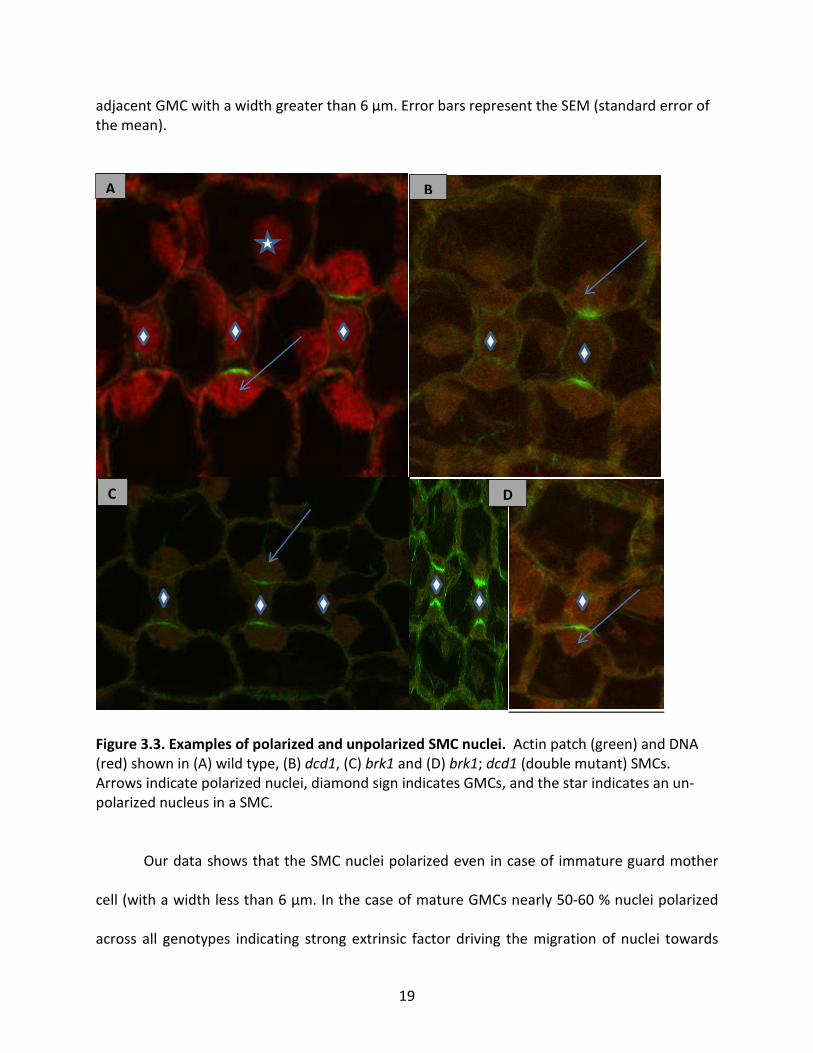
Figure 3.3. Examples of polarized and unpolarized SMC nuclei. Actin patch (green) and DNA (red) shown in (A) wild type, (B) dcd1, (C) brk1 and (D) brk1; dcd1 (double mutant) SMCs. Arrows indicate polarized nuclei, diamond sign indicates GMCs, and the star indicates an un-polarized nucleus in a SMC.
Our data shows that the SMC nuclei polarized even in case of immature guard mother
cell (with a width less than 6 µm. In the case of mature GMCs nearly 50-60 % nuclei polarized
across all genotypes indicating strong extrinsic factor driving the migration of nuclei towards
B
C D
A

20
adjacent GMC. Figure 3.3 shows the images of polarized and un- polarized nuclei in wild-type,
dcd1, brk1 and brk1; dcd1 plants.
3.2.2 Actin Patch Formation in SMCs
The arrangement and organization of the actin patch is thought to influence nuclear
migration and aid in the anchoring of the spindle to help with the separation of genetic material
into daughter cells during cell division. Since the phragmoplast arises from the remnants of the
spindle, the position of the spindle also may contribute to the initial position of the
phragmoplast. Because of this and the known role of brk1 in organizing the actin cytoskeleton,
it is important to observe the presence/absence of the actin patch as well as the size of the
actin patch during asymmetric division of SMCs in each of the genotypes. Table 3.2 and Figure
3.5 show the percentage of cells in all stages of mitosis for each genotype with an actin patch,
while Figure 3.4 shows images of representative actin patches. There are a high percentage of
actin patches present in wild-type and dcd1 SMCs adjacent to mature and immature GMCs as
compared to SMCs in brk1 and brk1; dcd1 mutants. The difference is much more dramatic in
the SMCs adjacent to mature GMCs (width > 6 µm).
This analysis was continued by looking at the absence or presence of actin patch in
SMCs adjacent to mature GMCs (width greater than 6 µm) only during metaphase, anaphase
and after cytokinesis was complete. It is thought that the actin patch may contribute to
maintenance of the spindle position during anaphase and metaphase. This data is shown in
Table 3.3 and Figure 3.6 and it keeps with the trend observed before with wild type and dcd1
SMCs having the greatest percentage of cells with actin patches and brk1 and brk1; dcd1 SMCs

21
having significantly less. After cytokinesis, divided SMCs showed fewer actin patches indicating
a re-distribution of actin microfilaments or digestion of actin microfilament assembly into its
monomer form.
Figure 3.4. Presence and absence of actin patches in different genotypes. DNA is in red and actin is in green. A) wild type, B) dcd1, C) brk1 and D) brk1; dcd1 double mutant. Arrows point to actin patches, star indicates polarized nucleus and the diamond represents the GMC.
Table 3.2. Percentage of SMCs (all stages of mitosis) with an actin patch.
Plant number and GMC Width
(µm) wild type dcd1 brk1 brk1; dcd1
Plant 1 GMC<6 (µm) 65.86 (n=110) 18.18 (n=12) 3.33 (n=1) 9.8 (n=1)
C
A B
D

22
Plant 2 GMC<6 (µm) 73.64 (n=109) 53.84 (n=7) 7.69 (n=1) 7.14 (n=1)
Plant 3 GMC<6 (µm) 22.72 (n=5) 51.12 (n=20) 7.1 (n=2)
Plant 4 GMC<6 (µm) 52.25 (n=58) 25 (n=6) 39.28 (n=33) 18.36 (n=9)
Mean 53.6 37.0 12.6 10.6 SEM 9.706006 7.830819 7.8228717 2.30596
Plant 1 GMC ˃6 (µm) 84.75 (n=545) 40.41 (n=78) 19.06 (n=49) 0.278 (n=1)
Plant 2 GMC ˃6 (µm) 72.22 (n=91) 81.81 (n=63) 15.68 (n=16) 3.92 (n=2)
Plant 3 GMC ˃6 (µm) 53.4 (n=94) 82.08 (n=110) 5.55 (n=4) 39.28 (n=22)
Plant 4 GMC ˃6 (µm) 72.86 (n=94) 57.71 (n=86) 51.35 (n=38) 40 (n=98)
Mean 70.8
65.5
22.9
20.9
SEM 4.488 7.017 9.706 7.526
0
10
20
30
40
50
60
70
wt dcd1 brk1 brk1; dcd1
Average percentage SMC with an actin patch that associated with a GMC < 6 µm
% SMC with an actin patch
A
23
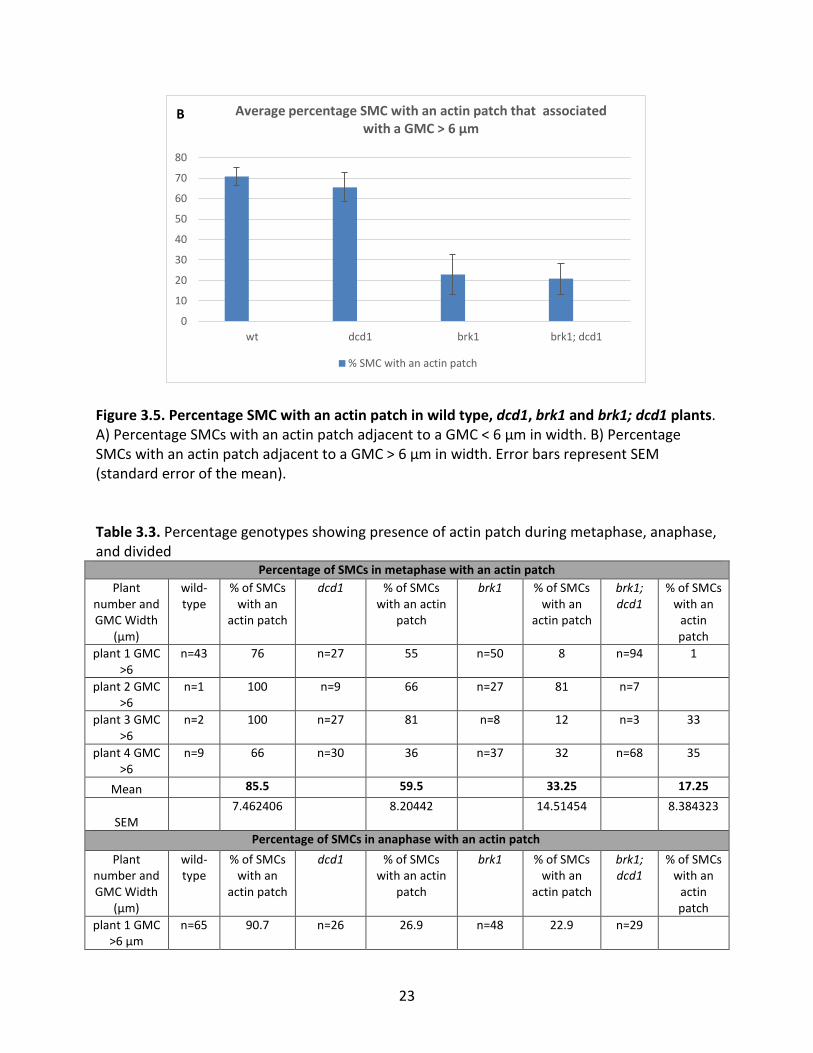
Figure 3.5. Percentage SMC with an actin patch in wild type, dcd1, brk1 and brk1; dcd1 plants. A) Percentage SMCs with an actin patch adjacent to a GMC < 6 µm in width. B) Percentage SMCs with an actin patch adjacent to a GMC > 6 µm in width. Error bars represent SEM (standard error of the mean).
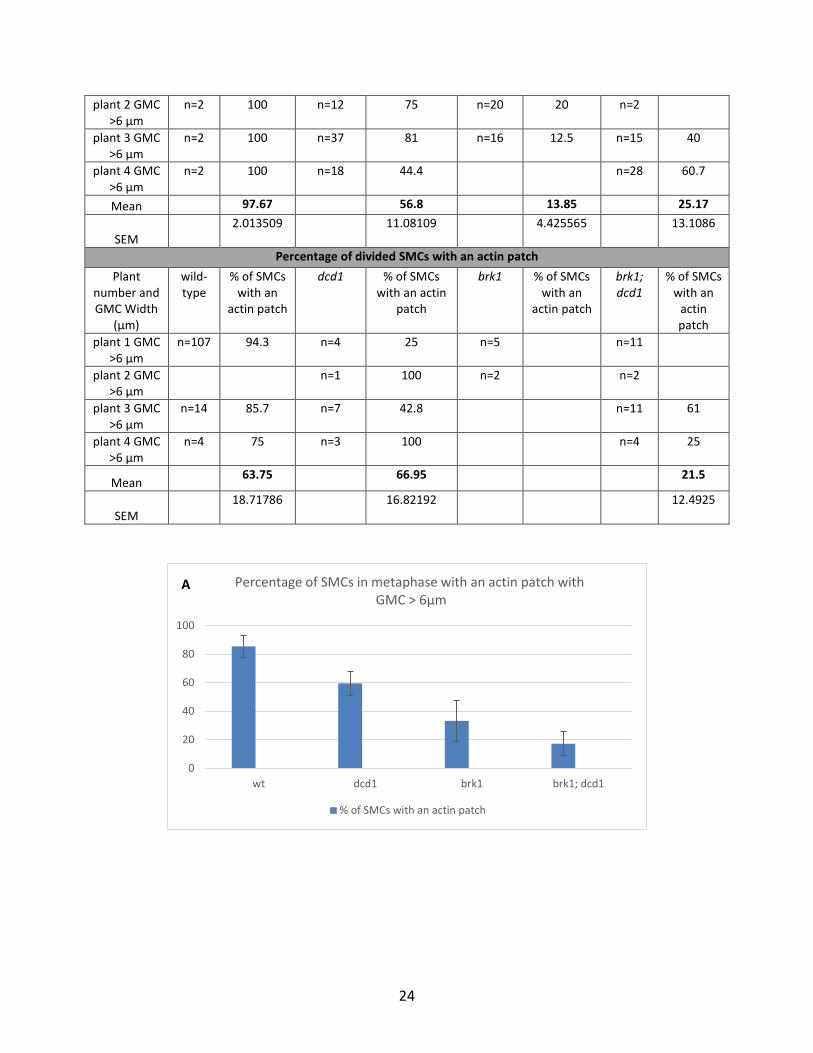
Table 3.3. Percentage genotypes showing presence of actin patch during metaphase, anaphase, and divided
Percentage of SMCs in metaphase with an actin patch Plant
number and GMC Width
(µm)
wild-type
% of SMCs with an
actin patch
dcd1 % of SMCs with an actin
patch
brk1 % of SMCs with an
actin patch
brk1; dcd1
% of SMCs with an
actin patch
plant 1 GMC ˃6
n=43 76 n=27 55 n=50 8 n=94 1
plant 2 GMC ˃6
n=1 100 n=9 66 n=27 81 n=7
plant 3 GMC ˃6
n=2 100 n=27 81 n=8 12 n=3 33
plant 4 GMC ˃6
n=9 66 n=30 36 n=37 32 n=68 35
Mean 85.5 59.5 33.25 17.25
SEM 7.462406
8.20442
14.51454
8.384323
Percentage of SMCs in anaphase with an actin patch
Plant number and GMC Width
(µm)
wild-type
% of SMCs with an
actin patch
dcd1 % of SMCs with an actin
patch
brk1 % of SMCs with an
actin patch
brk1; dcd1
% of SMCs with an
actin patch
plant 1 GMC ˃6 µm
n=65 90.7 n=26 26.9 n=48 22.9 n=29
0
10
20
30
40
50
60
70
80
wt dcd1 brk1 brk1; dcd1
Average percentage SMC with an actin patch that associated with a GMC > 6 µm
% SMC with an actin patch
B
24
plant 2 GMC ˃6 µm
n=2 100 n=12 75 n=20 20 n=2
plant 3 GMC ˃6 µm
n=2 100 n=37 81 n=16 12.5 n=15 40
plant 4 GMC ˃6 µm
n=2 100 n=18 44.4 n=28 60.7
Mean 97.67 56.8 13.85 25.17
SEM 2.013509
11.08109
4.425565
13.1086
Percentage of divided SMCs with an actin patch
Plant number and GMC Width
(µm)
wild-type
% of SMCs with an
actin patch
dcd1 % of SMCs with an actin
patch
brk1 % of SMCs with an
actin patch
brk1; dcd1
% of SMCs with an
actin patch
plant 1 GMC ˃6 µm
n=107 94.3 n=4 25 n=5 n=11
plant 2 GMC ˃6 µm
n=1 100 n=2 n=2
plant 3 GMC ˃6 µm
n=14 85.7 n=7 42.8 n=11 61
plant 4 GMC ˃6 µm
n=4 75 n=3 100 n=4 25
Mean 63.75 66.95 21.5
SEM 18.71786 16.82192
12.4925
0
20
40
60
80
100
wt dcd1 brk1 brk1; dcd1
Percentage of SMCs in metaphase with an actin patch withGMC ˃ 6µm
% of SMCs with an actin patch
A
25
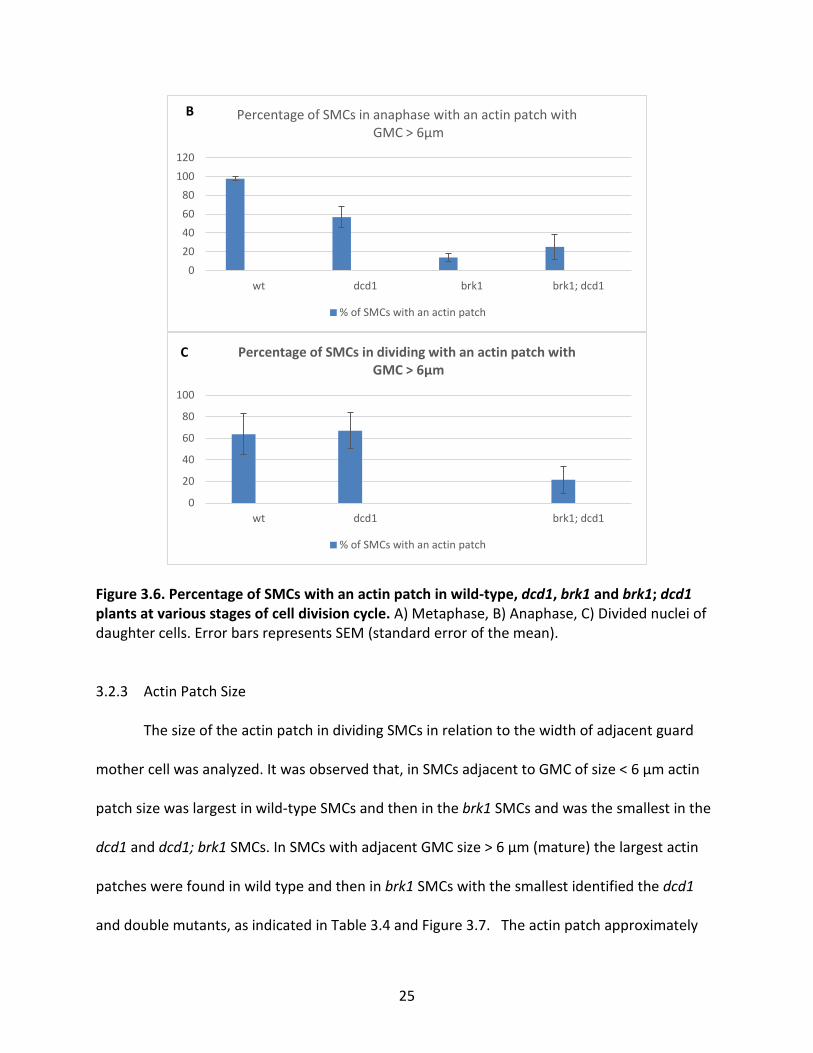
Figure 3.6. Percentage of SMCs with an actin patch in wild-type, dcd1, brk1 and brk1; dcd1 plants at various stages of cell division cycle. A) Metaphase, B) Anaphase, C) Divided nuclei of daughter cells. Error bars represents SEM (standard error of the mean).
3.2.3 Actin Patch Size
The size of the actin patch in dividing SMCs in relation to the width of adjacent guard
mother cell was analyzed. It was observed that, in SMCs adjacent to GMC of size < 6 µm actin
patch size was largest in wild-type SMCs and then in the brk1 SMCs and was the smallest in the
dcd1 and dcd1; brk1 SMCs. In SMCs with adjacent GMC size > 6 µm (mature) the largest actin
patches were found in wild type and then in brk1 SMCs with the smallest identified the dcd1
and double mutants, as indicated in Table 3.4 and Figure 3.7. The actin patch approximately
020406080
100120
wt dcd1 brk1 brk1; dcd1
Percentage of SMCs in anaphase with an actin patch withGMC ˃ 6µm
% of SMCs with an actin patch
B
0
20
40
60
80
100
wt dcd1 brk1; dcd1
Percentage of SMCs in dividing with an actin patch withGMC ˃ 6µm
% of SMCs with an actin patch
C

26
doubled in size for all genotypes when comparing actin patch size in SMCs next to mature and
immature GMCs.
Table 3.4. Average size of the actin patch for each genotype in relation to size of adjacent GMC. SEM (standard error of the mean).
Figure 3.7. Graphical representation of actin patch size in wild type, brk1, dcd1 and brk1; dcd1 mutants in relation to size of GMC. Error bars represent the SEM (standard error of the mean).
0
0.5
1
1.5
2
2.5
3
3.5
wt dcd1 brk1 brk1; dcd1
Size of actin patchGMC < 6 µm
size of actin patch
0
1
2
3
4
5
6
7
wt dcd1 brk1 brk1;dcd1
Size of actin patch GMC > 6 µm
size of actin patch
Average size of actin patch Plant number
and GMC Width (µm)
wild type Size actin patch
(µm)
dcd1 Size actin patch
(µm)
brk1 Size actin patch
(µm)
brk1; dcd1 Size actin patch
(µm) plant 1 GMC < 6 µm 3.392 0.78 0.151 plant 2 GMC < 6 µm 3.4 0.085 2.61 0.38 plant 3 GMC < 6 µm 1.2 0.18 2.99 plant 4 GMC < 6 µm 2.9 0.75 1.33 2.61
Mean 2.723 0.253 1.927 0.785 SEM 0.451162 0.169547 0.451973 0.640371
plant 1 GMC ˃ 6 µm 5.58 0.018 2.69 1.165 plant 2 GMC ˃ 6 µm 5.002 0.10 5.52 0.90 plant 3 GMC ˃ 6 µm 8.18 2.75 5.10 0.399 plant 4 GMC ˃ 6 µm 5.09 2.76 3.85 4.21
Mean 5.963 1.407 4.29 1.66 SEM 0.649395 0.674158 0.554673 0.746448

27
3.3 Are Actin Patches Required for Nuclear Migration?
Since nuclei in some SMCs failed to migrate and actin patches failed to form in some
SMCs, it was examined to see if there was a direct correlation between the failure to undergo
nuclear migration and a failure to form an actin patch. For this analysis, preprophase (Table 3.5
and Figure 3.8) and prophase (Table 3.6 and Figure 3.9) SMCs adjacent to mature GMCs were
considered. For each genotype, the first column shows the percentage of cells that have
polarized nuclei and the second column shows the percentage of those polarized cells that have
an actin patch. It is clear that many cells are capable of polarizing without the assistance of an
actin patch. This data also suggests that actin patches do not form as a result of nuclear
polarization.
Table 3.5. Percentage of preprophase SMCs with a polarized nucleus and an actin patch. SEM (standard error of the mean). n= number of the cells.
Percentage of preprophase SMCs with a polarized nucleus and an actin patch Plant numb
er and
GMC Widt
h (µm)
wild type
% polarized SMC
% polarized SMC with actin patch
dcd1 % polarized SMC
% polarized SMC with actin patch
brk1 % polarized SMC
% polarized SMC with actin patch
brk1; dcd1
% polarized SMC
% polarized SMC with actin patch
plant 1 GMC<6 µm
n= 116 25 68.9 n=59 44 18.6 n=17 47 n=82 29.2
plant 2 GMC<6 µm
n= 129 54.2 71.3 n=4 75 75 n=11 45.4 9.09 n=36 22.2 2.7
plant 3 GMC<6 µm
n=19 10.5 26.31 n=11 90.9 72.7 n=9 11.1 22.2 n=24 25
plant 4 GMC<6 µm
n=66 40.9 54.5 n=7 42.8 n=32 59.3 9.3 n=24 66.6 29.16
Mean 32.6
5 55.25 63.17 41.57 40.7 10.14 35.75 7.96
SEM 8.22 8.951 10.28 16.47 8.957 3.953 8.992 6.143

28
196 296 144 408 888 409 323 242 plant 1 GMC
˃6 µm
n=314
33.12 81.2 n=13
2 43.9 59 n=119 35.29 22.68 n=20
2 33.16
plant 2 GMC
˃6 µm
n=103 75.7 66 n=21 52.3 85.7 n=47 55.3 10.6 n=40 25
plant 3 GMC
˃6 µm
n=117 21.3 45.2 n=43 93 79 n=38 31.57 2.6 n=27 33.3 48.1
plant 4 GMC
˃6 µm n=72 65.2 68 n=45 28.8 46.6 n=6 83.3 16.6 n=12
6 62.6 37.3
Mean 48.8 65.1 54.5 67.57 51.36 13.12 38.5 21.35
SEM
11.1654
6
6.444183 11.88
471 7.796343 10.26
394 3.712519 7.152
861 10.84438
0
10
20
30
40
50
60
70
80
wt dcd1 brk1 brk1; dcd1
Percentage of preprophase SMCs with a polarized nucleus and an actin patch with GMC < 6 µm
% polarized SMC % polarized SMC with actin patch
A
29
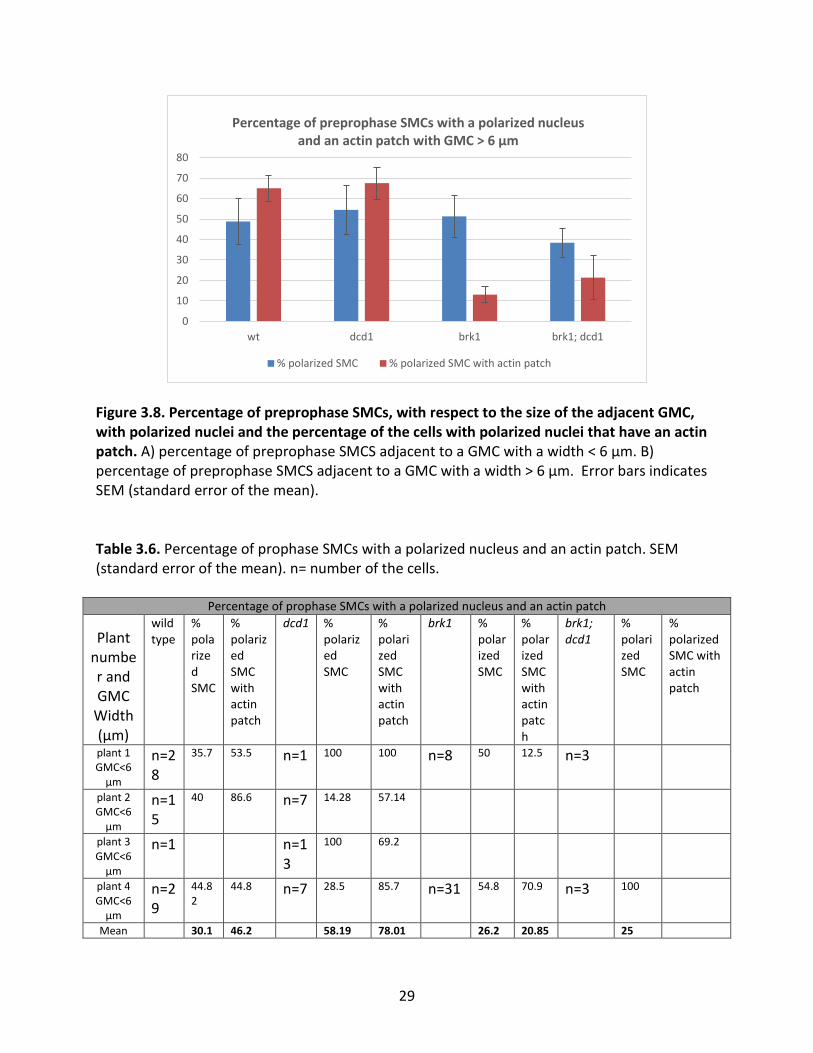
Figure 3.8. Percentage of preprophase SMCs, with respect to the size of the adjacent GMC, with polarized nuclei and the percentage of the cells with polarized nuclei that have an actin patch. A) percentage of preprophase SMCS adjacent to a GMC with a width < 6 µm. B) percentage of preprophase SMCS adjacent to a GMC with a width > 6 µm. Error bars indicates SEM (standard error of the mean).
Table 3.6. Percentage of prophase SMCs with a polarized nucleus and an actin patch. SEM (standard error of the mean). n= number of the cells.
Percentage of prophase SMCs with a polarized nucleus and an actin patch
Plant number and GMC
Width (µm)
wild type
% polarized SMC
% polarized SMC with actin patch
dcd1 % polarized SMC
% polarized SMC with actin patch
brk1 % polarized SMC
% polarized SMC with actin patch
brk1; dcd1
% polarized SMC
% polarized SMC with actin patch
plant 1 GMC<6
µm
n=28
35.7 53.5 n=1 100 100 n=8 50 12.5 n=3
plant 2 GMC<6
µm
n=15
40 86.6 n=7 14.28 57.14
plant 3 GMC<6
µm
n=1 n=13
100 69.2
plant 4 GMC<6
µm
n=29
44.82
44.8 n=7 28.5 85.7 n=31 54.8 70.9 n=3 100
Mean 30.1 46.2 58.19 78.01 26.2 20.85 25
0
10
20
30
40
50
60
70
80
wt dcd1 brk1 brk1; dcd1
Percentage of preprophase SMCs with a polarized nucleus and an actin patch with GMC > 6 µm
% polarized SMC % polarized SMC with actin patch
30
SEM
8.846097
15.45527
19.81262
8.123535
13.12745
14.67176
21.65064
plant 1 GMC ˃6
µm
n=115
53.9 84.3 n=4 50 n=35 42.8 20 n=23 52.1
plant 2 GMC ˃6
µm
n=20
90 100 n=34
70.5 85.29 n=6 25 50
plant 3 GMC ˃6
µm
n=41
39 60.9 n=20
70 100
plant 4 GMC ˃6
µm
n=41
65.8 82.9 n=51
52.9 80.3 n=30 46.6 83.3 n=15 60 60
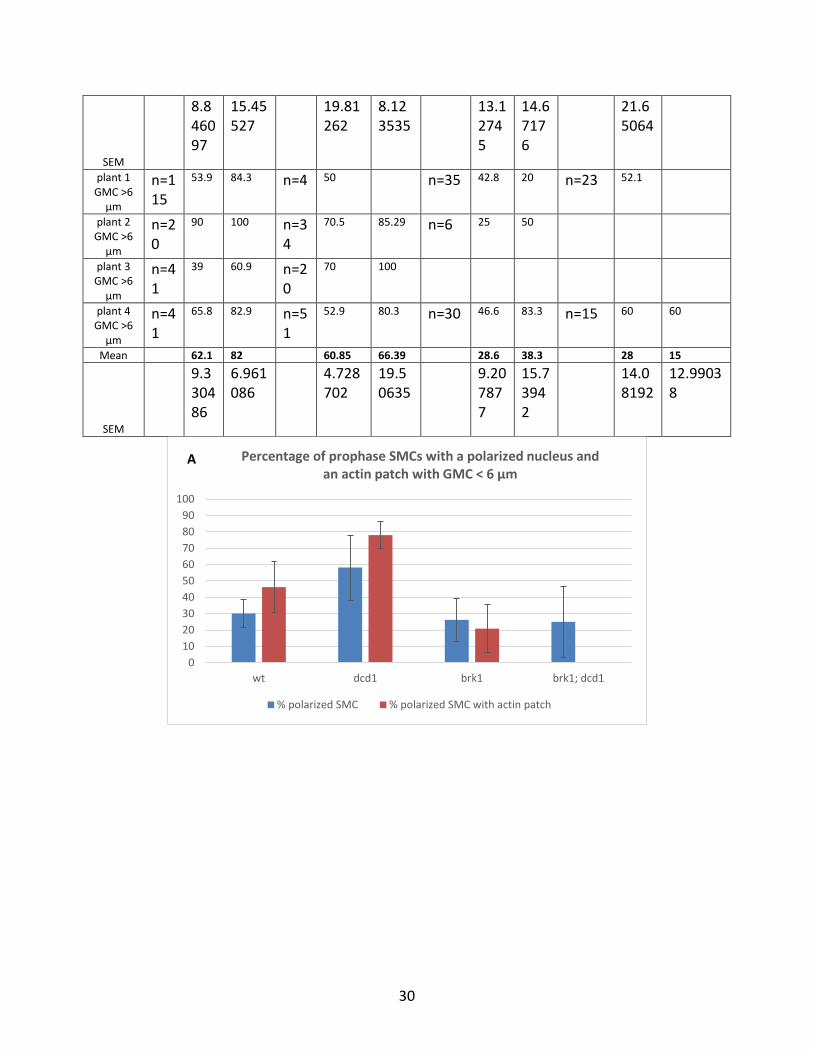
Mean 62.1 82 60.85 66.39 28.6 38.3 28 15
SEM
9.330486
6.961086
4.728702
19.50635
9.207877
15.73942
14.08192
12.99038
0102030405060708090
100
wt dcd1 brk1 brk1; dcd1
Percentage of prophase SMCs with a polarized nucleus and an actin patch with GMC < 6 µm
% polarized SMC % polarized SMC with actin patch
A

31
Figure 3.9. Percentage of prophase SMCs, with respect to the size of the adjacent GMC, with polarized nuclei and the percentage of the cells with polarized nuclei that have an actin patch. A) percentage of prophase SMCS adjacent to a GMC with a width < 6 µm. B) percentage of prophase SMCS adjacent to a GMC with a width > 6 µm. Error bars indicates SEM (standard error of the mean).
3.4 Phragmoplast Orientation in SMCs
The orientation of phragmoplast in all four genotypes was also observed, though the
percentage of SMCs with abnormally positioned phragmoplasts was not calculated. In wild type
plants, during cytokinesis, it has been observed that phragmoplast develops from remnants of
spindle assembly and grows towards the cortical division site, which was established by the pre-
prophase band during prophase. Figure 3.10 shows variation in the positioning of
phragmoplasts in dividing SMCs in wild-type, dcd1, brk1 and brk1; dcd1. In case of the
asymmetric cell division under study, wild-type SMCs develop a normal phragmoplast at the
site of the cortical division site (CDS). In case of mutant’s phragmoplasts, they expand away
from CDS and many times are located in the corner of a cell as opposed to adjacent to the GMC.
0
20
40
60
80
100
wt dcd1 brk1 brk1; dcd1
Percentage of prophaseSMCs with a polarized nucleus and an actin patch with
GMC > 6 µm
% polarized SMC % polarized SMC with actin patch
B

32
This type of phragmoplast development leads to the abnormal shape of the subsidiary cell since
phragmoplast positioning is essential for correct cell plate positioning between daughter cells.
Figure 3.10. Phragmoplast orientation in wild-type, dcd1, brk1 and brk1; dcd1 SMCs. (A) arrow indicates wild type normal phragmoplast. (B) Misoriented phragmoplast in brk1 mutant (away from plane of cortical division site. (C) Normal phragmoplast in dcd1 mutant. (D) brk1; dcd1 double mutant phragmoplast is tilted and off track.
A B
D C
SMC

33
CHAPTER 4
DISCUSSION
The subsidiary mother cell (SMC) division during stomatal complex formation is an
asymmetric cell division that produces a large epidermal cell and a smaller, sister subsidiary
cell. Mutants such as brk1 and dcd1 have a high number of abnormally shaped subsidiary cells.
brk1 mutants have defects in actin polymerization while dcd1 mutants have defects in
microtubule organization, specifically the formation of an organized PPB. The abnormal shape
of the subsidiary cells in brk1 mutants has been attributed to a failure of the SMC nucleus to
polarize in preprophase. Results from our study and previous studies indicate an absence of
actin patches in brk1 mutants. The dcd1 mutants have abnormal subsidiary cells due to
disorganized PPBs (Wright et al. 2009). Here, we examine the synergistic effect of the brk1 and
dcd1 mutations in the double mutant as opposed to the expected additive effect.
Experiments were conducted to determine the cause of the abnormal shape of the
subsidiary cells in the double mutant, brk1; dcd1. Actin staining was carried out to observe the
actin patches in dividing SMCs in each genotype. The study included a microscopic visualization
of the actin patch and the degree of SMC nuclear polarization at each stage of the cell cycle.
Propodium iodide was used to stain the DNA in nucleus and fluorescent phalloidin was used to
visualize actin microfilaments.
The process of SMC division starts with nuclear migration towards adjacent guard
mother cell. The results indicate that all wild type, brk1, dcd1 and brk1; dcd1 SMCs had similar
levels of nuclear migration when the polarizing GMC was immature and mature. This result is
in contrast to previously published results, which suggested defects in nuclear migration in the
34
brk1 mutant (Gallagher and Smith. 2000). This issue needs to be revisited with additional data
collection and analysis. One issue may be sampling error where a large number of very
immature GMCs were evaluated in one study and a large number of very mature GMCs were
evaluated in another study. There may have also been differences in what constituted a fully
migrated nucleus in each study.
The organization of an actin patch is a key characteristic in the asymmetric SMC division.
In dividing SMCs, the percentage of SMCs containing an actin patch was highest in wild type
and dcd1 mutants with the brk1 and brk1; dcd1 double mutants showing the least percentage
of SMCs with an actin patch. The difference between the two groups was greatest in SMCs
adjacent to mature GMCs. This behavior could be explained by concept of maturity and
reliability of signals coming from the mature GMCs. When actin patches were considered only
during metaphase and anaphase, the percentage of dcd1 SMCs with actin patches declined
relative to wild type. It is interesting to note that the double mutant phenotype is not
significantly worse than the brk1 single mutant an any stage of the cell cycle suggesting that
loss of DCD1 activity does not affect whether or not an actin patch forms inside a particular cell.
The size of actin patch is also essential factor in consideration of normal stomata
formation through proper SMC division. The size of actin patch in dividing SMCs in relation to
the width of adjacent guard mother cell was analyzed. It was observed that, in SMCs adjacent
to GMCs with a width < 6 µm, actin patch size was largest in WT and then brk1 and the smallest
in dcd1 and dcd1; brk1 double mutants. In SMCs adjacent to a GMC with a size > 6 µm (mature),
again the largest actin patches were found in wild type and then in the brk1 with the smallest in
the dcd1 and double mutants.

35
The observation that the size of actin patch was largest in wild type and the smallest in
the dcd1 mutant was quite surprising since dcd1 had not previously been implicated in any
actin-based processes. In SMCs, the PPB surrounds the area of the cortex where the actin
patch is formed. This data indicates that there may be a feedback mechanism between the PPB
and the actin patch that controls size actin patch size. Future investigations into this idea would
involve dual labeling of actin and microtubules in dividing SMCS in dcd1 mutants to see if there
is a correlation between disorganized PPB and actin patch size.
The percentage of SMCs with a polarized nucleus that had an actin patch during
preprophase and prophase was also evaluated to see if there was any correlation between
nuclear migration and actin patch formation. It is clear from the data that cells lacking an actin
patch are still capable of polarization suggesting that the actin patch is not required for nuclear
migration. This can also be interpreted as nuclear migration does not cause actin patch
formation.
Finally during SMC cytokinesis, the phragmoplast plays an important role in guiding the
cell plate between separated chromatids to the cortical division site. Similar to Malhortra
(2014) large numbers of brk1; dcd1 phragmoplasts were expanding off track predicting an
abnormally shaped subsidiary cell.
Overall, the work reported here and in Malhorta (2014) sought to clarify the cause of
the synergistic effect on SMC divisions created by combining the brk1 and dcd1 mutations.
Careful analysis of the microtubule and actin cytoskeletons at all stages of the cell cycle
identified PPB, spindle, and phragmoplast orientation as characteristics that are likely to be
worse in the double mutant when compared to either of the single mutants. PPBs in the

36
double mutant were more likely to be transverse than in either of the single mutants, the
spindle was more to be tilted, and the phragmoplast was more likely to be off track. These
results suggest that multiple processes function redundantly to ensure correct phragmoplast
positioning and thus normal cell shape. Loss of control over the microtubule and actin
cytoskeletons caused by the dcd1 and brk1 mutations impact the functionally redundant
mechanisms at the same time leading to abnormal phragmoplast orientation. For example, loss
of brk affects polarization of the SMC so a transverse instead of an asymmetric PPB forms.
However, the PPB is disorganized because the dcd1 mutation so the phragmoplast cannot track
back to the cortical division site and you end up with an abnormally shaped subsidiary cell. Or
in another case, the GMC signal is interpreted despite the brk1 mutation and the PPB forms in
the correct spot. However, it is disorganized so the cortical division site is insufficient. Also no
actin patch forms so the spindle is not anchored and it tilts out of position. Now phragmoplast
expansion begins in the wrong place and with the deficient cortical division site, the
phragmoplast cannot recover and cytokinesis produces an abnormally shaped cell.
Future experiments include a time course study of actin patch development with the
help of live cell actin markers in maize. Additionally triple labeling of microtubules, actin
filaments, and DNA in dividing SMCs may clarify some of the questions raised and provide
additional support for the explanation of the synergistic phenotype. It would also be useful to
examine double brk2; dcd1 mutants to see if they have the same synergistic affect. BRK2 is also
needed for ARP2/3 complex functioning and the results of this experiment would help us
distinguish if the observed synergy is brk1 specific or general to the actin cytoskeleton.

37
REFERENCES
Abrash, E. B. and Bergmann D. (2009). Asymmetric Cell Divisions: A View from Plant Development. Developmental Cell, 16, 783-796
Ambrose, J.C. and Cyr, R. (2008). Mitotic spindle organization by the preprophase band. Mol. Plant, 1, 950-960
Cartwright, H. N., Humphries, J.A., Smith, L. G. (2009) A Receptor-Like Protein That Promotes Polarization of an Asymmetric Cell Division in Maize. Science, 5914, 649-651
Cleary, A.L., Gunning, B.E.S., Wasteneys, G.O., Hepler, P.K. (1992) Microtubule and F–actin dynamics at the division site in living Tradescantia stamen hair cells. J. Cell Sci. 103, 977–988
Djakovic, S., Dyachok, J., Burke, M., Frank, M.J., Smith, L.G. (2006) BRICK1/HSPC300 functions with SCAR and the ARP2/3 complex to regulate epidermal cell shape in Arabidopsis. Development 133(6): 1091-100
Facette M. R. and Smith L. G. (2012). Division polarity in developing stomata. Current opinion in plant biology. 15 (6): 585-592
Frank, M.J., Cartwright, H.N. and Smith, L.G. (2003). Three Brick genes have distinct functions in a common pathway promoting polarized cell division and cell morphogenesis in the maize leaf epidermis. Development 130(4) 753-62
Frank, M.J. and Smith, L.G. (2002). A small, novel protein highly conserved in plants and animals promotes the polarized growth and division of maize leaf epidermal cells. Current Biology 12(10) 849-53
Galatis, B. and Apostolakos, P. (2004) The role of the cytoskeleton in the morphogenesis and function of stomatal complexes. New Phytol 161, 613-639
Gallagher K. and Smith L.G. (1999). Discordia mutations specifically misorient asymmetric cell divisions during development of the maize leaf epidermis. Development 126, 4623-4633
Gallagher, K. and Smith, L. G. (2000). Roles for polarity and nuclear determinants in specifying daughter cell fates after an asymmetric division in the maize leaf. Curr. Biol. 10, 1229-1232
Giannoutsou, E., Apostolakos, P. and Galatis, B. (2011) Actin filament-organized local cortical endoplasmic reticulum aggregations in developing stomatal complexes of grasses. Protoplasma 248,373-390
Hepler, P. K., Vidali, L. and Cheung, A. Y. (2001). Polarized cell growth in higher plants. Annu. Rev. Cell Dev. Biol. 17, 159-187

38
Humphries, J.A., Vejlupkova, Z., Luo, A., Meeley, R.B., Sylvester, A.W., Fowler, J.E., and Smith, L.G. (2011). ROP GTPases act with the receptor-like protein PAN1 to polarize asymmetric cell division in maize. Plant Cell 23: 2273–2284
Hussey, P.J., Hawkins, T.J., Igarashi, H., Kaloriti, D. and Smertenko, A. (2002) The plant cytoskeleton: recent advances in the study of the plant microtubule-associated proteins MAP–65, MAP–190 and the Xenopus MAP215-like protein, MOR1. Plant Mol. Biol. 50, 915–924
Ivakov A. and Persson S. (2013) Plant cell shape: modulators and measurements. Front plant science 4:439
Kirik, A., Ehrhardt, D., and Kirik, V. (2012). TONNEAU2/FASS regulates the geometry of microtubule nucleation and cortical array organization in interphase Arabidopsis cells. Plant Cell 24, 1158-1170
McCurdy, D. W. and Gunning, B. E. S. (1990) Reorganization of cortical actin microfilaments and microtubules at preprophase and mitosis in wheat root-tip cells: a double label immunofluorescence study. Cell Motil. Cytoskel. 15, 76-87
Muller, S., Wright, A., Smith, L. G. (2009). Division plane control in plants: new players in the band. Trends Cell Biology, 19, 180-188
Palevitz, B.A. (1987) Actin in the preprophase band of Allium cepa. J. Cell Biol. 104, 1515–1519
Panteris, E., Apostolakos, P., and Galatis, B. (2006). Cytoskeletal asymmetry in Zea mays subsidiary cell mother cells: a monopolar prophase microtubule half-spindle anchors the nucleus to its polar position. Cell Motil Cytoskeleton 63, 696-709
Raven P.H., Evert R.F., Eichhorn S.E. (2005): Biology of Plants, 7th Edition, W.H. Freeman and Company Publishers, New York, ISBN 0-7167-1007-2
Rhyu, M. S. and Knoblich, J. A. (1995) Spindle orientation and asymmetric cell fate. Cell 82, 523-526
Scheres, B., Benfey, P.N. (1999) Asymmetric cell division in plants. Annu Rev Plant Physiol Plant Molec Biol 50:505-537
Stebbins, G., and Shah, S. (1960) Developmental studies of cell differentiation in the epidermis of monocotyledones. II. Cytological features of stomatal development in the Gramineae. Dev. Biol. 2: 477–500
Sutimantanapi D, Pater D, Smith LG. (2014). Divergent roles for maize PAN1 and PAN2 receptor-like proteins in cytokinesis and cell morphogenesis. Plant phys 164 (4): 1905 - 1917
Taiz, E. Zeiger (2006): Plant Physiology, 4th Edition, Sinauer Associates, Inc., Publishers, Sunderland, MA, ISBN 0-87893-856-7

39
Wright, A.J., Gallagher, K. and Smith, L.G. (2009) discordia1 and alternative discordia1 function redundantly at the Cortical Division Site to promote preprophase band formation and orient division planes in maize. The Plant Cell vol. 21 234-247
Zhang, X., Facette M., Humphries, J., Shen, Z., Park, Y., Sutimantanapi, D, Sylvester, A.W., Briggs, S.P., and Smith, L.G. (2012) Identification of PAN2 by Quantitative Proteomics as a Leucine-Rich Repeat–Receptor-Like Kinase Acting Upstream of PAN1 to Polarize Cell Division in Maize .The Plant Cell, 24, 4577–4589
![CYTOSKELETON NEWS - fnkprddata.blob.core.windows.net · Dynamic remodeling of the actin cytoskeleton [i.e., rapid cycling between filamentous actin (F-actin) and monomer actin (G-actin)]](https://static.fdocuments.us/doc/165x107/609edd2b88630103265d18ee/cytoskeleton-news-dynamic-remodeling-of-the-actin-cytoskeleton-ie-rapid-cycling.jpg)


![Actin cytoskeleton and cell motility - Indico [Home]indico.ictp.it/event/a10138/session/33/contribution/22/material/0/... · Actin cytoskeleton and cell motility Julie Plastino, UMR](https://static.fdocuments.us/doc/165x107/5bcc339f09d3f232618dcbfd/actin-cytoskeleton-and-cell-motility-indico-home-actin-cytoskeleton-and.jpg)