Soluble Factors From Lactobacillus GG Activate MAPKs and Induce

i
Cover
THE ROLE OF SOLUBLE FACTORS AFFECTING
THE MAJOR HISTOCOMPATIBILITY COMPLEX
CLASS I MOLECULES IN AN IN VITRO MODEL
OF THE FETOMATERNAL INTERFACE
A thesis submitted for the degree of Doctor of Philosophy
School of Biological Sciences University of Essex United Kingdom Revised version June 2016
Soukaina Miya Hakam

i
This thesis is dedicated to all the mothers in the world, for putting their bodies through
tremendous changes to give us life. For supporting us, through thick and thin and, for their
unconditional love. This thesis is especially dedicated to my mother who never stopped
giving herself to us in countless ways. For her constant encouragement, limitless giving, love
and sacrifice, made this thesis possible.
Je t’aime mama
2
Abstract
Human main histocompatibility complex is encoded in the short arm of chromosome 6 and can be
divided into three main regions based on the proteins that it encodes. We have class I, class III and class
II. Class I encodes for proteins that are expressed on the cell surface of almost all somatic cells and is
related to the presentation of self-antigens. Class I can be sub-divided into two groups known as classical
class I (Ia) and non-classical class I (Ib), and expressed on the cell surface as human leukocyte antigen
(HLA). HLA-G is one of the members of HLA-Ib and, together with HLA-E and HLA-F, is thought to
play a key role in maternal tolerance to the semi-allogenic embryo, one haplotype comes from the
mother, and is shared with her, while the other comes from the father. At the trophoblast stage, embryos
do not express HLA-II and only express HLA-C (Ia member). Based on these facts, important questions
about the role of these antigens during pregnancy have arisen. Our premise is that PreImplantation Factor
(PIF), a 15 amino acid peptide secreted only by viable embryos, seems to plays a key role in this
regulation. In this study we have used the JEG-3 cell line as a human trophoblastic model to study the
effect of PIF on HLA-I expression. JEG-3 cells were incubated at different concentrations and time
points of PIF. Using a wide variety of techniques, we could detect that PIF significantly induced HLA-I
expression, mainly HLA-G and -E, increased their invasion, proliferation in vitro. Also, PIF modified
protein profile, detected by 2D electrophoresis. Compared with the untreated cells, 14 proteins were over-
expressed and 8 were under-expressed. Our study suggests that PIF, has a regulatory effect on HLA-I in
this cellular model and the fact that not only HLA-G was over-expressed can suggest new regulations
pathways under the control of HLA-E.

3
Papers and conference papers
Article (abstract): A. Jabeen, S. M. Hakam, J. M. Miranda-Sayago and N. Fernandez (2015). Regulation of the major histocompatibility
complex class I molecules on trophoblast cells: role of the preimplantation factor (PIF*). "Poster Abstracts." American Journal of Reproductive
Immunology 73: 23-49.
Article (abstract): A. Jabeen A., B. Obara, S. Hayrabedyan, S. M. Hakam, J. Pallavi, P. S. Spencer, P. P. Laissue and N. Fernandez (2014).
"Effect of infection on heterotypic associations of immune receptors expressed on trophoblast-derived cells." Journal of Reproductive
Immunology 101: 30-31.
Article (abstract): S. M. Hakam, J. H. Pallavi, T. Sachiyo, E. R. Barnea and N. Fernandez (2014). "Preimplantation factor (PIF*) regulates
HLA-G expression at the fetomaternal interface." Journal of Reproductive Immunology 101–102: 51.
Article: P. S. Spencer, S. M. Hakam, P. P. Laissue, A. Jabeen, P. Jain, S. Hayrabedyan, K. Todorova, A. Blanch, J. M. McElhinney, N.
Muhandiram, S. Alkhatib, G. B. Dealtry, J. M. Miranda-Sayago and N. Fernandez (2012). "Key cellular components and interactive
histocompatibility molecules regulating tolerance to the fetal allograft." Am J Reprod Immunol 68(2): 95-99.
Article (abstract): P. Jain, A. Jabeen, A. Blanch, S. M. Hakam and P. P. Laissue. (2012). The interaction of the cytoskeleton with
histocompatibility molecules on trophoblast cells: Relevance for foeto-maternal tolerance. "15th Biennial Meeting of the European Society for
Immunodeficiency." Journal of Clinical Immunology 32(1): 1-379.
Article (abstract): P. Jain, A. Blanch, A. Jabeen, S. M. Hakam, P. Laissue and N. Fernandez. (2012). The effect of all-trans retinoic acid on
histocompatibility receptor distribution at the foeto-maternal interface. "Poster Sessions." Immunology 137: 185-772.
Conference paper: A. Jabeen, S. M. Hakam, S. Alkhatib and N. Fernandez (2012). Trophoblast responses under co-infection with viral and
bacterial agents. 13th International Symposium for Immunology of Reproduction, 22-24 June 2012, Varna, Bulgaria; 05/2012.

4
Acknowledgements
This thesis represents not only my work at the laboratory, but also a personal achievement. My
experience at the University of Essex has been nothing short of amazing, and it has sort of become home
to me. I have been given many opportunities, including studying under the supervision of Professor
Nelson Fernandez, and I have taken advantage of each of these. Throughout my PhD, I have learnt that
there are those who carry out the research, and there are those who use that research; I for one have found
that my passion is in investigating the un-investigated, and pushing my limits. This thesis presents not
only the study carried out during my PhD, but also the result of hundreds of hours of work by myself and
several other people, all of whom I wish to thank. This thesis is also the result of the many experiences
encountered during my time at the University of Essex, all of which have contributed to this PhD in one
way or another.
First and foremost, I wish to thank my supervisor, Professor Nelson Fernandez. He has been
supportive since the day I began as an undergraduate at the University of Essex; since the first ever
immunology class Professor Fernandez has managed to instil in me a love for immunology and
encouraged me to pursue a PhD. Ever since, Professor Fernandez has supported me not only
academically by being a brilliant supervisor, but also emotionally through the rough and bumpy journey
that it was to finish this thesis. Thanks to him, I had to opportunity to study the field of reproductive
immunology, one which only a few understand and appreciate. He helped me to come up with a thesis
topic, and has guided me over the years. During the most difficult times of this thesis, he gave me the
moral support, the push, and the encouragement I needed to progress.
Several people have helped me and taught me immensely through the course of my PhD. Asma
Jabeen, welcomed me to the lab since day one. She has been a source of energy and of wisdom ever
since; she taught me all I needed to know and encouraged me at times when I was ready to give up. Julie
Arvidson, a wonderful support in the lab, who has been a mentor in the lab, and an inspiration on how to
make things ‘perfect’. A special acknowledgement goes to my students, Sachiyo Tarui, Helene Solli, and

5
Sona Vardanyan, who have been wonderful students, and who gave me the opportunity to teach them.
Thank you for all of your patience and for the encouragement. Thank you for all the wonderful ideas you
gave, all of which were important in realising this PhD, and most of all thank you for your friendship.
A special person has not yet been mentioned, because he deserves his own part: Dr. Jose Maria
Miranda-Sayago. I praise the enormous amount of help and teaching that you have offered me. Thank
you for helping through the years, and for taking me back to the basics, and teaching me when nothing
made sense to me. Thank you for being there to discuss ideas even when they were Ludacris at all hours.
Thank you for pushing me and for believing in the work I was doing. Thank you for being who you are,
and thank you for being a friend. It truly was special to be able to work with you and to be able to learn
from such a person.
I am going to finish giving thanks to the people where the most basic source of my life energy
resides: My family. I have an amazing family, unique in many ways. Their support has been
unconditional through all these years. Sabrine, thank you for always being there to listen, to reassure me,
and to help, thank you for being the best sister anyone could wish for. Thank you for the emotional
support you have offered me throughout my studies. Hadi, your constant questions have led to some of
the hypothesis included in this thesis, your love and support have been well needed through this PhD,
your hugs and words of wisdom to me are priceless. Thank you for all the love, and the jokes. Mama, I
express my sincere gratitude to you, for all that you have done for me, and for all that you have given up.
Thank you for believing in me even when I didn’t believe in myself, thank you for supporting me through
it all, through the times of uncertainty and the times of happiness. Thank you for teaching me to never
give up, and encouraging me to do this PhD, it has been one of the most testing times, but also one of the
best times of my life Thank you for being not only a mother, but also my best friend and a mentor. Thank
you for giving me life, and for putting yours on hold to get me this far. Last of all, I would like to thank
Naheem, my husband, for being patient with me, for loving me, supporting me and encouraging me
during the final stages of this PhD. Thank you for being there when I was irrational and for always
pulling me back. Thank you for all that you have done. Thank you.
Soukaina Miya Hakam

6
Abbreviations
2-DE 2 dimensional electrophoresis gel
5-HT Serotonin
β2M β2-microglobulin
ABC Antigen binding capacity
AM Acetomethylester moiety
BAE Background antibody equivalent
BCA Bradford protein assay
BSA Bovine serum albumin
CHAPS 3-[(3-cholamidopropyl) dimethylammonio]-1-propanesuflate
COX-2 Cyclooxygenase-2
DM Decidual macrophages
DMEM Dulbecco’s modified eagle medium
DMSO Dimethyl sulfoxide
dNK Decidual natural killer cells
DTT Dithiothreitol
ELISA Enzyme linked immunosorbent assays
EVCT Extravillous cytotrophoblast
FACS Flow analysis cell sorting
FCS Foetal calf serum
FITC Fluorescein isothiocyanate
FSC Forward scatter
GH Growth hormone
GM-CSF Granulocyte macrophage colony stimulating factor
hCG Human chorionic gonadotropin
hCS Human chorionic somatomammotropin
HhCG Cyperglycosylated hCG
HLA Human leukocyte antigen
hPL Human placental lactogen
hPR Human progesterone receptor
IEF Isoelectric focusing
IFN Interferon
7
IGF-2 Insulin growth factor 2
IL Interleukin
ILT Immunoglobulin-like transcript
IPG Immobilized pH gradient
IVF In vitro fertilization
KIR Killer immunoglobulin like receptor
LIF Leukaemia inhibitory factor
LILRB Leukocyte immunoglobulin like receptor family B
MΦ Macrophages
mAb Monoclonal antibody
MALDI-TOF-MS Matrix assisted laser desorption ionization time of flight mass spectrometry
M.F.I. Mean fluorescence intensity
MHC Major histocompatibility complex
MMP Metalloproteinase
MTS 3-(4,5-dimethylthiazol-2-yl)-5-(3-carboxymethoxyphenyl)-2-(4-sulfophenyl)-2H-tetrazolium
MS Mass spectrometry
Mw Molecular weight
NK Natural killer
P4 Progesterone
PAGE Polyacrylamide gel electrophoresis
pAPCs Professional antigen presenting cells
PBS Phosphate buffered saline
PBL Peripheral blood lymphocytes
PD Population doubling
PE Pre-eclampsia
PES Phenazine ethosulfate
PFA Paraformaldehyde
pI Isoelectric point
PIBF Progesterone-induced blocking factor
PIF Preimplantation factor
PMF Peptide mass fingerprinting
pNK Peripheral blood natural killer cell
PR Progesterone receptor
PRE Progesterone receptor element
8
PRL Prolactin
PVDF Polyvinyldine fluoride
RIA Radioactive immunosorbent assay
RLX Relaxin
RO Reverse osmosis
RT Room temperature
SABC Specific antibody-binding capacity
SDS Sodium dodecyl sulphate
sPIF* Synthetic scrambled PIF
sPIF Synthetic PIF
ST Syncytiotrophoblast
SSC Side scatter
TEMED Nnnn-tetramethylethylediamine
TGF Tumour growth factor
Th T helper lymphocyte
TNF Tumour necrosis factor
Treg Regulatory T lymphocyte
uNK Uterine natural killer
VCT Villous cytotrophoblast
VEGF Vascular endothelial growth factor
Wb Western blot
Note: Not all the abbreviations that can be found in the text are in this list as they are international units
that should be known by a person with a degree or higher (i.e. h for hours, min for minutes, kDa for
kilodalton, M for Mole, etc.)

9
Table of contents
COVER......................................................................................................................................................0
ABSTRACT.................................................................................................................................................2
PAPERSANDCONFERENCEPAPERS...........................................................................................................3
ACKNOWLEDGEMENTS.............................................................................................................................4
ABBREVIATIONS.......................................................................................................................................6
TABLEOFCONTENTS.................................................................................................................................9
LISTOFFIGURES.....................................................................................................................................13
LISTOFTABLES.......................................................................................................................................16
CHAPTERI.INTRODUCTION....................................................................................................................17
1.1 BACKGROUND......................................................................................................................................18
1.2 THEIMMUNOLOGICALPARADOXASFIRSTADDRESSEDBYMEDAWAR...............................................................18
1.3 THEMIRACLETHATISPREGNANCY............................................................................................................20
1.3.1 Menstrualcycle.......................................................................................................................20
1.3.2 Embryoimplantation...............................................................................................................22
1.3.3 Establishingapregnancy.........................................................................................................23
1.3.4 Thetrophoblastcell.................................................................................................................25
1.4 IMMUNECELLSINVOLVEDINPREGNANCY...................................................................................................26
1.4.1 Naturalkillercells(NKcells)....................................................................................................27
1.4.2 Macrophages(MΦ).................................................................................................................28
1.4.3 Tlymphocytes..........................................................................................................................29
1.5 SOLUBLEFACTORSATTHEFETOMATERNALINTERFACE..................................................................................31
1.5.1 Cytokines.................................................................................................................................31
1.5.2 PregnancyasaTh1orTh2state.............................................................................................32
10
1.5.3 Importanceofcytokinesinpregnancy.....................................................................................33
1.5.4 Hormones................................................................................................................................34
1.6 THEMAJORHISTOCOMPATIBILITYCOMPLEX...............................................................................................41
1.6.1 HumanleukocyteantigenG(HLA-G).......................................................................................44
1.6.2 HumanleukocyteantigenE(HLA-E)........................................................................................45
1.6.3 HumanleukocyteantigenC(HLA-C)........................................................................................46
1.6.4 HumanleukocyteantigenF(HLA-F)........................................................................................46
1.6.5 HLAinpregnancyandmedicine..............................................................................................47
1.7 PROJECTAIMS......................................................................................................................................48
CHAPTERII.MATERIALANDMETHODS...................................................................................................49
2.1 CELLLINESANDCELLCULTURETECHNIQUES................................................................................................50
2.1.1 Celllines...................................................................................................................................50
2.1.2 Mediaandcellculturegrowthconditions...............................................................................51
2.1.3 Cellculturetechniques.............................................................................................................52
2.1.4 Cellstimulations......................................................................................................................53
2.1.5 Cellproliferationassay............................................................................................................56
2.1.6 Invasionassay.........................................................................................................................56
2.1.7 Methodsfortotalproteinextractionandanalysis..................................................................57
2.1.8Flowcytometry..............................................................................................................................62
2.1.9 Statisticalanalysis...................................................................................................................71
CHAPTERIII.RESULTS:JEG-3ANDACH-3PCELLLINESCHARATERIZATIONANDSELECTION.....................72
3.1INTRODUCTION..........................................................................................................................................73
3.2 RESULTS..............................................................................................................................................73
3.2.1Trophoblast-derivedcelllinesculture............................................................................................73
3.2.2 ImmunoblotanalysisofHLA-IintheJEG-3andACH-3Pcells..................................................75
3.2.3 Surfaceantigenquantification................................................................................................78
3.2.4 Trophoblastcytokineprofile....................................................................................................80
3.2.5 HLA-G-specificcellsortoftheACH-3Pcellline........................................................................80
11
3.3 DISCUSSION.........................................................................................................................................85
CHAPTERIV.RESULTS:EFFECTSOFPROGESTERONEONJEG-3CELLS.......................................................91
4.1 INTRODUCTION.....................................................................................................................................92
4.2 RESULTS..............................................................................................................................................92
4.2.1 Timeanddoseprogesteroneinductionexperiments...............................................................92
4.2.2 ImmunoblottingoftheeffectofP4onHLA-IexpressedinJEG-3............................................94
4.2.3 EffectofP4overthephenotypeofHLA-IinJEG-3...................................................................95
4.2.4 Progesterone’seffectonJEG-3cellsmigration.......................................................................98
4.2.5 Progesterone’seffectonJEG-3cellsproliferation...................................................................99
4.2.6 JEG-3progesteronesecretioninresponsetoIL-17................................................................100
4.2.7 EffectofIL-17onHLA-GJEG-3surfaceexpression................................................................101
4.3 DISCUSSION.......................................................................................................................................103
CHAPTERV.RESULTS:EFFECTOFPREIMPLANTATIONALFACTORONJEG-3CELLS.................................109
5.1 INTRODUCTION...................................................................................................................................110
5.2 RESULTS............................................................................................................................................110
5.2.1 EffectofPIFonHLAexpression.............................................................................................110
5.2.2 AnalysisoftheeffectofP4andPIFonHLA-IinJEG-3cells...................................................114
5.2.3 Cellproliferation....................................................................................................................118
5.2.4 JEG-3cellinvasioninresponsetoP4andPIF........................................................................119
5.2.5 EffectofPIFandIL-17onP4secretiononJEG-3cells............................................................120
5.2.6 CytokineprofileofJEG-3inresponsetosolublefactors........................................................121
5.3DISCUSSION............................................................................................................................................123
CHAPTERVI.RESULTS:PROTEOMEAND2-DEANALYSIS.......................................................................129
6.1 INTRODUCTION...................................................................................................................................130
6.2 RESULTS............................................................................................................................................132
6.2.1 ProteinprofilesanalysisfromJEG-3cells,treatedanduntreated.........................................132
6.2.2 Identificationandstudy:differentiallyregulatedproteininJEG-3cells................................134

12
6.3 DISCUSSION.......................................................................................................................................145
CHAPTERVII.FINALDISCUSSION...........................................................................................................150
7.1 INTRODUCTION...................................................................................................................................151
7.2 TROPHOBLASTCELLLINES,AMEANSBYWHICHTOSTUDYHUMANPREGNANCY................................................152
7.3 HLAMOLECULESANDTHEIRROLEINHUMANPREGNANCY...........................................................................156
7.4 SOLUBLEFACTORSATTHEFETOMATERNALINTERFACE................................................................................163
CHAPTERVIII.FUTUREWORK...............................................................................................................169
8.1 INTRODUCTION...................................................................................................................................171
8.2 USINGAPRIMARYTROPHOBLASTCELLLINE...............................................................................................171
8.3 2-DEVALIDATIONSTUDIES....................................................................................................................172
CHAPTERIX.REFERENCES.....................................................................................................................173
13
List of figures
Figure 1.1. Human females’ menstrual cycle. .................................................................................. 21
Figure 1.2. The human fetomaternal microenvironment. ................................................................. 26
Figure 1.3. Role of natural killer cells at the fetomaternal environment. ......................................... 28
Figure 1.4. The T cells at the fetomaternal environment. ................................................................. 31
Figure 1.5. Role of soluble factors at the fetomaternal interface. .................................................... 41
Figure 1.6. Human chromosome 6 and MHC region. ...................................................................... 42
Figure 2.1. Summarized flow cytometry system. ............................................................................. 63
Figure 2.2. Bead population calibration curve tabulated mean fluorescence intensity (M.F.I) vs.
antigen binding capacity (ABC) (log-log scale) for the calibration bead populations. .................... 65
Figure 3.1. JEG-3 and ACH-3P growth curves. ............................................................................... 74
Figure 3.2. Results of the phenotype analysis studied by flow cytometry in a representative culture
of JEG-3 and ACH-3P. ..................................................................................................................... 75
Figure 3.3. Western blot analysis of lysates from both JEG-3 and ACH-3P cell cultures. .............. 76
Figure 3.4. Comparative study of intracellular HLA class I expression on JEG-3 and ACH-3P cell
lines. .................................................................................................................................................. 77
Figure 3.5. Comparative study of surface HLA class I expression of model trophoblastic cell lines.
.......................................................................................................................................................... 78
Figure 3.6. Comparative study of surface antigen quantification of HLA class I molecules in model
trophoblastic cell lines. ..................................................................................................................... 79
Figure 3.7. ACH-3P cell line specific sort using HLA-G as a marker. ............................................ 81
Figure 3.8. Growth curve for HLA-G+ and HLA-G- ACH-3P subpopulations. ............................... 83
Figure 3.9. Expression of HLA-G in ACH-3P HLA-G- subpopulation upon stimulation with P4 and
IFN-γ. ................................................................................................................................................ 84
Figure 4.1. Evaluation of progesterone dose effect on HLA-G surface expression by cultured JEG-
3 cells. ............................................................................................................................................... 93
14
Figure 4.2. Evaluation of progesterone incubation time over HLA-G surface expression by cultured
JEG-3 cells. ....................................................................................................................................... 94
Figure 4.3. Western blot analysis of P4 stimulated JEG-3 supernatants. ......................................... 95
Figure 4.4. Effect of P4 on intracellular HLA expression on JEG-3 cells. ...................................... 96
Figure 4.5. Effect of P4 on HLA surface antigen expression on JEG-3 cell line. ............................ 97
Figure 4.6. Surface vs. intracellular HLA expression of the JEG-3 trophoblastic cell line upon P4
stimulation. ....................................................................................................................................... 98
Figure 4.7. Representative invasive response of JEG-3 cells treated with or without hCG and P4. 99
Figure 4.8. Effect of P4, hCG and campthotecin on the proliferation of the JEG-3 cells. ............. 100
Figure 4.9. Representative P4 secretion by JEG-3 cells in response to IL-17. .............................. 101
Figure 4.10. The effect of IL-17 on HLA-G expression of JEG-3 cells. ........................................ 102
Figure 5.1. Evaluation of PIF dose effect on HLA-G surface expression. ..................................... 111
Figure 5.2. Evaluation of PIF time effect on HLA-G surface expression of JEG-3 cells. ............. 112
Figure 5.3. Effect of PIF on HLA surface antigen expression on JEG-3 cell line. ........................ 113
Figure 5.4. Effect of PIF on intracellular HLA expression of the JEG-3 cell line. ........................ 114
Figure 5.5. Western blot analysis of P4 and PIF stimulated JEG-3 supernatants. ......................... 115
Figure 5.6. Comparative study of effects of P4 and PIF on intracellular HLAs. ........................... 116
Figure 5.7. Comparative study of effect of P4 and PIF on the surface expression of HLAs by JEG-
3. ..................................................................................................................................................... 117
Figure 5.8. Comparative surface HLAs quantification after P4 or PIF treatment. ......................... 118
Figure 5.9. Effect of campthotecin, P4, and PIF on the proliferation of JEG-3 cells. .................... 119
Figure 5.10. Representative invasive response of JEG-3 cells to PIF, P4, and hCG. .................... 120
Figure 5.11. Representative P4 secretion by JEG-3 cells in response to of IL-17 and PIF at varying
time points. ..................................................................................................................................... 121
Figure 6.1. Representative 2-DE. ................................................................................................... 132
Figure 6.2. A master 2-DE gel representing twelve gels. ............................................................... 133
Figure 6.3. Histograms of protein spot adjusted volumes (mean ± SD) of the 22 spots identified to
be differentially expressed between the groups. ............................................................................. 134

15
16
List of tables
Table 2.1. List of human-derived-trophoblast cell lines used ........................................... 51
Table 2.2. Western blot buffer composition ...................................................................... 61
Table 2.3. Western blot gels composition ......................................................................... 61
Table 2.4. Antibodies used for proteomic techniques. ...................................................... 66
Table 2.5. Secondary antibodies used in proteomic techniques. ....................................... 67
Table 2.6. 2-DE buffers. .................................................................................................... 69
Table 2.7. Silver staining solutions. .................................................................................. 70
Table 3.1. PD time, morphology, and growth mode of trophoblast JEG-3 and ACH-3P cell
lines. ................................................................................................................................... 74
Table 3.2. Antigen quantification of surface HLAs as expressed by the JEG-3 and ACH-3P cell
lines. ................................................................................................................................... 79
Table 3.3. Cytokine secretion by JEG-3 and ACH-3P cell lines. ...................................... 80
Table 3.4. ACH-3P subpopulation characteristics. ............................................................ 82
Table 5.1. Effect of P4 and PIF on the secretion of cytokines by JEG-3 cells. ............... 122
Table 6.1. Differentially expressed spots as identified by MS ........................................ 135
Table 6.2. Statistically significant spots classified as overexpressed and under-expressed
............................................................................................................................ ……….136
Table 6.3. GO analysis of biological functions. .............................................................. 142
Table 7.1: JEG-3 cell line vs primary EVCT……………………………………………....153

17
CHAPTER I. INTRODUCTION
CHAPTER I
INTRODUCTION
18
1.1 Background
Evolution is a conservative process that relies on established mechanisms of change, these being
mutation, migration, genetic drift, and most importantly natural selection. Ancestral mammals, like the
modern day duck billed platypus were oviparous, and immunity as we know it, was in place. Only about
100 million years ago did placental reproduction and thus longer gestation periods begin to emerge (Ji
et al., 2002; Weil, 2002). The change from external to internal fertilisation and gestation, allowed for the
conceptus to be better protected from external hazardous environmental factors. It also meant that a
higher proportion of the young were live-born (Hunt e t al . , 2007). However, this presented the
pregnant female with a considerable immunological challenge as this destined the reproductive and
immune systems to work in close partnership with one another. This relationship between these two
systems would in theory hinder the survival of the human species, and in effect all mammals, as the two
have contrasting functions (Sacks et al., 1999). While the primary role of the immune system is to
destroy any non-self-structures or damaged tissues, the role of the reproductive system is to nourish and
maintain a foetus, which in essence is a semi-foreign body to the maternal system. However, on closer
inspection, the immune and reproductive systems are in fact similar, as Parham suggested in 2004; whilst
the immune system processes are driven by microbial factors, those of the reproductive system are
mediated by hormones (Parham, 2004) . Based on these principles, mammalian (human)
reproduction thus poses a paradox. Peter B. Medawar was one of the first researcher that tried to address
this paradox (Medawar, 1953).
1.2 The immunological paradox as first addressed by Medawar
As an embryo is the result of two different non-histocompatible individuals in an outbred
population mating, it is thus likened to a semi-allogenic graft (Thellin et al., 2000; Thellin and Heinen,
2003). Throughout pregnancy, the foetus requires nutrients and gas exchange from the mother, which
means that both share an intimate contact with one another. However, this close relationship between the
foetus and the mother has one main disadvantage for the foetus as it is a semi-allogenic graft. The

19
expression of molecules from the genetic father’s side that can be recognized as non-self-antigens, from
the mother’s immune system, and trigger an immune response and an abortion. This however, does not
happen. Several hypotheses have been proposed to explain foetal tolerance, the most notable of which are
those suggested by Peter B. Medawar in 1953 (Billington, 2003; Chaouat, 2015; Ribatti, 2015).
When Medawar first addressed this phenomenon he termed it as being an immunological paradox,
because any mechanism which is used by the foetus to avoid rejection by the mother will, somehow, be
inhibited by the need of both of these organisms to be able to ward off any invading organisms. Medawar
thus put forth a couple of hypothesis as to how the foetus is able to escape the usual providence of
transplants. How was the foetus able to thrive in the mother’s body during gestation, whilst allowing her
to maintain her immunity so as to fight off any harmful pathogens? The hypotheses suggested by
Medawar at the time were “that the anatomical separation of the foetus or inertness of the mother”
(Medawar, 1953; Billington, 2003; Veenstra van Nieuwenhoven et al., 2003). These hypotheses have
provided the theoretical starting platform that has enabled the scientific research to proceed for the better
half of a century.
Through countless research, it has been observed that the foetus does in fact possess immunogenic
properties, that the mother’s immune system is not suppressed and that the “uterus does not uniquely
protect the conceptus as an immune privileged site” (Thellin et al., 2000; Gronvik et al., 1987). Years of
research have disproved two of the three hypothesis, that of immature foetal antigens, and maternal
immunosuppression. Today the majority of research is reinforcing that it is in fact the anatomical
separation between mother and foetus that allows for such a paradox to exist, and to be considered as
natural (Moffett and Loke, 2004).
20
1.3 The miracle that is pregnancy
1.3.1 Menstrual cycle
The menstrual cycle is a complex and coordinated system, which can however be easily disturbed
by environmental factors (stress, eating disorders, etc.) and genetic influences (fragile X pre-mutations,
point mutations, etc.) (Popat et al., 2008). Menstruation is a recurring bodily function, in which the
uterine lining sloughs off as a result of the interactions that take place between the hormones that are
produced by the ovaries, pituitary and the hypothalamus (Hawkins and Matzuk, 2008). This process is
purely an opportunity by which to re-establish reproductive competence in an effort to prepare the uterus
for the next cycle and, maybe, the annealing of a fertilized ovule (Figure 1.1).
21
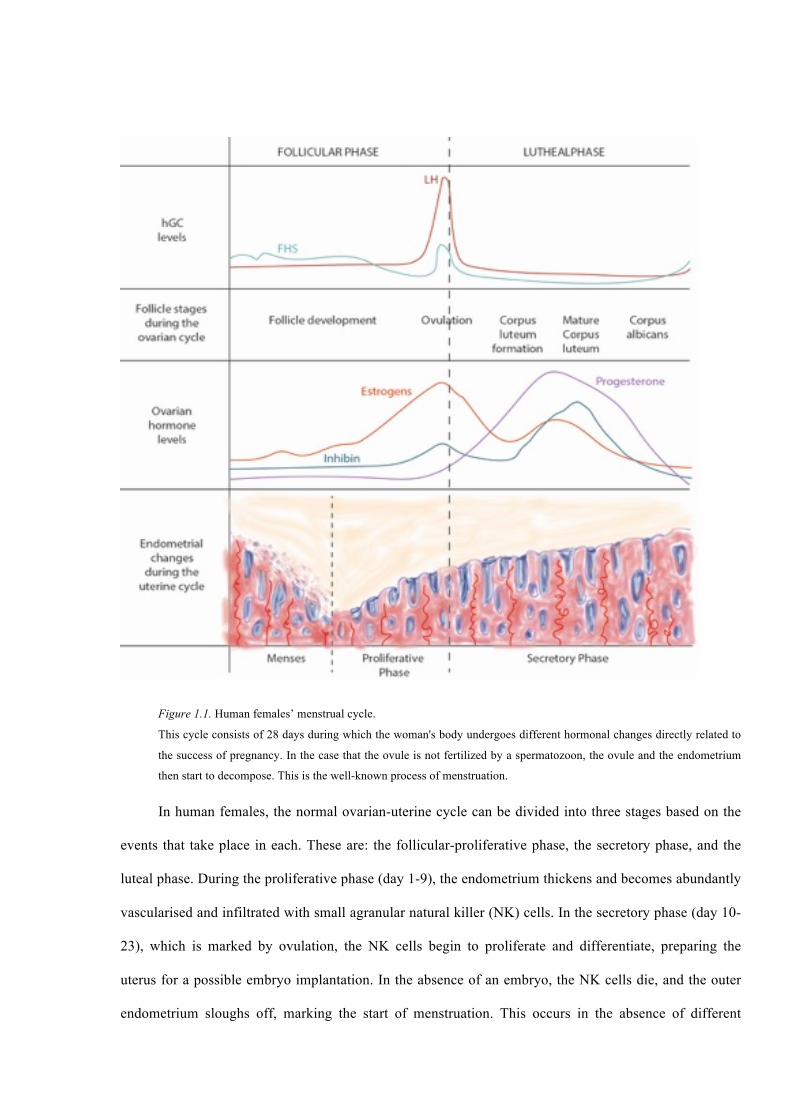
Figure 1.1. Human females’ menstrual cycle.
This cycle consists of 28 days during which the woman's body undergoes different hormonal changes directly related to
the success of pregnancy. In the case that the ovule is not fertilized by a spermatozoon, the ovule and the endometrium
then start to decompose. This is the well-known process of menstruation.
In human females, the normal ovarian-uterine cycle can be divided into three stages based on the
events that take place in each. These are: the follicular-proliferative phase, the secretory phase, and the
luteal phase. During the proliferative phase (day 1-9), the endometrium thickens and becomes abundantly
vascularised and infiltrated with small agranular natural killer (NK) cells. In the secretory phase (day 10-
23), which is marked by ovulation, the NK cells begin to proliferate and differentiate, preparing the
uterus for a possible embryo implantation. In the absence of an embryo, the NK cells die, and the outer
endometrium sloughs off, marking the start of menstruation. This occurs in the absence of different
22
hormones like the human chorionic gonadotropin (hCG). If during the secretory phase, an embryo
adheres and subsequently implants itself to the endometrium (essentially becoming a blastocyst and an
allograft), pregnancy ensues this bringing menstruation to a halt for the coming nine months. If the
embryo adheres to the endometrium it stars secrete hCG which, in turn, stimulate the cells of the corpus
luteum to secrete estrogen and progesterone (P4) so that they decidualize the endometrium while
supporting the embryo until the placenta is mature enough function independently and nurture the
embryo.
1.3.2 Embryo implantation
Though placental mammals are very diverse, in their early stages, they all follow a similar
progression (Hardy et al., 1989). Proceeding fertilization, the zygote which is enclosed in the zona
pellucida undertakes several cleavage divisions, compacts to create a morula, after which at the blastocyst
stage it collects fluid in the central blastocoel cavity (Cunningham et al., 2009). This blastocyst expands
after which it hatches from the zona pellucida and implants itself in the uterine wall (Hardy et al., 1989).
After fertilization, the implantation process takes place anywhere from six to seven days ensuing
fertilisation (Staun-Ram and Shalev, 2005). The process of implantation can be divided into three stages:
apposition, stable adhesion, and lastly invasion. Apposition, which is an unstable, is where the pinopodes
interlock with the microvilli on the apical syncytiotrophoblast surface of the blastocysts, thus establishing
the primary adhesion of the blastocyst to the uterine wall (Vigano et al., 2003; Norwitz et al., 2001). In
the next stage, there is an amplified physical contact between the uterine epithelium and the blastocyst,
this denoting the second stage of implantation, the stable adhesion (Staun-Ram and Shalev, 2005). Lastly,
trophoblast cells, more specifically the syncytiotrophoblast cells, penetrate the uterine epithelium and the
mononuclear cytotrophoblasts invade the entire endometrium. By proliferating outwards to form cell
columns, the villous cytotrophoblast cells are able to migrate into the decidua and, hence, invade the
maternal spiral arteries, allowing the trophoblast to be in direct with the maternal blood, thus establishing
the utero-placental circulation (Loke and King, 2000).

23
1.3.3 Establishing a pregnancy
The predecessor cells of the placenta are the trophoblast cells, which appear four days following
fertilization in the form of the outer cell mass of the blastocyst, which is also composed of an inner cell
mass which later develops into the foetus. The early blastocyst trophoblast cells differentiate to yield all
of the cell subtypes that comprise the human placenta (Loke and King, 2000). Within the first week of
gestation, a separation between the maternal tissues and the foetal cells is already established by a layer
of cytotrophoblast and syncytiotrophoblast cells. This parting is essential for nutrient exchange, but most
importantly to protect the developing foetus from any form of immunologic attack that may be triggered
by the mother (Thellin and Heinen, 2003). As of four weeks of gestation, the basic structure of the mature
placenta is already in place though the foetus is less than two centimetres in diameter. At this stage, foetal
circulation that ends in capillary loops within the chorionic villi penetrates the maternal blood-filled
intervillous space, which is supplied by spiral arteries and drained by uterine veins. The chorionic villi
which are closest to the maternal blood supply continue to develop and expand into a corpus of chorionic
tissue, better known as the placenta (Godfrey, 2002).
The foetal circulation enters the placenta via the umbilical arteries which are embedded in the
umbilical cord, where they then branch out into cotyledons. The finest of these branches are composed of
capillary loops within the chorionic villi (Cunningham et al., 2009). Once the foetus has absorbed the
nutrients carried to it by the blood and released its waste products, the foetal blood collects in the
umbilical vein where it is returned to the umbilical cord. On the other hand, the maternal blood uses the
spiral arteries of the uterus to enter the placenta where, the maternal blood is poured into the intervillous
uterine veins (Cunningham et al., 2009). At term, up to 35% of the maternal blood flow passes through
the intervillous space in order to sustain the quickly developing foetus. In the placenta, the chorionic villi
are the main functional units and are responsible for eliminating waste, mediating the absorption of
nutrients, and producing the majority of hormones that are produced by the placenta during the course of
pregnancy (Godfrey, 2002). When fully developed, the placenta is able to produce a physical separation
between the mother and the developing foetus, while harbouring and feeding the foetus (Loke and King,
2000).
24
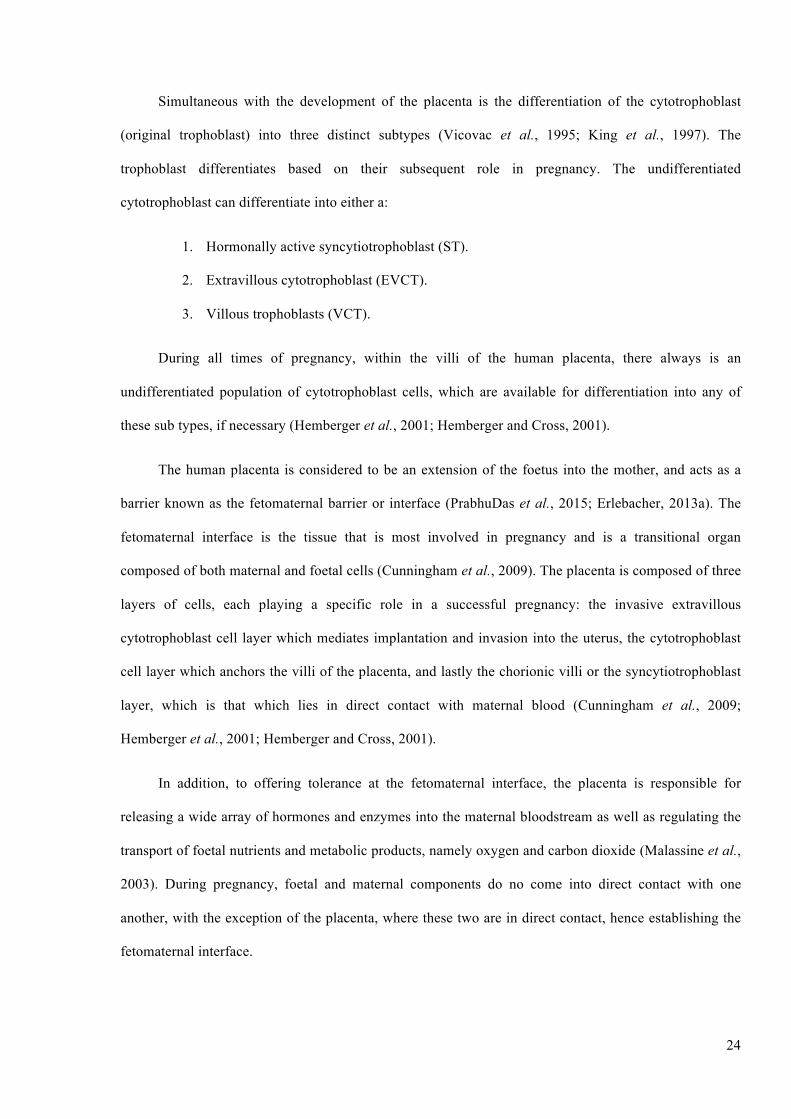
Simultaneous with the development of the placenta is the differentiation of the cytotrophoblast
(original trophoblast) into three distinct subtypes (Vicovac et al., 1995; King et al., 1997). The
trophoblast differentiates based on their subsequent role in pregnancy. The undifferentiated
cytotrophoblast can differentiate into either a:
1. Hormonally active syncytiotrophoblast (ST).
2. Extravillous cytotrophoblast (EVCT).
3. Villous trophoblasts (VCT).
During all times of pregnancy, within the villi of the human placenta, there always is an
undifferentiated population of cytotrophoblast cells, which are available for differentiation into any of
these sub types, if necessary (Hemberger et al., 2001; Hemberger and Cross, 2001).
The human placenta is considered to be an extension of the foetus into the mother, and acts as a
barrier known as the fetomaternal barrier or interface (PrabhuDas et al., 2015; Erlebacher, 2013a). The
fetomaternal interface is the tissue that is most involved in pregnancy and is a transitional organ
composed of both maternal and foetal cells (Cunningham et al., 2009). The placenta is composed of three
layers of cells, each playing a specific role in a successful pregnancy: the invasive extravillous
cytotrophoblast cell layer which mediates implantation and invasion into the uterus, the cytotrophoblast
cell layer which anchors the villi of the placenta, and lastly the chorionic villi or the syncytiotrophoblast
layer, which is that which lies in direct contact with maternal blood (Cunningham et al., 2009;
Hemberger et al., 2001; Hemberger and Cross, 2001).
In addition, to offering tolerance at the fetomaternal interface, the placenta is responsible for
releasing a wide array of hormones and enzymes into the maternal bloodstream as well as regulating the
transport of foetal nutrients and metabolic products, namely oxygen and carbon dioxide (Malassine et al.,
2003). During pregnancy, foetal and maternal components do no come into direct contact with one
another, with the exception of the placenta, where these two are in direct contact, hence establishing the
fetomaternal interface.
25
1.3.4 The trophoblast cell
Trophoblast cells are the major cell type involved in pregnancy and are the only foetal cells that ever
come into direct contact with the maternal tissue in the host uterus (Ober, 1998; Hunt et al., 2006).
The trophoblast is an extraembryonic cell, originating from the trophectoderm which, in the embryo, is
the first lineage to differentiate (Cunningham et al., 2009).
The trophoblast can be subdivided into several populations depending on its type of differentiation,
position in the foetus, and role in stimulating tolerance to the foetus (Hunt et al., 2006). As previously
mentioned, there are three subpopulations of trophoblast present, the ST, the EVCT and the VCT
(Kurman et al., 1984). Both the ST and EVCT are found within the placental villi. The ST is formed by
the fusing of the cytotrophoblasts and is responsible for producing the majority of placental hormones
critical to pregnancy, for the bi-directional transport of nutrients from mother to foetus, and of waste
products from foetus to mother (Kurman et al., 1984). The forefathers of all differentiated trophoblast
subpopulations, the cytotrophoblast have a more structural role. These cells form the anchoring cell
columns that are seen at the junction of the placenta and the endometrium throughout pregnancy. In other
words, they fuse with the syncytium, so as to provide more placental space for the developing foetus.
Also arising from the cytotrophoblast are the EVCT cells, which travel through the intersitium to replace
the endothelial cells, removing control on vasodilation and vasoconstriction, and essentially allowing the
mother’s blood to flow over the placenta. Trophoblast cells play other pivotal roles apart from preparing
and remodelling the endometrium, to allowing for the implantation of the foetus and subsequently
modulating the immune response of the mother against the semi-allogenic graft that is the foetus (Aplin
and Kimber, 2004).
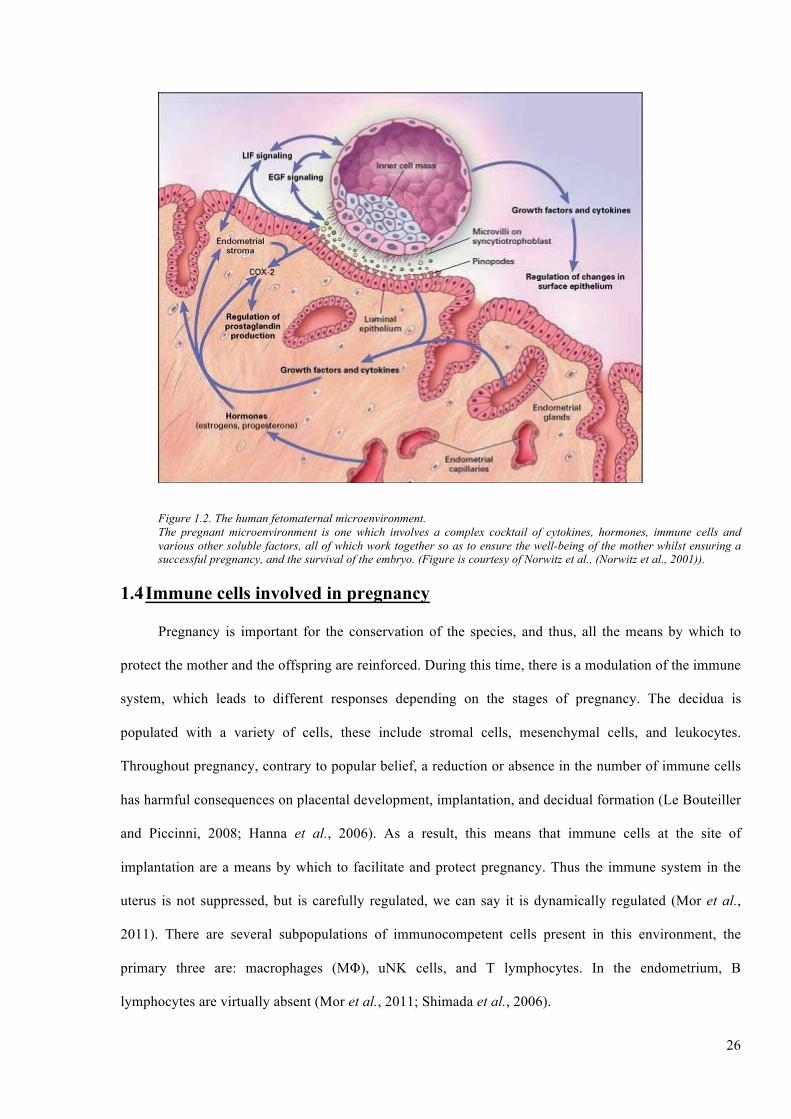
The trophoblasts and the placenta are not only essential in establishing the fetomaternal interface,
but also in producing essential hormones. In pregnancy, there is an overall hormonal change, as shown in
Figure 1.2.
26
Figure 1.2. The human fetomaternal microenvironment. The pregnant microenvironment is one which involves a complex cocktail of cytokines, hormones, immune cells and various other soluble factors, all of which work together so as to ensure the well-being of the mother whilst ensuring a successful pregnancy, and the survival of the embryo. (Figure is courtesy of Norwitz et al., (Norwitz et al., 2001)).
1.4 Immune cells involved in pregnancy
Pregnancy is important for the conservation of the species, and thus, all the means by which to
protect the mother and the offspring are reinforced. During this time, there is a modulation of the immune
system, which leads to different responses depending on the stages of pregnancy. The decidua is
populated with a variety of cells, these include stromal cells, mesenchymal cells, and leukocytes.
Throughout pregnancy, contrary to popular belief, a reduction or absence in the number of immune cells
has harmful consequences on placental development, implantation, and decidual formation (Le Bouteiller
and Piccinni, 2008; Hanna et al., 2006). As a result, this means that immune cells at the site of
implantation are a means by which to facilitate and protect pregnancy. Thus the immune system in the
uterus is not suppressed, but is carefully regulated, we can say it is dynamically regulated (Mor et al.,
2011). There are several subpopulations of immunocompetent cells present in this environment, the
primary three are: macrophages (MΦ), uNK cells, and T lymphocytes. In the endometrium, B
lymphocytes are virtually absent (Mor et al., 2011; Shimada et al., 2006).
27
1.4.1 Natural killer cells (NK cells)
Even before pregnancy, the endometrium is populated with NK cells, whose levels fluctuate during
the menstrual cycle and throughout the course of pregnancy. Moreover, as NK cells are present even
before conception, this suggests that the foetus does not have an effect on the distribution of these cells
(Bulmer, 1989; King and Loke, 1991).
NK cells make up to 70% of the decidual leukocyte population in early pregnancy. However, as
gestation progresses, the number steadily declines to become essentially absent at term (Koopman et al.,
2003; Ashkar and Croy, 1999). In comparison to the NK cells found in peripheral blood, the major subset
of NK cells in the uterus are the uNK, also referred to as the large granular lymphocytes (CD56bright
CD16- CD3-). This unique population of cells is found both in the pregnant and the non-pregnant
endometrium (King and Loke, 1991). Though these cells are insignificantly cytotoxic, in contrast to their
peripheral blood counterparts, they are nevertheless highly proliferative, and are known to express a wide
variety of adhesion molecules, cytokines, and NK receptors for interleukin (IL)-2, IL-10, granulocyte
macrophage colony stimulating factor (GM-CSF), interferon gamma (IFN-γ), tumour necrosis factor
alpha (TNF-α) and leukaemia inhibitory factor (LIF) (Figure 1.3) (Cooper and Broxmeyer, 2001). Uterine
NK cells express a wide range of inhibitory receptors that are known to interact with human leukocyte
antigen (HLA) class I molecules, delivering inhibitory signals to these cells once they recognize HLAs
bearing target cells. Of these inhibitory receptors, the most well-known are the killer cell
immunoglobulin like receptors (KIRs), CD94/NKG2 and immunoglobulin like transcript (ILT) (Menier
et al., 2008; Borrego et al., 2005). These are reported to bind to some of HLA class Ib molecules, i.e.
HLA-G on the trophoblast cell. The exact role of uNK cells is still not yet well established. However, it
has been reported that these cells regulate placental development, by mediating the foetal extraembryonic
trophoblast invasion (Moffett-King, 2002). In addition, as the number of the uNK cells decreases from
the start to the end of pregnancy, it has been hypothesized that the primary role of these cells is carried
out during the first trimester (Moffett-King, 2002).
28
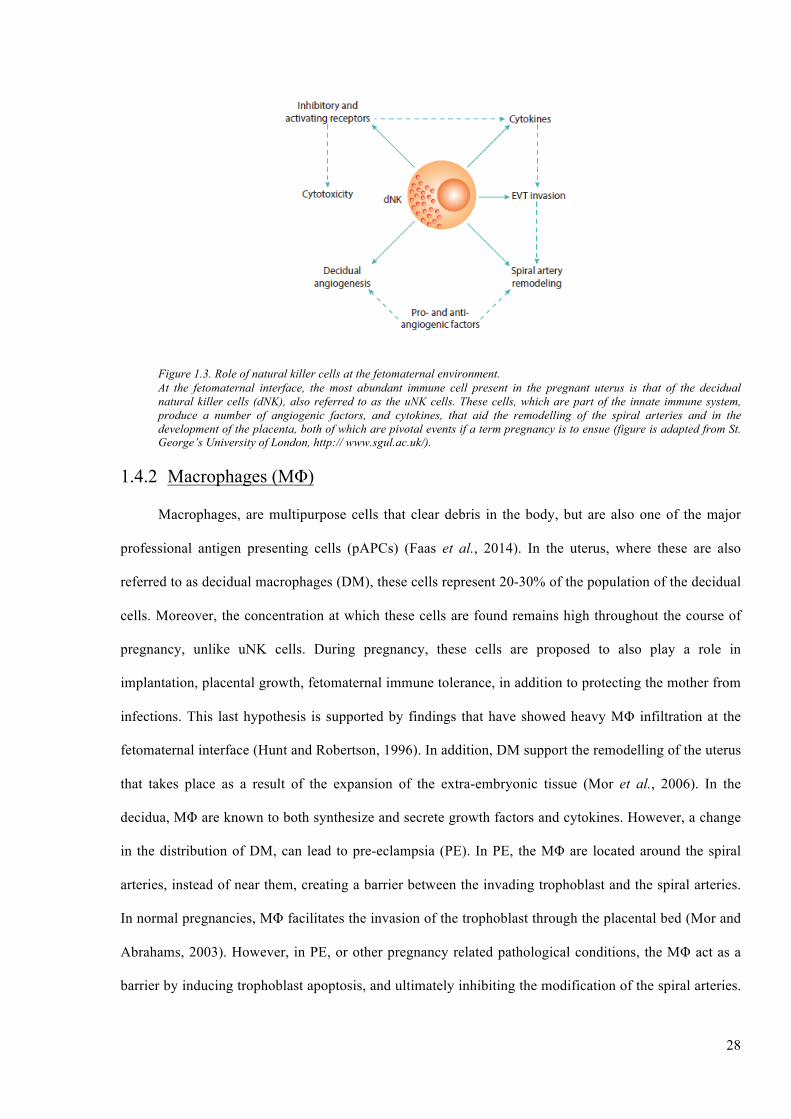
Figure 1.3. Role of natural killer cells at the fetomaternal environment. At the fetomaternal interface, the most abundant immune cell present in the pregnant uterus is that of the decidual natural killer cells (dNK), also referred to as the uNK cells. These cells, which are part of the innate immune system, produce a number of angiogenic factors, and cytokines, that aid the remodelling of the spiral arteries and in the development of the placenta, both of which are pivotal events if a term pregnancy is to ensue (figure is adapted from St. George’s University of London, http:// www.sgul.ac.uk/).
1.4.2 Macrophages (MΦ)
Macrophages, are multipurpose cells that clear debris in the body, but are also one of the major
professional antigen presenting cells (pAPCs) (Faas et al., 2014). In the uterus, where these are also
referred to as decidual macrophages (DM), these cells represent 20-30% of the population of the decidual
cells. Moreover, the concentration at which these cells are found remains high throughout the course of
pregnancy, unlike uNK cells. During pregnancy, these cells are proposed to also play a role in
implantation, placental growth, fetomaternal immune tolerance, in addition to protecting the mother from
infections. This last hypothesis is supported by findings that have showed heavy MΦ infiltration at the
fetomaternal interface (Hunt and Robertson, 1996). In addition, DM support the remodelling of the uterus
that takes place as a result of the expansion of the extra-embryonic tissue (Mor et al., 2006). In the
decidua, MΦ are known to both synthesize and secrete growth factors and cytokines. However, a change
in the distribution of DM, can lead to pre-eclampsia (PE). In PE, the MΦ are located around the spiral
arteries, instead of near them, creating a barrier between the invading trophoblast and the spiral arteries.
In normal pregnancies, MΦ facilitates the invasion of the trophoblast through the placental bed (Mor and
Abrahams, 2003). However, in PE, or other pregnancy related pathological conditions, the MΦ act as a
barrier by inducing trophoblast apoptosis, and ultimately inhibiting the modification of the spiral arteries.
29
Nevertheless, these cells remain true to their nature and carry out their duty of clearing debris even in this
environment. At the fetomaternal interface, a high concentration of the MΦ are found next to apoptotic
cells (Abrahams et al., 2004).
The DM have a similar phenotype to other MΦ present in other tissues. However, these MΦ show
increased activation, expression of a higher density of HLA-DR and CD11c (more than the peripheral
blood monocytes), and low levels of co- stimulatory molecules CD80 and CD86. Low levels of co-
stimulatory molecules suggest that DM can induce tolerance of maternal T lymphocytes by denying them
sufficient levels of co-stimulatory signal (Heikkinen et al., 2003). DM are also known to produce
elevated levels of IL-10, a cytokine known to hinder expression of HLA-DR on pAPCs, and to modulate
dendritic and T lymphocytes. Moreover, DM are known to produce lower levels of pro-inflammatory IL-
1, this could be important as in the case of an intrauterine infection this would result in less inflammation
(Abrahams et al., 2004; Heikkinen et al., 2003). MΦ are able to stimulate cell growth, whilst hindering
harmful inflammatory immune reactions by establishing a favourable environment through their cytokine
profile.
1.4.3 T lymphocytes
During pregnancy, the decidua is mainly dominated by the cells of the innate immune system.
However, T lymphocytes make up 10% of the endometrial stromal leukocyte population (Williams et al.,
2009). Throughout, both the menstrual cycle and pregnancy, the decidual T lymphocytes experience
changes. At the beginning of pregnancy the T lymphocytes steadily decrease to only experience an
increase becoming the most abundant leukocyte population by the end of pregnancy (T lymphocytes are
higher in non-pregnant uteri than they are in pregnant uteri during the first trimester). The increase in T
lymphocytes at the end of gestation and their expression of activation markers such as CD25 and HLA-
DR at this point, infers that these cells are important in the maintenance of pregnancy. A subpopulation of
the T lymphocytes, are the regulatory T lymphocytes (Treg), which are able to control immune
responsiveness to both self and non-self-antigens, and are important in transplantation tolerance and in
suppressing autoimmunity. Another subset of T lymphocytes are the T helper (Th) lymphocytes, of which
there are two subsets: Th1 cells, which are involved in cellular immunity, and Th2 cells, which are
30
involved in humoral immunity (Mosmann et al., 1986; Saito, 2010). These two subsets, once comprised
the Th1/Th2 paradigm, which recently has been changed and is now known as the Th1/Th2/Th17 and the
Treg cell paradigm (Saito et al., 2010). The Th17 cells, which are part of the paradigm, are known to play
an important role in inflammation and produce the pro-inflammatory cytokine IL-17 (Saito et al., 2010).
The Th cells, are reported to be regulated by the Treg cells. The formers capacity to produce cytokines is
also seen to be suppressed by immunoregulatory cytokines such as the transforming growth factor beta
(TGF-β) and IL-10, or by cell-cell interaction (Huber et al., 2011). In addition, it has also been proposed
that Treg cells may be responsible for controlling the Th1 activity, which is characteristic of a healthy
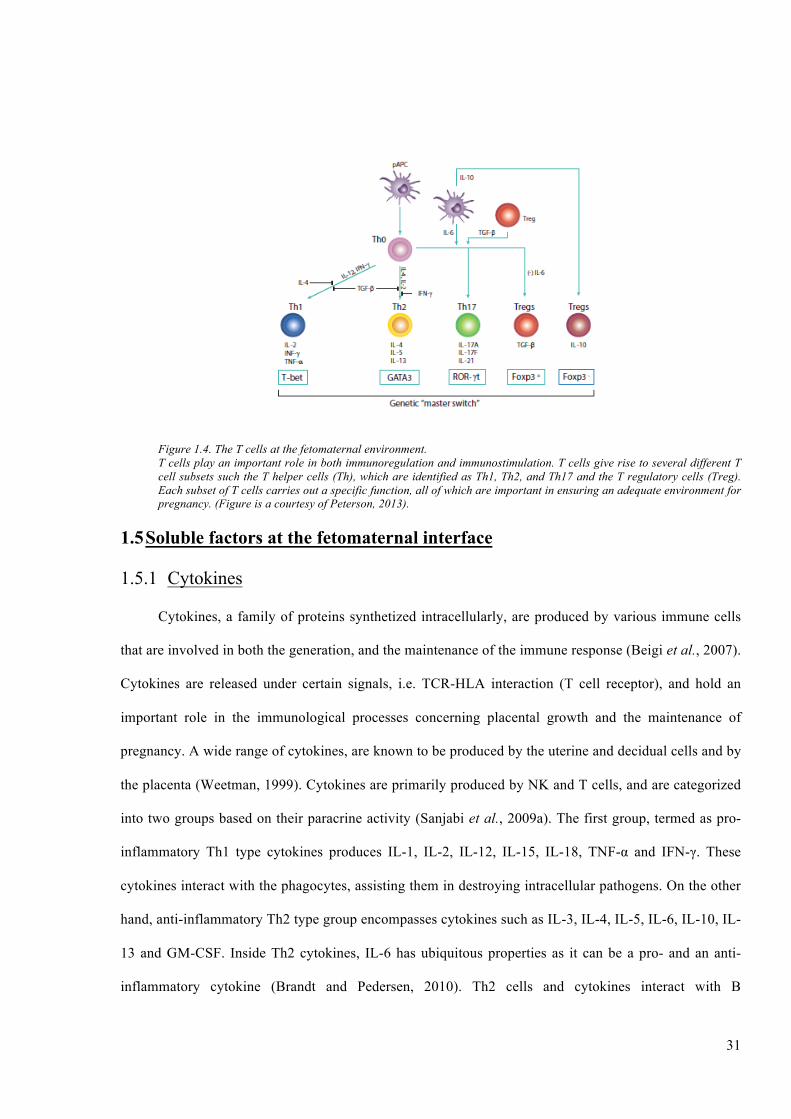
normal pregnancy (Figure 1.4) (Shima et al., 2010; Mjosberg et al., 2010).
31
Figure 1.4. The T cells at the fetomaternal environment. T cells play an important role in both immunoregulation and immunostimulation. T cells give rise to several different T cell subsets such the T helper cells (Th), which are identified as Th1, Th2, and Th17 and the T regulatory cells (Treg). Each subset of T cells carries out a specific function, all of which are important in ensuring an adequate environment for pregnancy. (Figure is a courtesy of Peterson, 2013).
1.5 Soluble factors at the fetomaternal interface
1.5.1 Cytokines
Cytokines, a family of proteins synthetized intracellularly, are produced by various immune cells
that are involved in both the generation, and the maintenance of the immune response (Beigi et al., 2007).
Cytokines are released under certain signals, i.e. TCR-HLA interaction (T cell receptor), and hold an
important role in the immunological processes concerning placental growth and the maintenance of
pregnancy. A wide range of cytokines, are known to be produced by the uterine and decidual cells and by
the placenta (Weetman, 1999). Cytokines are primarily produced by NK and T cells, and are categorized
into two groups based on their paracrine activity (Sanjabi et al., 2009a). The first group, termed as pro-
inflammatory Th1 type cytokines produces IL-1, IL-2, IL-12, IL-15, IL-18, TNF-α and IFN-γ. These
cytokines interact with the phagocytes, assisting them in destroying intracellular pathogens. On the other
hand, anti-inflammatory Th2 type group encompasses cytokines such as IL-3, IL-4, IL-5, IL-6, IL-10, IL-
13 and GM-CSF. Inside Th2 cytokines, IL-6 has ubiquitous properties as it can be a pro- and an anti-
inflammatory cytokine (Brandt and Pedersen, 2010). Th2 cells and cytokines interact with B
32
lymphocytes, aiding them in their differentiation process and in the immunoglobulin class switching
(Akdis et al., 1998). Leukocytes use cytokines in order to carry out their functions, and can influence the
activation status or/and the cytokine profile of other leukocyte subtypes. In addition, through cytokines,
these cells are also able to effect the differentiation or/and the cellular behaviour of non-immune
competent cells (von Rango, 2008).
1.5.2 Pregnancy as a Th1 or Th2 state
Over the years, pregnancy has been repeatedly described as being a Th2/anti-inflammatory state.
However, recent studies have postulated that pregnancy is not a single state event, but an event that has
three individual and distinct phases. The first stage of pregnancy, which was identified as the first and
very early second trimester, are identified as being a pro-inflammatory phase, as it is during this time
where the blastocyst implants itself into the uterus, essentially damaging the endometrial tissue. The
process of implantation and securing a viable placental-foetal blood supply make for high numbers of
invading, dying, and repairing cells. Therefore, it is essential to have a pro-inflammatory environment in
order to ensure the repair of the uterine epithelium, and the clearing of cellular debris (Bowen et al.,
2002). The second phase of pregnancy, which is termed as an anti-inflammatory phase, as the principal
immunological feature is the initiation of an anti-inflammatory state, dominates the late-early through to
the end of the second trimester of pregnancy. This, is often referred to as the optimal time for the mother
as it is when she no longer suffers from the symptoms of pregnancy (Mor et al., 2011). During the anti-
inflammatory phase of pregnancy, the foetus experiences rapid growth and development and the foetus,
placenta, and the mother have a synergetic relationship. During the third phase (third trimester of
pregnancy), the immunological feature goes back to being a pro-inflammatory state (Keelan et al., 2003).
During this trimester, the foetus has completed its growth and all its organs are ready. As the foetus needs
to be delivered, an inflammatory state is required (Gomez-Lopez et al., 2014). Delivery of the foetus is
represented by an invasion of immune cells into the myometrium so as to stimulate an inflammation
(Rusterholz et al., 2007). This inflammation encourages the uterus to contract, which leads to the delivery
of the baby and the placenta (Mor et al., 2011; Romero et al., 2007). Therefore, pregnancy depending on
the stage/trimester, is both an anti- and a pro-inflammatory state. Each state and the cytokines associated
33
with it, serve a purpose whether it’s to help in the implantation process, in the growth of the foetus or in
the labour (Mor, 2008; Xu et al., 2010).
In the end, a successful pregnancy is characterized by low levels of Th1 cytokines, and ultimately a
shift in the cytokine profile from Th1 to Th2. This shift, referred to as the Th1/Th2 paradigm of
reproduction, thus highlights that pregnancy is not just a Th2 state, but that the Th1 state is also
important. In addition, it also suggests that the cytokine profile needs to be carefully controlled, as though
Th1 cytokines are essential in establishing pregnancy as rejection of the foetus is primarily mediated by
the Th1 cytokines while, maintenance and acceptance of the foetus and its growth is mediated by Th2
cytokines (Du et al., 2014). An additional source of Th1 and Th2 cytokines during pregnancy, are the
EVCT and ST cells, the chorion, amnion and Hofbauer cells (von Rango, 2008).
1.5.3 Importance of cytokines in pregnancy
During the luteal stage of the menstrual cycle, the cells of the endometrium show an increase in
Th2 cytokines, namely IL-4 and IL-6, as compared to the Th1 cytokines. Secreted by the endometrium
infiltrating lymphocytes IL-4 and IL-6 are reported to stimulate the production of LIF in the
endometrium. LIF is very important in the implantation process as it not only facilitates trophoblast
invasion, but also endometrial decidualization, and it aids in the regulation of interactions between
decidual lymphocytes and trophoblast cells (Nachtigall et al., 1996). On the other hand, LIF secretion is
inhibited by Th1 cytokines. Moreover, low concentrations of LIF, IL-4, IL-6, and IL-10 in the
endometrium and the decidua are associated with implantation failure and recurrent abortions
(Wilczynski, 2005). During the implantation process, the embryo itself has the ability to actively control
interactions with the decidua, generally by decreasing secretion of Th1 cytokines, namely IL-2 and TNF-
α, and by increasing the secretion of GM-CSF (Sanjabi et al., 2009a). The embryo is also able to secrete
IL-10, which decreases the invasiveness of the trophoblast cells, and the secretion of TNF-α by the
maternal tissue. In vitro and in vivo studies have both shown the that peripheral blood lymphocytes (PBL)
of pregnant women secrete more Th2 cytokines and less Th1 cytokines than PBLs isolated from non-
pregnant women and, in pregnant women, the number of IL-4 secreting PBLs increases gradually from
the start to the end of pregnancy. The source of Th2 cytokines are the trophoblast, decidua, chorionic and
34
the amniotic membranes (Mor, 2008). These cytokines help to create the ideal environment for the
secretion of other Th2 cytokines, while simultaneously decreasing the inflammatory effects of IL-1 and
TNF-α. Such a mechanism allows for the initiation of premature labour to be evaded (Hunt and
Robertson, 1996; Gomez-Lopez et al., 2014).
The early implantation phase, premature, and at term labour are all situations associated with Th1
activity, and are ones where the Th1 profile dominates over the Th2. Th1 cytokines are very important in
the process of implantation. MΦ are the primary source of IL-1 and TNF-α. A Th1 dominating phase is
important in promoting a change in the number of endometrial leucocytes, in activating growth factors,
rebuilding the extracellular matrix and in preparing the maternal uterus for embryo implantation.
Additionally, TNF-α and IL-2 fuel the cytolytic activity of the uNK cells and lymphokine-activated T
lymphocytes, which are able to inhibit excessive trophoblast invasion and propagation which, if are not
controlled, could be detrimental to the process of a successful pregnancy. Moreover, during the
implantation process IL-1, which is present in the uterine environment as an outcome of the inflammation
that is taking place in response to the paternal components, stimulates trophoblastic metalloproteinase
nine (MMP-9), thus increasing their invasive properties. IL-1, along with TNF-α, is also known to
stimulate the production of LIF, which is known to have a positive influence on the growth and
differentiation of the trophoblast cells. Embryonic and uterine cells secrete IL-2, a cytokine that
stimulates uNK cells, which along with MΦ, who secrete IL-12 and TNF-α, have the potential to control
trophoblast infiltration, as these cytokines are known to have the potential to trigger trophoblast apoptosis
(Guenther et al., 2012). At term, pro-inflammatory cytokines stimulate the decidual prostaglandins, hence
triggering uterine contractions. These pro-inflammatory cytokines, in addition to mechanical stimuli
induce IL-8 production, whose high levels in the cervical mucus are responsible for cervical ripening and
opening (Keelan et al., 2003; Ekman-Ordeberg and Dubicke, 2012).
1.5.4 Hormones
1.5.4.1 Serotonin (5-HT)
Serotonin (5-HT), which can acts as a neurotransmitter or as a hormone, is involved in a wide
range of physiological functions including regulation of the cardiovascular system, control of

35
gastrointestinal motility and secretion, appetite, sexual behaviour, etc. (Ahern, 2011; Gellynck et al.,
2013; Hoyer et al., 2002). Increasing number of studies have also demonstrated that before acting as a
neurotransmitter, 5-HT plays a role in development. In adults, 5-HT regulates the differentiation of T
lymphocytes, and the concentration of 5-HT is closely related to the regulation of Th cells, NK cells, MΦ
and dendritic cells function (Ahern, 2011; Cloez-Tayarani and Changeux, 2007; Shajib and Khan, 2015).
5-HT shows these functions through specific receptors expressed on immunocompetent cells (Cloez-
Tayarani and Changeux, 2007). 5-HT is able to regulate reproductive processes by having a direct effect
on the reproductive organs, and not only through the hypothalamo-hypophyseal system (Dube and
Amireault, 2007; Sirotkin and Schaeffer, 1997; Jorgensen, 2007).
5-HT has also been detected in very early embryos of various kinds of organisms, and considered
to play an important role in ‘pre-nervous’ development (Malm, 2012; Bonnin and Levitt, 2011). 5-HT
receptors are also known to be expressed at very early stage in foetus development (Dube and Amireault,
2007; Kyle, 2006). 5-HT is one of the essential factors for early embryo growth, as it controls the
immune system development of the foetus and modulates the differentiation of various foetal tissues
(Basu et al., 2008). A lack of 5-HT during the prenatal period, can result in significant changes of the
immune system both in the T- and B- response (Latendresse et al., 2013). The morphogenetic effect of 5-
HT deficiency is related to the T lymphocytes differentiation of CD4+ cells (Th) in the thymus, which are
going to play an essential roll with B lymphocytes in the postnatal period (Afanas'eva et al., 2009).
In the maternal system, 5-HT is detected in the tubal fluid of the oviduct, cervix and uterus (Basu
et al., 2008; Amenta et al., 1992). Maternal 5-HT is considered as being crucial in pregnancy as it is
involved in the control of morphogenesis during embryo development (Cote et al., 2007).
1.5.4.2 Relaxin (RLX)
Relaxin (RLX) has a molecular weight of 6 kDa and is a member of the insulin like growth factor
family. This hormone has a wide range of functions in the female reproductive tract. It has been found in
female circulation during the luteal stage of the menstrual cycle, and during pregnancy, where the source
is the ovarian corpus luteum (Goldsmith and Weiss, 2009; Hsu et al., 2002). In addition, recent studies
have reported that RLX is also synthesized by the endometrium (Goldsmith and Weiss, 2009). Some of
36
the known functions of RLX include the regulation of growth and development of the mammary gland,
growth and dilation of the cervix, relaxation of the pubic symphysis, and inhibition of the uterine
contractions (Goldsmith and Weiss, 2009; Min and Sherwood, 1996). As a hormone, RLX is seen to have
several effects on the endometrium, which are critical in establishing a successful pregnancy. This is
further supported by the finding that RLX stimulates new blood vessel formation and increases cytokine-
containing lymphocyte numbers while maintaining endometrial connective tissue integrity, decreasing
endometrial levels of MMP-1 and MMP-3, and binding with high affinity to the endometrial cells,
particularly in the epithelium of the endometrial glands and uterine lumen (Goldsmith et al., 2004;
Einspanier et al., 2001; Bond et al., 2005; Osheroff and King, 1995). However, though this hormone is
important in rearranging the endometrium, high circulating levels of maternal RLX are harmful and have
been linked with preterm birth (Goldsmith and Weiss, 2009; Weiss et al., 1993). Elevated levels of RLX
can be detrimental during pregnancy, as can be the absence of circulating RLX. Elevated circulating
maternal RLX concentrations can be associated with premature labour, as RLX can regulate MMP-1 and
MMP-3 levels. Moreover, the absence of circulating RLX during pregnancy in women may have
negative consequences upon glucose metabolism. Therefore, during pregnancy the effect of RLX may be
dependent on the concentration of the hormone that is circulating, just as it would on the local
endocrinological milieu (Goldsmith and Weiss, 2009). As pregnancy can ensue without any circulating
RLX, this suggests that RLX must be synthesized locally if it plays a functional role in human pregnancy.
Recent data has shown that RLX is synthesised by the endometrial cells (Palejwala et al., 2002).
RLX is also known to selectively increase the level of neutrophils, uNK, and MΦ (CD68+) in the
endometrium. Such a regulation of these cells is important as uNK cells are crucial in spiral artery
remodelling, cytokines secretion, angiogenic factors release, etc. which are important for both
implantation and the maintenance of pregnancy (Croy et al., 2002). RLX is also known to have the ability
to regulate the levels of other hormones. RLX is known to inhibit protein levels of progesterone receptor
A, B, and ERα in the endometrium. This is important as the drop in the levels of these hormones in the
secretory phase of the menstrual cycle, correlates with the rising circulating levels of RLX. Therefore
37
RLX has distinct effects on the functions of the endometrium, making it an important player in early
pregnancy, both in establishing and maintaining it (Goldsmith and Weiss, 2009).
1.5.4.3 Human placental lactogen (hPL)
Human placental lactogen (hPL), also known as human chorionic somatomammotropin (hCS), is a
hormone of 191 amino acids with two intramolecular disulphide bridges, of the lactogen/growth hormone
(GH)/prolactin (PRL) protein family (Rygaard et al., 1998). This glycoprotein is produced by the
syncytiotrophoblast cells, and can be detected in embryo as early as 5-10 days after implantation, and at
six weeks of pregnancy in the maternal blood circulation. hPL has the highest concentration in maternal
serum compared with any of the other hormones. Its levels increase throughout the course of gestation,
with levels peaking at the third trimester (Josimovich and Archer, 1977).
Another source of hPL are the invasive trophoblasts, which produce this hormone during the first
trimester of pregnancy. During pregnancy, this hormone regulates the mother’s carbohydrate and lipid
metabolism. At the fetomaternal interface, hPL is known to inhibit the lymphocyte reactivity so as to
protect the foetus (Siiteri and Stites, 1982). This hormone, has also been associated with the cytokines
that are involved in fetomaternal tolerance while, Th2 cytokines are reported to contribute in the secretion
of hPL, as well as hCG from the trophoblasts (Licht et al., 2001a).
1.5.4.4 Human chorionic gonadotropin (hCG)
The ST is also known to produce one of the most studied hormones, the hCG (Malassine et al.,
2003). This hormone is crucial in pregnancy as it prevents the corpus luteum from degeneration,
ultimately sustaining the release of P4 by the ovarian granulosa cells, and facilitating cell growth and
differentiation (Staun-Ram and Shalev, 2005). In addition, hCG, which is one of the earliest secreted
hormones in pregnancy, is also reported to reach its highest concentration levels between the eight and
twelfth week of gestation, after which falls to a lower level and stays there until term. The early form of
the hCG, the hyperglycosylated hCG (HhCG), is a variant of the hCG that has extra-large O-linked
oligosaccharides and is produced by the invasive trophoblast cells. This form of the hCG is mainly
expressed in the early stages of pregnancy, where an “aggressive” invasion on the part of the trophoblast
is needed, and as gestation advances its levels decrease (Cole et al., 2003). During the early stages, the
38
receptor for this hormone is expressed in an inactive and truncated form by the trophoblast. Starting from
the ninth week of gestation, the full-length receptor of the hCG is expressed, hence allowing for the
hormone to serve out its autocrine regulation role, among which is the differentiation of the trophoblast
cells (Licht et al., 1993; Licht et al., 2001b).
Additionally, hCG has also been reported to have a stimulatory effect of trophoblast invasiveness.
MMP-9, a key-element in trophoblast invasion, is also seen to be increased by the hCG (Licht et al.,
2001b; Klein et al., 1995). Trophoblast migration is also stimulated by hCG through the effect of the
insulin-like growth factor 2 (IGF-2) (Zygmunt et al., 2005). In addition, to assisting the trophoblast in its
early stages, the hCG is also reported to influence uterine factors by increasing LIF, vascular endothelial
growth factor (VEGF) and cyclooxygenase-2 (COX-2), an enzyme renowned for being involved in
prostaglandin biosynthesis. It has also been reported that hCG is involved in endometrial vascularisation.
1.5.4.5 Progesterone (P4)
P4 is a steroid hormone belonging to the class of hormones called progestogens. This hormone
supports ovulation and uterine and mammary gland development. During the follicular phase of the
menstrual cycle, P4 levels are low, ranging from 1-2 nmol/l, while in the early-mid-late luteal phases, its
concentrations increase to 15-20, 35-50, and 20-40 nmol/l, respectively (Arck, 2004). P4 is primarily
secreted by the corpus luteum during the second half of the menstrual cycle. It is also important in
maintaining pregnancy, where it is secreted by the placenta, starting at 12th weeks of pregnancy (Arck,
2004).
P4 is important in preparing the uterus and ensuring a successful pregnancy. It stimulates the
growth of the maternal breast tissue, prevent lactation, and strengthen the pelvic wall muscles in
preparation for labour (Challis et al., 2000). Owing to both, its endocrine and immunological effects in
pregnancy, this hormone is considered as being crucial in the process of gestation from implantation
through to delivery. P4 is believed to effect invasiveness by down-regulating MMP-9 expression, and is
also reported to inhibit the invasion of the trophoblast into the endometrium (Staun-Ram and Shalev,
2005; Shah and Nagarajan, 2013). It is also responsible for triggering suppressor T lymphocytes
39
generation, inhibiting cytotoxic T cells activity, and reducing NK cells activity in the uterus (Yie et al.,
2006a; Brierley and Clark, 1987).
The immunological activity of P4, is believed to be modulated by the interaction with progesterone
receptor (PR). Human progesterone receptor (hPR), is encoded by the PGR gene. Using separate
promoters and translational start sites, PGR can be translated into two isoforms called PR-A and PR-B,
where PR-B is longer than PR-A. Both isoforms are transcription factors, so they work as ligand-
activated modulators of gene expression (Zakar and Mesiano, 2011). Upon immunological recognition of
pregnancy, there is an up-regulation of PR on dNK cells and on the placental lymphocytes (Druckmann
and Druckmann, 2005). In addition, in the presence of P4, activated lymphocytes and dNK cells produce
progesterone-induced blocking factor (PIBF), which is a 34 kDa immunomodulatory protein that has
several anti-abortive effects in vivo (Druckmann and Druckmann, 2005; Roussev et al., 1993). The
protective system of PIBF prompts an increase in asymmetric “blocking” antibodies, a Th2 biased
immune response, and a reduction in NK cells activity. PIBF stimulates secretion of Th2 cytokines from
activated lymphocytes, which are associated with B cell antibody production, whilst reducing the
cytotoxic and pro-inflammatory Th1 type cytokines (Druckmann and Druckmann, 2005; Faust et al.,
1999). The Th2 cytokines are essential for the secretion of other pregnancy related hormones such as hPL
and hCG from the trophoblast cells. This is important as the released hCG inhibits apoptosis of the corpus
luteum, as well as induces the synthesis of P4 by the corpus luteum (Saito, 2000). Moreover, Th2
cytokines are also able to reduce the secretion of Th1 cytokines. This bias towards a Th2 profile leads to
a favourable environment for a successful pregnancy (Dealtry et al., 1998). Although the mechanisms by
which P4 promotes immune tolerance have not been fully elucidated, P4 is also known to modulate HLA
expression on trophoblast cells, which is one of the key players to protect the foetus from the maternal
immune system. The Yie group reported that P4 enhances the expression of HLA-G both in protein and
gene level using as a model the human trophoblasts cell line JEG-3 (Yie et al., 2006b). HLA-G has been
known to play a vital role in fetomaternal immunological tolerance with protecting the fetomaternal unit
from NK cell lysis and T cell cytotoxic activity (Deniz et al., 1994; Kapasi et al., 2000). HLA-G inhibits
40
NK cell activity by binding NK receptors’ ILT2 and ILT4 (Colonna, 1998). P4 also induces fetomaternal
immune tolerance indirectly through promoting HLA-G expression.
1.5.4.6 Preimplantation factor (PIF)
Preimplantation factor (PIF) is a 15 amino acid peptide (MVRIKPGSANKPSDD) (Paidas et al.,
2010). This peptide is only secreted by viable mammalian embryos and is done so as early on as the two-
cell stage and remains present throughout the course of a viable pregnancy (Stamatkin et al., 2011a).
Though PIF is present during the course of pregnancy, there is a progressive increase in circulating
concentrations in the first and second trimester, while in the third trimester, prior to delivery, there is a
notable decrease (Ramu et al., 2013; Stamatkin et al., 2011b). As it is secreted by the preimplantation
embryo and later on by the placenta, this peptide is specific to pregnancy and plays a primordial role in
implantation and the overall wellbeing of the embryo by acting directly on the decidua, hence modulating
local immunity, enhancing embryo-decidual adhesion, and controlling apoptosis (Barnea et al., 2012a).
The Barnea group, have also reported that PIF has the capacity to modulate and orchestrate maternal
immunity, without triggering any adverse immune outcomes, all while preparing the local uterine
environment for implantation, the first step of pregnancy (Barnea et al., 2012b). This peptide also has the
ability to create a complimentary environment for early pregnancy as PIF is also believed to be the
primary message of viability and acceptance that is secreted by the embryo to the mother, to promote
maternal tolerance without triggering any form of suppression (Azar et al., 2013; Barnea, 2007). This
peptide has also been described as being universally mammalian, due to its cross species effect, non-
toxic, as it is embryo derived, and is able to act in low doses in the range of nanomolar (nm). Its synthetic
counterpart, sPIF also a 15 amino acid peptide is reported to mimic native PIF’s features, and like PIF,
inhibits NK cell cytotoxicity at low concentrations. However, scrambled PIF (sPIF*) has no effect on NK
cell cytotoxicity and in no way aids the embryo during the implantation process. This clearly
demonstrates the specificity of sPIF and PIF (Roussev et al., 2013).
Figure 1.5 summarizes the main factors that have previously been enumerated as having an
important impact or the ability to induce changes during the course of human pregnancy.
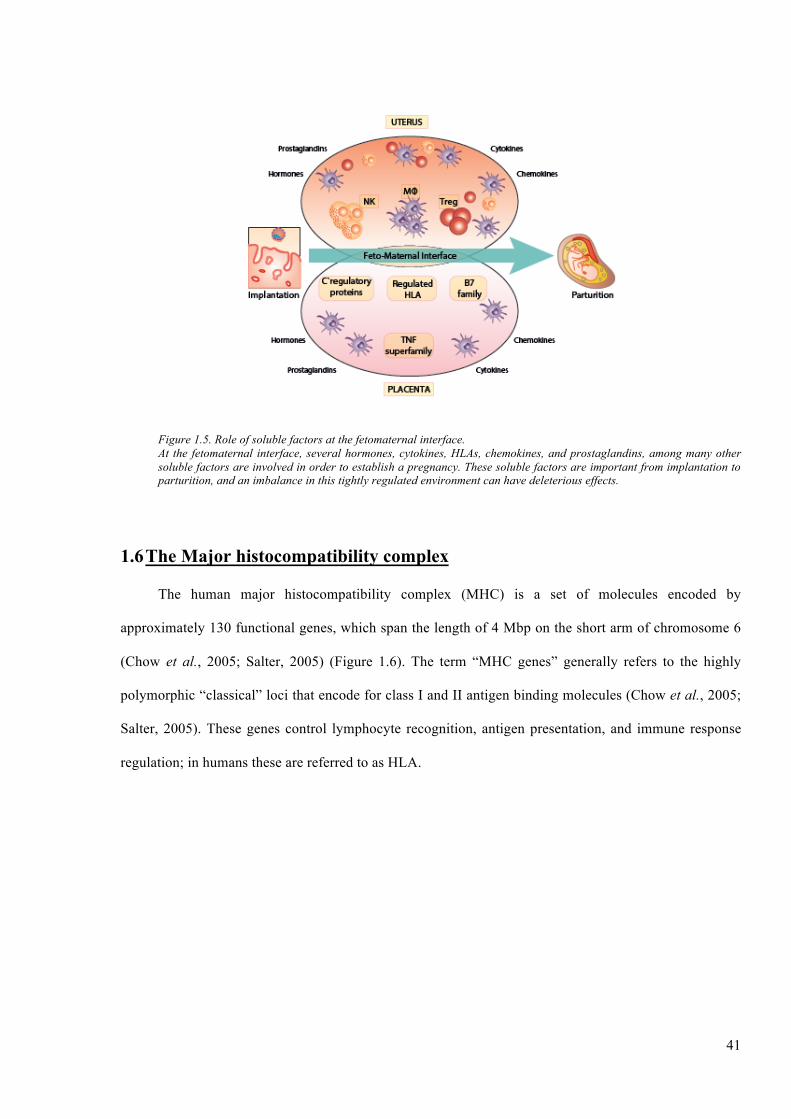
41
Figure 1.5. Role of soluble factors at the fetomaternal interface. At the fetomaternal interface, several hormones, cytokines, HLAs, chemokines, and prostaglandins, among many other soluble factors are involved in order to establish a pregnancy. These soluble factors are important from implantation to parturition, and an imbalance in this tightly regulated environment can have deleterious effects.
1.6 The Major histocompatibility complex
The human major histocompatibility complex (MHC) is a set of molecules encoded by
approximately 130 functional genes, which span the length of 4 Mbp on the short arm of chromosome 6
(Chow et al., 2005; Salter, 2005) (Figure 1.6). The term “MHC genes” generally refers to the highly
polymorphic “classical” loci that encode for class I and II antigen binding molecules (Chow et al., 2005;
Salter, 2005). These genes control lymphocyte recognition, antigen presentation, and immune response
regulation; in humans these are referred to as HLA.
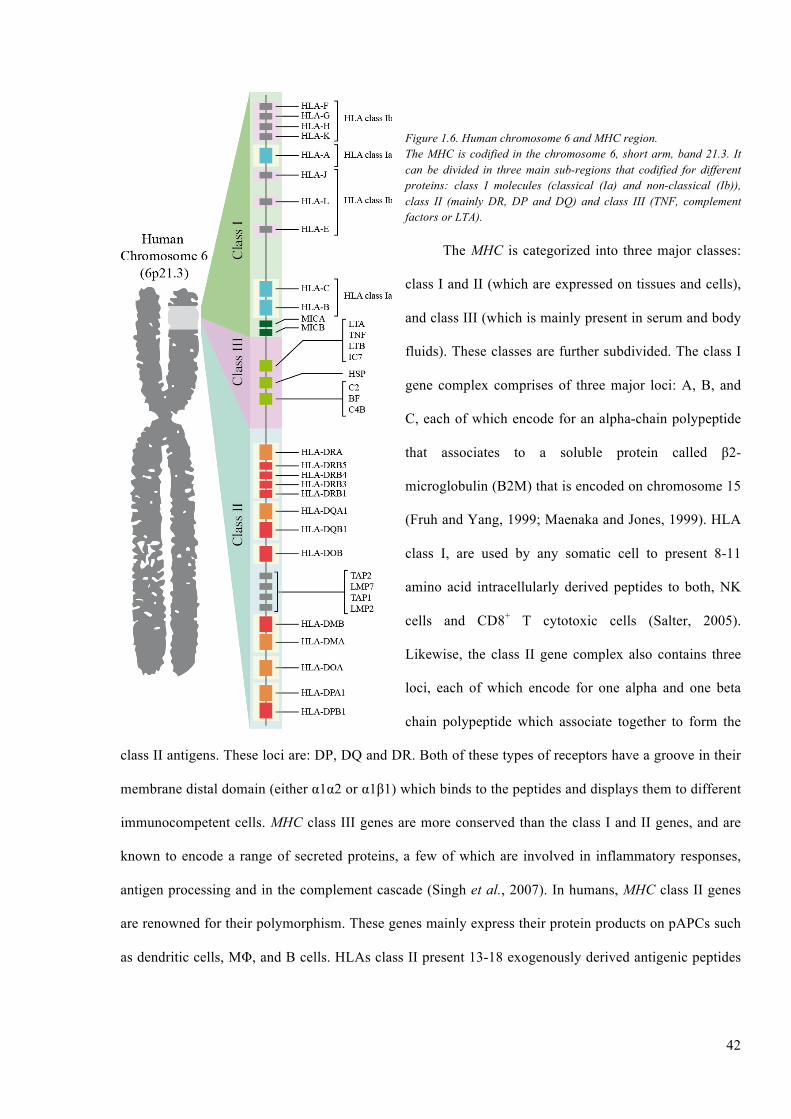
42
Figure 1.6. Human chromosome 6 and MHC region. The MHC is codified in the chromosome 6, short arm, band 21.3. It can be divided in three main sub-regions that codified for different proteins: class I molecules (classical (Ia) and non-classical (Ib)), class II (mainly DR, DP and DQ) and class III (TNF, complement factors or LTA).
The MHC is categorized into three major classes:
class I and II (which are expressed on tissues and cells),
and class III (which is mainly present in serum and body
fluids). These classes are further subdivided. The class I
gene complex comprises of three major loci: A, B, and
C, each of which encode for an alpha-chain polypeptide
that associates to a soluble protein called β2-
microglobulin (B2M) that is encoded on chromosome 15
(Fruh and Yang, 1999; Maenaka and Jones, 1999). HLA
class I, are used by any somatic cell to present 8-11
amino acid intracellularly derived peptides to both, NK
cells and CD8+ T cytotoxic cells (Salter, 2005).
Likewise, the class II gene complex also contains three
loci, each of which encode for one alpha and one beta
chain polypeptide which associate together to form the
class II antigens. These loci are: DP, DQ and DR. Both of these types of receptors have a groove in their
membrane distal domain (either α1α2 or α1β1) which binds to the peptides and displays them to different
immunocompetent cells. MHC class III genes are more conserved than the class I and II genes, and are
known to encode a range of secreted proteins, a few of which are involved in inflammatory responses,
antigen processing and in the complement cascade (Singh et al., 2007). In humans, MHC class II genes
are renowned for their polymorphism. These genes mainly express their protein products on pAPCs such
as dendritic cells, MΦ, and B cells. HLAs class II present 13-18 exogenously derived antigenic peptides
43
to CD4+ T helper cells. These genes are also important in the preparing and maintaining of the humoral
immune response (Maenaka and Jones, 1999).
As has been described, each HLA class I and II has a different structure and this structure is related
to the type of antigen determinant (epitope) that they can load inside their groove or pocket. Basically, we
can say that HLA-I display on the cell surface small epitopes because its pocket is closed, while the
epitope that can be loaded inside the pocket of HLA-II is bigger as the pocket sides open. Another
difference between both molecules is the type of molecules that are loaded inside the groove. Though
they both load proteins, their origins are different. While HLA-I mainly displays epitopes from proteins
synthetized inside the cell and processed by the endogenous pathway, HLA-IIs load proteins that have
been internalized from outside the cell and processed by the exogenous pathways (Hviid, 2006; 1999).
This is the reason as to why only pAPCs express HLA-II, as they are the only ones that can carry out
phagocytosis. While the rest of the somatic cells also present antigens, they cannot carry out the process
of phagocytosis.
HLA class I has developed into two distinct though structurally related subgroups termed classical
or Ia, and nonclassical or Ib. Whilst the Ia molecules have evolved into highly polymorphic,
omnipresently expressed membrane bound molecules, making them an important factor in establishing
immune response diversity; the Ib molecules, on the other hand, have maintained a selective and limited
polymorphism with restricted expression (regulated and tissue restricted) (Kedzierska and Turowski,
2001). The Ib molecules, which include HLA-G, -E and –F, are believed to have a more specialised
function in antigen presentation than their Ia counterparts. The MHC class I genes polymorphism is
concentrated in their epitope binding region and this polymorphism is generated by mutations that
introduces small changes in the amino acid sequence that can be conserved or not (balancing selection).
HLA class I have been identified as being expressed during pregnancy by the trophoblast, along with the
interactions that take place between the different HLA molecules, and between HLA molecules and
components of the immune system during pregnancy. In the human body, trophoblast cells are one of just
of handful of physiological cellular populations that don’t have the typical HLA profile, as they don’t
express HLA class Ia -A and -B or class II.
44
1.6.1 Human leukocyte antigen G (HLA-G)
HLA-G was the first HLA-Ib to be identified and still holds great interest (Hunt et al., 2006;
Moreau et al., 2002). Due to its features HLA-G can be considered as a very unique molecule. The gene
that encoded HLA-G (HLA-G) is comprised of 8 exons, which are arranged in a similar sequence as that
of the other class I genes. These 8 exons can suffer from alternative splicing that can produce seven
transcripts, i.e. in exon 6, a premature stop codon during the translation can cause a HLA-G with a
truncated cytoplasmic tail which can explain why this isoform has a slower turnover rate, and a prolonged
cell surface expression (Hunt et al., 2005).
1.6.1.1 HLA-G isoforms
In addition, HLAG gene is also known to be alternatively spliced to give rise to seven transcripts;
four membrane bound and three soluble (McCormick et al., 2009; Kovats et al., 1990). HLA-G1, apart
from its truncated cytoplasmic tail is similar in structure to its class I genes. HLA-G2 isoform differs
from the primary transcript in that it lacks exon 3, and is known to form a class II like structure through
homodimerization (Ishitani and Geraghty, 1992). HLA-G3 isoform is the result of spliced exons 3 and 4,
while HLA-G4 transcript has a spliced fourth exon. HLA-G5 and HLA-G6 transcripts are the same as
HLA-G1 and HLA-G2 transcripts, with the inclusion of intron 4 sequences, and the fact that they are
expressed as soluble isoforms (McCormick et al., 2009; Hunt and Langat, 2009). Exon 2 and intron 2 are
both part of HLA-G7, though in this transcript, intron 4 is spliced. To date, little is known about HLA-G4
and HLA-G7 transcripts, though it has been reported that in the placenta, their mRNAs are not present in
abundance (Hunt et al., 2005; Hunt and Langat, 2009).
1.6.1.2 HLA-G ligands
Studies by the Hunt group and Apps group have shown that the leukocyte immunoglobulin-like
receptors (LILR) are the major HLA-G receptors on leukocytes (Hunt et al., 2005; Apps et al., 2007).
The LILR group has 13 loci, is expressed by NK cells, mononuclear phagocytes, T and B lymphocytes
and is believed to interfere with activating signals (Hunt and Langat, 2009; Apps et al., 2007). From the
LILR family, two inhibitory receptors, LILRB1 and LILRB2 distinguish all of HLA-I (Borges and
Cosman, 2000). For lymphocytes, it is stipulated that LILRB1 is the main binding receptor, while
45
LILRB2 is believed to be the primary receptor on MΦ and DCs for HLA-G (Hunt and Langat, 2009). In a
study carried out by the Apps group, it was shown that all HLA-DR+ cells in the decidua expressed
LILRB1 and LILRB2 (Apps et al., 2007). In addition, various experiments from other groups have
demonstrated that the modulation of myelomonocytic cells function is the direct result of HLA-G binding
with LILRB, and that such an interaction has an impact on antigen presentation (Apps et al., 2007;
Ristich et al., 2005).
1.6.1.3 HLA-G in pregnancy
HLA-G is a molecule of interest as it may hold the key to human successful reproduction.
Researchers consider that a pregnancy specific signal is delivered to the local maternal leukocytes by
HLA-G trophoblast cells as they infiltrate the uterine mucosa, thereby changing the function of these
cells so as to hold the placenta and foetus (Apps et al., 2007).
1.6.2 Human leukocyte antigen E (HLA-E)
Like HLA-G, HLA-E is a molecule with low polymorphism compared to its classical class I
counterparts and is one which is highly conserved (Shaikly et al., 2010). Widely expressed, “cell-surface
expression of HLA-E heavy chain requires the formation of a non-covalent complex with β2M and a
leader peptide antigen, derived from the N’-terminal sequence of other HLA class I molecules such HLA-
G or HLA-C (Shaikly et al., 2010; Rodgers and Cook, 2005). Protection to the foetus from the maternal
system may be the result of the “affiliated” cell surface expression of HLA-G and HLA-E, as the cell
surface expression of the latter is dependent on that of the former (Shaikly et al., 2010). In 2004,
Trundley and Moffet reported that trophoblast cells were protected from NK cytotoxicity due to the
binding of HLA-E with CD94/NKG2A expressed on the surface of uNK cells (Trundley and Moffett,
2004). The Shaikly group, further hypothesized that this interaction may also be responsible for
controlling other “functions” at the site of implantation (Shaikly et al., 2010). The Ishitani group,
reported “overlapping expression” at the trophoblast cell surface of HLA-G and HLA-E (Ishitani et al.,
2003). This results were reconfirmed in 2010 by the Shaikly group who also showed that HLA-G and
HLA-E are co-localized on the cell surface in clusters of four molecules (tetramers) or other higher order
clusters (Shaikly et al., 2010). These clusters are a sign that, at the cell surface, HLA-E and HLA-G work
46
together to unite to receptors. The juxtaposition of these clusters on the implanting blastocyst is important
at the fetomaternal interface as they are now believed to be responsible for the modulation of the immune
responses of the leukocyte cells present at this site (Shaikly et al., 2010).
1.6.3 Human leukocyte antigen C (HLA-C)
Of HLA-Ia, only HLA-C is expressed by the trophoblast cells at the fetomaternal interface. This
molecule is highly polymorphic, in comparison to HLA-Ib expressed by the trophoblast, and has the
ability to elicit an allogenic T cell response (Heemskerk et al., 2005). Due to its relative polymorphism,
HLA-C could thus elicit a maternal anti-foetal acquired immunity, if the paternal alleles differed from
those of the mother (Hunt et al., 2005). HLA-C is reported to interact with KIR2D receptors, which are
expressed by the uNK cells and, is also believed, that this molecule also has the ability to control the
cytokine profile of the uNK cells. HLA-C is expressed by the invasive or extravillous trophoblast cells.
HLA-C has two main haplotypes called C2 and C1, which may be recognized by KIR2DL1/KIR2DS1
and KIR2DL2/KIR2DL3/KIR2DS2, respectively. C2 binds and interacts with KIR with more affinity
than C1 (Boyington et al., 2001; Nowak et al., 2011a; Nowak et al., 2011b). Different aggrupation and
interaction of maternal uNK cell KIRs and trophoblast HLA-C will have different effects on the
trophoblast cells, i.e. a combination of HLA-C1 and KIRB+ uNK cells will promote trophoblast invasion,
however HLA-C2 and KIR2+ uNK cells will decrease trophoblast invasion. This combination is one
which dominates in woman suffering from pre-eclampsia (Hiby et al., 2004; Sargent et al., 2006). This
thus demonstrates that HLA-C KIR epitope and maternal KIR incompatibility (ultimately, a foetal
mismatch) results in an increase in activated maternal T cells in the decidua, ultimately leading to
pregnancy complications and spontaneous abortions (Tilburgs et al., 2009). Though all HLA class Ib are
expressed by the trophoblast cells, they are done so at different levels, and they serve different functions.
1.6.4 Human leukocyte antigen F (HLA-F)
HLA-F was the last class Ib HLA to be discovered. This molecule, expressed as a β2M-associated
protein of 40-41 kDa, was first identified by the Geraghty group in 1990 (Geraghty et al., 1990). Like the
other class Ib molecules, HLA-F displays very low allelic polymorphism and is highly conserved.
However, compared to the other HLA class I, HLA-F is shorter. In the mature HLA-F mRNA exon 7 is
47
missing, hence yielding an HLA-F protein that has a shortened cytoplasmic domain in comparison to the
other HLA molecules (Lee et al., 2010). HLA-F expression has been identified in the cytoplasm of
peripheral blood B cells, some tissue cells, but most importantly expression of HLA-F was seen on
extravillous trophoblast normal term placenta cells (Ishitani et al., 2003; Shobu et al., 2006). Expression
of HLA-F by the trophoblast cells suggests that this molecule plays an important role in the fetomaternal
interaction. Though countless studies, HLA-F expression have been detected in the cytoplasm of the
thymus, tonsil, and spleen cells but not on their surfaces, while their function has yet to be elucidated
(Wainwright et al., 2000). The Shobu group had reported HLA-F expression in the cytoplasm of decidual
extravillous trophoblasts during early gestation, and on the surface of these cells from mid-gestation to
term, while the expression of this molecules was weak in the cytoplasm of the villous cytotrophoblasts
and syncytiotrophoblasts (Shobu et al., 2006). Tetramers of HLA-F molecule have been identified to bind
to the ILT2 and ILT4 NK receptors however, it still needs to be identified whether or not HLA-F has an
NK inhibitory function (Shobu et al., 2006; Lepin et al., 2000). In addition, HLA-F, like HLA-E
expression, is seen to increase towards the later stages of pregnancy. Extravillous trophoblast expression
of HLA-F is reported to be increased, and to move towards the cell surface during the later stages of
pregnancy. This, hence suggesting this molecule plays an important role in the maintenance of
pregnancy. Though several studies have been carried out on HLA-F and its expression, to date little is
known about its function.
1.6.5 HLA in pregnancy and medicine
The MHC, since it was discovered in 1967, has significantly advanced the field of not only
immunology, and reproductive immunology, but also the fields of organ and tissue transplantation
(Bernard, 1967). However, to date, due to the very complex immunobiology of transplantation and due to
the involvement of several components, namely antibodies, antigen presenting cells, cytotoxic T cell
subsets, immune cells cytokines, etc. which all play an important role in innate and adaptive immunity,
the mechanism with which a graft can avoid rejection has not been elucidated. The foetus, which is
considered to be a semi-allograft, however, is able to survive in the maternal body for nine months, but
more importantly, it is protected, and nourished, without causing any deleterious effects to the mother.
48
The way in which the foetus is able to avoid maternal rejection, is still not well understood. However, if
such an event is understood, this may give the field of medicine a breakthrough where the organ
transplantation is concerned.
1.7 Project aims
HLA class I have been reported to be expressed at the fetomaternal interface by the trophoblast
cell. The expression of these HLAs is pivotal if the foetus is to avoid maternal rejection. However, these
proteins are not the only factors used by the semi-allograft to avoid rejection, as the fetomaternal
interface is a site of complex interactions, where several factors work together to not only protect the
foetus, but also ensure the well-being of the mother. In the present study, the effects of soluble factors on
the human-derived-trophoblast cell line JEG-3 and ACH-3P were studied, as a means by which to
determine what soluble factors are involved at the fetomaternal interface.

CHAPTER II. MATERIAL AND METHODS
CHAPTER II
MATERIALS AND METHODS
50
2.1 Cell lines and cell culture techniques
2.1.1 Cell lines
Cell lines used in this study included the human first trimester choriocarcinoma trophoblastic cell
lines JEG-3 and ACH-3P. The JEG-3 cell line was kindly provided by Professor I. L. Sargent of the
Nuffield Department of Obstetrics and Gynecology at the University of Oxford, and its characterization
and establishment is described in previous studies (Kohler and Bridson, 1971; Kohler et al., 1971; Fogh
et al., 1977). ACH-3P, a novel trophoblast hybrid cell line, was kindly provided by Dr. G. Desoye of the
Department of Obstetrics and Gynecology at the Medical University of Graz, Austria. Establishment and
characterization of the ACH-3P cell line, is described in a study by the Hiden group (Hiden et al., 2007).
The cell lines used were routinely maintained in our laboratory in small aliquots stored in liquid nitrogen.
A description of all cell lines used in this study is given in Table 2.1. Both cell lines were not DNA
fingerprinted as there is no consensus in the scientific community about it. The ATCC has a document
with the title "Recommendations (see appendix)", here, you can read the recommendations that the
ATCC suggests. Clearly, the ATCC shows that there is no established protocol by which to characterise a
cell line, but does suggest some techniques. We used morphology, growth ratio, mycoplasm detection
(our group technician Julie Ardvison did it for us) and finally, we did flow cytometry for specific
antigens for human trophoblast-derived populations. We thought that it was enough, even when there is
not a standard protocol. Another fact that has to be taken into account is the cost/effectiveness of DNA
fingerprinting: this is quite an expensive technique that needs to be checked with another technique like
Western blot, as not all mRNAs are translated to proteins. It is obvious that cell lines are not going to
have the same behaviour as real tissue but sometimes, in research, it is important to understand that
access to human tissue is not always easy and facilities are not always up to a standard which is required
when working with human tissue. So, in very early research stages it is better to start and establish a
cellular model using cell lines and then extrapolate it to isolated human tissue. One the advantages that
cell lines have is that they are supposed to be homogeneous so we can avoid the bias introduced by the
characteristic of each human donor.
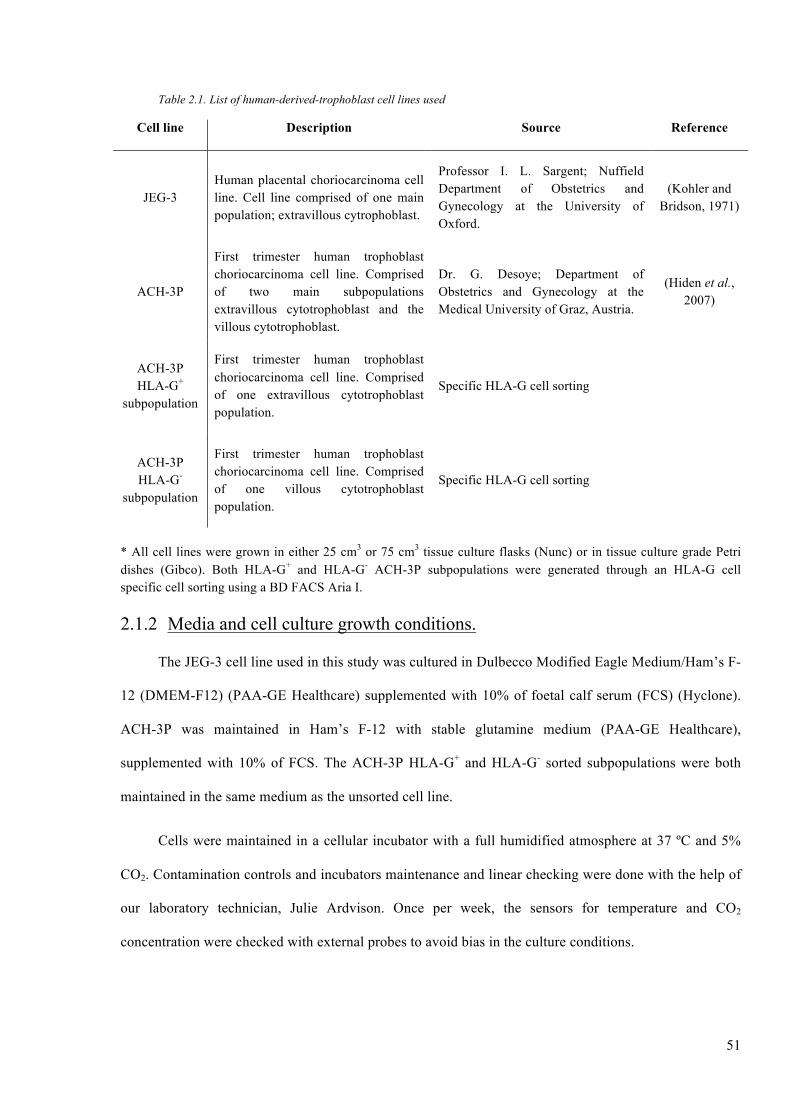
51
Table 2.1. List of human-derived-trophoblast cell lines used
Cell line Description Source Reference
JEG-3 Human placental choriocarcinoma cell line. Cell line comprised of one main population; extravillous cytrophoblast.
Professor I. L. Sargent; Nuffield Department of Obstetrics and Gynecology at the University of Oxford.
(Kohler and Bridson, 1971)
ACH-3P
First trimester human trophoblast choriocarcinoma cell line. Comprised of two main subpopulations extravillous cytotrophoblast and the villous cytotrophoblast.
Dr. G. Desoye; Department of Obstetrics and Gynecology at the Medical University of Graz, Austria.
(Hiden et al., 2007)
ACH-3P HLA-G+
subpopulation
First trimester human trophoblast choriocarcinoma cell line. Comprised of one extravillous cytotrophoblast population.
Specific HLA-G cell sorting
ACH-3P HLA-G-
subpopulation
First trimester human trophoblast choriocarcinoma cell line. Comprised of one villous cytotrophoblast population.
Specific HLA-G cell sorting
* All cell lines were grown in either 25 cm3 or 75 cm3 tissue culture flasks (Nunc) or in tissue culture grade Petri dishes (Gibco). Both HLA-G+ and HLA-G- ACH-3P subpopulations were generated through an HLA-G cell specific cell sorting using a BD FACS Aria I.
2.1.2 Media and cell culture growth conditions.
The JEG-3 cell line used in this study was cultured in Dulbecco Modified Eagle Medium/Ham’s F-
12 (DMEM-F12) (PAA-GE Healthcare) supplemented with 10% of foetal calf serum (FCS) (Hyclone).
ACH-3P was maintained in Ham’s F-12 with stable glutamine medium (PAA-GE Healthcare),
supplemented with 10% of FCS. The ACH-3P HLA-G+ and HLA-G- sorted subpopulations were both
maintained in the same medium as the unsorted cell line.
Cells were maintained in a cellular incubator with a full humidified atmosphere at 37 ºC and 5%
CO2. Contamination controls and incubators maintenance and linear checking were done with the help of
our laboratory technician, Julie Ardvison. Once per week, the sensors for temperature and CO2
concentration were checked with external probes to avoid bias in the culture conditions.
2.1.3 Cell culture techniques
2.1.3.1 Passaging
All the cell lines used in this study grow as an adherent monolayer, and require passaging when
they are approximately 70-80% confluent. When passaging the cells, the culture media was removed, and
cells washed with 3 ml of pre-warmed (37 ºC) phosphate-buffered saline (PBS). Cells were then detached
by adding 1 ml of pre-warmed Accutase™ (PAA-GE Healthcare) and incubating the flask in a dry
chamber at 37 ºC for 2-8 min. After examining the cells under the microscope, to ensure their
detachment, the Accutase™ was diluted ten times with the appropriate warm complete media. The media
was then gently pipetted to help cells detach from the flask and to avoid cell clump formation. The cell
suspension was then transferred to a tube and centrifuged at 1237 g for 5 min. The supernatant was
aspirated off, and the cell pellet was re-suspended in fresh complete media. Cells were either transferred
to new flasks for future culture or used for experiments. The maximum culture time that the cells could
be maintained in culture for was up to one month, after which they had to be replaced with a fresh stock.
2.1.3.2 Counting and seeding of cells
To count the number of cells, 10 µl of the final cell suspension was obtained as described above
and the cell number determined through the use of a hemocytometer. The average number of cells present
in four corner squares was determined and multiplied by 104 giving us the concentration of cells per ml.
Upon determination of a cell count, cells were diluted to the required concentration which was normally
between 1.0x10⁵ - 1.5x10⁵ cells/ml using appropriate media, and were seeded in six wells plates,
microscopy chambers or flasks, as required per the experimental set up.
2.1.3.3 Freezing and defrosting cell stocks
Cells were passaged as described in section 2.1.3.1, a cell count was carried out and 0.8 ml of the
cell suspension (approximately 1x10⁶ cells/ml) was diluted with 0.8-1.0 ml of freezing media (10%
Dimethyl Sulfoxide (DMSO) (Sigma) and 90% FCS). The cell mix was transferred to cryotubes (Nunc)
and stored at -80 ºC freezer wrapped with insulating material in order to prevent rapid cooling, that will
avoid ice crystal formation that could damage the cells. After 3-4 days, these cells were then moved to a
liquid nitrogen container for longer storage.
53
To thaw the cells, the cryogenic tubes were removed from liquid nitrogen using dry ice to transport
them from the cryogenic facility to the cell culture room. Tubes were then placed in a dry chamber, to
avoid possible contamination, and pre-warmed at 37 ºC so as to defrost them quickly. The thawed cell
suspension was centrifuged at 1237 g for 5 min and the supernatant was removed, as at room temperature
(RT) DMSO is toxic and can induces changes in the behaviour of the cells (Preisler and Giladi, 1975;
Galvao et al., 2014). The cell pellet was then pipetted into a small culture flask containing 10 ml of pre-
warmed culture medium and maintained at 37 ºC and 5% CO2, until the cells reached 70-80% confluency
2.1.4 Cell stimulations
2.1.4.1 Progesterone stimulations
Progesterone (Sigma-Aldrich) was diluted to a final concentration of 1 mg/ml using absolute
ethanol, as was suggested by the manufacturer. This was further diluted in DMEM-F12 medium to a
concentration of 1 µg/ml.
To assess the effect of P4 on JEG-3 cells HLA profile and cytokine expression, cells were
passaged and cultured at a density of 1x10⁶ cells/ml in complete medium. After 24 h, the cells were
serum starved by replacing the medium with DMEM-F12 supplemented with 0.1% FCS (starving
medium). Cells were incubated in this medium for 6 h after which it was refreshed and supplemented
with P4 at a final concentration of 1 µg/ml. Cells were cultured in starving medium to decrease HLA
surface expression as its turnover is around 3 hours (Mandelboim et al., 1997; Davis et al., 1997).
For dose dependent experiments, cells were incubated with concentrations of P4 ranging from 1-
1000 ng/ml for a period of 24 h. For time dependent experiments, cells were incubated with P4 at a dose
of 1000 ng/ml for time periods ranging from 0-72 h.
2.1.4.2 Preimplantation factor stimulations
Preimplantation factor, which was kindly supplied by Dr. Eytan Barnea (Society for the
Investigation of Early Pregnancy and BioIncept, LLC, Cherry Hill, NJ, USA) and was reconstituted in
double distilled water to a final concentration of 20 µM.
54
JEG-3 cells were cultured in complete medium at a density of 1x10⁶ cells/ml. After 24 h, the
medium was changed for fresh starving medium. Cells were incubated in this medium for 6 h after which
the starving medium was refreshed and supplemented with PIF. For dose dependent experiments, cells
were incubated with concentrations of PIF ranging from 0-1000 nM for a period of 24 h. For time
dependent experiments, cells were incubated with PIF at a dose of 200 nM for time periods ranging from
0-72 h.
2.1.4.3 IL-17 stimulations
IL-17RA (Life technologies) was reconstituted in sterile double distilled water to a concentration
of 200 µg/ml. This was further diluted to a final concentration of 100 ng/ml using culture medium.
To assess the effect of IL-17 on the secretion of P4 by JEG-3 cells, cells were passaged after which
they were re-suspended at a density of 1x10⁶ cells/ml in complete medium. After 24 h, the medium was
removed and fresh starving medium was added. Cells were incubated in this medium for 6 h after which
the medium was changed with fresh starving medium and supplemented with IL-17RA at final
concentration of 1, 10 and 100 ng/ml, for 24 h. This was the range of concentration of IL-17 used, as it is
in this range that IL-17 can exert activity in a wide variety of in vitro applications (Pongcharoen and
Supalap, 2009). Controls for this experiment were JEG-3 cells incubated in medium without IL-17RA
stimulation. After 24 h, the supernatant was harvested and kept at -20 ºC until determination of P4
secretion.
2.1.4.4 Enzyme Linked Immunosorbent Assay for cytokine determination
An enzyme linked immunosorbent assay (ELISA), is a biochemical technique that is widely used
in the laboratory (Berg et al., 2002). This technique combines the specificity of antibodies with the
sensitivity of simple enzyme assays, by using antigens or antibodies coupled to an easily-assayed
enzyme, by which to detect the presence of these, and provide a measurement of their concentration in a
wide variety of biological samples was first described by Perlmann and Engvall in 1971 (Engvall and
Perlmann, 1971). We can consider two among the several types of ELISA. The indirect ELISA is used to
detect the presence of antibody and is one of the techniques used to test for HIV infection. In that test,
viral core proteins (the antigen) are absorbed to the bottom of a well. Antibodies from a patient are then
55
added and allowed to bind to the antigen. Finally, enzyme-linked antibodies against human antibodies are
added and allowed to react. Unbound antibodies are removed by washing. Substrate is then applied. A
coloured well implies that the patient had antibodies to the viral antigen. The sandwich ELISA allows
both the detection and the quantification of antigens. Antibody to a particular antigen is first absorbed to
the bottom of a well. Next, the sample containing the antigen is added to the well and allowed to interact.
Finally, a second, different antibody to the antigen is added. This antibody is enzyme linked and is
processed as described for indirect ELISA. In this case, the extent of reaction is directly proportional to
the amount of antigen present. Consequently, it permits the measurement of small quantities of antigen.
One variation that we can use is to change the linked-enzyme for a fluorescent-linked antibody. In
addition, we can also link an isotope, this technique is called RIA (radioactive immunosorbent assay)
(Crowther, 1995).
To carry out the ELISA, supernatants from stimulated and unstimulated cellular cultures were
collected. The concentrations TNF-α, IL-1, IL-8, IL-10, IFN-γ, TGF-β1, GM-CSF, and P4 were
measured through the use of commercially available ELISA kits (eBioscience), following the
manufacturer’s instructions. In summary, the protocol required dilution of the capture antibody, which is
a monoclonal antibody specific for the respective human biomolecule, to a concentration of 3 µg/ml in
coating buffer. Using a 96 well plate, 100 µl of this antibody was then applied to the appropriate wells,
after which the plate was covered, and incubated in 4 overnight. The plate was then washed five times
with PBS and blocked adding 200 µl of blocking buffer. The plate was then incubated at room
temperature (RT) for 2 h. 100 µl of the protein standards or samples was then added into the wells, after
which the plate was again incubated for 2 h at RT. The plate was washed three times with PBS to remove
any unbound antigen. Then, 100 µl of biotin conjugated antibodies specific for the appropriate cytokine
were added to each of the wells, and the plate was incubated at RT for 1 h. Plate was washed five times
using PBS and 100 µl of substrate added. The reactions resulted in the wells turning blue, this indicated a
positive reaction. The stop solution was then added, resulting in a yellow colour. The absorbance of each
well was measured through the use of an ELISA reader at 450 nm, and a standard curve used to
determine the concentration of each cytokine was obtained. The samples were each assayed as triplicates.
56
2.1.5 Cell proliferation assay
A way in which to measure cell proliferation is through the metabolic activity of the cellular
population. One such assay is the CellTiter96 AQueous One Solution Cell Proliferation Assay (Promega),
which is a colorimetric method based on the use of a tetrazolium compound (3-(4,5-dimethylthiazol-2-
yl)-5-(3-carboxymethoxyphenyl)-2-(4-sulfophenyl)-2H-tetrazolium, inner salt; MTS) as well as an
electron coupling reagent (phenazine ethosulfate; PES). As PES has a solid chemical stability, it is
combined with MTS so as to form a stable solution. The principle is centred on the reduction of the MTS
tetrazolium compound by cells into a coloured formazan product that is soluble in cell culture medium.
This change is attributed to NADH, which is produced by the dehydrogenase enzymes found in
metabolically active cells. Briefly, this assay is carried out by adding a small amount of CellTiter96
AQueous One Solution Cell Reagent directly into cell cultures and incubating these for a period of 1-4 h.
Then, the absorbance is measured using a 96-well plate reader at 490 nm (1992). In this assay, the
quantity of formazan produced is directly proportional to the number of live cells in culture.
Cell proliferation was measured using the MTS CellTiter96 AQueous One Solution assay
following the manufacturer’s instructions. To do this, cells were seeded at a density of 1x10⁴ cells/well in
a 96-well plate in 100 µl of fresh complete medium. Following 24 h, cells were then serum starved for a
period of 6 h, after which they were treated with fresh starving medium or with fresh starving medium
containing the appropriate concentrations of P4, PIF or hCG (1000 ng/ml, 200 nM or 1000 ng/·ml,
respectively). Camptothecin (Sigma-Aldrich), a well-known cell apoptosis inducing agent, was used as
negative control at a concentration of 4 mM in starving medium. Cells were then incubated at 37 ºC and
5% CO2 for time different time points (0-72 h). Following incubation, 20 µl of cell titter solution reagent
was added to each well. Absorbance was then measured at 490 nm using a microplate reader.
2.1.6 Invasion assay
An invasion assay provides means by which to study the invasion capacities of cells in an in vitro
environment. This assay makes use of a modified Boyden chamber-like design consisting of two
chambers that are separated by a filter coated with extracellular matrix components (Albini et al., 1987a;
Albini et al., 1987b). Cells are then placed in the top chamber, and incubated in the presence of a specific

57
medium that contains certain chemoattractants in the bottom chamber. Cells will migrate from the top
chamber through the coated filter pores to the bottom filter. Cell invasion is then detected and quantified
using Calcein acetomethylester moiety (AM). The migrated cells are then dissociated from the filter
through the use of Calcein AM solution, which is internalized by the cells, and causing the intracellular
esterases to cleave the AM. As the free Calcein fluoresces brightly, it is thus used to quantify the number
of cells that have migrated.
To assess JEG-3 cells invasion capacity, Matrigel-coated (Corning) porous filters (8.0 µm pore
size) were used as a barrier in a Boyden-like chamber. The cells were seeded in a multi-well plate in
starving medium at a concentration of 5x10⁴ cells/well and incubated under standard culture conditions.
Different soluble factors were added to the medium (PIF at a concentration of 200 nM and P4 at a
concentration of 1000 ng/ml). Five wells were used for each stimulation. After incubation and fixation
with 70% ethanol, the non-invasive cells were removed from the upper surface of the membrane through
the use of a cotton swab, and stained with haematoxylin and eosin. The filters were then examined under
the microscope for cells on the underside of the membrane. The number of cells in eight fields was then
counted and the mean determined. The invasion was expressed as the number of cells invading through
the Matrigel relative to the cells migrating through the control membrane.
2.1.7 Methods for total protein extraction and analysis
The Western blot (Wb) technique is used to separate and identify proteins. Using this technique,
proteins are separated based on their molecular weight, through the use of gel electrophoresis. The
proteins are then transferred to a membrane, which is then incubated with antibodies specific to the
protein of interest.
2.1.7.1 Preparation of samples for protein analysis by SDS-PAGE
2.1.7.1.1 Cell lysates
Treated and untreated cells, as per the experimental set up, were detached, counted, and pelleted as
described in section 2.1.3.1. They were immediately lysed using sodium dodecyl sulphate (SDS)-lysis
buffer at a ratio of 1x10⁵ cells per 20 µl of buffer. The cell pellet was then vortexed, and heated at 95 ºC
58
for 5 min after which it was stored at -20 ºC until required for protein analysis by sodium dodecyl
sulphate-polyacrylamide gel electrophoresis (SDS-PAGE).
2.1.7.1.2 Protein concentration
A Bradford protein assay (BCA) is used as a tool to measure the total protein concentration of a
sample. This assay is based on the principle that when the proteins bind to the Coomassie dye under
acidic condition, a shift in absorption occurs from 465-595 nm resulting in a colour change from brown
to blue. This assay was carried out using the BCA, as previously described (Bradford and Richards,
1976). We used bovine serum albumin (BSA) at a concentration of 4 mg/ml as a calibration standard.
Five microliters of the standard was diluted sequentially in a microplate with PBS to produce a standard
curve. Five microliters of each protein sample was then aliquoted into a microplate, using 5 µl of PBS as
a control. Two hundred and fifty microliters of Bradford reagent (Sigma-Aldrich) were then added to
each well. The microplate was incubated at RT for 5 min, and absorbance was read using a plate reader at
595 nm. Protein concentrations for each sample was determined using the standard curved using the
absorbance of the standards.
2.1.7.1.3 SDS-PAGE and Western blot analysis.
SDS-PAGE is one of the most commonly used analytical method to separate components of a
protein mixture based on their molecular weights under the effect of an electric charge. For this
technique, a discontinuous polyacrylamide gel is used as a support medium. SDS, is also used to denature
the protein, so that all the samples acquire a uniform charge, so that the separation (electrophoretic
mobility) will only depend on the molecular weight (Mw) of the protein. SDS is also used as it will give
the proteins a negative charge, so that when loaded onto a gel, and placed in an electric field, they will
migrate towards the anode, and will be separated by a molecular sieving effect that is based on size: the
smaller molecules will migrate faster than the larger ones, which are restrained by the polyacrylamide gel
matrix (Chrambach and Rodbard, 1971).
In this research, we used a modified SDS-PAGE system (Bio-Rad), which is nevertheless based on
the original technique (Laemmli, 1970; Laemmli et al., 1970). Cell lysates were prepared as described in
1.7.1.1. Samples were diluted five times in SDS-sample buffer and heated for 5 min at 95 ºC. Samples
59
were then loaded onto the casted polyacrylamide gel (stacking gel at 4%) and resolved in the resolving
gel at 12% for 30 min (table 2.3) at 30 V after which, it was increased to 100 V until the gel finished
running (approximately 1 h - 2 h). A pre-stained standard protein marker (Fermentas), containing proteins
of known Mw, was also loaded onto the gel and run parallel to the protein samples. After the separation
using SDS-PAGE, protein samples can be visualized using a Coomassie blue staining (Meyer and
Lamberts, 1965). However, as we said, in this study we were more interested in looking for
predetermined proteins of known sizes, SDS-PAGE was thus followed by a technique referred to as Wb
or immunoblotting. All the buffers and gel compositions are summarized in Tables 2.2 and 2.3.
2.1.7.1.4 Western blotting
Western blotting is a technique used in the detection and analysis of proteins based on their ability
to bind to specific antibodies. In this technique, the proteins resolved by SDS-PAGE, are transferred to a
polyvinylidene difluoride (PVDF) membrane, which is then incubated with a specific antibody against a
target protein (Towbin et al., 1979). The transferred protein is further detected using a secondary
antibody that is either conjugated to an enzyme that produces a chemiluminescence signal in the presence
of an appropriate substrate, or that is labelled with a fluorescent tag. When the unbound antibody is
washed off, only the antibody that is bounded to the protein of interest is left. Development of the signal
will confirm the presence of the protein of interest in the total cell lysate analysed. The thickness of the
band produced by the antibody corresponds to the amount of protein, hence this is why this technique is
often referred to as semi-quantitative: using a standard can help to calculate the amount of protein
present.
Our proteins resolved using SDS-PAGE, were transferred onto a PVDF membrane (Immobilion P
Millipore Inc.), through the use of a semi-dry electro blotting apparatus Mini Trans- Blot Cell (Bio Rad)
using the following method. Before transfer, the SDS-PAGE gel was incubated in gel running buffer for
15 min. The PVDF membrane was dehydrated in absolute methanol for 10 sec and immediately washed
with reverse osmosis (RO) water. A stack/sandwich consisting of sponge, three Whatman papers soaked
in transfer buffer (Table 2), followed by the PVDF membrane, the SDS-PAGE gel, three Whatmann
papers, and sponge was then made. To ensure there were no air bubbles between the gel and the PVDF

60
membrane, a glass rod was gently rolled over the stack. This stack was placed on the semi-dry electro
blotter, which was transferred to the blotting apparatus. Ice cold transfer buffer was added to the
apparatus, a water cooling core added, the electrodes placed, and the apparatus set to transfer for 1 h at
110 mA/40 V. After transfer, the stack was disassembled, and the membrane washed with RO water. The
membrane was then incubated in blocking buffer (Table 2.2) for 1 h at RT or overnight at 4 ºC. After
blocking, the membrane was washed with washing buffer PBS-T (Table 2.2). This was then probed with
the primary antibody diluted in washing buffer (against the protein of interest) for 1 hr at RT or overnight
at 4 ºC. The membrane was then washed three times with washing buffer (10 min each wash), after which
the membrane was incubated with secondary antibody IRDye 800CW© Donkey anti-Mouse IgG (Li-Cor
Biosciences) prepared in washing buffer for 1 h at RT. Signals were detected using the OSDSSEY©
infrared imaging system (Li-Cor Biosciences).
It is very important to be aware that the data produced with a Wb is typically considered to be
semi-quantitative. This is because it provides a relative comparison of protein levels, but not an absolute
measure of quantity. There are two reasons for this. First, there are variations in loading and transfer rates
between the samples in separate lanes, which are different on separate blots. These differences will need
to be standardized before a more precise comparison can be made. Second, the signal generated by
detection is not linear across the concentration range of samples. Thus, since the signal produced is not
linear, it should not be used to model the concentration.
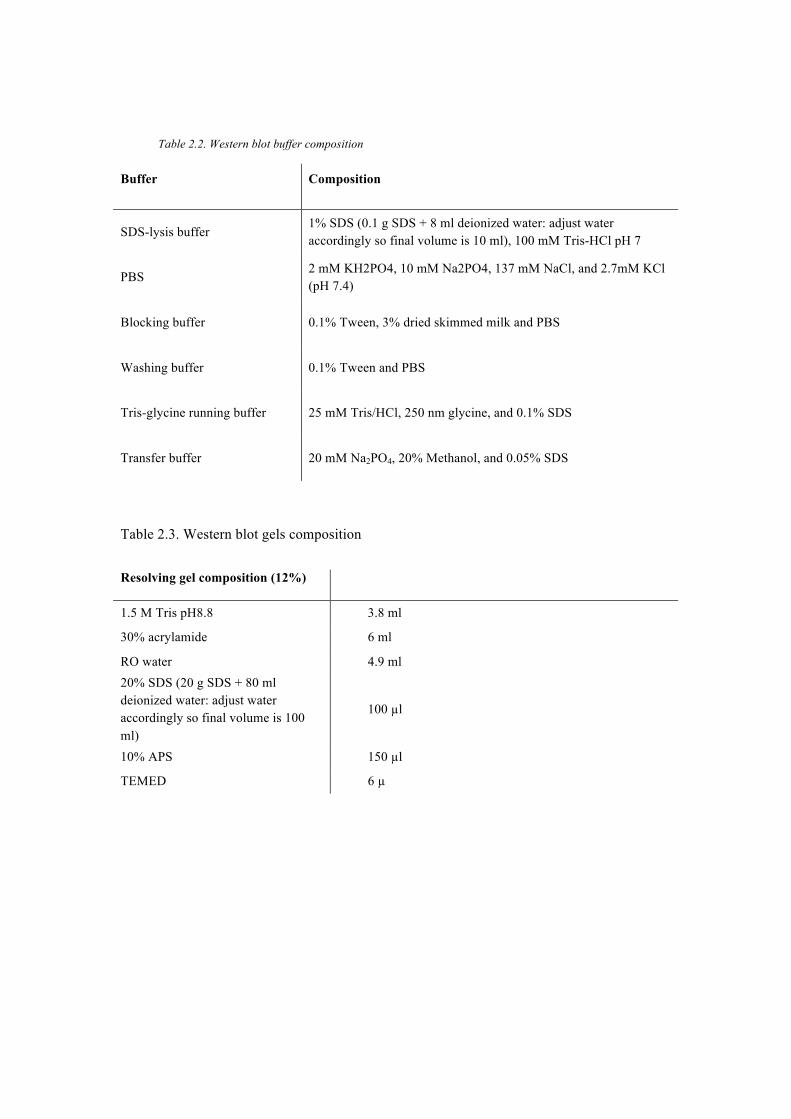
Table 2.2. Western blot buffer composition
Buffer Composition
SDS-lysis buffer 1% SDS (0.1 g SDS + 8 ml deionized water: adjust water accordingly so final volume is 10 ml), 100 mM Tris-HCl pH 7
PBS 2 mM KH2PO4, 10 mM Na2PO4, 137 mM NaCl, and 2.7mM KCl (pH 7.4)
Blocking buffer 0.1% Tween, 3% dried skimmed milk and PBS
Washing buffer 0.1% Tween and PBS
Tris-glycine running buffer 25 mM Tris/HCl, 250 nm glycine, and 0.1% SDS
Transfer buffer 20 mM Na2PO4, 20% Methanol, and 0.05% SDS
Table 2.3. Western blot gels composition
Resolving gel composition (12%)
1.5 M Tris pH8.8 3.8 ml
30% acrylamide 6 ml
RO water 4.9 ml 20% SDS (20 g SDS + 80 ml deionized water: adjust water accordingly so final volume is 100 ml)
100 µl
10% APS 150 µl
TEMED 6 µ
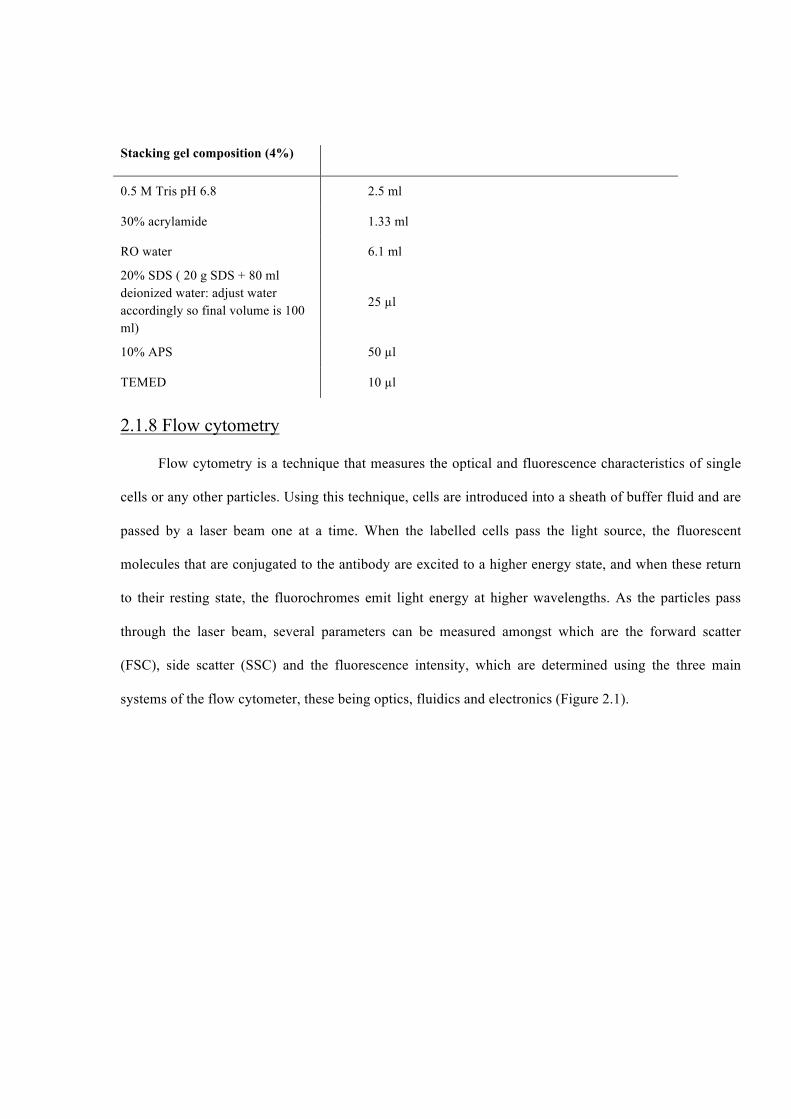
Stacking gel composition (4%)
0.5 M Tris pH 6.8 2.5 ml
30% acrylamide 1.33 ml
RO water 6.1 ml
20% SDS ( 20 g SDS + 80 ml deionized water: adjust water accordingly so final volume is 100 ml)
25 µl
10% APS 50 µl
TEMED 10 µl
2.1.8 Flow cytometry
Flow cytometry is a technique that measures the optical and fluorescence characteristics of single
cells or any other particles. Using this technique, cells are introduced into a sheath of buffer fluid and are
passed by a laser beam one at a time. When the labelled cells pass the light source, the fluorescent
molecules that are conjugated to the antibody are excited to a higher energy state, and when these return
to their resting state, the fluorochromes emit light energy at higher wavelengths. As the particles pass
through the laser beam, several parameters can be measured amongst which are the forward scatter
(FSC), side scatter (SSC) and the fluorescence intensity, which are determined using the three main
systems of the flow cytometer, these being optics, fluidics and electronics (Figure 2.1).
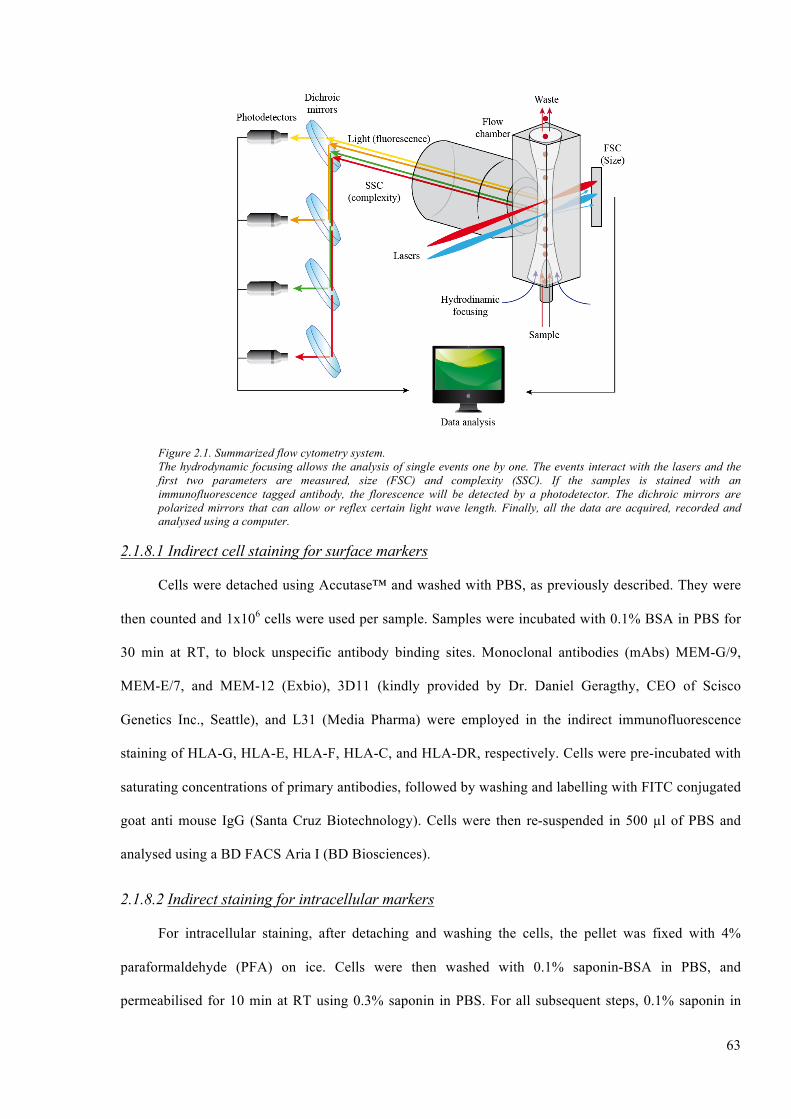
63
Figure 2.1. Summarized flow cytometry system. The hydrodynamic focusing allows the analysis of single events one by one. The events interact with the lasers and the first two parameters are measured, size (FSC) and complexity (SSC). If the samples is stained with an immunofluorescence tagged antibody, the florescence will be detected by a photodetector. The dichroic mirrors are polarized mirrors that can allow or reflex certain light wave length. Finally, all the data are acquired, recorded and analysed using a computer.
2.1.8.1 Indirect cell staining for surface markers
Cells were detached using Accutase™ and washed with PBS, as previously described. They were
then counted and 1x10⁶ cells were used per sample. Samples were incubated with 0.1% BSA in PBS for
30 min at RT, to block unspecific antibody binding sites. Monoclonal antibodies (mAbs) MEM-G/9,
MEM-E/7, and MEM-12 (Exbio), 3D11 (kindly provided by Dr. Daniel Geragthy, CEO of Scisco
Genetics Inc., Seattle), and L31 (Media Pharma) were employed in the indirect immunofluorescence
staining of HLA-G, HLA-E, HLA-F, HLA-C, and HLA-DR, respectively. Cells were pre-incubated with
saturating concentrations of primary antibodies, followed by washing and labelling with FITC conjugated
goat anti mouse IgG (Santa Cruz Biotechnology). Cells were then re-suspended in 500 µl of PBS and
analysed using a BD FACS Aria I (BD Biosciences).
2.1.8.2 Indirect staining for intracellular markers
For intracellular staining, after detaching and washing the cells, the pellet was fixed with 4%
paraformaldehyde (PFA) on ice. Cells were then washed with 0.1% saponin-BSA in PBS, and
permeabilised for 10 min at RT using 0.3% saponin in PBS. For all subsequent steps, 0.1% saponin in
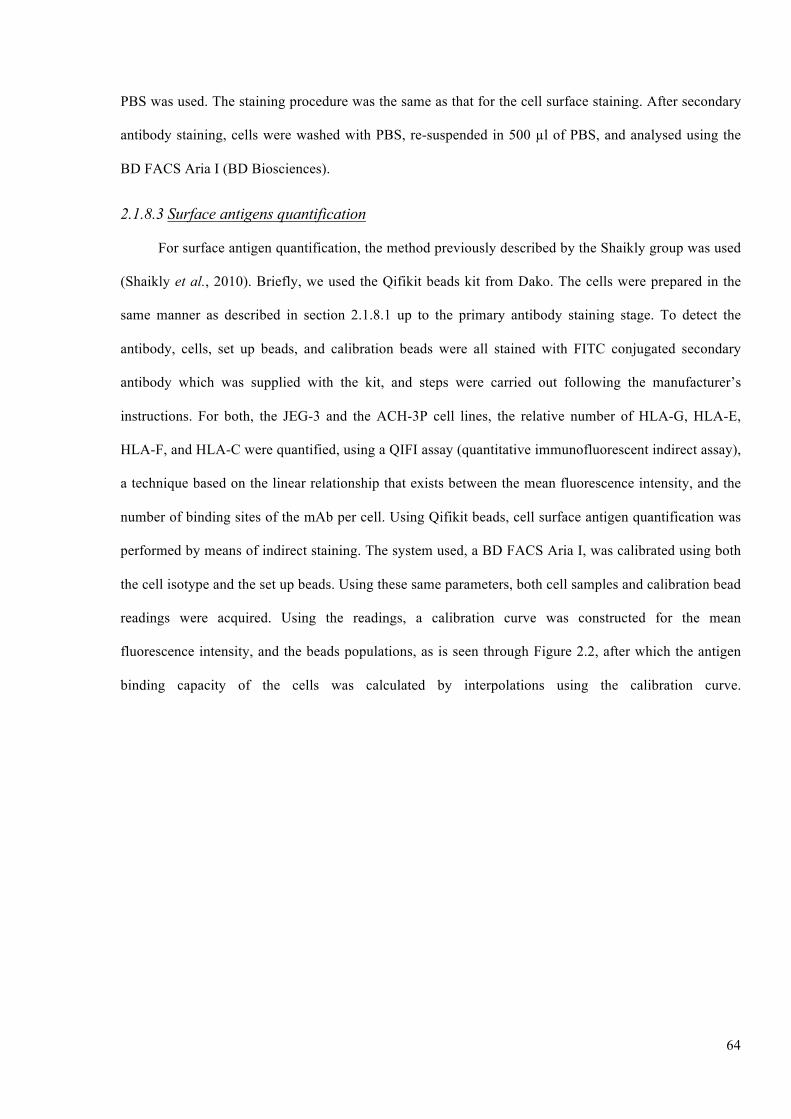
64
PBS was used. The staining procedure was the same as that for the cell surface staining. After secondary
antibody staining, cells were washed with PBS, re-suspended in 500 µl of PBS, and analysed using the
BD FACS Aria I (BD Biosciences).
2.1.8.3 Surface antigens quantification
For surface antigen quantification, the method previously described by the Shaikly group was used
(Shaikly et al., 2010). Briefly, we used the Qifikit beads kit from Dako. The cells were prepared in the
same manner as described in section 2.1.8.1 up to the primary antibody staining stage. To detect the
antibody, cells, set up beads, and calibration beads were all stained with FITC conjugated secondary
antibody which was supplied with the kit, and steps were carried out following the manufacturer’s
instructions. For both, the JEG-3 and the ACH-3P cell lines, the relative number of HLA-G, HLA-E,
HLA-F, and HLA-C were quantified, using a QIFI assay (quantitative immunofluorescent indirect assay),
a technique based on the linear relationship that exists between the mean fluorescence intensity, and the
number of binding sites of the mAb per cell. Using Qifikit beads, cell surface antigen quantification was
performed by means of indirect staining. The system used, a BD FACS Aria I, was calibrated using both
the cell isotype and the set up beads. Using these same parameters, both cell samples and calibration bead
readings were acquired. Using the readings, a calibration curve was constructed for the mean
fluorescence intensity, and the beads populations, as is seen through Figure 2.2, after which the antigen
binding capacity of the cells was calculated by interpolations using the calibration curve.
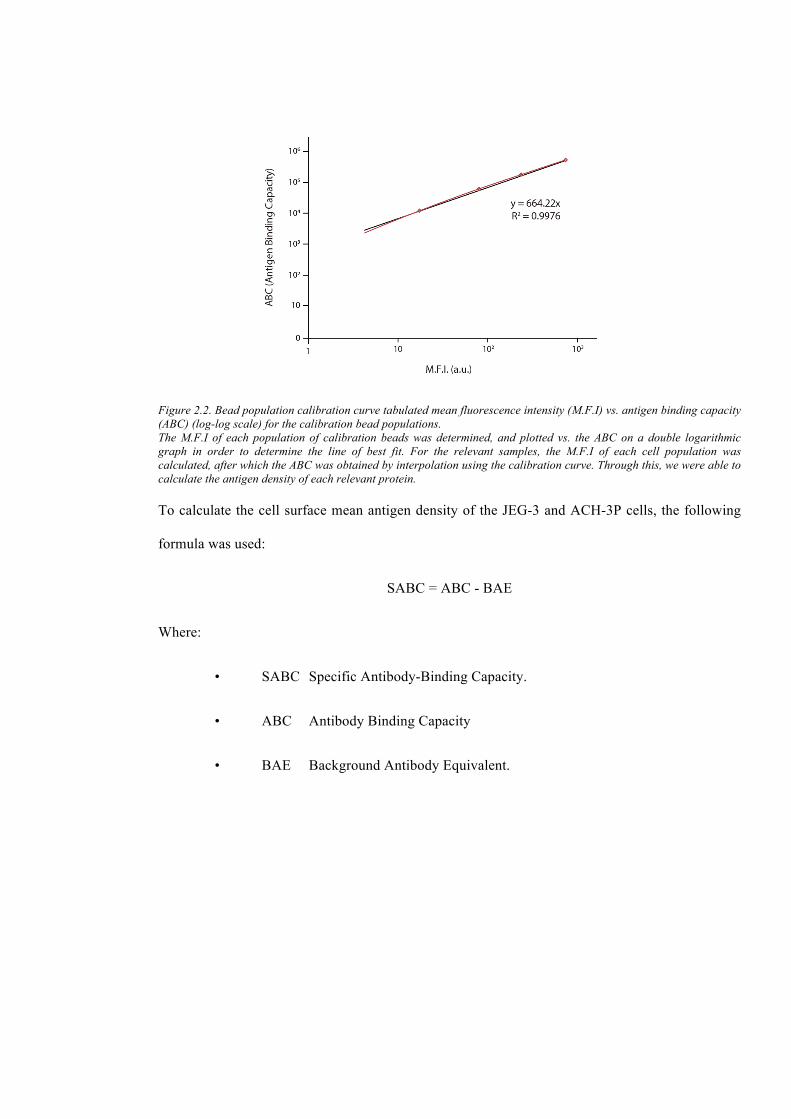
Figure 2.2. Bead population calibration curve tabulated mean fluorescence intensity (M.F.I) vs. antigen binding capacity (ABC) (log-log scale) for the calibration bead populations. The M.F.I of each population of calibration beads was determined, and plotted vs. the ABC on a double logarithmic graph in order to determine the line of best fit. For the relevant samples, the M.F.I of each cell population was calculated, after which the ABC was obtained by interpolation using the calibration curve. Through this, we were able to calculate the antigen density of each relevant protein.
To calculate the cell surface mean antigen density of the JEG-3 and ACH-3P cells, the following
formula was used:
SABC = ABC - BAE
Where:
• SABC Specific Antibody-Binding Capacity.
• ABC Antibody Binding Capacity
• BAE Background Antibody Equivalent.
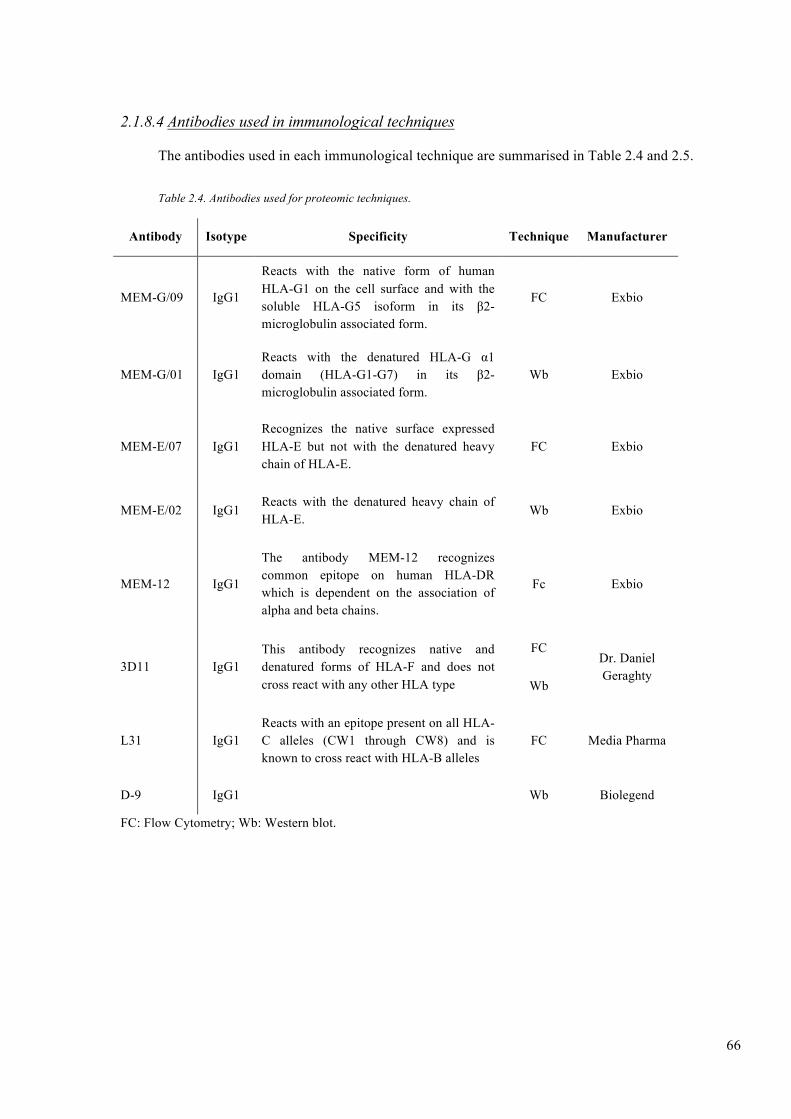
66
2.1.8.4 Antibodies used in immunological techniques
The antibodies used in each immunological technique are summarised in Table 2.4 and 2.5.
Table 2.4. Antibodies used for proteomic techniques.
Antibody Isotype Specificity Technique Manufacturer
MEM-G/09 IgG1
Reacts with the native form of human HLA-G1 on the cell surface and with the soluble HLA-G5 isoform in its β2-microglobulin associated form.
FC Exbio
MEM-G/01 IgG1 Reacts with the denatured HLA-G α1 domain (HLA-G1-G7) in its β2-microglobulin associated form.
Wb Exbio
MEM-E/07 IgG1 Recognizes the native surface expressed HLA-E but not with the denatured heavy chain of HLA-E.
FC Exbio
MEM-E/02 IgG1 Reacts with the denatured heavy chain of HLA-E.
Wb Exbio
MEM-12 IgG1
The antibody MEM-12 recognizes common epitope on human HLA-DR which is dependent on the association of alpha and beta chains.
Fc Exbio
3D11 IgG1 This antibody recognizes native and denatured forms of HLA-F and does not cross react with any other HLA type
FC Dr. Daniel Geraghty
Wb
L31 IgG1 Reacts with an epitope present on all HLA-C alleles (CW1 through CW8) and is known to cross react with HLA-B alleles
FC Media Pharma
D-9 IgG1 Wb Biolegend
FC: Flow Cytometry; Wb: Western blot.
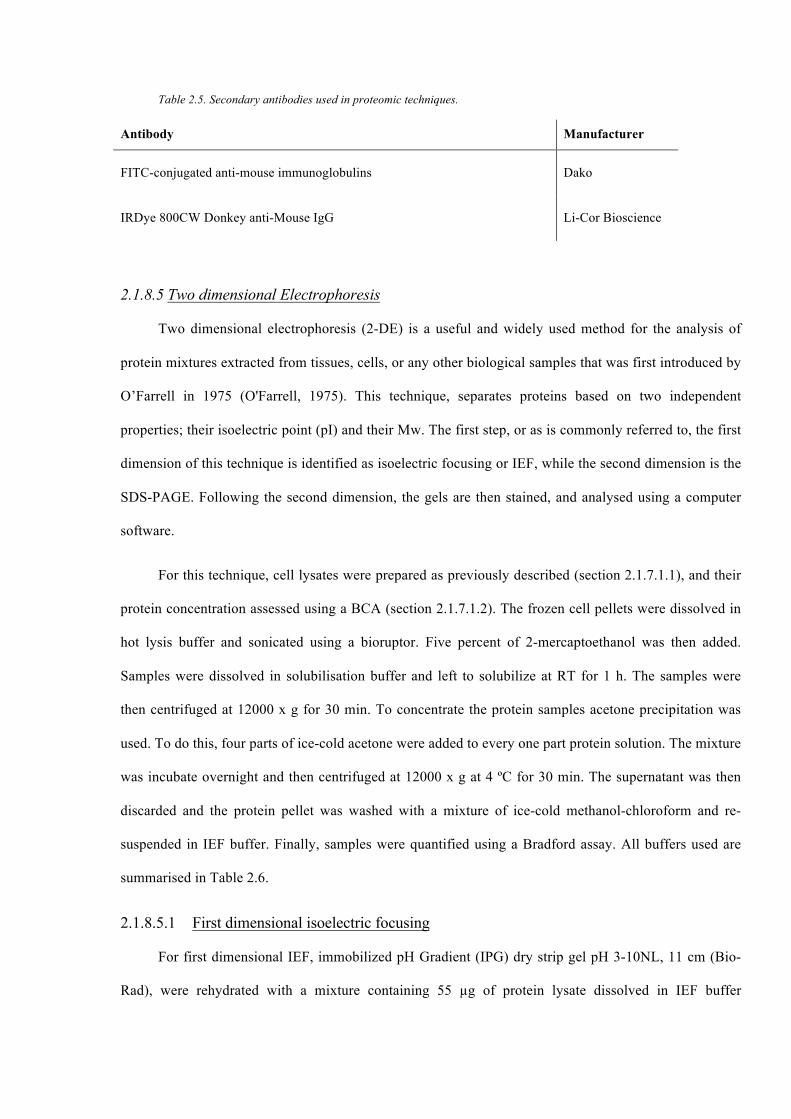
Table 2.5. Secondary antibodies used in proteomic techniques.
Antibody Manufacturer
FITC-conjugated anti-mouse immunoglobulins Dako
IRDye 800CW Donkey anti-Mouse IgG Li-Cor Bioscience
2.1.8.5 Two dimensional Electrophoresis
Two dimensional electrophoresis (2-DE) is a useful and widely used method for the analysis of
protein mixtures extracted from tissues, cells, or any other biological samples that was first introduced by
O’Farrell in 1975 (O'Farrell, 1975). This technique, separates proteins based on two independent
properties; their isoelectric point (pI) and their Mw. The first step, or as is commonly referred to, the first
dimension of this technique is identified as isoelectric focusing or IEF, while the second dimension is the
SDS-PAGE. Following the second dimension, the gels are then stained, and analysed using a computer
software.
For this technique, cell lysates were prepared as previously described (section 2.1.7.1.1), and their
protein concentration assessed using a BCA (section 2.1.7.1.2). The frozen cell pellets were dissolved in
hot lysis buffer and sonicated using a bioruptor. Five percent of 2-mercaptoethanol was then added.
Samples were dissolved in solubilisation buffer and left to solubilize at RT for 1 h. The samples were
then centrifuged at 12000 x g for 30 min. To concentrate the protein samples acetone precipitation was
used. To do this, four parts of ice-cold acetone were added to every one part protein solution. The mixture
was incubate overnight and then centrifuged at 12000 x g at 4 ºC for 30 min. The supernatant was then
discarded and the protein pellet was washed with a mixture of ice-cold methanol-chloroform and re-
suspended in IEF buffer. Finally, samples were quantified using a Bradford assay. All buffers used are
summarised in Table 2.6.
2.1.8.5.1 First dimensional isoelectric focusing
For first dimensional IEF, immobilized pH Gradient (IPG) dry strip gel pH 3-10NL, 11 cm (Bio-
Rad), were rehydrated with a mixture containing 55 µg of protein lysate dissolved in IEF buffer
68
containing 1 µl IPG buffer and 2.4 µl destreak reagent, all make up to a total volume of 202 µl. Strips
were allowed to rehydrate for 24 h at RT. The IPG strips were then focused using an IPGphor system.
Rehydrated filter wicks were placed between the electrodes and the IPG strip. The separation of the
protein mixture in the first dimension was carried out at 20 ºC for 24 h, following the manufacturer’s
instructions. After IEF, strips were rinsed in deionized water and stored at -80 ºC to be used at a later
time.
2.1.8.5.2 Second dimensional SDS-PAGE
IPG strips were incubated in equilibrium buffer 1 for 15 min at RT, and in equilibrium buffer 2 for
15 min at RT. Strips were then rinsed in electrophoresis buffer and second dimensional analysis was
carried out using a Criterion gel system (Bio-Rad). Each strip was placed into the well of a ready-to-use
12% SDS-PAGE gels (Bio-Rad) and sealed with agarose solution. Electrophoresis was carried out at 50
V for 30 min, after which it was increased to 150 V for 4-5 h. This was all carried out at RT. The gel was
then fixed overnight in fixing solution and stained using silver staining.
2.1.8.6 Silver staining.
The gels were stained using the silver staining protocol as described by the Shevchenko group
(Shevchenko et al., 1996). Gels were stained with 2.5% silver nitrate solution for 20 min after which,
they were washed with water for 1 min. Gels were then developed for 15 mins using developing solution
and the reaction was stopped by washing the gels with stop solution for 10 min. The gels were washed
three times with water and stored in 2% acetic acid at 4 ºC. Each sample was prepared and run as a
triplicate. Both solutions composition can be consulted in Table 2.7.
2.1.8.7 Spot analysis
The gels were scanned and analysed using SameSpots analysis software (Nonlinear dynamics
Ltd.). Digitized images from 12 silver stained gels were analysed for spot detection and quantification.
Image analysis included spot detection, editing, background subtraction, and spot matching. A master
image was created and all spots in the other gels were matched to this master image, both manually and
digitally. The size of each protein was expressed as the volume of the spot, which was defined as the sum
of the intensity of all the pixels that made up to spot was also calculated using the software. The spots,
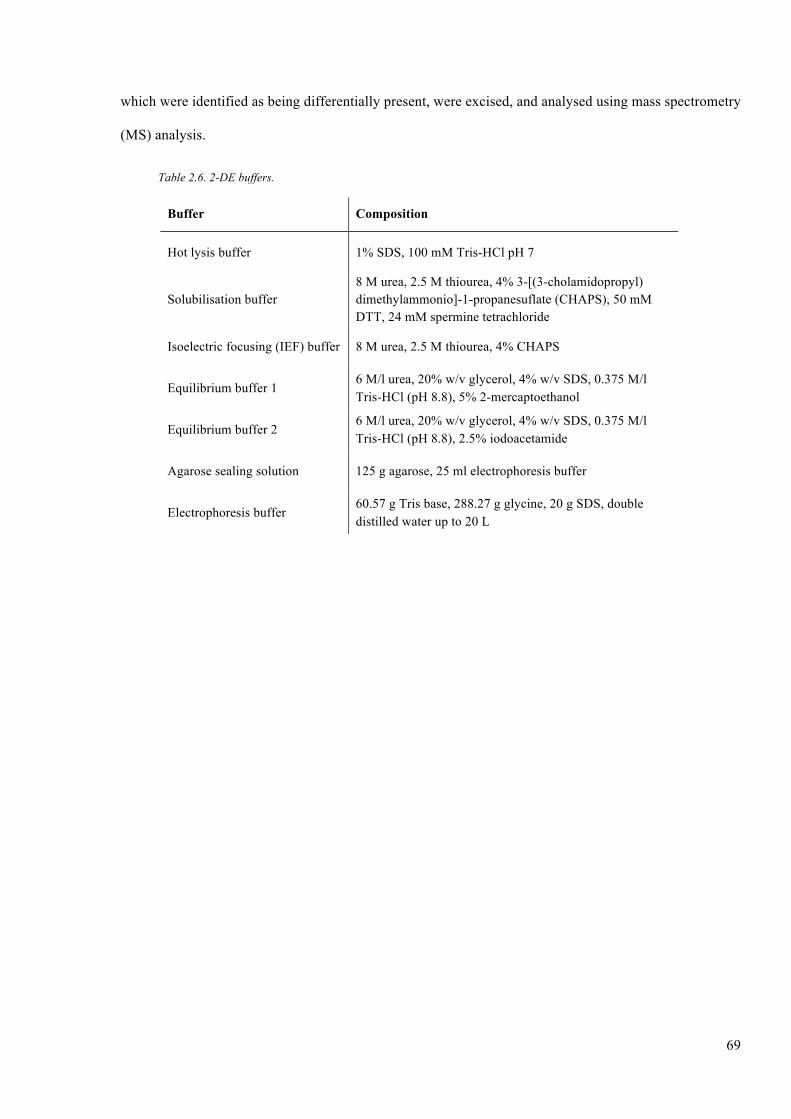
69
which were identified as being differentially present, were excised, and analysed using mass spectrometry
(MS) analysis.
Table 2.6. 2-DE buffers.
Buffer Composition
Hot lysis buffer 1% SDS, 100 mM Tris-HCl pH 7
Solubilisation buffer 8 M urea, 2.5 M thiourea, 4% 3-[(3-cholamidopropyl) dimethylammonio]-1-propanesuflate (CHAPS), 50 mM DTT, 24 mM spermine tetrachloride
Isoelectric focusing (IEF) buffer 8 M urea, 2.5 M thiourea, 4% CHAPS
Equilibrium buffer 1 6 M/l urea, 20% w/v glycerol, 4% w/v SDS, 0.375 M/l Tris-HCl (pH 8.8), 5% 2-mercaptoethanol
Equilibrium buffer 2 6 M/l urea, 20% w/v glycerol, 4% w/v SDS, 0.375 M/l Tris-HCl (pH 8.8), 2.5% iodoacetamide
Agarose sealing solution 125 g agarose, 25 ml electrophoresis buffer
Electrophoresis buffer 60.57 g Tris base, 288.27 g glycine, 20 g SDS, double distilled water up to 20 L
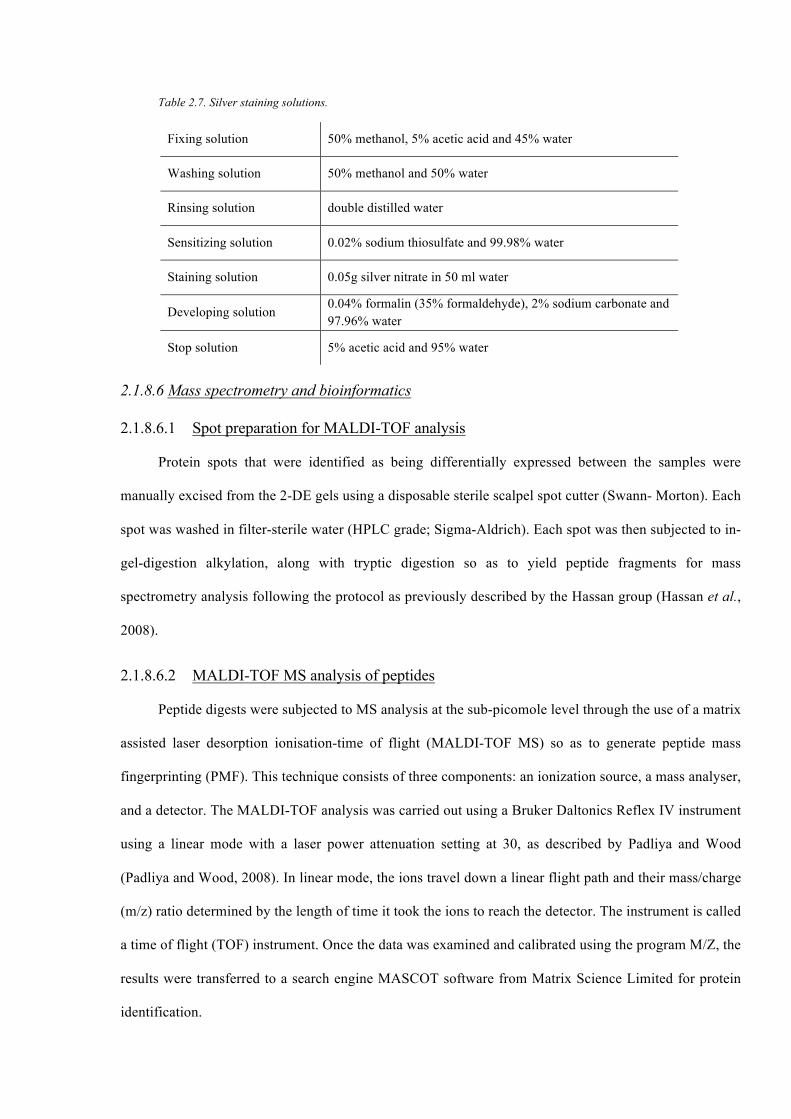
Table 2.7. Silver staining solutions.
Fixing solution 50% methanol, 5% acetic acid and 45% water
Washing solution 50% methanol and 50% water
Rinsing solution double distilled water
Sensitizing solution 0.02% sodium thiosulfate and 99.98% water
Staining solution 0.05g silver nitrate in 50 ml water
Developing solution 0.04% formalin (35% formaldehyde), 2% sodium carbonate and 97.96% water
Stop solution 5% acetic acid and 95% water
2.1.8.6 Mass spectrometry and bioinformatics
2.1.8.6.1 Spot preparation for MALDI-TOF analysis
Protein spots that were identified as being differentially expressed between the samples were
manually excised from the 2-DE gels using a disposable sterile scalpel spot cutter (Swann- Morton). Each
spot was washed in filter-sterile water (HPLC grade; Sigma-Aldrich). Each spot was then subjected to in-
gel-digestion alkylation, along with tryptic digestion so as to yield peptide fragments for mass
spectrometry analysis following the protocol as previously described by the Hassan group (Hassan et al.,
2008).
2.1.8.6.2 MALDI-TOF MS analysis of peptides
Peptide digests were subjected to MS analysis at the sub-picomole level through the use of a matrix
assisted laser desorption ionisation-time of flight (MALDI-TOF MS) so as to generate peptide mass
fingerprinting (PMF). This technique consists of three components: an ionization source, a mass analyser,
and a detector. The MALDI-TOF analysis was carried out using a Bruker Daltonics Reflex IV instrument
using a linear mode with a laser power attenuation setting at 30, as described by Padliya and Wood
(Padliya and Wood, 2008). In linear mode, the ions travel down a linear flight path and their mass/charge
(m/z) ratio determined by the length of time it took the ions to reach the detector. The instrument is called
a time of flight (TOF) instrument. Once the data was examined and calibrated using the program M/Z, the
results were transferred to a search engine MASCOT software from Matrix Science Limited for protein
identification.

71
2.1.9 Statistical analysis
The statistical analysis was performed using the software SigmaPlot version 12.5 (Systat Software
Inc.). The descriptive statistics and normality test were done as a first step. If the population followed a
normal distribution (Gauss' Bell) Student's t-test was used to compare the different groups (treated vs.
non-treated, surface vs. intracellular antigen expression, etc.). If the population did not follow a normal
distribution Mann-Whitney U test was used. This test allows the comparison of groups, samples or data
that do not follow a normal distribution pattern. The multiparametric comparison was performed by
ANOVA. A statistically significant value of P ≤ 0.05 was chosen a priori.

CHAPTER III. RESULTS: JEG-3 AND ACH-3P CELL LINES
CHARATERIZATION AND SELECTION
CHAPTER III
RESULTS
JEG-3 AND ACH-3P CELL LINES CHARATERIZATION AND
SELECTION
73
3.1 Introduction
The aim of the present study was to investigate how soluble factors affect HLA expression by
trophoblast cells. In this research, to study the role of HLAs, the choriocarcinoma cell lines JEG-3 and
ACH-3P were used. Both cell lines are good surrogates for primary trophoblast cells (Orendi et al.,
2011). JEG cell line, was established by the Kohler group in 1971 (Kohler and Bridson, 1971; Kohler et
al., 1971). It is a hypertriploid high-proliferating human cell line with a long lifespan, in comparison with
other chorocarcinoma cell lines like BeWo or Jar (Soares and Hunt, 2006a). From the parent cell line,
which was isolated from the Woods strain of Erwin-Turner tumour, six different clonal cell lines have
been established: JEG-1, JEG-2, JEG-3, JEG-4, JEG-7 and JEG-8. Though all the cell lines display
different morphologies, none are reported to form a syncytium (Kohler and Bridson, 1971; Kohler et al.,
1971). Of these clonally derived cell lines, JEG-3 is that which was used through the course of our
investigation. ACH-3P is a new hybrid, immortal cell line that was established by the Hiden group
(Hiden et al., 2007). Immortalization of this cell line was attained through fusion of primary first
trimester trophoblast cells with the choriocarcinoma cell line AC1-1 (Hiden et al., 2007). The ACH-3P
cell line was established in an effort to overcome limitations posed by the already existing cell lines such
as a lack of subpopulations and divergent genetic background.
HLAs expressed by the trophoblast cells are reported to exhibit both surface and intracellular
expression. To map the expression of these molecules in different cell lines, a comparative study of both
JEG-3 and ACH-3P cell lines was carried out, in an attempt to identify which of these cell lines would be
best suited for ensuing studies.
3.2 Results
3.2.1 Trophoblast-derived cell lines culture
Cell culture plays an important role in immunology, as it allows for a constant or critical number of
cells that can be studied biologically and immunologically to be obtained. Various methods to study cell
viability and proliferation in culture are available. To determine the proliferation of both cell lines, the
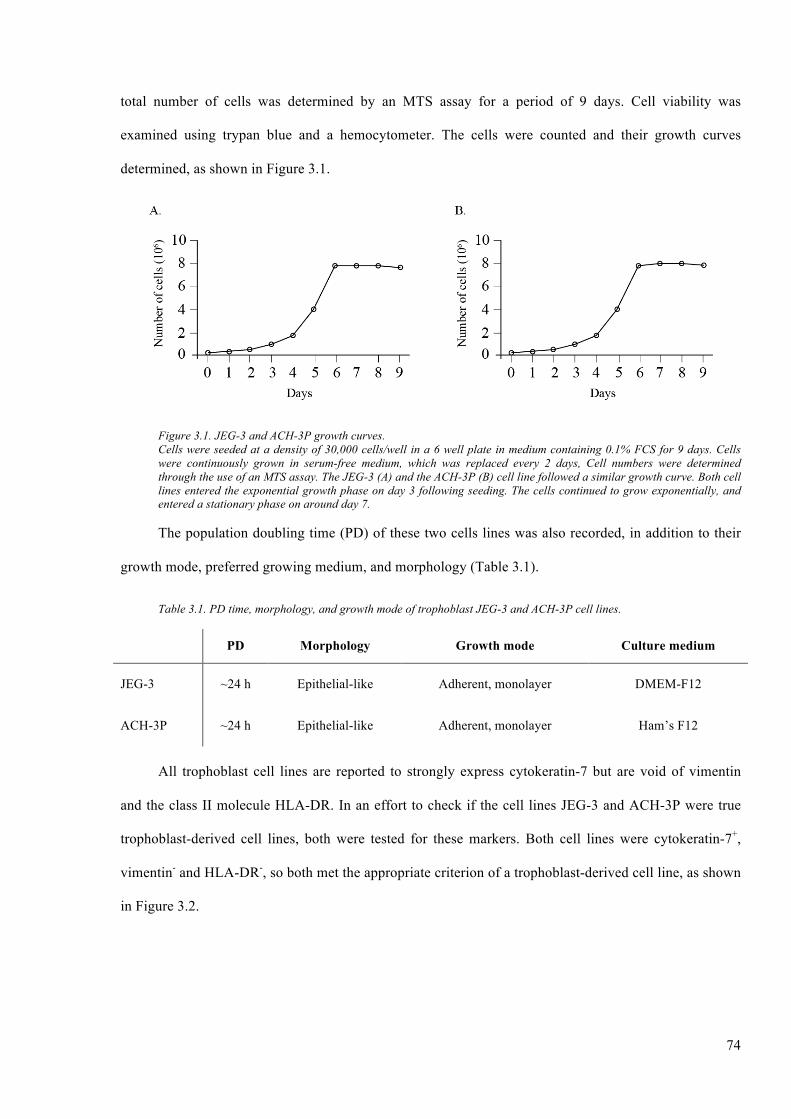
74
total number of cells was determined by an MTS assay for a period of 9 days. Cell viability was
examined using trypan blue and a hemocytometer. The cells were counted and their growth curves
determined, as shown in Figure 3.1.
Figure 3.1. JEG-3 and ACH-3P growth curves. Cells were seeded at a density of 30,000 cells/well in a 6 well plate in medium containing 0.1% FCS for 9 days. Cells were continuously grown in serum-free medium, which was replaced every 2 days, Cell numbers were determined through the use of an MTS assay. The JEG-3 (A) and the ACH-3P (B) cell line followed a similar growth curve. Both cell lines entered the exponential growth phase on day 3 following seeding. The cells continued to grow exponentially, and entered a stationary phase on around day 7.
The population doubling time (PD) of these two cells lines was also recorded, in addition to their
growth mode, preferred growing medium, and morphology (Table 3.1).
Table 3.1. PD time, morphology, and growth mode of trophoblast JEG-3 and ACH-3P cell lines.
PD Morphology Growth mode Culture medium
JEG-3 ~24 h Epithelial-like Adherent, monolayer DMEM-F12
ACH-3P ~24 h Epithelial-like Adherent, monolayer Ham’s F12
All trophoblast cell lines are reported to strongly express cytokeratin-7 but are void of vimentin
and the class II molecule HLA-DR. In an effort to check if the cell lines JEG-3 and ACH-3P were true
trophoblast-derived cell lines, both were tested for these markers. Both cell lines were cytokeratin-7+,
vimentin- and HLA-DR-, so both met the appropriate criterion of a trophoblast-derived cell line, as shown
in Figure 3.2.
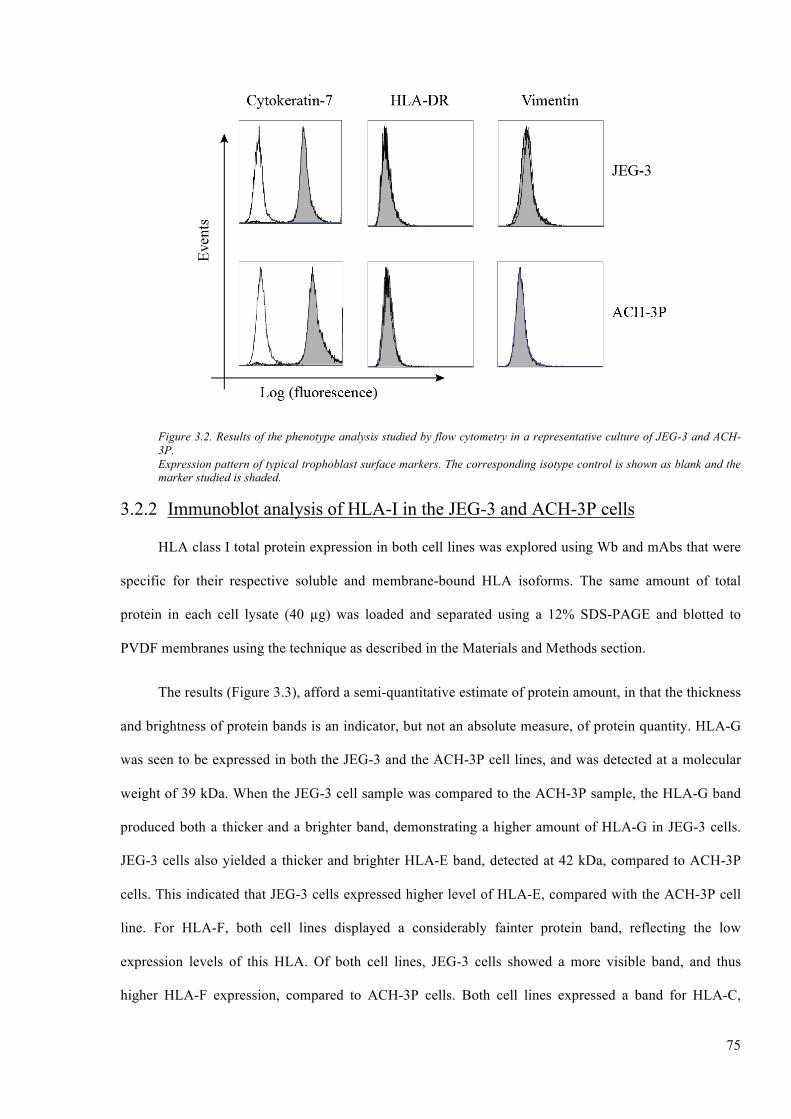
75
Figure 3.2. Results of the phenotype analysis studied by flow cytometry in a representative culture of JEG-3 and ACH-3P. Expression pattern of typical trophoblast surface markers. The corresponding isotype control is shown as blank and the marker studied is shaded.
3.2.2 Immunoblot analysis of HLA-I in the JEG-3 and ACH-3P cells
HLA class I total protein expression in both cell lines was explored using Wb and mAbs that were
specific for their respective soluble and membrane-bound HLA isoforms. The same amount of total
protein in each cell lysate (40 µg) was loaded and separated using a 12% SDS-PAGE and blotted to
PVDF membranes using the technique as described in the Materials and Methods section.
The results (Figure 3.3), afford a semi-quantitative estimate of protein amount, in that the thickness
and brightness of protein bands is an indicator, but not an absolute measure, of protein quantity. HLA-G
was seen to be expressed in both the JEG-3 and the ACH-3P cell lines, and was detected at a molecular
weight of 39 kDa. When the JEG-3 cell sample was compared to the ACH-3P sample, the HLA-G band
produced both a thicker and a brighter band, demonstrating a higher amount of HLA-G in JEG-3 cells.
JEG-3 cells also yielded a thicker and brighter HLA-E band, detected at 42 kDa, compared to ACH-3P
cells. This indicated that JEG-3 cells expressed higher level of HLA-E, compared with the ACH-3P cell
line. For HLA-F, both cell lines displayed a considerably fainter protein band, reflecting the low
expression levels of this HLA. Of both cell lines, JEG-3 cells showed a more visible band, and thus
higher HLA-F expression, compared to ACH-3P cells. Both cell lines expressed a band for HLA-C,
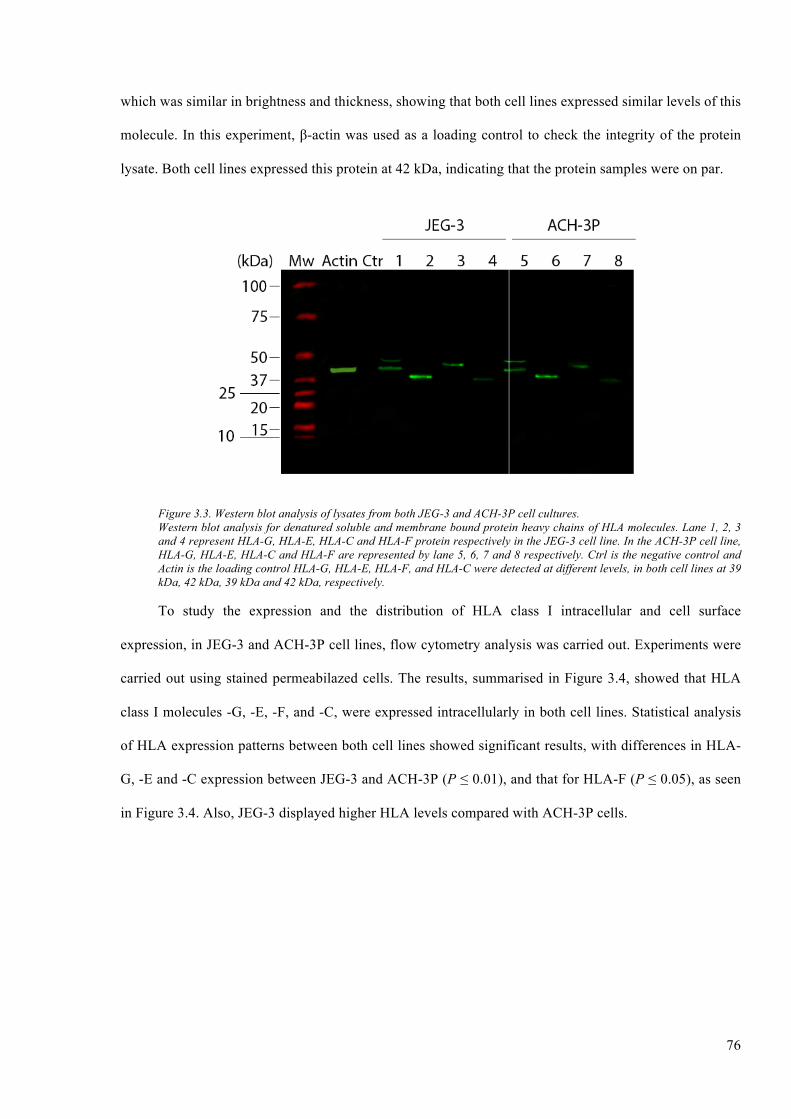
76
which was similar in brightness and thickness, showing that both cell lines expressed similar levels of this
molecule. In this experiment, β-actin was used as a loading control to check the integrity of the protein
lysate. Both cell lines expressed this protein at 42 kDa, indicating that the protein samples were on par.
Figure 3.3. Western blot analysis of lysates from both JEG-3 and ACH-3P cell cultures. Western blot analysis for denatured soluble and membrane bound protein heavy chains of HLA molecules. Lane 1, 2, 3 and 4 represent HLA-G, HLA-E, HLA-C and HLA-F protein respectively in the JEG-3 cell line. In the ACH-3P cell line, HLA-G, HLA-E, HLA-C and HLA-F are represented by lane 5, 6, 7 and 8 respectively. Ctrl is the negative control and Actin is the loading control HLA-G, HLA-E, HLA-F, and HLA-C were detected at different levels, in both cell lines at 39 kDa, 42 kDa, 39 kDa and 42 kDa, respectively.
To study the expression and the distribution of HLA class I intracellular and cell surface
expression, in JEG-3 and ACH-3P cell lines, flow cytometry analysis was carried out. Experiments were
carried out using stained permeabilazed cells. The results, summarised in Figure 3.4, showed that HLA
class I molecules -G, -E, -F, and -C, were expressed intracellularly in both cell lines. Statistical analysis
of HLA expression patterns between both cell lines showed significant results, with differences in HLA-
G, -E and -C expression between JEG-3 and ACH-3P (P ≤ 0.01), and that for HLA-F (P ≤ 0.05), as seen
in Figure 3.4. Also, JEG-3 displayed higher HLA levels compared with ACH-3P cells.
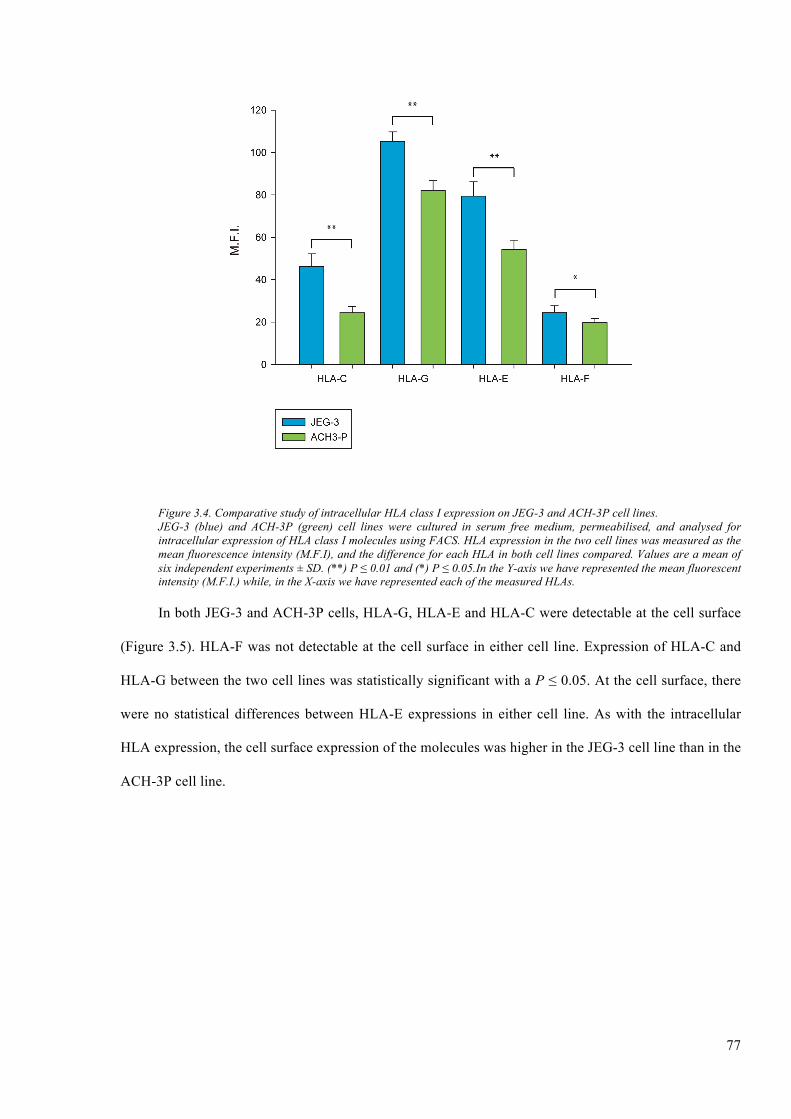
77
Figure 3.4. Comparative study of intracellular HLA class I expression on JEG-3 and ACH-3P cell lines. JEG-3 (blue) and ACH-3P (green) cell lines were cultured in serum free medium, permeabilised, and analysed for intracellular expression of HLA class I molecules using FACS. HLA expression in the two cell lines was measured as the mean fluorescence intensity (M.F.I), and the difference for each HLA in both cell lines compared. Values are a mean of six independent experiments ± SD. (**) P ≤ 0.01 and (*) P ≤ 0.05.In the Y-axis we have represented the mean fluorescent intensity (M.F.I.) while, in the X-axis we have represented each of the measured HLAs.
In both JEG-3 and ACH-3P cells, HLA-G, HLA-E and HLA-C were detectable at the cell surface
(Figure 3.5). HLA-F was not detectable at the cell surface in either cell line. Expression of HLA-C and
HLA-G between the two cell lines was statistically significant with a P ≤ 0.05. At the cell surface, there
were no statistical differences between HLA-E expressions in either cell line. As with the intracellular
HLA expression, the cell surface expression of the molecules was higher in the JEG-3 cell line than in the
ACH-3P cell line.
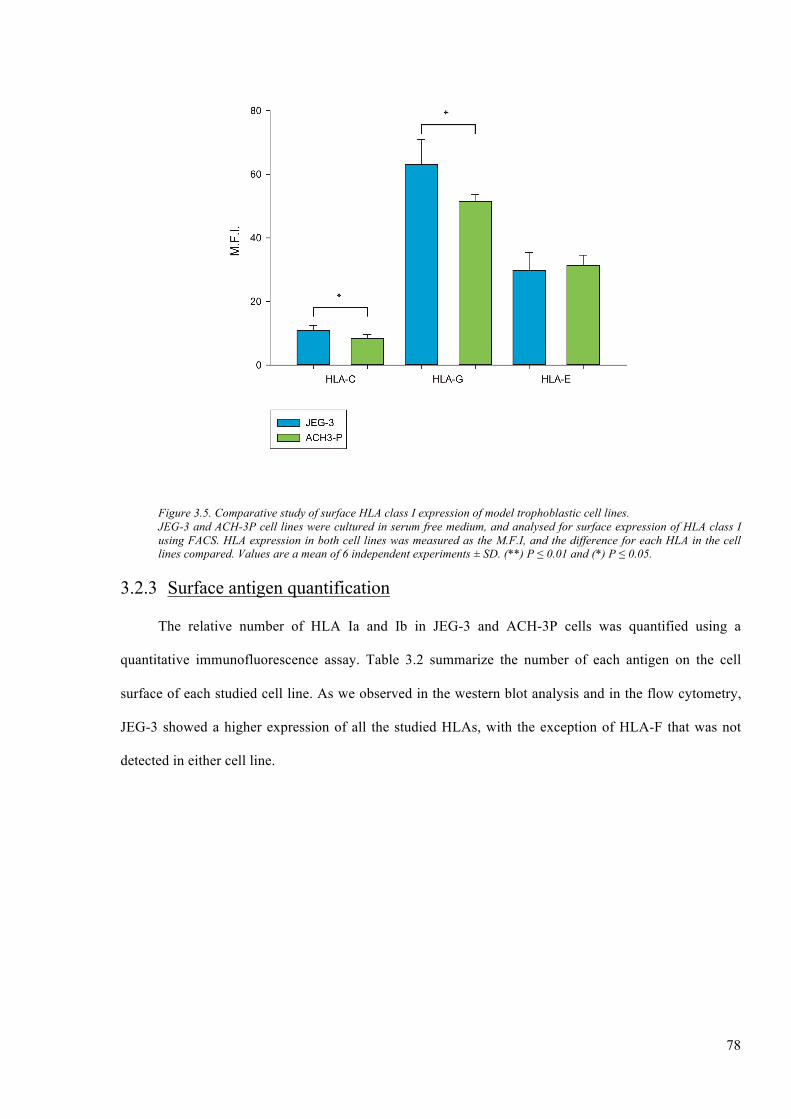
78
Figure 3.5. Comparative study of surface HLA class I expression of model trophoblastic cell lines. JEG-3 and ACH-3P cell lines were cultured in serum free medium, and analysed for surface expression of HLA class I using FACS. HLA expression in both cell lines was measured as the M.F.I, and the difference for each HLA in the cell lines compared. Values are a mean of 6 independent experiments ± SD. (**) P ≤ 0.01 and (*) P ≤ 0.05.
3.2.3 Surface antigen quantification
The relative number of HLA Ia and Ib in JEG-3 and ACH-3P cells was quantified using a
quantitative immunofluorescence assay. Table 3.2 summarize the number of each antigen on the cell
surface of each studied cell line. As we observed in the western blot analysis and in the flow cytometry,
JEG-3 showed a higher expression of all the studied HLAs, with the exception of HLA-F that was not
detected in either cell line.
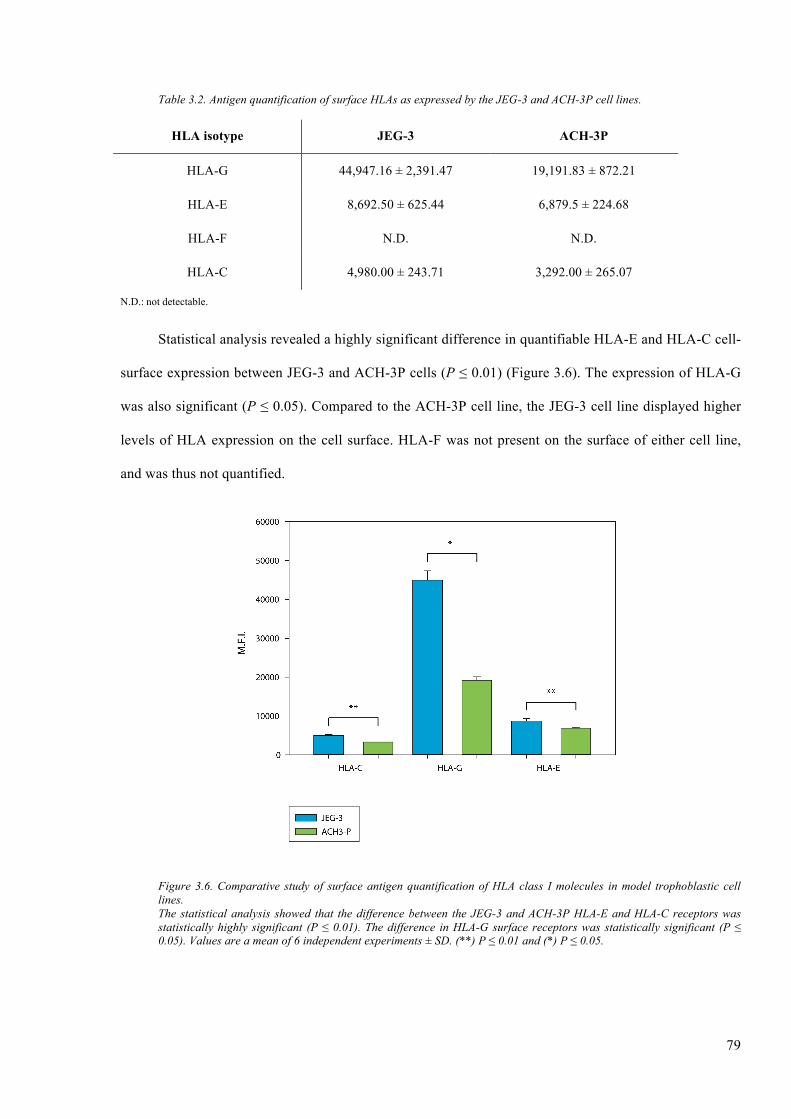
79
Table 3.2. Antigen quantification of surface HLAs as expressed by the JEG-3 and ACH-3P cell lines.
HLA isotype JEG-3 ACH-3P
HLA-G 44,947.16 ± 2,391.47 19,191.83 ± 872.21
HLA-E 8,692.50 ± 625.44 6,879.5 ± 224.68
HLA-F N.D. N.D.
HLA-C 4,980.00 ± 243.71 3,292.00 ± 265.07
N.D.: not detectable.
Statistical analysis revealed a highly significant difference in quantifiable HLA-E and HLA-C cell-
surface expression between JEG-3 and ACH-3P cells (P ≤ 0.01) (Figure 3.6). The expression of HLA-G
was also significant (P ≤ 0.05). Compared to the ACH-3P cell line, the JEG-3 cell line displayed higher
levels of HLA expression on the cell surface. HLA-F was not present on the surface of either cell line,
and was thus not quantified.
Figure 3.6. Comparative study of surface antigen quantification of HLA class I molecules in model trophoblastic cell lines. The statistical analysis showed that the difference between the JEG-3 and ACH-3P HLA-E and HLA-C receptors was statistically highly significant (P ≤ 0.01). The difference in HLA-G surface receptors was statistically significant (P ≤ 0.05). Values are a mean of 6 independent experiments ± SD. (**) P ≤ 0.01 and (*) P ≤ 0.05.
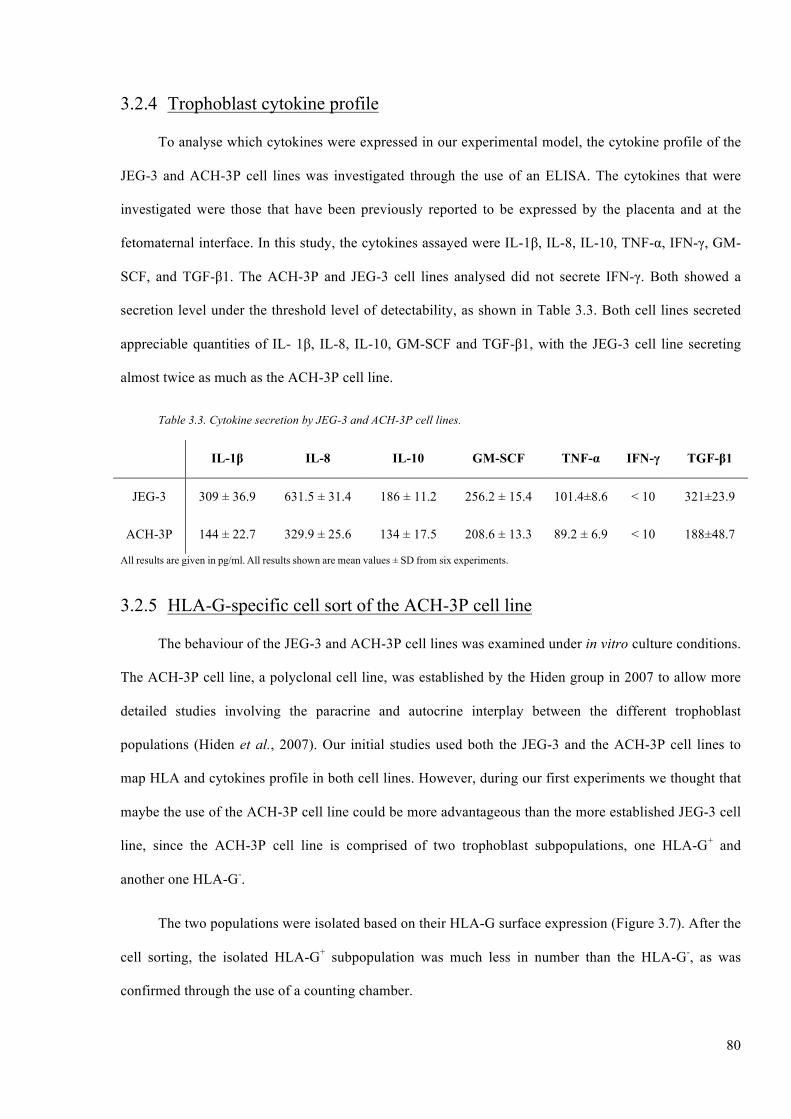
80
3.2.4 Trophoblast cytokine profile
To analyse which cytokines were expressed in our experimental model, the cytokine profile of the
JEG-3 and ACH-3P cell lines was investigated through the use of an ELISA. The cytokines that were
investigated were those that have been previously reported to be expressed by the placenta and at the
fetomaternal interface. In this study, the cytokines assayed were IL-1β, IL-8, IL-10, TNF-α, IFN-γ, GM-
SCF, and TGF-β1. The ACH-3P and JEG-3 cell lines analysed did not secrete IFN-γ. Both showed a
secretion level under the threshold level of detectability, as shown in Table 3.3. Both cell lines secreted
appreciable quantities of IL- 1β, IL-8, IL-10, GM-SCF and TGF-β1, with the JEG-3 cell line secreting
almost twice as much as the ACH-3P cell line.
Table 3.3. Cytokine secretion by JEG-3 and ACH-3P cell lines.
IL-1β IL-8 IL-10 GM-SCF TNF-α IFN-γ TGF-β1
JEG-3 309 ± 36.9 631.5 ± 31.4 186 ± 11.2 256.2 ± 15.4 101.4±8.6 < 10 321±23.9
ACH-3P 144 ± 22.7 329.9 ± 25.6 134 ± 17.5 208.6 ± 13.3 89.2 ± 6.9 < 10 188±48.7
All results are given in pg/ml. All results shown are mean values ± SD from six experiments.
3.2.5 HLA-G-specific cell sort of the ACH-3P cell line
The behaviour of the JEG-3 and ACH-3P cell lines was examined under in vitro culture conditions.
The ACH-3P cell line, a polyclonal cell line, was established by the Hiden group in 2007 to allow more
detailed studies involving the paracrine and autocrine interplay between the different trophoblast
populations (Hiden et al., 2007). Our initial studies used both the JEG-3 and the ACH-3P cell lines to
map HLA and cytokines profile in both cell lines. However, during our first experiments we thought that
maybe the use of the ACH-3P cell line could be more advantageous than the more established JEG-3 cell
line, since the ACH-3P cell line is comprised of two trophoblast subpopulations, one HLA-G+ and
another one HLA-G-.
The two populations were isolated based on their HLA-G surface expression (Figure 3.7). After the
cell sorting, the isolated HLA-G+ subpopulation was much less in number than the HLA-G-, as was
confirmed through the use of a counting chamber.
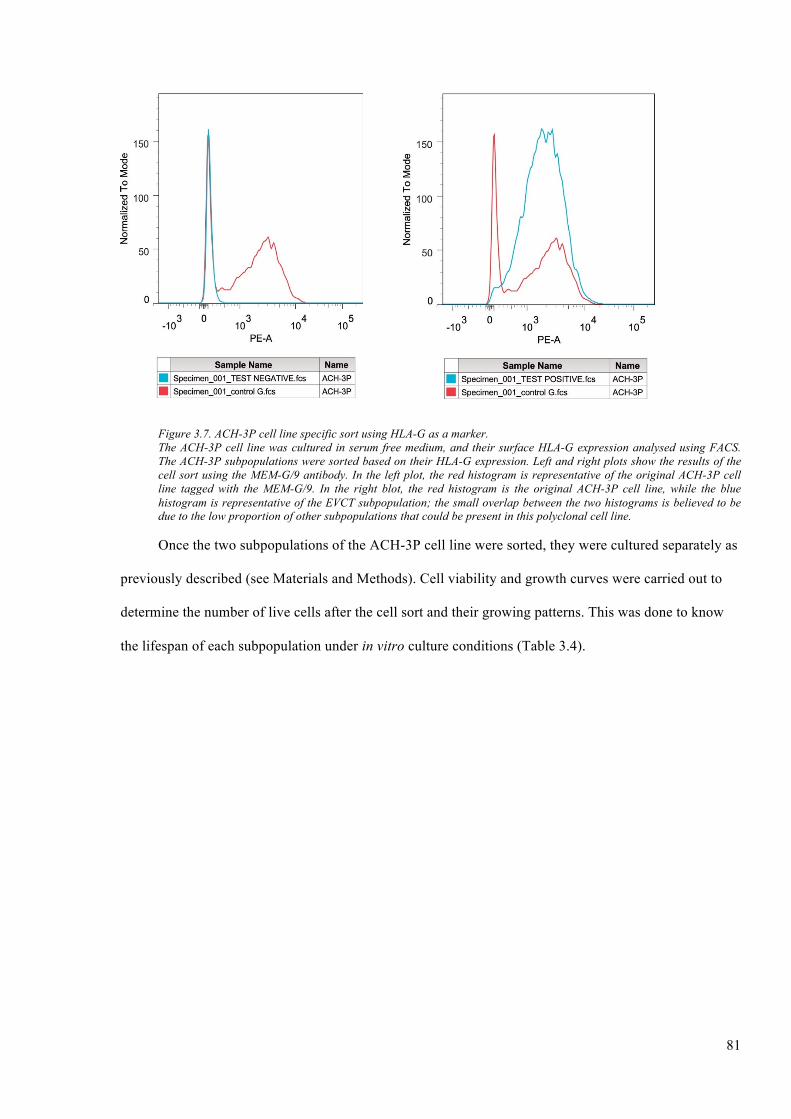
81
Figure 3.7. ACH-3P cell line specific sort using HLA-G as a marker. The ACH-3P cell line was cultured in serum free medium, and their surface HLA-G expression analysed using FACS. The ACH-3P subpopulations were sorted based on their HLA-G expression. Left and right plots show the results of the cell sort using the MEM-G/9 antibody. In the left plot, the red histogram is representative of the original ACH-3P cell line tagged with the MEM-G/9. In the right blot, the red histogram is the original ACH-3P cell line, while the blue histogram is representative of the EVCT subpopulation; the small overlap between the two histograms is believed to be due to the low proportion of other subpopulations that could be present in this polyclonal cell line.
Once the two subpopulations of the ACH-3P cell line were sorted, they were cultured separately as
previously described (see Materials and Methods). Cell viability and growth curves were carried out to
determine the number of live cells after the cell sort and their growing patterns. This was done to know
the lifespan of each subpopulation under in vitro culture conditions (Table 3.4).
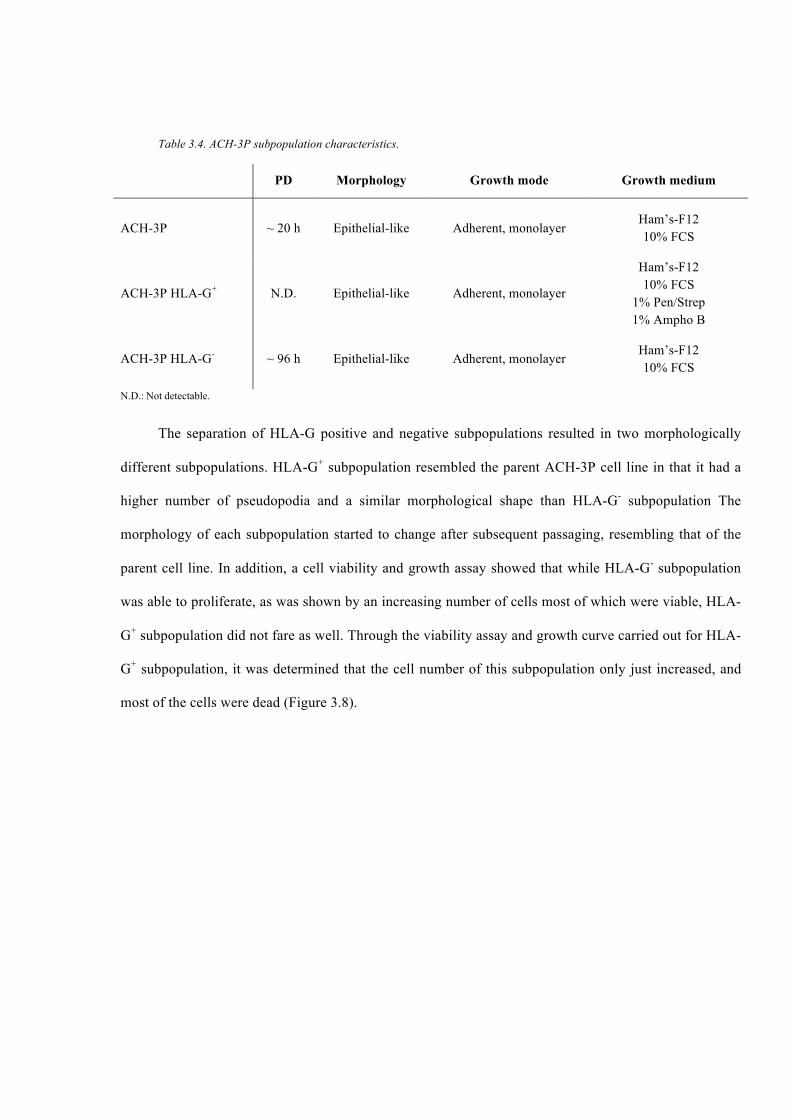
Table 3.4. ACH-3P subpopulation characteristics.
PD Morphology Growth mode Growth medium
ACH-3P ~ 20 h Epithelial-like Adherent, monolayer Ham’s-F12 10% FCS
ACH-3P HLA-G+ N.D. Epithelial-like Adherent, monolayer
Ham’s-F12 10% FCS
1% Pen/Strep 1% Ampho B
ACH-3P HLA-G- ~ 96 h Epithelial-like Adherent, monolayer Ham’s-F12 10% FCS
N.D.: Not detectable.
The separation of HLA-G positive and negative subpopulations resulted in two morphologically
different subpopulations. HLA-G+ subpopulation resembled the parent ACH-3P cell line in that it had a
higher number of pseudopodia and a similar morphological shape than HLA-G- subpopulation The
morphology of each subpopulation started to change after subsequent passaging, resembling that of the
parent cell line. In addition, a cell viability and growth assay showed that while HLA-G- subpopulation
was able to proliferate, as was shown by an increasing number of cells most of which were viable, HLA-
G+ subpopulation did not fare as well. Through the viability assay and growth curve carried out for HLA-
G+ subpopulation, it was determined that the cell number of this subpopulation only just increased, and
most of the cells were dead (Figure 3.8).
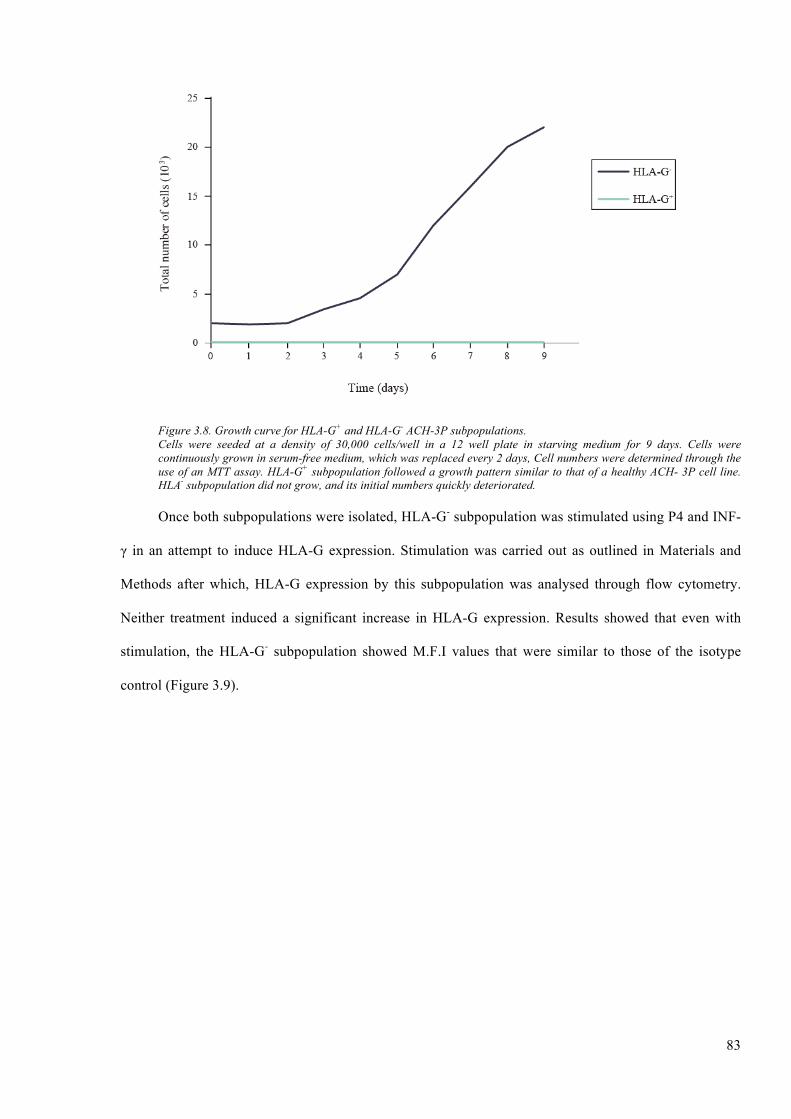
83
Figure 3.8. Growth curve for HLA-G+ and HLA-G- ACH-3P subpopulations. Cells were seeded at a density of 30,000 cells/well in a 12 well plate in starving medium for 9 days. Cells were continuously grown in serum-free medium, which was replaced every 2 days, Cell numbers were determined through the use of an MTT assay. HLA-G+ subpopulation followed a growth pattern similar to that of a healthy ACH- 3P cell line. HLA- subpopulation did not grow, and its initial numbers quickly deteriorated.
Once both subpopulations were isolated, HLA-G- subpopulation was stimulated using P4 and INF-
γ in an attempt to induce HLA-G expression. Stimulation was carried out as outlined in Materials and
Methods after which, HLA-G expression by this subpopulation was analysed through flow cytometry.
Neither treatment induced a significant increase in HLA-G expression. Results showed that even with
stimulation, the HLA-G- subpopulation showed M.F.I values that were similar to those of the isotype
control (Figure 3.9).
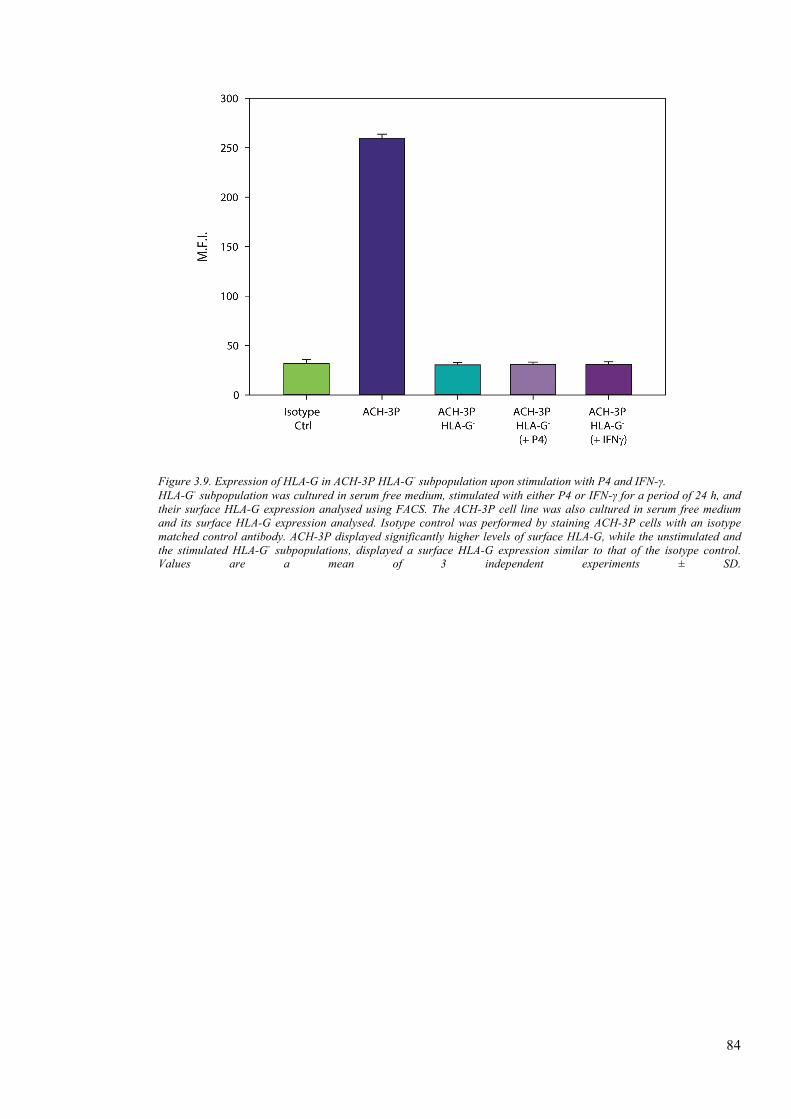
84
Figure 3.9. Expression of HLA-G in ACH-3P HLA-G- subpopulation upon stimulation with P4 and IFN-γ. HLA-G- subpopulation was cultured in serum free medium, stimulated with either P4 or IFN-γ for a period of 24 h, and their surface HLA-G expression analysed using FACS. The ACH-3P cell line was also cultured in serum free medium and its surface HLA-G expression analysed. Isotype control was performed by staining ACH-3P cells with an isotype matched control antibody. ACH-3P displayed significantly higher levels of surface HLA-G, while the unstimulated and the stimulated HLA-G- subpopulations, displayed a surface HLA-G expression similar to that of the isotype control. Values are a mean of 3 independent experiments ± SD.

3.3 Discussion
HLAs are the keystone of the antigen presentation system in humans and their expression, or lack
thereof, is important in pregnancy (Davies, 2007). As a means by which to study pregnancy, several
trophoblast cell lines have been well established and characterized, all of which have features that
resemble those of a distinct trophoblast subpopulation. Of these cell lines, JEG-3 is one which has been
extensively used in studies about the fetomaternal interface. Though these cell lines have proved essential
in studying pregnancy, they present some limitations. In vitro culture methods used to increase the
lifespan may alter the regulation of cell division, affecting the gene expression and differentiated
functions (Sutton et al., 2003; Roobrouck et al., 2011). Moreover, these cell lines sometimes have
characteristics that are related to their malignant origins (see appendix). Nevertheless, these cell lines
have been proved to be essential in studies addressing the interactions that take place at the fetomaternal
interface when there is no access to human, or even rat/mouse, trophoblasts or placental tissue.
Upon checking the origin of the JEG-3 and ACH-3P cell lines, their growth pattern was
characterised to distinguish when they are in the exponential phase, so as to ensure their viability and
phenotypic stability. Here, we want to clarify that there is no consensus about how to characterise cell
lines. The ATCC suggests some tests, which have been mentioned in the appendix. We performed three
of the five suggested methods (which we consider as being sufficient). Through the use of a cell viability
test and a generated growth curve, we determined that the ACH-3P and JEG-3 cell lines enter the log
exponential phase three days after seeding. In this phase, cells will continue to proliferate until they run
out of nutrients or their growing conditions change. The PD time was approximately 24 h. This was
important for later experiments in which the cells needed to be stable and in a proliferative phase prior to
their stimulation. This will help to avoid quiescent or senescent cells or cells in the G0 phase of the cell
cycle which decreases metabolism hence interfering with any response to stimulus. The results acquired
suggest that the two cell lines were behaviourally similar to an immortalised cell line, i.e. that they evade
normal cellular senescence. The JEG-3 cells were isolated from a choriocarcinoma while the ACH-3P
cell line was immortalized (Hiden et al., 2007). Such a feature is important as it means that unlike
86
primary cells cultured in vitro, which have a limited proliferative lifespan, a choriocarcinomic cell line
will grow readily in culture providing an abundant supply of cells that will display a stable phenotype
over the course of many passages (Soares and Hunt, 2006a).
By studying the growth pattern of the JEG-3 and ACH-3P cell lines, it was possible to identify the
optimal time point to passage them into subsequent cultures, or to use them for experiments. The two cell
lines were positive for a full range of HLAs that we enumerated previously (check Materials and
Methods or points 3.2.1 to 3.2.4 in this section). Cells used for the phenotyping of HLAs on JEG-3 and
ACH-3P were usually in the later stage of their exponential phase.
It has recently been recognized that trophoblast cells are not “blank” cells and, in addition to
HLAs, also secrete a wide range of cytokines through the three trimesters of pregnancy (Blaschitz et al.,
2001; Hutter et al., 1996; Juch et al., 2012). Stringent regulation of these cytokines is required if a
successful pregnancy is to happen. The first trimester of pregnancy, often described as a Th1-dominant
phase, is one where several pro-inflammatory cytokines are produced. Through the ELISA based studies,
it was seen that in both cases the JEG-3 and ACH-3P cell lines secreted constitutively the pro-
inflammatory cytokines IL-1β, IL-8, IL-10, GM-SCF, and TGF-β1 at relatively abundant levels. High
levels of TNF-α were also observed. These findings are in agreement with the theory that the first
trimester is Th1 dominated (Saito et al., 2010; Wilczynski, 2005). In addition, the results showed that the
JEG-3 cell line secreted a higher level of cytokines, namely IL-1β, when compared to the ACH-3P cell
line. We believe that such a result was because this cytokine is primarily found in EVCTs and not in
VCTs, which are the second major subpopulation in the ACH-3P cell line. This may be due to the
different trophoblast subpopulations between both cell lines. The trophoblast is reported to differentiate
into functionally different subpopulations (Naruse et al., 2010). Thus, it is possible that during the first
trimester the EVCT population provides a rich source of cytokines, which ensure proper invasion and
implantation of the foetus. This observation is supported by the Bischof group, who reported that the
EVCT was the only trophoblast population with IL-1 receptors (Bischof et al., 2000a; Bischof et al.,
2000b).
87
HLA-G is especially important in pregnancy as it has the ability to extenuate the immunological
function of several immunocompetent cells and, after implantation and development of the placenta, it
shifts the uterus’ status to that of an immune privileged site (Hunt et al., 2007). The presence of soluble
HLA-G in maternal circulation, in addition to expression of HLA-G by embryos, is also reported to result
in higher rates of successful pregnancy (Lynge Nilsson et al., 2014). Through our results, gathered
through proteomic techniques, namely flow cytometry and Wb, we were able to establish that JEG-3 and
ACH-3P cells express HLA-G, both on the cell surface and intracellularly. However, the JEG-3 cell line,
which is comprised of only EVCT cells, expressed a higher level of HLA-G, both on the surface and
intracellularly, than did the ACH-3P cell line. This difference in the expression of HLA-G between the
two cell lines can be attributed to the fact that while JEG-3 is formed of one population while, the ACH-
3P cell line, based on its origin, is formed from two main populations, where the extravillous cells only
make up 40% of this cell population (Hiden et al., 2007). Thus, the number of HLA-G+ cells is lower
than in the JEG-3 cell line.
Our results also showed that after HLA-G, both cell lines most readily express HLA-E. It has been
reported that HLA-E expression is dependent on that of HLA-G. Specifically, cell surface expression of
HLA-E has been viewed as dependent, or facilitated, by the co-expression of HLA-G (Shaikly et al.,
2010; Guleria and Sayegh, 2007). However, our findings suggested that not all HLA-G expressed by the
JEG-3 and ACH-3P cells, was associated with HLA-E. We observed HLA-G and HLA-E values that
differed from one another. This could suggest that not all HLA-G and HLA-E expressed by the cells are
functionally associated. This is in agreement with results from previous research that reported that HLA-
G is found to be expressed independently of HLA-E (Ishitani et al., 2003; Jabeen et al., 2013).
In a previous study, it was reported that HLA-C is a ligand for KIRs, which are expressed on NK
cells who are well-known for their cytotoxic properties and ability to elicit an immune response (Blais et
al., 2011). Our results showed that significant levels of HLA-C were present in both JEG-3 and ACH-3P
cells, although compared to the other HLAs, its levels were lower. HLA-C plays a crucial role since if an
infection were to occur, it allows the mother to protect herself without adversely affecting the foetus.
Additionally, in the case of pregnancy complications, HLA-C will trigger a response that could induce a
88
preterm labour, protecting the mother. Although HLA-C expression levels in trophoblast cells are low
compared to that of HLA-G and HLA-E, it nevertheless remains important in pregnancy, being a ligand
for the different KIRs expressed by the uNK cells. The Hunt group have reported that HLA-C should not
be expressed by the trophoblast, due to its moderate polymorphism and ability to stimulate maternal anti-
foetal acquired immunity, if the paternal alleles differed greatly from those of the maternal host (Hunt et
al., 2005). It is here advocated that this molecule is important, because if HLA alleles are similar, this
will decrease the variability in the population and will lead to an abortion.
HLA-F is a molecule of little known function. It has only recently become of interest in human
pregnancy. It has been suggested that HLA-F is expressed on the trophoblast cells surface. However, this
remains an area of controversy and has only been reported by a few groups (Shobu et al., 2006; Ishitani et
al., 2006). Our results showed intracellular HLA-F expression in our experimental models. This is in
agreement with the findings of the Jabeen group, who reported that HLA- F’s expression was restricted to
the cell cytoplasm (Jabeen et al., 2013). On the other hand, the Shobu group have reported evidence that
trophoblast cells express HLA-F on their surface during late gestation stages (Shobu et al., 2006).
However, these discrepancies between our results and those published by the Shobu group can be
explained by the fact that whole the Shobu group used cells from mid to term gestation, we used first
trimester isolated cells. Therefore, it is possible that at the beginning of pregnancy, cells have the ability
to regulate the expression of autoantigens on the surface by an interference mechanism with other HLA
molecules or with molecules involved in the antigen groove loading mechanism, while at the later stages
of pregnancy this ability is lost.
Our study also appraised if the use of the new choriocarcinoma cell line, ACH-3P, which consists
of two distinct subpopulations, has advantages over the JEG-3 cell line. Through a specific cell sort, two
subpopulations were isolated based on their HLA-G expression, HLA-G+ and HLA-G- subpopulation.
HLA-G+ subpopulation, made up of the extravillous cells, was fewer in number than HLA-G-
subpopulation. This result is in agreement with those as reported by the Hiden group, who observed only
40% of the ACH-3P population to be extravillous and thus, HLA-G+ (Hiden et al., 2007). In addition,
when both isolated subpopulations were cultured, we found that, unlike HLA-G- subpopulation, HLA-G+
89
extravillous subpopulation was unable to grow and the number of viable cells quickly decreased. Such a
decline in this population may be in part due to the low levels of viable cells that remained after sorting,
or due to the morphological dissimilarities of the two cell lines: HLA-G+ subpopulation displayed a
higher number of pseudopodia than did HLA-G- subpopulation (Hiden et al., 2007). To date, no data
have been published that could explain why HLA-G+ and HLA-G- subpopulations of ACH-3P cells are
unable to grow. Even, the Hiden group reported that once separated, the subpopulations of the ACH-3P
cell line are only stable up to the 5th passage after which, it is necessary to carry out another sort to isolate
a fresh pool of ACH-3P subpopulations (Hiden et al., 2007). Because the cytotrophoblast population
displayed a more appropriate growth curve, and was the one with the more viable cells, an attempt was
made to induce HLA-G expression in the HLA-G- subpopulation. However, expression of HLA-G by this
subpopulation did not occur, even when cells were treated with P4 and IFN-γ, two soluble factors which
are reported to induce the expression of HLA-G in other cells isolated from human placenta (Carosella et
al., 2001; Lefebvre et al., 2000). This is possibly because HLA expression, especially HLA-G expression,
is restricted to the EVCT cell population (Hunt et al., 2005).
The use of primary cell cultures from human organs for research purposes is a coveted opportunity,
and even when this is the case, several limitations, such as restricted quantities and diseased tissue, are
posed to the investigator (Petroff et al., 2006). Using cell lines to study the fetomaternal relationship
greatly limits out ability to infer conclusions to an in vivo condition. Nonetheless, as cell lines are readily
available, have excellent viability, and there is limited ethical controversy surrounding their use, they
remain an essential tool in the field of reproductive immunology. Over the last three decades several cell
lines, have been established as a tool, by which to investigate, the fetomaternal interface. Of these,
BeWo, JEG, and Jar cell lines are those which have been adapted to standard cell culture conditions, and
those which have proven to be the most valuable for investigating human trophoblast differentiation and
function (Soares and Hunt, 2006b). In our study, the reliability and usefulness of JEG-3 and the ACH-3P
cell lines was appraised by mapping differences and similarities of HLA and cytokines that these cell
lines express. Subsequent research is likely to focus on the effect of soluble factors on HLA expression
and cytokine secretion. This will require a cell line that has consistent HLA expression. Through our
90
research, we found that the JEG-3 and the ACH-3P cell lines showed positive expression of the proteins
of interest while, JEG-3 cells consistently expressed higher levels of HLA molecules.
Trophoblast cells express a unique HLA profile, with different subpopulations expressing different
cytokines and HLAs. This study has allowed us to choose the cell line that is best suited to proceeding
investigations. It has also provided a better understanding of the JEG-3 and ACH-3P cell lines through
mapping of the differences in their HLA and cytokine expression profiles. The observed difference in
HLA profiles in the JEG-3 and ACH-3P lines is probably the result of the distinct trophoblast
subpopulations that constitute them. Whilst JEG-3 is comprised of extravillous cells, ACH-3P is
comprised of two subpopulations, extravillous and villous cytotrophoblasts.

CHAPTER IV. RESULTS: EFFECTS OF PROGESTERONE ON
JEG-3 CELLS
CHAPTER IV
RESULTS
AFFECTS OF PROGESTERONE ON JEG-3 CELLS
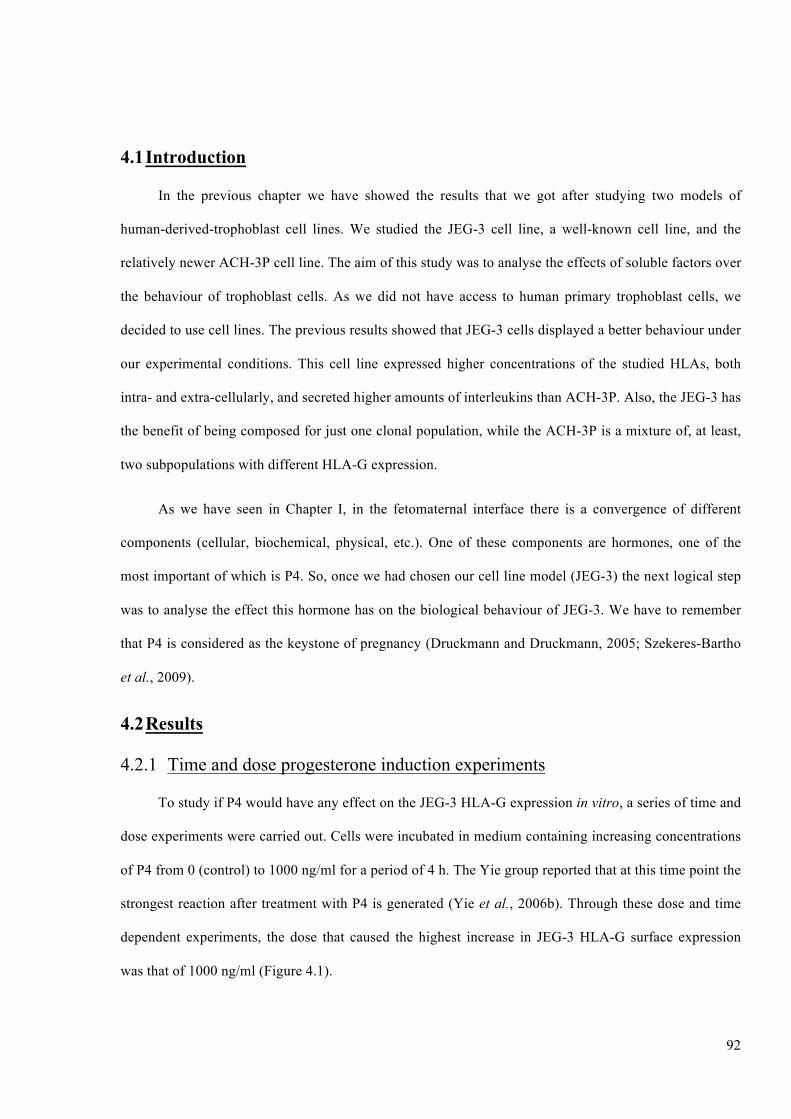
92
4.1 Introduction
In the previous chapter we have showed the results that we got after studying two models of
human-derived-trophoblast cell lines. We studied the JEG-3 cell line, a well-known cell line, and the
relatively newer ACH-3P cell line. The aim of this study was to analyse the effects of soluble factors over
the behaviour of trophoblast cells. As we did not have access to human primary trophoblast cells, we
decided to use cell lines. The previous results showed that JEG-3 cells displayed a better behaviour under
our experimental conditions. This cell line expressed higher concentrations of the studied HLAs, both
intra- and extra-cellularly, and secreted higher amounts of interleukins than ACH-3P. Also, the JEG-3 has
the benefit of being composed for just one clonal population, while the ACH-3P is a mixture of, at least,
two subpopulations with different HLA-G expression.
As we have seen in Chapter I, in the fetomaternal interface there is a convergence of different
components (cellular, biochemical, physical, etc.). One of these components are hormones, one of the
most important of which is P4. So, once we had chosen our cell line model (JEG-3) the next logical step
was to analyse the effect this hormone has on the biological behaviour of JEG-3. We have to remember
that P4 is considered as the keystone of pregnancy (Druckmann and Druckmann, 2005; Szekeres-Bartho
et al., 2009).
4.2 Results
4.2.1 Time and dose progesterone induction experiments
To study if P4 would have any effect on the JEG-3 HLA-G expression in vitro, a series of time and
dose experiments were carried out. Cells were incubated in medium containing increasing concentrations
of P4 from 0 (control) to 1000 ng/ml for a period of 4 h. The Yie group reported that at this time point the
strongest reaction after treatment with P4 is generated (Yie et al., 2006b). Through these dose and time
dependent experiments, the dose that caused the highest increase in JEG-3 HLA-G surface expression
was that of 1000 ng/ml (Figure 4.1).
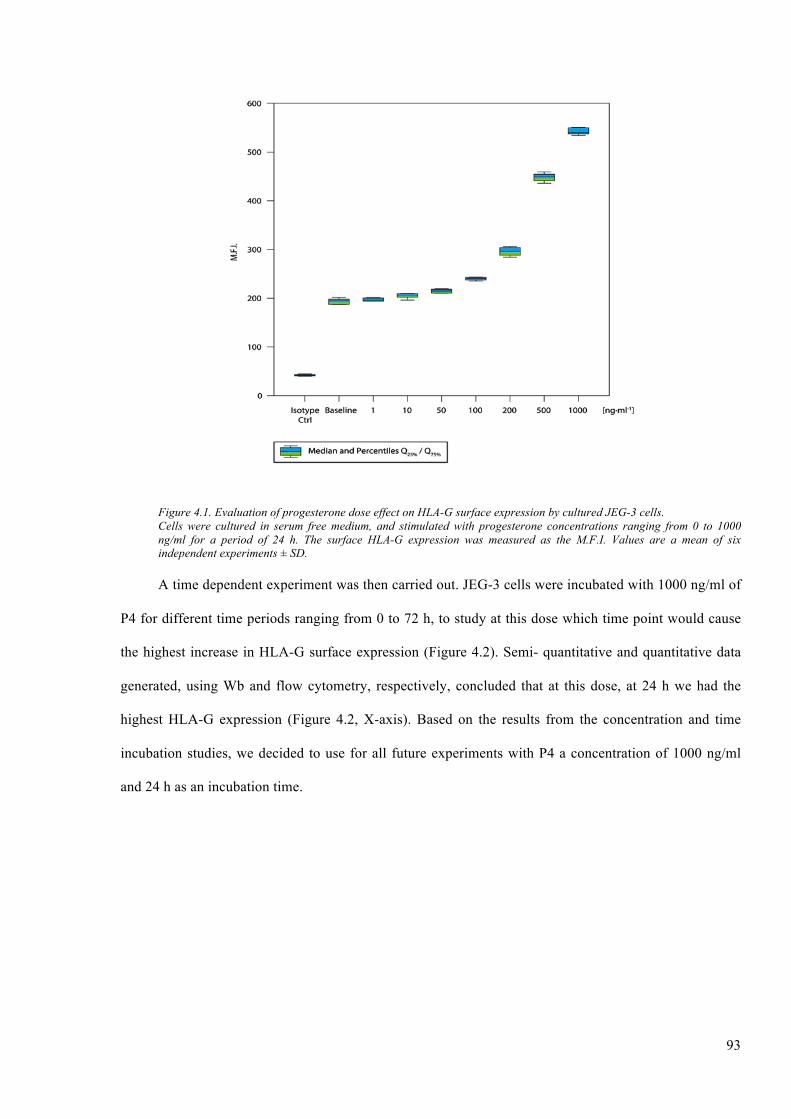
93
Figure 4.1. Evaluation of progesterone dose effect on HLA-G surface expression by cultured JEG-3 cells. Cells were cultured in serum free medium, and stimulated with progesterone concentrations ranging from 0 to 1000 ng/ml for a period of 24 h. The surface HLA-G expression was measured as the M.F.I. Values are a mean of six independent experiments ± SD.
A time dependent experiment was then carried out. JEG-3 cells were incubated with 1000 ng/ml of
P4 for different time periods ranging from 0 to 72 h, to study at this dose which time point would cause
the highest increase in HLA-G surface expression (Figure 4.2). Semi- quantitative and quantitative data
generated, using Wb and flow cytometry, respectively, concluded that at this dose, at 24 h we had the
highest HLA-G expression (Figure 4.2, X-axis). Based on the results from the concentration and time
incubation studies, we decided to use for all future experiments with P4 a concentration of 1000 ng/ml
and 24 h as an incubation time.
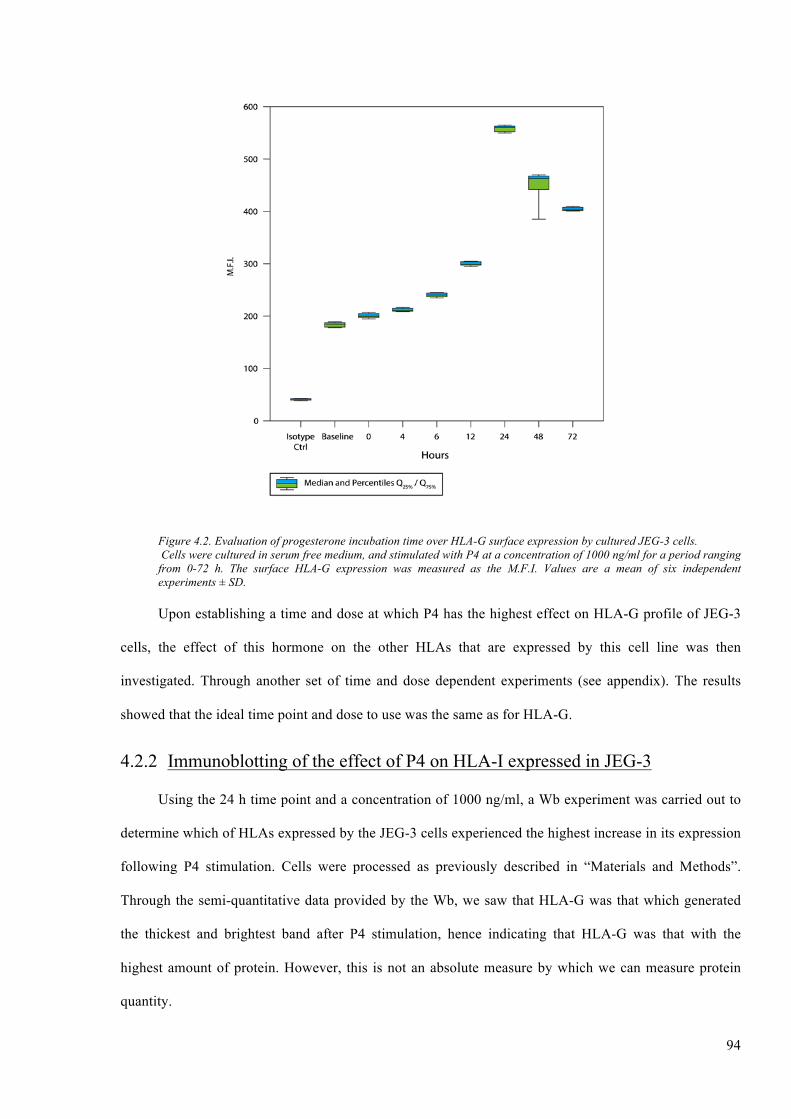
94
Figure 4.2. Evaluation of progesterone incubation time over HLA-G surface expression by cultured JEG-3 cells. Cells were cultured in serum free medium, and stimulated with P4 at a concentration of 1000 ng/ml for a period ranging from 0-72 h. The surface HLA-G expression was measured as the M.F.I. Values are a mean of six independent experiments ± SD.
Upon establishing a time and dose at which P4 has the highest effect on HLA-G profile of JEG-3
cells, the effect of this hormone on the other HLAs that are expressed by this cell line was then
investigated. Through another set of time and dose dependent experiments (see appendix). The results
showed that the ideal time point and dose to use was the same as for HLA-G.
4.2.2 Immunoblotting of the effect of P4 on HLA-I expressed in JEG-3
Using the 24 h time point and a concentration of 1000 ng/ml, a Wb experiment was carried out to
determine which of HLAs expressed by the JEG-3 cells experienced the highest increase in its expression
following P4 stimulation. Cells were processed as previously described in “Materials and Methods”.
Through the semi-quantitative data provided by the Wb, we saw that HLA-G was that which generated
the thickest and brightest band after P4 stimulation, hence indicating that HLA-G was that with the
highest amount of protein. However, this is not an absolute measure by which we can measure protein
quantity.
95
In addition, we also observed that all the JEG-3 cell samples stimulated with P4 resulted in a
thicker and brighter HLA bands compared with the unstimulated control JEG-3 cells (Figure 4.3).
Figure 4.3. Western blot analysis of P4 stimulated JEG-3 supernatants. Cells were incubated in serum free medium and stimulated with P4. Lane 1, 3, 5 and 7 represent HLA-G, HLA-E, HLA-C and HLA-F, respectively. Lanes 2, 4, 6 and 8 represent HLA-G, HLA-E, HLA-C, and HLA-F after P4 stimulation. -ve Ctrl is the control lane, and was loaded with water. The Ld Ctrl is tubulin (loading control), which is detected at a molecular weight of 42 kDa. HLA-G, HLA-E, HLA-F, and HLA-C were detected at different levels, in both unstimulated and P4 stimulated JEG-3 supernatants at 39 kDa, 42 kDa, 39 kDa and 42 kDa, respectively.
4.2.3 Effect of P4 over the phenotype of HLA-I in JEG-3
To support this data, a flow cytometry experiment using the same treatment conditions was then
carried out. Cells were cultured with or without P4, permeabilazed, stained with the appropriate mAb,
and results acquired through the use of a flow cytometer BD FACS Aria I. Results obtained reinforced
the semi-quantitative data obtained using the Wb technique. Intracellular flow cytometry results showed
that the HLA that experienced the highest increase in its expression, in comparison to the control, was
HLA-G and this increase was statistically highly significant, and the same happened to HLA-C and -F (P
≤ 0.01). We also observed that HLA-E also experienced an increased expression, as was previously seen
through the Wb data. The detected increase in this protein was statistically significant (P ≤ 0.05) (Figure
4.4).
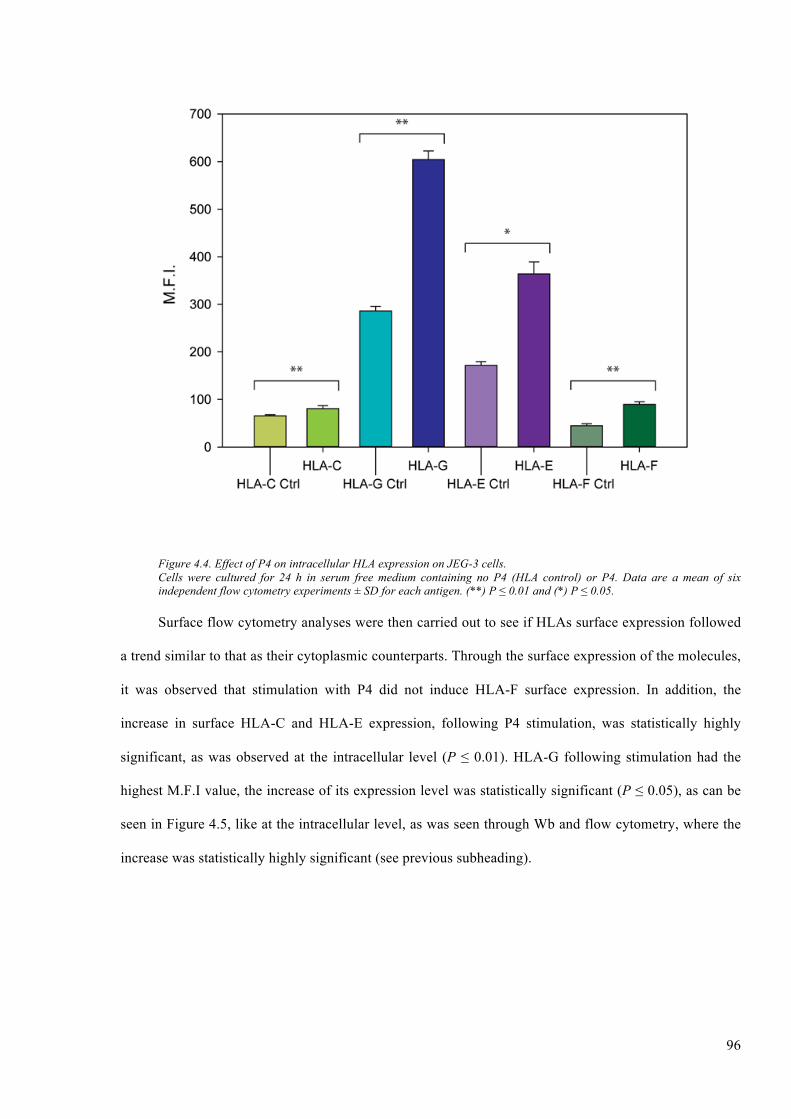
96
Figure 4.4. Effect of P4 on intracellular HLA expression on JEG-3 cells. Cells were cultured for 24 h in serum free medium containing no P4 (HLA control) or P4. Data are a mean of six independent flow cytometry experiments ± SD for each antigen. (**) P ≤ 0.01 and (*) P ≤ 0.05.
Surface flow cytometry analyses were then carried out to see if HLAs surface expression followed
a trend similar to that as their cytoplasmic counterparts. Through the surface expression of the molecules,
it was observed that stimulation with P4 did not induce HLA-F surface expression. In addition, the
increase in surface HLA-C and HLA-E expression, following P4 stimulation, was statistically highly
significant, as was observed at the intracellular level (P ≤ 0.01). HLA-G following stimulation had the
highest M.F.I value, the increase of its expression level was statistically significant (P ≤ 0.05), as can be
seen in Figure 4.5, like at the intracellular level, as was seen through Wb and flow cytometry, where the
increase was statistically highly significant (see previous subheading).
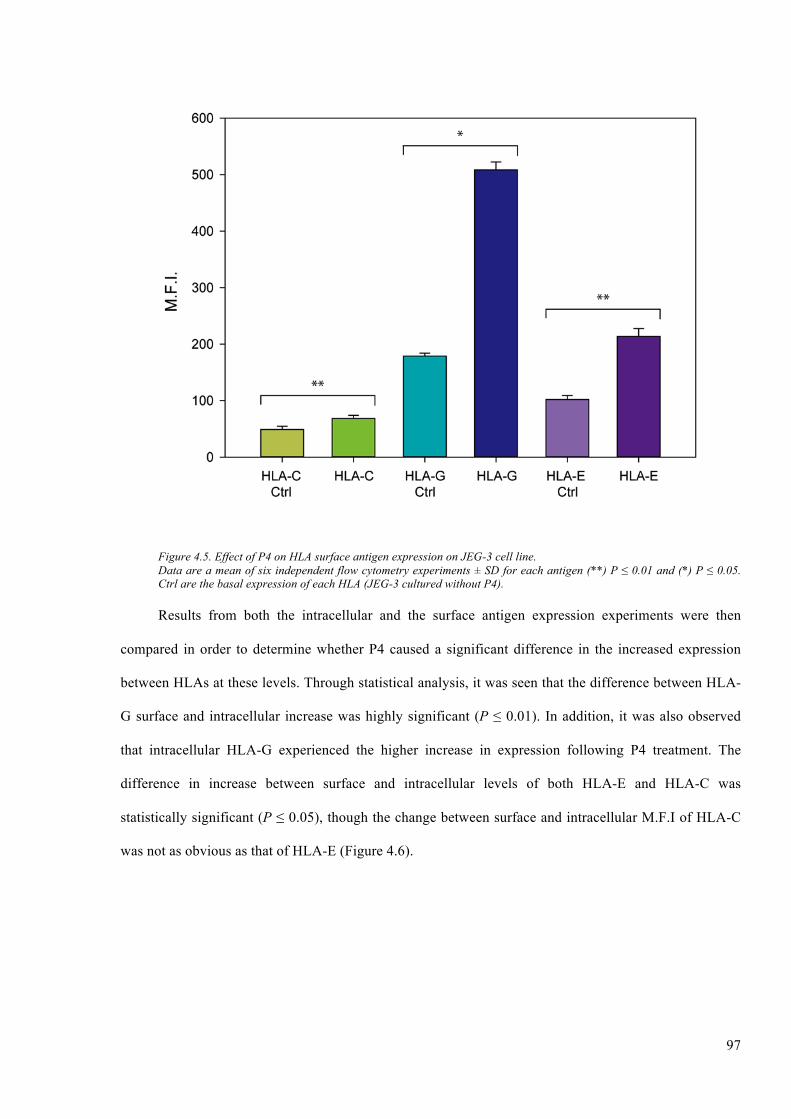
97
Figure 4.5. Effect of P4 on HLA surface antigen expression on JEG-3 cell line. Data are a mean of six independent flow cytometry experiments ± SD for each antigen (**) P ≤ 0.01 and (*) P ≤ 0.05. Ctrl are the basal expression of each HLA (JEG-3 cultured without P4).
Results from both the intracellular and the surface antigen expression experiments were then
compared in order to determine whether P4 caused a significant difference in the increased expression
between HLAs at these levels. Through statistical analysis, it was seen that the difference between HLA-
G surface and intracellular increase was highly significant (P ≤ 0.01). In addition, it was also observed
that intracellular HLA-G experienced the higher increase in expression following P4 treatment. The
difference in increase between surface and intracellular levels of both HLA-E and HLA-C was
statistically significant (P ≤ 0.05), though the change between surface and intracellular M.F.I of HLA-C
was not as obvious as that of HLA-E (Figure 4.6).
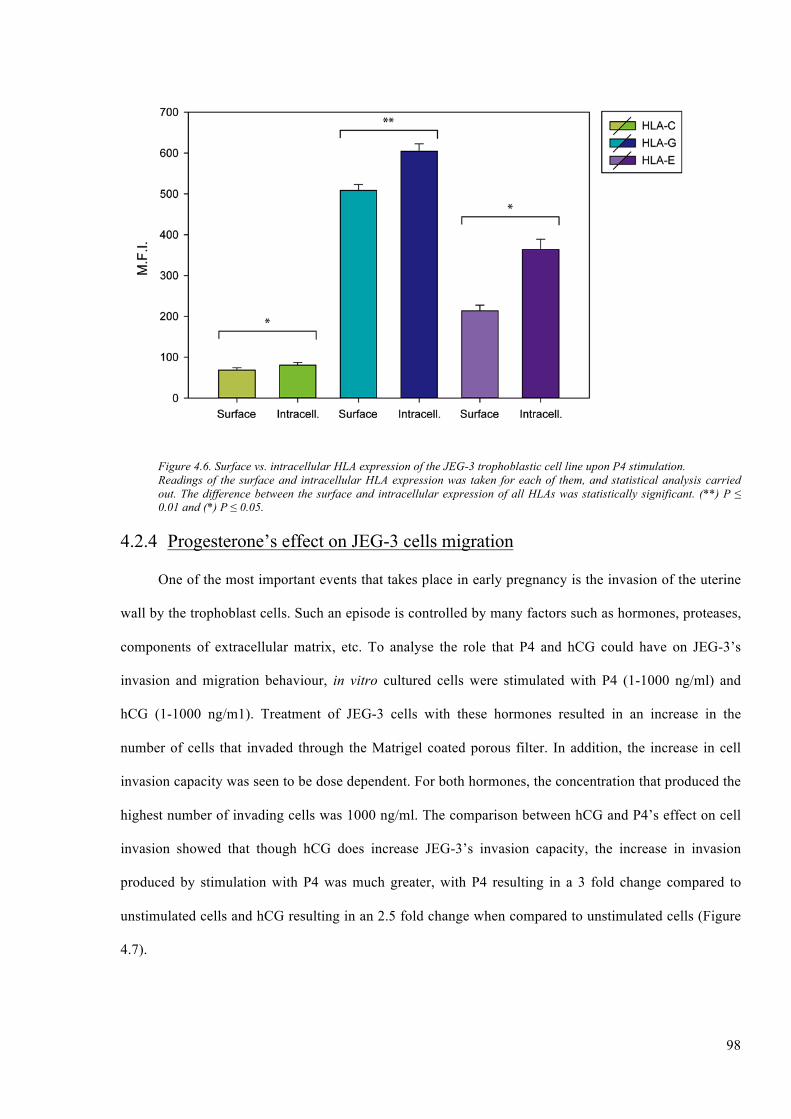
98
Figure 4.6. Surface vs. intracellular HLA expression of the JEG-3 trophoblastic cell line upon P4 stimulation. Readings of the surface and intracellular HLA expression was taken for each of them, and statistical analysis carried out. The difference between the surface and intracellular expression of all HLAs was statistically significant. (**) P ≤ 0.01 and (*) P ≤ 0.05.
4.2.4 Progesterone’s effect on JEG-3 cells migration
One of the most important events that takes place in early pregnancy is the invasion of the uterine
wall by the trophoblast cells. Such an episode is controlled by many factors such as hormones, proteases,
components of extracellular matrix, etc. To analyse the role that P4 and hCG could have on JEG-3’s
invasion and migration behaviour, in vitro cultured cells were stimulated with P4 (1-1000 ng/ml) and
hCG (1-1000 ng/m1). Treatment of JEG-3 cells with these hormones resulted in an increase in the
number of cells that invaded through the Matrigel coated porous filter. In addition, the increase in cell
invasion capacity was seen to be dose dependent. For both hormones, the concentration that produced the
highest number of invading cells was 1000 ng/ml. The comparison between hCG and P4’s effect on cell
invasion showed that though hCG does increase JEG-3’s invasion capacity, the increase in invasion
produced by stimulation with P4 was much greater, with P4 resulting in a 3 fold change compared to
unstimulated cells and hCG resulting in an 2.5 fold change when compared to unstimulated cells (Figure
4.7).
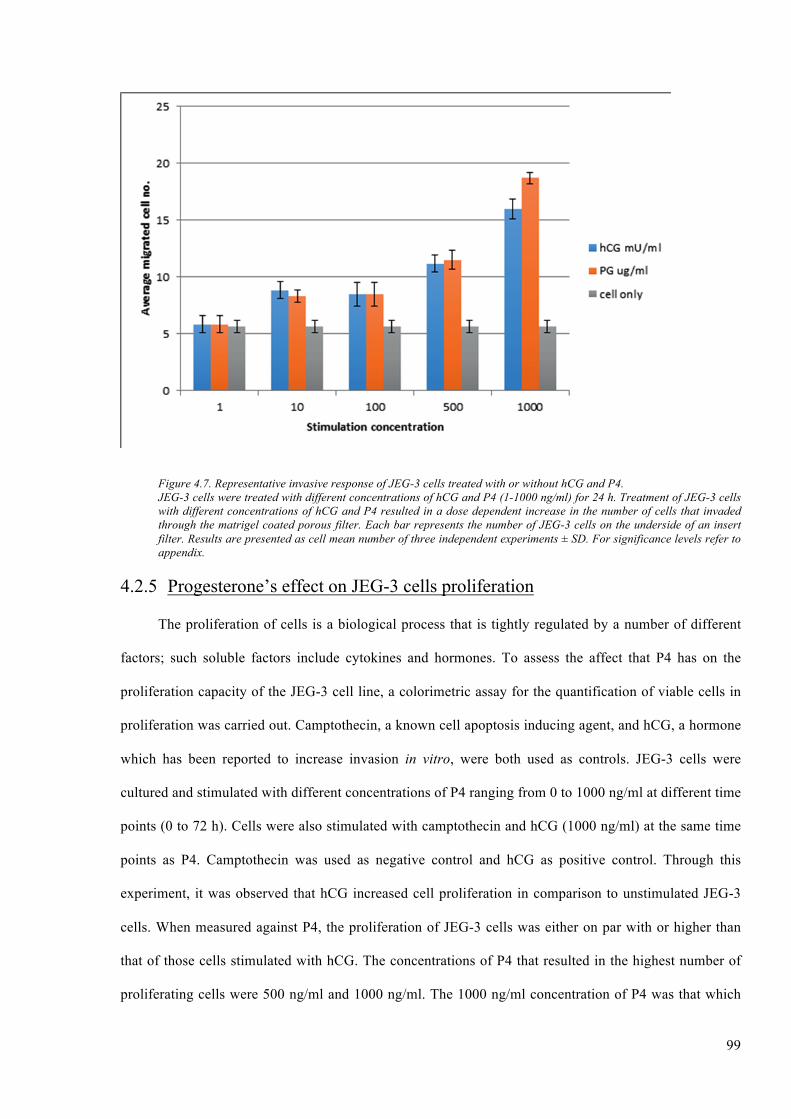
99
Figure 4.7. Representative invasive response of JEG-3 cells treated with or without hCG and P4. JEG-3 cells were treated with different concentrations of hCG and P4 (1-1000 ng/ml) for 24 h. Treatment of JEG-3 cells with different concentrations of hCG and P4 resulted in a dose dependent increase in the number of cells that invaded through the matrigel coated porous filter. Each bar represents the number of JEG-3 cells on the underside of an insert filter. Results are presented as cell mean number of three independent experiments ± SD. For significance levels refer to appendix.
4.2.5 Progesterone’s effect on JEG-3 cells proliferation
The proliferation of cells is a biological process that is tightly regulated by a number of different
factors; such soluble factors include cytokines and hormones. To assess the affect that P4 has on the
proliferation capacity of the JEG-3 cell line, a colorimetric assay for the quantification of viable cells in
proliferation was carried out. Camptothecin, a known cell apoptosis inducing agent, and hCG, a hormone
which has been reported to increase invasion in vitro, were both used as controls. JEG-3 cells were
cultured and stimulated with different concentrations of P4 ranging from 0 to 1000 ng/ml at different time
points (0 to 72 h). Cells were also stimulated with camptothecin and hCG (1000 ng/ml) at the same time
points as P4. Camptothecin was used as negative control and hCG as positive control. Through this
experiment, it was observed that hCG increased cell proliferation in comparison to unstimulated JEG-3
cells. When measured against P4, the proliferation of JEG-3 cells was either on par with or higher than
that of those cells stimulated with hCG. The concentrations of P4 that resulted in the highest number of
proliferating cells were 500 ng/ml and 1000 ng/ml. The 1000 ng/ml concentration of P4 was that which
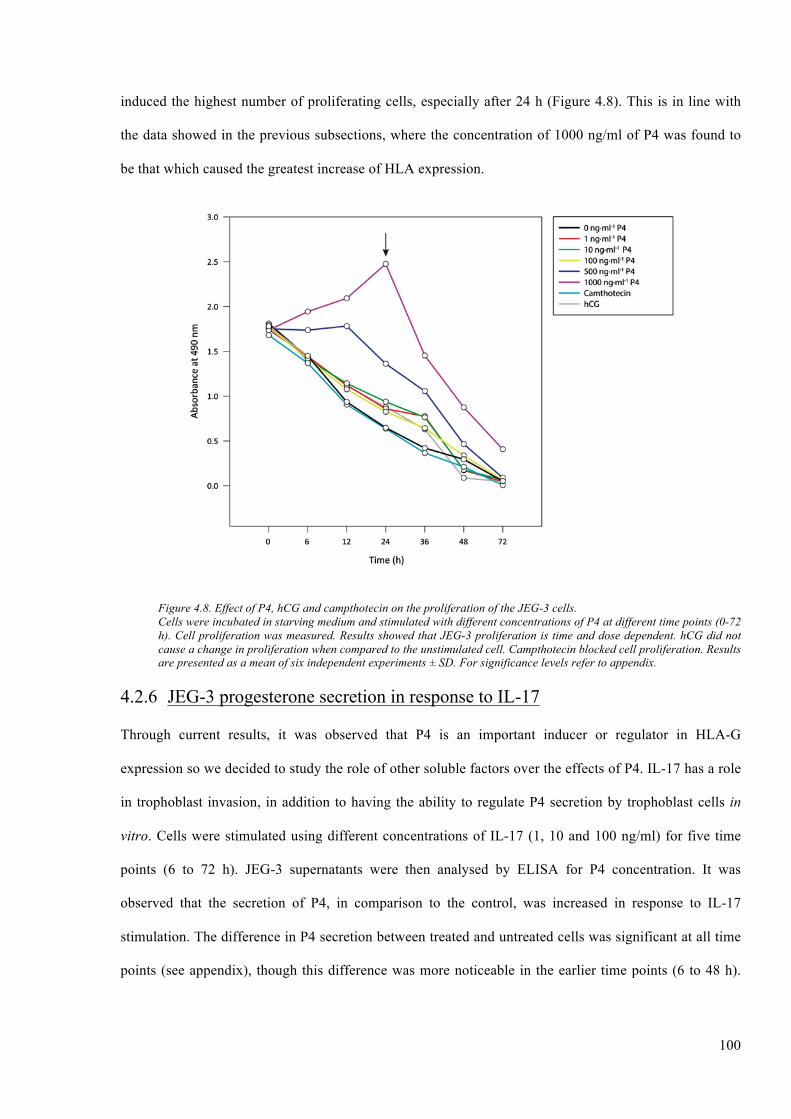
100
induced the highest number of proliferating cells, especially after 24 h (Figure 4.8). This is in line with
the data showed in the previous subsections, where the concentration of 1000 ng/ml of P4 was found to
be that which caused the greatest increase of HLA expression.
Figure 4.8. Effect of P4, hCG and campthotecin on the proliferation of the JEG-3 cells. Cells were incubated in starving medium and stimulated with different concentrations of P4 at different time points (0-72 h). Cell proliferation was measured. Results showed that JEG-3 proliferation is time and dose dependent. hCG did not cause a change in proliferation when compared to the unstimulated cell. Campthotecin blocked cell proliferation. Results are presented as a mean of six independent experiments ± SD. For significance levels refer to appendix.
4.2.6 JEG-3 progesterone secretion in response to IL-17
Through current results, it was observed that P4 is an important inducer or regulator in HLA-G
expression so we decided to study the role of other soluble factors over the effects of P4. IL-17 has a role
in trophoblast invasion, in addition to having the ability to regulate P4 secretion by trophoblast cells in
vitro. Cells were stimulated using different concentrations of IL-17 (1, 10 and 100 ng/ml) for five time
points (6 to 72 h). JEG-3 supernatants were then analysed by ELISA for P4 concentration. It was
observed that the secretion of P4, in comparison to the control, was increased in response to IL-17
stimulation. The difference in P4 secretion between treated and untreated cells was significant at all time
points (see appendix), though this difference was more noticeable in the earlier time points (6 to 48 h).
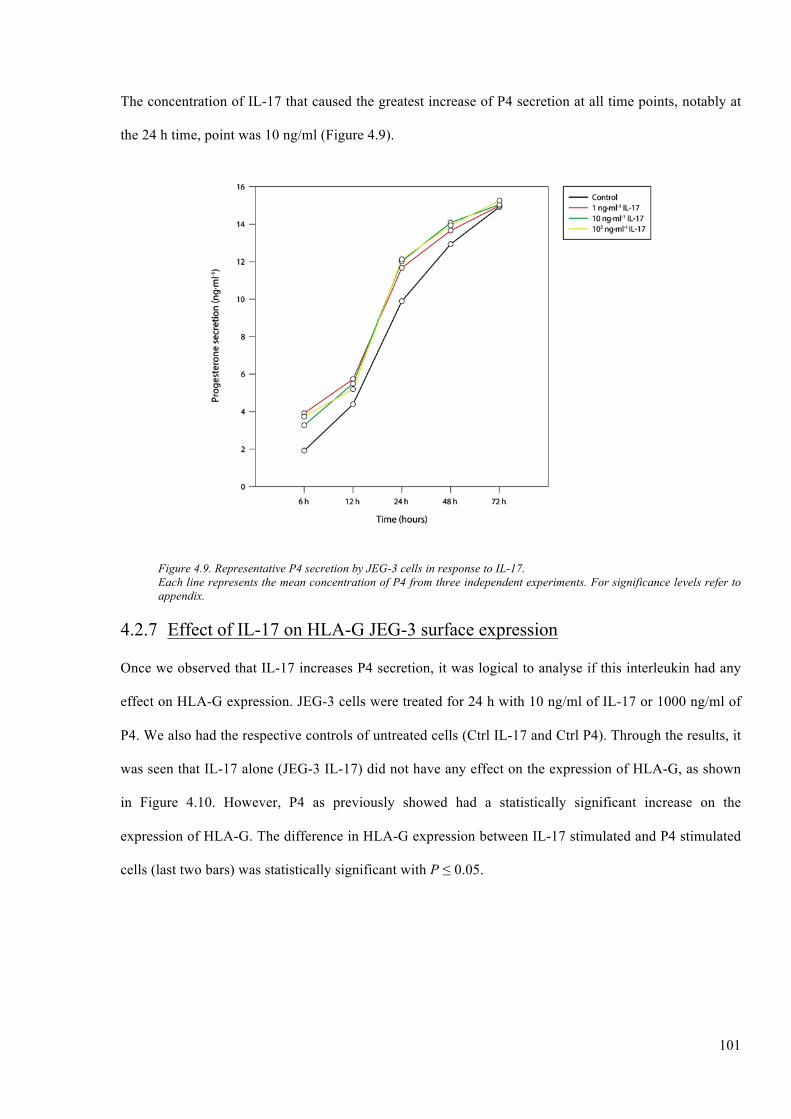
101
The concentration of IL-17 that caused the greatest increase of P4 secretion at all time points, notably at
the 24 h time, point was 10 ng/ml (Figure 4.9).
Figure 4.9. Representative P4 secretion by JEG-3 cells in response to IL-17. Each line represents the mean concentration of P4 from three independent experiments. For significance levels refer to appendix.
4.2.7 Effect of IL-17 on HLA-G JEG-3 surface expression
Once we observed that IL-17 increases P4 secretion, it was logical to analyse if this interleukin had any
effect on HLA-G expression. JEG-3 cells were treated for 24 h with 10 ng/ml of IL-17 or 1000 ng/ml of
P4. We also had the respective controls of untreated cells (Ctrl IL-17 and Ctrl P4). Through the results, it
was seen that IL-17 alone (JEG-3 IL-17) did not have any effect on the expression of HLA-G, as shown
in Figure 4.10. However, P4 as previously showed had a statistically significant increase on the
expression of HLA-G. The difference in HLA-G expression between IL-17 stimulated and P4 stimulated
cells (last two bars) was statistically significant with P ≤ 0.05.
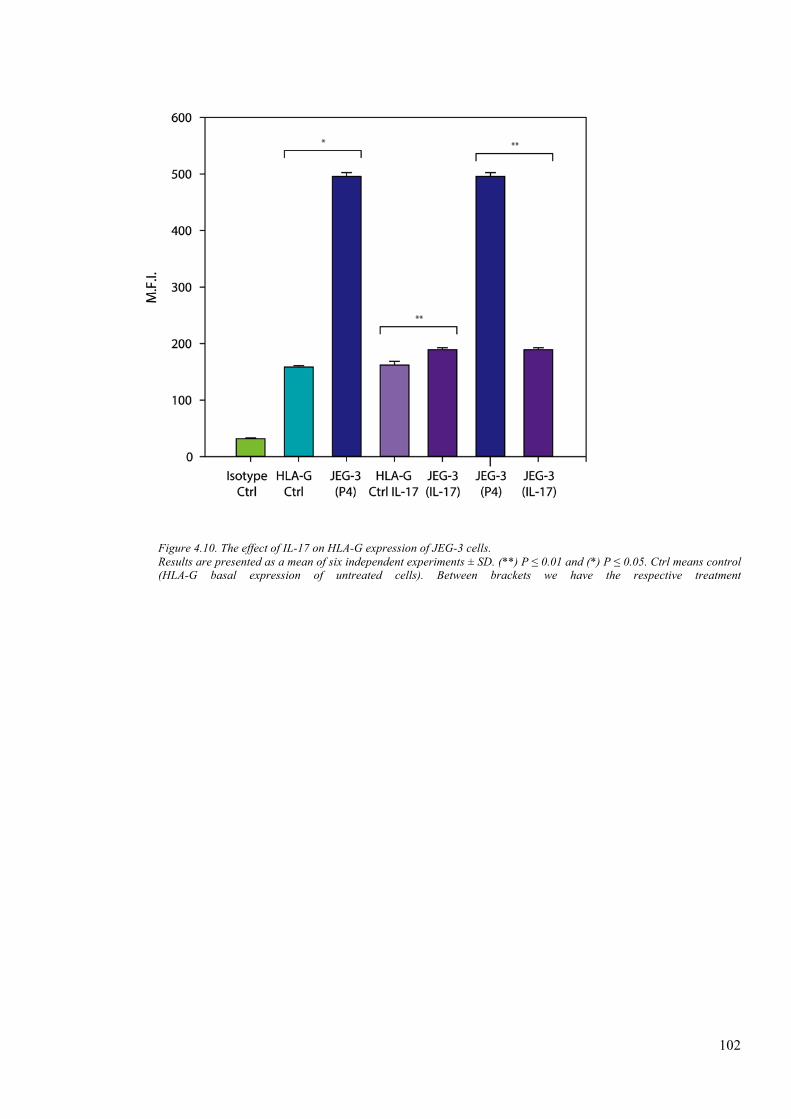
102
Figure 4.10. The effect of IL-17 on HLA-G expression of JEG-3 cells. Results are presented as a mean of six independent experiments ± SD. (**) P ≤ 0.01 and (*) P ≤ 0.05. Ctrl means control (HLA-G basal expression of untreated cells). Between brackets we have the respective treatment
4.3 Discussion
Progesterone is present even before pregnancy, being secreted by the corpus luteum during the
luteal phase of the menstrual cycle. Upon signals of pregnancy, the main source of P4 becomes the
trophoblast cells (Norwitz et al., 2001). The roles attributed to P4 in pregnancy are extensive, ranging
from preparing the endometrium for embryo invasion, to inducing stromal cells to proliferate and
differentiate, etc. (Halasz and Szekeres-Bartho, 2013). It is secreted in large amounts at the fetomaternal
interface and is believed to play an important role in trophoblast invasion (Bischof et al., 2000a). In
addition, it has been reported that the P4, that is produced either by the placenta and/or ovaries, is
essential in maintaining mammalian pregnancy due to its ability to inhibit the T lymphocyte cell mediated
responses that are involved in tissue rejection (Szekeres-Bartho, 2009). Moreover, in 1977 the Siitteri
group also reported that the local suppression of the maternal cellular immune response by P4 may be one
of the ways that the foetus avoids rejection (Siiteri et al., 1977). Due to its dominant presence in
pregnancy, for many years this has been used in the field of in vitro fertilisation (IVF) and reproductive
immunology, in an effort to avoid adverse outcomes in pregnancy such as preterm labour or miscarriages
(Szekeres-Bartho and Balasch, 2008; Szekeres-Bartho et al., 2008).
As we have reported in the previous chapter, HLA-G is an important molecule in pregnancy and its
immunomodulatory properties are believed to be crucial for a successful pregnancy. Like HLA-G, P4 is
also reported to induce tolerance, though the exact mechanisms by which this is achieved are still not
fully understood (Yie et al., 2006b). As these mechanisms to date remain undefined, the Yie group
hypothesized that one possible pathway may be through the modulation of the MHC-G gene expression
in the placenta (Yie et al., 2006a). Through their study, this group reported that P4 had an up-regulatory
effect on the expression of MHC-G gene in the cytotrophoblast and in the JEG-3 trophoblastic cell line.
The Yie group also reported that after 4 h of incubation, HLA-G transcription reached its maximum,
insinuating that, at least, part of progesterone’s actions are mediated through the regulation of
transcription (Yie et al., 2006a). The increase witnessed by the Yie group was investigated to see if it
would translate into one at the protein level, as an increase at the gene levels is not always related to one
104
at the protein level. Through our study, it was seen that P4 increased HLA-G expression, in addition to
the other studied HLAs expressed by the EVCT cells, a finding that to date has still not be reported.
Through P4 induction experiments, it was established that the time point at which this hormone caused
the greatest increase in HLA-G and the other HLAs expression was 24 h. The difference in time points
between our research and the Yie group’s report is in large due to the fact that while they measured the
regulation of HLA-G by P4 at the mRNA level, our study addressed the effect that P4 had on the
expression of HLA-G at the protein level, at the surface and intracellularly. It is quicker to detect mRNA
than a protein expression, because to have the protein first we need to process the mRNA (post-
transcriptional modifications), translate it, and process once again the protein (post-translational
modifications), and finally express it on the cell surface or intracellularly, this accounting for the time
difference observed between our results and Yie’s.
We found that the P4 concentration that was found to cause the greatest increase in HLA-G surface
expression was at 1000 ng/ml. Such a finding is in agreement with the Yie group, who reported that
maximal enhancement of steady state mRNA was seen at a P4 concentration of 100 ng/ml or higher (Yie
et al., 2006b). In addition, these findings (our and Yie’s), are further supported by the Szerkeres-Bartho
group. This group have reported that during pregnancy, while circulating P4 concentrations are found to
be at 200 ng/ml, the concentration of P4 in the placenta, at the fetomaternal interface, can reach
concentrations of up to 1720-1243 ng/g of tissue (Feinshtein et al., 2010). Some of the
immunomodulatory effects that are displayed by P4 during pregnancy may be mediated indirectly
through modulation of MHC-G gene transcription. Our induction experiments revealed that P4 increased
the expression of HLA-G in both a time and dose dependent manner, which is in agreement with the
results observed by the Yie group for regulation of the MHC-G gene (Yie et al., 2006a). Our time and
dose dependent induction experiments of HLA-E, and -C also identified the 24 h time point and the 1000
ng/ml concentration, to be those which caused P4 to have a maximal effect on the expression of both
HLAs. As HLA-F is a molecule that is not expressed on the surface of the JEG-3 cell line, the induction
experiments for this HLA were focused in the intracellular expression. The optimal dose and time was
identical to that identified for the other expressed HLAs.

105
Upon successful identification of an appropriate time and dose, the surface and intracellular
expression of HLA molecules in response to P4 stimulation, and how these differed from one another was
analysed. Through our investigation, it was observed that of all HLAs, HLA-G was the one on which P4
had the maximum effect, in addition to it undergoing the most important difference in expression
between the surface and intracellular level. Such findings in vitro are important and relevant as they
suggest that P4 may play a crucial role in the regulation of HLAs in vivo.
It has been well established that for a successful pregnancy, a number of immune modulatory
factors from both the mother and the foetus are required. The effects of P4 on the immune system during
pregnancy are well reported, ranging from its ability to induce lymphocyte-blocking proteins to triggering
suppressor cell generation (Brierley and Clark, 1987; Mannel et al., 1990). Previous studies from other
groups have attributed to HLA-G functions similar to those of P4, as both are reported to reduce NK cell
cytotoxicity and block cytotoxic T cell activity, among other things (Kapasi et al., 2000; Chumbley et al.,
1994). In our study we have showed that HLA-G was that on which P4 had a maximal effect, though the
other HLAs also experienced an increase in their expression. Such is important granting they are not
identified as the leading HLA in parturition their presence is, nevertheless, still crucial if a favourable
outcome is to be met.
HLA-C, though a class Ia protein was still observed to undergo an increase both at the surface and
intracellular level when stimulated with P4. This increase is equally as important as that experienced by
HLA-G, as HLA-C is also able to present antigenic peptides and can be recognized by T cells (Hutter et
al., 1996). Additionally, HLA-C is also important in pregnancy as it is believed to have the ability to
regulate placentation through its interaction with KIRs. It can thus be proposed that HLA-C has a role in
the invasion of the trophoblast, as the expression of KIR that binds HLA-C on uNK cells is higher in the
decidua, in comparison to those found in the blood (Trowsdale and Moffett, 2008).
HLA-E is also reported as being essential in pregnancy as through CD94/NKG2A, a receptor
expressed by CD56bright uNK cells, it is able to inhibit cytolysis carried out by NK cells (Dahl and Hviid,
2012). Following P4 stimulation, HLA-E also experienced a significant increase in both its surface and
intracellular expression. This increase on the part of HLA-E upon P4 stimulation was expected because
106
surface expression of this protein is dependent on a nonamer sequence that is generally provided by the
other HLAs. Hence, it was hypothesized that because the other HLAs experienced an increase, a greater
number of molecules would thus be available to provide a nonamer signalling sequence, which would
translate into a higher number of HLA-E molecules (Dahl and Hviid, 2012; Lee et al., 1998).
An increase in HLA-F molecule was also observed at the intracellular level. Though expression is
low in the trophoblast cells to begin with, a significant increase of HLA-F in response to P4 was
witnessed. In 2010 the Lee group hypothesized that, in pregnancy, HLA-F may have a role in regulating
the immune response by interacting with Treg cells to induce a suppressive signalling (Lee et al., 2010).
However, as data on HLA-F still remains contradictory, whether or not HLA-F holds a central role in
developing tolerance during pregnancy can still not be established.
As the hormone of pregnancy, P4 is critical if a pregnancy is to be established and maintained.
Invasion and proliferation are one of the earliest crucial events that take place during pregnancy, without
a successful invasion pregnancy would not ensue. The process of invasion is an active biochemical
process and not just a process that occurs due to passive growth pressure (Bischof et al., 2000a). In vivo,
trophoblast cells are only invasive during the first trimester and, even then, their invasion capacity is
limited to the endometrium and to the promixal myometrium hence, they are only transiently invasive
(Bischof et al., 2000a; Pijnenborg et al., 1980). Two the most important regulators of trophoblast
invasion are the hCG and the P4 hormones. Through our study, we have showed that both hormones
increase trophoblast invasion in a dose dependent manner: maximum invasion, was witnessed at a
concentration of 1000 ng/ml for both the hormones, though P4 caused a higher number of cells to invade
at this concentration. In 1998 the Shimonovitz group reported that P4 down-regulates the production of
MMP-9, a matrix metaloproteinase, which is believed to mediate invasion of cells in vitro (Shimonovitz
et al., 1998). Where the hCG hormone is concerned, previous studies have reported that it could play an
autocrine role in its control of trophoblast growth and invasion, inhibits trophoblast invasion in a dose-
dependent manner, and increases trophoblast invasion (Shimonovitz et al., 1998; Zygmunt et al., 1998;
Yagel et al., 1993). Our results are in agreement with these previously published data, in that we also saw
an increase in trophoblast invasion. However, to date the effect of hCG on trophoblast invasion is still not

107
clear and further studies are required. Proliferation is another important aspect in early pregnancy. Our
investigation has found that while hCG increases trophoblast invasion, it has no effect on the proliferation
of JEG-3 cells. However, P4 has an important effect on the JEG-3 cell proliferation, not only did it
increase cell number, but it seems to do so in a dose-dependent manner, as the higher doses of P4 caused
a greater increase in the cell number.
In pregnancy, P4 not only effects the uterus by regulating tissue repair and regeneration among
other things, but it also creates a favourable immunological environment for the foetus by mediating
interactions between the immune and endocrine systems (Szekeres-Bartho, 2009). Previously, cytokines
have been reported to play an important role in the production of hormones by the trophoblast, one of
these cytokines is IL-17 which was previously described to be expressed by the human placenta (Wu et
al., 2014). In our study we have observed that IL-17 significantly increases the secretion of the P4. The
increase in P4 secretion upon IL-17 stimulation was seen during the earlier time points (6-48 h), and at all
studied concentrations, though the concentration of IL-17 that had the highest stimulatory effect was 100
ng/ml. As of the 72 h time point, P4 secretion of IL-17 stimulated cells was similar to that of the
unstimulated cells. Such an observation is in agreement with that of Pongcharoen and Supalap
(Pongcharoen and Supalap, 2009). These researches reported that IL-17, has a stimulatory effect on P4
secretion during the earlier time points (6-24 h). This could be explained because IL-17 may only have a
stimulatory effect on the secretion of P4 during the earlier time points, as after a certain time, there may
not be any more IL-17 (no longer sufficient receptor occupancy). Another reason why an increase in P4
secretion was only seen at the earlier time points may be because, after 48 h, our cells have almost
reached 100% confluency hence, their response to IL-17 may decrease (this may be due to a chance in
their response to a higher concentration of P4). Nevertheless, the fact that IL-17 increases P4 secretion in
vitro is important as it may allow an alternative way in which to control HLA-G expression.
Increase of P4 secretion by IL-17, prompted the question of whether this interleukin would be able
to directly affect the expression of HLA-G, as it was previously reported that P4 has an up-regulatory
effect on HLA-G, thereby IL-17 should have some effect on the expression of this protein. However, we
observed that IL-17 has no direct effect on the expression of HLA-G while, P4 stimulation increased
108
HLA-G expression. The stimulation of JEG-3 cells with IL-17 had no observable effect on HLA-G
expression. It was therefore hypothesized that the effect of P4 on the expression of HLAs is mediated
through PR activation, which binds to a unique progesterone response element (PRE) sequence, which is
located in the promoter region (Yie et al., 2006a).
P4 is an important regulator in the establishment, and throughout the course of pregnancy. P4 is
able to effect the regulation of the cell cycle, the differentiation, proliferation, and invasion of the
trophoblast cells, all of which are important if the endometrium is to be ready to host the embryo.
Progesterone’s regulatory effects on HLA-G, were first reported by the Yie group and our study, further
supported this in addition, to also showing that P4 also exerts its regulatory effects on the other HLAs
expressed at the fetomaternal interface. Such findings are important as P4 is a well-established modulator
of the immune system and it can be hypothesized that one of the ways in which this hormone carries out
its functions, may be through the regulation of HLA-G expression.

CHAPTER V. RESULTS: EFFECT OF PREIMPLANTATIONAL FACTOR
ON JEG-3 CELLS
CHAPTER V
RESULTS
EFFECTS OF PREIMPLANTATION FACTOR ON JEG-3
CELLS
110
5.1 Introduction
In the previous chapter, we have characterised and established our model of study. After that, we
have studied how some soluble factors affect the biology of JEG-3 cells. We have analysed the role of P4
and IL-17 over the expression of HLA-C, -E, -F, and -G. However, to date, the specific endogenous
factors involved in regulating HLA expression in pregnancy are not fully characterized. PIF, which is
reported to regulate global systemic immunity and trophoblast invasion was used in conjunction with the
JEG-3 trophoblastic cell line to analyse the effect of PIF on HLA-I expression (-C, -E, -F, and -G) in a
controlled environment, in comparison to other soluble factors, mainly P4.
5.2 Results
5.2.1 Effect of PIF on HLA expression
To observe the possible effects of PIF on HLA expression patterns in vitro, JEG-3 cells were
incubated without PIF (control) or with a range of different concentrations of PIF (50-1000 nM). HLA-G
expression was measured, by flow cytometry, before and after treatment. Results showed that the
exogenous PIF increases HLA-G levels in JEG-3 cells in a dose dependent manner in comparison to the
untreated samples (Figure 5.1).
The detected increase was statistically significant (P ≤ 0.01) when the cells were treated with a
dose of 1 nM of PIF or higher. The concentration of PIF that resulted in the greatest increase of HLA-G
was 200 nM. However, with concentrations of PIF higher than 200 nM we observed a decrease in HLA-
G expression levels. This can be related to the saturation of the mechanism or receptor involved in
regulating HLA-G expression. The mechanism that is involved in the regulation of HLA-G expression by
PIF is still not well understood. One of our hypotheses is that PIF acts as a “protection system” that the
foetus has before P4 reaches optimal concentrations. PIF is not going to regulate just HLA-G expression
other mechanisms will also be invariably regulated by PIF. For this reason, we decided to also analyse the
proteasome by 2-DE (Chapter VI. Results 6.2), to detect possible proteins which expression could be
significantly increased or decreased after PIF stimulation.
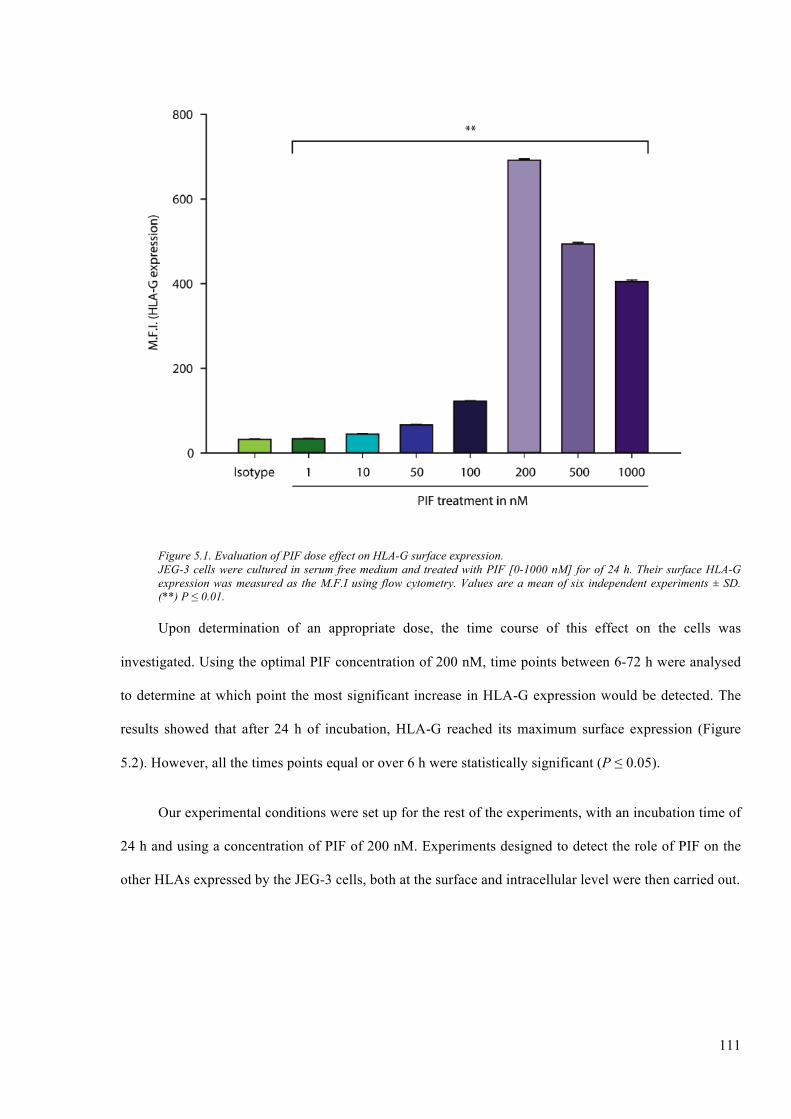
111
Figure 5.1. Evaluation of PIF dose effect on HLA-G surface expression. JEG-3 cells were cultured in serum free medium and treated with PIF [0-1000 nM] for of 24 h. Their surface HLA-G expression was measured as the M.F.I using flow cytometry. Values are a mean of six independent experiments ± SD. (**) P ≤ 0.01.
Upon determination of an appropriate dose, the time course of this effect on the cells was
investigated. Using the optimal PIF concentration of 200 nM, time points between 6-72 h were analysed
to determine at which point the most significant increase in HLA-G expression would be detected. The
results showed that after 24 h of incubation, HLA-G reached its maximum surface expression (Figure
5.2). However, all the times points equal or over 6 h were statistically significant (P ≤ 0.05).
Our experimental conditions were set up for the rest of the experiments, with an incubation time of
24 h and using a concentration of PIF of 200 nM. Experiments designed to detect the role of PIF on the
other HLAs expressed by the JEG-3 cells, both at the surface and intracellular level were then carried out.
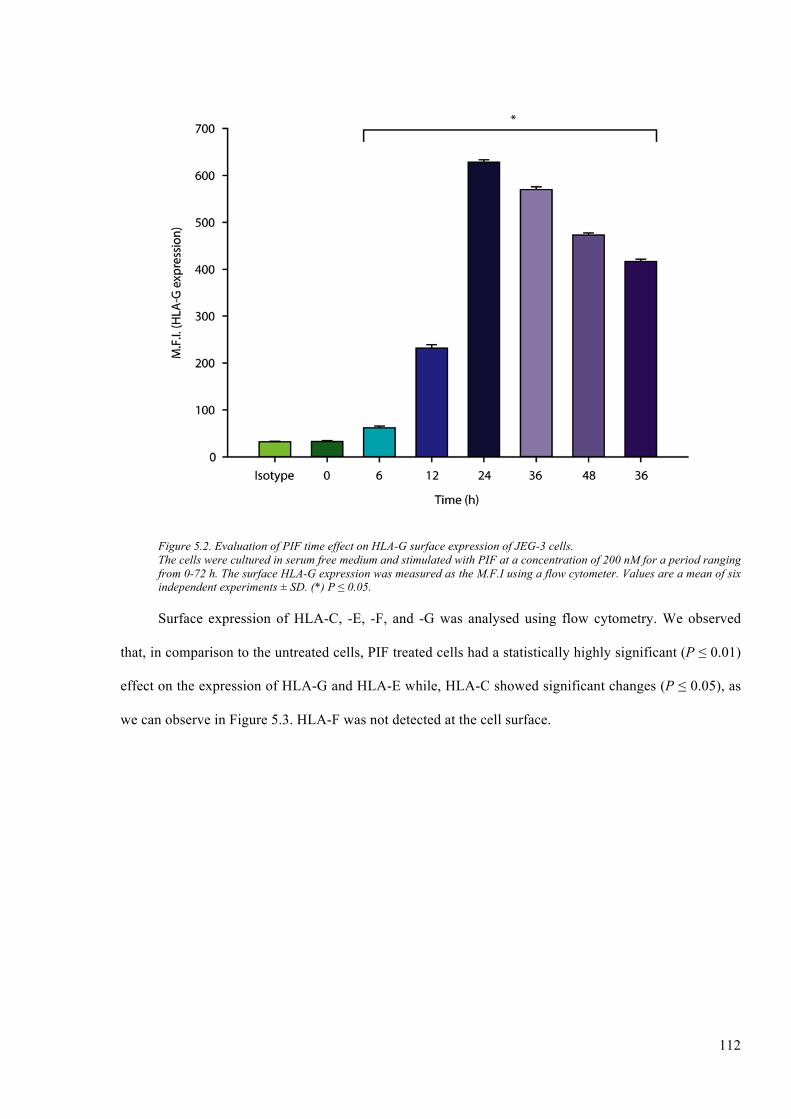
112
Figure 5.2. Evaluation of PIF time effect on HLA-G surface expression of JEG-3 cells. The cells were cultured in serum free medium and stimulated with PIF at a concentration of 200 nM for a period ranging from 0-72 h. The surface HLA-G expression was measured as the M.F.I using a flow cytometer. Values are a mean of six independent experiments ± SD. (*) P ≤ 0.05.
Surface expression of HLA-C, -E, -F, and -G was analysed using flow cytometry. We observed
that, in comparison to the untreated cells, PIF treated cells had a statistically highly significant (P ≤ 0.01)
effect on the expression of HLA-G and HLA-E while, HLA-C showed significant changes (P ≤ 0.05), as
we can observe in Figure 5.3. HLA-F was not detected at the cell surface.
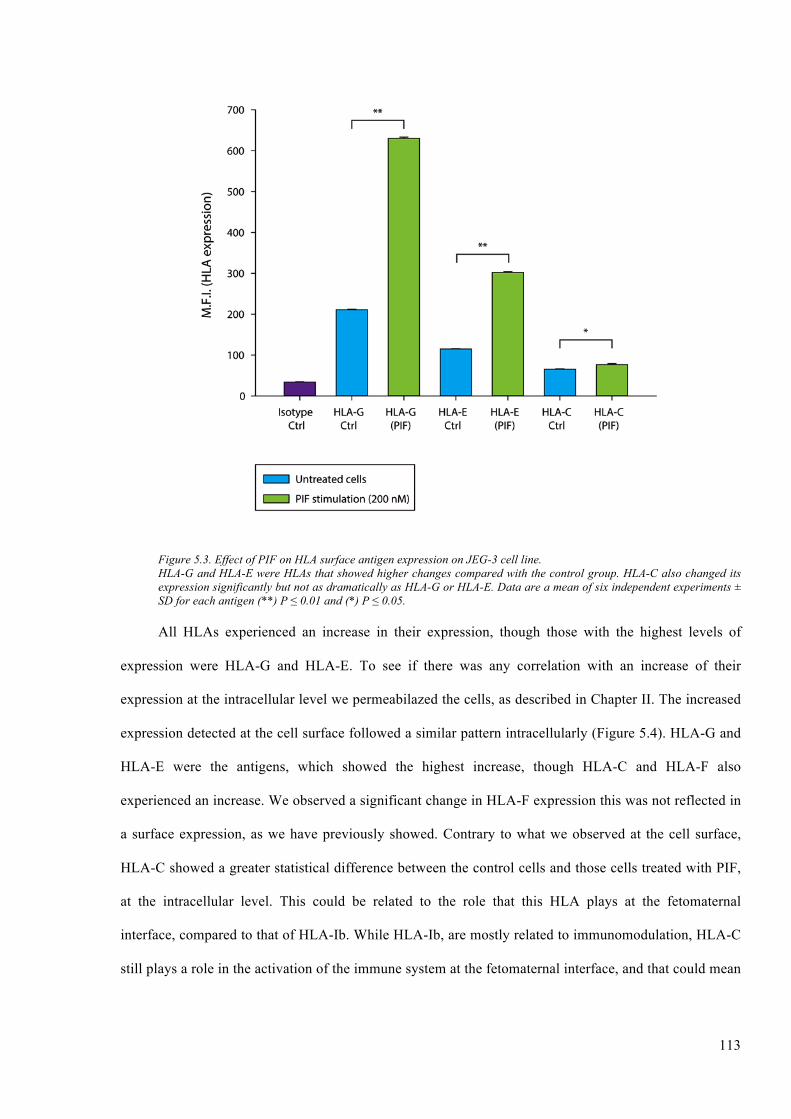
113
Figure 5.3. Effect of PIF on HLA surface antigen expression on JEG-3 cell line. HLA-G and HLA-E were HLAs that showed higher changes compared with the control group. HLA-C also changed its expression significantly but not as dramatically as HLA-G or HLA-E. Data are a mean of six independent experiments ± SD for each antigen (**) P ≤ 0.01 and (*) P ≤ 0.05.
All HLAs experienced an increase in their expression, though those with the highest levels of
expression were HLA-G and HLA-E. To see if there was any correlation with an increase of their
expression at the intracellular level we permeabilazed the cells, as described in Chapter II. The increased
expression detected at the cell surface followed a similar pattern intracellularly (Figure 5.4). HLA-G and
HLA-E were the antigens, which showed the highest increase, though HLA-C and HLA-F also
experienced an increase. We observed a significant change in HLA-F expression this was not reflected in
a surface expression, as we have previously showed. Contrary to what we observed at the cell surface,
HLA-C showed a greater statistical difference between the control cells and those cells treated with PIF,
at the intracellular level. This could be related to the role that this HLA plays at the fetomaternal
interface, compared to that of HLA-Ib. While HLA-Ib, are mostly related to immunomodulation, HLA-C
still plays a role in the activation of the immune system at the fetomaternal interface, and that could mean
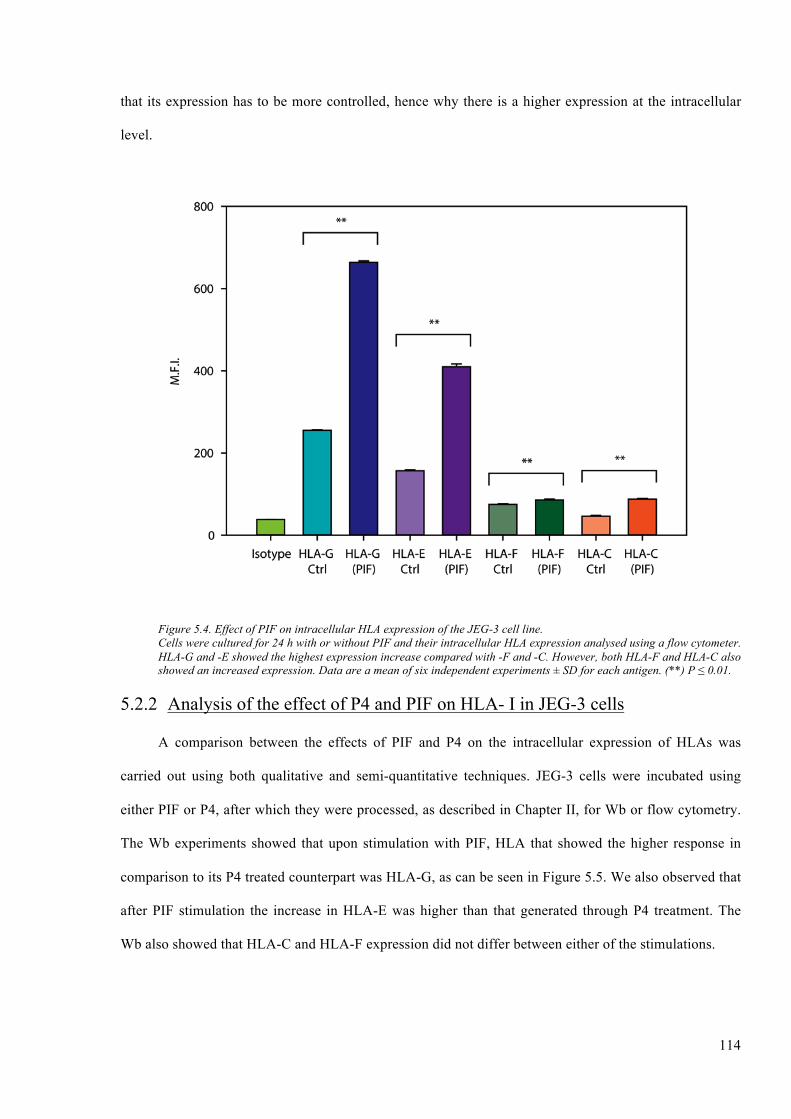
114
that its expression has to be more controlled, hence why there is a higher expression at the intracellular
level.
Figure 5.4. Effect of PIF on intracellular HLA expression of the JEG-3 cell line. Cells were cultured for 24 h with or without PIF and their intracellular HLA expression analysed using a flow cytometer. HLA-G and -E showed the highest expression increase compared with -F and -C. However, both HLA-F and HLA-C also showed an increased expression. Data are a mean of six independent experiments ± SD for each antigen. (**) P ≤ 0.01.
5.2.2 Analysis of the effect of P4 and PIF on HLA- I in JEG-3 cells
A comparison between the effects of PIF and P4 on the intracellular expression of HLAs was
carried out using both qualitative and semi-quantitative techniques. JEG-3 cells were incubated using
either PIF or P4, after which they were processed, as described in Chapter II, for Wb or flow cytometry.
The Wb experiments showed that upon stimulation with PIF, HLA that showed the higher response in
comparison to its P4 treated counterpart was HLA-G, as can be seen in Figure 5.5. We also observed that
after PIF stimulation the increase in HLA-E was higher than that generated through P4 treatment. The
Wb also showed that HLA-C and HLA-F expression did not differ between either of the stimulations.
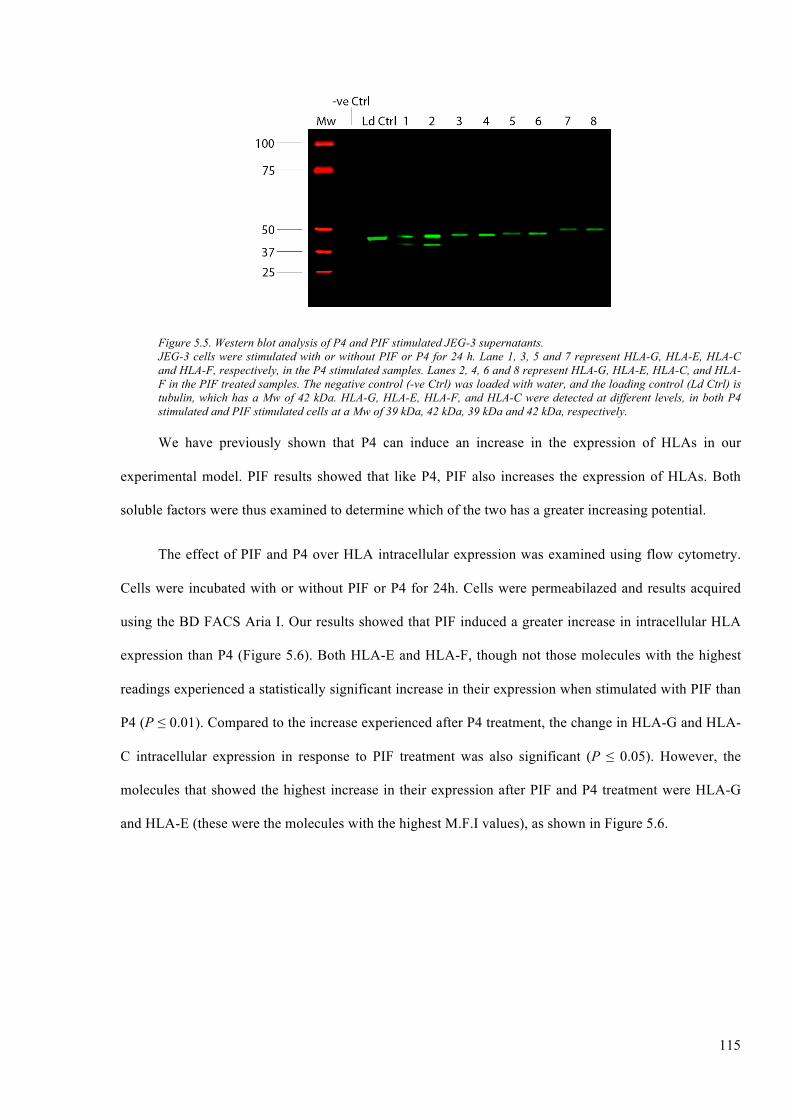
115
Figure 5.5. Western blot analysis of P4 and PIF stimulated JEG-3 supernatants. JEG-3 cells were stimulated with or without PIF or P4 for 24 h. Lane 1, 3, 5 and 7 represent HLA-G, HLA-E, HLA-C and HLA-F, respectively, in the P4 stimulated samples. Lanes 2, 4, 6 and 8 represent HLA-G, HLA-E, HLA-C, and HLA-F in the PIF treated samples. The negative control (-ve Ctrl) was loaded with water, and the loading control (Ld Ctrl) is tubulin, which has a Mw of 42 kDa. HLA-G, HLA-E, HLA-F, and HLA-C were detected at different levels, in both P4 stimulated and PIF stimulated cells at a Mw of 39 kDa, 42 kDa, 39 kDa and 42 kDa, respectively.
We have previously shown that P4 can induce an increase in the expression of HLAs in our
experimental model. PIF results showed that like P4, PIF also increases the expression of HLAs. Both
soluble factors were thus examined to determine which of the two has a greater increasing potential.
The effect of PIF and P4 over HLA intracellular expression was examined using flow cytometry.
Cells were incubated with or without PIF or P4 for 24h. Cells were permeabilazed and results acquired
using the BD FACS Aria I. Our results showed that PIF induced a greater increase in intracellular HLA
expression than P4 (Figure 5.6). Both HLA-E and HLA-F, though not those molecules with the highest
readings experienced a statistically significant increase in their expression when stimulated with PIF than
P4 (P ≤ 0.01). Compared to the increase experienced after P4 treatment, the change in HLA-G and HLA-
C intracellular expression in response to PIF treatment was also significant (P ≤ 0.05). However, the
molecules that showed the highest increase in their expression after PIF and P4 treatment were HLA-G
and HLA-E (these were the molecules with the highest M.F.I values), as shown in Figure 5.6.
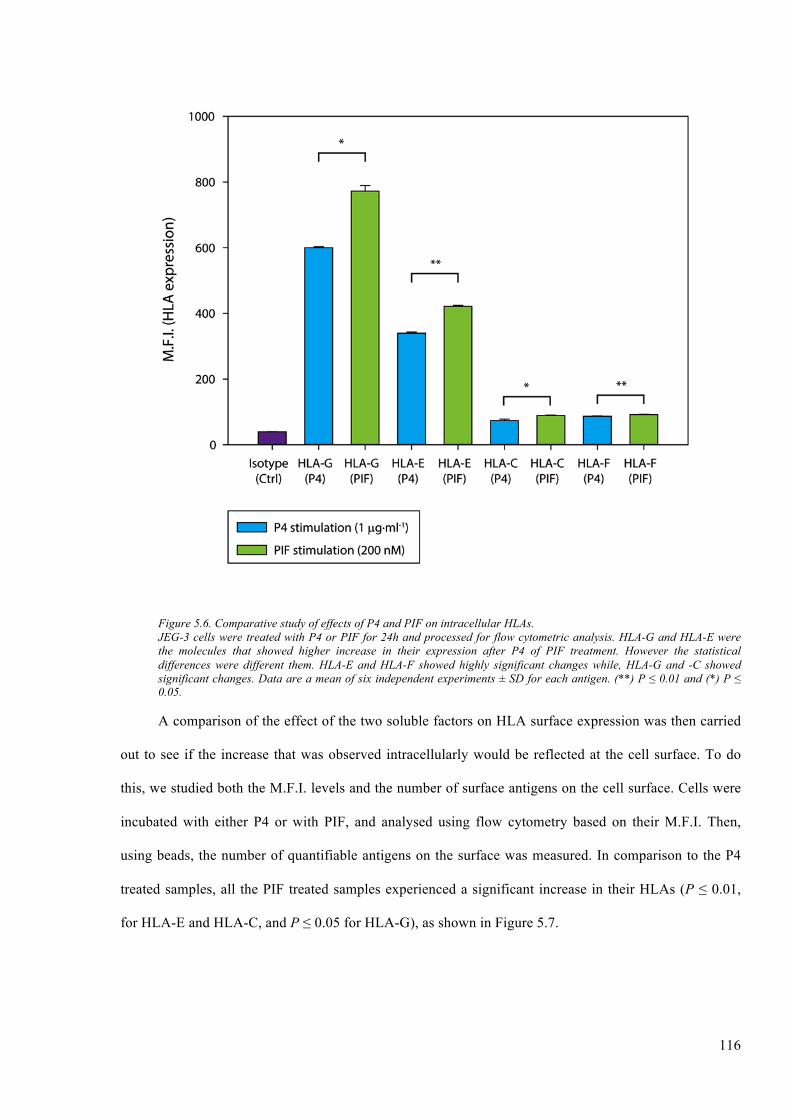
116
Figure 5.6. Comparative study of effects of P4 and PIF on intracellular HLAs. JEG-3 cells were treated with P4 or PIF for 24h and processed for flow cytometric analysis. HLA-G and HLA-E were the molecules that showed higher increase in their expression after P4 of PIF treatment. However the statistical differences were different them. HLA-E and HLA-F showed highly significant changes while, HLA-G and -C showed significant changes. Data are a mean of six independent experiments ± SD for each antigen. (**) P ≤ 0.01 and (*) P ≤ 0.05.
A comparison of the effect of the two soluble factors on HLA surface expression was then carried
out to see if the increase that was observed intracellularly would be reflected at the cell surface. To do
this, we studied both the M.F.I. levels and the number of surface antigens on the cell surface. Cells were
incubated with either P4 or with PIF, and analysed using flow cytometry based on their M.F.I. Then,
using beads, the number of quantifiable antigens on the surface was measured. In comparison to the P4
treated samples, all the PIF treated samples experienced a significant increase in their HLAs (P ≤ 0.01,
for HLA-E and HLA-C, and P ≤ 0.05 for HLA-G), as shown in Figure 5.7.
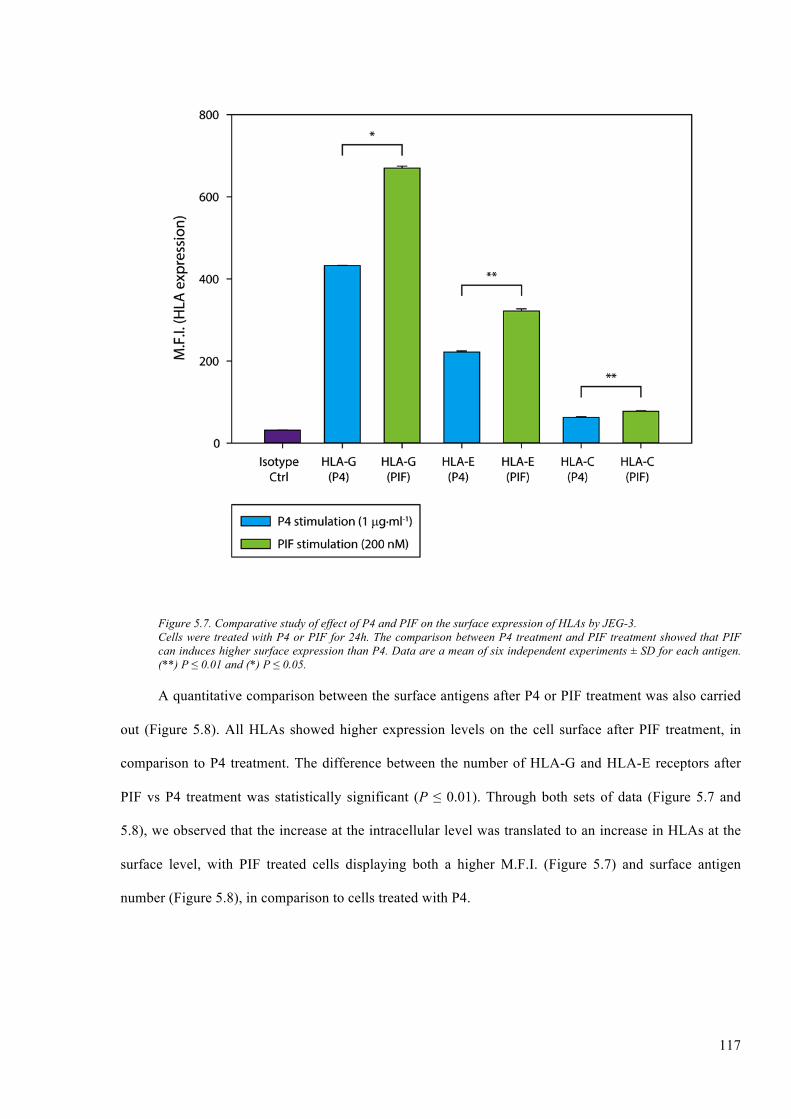
117
Figure 5.7. Comparative study of effect of P4 and PIF on the surface expression of HLAs by JEG-3. Cells were treated with P4 or PIF for 24h. The comparison between P4 treatment and PIF treatment showed that PIF can induces higher surface expression than P4. Data are a mean of six independent experiments ± SD for each antigen. (**) P ≤ 0.01 and (*) P ≤ 0.05.
A quantitative comparison between the surface antigens after P4 or PIF treatment was also carried
out (Figure 5.8). All HLAs showed higher expression levels on the cell surface after PIF treatment, in
comparison to P4 treatment. The difference between the number of HLA-G and HLA-E receptors after
PIF vs P4 treatment was statistically significant (P ≤ 0.01). Through both sets of data (Figure 5.7 and
5.8), we observed that the increase at the intracellular level was translated to an increase in HLAs at the
surface level, with PIF treated cells displaying both a higher M.F.I. (Figure 5.7) and surface antigen
number (Figure 5.8), in comparison to cells treated with P4.
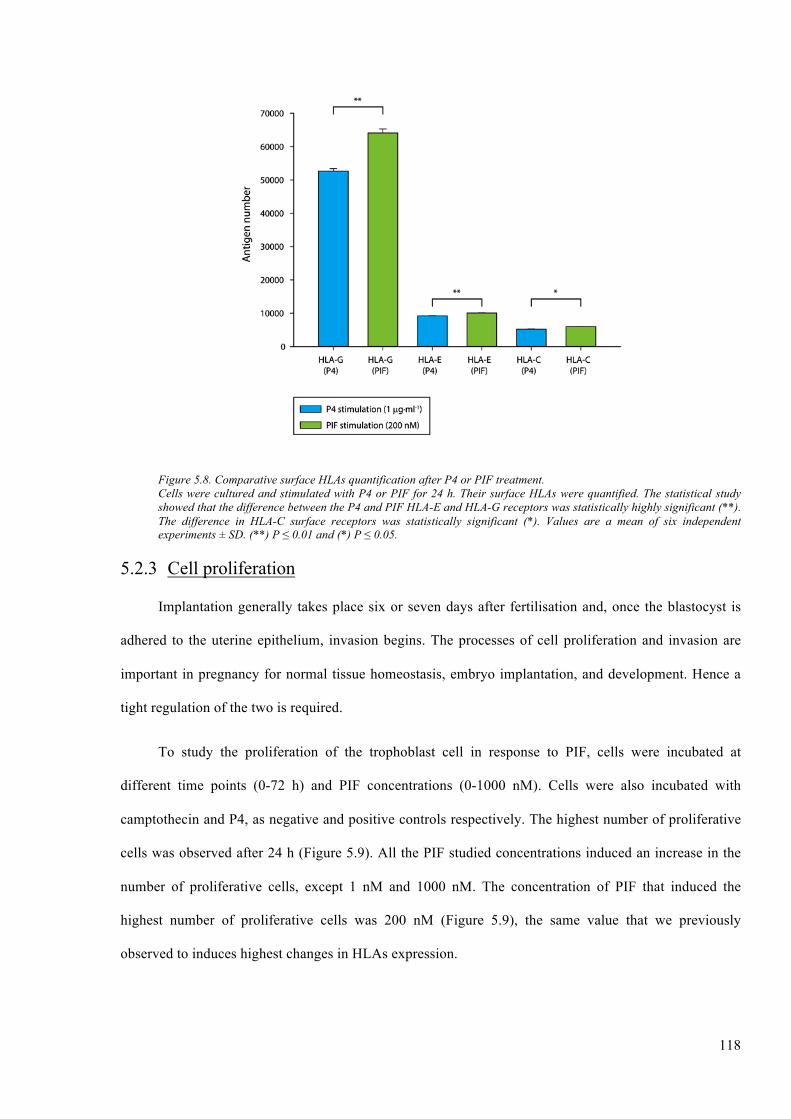
118
Figure 5.8. Comparative surface HLAs quantification after P4 or PIF treatment. Cells were cultured and stimulated with P4 or PIF for 24 h. Their surface HLAs were quantified. The statistical study showed that the difference between the P4 and PIF HLA-E and HLA-G receptors was statistically highly significant (**). The difference in HLA-C surface receptors was statistically significant (*). Values are a mean of six independent experiments ± SD. (**) P ≤ 0.01 and (*) P ≤ 0.05.
5.2.3 Cell proliferation
Implantation generally takes place six or seven days after fertilisation and, once the blastocyst is
adhered to the uterine epithelium, invasion begins. The processes of cell proliferation and invasion are
important in pregnancy for normal tissue homeostasis, embryo implantation, and development. Hence a
tight regulation of the two is required.
To study the proliferation of the trophoblast cell in response to PIF, cells were incubated at
different time points (0-72 h) and PIF concentrations (0-1000 nM). Cells were also incubated with
camptothecin and P4, as negative and positive controls respectively. The highest number of proliferative
cells was observed after 24 h (Figure 5.9). All the PIF studied concentrations induced an increase in the
number of proliferative cells, except 1 nM and 1000 nM. The concentration of PIF that induced the
highest number of proliferative cells was 200 nM (Figure 5.9), the same value that we previously
observed to induces highest changes in HLAs expression.
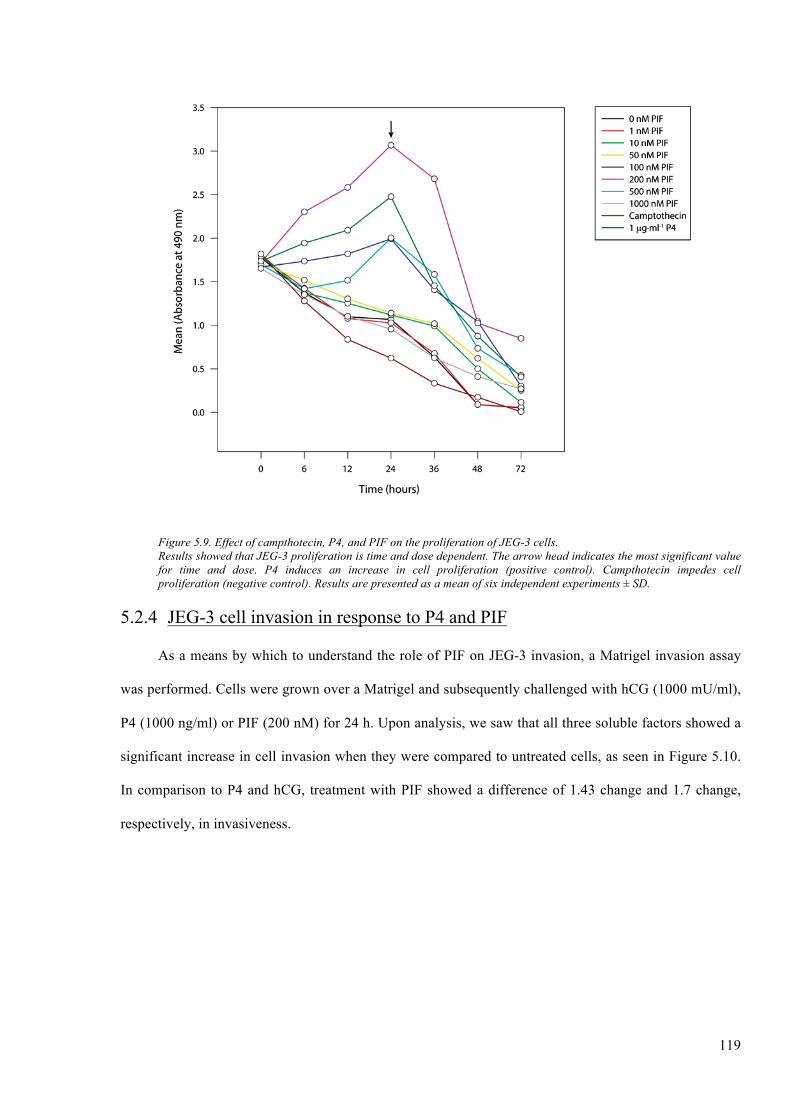
119
Figure 5.9. Effect of campthotecin, P4, and PIF on the proliferation of JEG-3 cells. Results showed that JEG-3 proliferation is time and dose dependent. The arrow head indicates the most significant value for time and dose. P4 induces an increase in cell proliferation (positive control). Campthotecin impedes cell proliferation (negative control). Results are presented as a mean of six independent experiments ± SD.
5.2.4 JEG-3 cell invasion in response to P4 and PIF
As a means by which to understand the role of PIF on JEG-3 invasion, a Matrigel invasion assay
was performed. Cells were grown over a Matrigel and subsequently challenged with hCG (1000 mU/ml),
P4 (1000 ng/ml) or PIF (200 nM) for 24 h. Upon analysis, we saw that all three soluble factors showed a
significant increase in cell invasion when they were compared to untreated cells, as seen in Figure 5.10.
In comparison to P4 and hCG, treatment with PIF showed a difference of 1.43 change and 1.7 change,
respectively, in invasiveness.
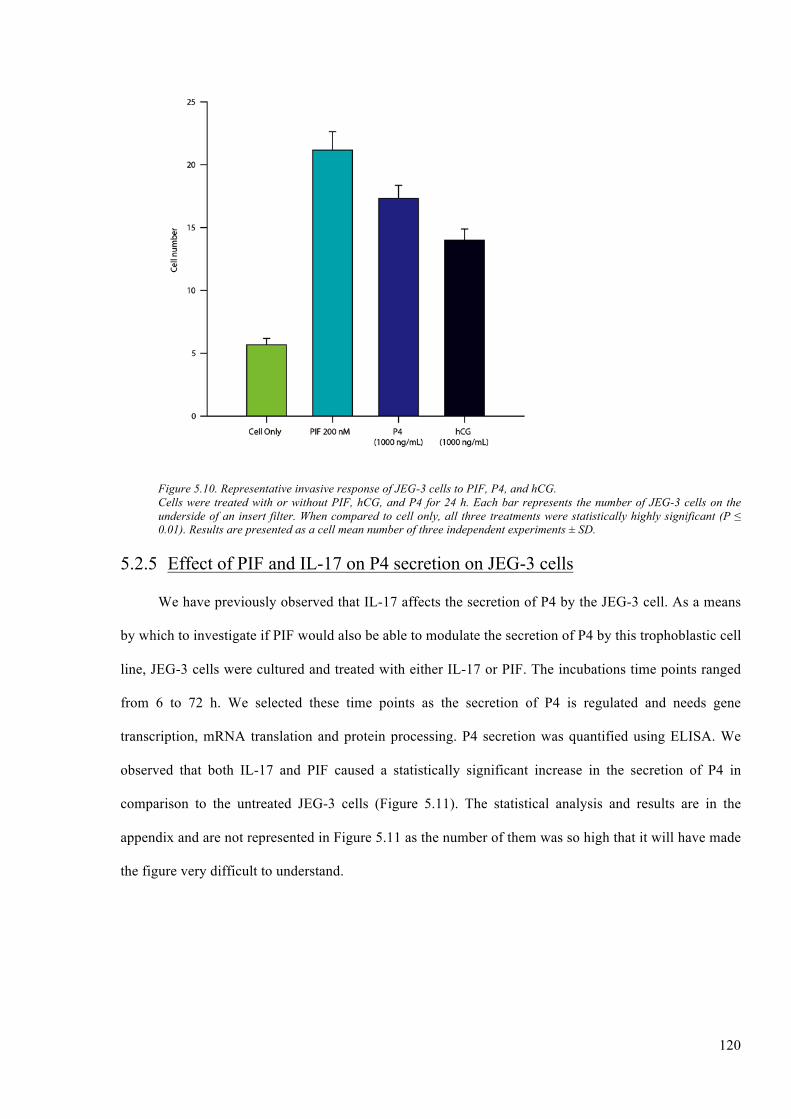
120
Figure 5.10. Representative invasive response of JEG-3 cells to PIF, P4, and hCG. Cells were treated with or without PIF, hCG, and P4 for 24 h. Each bar represents the number of JEG-3 cells on the underside of an insert filter. When compared to cell only, all three treatments were statistically highly significant (P ≤ 0.01). Results are presented as a cell mean number of three independent experiments ± SD.
5.2.5 Effect of PIF and IL-17 on P4 secretion on JEG-3 cells
We have previously observed that IL-17 affects the secretion of P4 by the JEG-3 cell. As a means
by which to investigate if PIF would also be able to modulate the secretion of P4 by this trophoblastic cell
line, JEG-3 cells were cultured and treated with either IL-17 or PIF. The incubations time points ranged
from 6 to 72 h. We selected these time points as the secretion of P4 is regulated and needs gene
transcription, mRNA translation and protein processing. P4 secretion was quantified using ELISA. We
observed that both IL-17 and PIF caused a statistically significant increase in the secretion of P4 in
comparison to the untreated JEG-3 cells (Figure 5.11). The statistical analysis and results are in the
appendix and are not represented in Figure 5.11 as the number of them was so high that it will have made
the figure very difficult to understand.
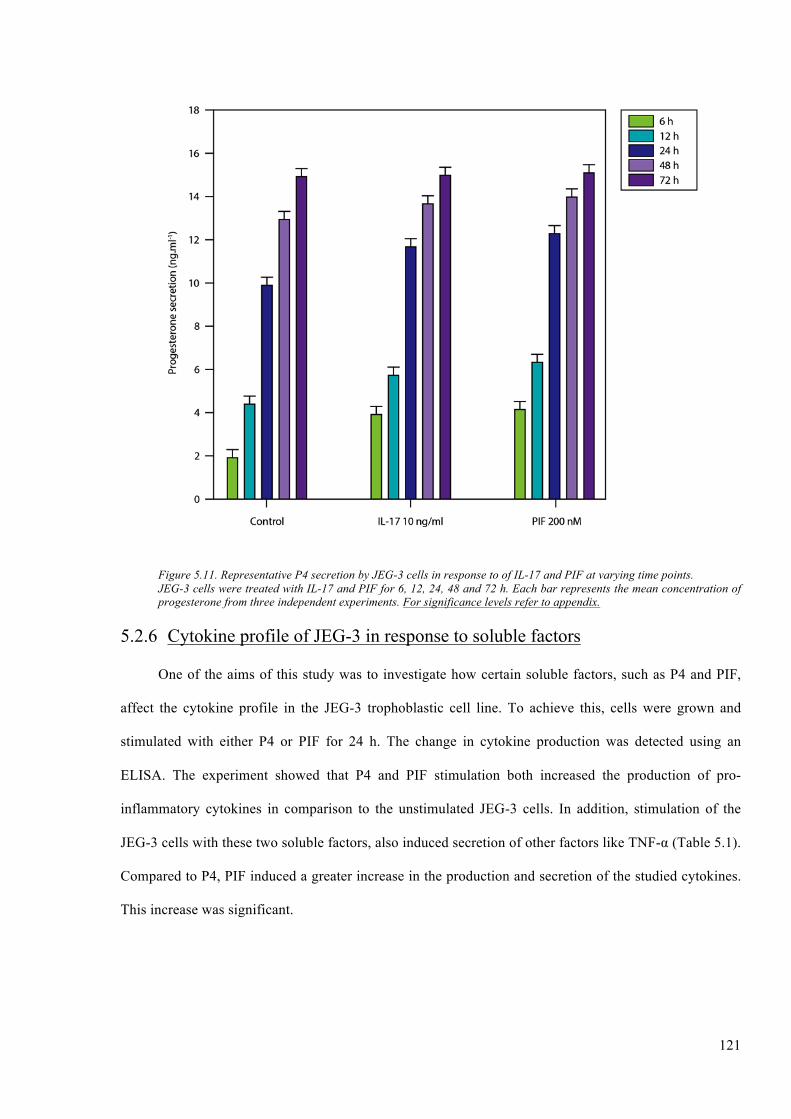
121
Figure 5.11. Representative P4 secretion by JEG-3 cells in response to of IL-17 and PIF at varying time points. JEG-3 cells were treated with IL-17 and PIF for 6, 12, 24, 48 and 72 h. Each bar represents the mean concentration of progesterone from three independent experiments. For significance levels refer to appendix.
5.2.6 Cytokine profile of JEG-3 in response to soluble factors
One of the aims of this study was to investigate how certain soluble factors, such as P4 and PIF,
affect the cytokine profile in the JEG-3 trophoblastic cell line. To achieve this, cells were grown and
stimulated with either P4 or PIF for 24 h. The change in cytokine production was detected using an
ELISA. The experiment showed that P4 and PIF stimulation both increased the production of pro-
inflammatory cytokines in comparison to the unstimulated JEG-3 cells. In addition, stimulation of the
JEG-3 cells with these two soluble factors, also induced secretion of other factors like TNF-α (Table 5.1).
Compared to P4, PIF induced a greater increase in the production and secretion of the studied cytokines.
This increase was significant.
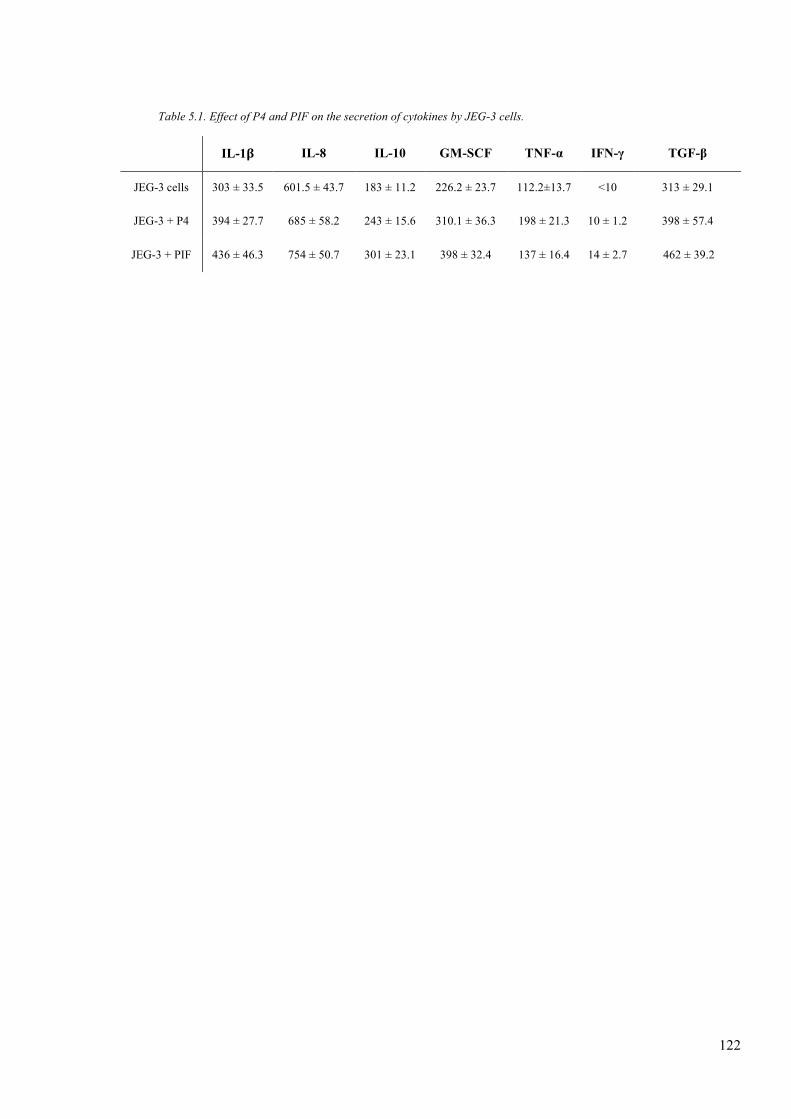
122
Table 5.1. Effect of P4 and PIF on the secretion of cytokines by JEG-3 cells.
IL-1β IL-8 IL-10 GM-SCF TNF-α IFN-γ TGF-β
JEG-3 cells 303 ± 33.5 601.5 ± 43.7 183 ± 11.2 226.2 ± 23.7 112.2±13.7 <10 313 ± 29.1
JEG-3 + P4 394 ± 27.7 685 ± 58.2 243 ± 15.6 310.1 ± 36.3 198 ± 21.3 10 ± 1.2 398 ± 57.4
JEG-3 + PIF 436 ± 46.3 754 ± 50.7 301 ± 23.1 398 ± 32.4 137 ± 16.4 14 ± 2.7 462 ± 39.2
5.3 Discussion
Since the exact moment of implantation until the moment of giving birth, the developing foetus
and the mother are in continuous regulated communication where different soluble factors play an
essential role to ensure a successful pregnancy, which is inextricably linked with placental growth and
differentiation (Albrecht and Pepe, 1999; Barnea, 2001). However, without a successful implantation into
the uterine wall, a pregnancy cannot progress further than the blastocyst stage (Aplin and Kimber, 2004).
During this stage, several soluble factors have been reported to interact with one another, but more so to
complement each other’s functions so as to promote a healthy foetus. During the onset of pregnancy,
many hormones are present, amongst which are hCG and P4. Though present during the first trimester of
pregnancy, neither hCG nor P4 are present for the whole nine months (Malassine et al., 2003). PIF, a
peptide secreted by embryos as early as the two-cell stage, is however present from the onset of
pregnancy and remains so up until birth (Paidas et al., 2010). In this study we have studied one of the
roles that this peptide can have in a pregnant woman is the regulation of HLAs expression at the surface
of trophoblastic-derived cells. In addition, as PIF is a soluble factor that is released before P4, we also
analysed the possible impact that PIF can have over the cytokine profile of the trophoblast-derived cells.
The effects PIF has on HLAs expression and cytokines secretion regulation were compared with the
effects induced by P4.
In this study, evidence of the effect of PIF on the expression of HLA by the JEG- 3 cell line has
been acquired through the use of techniques such as Wb and flow cytometry. Results showed that PIF can
induce an increase in the expression of the studied HLAs in a dose and time dependent manner, both at
the intracellular and at the surface level. Our in vitro dose-time experiment showed that PIF had a
significant effect on HLAs expression at doses over 1 nM and as soon as 6 h of incubation. The
concentration and time at which PIF induces its maximal effects on JEG-3 cells measured as HLA-G
expression, was at a dose of 200 nM and after 24 h of incubation. The Barnea group have hypothesized
that PIF’s ability to act at low doses is in part due to its early secretion and its small size (Barnea et al.,
2012a). We believe that, based on our results, this could be possible because a small peptide of only 15
amino acids can diffuse the membrane freely and mimics the role of other bigger molecules and its

124
synthesis would not take as long as that of a more complex molecule. An early secretion, at the two-cell-
stage, can mean that it will act in a very low dose, basically autocrinely, while in the meantime the
concentration of PIF continues to increase, and its effects will also become paracrine, i.e. at the uterus
during or after the annealing. Results from the Than group have also eluded to this by showing that this
peptide is only 15 amino acids, inherently nontoxic, universally mammalian and able to act a low doses
(Than et al., 2007). PIF can be found in the maternal circulation at a concentration ranging between 30-
150 nM (Duzyj et al., 2010). As it has been previously published, the concentration of PIF in the
peripheral maternal blood has a wide range, which is in line with our findings, which found that a PIF
concentration of 200 nM was that which had the highest expression increase effect. We have to be careful
with this data, as the concentration that can be found in the peripheral blood is different than that which is
found at the fetomaternal interface. The difference between the two concentrations may be because only a
small amount of PIF can diffuse to the maternal blood stream, hence foetal concentrations are higher. Our
results focused on the effect of PIF over a trophoblast cell line (which is made up of foetal cells), not over
cells isolated from the maternal side. This could be another reason for such discrepancy in the
concentrations of PIF. In addition, the time point of 24 h that was observed is similar to that which it
takes embryos to reach the two-cell stage when they start to secrete PIF (Barnea, 2001). Our induction
experiments were successful in identifying an appropriate time and dose which are similar to those
conditions observed in vivo. This reinforces and partially validates the present experimental model as
being a suitable system by which to study the role and impact of PIF at the fetomaternal interface.
Physiological and in vitro culture conditions are never are going to be equal as there are so many
different factors that can induce changes in the results, that is why our model is partially validated (this is
something completely different from invalidated).
Through our experiments, it was also seen that PIF has an increasing effect on all HLAs as
expressed by our cellular model, at the surface and intracellular level, as does P4 (Yie et al., 2006b). It
was observed that at the intracellular level, in comparison to untreated cells, PIF treated cells underwent a
significant change in their HLA profiles. At the cell surface level this change was translated for all HLAs,
notably HLA-G and HLA-E, and to a lesser degree HLA-C, with the exception of HLA-F which is not
125
expressed at this level. This study is the first to show a regulation of HLAs by PIF and is important as it
shows that several soluble factors, using different pathways, are involved in the regulation of HLAs
during pregnancy, which is important as it helps to ensure survival of the foetus.
Previous research has shown that P4 and hCG are important in regulating the process of pregnancy
(Miyaura and Iwata, 2002; Okabe et al., 2014). Our investigation furthered those results by showing that
in addition to increasing HLA-G expression, P4 also increases other HLAs expressed on the trophoblast.
Once we observed this, we compared the effects of PIF with those of P4. Our experimental results
indicated that PIF and P4 both exhibit increasing effects on HLAs expression. We can hypothesize that
PIF causes a higher increase in HLAs expression than does P4, as PIF is secreted soon after fertilization
and before secretion or production of P4 by the corpus luteum or trophoblast, respectively (Maccarrone et
al., 2001). This is important because without an adequate uterine environment or implantation of the
embryo, which is believed, to be partially mediated by PIF a healthy pregnancy will not occur. This
hypothesis is in line with other groups that have reported that in pregnancy, problems regularly occur
during the peri- and pre-implantation period (Aplin and Kimber, 2004; Sargent et al., 2006).
After PIF and P4 exerted their regulatory affects, it was observed that HLA-G remained that which
was the highest expressed, followed by HLA-E, -C and -F that was only detected intracellularly. The
dominant expression of HLA-G over the other HLAs expressed by our cellular model, even after
treatment with PIF, consistently points to this molecule as being pivotal in pregnancy. The Apps group
reported that HLA-G was the first of HLA-Ib molecules to be discovered in the placental trophoblast
cells, due to its elevated levels of expression at this site in comparison to the other HLAs (Apps et al.,
2007). In addition, an observation made by the Hutter group who stated that at the site of the human
placenta, the expression of HLA-G is that which favoured further backs our hypothesis (Hutter et al.,
1996).
It was also hypothesized that after PIF stimulation, HLA-E and HLA-F would experience an
increase similar to that experienced after P4 stimulation, while HLA-C would experience either a
decrease in its expression or remain unchanged. Our results are not in line with this hypothesis as our
results showed that even when HLA-E and HLA-F experienced an increase after PIF treatment, this was
126
significantly higher than that resulting from stimulation with P4. Our results also showed that HLA-G,
HLA-E, and HLA-F underwent a significant increase in their expression in response to PIF, as they are
essential in maintaining a healthy pregnancy. We hypothesized that the foetus ensures its own survival by
secreting PIF, which acts on these HLAs in a positive manner. Our results also showed that HLA-C
experienced an increase in its expression after PIF treatment and, even when the change was not as high
as with HLA-G or -E, it was statistically significant compared with P4 treatment. We believe that the
increase that we detected in HLA-C expression was related to its role in the regulation of the uNK cells.
However, as HLA-C is a member of HLA-Ia, it is still a polymorphic molecule that is more related to
antigen presentation. If a viral infection was to occur during pregnancy, or the foetus were to start to
produce truncated or abnormal proteins, HLA-C will be the molecule that will trigger the mother’s
immune response. This response maybe will induce a preterm labour but surely will save the mother
(Chazara et al., 2011). In the end, the immune response is finely regulated where the net balance between
activating and tolerogenic signals will decide if the immune system is activated or not (Thellin and
Heinen, 2003; Tadokoro, 2012).
Through our investigation we also observed that PIF greatly affects the invasion and proliferation
of JEG-3 cells in vitro. PIF enhanced JEG-3 invasion to a greater extent than hCG or P4. Our results,
regarding hCG and P4, were in agreement with a previous work that described that P4 enhanced JEG-3
invasion to a greater degree than hCG (Zygmunt et al., 1998). We also detected that cell proliferation was
also increased after PIF stimulation, notably using a concentration of 200 nM and an incubation period of
24 h. Based on our data, we can assert that PIF’s effects over cell invasiveness and proliferation is
statistically significant compared with the results measured after hCG or P4 stimulation. This moves the
classical paradigm of P4 as the “hormone of pregnancy” to something more complex to include others
actors that can may be just as important as P4 in pregnancy. One of these new actors could be PIF as not
only is it secreted before either of these hormones, but it’s also assumed that it is an important factor in
modulating the maternal immune system and preparing the uterine environment so as to promote
receptivity. Our findings support previous groups’ hypothesis and findings of PIF’s multi-targeted effects
127
and ability to prepare and adapt the maternal body to pregnancy (Stamatkin et al., 2011a; Stamatkin et
al., 2011b; Duzyj et al., 2010; Bose et al., 1989).
PIFs early detection in pregnancy drove us to investigate its effect on the secretion of P4. We have
been able to detect that in comparison to IL-17, PIF induced a significant increase in the P4 secretion
levels of JEG-3 cells. We believe that PIF’s modulation of the secretion of P4 is the embryo’s way of
ensuring that there is a convenient level of P4, as well as warranting its renewal. In addition, we also
believe that PIF induces higher secretion levels of P4 by signalling to the maternal host that it is viable
and needs to be maintained, hence the latter needs to continually replenish its P4 levels. We postulate that
only a properly implanted embryo would be able to control the secretion of P4, as only viable embryos
synthetize and secrete PIF (Bose et al., 1989; Roussev et al., 1996; Adinolfi, 1988).
In pregnancy, cytokines have been shown to act in an autocrine and paracrine manner, so as to
regulate the implantation process and the development of the embryo (Sanjabi et al., 2009a; Sanjabi et
al., 2009b). As at the fetomaternal interface, there is a complex network of cytokines and hormones that
are at play, the interactions between these two players are inevitable. This study was successful in
showing that P4 and PIF both have an increasing effect on the synthesis and releasing of pro-
inflammatory cytokines produced by the JEG-3 cells, in addition to inducing the expression of some anti-
inflammatory cytokines. More so, it was also observed that in their regulation of cytokines, PIF had a
more prominent effect on the regulation of the cytokines than P4. Our results are in line with those
published by the Chaouat group, who reported that different hormones were able to influence the
production of local soluble factors secreted by the endometrium, i.e. cytokines (Chaouat et al., 2005). The
regulation of cytokine production by PIF and P4 is important, as it highlights their roles in modulating the
process of implantation and embryo development. In addition, PIF’s dominant regulation of the cytokines
further highlights its important role in embryo implantation and its role as an autocrine regulator of
embryo development. By regulating the cytokine production, PIF is able to ensure that the necessary
levels of cytokines needed for a successful implantation and maintenance of the embryo are thus met.
This conclusion is alongside that of the Stamatkin group, who reported that PIF has multi-targeted
effects, one of which was its autocrine supporting effect on the development of the foetus (Stamatkin et
128
al., 2011a; Stamatkin et al., 2011b). The modulation of the local immune system by PIF is important as it
points to its importance in the foetus’ wellbeing.
The main source of P4 in the earliest stages of pregnancy is the corpus luteum and it is only when
the placenta has been established that this becomes the primary source of P4. On the other hand, the
embryo under development, as early as the two-cell stage, is the first source of PIF secretion. This study
is the first to present evidence showing PIF’s ability to regulate other HLAs expressed by a cellular
trophoblast-derived model JEG-3, in an in vitro environment. In addition, it also showed that PIF has an
effect on the proliferative and invasive behaviour of the JEG-3 cells, as well as the capacity to change or
modulate JEG-3 cells’ P4 secreting abilities and cytokine profile. PIF’s modulation of HLAs, and the
local environment, and its increasing effect of P4 secretion are important in that it highlight its
importance, not only, in the earliest stages of pregnancy, but also point to the embryo as being a “selfish”
entity as it produces PIF for its own benefit, in that it ensures its requirements are met. Pregnancy is an
event, which involves multiple soluble factors, which have to act in a harmonious way in order to ensure
a favourable outcome. Though the mother ensures the embryo’s survival by providing a receptive
endometrium and favourable local immunity, the embryo nevertheless guarantees its own survival by
producing PIF, a peptide renowned for its multi-targeted effects.

CHAPTER VI. RESULTS: PROTEOME AND 2-DE ANALYSIS
CHAPTER VI
RESULTS
PROTEOME AND 2-DE ANALYSIS
6.1 Introduction
As we have shown in the previous chapters both, PIF and P4, play an important role in the
regulation of several critical factors clearly involved in human pregnancy. Maybe the main role is the
regulation of HLA-G expression, but not only, as both soluble factors also regulate the expression of
HLA-E, HLA-F, and HLA-C. However, as had been highlighted in this research and in the bibliography,
the mechanisms by which these soluble factors carry out their roles are still not well understood (Ramu et
al., 2013; Hakam et al., 2014; al-Sebai et al., 1995; Arkaravichien and Kendle, 1990; Barrera et al., 2007;
Coulam et al., 1995; Moindjie et al., 2014).
In this study we have observed that the effects induced by PIF are pretty much similar to those
induced by P4. We also know that the expression of any protein is more complex, and involves many
mechanisms that do more than just ensure its secretion, especially if this protein, is constitutively secreted
by the cell. Protein secretion or expression requires the regulation of multiple factors such as enzymes,
nuclear factors or enhancers, surface or intracellular receptors, etc. Based on these premises, we decided
to investigate how PIF induces these changes that we have measured in the previous chapters, in order to
better understand the role of PIF. To carry out this investigation, we decided to use 2-DE (two
dimensional polyacrylamide gel electrophoresis), which is a powerful tool used to separate and fraction
complex protein mixtures from cells, tissue or any biological sample.
As 2-DE analysis is not only cheaper than a microarray, but also easier to perform, and the
bioinformatics analysis is simpler to carry out and not as time-consumable as the data-mining needed for
a microarray it was the next logical step that was carried out in this investigation. In addition, 2-DE
analysis offered us another advantage over a microarray study in that the expression of false positives is
lower than those that occur in a microarray as when a protein is detected. However, with a microarray the
information about all the mRNAs is provided, meaning both those that will be translated and those that
will not. Hence with a microarray, for the data to be validated, a second technique, such as a Quantitative
Real Time PCR (qRT-PCR) or newer and more expensive techniques, such as RNASeq or whole

131
transcriptome sequencing, will have to be carried out. Therefore, for this investigation, we thought that
the 2-DE technique was the best way by which to investigate how a protein induces changes in both the
phenotype and the genotype of a cell
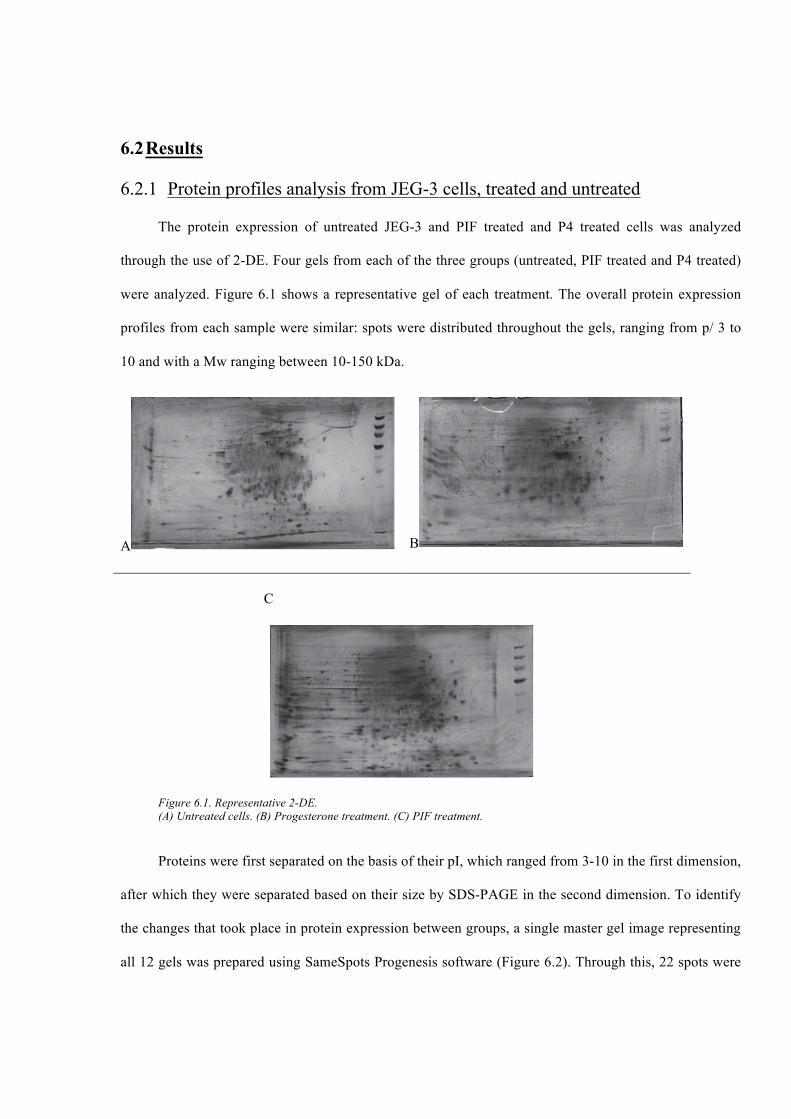
6.2 Results
6.2.1 Protein profiles analysis from JEG-3 cells, treated and untreated
The protein expression of untreated JEG-3 and PIF treated and P4 treated cells was analyzed
through the use of 2-DE. Four gels from each of the three groups (untreated, PIF treated and P4 treated)
were analyzed. Figure 6.1 shows a representative gel of each treatment. The overall protein expression
profiles from each sample were similar: spots were distributed throughout the gels, ranging from p/ 3 to
10 and with a Mw ranging between 10-150 kDa.
A B
C
Figure 6.1. Representative 2-DE. (A) Untreated cells. (B) Progesterone treatment. (C) PIF treatment.
Proteins were first separated on the basis of their pI, which ranged from 3-10 in the first dimension,
after which they were separated based on their size by SDS-PAGE in the second dimension. To identify
the changes that took place in protein expression between groups, a single master gel image representing
all 12 gels was prepared using SameSpots Progenesis software (Figure 6.2). Through this, 22 spots were
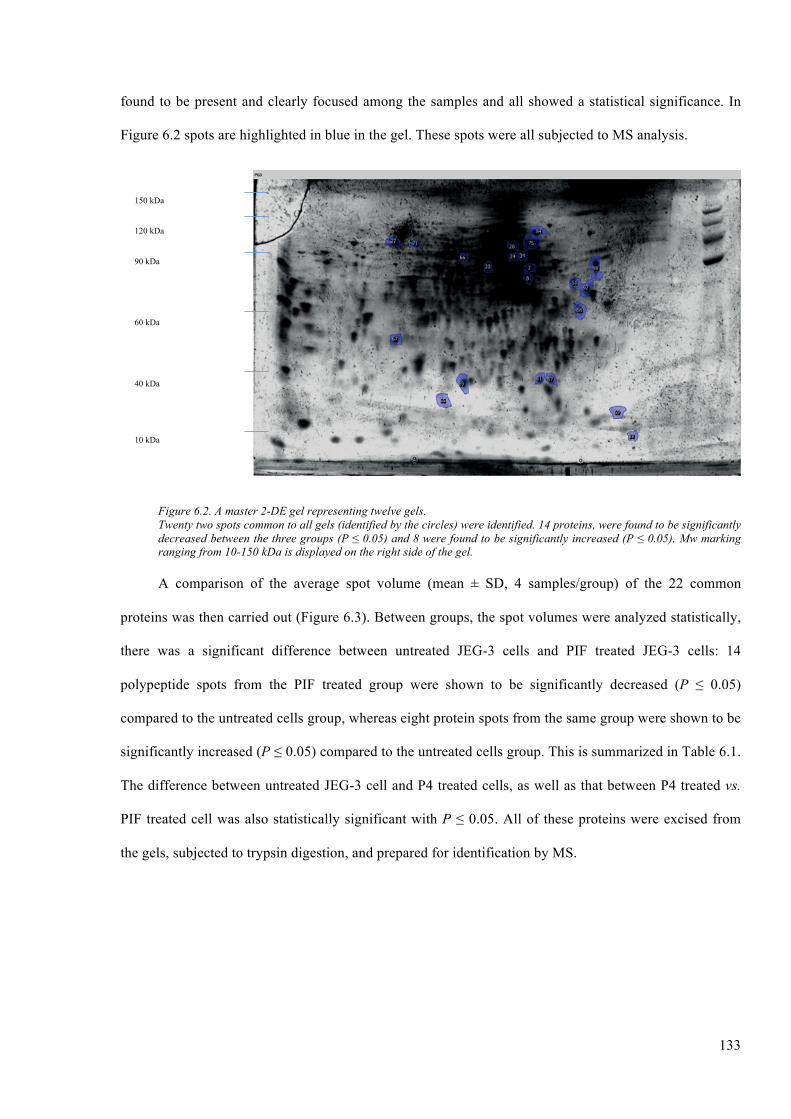
133
found to be present and clearly focused among the samples and all showed a statistical significance. In
Figure 6.2 spots are highlighted in blue in the gel. These spots were all subjected to MS analysis.
Figure 6.2. A master 2-DE gel representing twelve gels. Twenty two spots common to all gels (identified by the circles) were identified. 14 proteins, were found to be significantly decreased between the three groups (P ≤ 0.05) and 8 were found to be significantly increased (P ≤ 0.05). Mw marking ranging from 10-150 kDa is displayed on the right side of the gel.
A comparison of the average spot volume (mean ± SD, 4 samples/group) of the 22 common
proteins was then carried out (Figure 6.3). Between groups, the spot volumes were analyzed statistically,
there was a significant difference between untreated JEG-3 cells and PIF treated JEG-3 cells: 14
polypeptide spots from the PIF treated group were shown to be significantly decreased (P ≤ 0.05)
compared to the untreated cells group, whereas eight protein spots from the same group were shown to be
significantly increased (P ≤ 0.05) compared to the untreated cells group. This is summarized in Table 6.1.
The difference between untreated JEG-3 cell and P4 treated cells, as well as that between P4 treated vs.
PIF treated cell was also statistically significant with P ≤ 0.05. All of these proteins were excised from
the gels, subjected to trypsin digestion, and prepared for identification by MS.
150 kDa
120 kDa
90 kDa
60 kDa
40 kDa
10 kDa
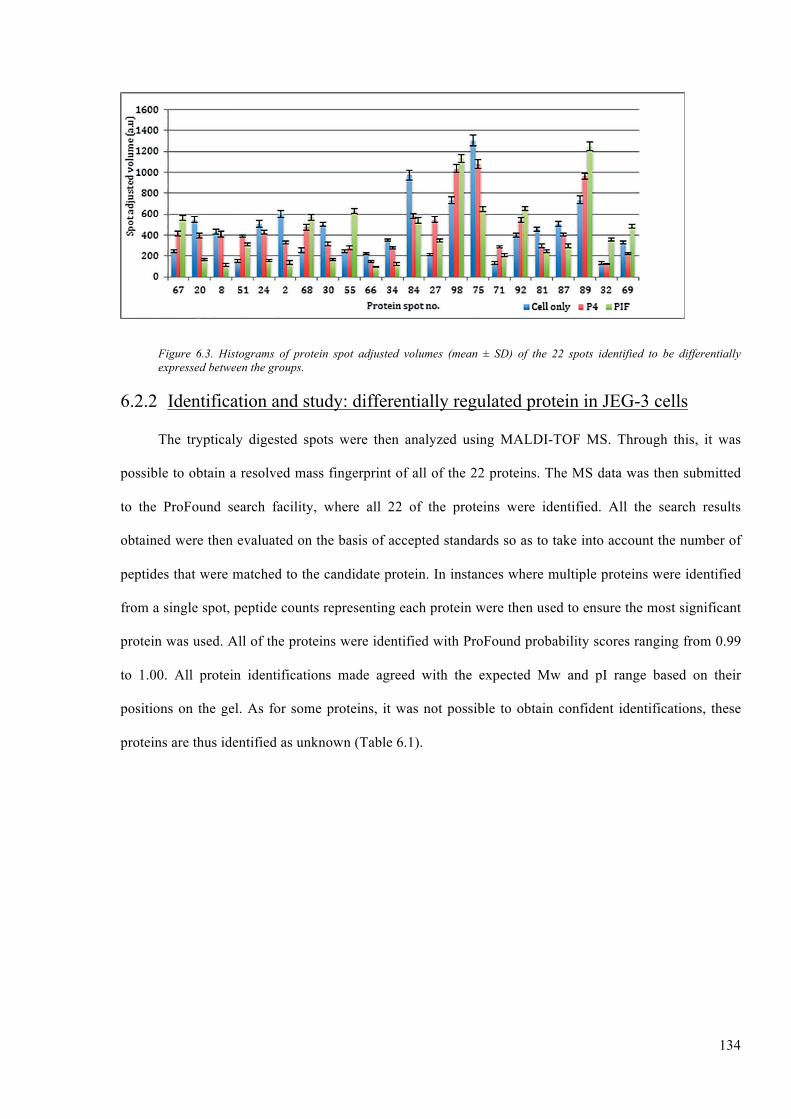
134
Figure 6.3. Histograms of protein spot adjusted volumes (mean ± SD) of the 22 spots identified to be differentially expressed between the groups.
6.2.2 Identification and study: differentially regulated protein in JEG-3 cells
The trypticaly digested spots were then analyzed using MALDI-TOF MS. Through this, it was
possible to obtain a resolved mass fingerprint of all of the 22 proteins. The MS data was then submitted
to the ProFound search facility, where all 22 of the proteins were identified. All the search results
obtained were then evaluated on the basis of accepted standards so as to take into account the number of
peptides that were matched to the candidate protein. In instances where multiple proteins were identified
from a single spot, peptide counts representing each protein were then used to ensure the most significant
protein was used. All of the proteins were identified with ProFound probability scores ranging from 0.99
to 1.00. All protein identifications made agreed with the expected Mw and pI range based on their
positions on the gel. As for some proteins, it was not possible to obtain confident identifications, these
proteins are thus identified as unknown (Table 6.1).
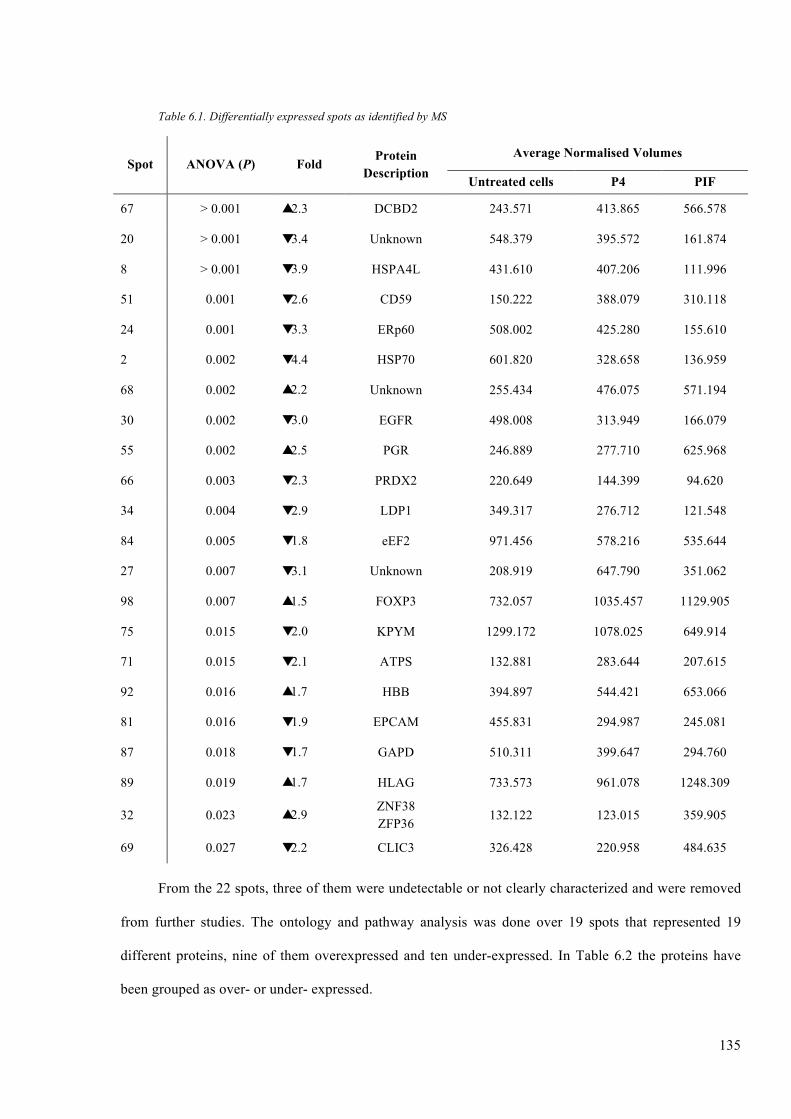
135
Table 6.1. Differentially expressed spots as identified by MS
Spot ANOVA (P) Fold Protein Description
Average Normalised Volumes
Untreated cells P4 PIF
67 > 0.001 � 2.3 DCBD2 243.571 413.865 566.578
20 > 0.001 � 3.4 Unknown 548.379 395.572 161.874
8 > 0.001 � 3.9 HSPA4L 431.610 407.206 111.996
51 0.001 � 2.6 CD59 150.222 388.079 310.118
24 0.001 � 3.3 ERp60 508.002 425.280 155.610
2 0.002 � 4.4 HSP70 601.820 328.658 136.959
68 0.002 � 2.2 Unknown 255.434 476.075 571.194
30 0.002 � 3.0 EGFR 498.008 313.949 166.079
55 0.002 � 2.5 PGR 246.889 277.710 625.968
66 0.003 � 2.3 PRDX2 220.649 144.399 94.620
34 0.004 � 2.9 LDP1 349.317 276.712 121.548
84 0.005 � 1.8 eEF2 971.456 578.216 535.644
27 0.007 � 3.1 Unknown 208.919 647.790 351.062
98 0.007 � 1.5 FOXP3 732.057 1035.457 1129.905
75 0.015 � 2.0 KPYM 1299.172 1078.025 649.914
71 0.015 � 2.1 ATPS 132.881 283.644 207.615
92 0.016 � 1.7 HBB 394.897 544.421 653.066
81 0.016 � 1.9 EPCAM 455.831 294.987 245.081
87 0.018 � 1.7 GAPD 510.311 399.647 294.760
89 0.019 � 1.7 HLAG 733.573 961.078 1248.309
32 0.023 � 2.9 ZNF38 ZFP36
132.122 123.015 359.905
69 0.027 � 2.2 CLIC3 326.428 220.958 484.635
From the 22 spots, three of them were undetectable or not clearly characterized and were removed
from further studies. The ontology and pathway analysis was done over 19 spots that represented 19
different proteins, nine of them overexpressed and ten under-expressed. In Table 6.2 the proteins have
been grouped as over- or under- expressed.
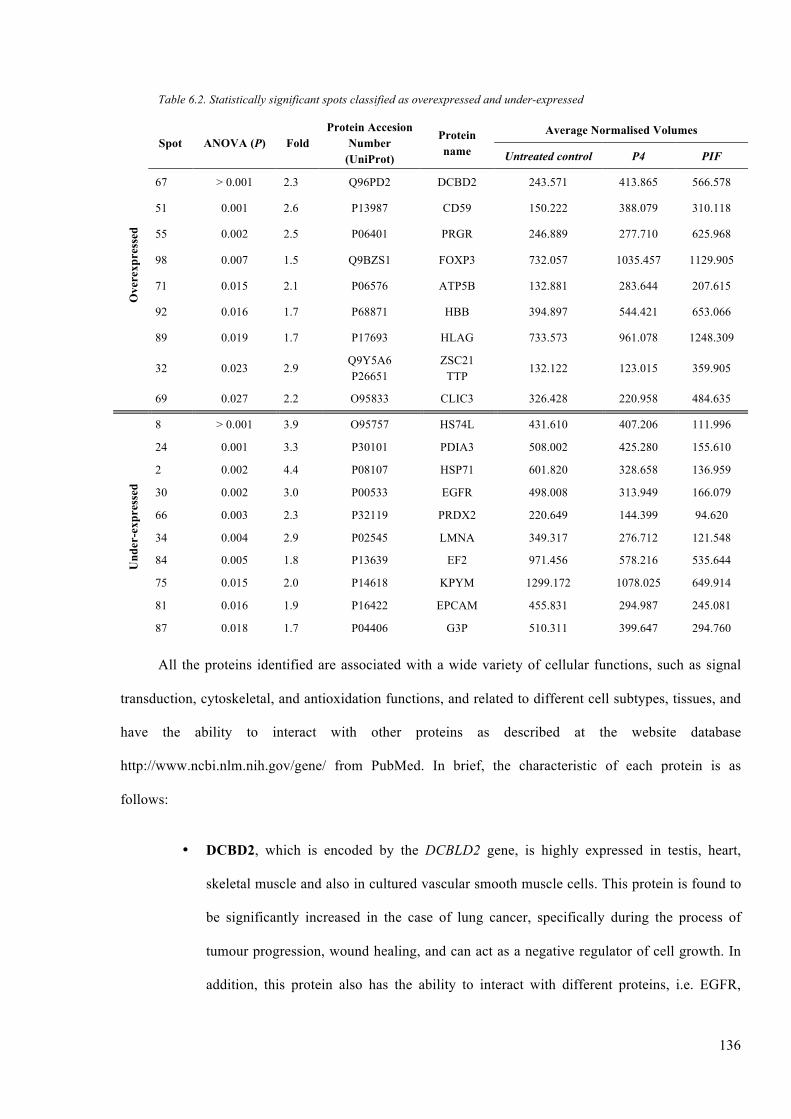
136
Table 6.2. Statistically significant spots classified as overexpressed and under-expressed
Ove
rexp
ress
ed
Spot ANOVA (P) Fold Protein Accesion
Number (UniProt)
Protein name
Average Normalised Volumes
Untreated control P4 PIF
67 > 0.001 2.3 Q96PD2 DCBD2 243.571 413.865 566.578
51 0.001 2.6 P13987 CD59 150.222 388.079 310.118
55 0.002 2.5 P06401 PRGR 246.889 277.710 625.968
98 0.007 1.5 Q9BZS1 FOXP3 732.057 1035.457 1129.905
71 0.015 2.1 P06576 ATP5B 132.881 283.644 207.615
92 0.016 1.7 P68871 HBB 394.897 544.421 653.066
89 0.019 1.7 P17693 HLAG 733.573 961.078 1248.309
32 0.023 2.9 Q9Y5A6 P26651
ZSC21 TTP
132.122 123.015 359.905
69 0.027 2.2 O95833 CLIC3 326.428 220.958 484.635
Und
er-e
xpre
ssed
8 > 0.001 3.9 O95757 HS74L 431.610 407.206 111.996
24 0.001 3.3 P30101 PDIA3 508.002 425.280 155.610
2 0.002 4.4 P08107 HSP71 601.820 328.658 136.959
30 0.002 3.0 P00533 EGFR 498.008 313.949 166.079
66 0.003 2.3 P32119 PRDX2 220.649 144.399 94.620
34 0.004 2.9 P02545 LMNA 349.317 276.712 121.548
84 0.005 1.8 P13639 EF2 971.456 578.216 535.644
75 0.015 2.0 P14618 KPYM 1299.172 1078.025 649.914
81 0.016 1.9 P16422 EPCAM 455.831 294.987 245.081
87 0.018 1.7 P04406 G3P 510.311 399.647 294.760
All the proteins identified are associated with a wide variety of cellular functions, such as signal
transduction, cytoskeletal, and antioxidation functions, and related to different cell subtypes, tissues, and
have the ability to interact with other proteins as described at the website database
http://www.ncbi.nlm.nih.gov/gene/ from PubMed. In brief, the characteristic of each protein is as
follows:
• DCBD2, which is encoded by the DCBLD2 gene, is highly expressed in testis, heart,
skeletal muscle and also in cultured vascular smooth muscle cells. This protein is found to
be significantly increased in the case of lung cancer, specifically during the process of
tumour progression, wound healing, and can act as a negative regulator of cell growth. In
addition, this protein also has the ability to interact with different proteins, i.e. EGFR,
137
CRKL, SEMA4B and TRAF6 (the two latter ones are strongly associated with the immune
system).
• CD59, is encoded by the CD59 gene. This protein, which is also referred to as a membrane
attack complex (MAC)-inhibitory protein (MAC-IP), is responsible for the regulation of
complement-mediated cell lysis, as well as being involved in the process of lymphocyte
signal transduction. This protein is a potent inhibitor of the MAC, whereby it binds C8
and/or C9, thereby inhibiting the incorporation of multiple copies of C9 into the complex,
which is necessary for osmolytic pore formation. This protein also plays a role in signal
transduction pathways namely in the activation of T cells. CD59 interacts with several
different proteins, such as the envelope surface glycoprotein gp120 and gp41, which are
present in HIV-1, or with EGFR complement elements C8 and C9 and their derivate and
SMAD4.
• PRGR, encoded by the PGR gene, is a progesterone receptor of the steroid receptor
superfamily. PRGR, mediates the physiological effects of the progesterone hormone,
which plays a central role in reproductive events associated with both the establishment
and the maintenance of pregnancy. PRGR also interacts with different proteins such as
ESR1 and SP1 and with the histones HIST3H3 and HIST4H4.
• FOXP3, is encoded by the FOXP3 gene. The FOXP3 protein is a member of the
forkhead/winged-helix family of transcriptional regulators. It has the ability with which to
interact with Tat protein from the HIV-1, the nuclear factors AT (NFAT5, NFATC1 and 2)
and HDCA proteins. FOXP3 is known to be one of “master switches” during the Treg
differentiation.
• ATPB, encoded by the gene ATP5B, is a subunit of mitochondrial ATP synthase.
Mitochondrial ATP synthase catalyzes ATP synthesis, utilizing an electrochemical gradient
of protons across the inner membrane during oxidative phosphorylation. In addition, it has
also been reported that ATPB can inhibit HIV-1 replications in HeLa cells by interacting
with the viral proteins Tat, Vpr and Vpu. ATPB can also interact with other proteins such as
other ATP5 or ASB proteins.
138
• HBB protein is encoded by the HBB gene, is related to human adult haemoglobin, which is
a tetramer consisting of two alpha and two beta chains. The central role of haemoglobin is
the transport of oxygen and it has the potential to interact with proteins like ORC2, HBA2
or SELT.
• HLA-G, which encoded by the HLAG gene, is one of the prime members of the non-
classical HLA class I molecules (HLA-Ib). HLA-G is involved in antigen presentation and
in the regulation of immune responses. HLA-G is expressed by certain types of tumour
cells, as a way with which to avoid cellular cytotoxicity. HLA-G can interact with a variety
of different viral proteins such as the HIV-1 like gp120, gp41 or gp160. In the human body
HLA-G can also interact with KIR2-DEL4, LILRB1 or TAP1 and 2.
• ZSC21, encoded by the ZSCAN21 gene, is a member of the family of zinc-finger proteins
that binds to DNA and regulates its transcription. ZSC21 can also interact with other ZNF
proteins.
• TTP, encoded by the ZFP36 gene, is a member of the family of zinc ring finger proteins,
can interact not only with the DNA but also with COX2 mRNA. At the proteomic level,
this protein can also interact with several proteins like YWHA proteins, PTGS2 or APP.
• CLIC3, is encoded by the CLIC3 gene. Is a member of the chloride channels, which are a
diverse group of proteins that regulate fundamental cellular processes including
stabilization of cell membrane, potential trans-epithelial transport, maintenance of
intracellular pH, and regulation of cell volume. The chloride intracellular channel 3, is a
member of the p64 family, and is predominantly localized in the nucleus. It is renowned
for its stimulation of chloride ion channel activity. This protein is also reported to
participate in the process of cellular growth control, based on its observed association with
a member of the MAP kinase family, ERK7.
• HS74L, is encoded by the HSPA4L gene. This protein, which is a member of the heat
shock protein 70 family showed chaperone activity in vitro, where it is seen to inhibit
139
aggregation of citrate synthase. The expression of this protein is also renowned to be
induced by both osmotic imbalance and heat shock.
• PDIA3 is encoded by the PDIA3 gene. This protein can be detected in the endoplasmic
reticulum where is reported to interact with the lectin chaperones, calreticulin and
calnexin, so as to modulate the folding of newly synthesized glycoproteins. It has recently
been demonstrated that this protein has disulphide isomerase activity, and not a
phospholipase as was once believed. The complexes of lectins and this protein mediate
protein folding through the promotion of the formation of disulphide bonds in their
glycoprotein substrates.
• HSP71, is encoded by the HSPA8 gene. Is a member of the heat shock protein 70 family,
HSP71 belongs to the basic expressed members group, which are more commonly referred
to as heat-shock cognate proteins. This protein functions as a chaperone, in addition to
binding to nascent polypeptides as a mean by which to expedite correct folding. Moreover,
this protein also functions as an ATPase in the disassembly of clathrin-coated vesicles
during the process of the transportation of membrane components through the cell.
• EGFR, encoded by the EGFR gene. This protein, is a transmembrane glycoprotein
member of the protein kinase superfamily. Moreover, it also acts as a cell surface receptor
for members of the epidermal growth factor of extracellular protein ligands. Induction of
receptor dimerization and tyrosine autophosphorylation, which ultimately leads to cell
proliferation is triggered by the binding of the protein to a ligand. Mutations arising from
this protein are highly related to lung cancer.
• PRDX2, encoded by the PRDX2 gene, is a member of the peroxiredoxin family of
antioxidant enzymes. This protein is known to reduce hydrogen peroxide and alkyl
hydroperoxides, in addition to playing an antioxidant protective role in cells. This protein
may also contribute to the antiviral activity of CD8+ T cells. This protein is also seen to
prevent haemolytic anaemia as a result of oxidative stress through the stabilization of
haemoglobin. In addition, PRDX2 is also reported as having a proliferative effect, and may
play a role in both the development and progression of cancer.
140
• LMNA is encoded by the LMNA gene, and is also known as LAMIN A/C. The lamin
family of proteins have been highly conserved through evolution. Lamins are components
of the nuclear lamina, which is a fibrous layer on the nucleoplasmic side of the inner
nuclear membrane. During the process of mitosis, as the lamin proteins are
phosphorylated, the lamina matrix is simultaneously reversibly disassembled. Moreover,
the lamin proteins are believed to be involved in the processes of chromatin structure, gene
expression, and nuclear stability. The proteins are also known to be able to interact with
other lamin line proteins, such as LMNB, CASP1 and 6 or EGF.
• EF2, encoded by the EEF2 gene, is a translation elongation factor with five domains. This
G-protein, is a member of the GTP-binding translation elongation factor family. EF2 is
also an essential factor for protein synthesis, and promotes the GTP-dependent
translocation of the nascent protein chain from the A-site to the P-site of the ribosome.
This protein is also known to interact with CDK proteins, TP53 or CASP7.
• Encoded by the KPM gene, the KPYM protein is a serine/threonine protein kinase
belonging to the LATS tumour suppressor family, and is also involved in glycolysis. This
protein has the role of o localize the centrosomes during the interphase, and early and late
metaphase stages of mitosis. KPYM also interacts with the centrosomal proteins aurora-A
and ajuba, and is essential for the accumulation of gamma tubulin and spindle formation at
the beginning of the mitosis process. As well as interacting with a negative regulatory of
p53, this protein also functions as a positive feedback loop with p53, responding to
cytoskeletal damage. Lastly, the KPYM protein acts as a co-repressor of androgen-
responsive gene expression.
• EPCAM, encoded by the EPCAM gene, is an epithelial cell adhesion molecule. EPCAM is
part of a family that includes at least two type I membrane proteins, in addition to being a
carcinoma-associated antigen. This protein functions as a transmembrane glycoprotein
mediating Ca2+ independent homotypic cell-cell adhesion in the epithelia.
• G3P, also known as triose phosphate, is encoded by the GAPDH gene. G3P, which
participates in the Calvin cycle, has both glyceraldehyde-3-phosphate dehydrogenase and
141
nitrosylase activities, thereby playing a role in glycolysis and nuclear functions,
respectively. This protein is also known to hold a role in nuclear events, such as those of
transcription, DNA replication, apoptosis, and RNA transport. It is most probably involved
in nuclear functions due to its nitrosylase activity, which mediates cysteine S-nitrosylation
of nuclear target proteins such as SIRT1, HDAC2 and PRKDC. This protein is also
involved in modulating the assembly and organization of the cytoskeleton, in addition to
facilitating the CHP1-dependent microtubule and membrane associations through its
ability to stimulate the binding of CHP1 to microtubules. Is a component of the GAIT
(gamma interferon-activated inhibitor of translation) complex and is involved in
interferon-gamma-induced transcript-selective translation inhibition in inflammation
processes. G3P, when is treated with interferon-gamma assembles into the GAIT complex,
which then binds to stem loop-containing GAIT elements in the 3’-UTR of diverse
inflammatory mRNAs, and as a result, suppresses their translation.
The selected significant spots were then analysed for their ontogeny using the web tools provided
by PIR (Protein Information Resource, a UniProt consorcium member), hosted by the University of
Georgetown at http://pir.georgetown.edu/pirwww/index.shtml.
The main focus of this study addressed the gene ontology (GO) of the 19 differentially expressed
proteins. The analysis that was performed dealt with these proteins biological functions, as is summarized
in Table 6.3. The analysis supplied data on the role of PIF during the first stages of pregnancy, and how it
differs from the effects of P4 during this stage. Through the analysis of the 19 differentially expressed
proteins, it was possible to detect 59 different ontological terms, as is summarized in the next table.
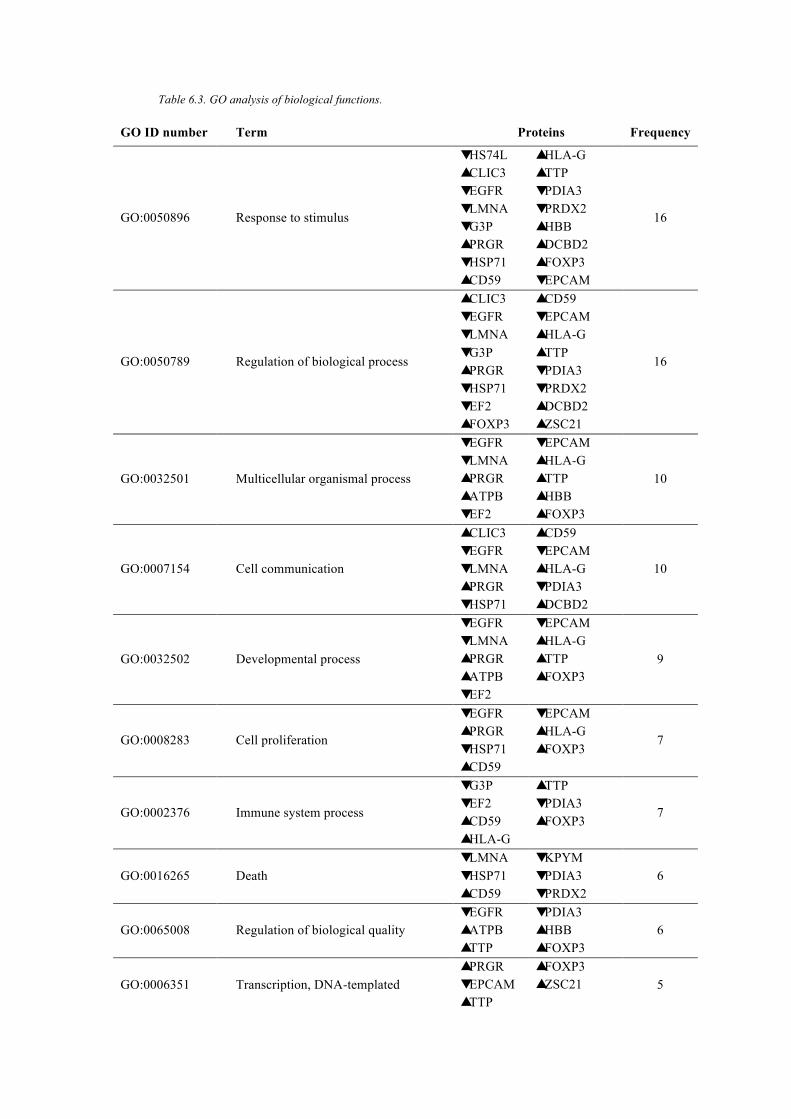
Table 6.3. GO analysis of biological functions.
GO ID number Term Proteins Frequency
GO:0050896 Response to stimulus
� HS74L � CLIC3 � EGFR � LMNA � G3P � PRGR � HSP71 � CD59
� HLA-G � TTP � PDIA3 � PRDX2 � HBB � DCBD2 � FOXP3 � EPCAM
16
GO:0050789 Regulation of biological process
� CLIC3 � EGFR � LMNA � G3P � PRGR � HSP71 � EF2 � FOXP3
� CD59 � EPCAM � HLA-G � TTP � PDIA3 � PRDX2 � DCBD2 � ZSC21
16
GO:0032501 Multicellular organismal process
� EGFR � LMNA � PRGR � ATPB � EF2
� EPCAM � HLA-G � TTP � HBB � FOXP3
10
GO:0007154 Cell communication
� CLIC3 � EGFR � LMNA � PRGR � HSP71
� CD59 � EPCAM � HLA-G � PDIA3 � DCBD2
10
GO:0032502 Developmental process
� EGFR � LMNA � PRGR � ATPB � EF2
� EPCAM � HLA-G � TTP � FOXP3
9
GO:0008283 Cell proliferation
� EGFR � PRGR � HSP71 � CD59
� EPCAM � HLA-G � FOXP3
7
GO:0002376 Immune system process
� G3P � EF2 � CD59 � HLA-G
� TTP � PDIA3 � FOXP3
7
GO:0016265 Death � LMNA � HSP71 � CD59
� KPYM � PDIA3 � PRDX2
6
GO:0065008 Regulation of biological quality � EGFR � ATPB � TTP
� PDIA3 � HBB � FOXP3
6
GO:0006351 Transcription, DNA-templated � PRGR � EPCAM � TTP
� FOXP3 � ZSC21 5
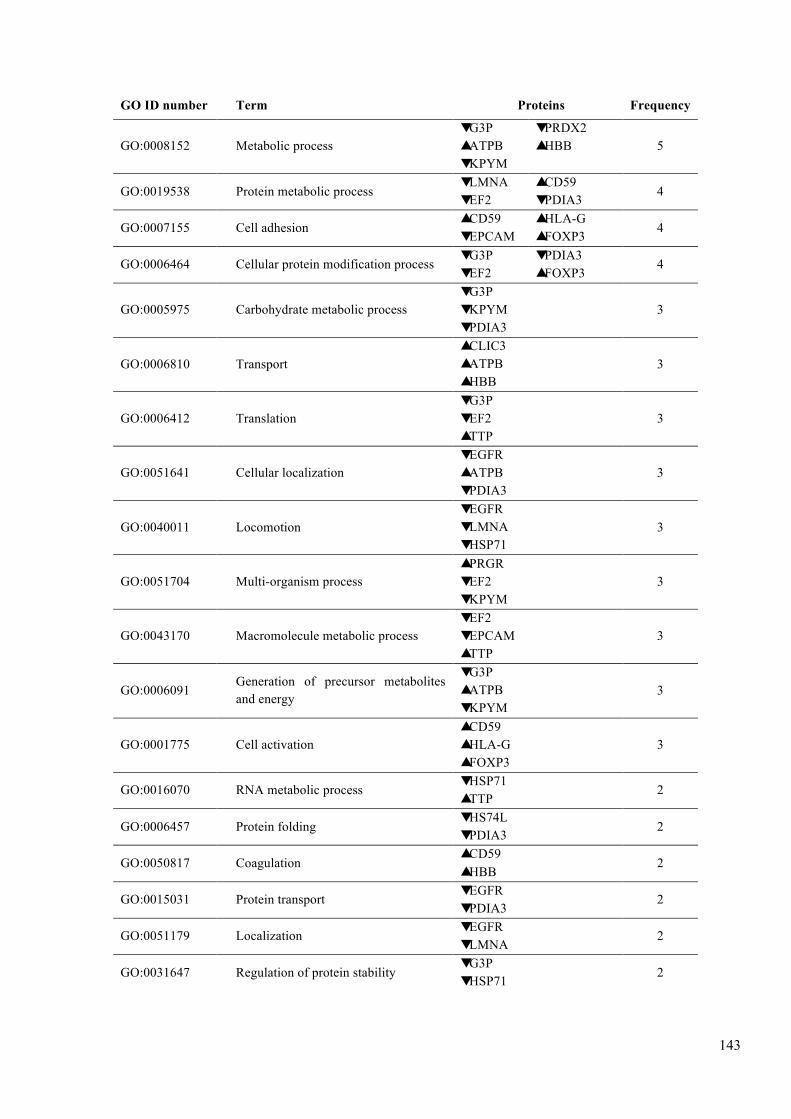
143
GO ID number Term Proteins Frequency
GO:0008152 Metabolic process � G3P � ATPB � KPYM
� PRDX2 � HBB 5
GO:0019538 Protein metabolic process � LMNA � EF2
� CD59 � PDIA3
4
GO:0007155 Cell adhesion � CD59 � EPCAM
� HLA-G � FOXP3
4
GO:0006464 Cellular protein modification process � G3P � EF2
� PDIA3 � FOXP3
4
GO:0005975 Carbohydrate metabolic process � G3P � KPYM � PDIA3
3
GO:0006810 Transport � CLIC3 � ATPB � HBB
3
GO:0006412 Translation � G3P � EF2 � TTP
3
GO:0051641 Cellular localization � EGFR � ATPB � PDIA3
3
GO:0040011 Locomotion � EGFR � LMNA � HSP71
3
GO:0051704 Multi-organism process � PRGR � EF2 � KPYM
3
GO:0043170 Macromolecule metabolic process � EF2 � EPCAM � TTP
3
GO:0006091
Generation of precursor metabolites and energy
� G3P � ATPB � KPYM
3
GO:0001775 Cell activation � CD59 � HLA-G � FOXP3
3
GO:0016070 RNA metabolic process � HSP71 � TTP
2
GO:0006457 Protein folding � HS74L � PDIA3
2
GO:0050817 Coagulation � CD59 � HBB
2
GO:0015031 Protein transport � EGFR � PDIA3
2
GO:0051179 Localization � EGFR � LMNA
2
GO:0031647 Regulation of protein stability � G3P � HSP71
2
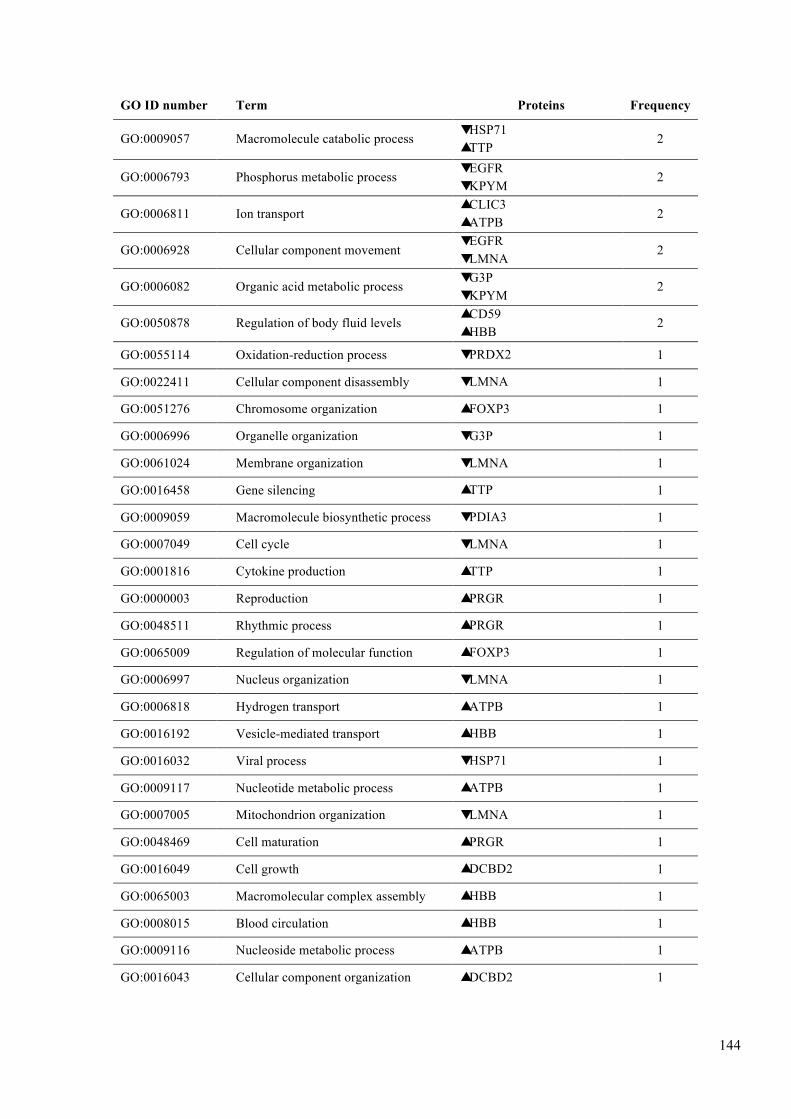
144
GO ID number Term Proteins Frequency
GO:0009057 Macromolecule catabolic process � HSP71 � TTP
2
GO:0006793 Phosphorus metabolic process � EGFR � KPYM
2
GO:0006811 Ion transport � CLIC3 � ATPB
2
GO:0006928 Cellular component movement � EGFR � LMNA
2
GO:0006082 Organic acid metabolic process � G3P � KPYM
2
GO:0050878 Regulation of body fluid levels � CD59 � HBB
2
GO:0055114 Oxidation-reduction process � PRDX2 1
GO:0022411 Cellular component disassembly � LMNA 1
GO:0051276 Chromosome organization � FOXP3 1
GO:0006996 Organelle organization � G3P 1
GO:0061024 Membrane organization � LMNA 1
GO:0016458 Gene silencing � TTP 1
GO:0009059 Macromolecule biosynthetic process � PDIA3 1
GO:0007049 Cell cycle � LMNA 1
GO:0001816 Cytokine production � TTP 1
GO:0000003 Reproduction � PRGR 1
GO:0048511 Rhythmic process � PRGR 1
GO:0065009 Regulation of molecular function � FOXP3 1
GO:0006997 Nucleus organization � LMNA 1
GO:0006818 Hydrogen transport � ATPB 1
GO:0016192 Vesicle-mediated transport � HBB 1
GO:0016032 Viral process � HSP71 1
GO:0009117 Nucleotide metabolic process � ATPB 1
GO:0007005 Mitochondrion organization � LMNA 1
GO:0048469 Cell maturation � PRGR 1
GO:0016049 Cell growth � DCBD2 1
GO:0065003 Macromolecular complex assembly � HBB 1
GO:0008015 Blood circulation � HBB 1
GO:0009116 Nucleoside metabolic process � ATPB 1
GO:0016043 Cellular component organization � DCBD2 1
145
6.3 Discussion
The purpose of the 2-DE analysis was to identify the partial changes in the proteome of the human
choriocarcinoma cell line JEG-3 in response to PIF and P4 treatments. JEG-3 cellular proteins were
displayed by 2-DE, after their treatment with or without P4 or PIF. We found that 42 proteins were
common to all the gels (untreated, P4 treated and PIF treated). Of these proteins, only 22 were seen to be
differentially expressed; 14 were consistently under-expressed and 8 were overexpressed. MALDI-TOF
MS was successful in identifying 19 of these 22 proteins.
Through the gene ontology of the biological functions of the identified proteins, 59 GO terms were
associated to the significant proteins. Of the 59 terms, 10 of them were believed to be pivotal in
pregnancy, and were closely looked at and examined. In addition, as being a hierarchical system of
classification, gene ontology does not require that all the terms identified be defined as they are
interrelated to one another.
Of the proteins identified, 16 fall under the GO identification GO:0050896, also known as response
to stimulus. Of the 16 proteins, eight were under-expressed, and the other eight were overexpressed.
Among the overexpressed proteins we had CLIC3, which acts as an ion channel, PRGR, which is
responsible for the mediation of P4 signalling as well as cell-cell signalling. In addition, CD59 was also
among the overexpressed proteins. This protein is associated with the tyrosine kinase complex, which is
responsible for inducing the start of different intracellular signalling cascades, which have the ability to
activate different nuclear factors such as NFκB or NFAT, both of which are related to FOXP3. TTP, is a
negative regulator of the translation of micro RNA (miRNA) which has the ability to silence a wide range
of different genes expression interfering with their mRNA (Bartel, 2009; Brennecke et al., 2005; Lim et
al., 2005). Other proteins, such as HBB, which is involved in the transportation of volatile messengers i.e.
NO and oxygen species, and HLA-G, which is related to the response and interaction of different immune
competent cells were also overexpressed after stimulation. The last overexpressed protein was DCBD2,
which is reported to positively regulate the extracellular matrix. On the under-expressed proteins side, we
had HS74L and HSP71, both of which are involved in protein folding, as they act as chaperones. EGFR
146
was another under-expressed protein; this has the ability to regulate the response to estradiol which plays
a crucial role during the course of pregnancy, where EGFR increases uterine blood flow, breast size, the
number of oxytocin receptors, and prepares the cervix for parturition. LMNA is involved in the stability
of the nucleus, as well as in the regulation of the condensed state of chromatin and in gene expression.
G3P, is notorious for its involvement in the modulation of the assembly state of the cytoskeleton, while
both PDIA3 and PRDX2 play a central role in the cellular redox homeostasis. The last under-expressed
protein was EPCAM, which is widely involved in cell-to-cell interactions.
Regulation of biological process, a GO term also identified as GO:0050789, also encompassed 16
significant proteins, eight of which were overexpressed, and eight of which were under-expressed. From
Table 6.3, it can be observed that the proteins that fall under this GO term, are almost identical to those
which fall under the GO term response to stimulus. Such can be explained, as because ontology is a
hierarchical system of classification, thus numerous proteins will thus be involved in a variety of
biological functions. In other words, the regulation of the biological process may be associated with the
regulation at the genetic level either by an intracellular phosphorylation cascade, which would involve
CD59 or EGFR, it may also be related with the activation of nuclear factors, which involves FOX3P, or
may directly interact with the DNA or translation processes which involve LMNA or TTP. Though 14
out of the 16 proteins involved in the regulation of biological processes are also involved in response to
stimulus, there were two proteins, which differ between these two groups. These two proteins were
ZCS21 and EF2. The overexpressed ZSC21, is a strong transcriptional activator, while the under-
expressed EF2 is observed to be essential for the synthesis of proteins at the ribosomal level, in addition
to being able to interact with CDK molecules, p53 (which are termed as the “gatekeeper” of the genome)
and caspases such as CASP7.
The GO:0007154 term identifies the process of cell communication. Such can be considered to be
a result of response to stimulus, as cells either use chemical or electrical signals to communicate between
themselves. A response to stimuli or a means of communication may involve a chemical messenger such
as P4, an interleukin, or even a change in the membrane’s electric potential (i.e. internalisation or release
147
of ions from or to the extracellular environment). Due to this, the proteins involved in this term, are all
ones, which are involved in other functions, and have been previously described.
The function of developmental process is identified by the GO term GO:0032502. The processes of
cell-cell signalling also referred to as communication between cells, and the response to stimulus, which
can induce change in a group of cells, as well as maturity, division, etc., can all trigger mechanisms
which are involved in the developmental processes of the foetus. Under this category nine proteins were
observed, four of which were under-expressed and five overexpressed. All the proteins belonging to this
group, have previously been detected and described in other groups, with the exception of one
overexpressed protein, ATPB. This protein constitutes part of the ATP complex synthase in the
mitochondria. Any process that involves a developmental process, requires energy, and the energetic coin
in cells is ATP. As the biosynthesis of cells depends on the ATP synthase, it is obvious why we observed
an increase in its expression levels; the foetus under development will need energy to synthetize proteins,
gene translation, transduction, etc.
Identified by the GO term GO:0008283, the biological function of cell proliferation had seven of
the 20 differentially expressed proteins. Of these, were the overexpressed CD59, which is related with
intracellular signalling, and PRGR and FOXP3, which are related with genetic regulation. The three
under-expressed proteins included EGFR, which is related with chromatin binding, HSP71, a protein
used as a means by which to control both protein expression and cell adhesion, and also EPCAM, which
is used as a mechanism by which to keep cells tied together.
The biological immune system process, also identified by the GO number 0002376, is a somewhat
confusing term, as one must remember that the cells used in this investigation are in fact not
immunocompetent cells. The immune system does not “produce” proteins to carry out its normal
functions, but instead uses proteins that are already involved in such processes. In this case, it was
observed that four overexpressed proteins, CD59, HLA-G, TTP, and FOXP3, and three under-expressed
proteins G3P, EF2, and PDIA3, fall under this category. Under this classification, it can be said that
HLA-G holds the most crucial role, being described as an immune regulator of the immune system. In
148
addition, during pregnancy, this protein is reported to interact with KIR receptors on the surface of uNK
cells.
The biological process of cell death (GO:0016265), at the ontological level, differs from apoptosis
and necrosis. In the ontological classification, cell death is at the upper end of the hierarchy ladder, in
comparison to apoptosis or necrosis. Where this process is concerned, one of the overexpressed proteins
was CD59, which is known to protect cells against the complement system, through inhibition of MAC,
ultimately avoiding the polymerization of the factor C9, which produces pores on the surface of cells. We
identified five under-expressed proteins among which was LMNA, which is related with nucleus
stability; HSP71, which is involved in the depolymerisation of clathrin coated intracellular vesicules;
KPYM, which plays a general role in caspase independent cell death; PDIA3, which is responsible for
avoiding cellular cytotoxicity by decreasing antigen presentation through the regulation of folding,
assembly and peptide loading of class I molecules. Lastly, PRDX2 is known for its promotion of
apoptosis. Under the biological function of cell death, all six proteins are related with cell survival, hence
there is a decrease in those proteins, which are renowned for their involvement in apoptosis so as to not
promote cell death.
The GO:0008152 identifies the biological function of metabolic process. Under this term, two
overexpressed and three under-expressed proteins were reported. ATPB, is related with ATP production,
and HBB is known for its ability to protect the cell from radical species of oxygen and nitrogen. Both
molecules are clearly related with metabolism: ATPB as the “producer” of energy and HBB as “a shield”
against the free radicals that can be produced during the process.
The GO:0007155 identifies the biological function of cell adhesion. The overexpressed proteins
under this term were CD59, HLA-G and FOXP3, all of which are related with soft cell adhesion and cell-
cell interaction. EPCAM, a protein related to tight joints, which hinders cell growth due to them being in
too close proximity with each other, was found to be under-expressed.
Cell activation, is identified by the GO term GO:0001775. Under this biological process, the
overexpression of three proteins was observed of which was that of CD59, which is related with the

149
activation by a tyrosin kinase complex; HLA-G, which can either induce or inhibit the activation of
immunocompetent cells; and FOXP3, which has the ability to regulate the activation of numerous cells.
The data obtained in this investigation represents the first proteomic profiling of the effect of PIF
on JEG-3 cells. The proteins identified through this study are key components in determining cell
proliferation, signalling, immunomodulation, etc. All the proteins identified to be either overexpressed, or
under-expressed as a result of PIF are consistent with the profile of pregnancy. In addition, this study
establishes and validates proteomic analysis as a useful tool by which to profile the effect of soluble
factors, such as PIF or P4, on protein expression.

CHAPTER VII. FINAL DISCUSSION
CHAPTER VII
FINAL DISCUSSION

151
7.1 Introduction
Reproductive immunology is a field of medicine that addresses the interactions that take place
between the immune system and the reproductive system. Studies of the maternal immune system and the
foetal-placental unit have been the major focus of reproductive immunology, for the reason that many
have sought to address an apparent paradox: the foetus, which in essence is an allograft (semi-allogenic),
not only avoids immune recognition, but grows and develops in the maternal uterus without adverse
effects. Medawar was the first to recognize the unique immunology that exists at the fetomaternal
interface in his paper from 1953 (Medawar, 1953). It was in this paper where the “foetal allograft”
analogy was first described, whereby the foetus was compared to a semi-allogenic graft, which in part is
comprised of paternal genes, hence is foreign to the maternal immune system, yet the foetus is able to
evade maternal rejection. Medawar theorized that the unknown mechanism used by the foetus to avoid
rejection by the maternal body could be due to three things: “(1) the antigenic immaturity of the foetus,
(2) the immunological inertness of the mother, and (3) the anatomical separation of the foetus from the
mother” (Moffett and Loke, 2004; Mor and Abrahams, 2003). Adding on the Medawar’s original
hypothesis, a fourth hypothesis to try and explain how the foetus avoids rejection was proposed in 1964
by Billingham who hypothesized that the uterus may be an immune privileged site, where the foetus
shifts the maternal host’s immune response to a protective and tolerant one: the concept of immune
privileged sites was by no account new as it was recognized by immunologists for nearly 135 years when
Billingham proposed it (Billingham, 1964a; Billingham, 1964b; Billingham, 1964c). Research about how
the foetus avoids the mother’s immune system and is able to grow and develop, including the study that
you have between your hands, has shown that the foetus does not present any antigenic immaturity, and
the maternal system is not inert, as can be seen through the wide array of cytokines, HLAs, growth
factors, hormones, and many other soluble factors that exist and act at the fetomaternal interface (Gomez-
Lopez et al., 2014; Guleria and Sayegh, 2007; Erlebacher, 2013b; Girardi et al., 2006; Spencer et al.,
2012). Such findings in fact support Medawar’s theory of the existence of a physical separation between
the mother and the foetus, as though both mother and foetus display ‘active’ immune systems, they are
able to tolerate one another, and the foetus is able to thrive in the host’s body.
152
Humans possess a form of hemotrophic viviparity that is distinguished by the presence of a
placenta that acts as a physical separation between the mother and foetus (Colucci et al., 2014). This
physical separation that develops between the mother and the foetus is biologically significant as are the
cells of the placenta, more specifically the trophoblast cells, which exert the immunomodulatory
functions that allow the survival of the foetus. The trophoblast cells also downregulate the expression of
HLAs, as well as express regulators of the complement system (Girardi et al., 2006). The human
placenta, a haemochorial transitional organ, is essential for the development of the embryo (Dancis,
1965). The placenta acts to facilitate the bi-directional exchange of soluble factors between the mother
and the foetus. This is important for the development of the embryo, maintenance of pregnancy, and
induction of labour (Sacks et al., 1999; Schneider, 1991; Sacks et al., 2000). Such soluble factors, which
include biologically active molecules, locally produced cytokines, a wide array of hormones, and the
MHC proteins are important in controlling the immune response at the pregnancy level, in addition to
supporting the growth of the foetus.
Whilst the role of MHC proteins during fertilization remains controversial, they are believed to be
implicated in several different stages of reproduction, most importantly blastocyst and trophoblast
formation, embryo implantation, and the development and overall survival of the foetus (Rodgers and
Cook, 2005; Blaschitz et al., 2001; Juch et al., 2012; Choudhury and Knapp, 2001). In a quest to help and
explain the enigma of the foetal allograft, this study has focused on the expression of MHC molecules
and their potential effect during pregnancy, as well as addressing the effect that soluble factors have on
the expression of MHC molecules at the fetomaternal interface. To study such interactions that take place
at the level of pregnancy, well established choriocarcinomic cells lines and proteomic techniques were
used.
7.2 Trophoblast cell lines, a means by which to study human pregnancy
The physical and molecular interactions that take place between maternal and foetal tissues are
often complex, and studying them is a difficult task. Implantation of the human blastocyst into the
maternal endometrium, and all the interactions that take place during this process, cannot be studied in

153
vivo and neither can they be easily studied ex vivo. In addition, there are countless ethical restrictions and
technical limitations that exist in trying to perform studies in pregnant women. Worldwide, only a
handful of laboratories have the privilege to have access to human embryos that have been donated for
research purposes, and though endometrial curettage material is more available, it nevertheless remains
very hard to come by (Hannan et al., 2010). Therefore, the majority of researchers turn to an alternative,
yet established method, of using in vitro cell lines as a means by which to examine the interactions that
take place at the fetomaternal interface. Each cell line has a different phenotype and, while one may be
useful for studying a certain response or function of pregnancy it may not be the best to study another
function (Bazer and Salamonsen, 2008). Therefore, it is very important to choose those, which are best
fitted to each individual investigation.
In the present study, cell lines were selected based on three criteria: (1) HLA expression, (2)
cytokines secretion, such as the IL-1β, GM-CSF, IL-12, IL-10, all of which are considered to be
important in the first trimester of pregnancy, and (3) their ability to migrate through basement membrane-
like Matrigel barriers. Four candidate cell lines, JAR, HTR-8/SVneo, JEG-3 and ACH-3P, were
identified through a literature search. The JAR cell line does not express HLA-G, while the HTR-
8/SVneo cell line, when grown on a Matrigel, only expresses HLA-G. The JEG-3 and ACH-3P cell lines,
however, actively express HLA-G, in addition to several other HLAs, hence displaying similar
characteristics to in vivo trophoblast cells (Kovats et al., 1990; Kilburn et al., 2000; Frank et al., 2000). In
addition, the JEG-3 cell line is suited for invasion and migration assays, while on the other hand the
ACH-3P cell line is a new cell line and an instructive one to study. Hence both the JEG-3 and ACH-3P
cell lines were selected to be tested and validated (Hannan et al., 2010). Through several experiments, it
was determined if the JEG-3 or ACH-3P cell line would offer the ability to study all the a priori selected
biological characteristics, and would thus be better suited to this specific investigation. By studying
phenotypic characteristics and HLA and cytokine expression patterns of the JEG-3 and ACH-3P cell lines
(an aspect which remains unpublished), it was found that both express HLA-G, HLA-E, HLA-C and
HLA-F, with the JEG-3 cell line expressing a significantly higher level of these HLAs. In addition, the
JEG-3 cell line was that with the higher cytokine expression profile, in that it expressed higher levels of
154
the investigated cytokines. The difference in the relative expression of HLAs between JEG-3 and ACH-
3P cells can be explained by the presence of two trophoblast subpopulations, ST and EVCT, in the ACH-
3P cell line, as reported by the Hiden group (Hiden et al., 2007). The JEG-3 cell line was chosen for this
investigation, since unlike the ACH-3P cell line, it had a stable and higher basal HLA protein and
cytokine expression profile. The JEG-3 cell line also had a similar HLA profile as its EVCT counterpart
in vivo. This cell line is also reported to have similar biological and biochemical characteristics to EVCT
(Table 7.1) (Wadsack et al., 2003). Similarities between the JEG-3 and EVCT in vivo were essential for
the results to be conclusive.
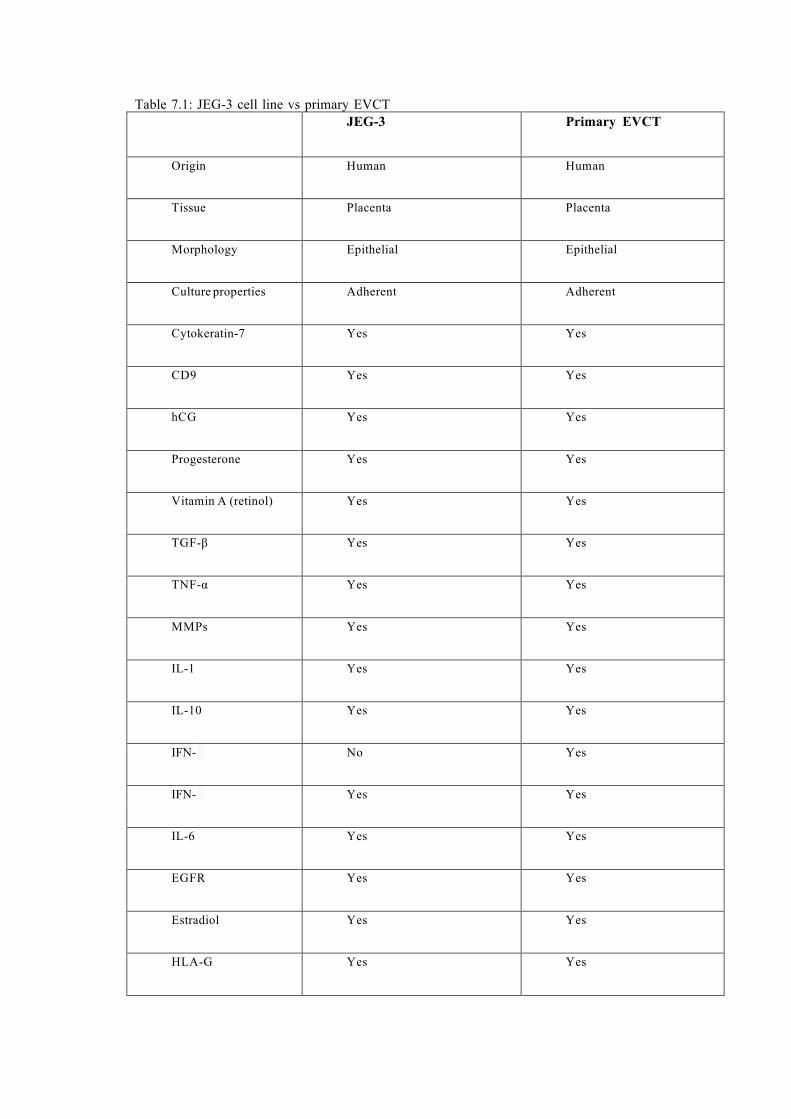
Table 7.1: JEG-3 cell line vs primary EVCT JEG-3 Primary EVCT
Origin Human Human
Tissue Placenta Placenta
Morphology Epithelial Epithelial
Culture properties Adherent Adherent
Cytokeratin-7 Yes Yes
CD9 Yes Yes
hCG Yes Yes
Progesterone Yes Yes
Vitamin A (retinol) Yes Yes
TGF-β Yes Yes
TNF-α Yes Yes
MMPs Yes Yes
IL-1 Yes Yes
IL-10 Yes Yes
IFN- γ No Yes
IFN- α Yes Yes
IL-6 Yes Yes
EGFR Yes Yes
Estradiol Yes Yes
HLA-G Yes Yes

156
Experiments, entailing the careful selection of the cell line(s) to be used for the study, were an
essential starting point. Selecting appropriate cell lines is important to ensure the generation of relevant,
but also extrapolatable results. In addition, these experiments also permitted the characterization of the
cellular phenotype, showing that both, cell line and cells of interest in vivo, shares similar characteristics,
i.e. HLA expression pattern. The selection criteria included whether the cell line being appraised
expressed a similar receptor profile, and if it had a similar response to soluble factors as human primary
trophoblast cells, and if the changes in the expression profile of the cells can be related to those that take
place in the body (Bazer and Salamonsen, 2008). Although cell lines might yield information on
mechanisms of cellular action, there is often the problem of over or under expression of certain factors. In
an in vivo milieu there is a complex balance involving many more factors that can regulate over or under
expression, than can be studied in vitro. Within this context, these experiments remain important, as only
through them can it be determined if the results obtained are indicative of the processes that occur in vivo.
7.3 HLA molecules and their role in human pregnancy
The present investigation has confirmed that HLA-G, HLA-E, HLA-F and HLA-C are all
expressed by the JEG-3 trophoblast, and indirectly the resting EVCT. It also established that there is a
difference between cell-surface and intracellular MHC expression levels, whereby a significantly higher
level of HLA-G, -E and -C is expressed intracellularly than at the surface. HLA-F, was however observed
to be entirely intracellularly expressed, in contrast to the findings of the Shobu group who reported
surface expression of HLA-F on EVCTs, through the use of cell lines (Shobu et al., 2006). Another study
by the Nagamatsu group et al., (2006) reported HLA-F to be restricted to the intracellular level in
cultured EVCTs (Nagamatsu et al., 2006). Our results are in line with those from the Nagamatsu group
however, they observed that HLA-F expression increased with time in culture while our results did not
show that, as it was not the aim of this study. We have focused all our efforts in the detection of
phenotypical changes that take place after treatment with P4 and PIF, and whether any of them were able
to induce a surface expression of HLA-F. Both treatments induced a faint, but significant increase in the
intracellular expression of HLA-F, however none induced a surface expression. We believe that this
discrepancy in surface and intracellular HLA levels is due to the fact that the molecules are retained
157
inside the trophoblast cell until they are required at the cell surface. This may be in part due to a limited
availability of peptides that are able to bind the respective peptide groove, or to the presence of a
regulation point that exists at the intracellular level, or, potentially, at the cell surface. Since HLA-F is not
expressed at the surface level, it may not have any peptides with which to bind, or its function is one that
does not require its expression at the cell surface, like HLA-DM. Our Western blot and flow cytometric
analysis confirmed the translation of these molecules from mRNA to proteins in the studied cell lines.
In the maternal body, prior to implantation, there is an overall downregulation of the majority of
MHC class Ia and II molecules, whose polymorphism and cell surface expression, is neither limited nor
low and restricted like that of the class Ib molecules (Derre et al., 2006). This under-expression of the
MHC proteins should permit the trophoblast to avoid recognition by CTLs. Conversely, the trophoblast
would become vulnerable to uNK cells, which are programmed to identify and destroy any HLA null
cells. However, during implantation and throughout the course of pregnancy, a unique profile of HLAs
(HLA-G, HLA-E, HLA-Fand HLA-C) is expressed, and such an adverse outcome is avoided (Guleria and
Sayegh, 2007). In addition, uNK cells, instead of attacking the trophoblast, are thought to play an
important role in the acceptance of the foetus through their interaction with HLA (Guleria and Sayegh,
2007; Clark et al., 1996). Both the presence, and lack thereof, of these HLAs at the fetomaternal interface
alludes to their importance in maintaining pregnancy, and might represent evolutionary tuning of the
immune function between foetal and maternal tissues to avoid recurrent pregnancy losses.
HLA-G, which was here confirmed to be expressed at highest abundance by our trophoblastic
cellular model, has had several immunomodulatory functions ascribed to it, amongst which are its
inhibition of CTL responses and NK cell functions (Hunt et al., 2006; Hunt et al., 2005; Hunt and Langat,
2009) (Kapasi et al., 2000). HLA-G interaction with its KIR2DL4 receptor, which is located on the uNK
cell’s surface is important, as this triggers a secretion of inflammatory factors, which are important in
promoting the infiltration and vascularisation of the decidua (Long et al., 2013). This interaction is also
reported to protect the trophoblast from cell lysis, through the interaction of HLA-G homodimers with
KIR2DL4 and B2 (ILT2 and ILT4) (Jabeen et al., 2013). Moreover, as this protein preferentially binds
nonamer peptides, and may play a role in presenting viral antigens to T cells, it is also believed to play a
158
role in immunosurveillance during the course of pregnancy (Hunt et al., 2006; Hunt et al., 2005;
Rebmann et al., 2014). Since trophoblast cells express high levels of HLA-G, it was hypothesized that
HLA-G may be the highest expressed HLA in the fetoplacental unit. HLA-G differs from other HLA
proteins in its function. It is the only class I molecule that forms a β2M-associated homodimer, and thus
has a higher avidity to LILRB than to the other ‘conventional’ class I monomeric molecules. It is
believed that such interactions give the trophoblast and the placenta the ability to modulate the local
immune response in the uterus so as to prevent foetal death (Trowsdale and Moffett, 2008). In addition, it
is supposed that HLA-G has a potential role as an immune-regulator. This is related with the expression
of HLA-E. The intracellular form of HLA-G has previously been reported to bind with that of HLA-E,
which leads to an increased level of cell-surface expression of both molecules. HLA-G/HLA-E cell-
surface complexes might have the ability to interact with other inhibitory receptors of NK cells as a
means by which to prevent lysis (Ishitani et al., 2006). In humans, HLA-G is also thought to facilitate the
expression of HLA-E (Allan et al., 2002; Hunt, 2006).
Our investigation had found HLA-E was greatly expressed by the JEG-3 cell line and that high
expression, like that of HLA-G, reflects its importance in pregnancy. The functions of HLA-E at the
fetomaternal interface are thought to be closely related to those of trophoblast-specific HLA-G. A study
by the Shaikly group reported that HLA-E was co-expressed with HLA-G at the surface of the
trophectorderm of preimplantation embryos, suggesting the importance of both these molecules in the
process of implantation (Shaikly et al., 2010). In addition, the co-expression of these molecules means
that without HLA-G, HLA-E would be unsuccessful in producing a successful implantation. It is thus
postulated that HLA-G regulates HLA-E’s expression, hence making it the second highest expressed
HLA by the trophoblast. HLA-E can only bind nonamer peptides derived from the signal sequence of
other HLA class I molecule, notably HLA-G, which seem to both stabilize and increase HLA-E.
Therefore, cell-surface expression of HLA-E will only happen if such a binding occurs, and is thus
dependent upon the availability of a leader sequence (Lee et al., 1998; Llano et al., 1998). Thus a high
HLA-G expression will invariably affect the level of HLA-E expression, and this will result in an
inhibitory effect on the activity of uNK cells. Like HLA-G, HLA-E also interacts with NK cells as it is a
159
ligand for CD94/NKG2 family of receptors that are expressed by these cells, and it is theorized that
HLA-E inhibits cell lysis through this interaction (Jabeen et al., 2013). In addition, it is also postulated
that HLA-G and HLA-E work together to inhibit NK cytotoxicity by interacting with KIR2DL4 and
CD94/NKG2 receptor family respectively, as previous results have reported the two HLAs to be co-
localized (Jabeen et al., 2013).
HLA-F is potentially significant for fetomaternal tolerance, but this molecule has only recently
been well studied. The expression of cell-surface HLA-F has been the subject to debate. The Ishitani
group have reported its surface expression on EVCT in vivo (Ishitani et al., 2003). However, others have
found these cells to be devoid of any HLA-F surface expression (Lepin et al., 2000; Nagamatsu et al.,
2006). The present study found that HLA-F was significantly expressed at the intracellular level, but
without detectable surface expression. This may indicate that HLA-F lacks any immunological function
at the cell surface, at least during the first trimester of pregnancy, and exists during this phase as an empty
heterodimer free of any peptides. The Shobu group have also reported HLA-F cell-surface expression on
extravillous cells during the second trimester, with a noticeable increase in the levels of expression with
the progression of pregnancy (Shobu et al., 2006). A study by the Wainwright group reported HLA-F to
mainly be present in the cytoplasm of peripheral blood cells and cell lines, and not on the surface, which
led them to the conclusion that this protein does not bind any peptides (Wainwright et al., 2000).
However, the Lepin group have contended that HLA-F forms a complex with transporter associated with
antigen processing TAP, thus indicating that this molecule does have the potential to bind to peptides
(Lepin et al., 2000). To date it is still uncertain whether or not HLA-F binds any peptides but is believed
to not be involved in antigen presentation (Ishitani et al., 2006; Djurisic and Hviid, 2014). The techniques
used for the present study did not detect the presence of surface HLA-F during the first trimester; if this
molecule is expressed at the surface its expression level is very low, and undetectable by the methods
used. The study by the Shobu group has however reported surface expression of this molecule during the
second trimester and thereafter (Shobu et al., 2006). This may mean that the translation of HLA-F from
cytoplasm to cell surface is triggered at the second trimester, possibly due to the dominant Th2 cytokine
profile, hence suggesting that surface HLA-F expression is characteristic of the second trimester. It has
160
also been observed that though IFN-γ has the ability to induce the translation of HLA-F, this will not
necessarily result in its cell surface expression (Wainwright et al., 2000).
HLA-C was observed to be expressed at high levels in JEG-3, and ACH-3P cells, and was present
both intracellularly and at the cell surface. The presence of HLA-C is important during pregnancy as it
interacts with KIR, and may serve as a mediator of uNK cell control of the invasion of the trophoblast
(Hiby et al., 2004). Uterine NK cells could affect the ability of the trophoblast to invade and transform
the spiral arteries, by regulating the blood flow to the intervillous space, rather than by acting directly on
the spiral arteries of the uterus. Through the remodelling of the uterus, the placenta is formed and
supported with an adequate blood supply (Moffett and Loke, 2006). HLA-C/KIR interactions that take
place at the fetomaternal interface, are known to be important in the process of placentation, although it is
still not clear why this is (Chazara et al., 2011). One study has demonstrated a higher KIR expression on
uNK cells than on peripheral blood natural killer (pNK) cells from the same woman, which highlights the
importance of KIR/HLA-C interactions in pregnancy (Sharkey et al., 2008). There is also a higher KIR
expression in the earlier stages of pregnancy, and this is seen to decrease as the first trimester progresses
(Verma et al., 1997). Since both KIR and HLA-C are polymorphic, individual pregnancies are
distinguished by different maternal KIR and foetal, HLA-C variant combinations. Certain combinations
of maternal KIR and HLA-C variants, together with foetal HLA-C groups, when over presented, can lead
to defective trophoblast invasion, or an incomplete transformation of arteries, which ultimately leads to
major pregnancy disorders such as pre-eclampsia, or recurrent miscarriages (Hiby et al., 2004; Hiby et
al., 2010). This suggests that HLA-C has a very important role in the process of uterine remodelling and
implantation. HLA-C’s presence at the fetomaternal interface remains a point of controversy, as
compared to the other HLAs expressed here, which are almost invariant, whilst HLA-C is polymorphic
(Trowsdale and Moffett, 2008). Nevertheless, though its presence at the fetomaternal interface remains a
point of great controversy, in pregnancy HLA-C holds an important role in placentation, which if
unsuccessful or incomplete would hinder all ensuing processes that take place in foetal development
(Chazara et al., 2011; Parham et al., 2012).
161
Studies investigating the cytokine profile of EVCT in vitro during the first trimester have showed a
clear predominance of the different cytokines, namely IL-1β, TGF-β, IL-8, IL-10, IL-12, and GM-SCF.
In our study, we observed that TNF-α was detected above the threshold level in untreated JEG-3 cells.
We believe that the values that we detected for TNF-α were related with the reality as previous results
showed that JEG-3 cells could secrete TNF-α. All the repetitions showed the same results. This
observation is in line with previous studies that have reported the first trimester of pregnancy as being a
Th1 dominated period (Saito et al., 2010; Wilczynski, 2005; Saito, 2000).
In pregnancy, cytokines are important as modulators of the maternal immune system. They also act
as autocrine factors and aid in orchestrating the events of early pregnancy. During pregnancy, HLAs
expressed at the fetomaternal interface are affected by and affect the cytokines present in this
environment. A tightly regulated cytokine balance during pregnancy, especially during the earliest stages,
is believed to be essential in promoting survival of the foetus (Saito et al., 2010; Wilczynski, 2005). A
dominant Th1 profile is required during the first trimester, especially during the earlier period, as this is
when the crucial events of placentation and implantation take place.
In this study, IL-10 was found to be significantly elevated in the JEG-3 cell line. Although this
cytokine is often referred to as a Th2 cytokine, it can be postulated that its high expression levels in first
trimester cultured trophoblast cells suggests otherwise: IL-10 may be secreted by both Th1 and Th2 cells,
and depending on the stage of pregnancy at which it is secreted, it is believed to have different functions
(Sanjabi et al., 2009a). Previous studies have suggested that IL-10 is a key contributor in establishing a
fine balance between pro- and anti-inflammatory signals, which are responsible for a successful
pregnancy (Simpson et al., 1998; Thaxton and Sharma, 2010). In addition, the presence of IL-10 is
important as it is reported to enhance HLA-G transcription in human first trimester cultured trophoblast,
thereby regulating the expression of HLA-G levels (Moreau et al., 1999; Rizzo et al., 2005; Roth et al.,
1996). This may be important in that if HLA-G levels are low, this cytokine can be administered as a way
of increasing them, hence providing a more favourable environment for the foetus through regulation of
HLA-G.
162
The pro-inflammatory cytokines IL-1β, TGF-β1, IL-8, IFN-γ, and GM-SCF, were also found to be
significantly expressed in the JEG-3 cell line. Detection of significantly high IL-1β levels is in agreement
with earlier studies that have confirmed the presence of IL-1β in the human placenta (Jokhi et al., 1997).
This suggesting that this cytokine, is produced by both the placental and the uterine cells. The detection
of this cytokine indicates that this synthetic ability is not lost with the malignant transformation of the
trophoblast cell, once more reinforcing the use of the JEG-3 cell line as a good model by which to study
the interactions that take place at the fetomaternal interface. TGF-β1 was also detected at significantly
high levels, showing that this cytokine is secreted by JEG-3 cells, and presumably by primary trophoblast
cells. The presence of this cytokine in the first trimester is important, since TGF-β1 is reported to inhibit
the proliferation and invasion of the trophoblast by up-regulating integrin expression. Regulation of these
two processes is essential if the blastocyst is to successfully implant itself in the uterus. IFN-γ, a potent
cytokine, is an inductor of Th1 responses. We believe its presence at the fetomaternal interface is
important, as it will help in the process of embryo implantation, but more importantly it can modulate the
expression of HLAs at this site. This theory is supported by previous studies that established that IFN-γ
has the ability to induce the formation of a nuclear-binding protein, which in turn binds to class I
regulatory sequences, and hence decreases the expression of MHC class II whilst increasing that of MHC
class I antigens (Choudhury and Knapp, 2001; Brown et al., 1993). TNF-α, a prominent inflammatory
cytokine, was tested for in this study, but no detectable levels were found. It is believed that this is due to
the effects of this cytokine, which are up-regulation of T cell proliferation and NK cell activity (Gordon
and Wofsy, 1990; Zingoni et al., 2005; Melero et al., 2013). For pregnancy to proceed normally, both
effects require to be limited during the first trimester.
Just as cytokines can influence HLA expression by trophoblast cells, the interactions that take
place between HLA proteins can also effect the secretion of cytokines. In addition, HLAs may also hold a
pivotal role in regulating the interactions that take place between factors such as cytokines and NK cells.
One such consequence of HLA-E and HLA-G association that takes place at the fetomaternal interface is
a surge in the release of cytokines. Such an effect on the cytokine profile is important as it may regulate
the process of placentation (Baergen et al., 1994; Szukiewicz et al., 2014).
163
7.4 Soluble factors at the fetomaternal interface
The fetomaternal interface is a site of simultaneous interactions that all work in unison to ensure a
successful outcome of pregnancy. At this site, both the mother and the foetus release factors not only to
ensure their own survival, but also to promote the well-being of the other party. A prime example of such
a scenario involves the progesterone hormone and the PIF peptide. Progesterone, which is secreted by the
mother and the placenta, and PIF, which is secreted by the embryo, in this report, have both been
observed to regulate the uterine environment and the placenta so as to ensure a healthy and problem-free
pregnancy through their regulation of HLAs and cytokines.
The results obtained in this study demonstrate that, upon stimulation of JEG-3 cells with either
progesterone or PIF, a change in HLAs and cytokine profiles takes place. Progesterone caused an
overexpression of HLAs both at the intracellular and the cell surface level of the JEG-3 cells, as did PIF
stimulation. As was previously seen with the unstimulated JEG-3 cell HLA profile, even after
stimulation, HLA-G remained that which was the highest expressed. Therefore, although progesterone
and PIF have the ability to solicit an overexpression in HLAs profile, they do not change the relative
proportion of each HLA subtype. This regulation of the trophoblast HLA profile by soluble factors is
important, since it highlights their significance in both the establishment and maintenance of pregnancy.
In addition, the fact that an increase in HLAs, but not the sequence (meaning HLA-G was still that most
expressed by the JEG-3 cell followed by HLA-E, -C and -F), resulted from progesterone or PIF
treatment, also highlights that the effect of either soluble factor does not change the importance of each
individual HLA in pregnancy. This is indicated in that HLA-G endures as the most important HLA.
Progesterone and PIF have a similar effect on soluble factors associated with normal pregnancy.
Both cause the overexpression of HLA molecules expressed by the trophoblast and an increase in
cytokine secretion, as shown by the investigations herein. It can be said that having both PIF and
progesterone carry out the same functions is redundant. The reason why PIF fulfils the similar functions
as progesterone might be explained by the fact that PIF is secreted as early as the two-cell stage (Barnea
et al., 2012a; Barnea et al., 2012b; Roussev et al., 2013), whereas progesterone is only secreted by the
placenta at around 12 weeks of pregnancy; before that progesterone is secreted by the corpus luteum
164
(Szekeres-Bartho and Balasch, 2008; Szekeres-Bartho et al., 2008; Okabe et al., 2014; Szekeres-Bartho,
2002). In the earlier weeks of pregnancy, progesterone is secreted by the corpus luteum at relatively low
levels, at 32.5 ng/ml (Shah and Nagarajan, 2013). Therefore, for progesterone to fulfil its role as an
immunomodulator, and to carry out its role in pregnancy, its concentration has to be higher. It is proposed
that this is achieved through PIF, which increases the expression of progesterone receptors, as was
observed during the 2-DE study. Increasing the cell’s sensitivity to progesterone will result in an increase
in its uptake and assimilation. Pregnancy cannot be achieved without the presence of the progesterone
(Szekeres-Bartho and Balasch, 2008; Szekeres-Bartho et al., 2008; Okabe et al., 2014). This point raises
the question of why its levels are not higher from the onset of pregnancy. The delayed
secretion/production of progesterone by the placenta can be taken to indicate that PIF functions as a
complementary factor to progesterone. PIF is secreted before implantation and throughout pregnancy,
and displays multi-targeted effects (Paidas et al., 2010). Some of these effects are: its role in embryo
invasion and implantation, the remodelling of the uterus and blocking of peripheral mononuclear blood
cells activation (Stamatkin et al., 2011a; Roussev et al., 2013; Moindjie et al., 2014; Barnea et al., 2015;
Barnea et al., 2014). This study, in addition, has shown that PIF can regulate HLA profile. It can be
proposed that, firstly, PIF is able to carry out the same functions as progesterone, allowing time for this
hormone to take effect and to be produced in concentrations that are high enough to maintain a normal
pregnancy. In addition, it can also be speculated that the reason why PIF is secreted as early as the two-
cell stage, is that at that time this peptide can prepare the uterus for the process of pregnancy (Stamatkin
et al., 2011a; Barnea, 2001; Roussev et al., 1996; Moindjie et al., 2014). PIF is secreted from the time
prior implantation (Roussev et al., 1996). It can thus be said that this is the embryo’s first line of defence
against the hostile maternal environment, since PIF will guarantee proper invasion, implantation, and
establishment of a blood supply to the embryo.
It can be argued that PIF and progesterone do not carry out the same functions, but that one of
them, PIF, supplements the effects of progesterone. The effect of PIF, a 15 amino acid (Duzyj et al.,
2010), on the maternal immune system, is presumably more expidative than that of progesterone, which
is substantially larger in size. In addition, due to the size of progesterone, the process of transcribing the
165
gene, processing the primary RNA, translating it and folding it into a protein, transporting it to the Golgi
where the hydrocarbons are added, and then sending it to the membrane for secretion into the intracellular
space or the blood stream, will take a considerable amount of time than it will for PIF. Furthermore, since
PIF, is produced by the foetus, it does not need to be transported to the foetus to carry out its function.
The process of trophoblast invasion shares several biochemical mechanisms with tumour invasion
(Karmakar et al., 2004). However, unlike the latter, trophoblast invasion is a tightly regulated process,
involving factors such as cytokines and growth factors in the peri-implantation uterine milieu (Bischof et
al., 2000b; Halasz and Szekeres-Bartho, 2013; Murphy et al., 2006).
Cytokine presence is important at the fetomaternal interface, and as observed through this study,
can be regulated by soluble factors, namely progesterone and PIF. Both progesterone and PIF were seen
to increase the secretion of the pro-inflammatory cytokines, and even induce the expression of certain
pro-inflammatory cytokines, reported to be secreted by trophoblast. By increasing the pro-inflammatory
cytokine IL-1, whilst keeping its increase tightly controlled, PIF and progesterone are able to ensure
proper invasion and implantation of the embryo. In addition, since IL-1 stimulates trophoblast synthesis
of hCG hormone, the increase in this interleukin will have a positive effect on the state of pregnancy
(Jokhi et al., 1997). Regulation of the cytokine profile in trophoblasts by progesterone and PIF
accentuates their role in regulating cytokines to ensure survival of the foetus. Progesterone has been
reported to block IL-12 production, so as to inhibit NK activation (Szekeres-Bartho, 2008; Szekeres-
Bartho et al., 1996). In addition, by doing so, progesterone is able to ensure proper cell invasion and
motility, since IL-12 reduces the level of both (Karmakar et al., 2004). Furthermore, it can be said that
the fetomaternal relationship is not just one in which the maternal system has to tolerate a foreign body,
but is actually a succession of cytokine interactions that serve to guide selective immune regulation. The
implicated cytokines also mediate apposition of the blastocyst to the uterus and vascularisation of the
placenta. Progesterone and PIF were found to induce the secretion anti-inflammatory cytokines by the
trophoblast. This is important, because these cytokines could suppress cell-mediated immunity, guarding
against maternal rejection of the embryo. Increased secretion of Th2 cytokines may be a mechanism by
which progesterone and PIF suppress cell-mediated immunity in the endometrium, and instead favour the
166
state of pregnancy and enhance embryonic implantation. Trophoblastic invasion is somewhat dependent
on the local milieu’s cytokine and growth factor profile, which control this process (Zourbas et al., 2001).
The enhanced cytokine profile induced by progesterone and PIF thus promotes it. It was observed that
both soluble factors increased invasion onto the Matrigel, which was used as a representative of the
endometrium, by JEG-3 cells, with PIF causing a more significant increase in invasion than progesterone.
PIF enhancement of invasion over progesterone may possibly be due to its earlier expression, or its
increased concentration in comparison to progesterone during the first few weeks of pregnancy. PIF was
found to be secreted at concentrations ranging from 25-100 nM and 150-250 nM (Duzyj et al., 2010).
Progesterone, which at this stage is still secreted by the corpus luteum, is only present at a concentration
of 32.5 ng/ml or 103.5 nM/l. Invasion, and subsequently uterine spiral artery remodelling, are important
processes in pregnancy, permitting the embryo to implant itself and lowering maternal vascular
resistance. They also increase the uteroplacental blood flow (Cui et al., 2012). Without proper invasion,
or remodelling of the uterus, major complications, such as pre-eclampsia will eventually arise, this being
a leading cause of maternal death (Lyall et al., 2001).
It was observed that PIF, and other factors, including IL-17, can induce the secretion of
progesterone by the placenta. Regulation of progesterone secretion by IL-17 is implemented by means of
a receptor, which is present in the JEG-3 cells. The IL-17 receptor has been characterised in trophoblast
cells (Pongcharoen and Supalap, 2009). Though an increase of progesterone secretion, as a result of PIF,
has been observed, the process by which this occurs has not been characterized. However, given the
above facts, it can be hypothesized that the trophoblast cell is equipped with a PIF receptor.
Progesterone and PIF have been demonstrated to have the capacity to modulate the cell proteome,
as has been observed through this study. This study also strengthens a previous study from the Paidas
group in 2010 where they studied, using microarrays, the genomic changes induced by PIF, but without
any further analysis (Paidas et al., 2010). Through our 2-DE studies, it was observed that both
progesterone and PIF caused 22 of the identified proteins to be differentially expressed. Both caused a
significant change in the proteins in comparison to the resting JEG-3 proteome. Further comparison
between the JEG-3 proteome and the PIF-stimulated cell proteome showed that PIF has the ability to
167
orchestrate/coordinate the maternal immune system without any detrimental effects. The effects of PIF on
trophoblasts, observed through stringent proteome analysis, showed that this peptide has interdependent
effects on the immune, apoptotic, adhesion, proliferative, biological, response to stimulus and
communication processes in the trophoblastic cell. The biological components of some of the
differentially expressed proteins identified in this study are from the same family, or are related to those
that have been previously identified by the Paidas group (Paidas et al., 2010). These proteins include
different chaperones (BAG2, BAG), heat shock proteins (HSPB1 vs. HSP70 and HSP4L), proteins/genes
that are related to ribosomes (RPS23 40S, RPL26 60S) and cytoskeletal proteins (LMNA, G3P). While
the Paidas group addressed, namely the genomic profile of human endometrial cells, which released
factors that work on the embryo in a paracrine manner, the current study addressed the proteome of
trophoblasts, in which soluble factors work in an autocrine manner. These work on the trophoblast itself.
The proteomic data derived from this study significantly advances the understanding of PIF’s multi-
targeted effects in regulating immunity.
This investigation is important in that it furthers the medical field of reproductive immunology.
PIF is secreted as early as the two-cell stage, and only by viable embryos (Stamatkin et al., 2011a;
Stamatkin et al., 2011b). Thus, it could serve as an important marker that could be employed to select the
best embryos to implant in the IVF context. In addition, progesterone and PIF have the capacity to
modulate the immune system, and thus could be used to sustain pregnancy in the event of a pregnancy
complication. Both have been observed to have the ability to increase the cytokine and HLA profile, and
at the start of a pregnancy, both assist proper invasion and implantation of the embryo.
Pregnancy cogently portrays the interactions between two different and genetically unique tissues,
those that have a foetal origin and those with a uterine origin. This study sought to advance understanding
of the function of soluble factors at the fetomaternal interface, focussing on that of progesterone and PIF.
It was observed that PIF and progesterone are pivotal in:
1. Regulating local uterine immunity.
2. Promoting trophoblast invasion and proliferation.

168
3. Regulating adaptive processes related to the pre-implantation stage and the whole of
pregnancy.

CHAPTER VIII. FUTURE WORK
CHAPTER VIII
FUTURE WORK


8.1 Introduction
The immune tolerance that is offered to the foetus by the maternal host is indispensable if a healthy
pregnancy is to happen. Nowhere else in the body is this immune tolerance of the foetus by the mother
more important than at the site of the fetomaternal interface, and the interactions that take place at this
site are ones of extreme importance. Several key components have been identified as being crucial in
supplying this tolerance. The major histocompatibility complex, one of the key players in establishing
this tolerance, and the soluble factors that affect these proteins expression were studied in this
investigation, and different mechanisms by which tolerance is offered were proposed.
It is believed that the results generated in this study, and new data, which will be obtained
through future work, will provide novel insights into the fetomaternal relationship and to how tolerance is
established at this site. In addition, this data may also aid in preventing spontaneous abortions, as soluble
factors that aid in maintaining a healthy pregnancy can be monitored and corrected if unsuitable.
The results that have been presented here showed the effectiveness of the JEG-3 cell line in
studying the role of soluble factors affecting the MHC class I molecules and other processes (cell
proliferation, invasion, etc), at the fetomaternal interface, this study could be furthered in a number of
ways.
8.2 Using a primary trophoblast cell line
The use of a primary cell line would further this study as primary trophoblasts would allow us to
further confirm the results that we have collected using the JEG-3 cell line. In addition, the use of
primary trophoblasts would also be advantageous as the cells would not have any choriocarcinomic
characteristics, hence the responses seen would be closer to what is seen in vivo. To obtain primary
trophoblast cells, we would have to isolate them from human embryos, which would require a specific
protocol and authorisation, and work conditions, in addition to ethical approval which would have to be
obtained from both the University of Essex ethical committee and the Human Fertilisation and
Embryology Authority. Once this is done, we would then have to work with special culture conditions,

172
and to confirm the results reported in this thesis, we would carry out the same experiments (under the
same conditions) using primary trophoblast cells to see if the same responses would be seen.
8.3 2-DE validation studies
The proteins that were identified through the 2-DE experiments should be validated using specific
antibodies and techniques such as that of the Western blot, so as to investigate the importance of each of
the proteins.

CHAPTER IX. REFERENCES
CHAPTER IX
REFERENCES
1. Abrahams VM, Kim YM, Straszewski SL, Romero R, Mor G. Macrophages and apoptotic cell clearance during pregnancy. Am J Reprod Immunol 2004; 51(4): 275-82.
2. Adinolfi M. Production of immunosuppressor factor(s) by preimplantation human embryos. Am J Reprod Immunol Microbiol 1988; 17(4): 156-7.
3. Afanas'eva MA, Izvol'skaya MS, Voronova SN, Zakharova LA, Melnikova VI. Effect of serotonin deficiency on the immune system development in the rat. Dokl Biol Sci 2009; 427: 319-21.
4. Ahern GP. 5-HT and the immune system. Current opinion in pharmacology 2011; 11(1): 29-33. 5. Akdis CA, Blesken T, Wymann D, Akdis M, Blaser K. Differential regulation of human T cell
cytokine patterns and IgE and IgG4 responses by conformational antigen variants. European journal of immunology 1998; 28(3): 914-25.
6. Albini A, Allavena G, Melchiori A, Giancotti F, Richter H, Comoglio PM, Parodi S, Martin GR, Tarone G. Chemotaxis of 3T3 and SV3T3 cells to fibronectin is mediated through the cell-attachment site in fibronectin and a fibronectin cell surface receptor. J Cell Biol 1987a; 105(4): 1867-72.
7. Albini A, Iwamoto Y, Kleinman HK, Martin GR, Aaronson SA, Kozlowski JM, McEwan RN.. A rapid in vitro assay for quantitating the invasive potential of tumor cells. Cancer Res 1987b; 47(12): 3239-45.
8. Albrecht ED, Pepe GJ. Central integrative role of oestrogen in modulating the communication between the placenta and fetus that results in primate fecal-placental development. Placenta 1999; 20(2-3): 129-39.
9. Allan DS, Lepin EJ, Braud VM, O'Callaghan CA, McMichael AJ. Tetrameric complexes of HLA-E, HLA-F, and HLA-G. Journal of immunological methods 2002; 268(1): 43-50.
10. al-Sebai MA, Kingsland CR, Diver M, Hipkin L, McFadyen IR. The role of a single progesterone measurement in the diagnosis of early pregnancy failure and the prognosis of fetal viability. Br J Obstet Gynaecol 1995; 102(5): 364-9.
11. Amenta F, Vega JA, Ricci A, Collier WL. Localization of 5-hydroxytryptamine-like immunoreactive cells and nerve fibers in the rat female reproductive system. Anat Rec 1992; 233(3): 478-84.
12. Aplin JD, Kimber SJ. Trophoblast-uterine interactions at implantation. Reproductive biology and endocrinology : RB&E 2004; 2: 48.
13. Apps R, Gardner L, Sharkey AM, Holmes N, Moffett A. A homodimeric complex of HLA-G on normal trophoblast cells modulates antigen-presenting cells via LILRB1. European journal of immunology 2007; 37(7): 1924-37.
14. Arck P. [Stress and embryo implantation]. J Gynecol Obstet Biol Reprod (Paris) 2004; 33(1 Pt 2): S40-2.
15. Arkaravichien W, Kendle KE. Critical progesterone requirement for maintenance of pregnancy in ovariectomized rats. J Reprod Fertil 1990; 90(1): 63-70.
16. Ashkar AA, Croy BA. Interferon-gamma contributes to the normalcy of murine pregnancy. Biol Reprod 1999; 61(2): 493-502.
17. Azar Y, Shainer R, Almogi-Hazan O, Bringer R, Compton SR, Paidas MJ, Barnea ER, Or R. Preimplantation factor reduces graft-versus-host disease by regulating immune response and lowering oxidative stress (murine model). Biol Blood Marrow Transplant 2013; 19(4): 519-28.
18. Baergen R, Benirschke K, Ulich TR. Cytokine expression in the placenta. The role of interleukin 1 and interleukin 1 receptor antagonist expression in chorioamnionitis and parturition. Arch Pathol Lab Med 1994; 118(1): 52-5.
19. Barnea ER. Embryo maternal dialogue: From pregnancy recognition to proliferation control. Early pregnancy 2001; 5(1): 65-6.
20. Barnea ER. Applying embryo-derived immune tolerance to the treatment of immune disorders. Ann N Y Acad Sci 2007; 1110: 602-18.
21. Barnea ER, Kirk D, Paidas MJ. PreImplantation Factor (PIF) promoting role in embryo implantation: increases endometrial Integrin-alpha2beta3, amphiregulin and epiregulin while reducing betacellulin expression via MAPK in decidua. Reproductive biology and endocrinology : RB&E 2012a; 10: 50.
175
22. Barnea ER, Kirk D, Ramu S, Rivnay B, Roussev R, Paidas MJ. PreImplantation Factor (PIF) orchestrates systemic antiinflammatory response by immune cells: effect on peripheral blood mononuclear cells. Am J Obstet Gynecol 2012b; 207(4): 313 e1- e11.
23. Barnea ER, Kirk D, Todorova K, McElhinney J, Hayrabedyan S, Fernandez N. PIF direct immune regulation: Blocks mitogen-activated PBMCs proliferation, promotes TH2/TH1 bias, independent of Ca(2+). Immunobiology 2015; 220(7): 865-75.
24. Barnea ER, Lubman DM, Liu YH, Absalon-Medina V, Hayrabedyan S, Todorova K, Gilbert RO, Guinjab J, Barder TJ. Insight into PreImplantation Factor (PIF*) mechanism for embryo protection and development: target oxidative stress and protein misfolding (PDI and HSP) through essential RIPK binding site. PLoS One 2014; 9(7): e100263.
25. Barrera D, Avila E, Diaz L. [Immunological role of progesterone in the maintenance of pregnancy]. Rev Invest Clin 2007; 59(2): 139-45.
26. Bartel DP. MicroRNAs: target recognition and regulatory functions. Cell 2009; 136(2): 215-33. 27. Basu B, Desai R, Balaji J, Chaerkady R, Sriram V, Maiti S, Panicker MM. Serotonin in pre-
implantation mouse embryos is localized to the mitochondria and can modulate mitochondrial potential. Reproduction 2008; 135(5): 657-69.
28. Bazer FW, Salamonsen LA. Let's validate those cell lines. Biol Reprod 2008; 79(3): 585. 29. Beigi RH, Yudin MH, Cosentino L, Meyn LA, Hillier SL. Cytokines, pregnancy, and bacterial
vaginosis: comparison of levels of cervical cytokines in pregnant and nonpregnant women with bacterial vaginosis. J Infect Dis 2007; 196(9): 1355-60.
30. Berg JM, Tymoczko JL, Stryer L. Immunology Provides Important Techniques with Which to Investigate Proteins. Biochemistry, 5th edition: W H Freeman; 2002.
31. Bernard J. [The discovery of the principal histocompatibility system in man]. Presse Med 1967; 75(47): 2369.
32. Billingham RE. Transplantation Immunity and the Maternal-Fetal Relationship. Trans Stud Coll Physicians Phila 1964a; 31: 187-203.
33. Billingham RE. Transplantation Immunity and the Maternal-Fetal Relation. The New England journal of medicine 1964b; 270: 667-72 CONTD.
34. Billingham RE. Transplantation Immunity and the Maternal-Fetal Relation. The New England journal of medicine 1964c; 270: 720-5 CONCL.
35. Billington WD. The immunological problem of pregnancy: 50 years with the hope of progress. A tribute to Peter Medawar. J Reprod Immunol 2003; 60(1): 1-11.
36. Bischof P, Meisser A, Campana A. Mechanisms of endometrial control of trophoblast invasion. J Reprod Fertil Suppl 2000a; 55: 65-71.
37. Bischof P, Meisser A, Campana A. Paracrine and autocrine regulators of trophoblast invasion--a review. Placenta 2000b; 21 Suppl A: S55-60.
38. Blais ME, Dong T, Rowland-Jones S. HLA-C as a mediator of natural killer and T-cell activation: spectator or key player? Immunology 2011; 133(1): 1-7.
39. Blaschitz A, Hutter H, Dohr G. HLA Class I protein expression in the human placenta. Early pregnancy 2001; 5(1): 67-9.
40. Bond CP, Parry LJ, Samuel CS, Gehring HM, Lederman FL, Rogers PA, Summers RJ. Increased expression of the relaxin receptor (LGR7) in human endometrium during the secretory phase of the menstrual cycle. Ann N Y Acad Sci 2005; 1041: 136-43.
41. Bonnin A, Levitt P. Fetal, maternal, and placental sources of serotonin and new implications for developmental programming of the brain. Neuroscience 2011; 197: 1-7.
42. Borges L, Cosman D. LIRs/ILTs/MIRs, inhibitory and stimulatory Ig-superfamily receptors expressed in myeloid and lymphoid cells. Cytokine Growth Factor Rev 2000; 11(3): 209-17.
43. Borrego F, Masilamani M, Kabat J, Sanni TB, Coligan JE. The cell biology of the human natural killer cell CD94/NKG2A inhibitory receptor. Molecular immunology 2005; 42(4): 485-8.
44. Bose R, Cheng H, Sabbadini E, McCoshen J, MaHadevan MM, Fleetham J. Purified human early pregnancy factor from preimplantation embryo possesses immunosuppresive properties. Am J Obstet Gynecol 1989; 160(4): 954-60.
45. Bowen JM, Chamley L, Keelan JA, Mitchell MD. Cytokines of the placenta and extra-placental membranes: roles and regulation during human pregnancy and parturition. Placenta 2002; 23(4): 257-73.
176
46. Boyington JC, Brooks AG, Sun PD. Structure of killer cell immunoglobulin-like receptors and their recognition of the class I MHC molecules. Immunol Rev 2001; 181: 66-78.
47. Bradford HF, Richards CD. Specific release of endogenous glutamate from piriform cortex stimulated in vitro. Brain research 1976; 105(1): 168-72.
48. Brandt C, Pedersen BK. The role of exercise-induced myokines in muscle homeostasis and the defense against chronic diseases. Journal of biomedicine & biotechnology 2010; 2010: 520258.
49. Brennecke J, Stark A, Russell RB, Cohen SM. Principles of microRNA-target recognition. PLoS Biol 2005; 3(3): e85.
50. Brierley J, Clark DA. Characterization of hormone-dependent suppressor cells in the uterus of mated and pseudopregnant mice. J Reprod Immunol 1987; 10(3): 201-17.
51. Brown AM, Wright KL, Ting JP. Human major histocompatibility complex class II-associated invariant chain gene promoter. Functional analysis and in vivo protein/DNA interactions of constitutive and IFN-gamma-induced expression. J Biol Chem 1993; 268(35): 26328-33.
52. Bulmer JN. Decidual cellular responses. Curr Opin Immunol 1989; 1(6): 1141-7. 53. Challis JRG, Matthews SG, Gibb W, Lye SJ. Endocrine and paracrine regulation of birth at term and
preterm. Endocr Rev 2000; 21(5): 514-50. 54. Chaouat G. Reconsidering the Medawar paradigm placental viviparity existed for eons, even in
vertebrates; without a "problem": Why are Tregs important for preeclampsia in great apes? J Reprod Immunol 2015.
55. Chaouat G, Ledee-Bataille N, Chea KB, Dubanchet S. Cytokines and implantation. Chem Immunol Allergy 2005; 88: 34-63.
56. Carosella ED, Moreau P, Aractingi S, Rouas-Freiss N. HLA-G: a shield against inflammatory aggression. Trends Immunol 2001; 22(10): 553-5.
57. Chazara O, Xiong S, Moffett A. Maternal KIR and fetal HLA-C: a fine balance. J Leukoc Biol 2011; 90(4): 703-16.
58. Choudhury SR, Knapp LA. Human reproductive failure I: immunological factors. Human reproduction update 2001; 7(2): 113-34
59. Chow AY, Unternaehrer JJ, Mellman I. Chapter 2 - MHC Class II. In: Thomson MTLW, ed. Measuring Immunity. London: Academic Press; 2005: 12-22.
60. Chrambach A, Rodbard D. Polyacrylamide gel electrophoresis. Science 1971; 172(3982): 440-51. 61. Chumbley G, King A, Robertson K, Holmes N, Loke YW. Resistance of HLA-G and HLA-A2
transfectants to lysis by decidual NK cells. Cellular immunology 1994; 155(2): 312-22. 62. Clark DE, Smith SK, Sharkey AM, Charnock-Jones DS. Localization of VEGF and expression of its
receptors flt and KDR in human placenta throughout pregnancy. Hum Reprod 1996; 11(5): 1090-8. 63. Cloez-Tayarani I, Changeux JP. Nicotine and serotonin in immune regulation and inflammatory
processes: a perspective. J Leukoc Biol 2007; 81(3): 599-606. 64. Cole LA, Khanlian SA, Sutton JM, Davies S, Stephens ND. Hyperglycosylated hCG (invasive
trophoblast antigen, ITA) a key antigen for early pregnancy detection. Clin Biochem 2003; 36(8): 647-55.
65. Colonna M. Immunology. Unmasking the killer's accomplice. Nature 1998; 391(6668): 642-3. 66. Colucci F, Moffett A, Trowsdale J. Medawar and the immunological paradox of pregnancy: 60 years
on. European journal of immunology 2014; 44(7): 1883-5. 67. Complete sequence and gene map of a human major histocompatibility complex. The MHC
sequencing consortium. Nature 1999; 401(6756): 921-3. 68. Cooper SH, Broxmeyer HE. Measurement of interleukin 3 and other hematopoietic cytokines, such
as GM-CSF, G-CSF, M-CSF, erythropoietin, steel factor, and Flt-3 ligand. Curr Protoc Immunol 2001; Chapter 6: Unit 6 4.
69. Cote F, Fligny C, Bayard E, Launay JM, Gershon MD, Mallet J, Vodjdani G. Maternal serotonin is crucial for murine embryonic development. Proc Natl Acad Sci U S A 2007; 104(1): 329-34.
70. Coulam CB, Roussev RG, Thomason EJ, Barnea ER. Preimplantation factor (PIF) predicts subsequent pregnancy loss. Am J Reprod Immunol 1995; 34(2): 88-92.
71. Crowther JR. ELISA - Theory and Practice: Springer; 1995. 72. Croy BA, Chantakru S, Esadeg S, Ashkar AA, Wei Q. Decidual natural killer cells: key regulators of
placental development (a review). J Reprod Immunol 2002; 57(1-2): 151-68.
177
73. Cui Y, Wang W, Dong N, Lou J, Srinivasan DK, Cheng W, Huang X, Liu M, Fang C, Peng J, Chen S, Wu S, Liu Z, Dong L, Zhou Y, Wu Q. Role of corin in trophoblast invasion and uterine spiral artery remodelling in pregnancy. Nature 2012; 484(7393): 246-50.
74. Cunningham F, Leveno K, Bloom S, Hauth J, Rouse D, Spong C. Williams Obstetrics: 23rd Edition: McGraw-Hill Education; 2009.
75. Dahl M, Hviid TV. Human leucocyte antigen class Ib molecules in pregnancy success and early pregnancy loss. Human reproduction update 2012; 18(1): 92-109.
76. Dancis J. The Role of the Placenta in Fetal Survival. Pediatr Clin North Am 1965; 12: 477-92. 77. Davies CJ. Why is the fetal allograft not rejected? J Anim Sci 2007; 85(13 Suppl): E32-5. 78. Davis DM, Reyburn HT, Pazmany L, Chiu I, Mandelboim O, Strominger JL. Impaired spontaneous
endocytosis of HLA-G. European journal of immunology 1997; 27(10): 2714-9. 79. Dealtry GB, Clark DE, Sharkey A, Charnock-Jones DS, Smith SK. Expression and localization of the
Th2-type cytokine interleukin-13 and its receptor in the placenta during human pregnancy. Am J Reprod Immunol 1998; 40(4): 283-90.
80. Deniz G, Christmas SE, Brew R, Johnson PM. Phenotypic and functional cellular differences between human CD3- decidual and peripheral blood leukocytes. J Immunol 1994; 152(9): 4255-61.
81. Derre L, Corvaisier M, Charreau B, Moreau A, Godefroy E, Moreau-Aubry A, Jotereau F, Gervos N. Expression and release of HLA-E by melanoma cells and melanocytes: potential impact on the response of cytotoxic effector cells. J Immunol 2006; 177(5): 3100-7.
82. Djurisic S, Hviid TV. HLA Class Ib Molecules and Immune Cells in Pregnancy and Preeclampsia. Frontiers in immunology 2014; 5: 652.
83. Druckmann R, Druckmann MA. Progesterone and the immunology of pregnancy. The Journal of steroid biochemistry and molecular biology 2005; 97(5): 389-96.
84. Du MR, Wang SC, Li DJ. The integrative roles of chemokines at the maternal-fetal interface in early pregnancy. Cellular & molecular immunology 2014; 11(5): 438-48.
85. Dube F, Amireault P. Local serotonergic signaling in mammalian follicles, oocytes and early embryos. Life sciences 2007; 81(25-26): 1627-37.
86. Duzyj CM, Barnea ER, Li M, Huang SJ, Krikun G, Paidas MJ. Preimplantation factor promotes first trimester trophoblast invasion. Am J Obstet Gynecol 2010; 203(4): 402 e1-4.
87. Einspanier A, Müller D, Lubberstedt J, Bartsch O, Jurdzinski A, Fuhrmann K, Ivell R. Characterization of relaxin binding in the uterus of the marmoset monkey. Molecular human reproduction 2001; 7(10): 963-70.
88. Erlebacher A. Immunology of the maternal-fetal interface. Annu Rev Immunol 2013a; 31: 387-411. 89. Ekman-Ordeberg G, Dubicke A. Preterm Cervical Ripening in humans. Facts Views Vis Obgyn 2012;
4(4): 245-53. 90. Engvall E, Perlmann P. Enzyme-linked immunosorbent assay (ELISA). Quantitative assay of
immunoglobulin G. Immunochemistry 1971; 8(9): 871-4. 91. Erlebacher A. Mechanisms of T cell tolerance towards the allogeneic fetus. Nature reviews
Immunology 2013b; 13(1): 23-33. 92. Faas MM, Spaans F, De Vos P. Monocytes and macrophages in pregnancy and pre-eclampsia.
Frontiers in immunology 2014; 5: 298. 93. Faust Z, Laskarin G, Rukavina D, Szekeres-Bartho J. Progesterone-induced blocking factor inhibits
degranulation of natural killer cells. Am J Reprod Immunol 1999; 42(2): 71-5. 94. Feinshtein V, Ben-Zvi Z, Sheiner E, Amash A, Sheizaf B, Holcberg G. Progesterone levels in
cesarean and normal delivered term placentas. Archives of gynecology and obstetrics 2010; 281(3): 387-92.
95. Fogh J, Fogh JM, Orfeo T. One hundred and twenty-seven cultured human tumor cell lines producing tumors in nude mice. J Natl Cancer Inst 1977; 59(1): 221-6.
96. Frank HG, Gunawan B, Ebeling-Stark I, Schulten HJ, Funayama H, Cremer U, Huppertz B, Gaus B, Kaufmann P, Fuzesi L. Cytogenetic and DNA-fingerprint characterization of choriocarcinoma cell lines and a trophoblast/choriocarcinoma cell hybrid. Cancer Genet Cytogenet 2000; 116(1): 16-22.
97. Fruh K, Yang Y. Antigen presentation by MHC class I and its regulation by interferon gamma. Curr Opin Immunol 1999; 11(1): 76-81.
98. Galvao J, Davis B, Tilley M, Normando E, Duchen MR, Cordeiro MF. Unexpected low-dose toxicity of the universal solvent DMSO. FASEB J 2014; 28(3): 1317-30.
178
99. Gauster M, Blaschitz A, Siwetz M, Huppertz B. Keratins in the human trophoblast. Histology and Histopathology. 2013; 28 (7): 817-825.
100. Gellynck E, Heyninck K, Andressen KW, Haegeman G, Levy FO, Vanhoenacker P, Van Craenenbroeck K. The serotonin 5-HT receptors: two decades of research. Experimental brain research Experimentelle Hirnforschung Experimentation cerebrale 2013; 230(4): 555-68.
101. Geraghty DE, Wei XH, Orr HT, Koller BH. Human leukocyte antigen F (HLA-F). An expressed HLA gene composed of a class I coding sequence linked to a novel transcribed repetitive element. J Exp Med 1990; 171(1): 1-18.
102. Girardi G, Bulla R, Salmon JE, Tedesco F. The complement system in the pathophysiology of pregnancy. Molecular immunology 2006; 43(1-2): 68-77.
103. Godfrey KM. The role of the placenta in fetal programming-a review. Placenta 2002; 23 Suppl A: S20-7.
104. Goldsmith LT, Weiss G. Relaxin in human pregnancy. Ann N Y Acad Sci 2009; 1160: 130-5. 105. Goldsmith LT, Weiss G, Palejwala S, Plant TM, Wojtczuck A, Clark Lambert W, Ammur N,
Heller D, Skurnick JH, Edwards D, Cole DM. Relaxin regulation of endometrial structure and function in the rhesus monkey. Proc Natl Acad Sci U S A 2004; 101(13): 4685-9.
106. Gomez-Lopez N, StLouis D, Lehr MA, Sanchez-Rodriguez EN, Arenas-Hernandez M. Immune cells in term and preterm labor. Cellular & molecular immunology 2014; 11(6): 571-81.
107. Gordon C, Wofsy D. Effects of recombinant murine tumor necrosis factor-alpha on immune function. J Immunol 1990; 144(5): 1753-8.
108. Gronvik KO, Hoskin DW, Murgita RA. Monoclonal antibodies against murine neonatal and pregnancy-associated natural suppressor cells induce resorption of the fetus. Scand J Immunol 1987; 25(5): 533-40.
109. Guleria I, Sayegh MH. Maternal acceptance of the fetus: true human tolerance. J Immunol 2007; 178(6): 3345-51.
110. Guenther S, Vrekoussis T, Heublein S, Bayer B, Anz D, Knabl J, Navrozoglou I, Dian D, Friese K, Makrigiannakis A, Jeschke U. Decidual macrophages are significantly increased in spontaneous miscarriages and over-express FasL: a potential role for macrophages in trophoblast apoptosis. Int J Mol Sci 2012; 13(7): 9069-80.
111. Hakam SM, Pallavi JH, Sachiyo T, Barnea ER, Fernandez N. Preimplantation factor (PIF*) regulates HLA-G expression at the feto-maternal interface. Journal of Reproductive Immunology 2014; 101–102: 51.
112. Halasz M, Szekeres-Bartho J. The role of progesterone in implantation and trophoblast invasion. J Reprod Immunol 2013; 97(1): 43-50.
113. Hanna J, Goldman-Wohl D, Hamani Y, Avraham I, Greenfield C, Natanson-Yaron S, Prus D, Cohen-Daniel L, Arnon TI, Manaster I, Gazit R, Yutkin V, Benharroch D, Porgador A, Keshet E, Yagel S, Mandelboim O. Decidual NK cells regulate key developmental processes at the human fetal-maternal interface. Nat Med 2006; 12(9): 1065-74.
114. Hannan NJ, Paiva P, Dimitriadis E, Salamonsen LA. Models for study of human embryo implantation: choice of cell lines? Biol Reprod 2010; 82(2): 235-45.
115. Hardy K, Handyside AH, Winston RM. The human blastocyst: cell number, death and allocation during late preimplantation development in vitro. Development 1989; 107(3): 597-604.
116. Hassan MI, Kumar V, Singh TP, Yadav S. Proteomic analysis of human amniotic fluid from Rh(-) pregnancy. Prenat Diagn 2008; 28(2): 102-8.
117. Heemskerk MB, Roelen DL, Dankers MK, Van Rood JJ, Class FHJ, Doxiadis IIN, Oudshoorn M. Allogeneic MHC class I molecules with numerous sequence differences do not elicit a CTL response. Hum Immunol 2005; 66(9): 969-76.
118. Heikkinen J, Mottonen M, Komi J, Alanen A, Lassila O. Phenotypic characterization of human decidual macrophages. Clin Exp Immunol 2003; 131(3): 498-505.
119. Hemberger M, Cross JC, Ropers HH, Lehrach H, Fundele R, Himmelbauer H. UniGene cDNA array-based monitoring of transcriptome changes during mouse placental development. Proc Natl Acad Sci U S A 2001; 98(23): 13126-31.
120. Hemberger M, Cross JC. Genes governing placental development. Trends Endocrinol Metab 2001; 12(4): 162-8.
179
121. Hiby SE, Ashrafian-Bonab M, Farrell L, Single RM, Balloux F, Carrington M, Moffett A, Ebrahimi Z. Distribution of killer cell immunoglobulin-like receptors (KIR) and their HLA-C ligands in two Iranian populations. Immunogenetics 2010; 62(2): 65-73.
122. Hiby SE, Walker JJ, O'Shaughnessy K M, Redman CWG, Carrrington M, Trowsdale J, Moffett A. Combinations of maternal KIR and fetal HLA-C genes influence the risk of preeclampsia and reproductive success. J Exp Med 2004; 200(8): 957-65.
123. Hiden U, Wadsack C, Prutsch N, Gauster M, Weiss U, Grank HG, Schmitz U, Fast-Hirsch C, Hengstschlager M, Potgens A, Ruben A, Knofler M, Haslinger P, Huppertz B, Bilban M, Kaufmann P, Desoye G. The first trimester human trophoblast cell line ACH-3P: a novel tool to study autocrine/paracrine regulatory loops of human trophoblast subpopulations--TNF-alpha stimulates MMP15 expression. BMC Dev Biol 2007; 7: 137.
124. Hoyer D, Hannon JP, Martin GR. Molecular, pharmacological and functional diversity of 5-HT receptors. Pharmacology, biochemistry, and behavior 2002; 71(4): 533-54.
125. Hsu SY, Nakabayashi K, Nishi S, Kumagai J, Kudo M, Sherwood OD, Hsueh AJ. Activation of orphan receptors by the hormone relaxin. Science 2002; 295(5555): 671-4.
126. Huber S, Gagliani N, Esplugues E, O’ Connor W Jr, Huber FJ, Chaudhry A, Kamanaka M, Kobayashi Y, Booth CJ, Rudensky AY, Roncarolo MG, Battaflia M, Flavell RA. Th17 cells express interleukin-10 receptor and are controlled by Foxp3 and Foxp3+ regulatory CD4+ T cells in an interleukin-10-dependent manner. Immunity 2011; 34(4): 554-65.
127. Hunt JS. Stranger in a strange land. Immunol Rev 2006; 213: 36-47. 128. Hunt JS, Langat DK, McIntire RH, Morales PJ. The role of HLA-G in human pregnancy.
Reproductive biology and endocrinology : RB&E 2006; 4 Suppl 1: S10. 129. Hunt JS, Langat DL. HLA-G: a human pregnancy-related immunomodulator. Curr Opin
Pharmacol 2009; 9(4): 462-9. 130. Hunt JS, Morales PJ, Pace JL, Fazleabas AT, Langat DK. A commentary on gestational
programming and functions of HLA-G in pregnancy. Placenta 2007; 28 Suppl A: S57-63. 131. Hunt JS, Petroff MG, McIntire RH, Ober C. HLA-G and immune tolerance in pregnancy. FASEB
J 2005; 19(7): 681-93. 132. Hunt JS, Robertson SA. Uterine macrophages and environmental programming for pregnancy
success. J Reprod Immunol 1996; 32(1): 1-25. 133. Hutter H, Hammer A, Blaschitz A, Hartmann M, Ebbesen P, Dohr G, Ziegler A, Uchanska-
Ziegler B. Expression of HLA class I molecules in human first trimester and term placenta trophoblast. Cell Tissue Res 1996; 286(3): 439-47.
134. Hviid TV. [Non-classical human leukocyte antigen (HLA) tissue types--from implantation to transplantation]. Ugeskr Laeger 2006; 168(5): 461-6.
135. Ishitani A, Geraghty DE. Alternative splicing of HLA-G transcripts yields proteins with primary structures resembling both class I and class II antigens. Proc Natl Acad Sci U S A 1992; 89(9): 3947-51.
136. Ishitani A, Sageshima N, Lee N, Dorofeeva N, Hatake K, Marquardt, Geraghty DE. Protein expression and peptide binding suggest unique and interacting functional roles for HLA-E, F, and G in maternal-placental immune recognition. J Immunol 2003; 171(3): 1376-84.
137. Ishitani A, Sageshima N, Hatake K. The involvement of HLA-E and -F in pregnancy. J Reprod Immunol 2006; 69(2): 101-13.
138. Jabeen A, Miranda-Sayago JM, Obara B, Spencer PS, Dealtry GB, Hayrabedyan S, Shaikly V, Laissue PP, Fernandez N. Quantified Colocalization Reveals Heterotypic Histocompatibility Class I Antigen Associations on Trophoblast Cell Membranes: Relevance for Human Pregnancy. Biology of Reproduction 2013; 89(4).
139. Ji Q, Luo ZX, Yuan CX, Wible JR, Zhang JP, Georgi JA. The earliest known eutherian mammal. Nature 2002; 416(6883): 816-22.
140. Jokhi PP, King A, Loke YW. Cytokine production and cytokine receptor expression by cells of the human first trimester placental-uterine interface. Cytokine 1997; 9(2): 126-37.
141. Jorgensen HS. Studies on the neuroendocrine role of serotonin. Dan Med Bull 2007; 54(4): 266-88.
142. Josimovich JB, Archer DF. The role of lactogenic hormones in the pregnant woman and the fetus. Am J Obstet Gynecol 1977; 129(7): 777-80.
180
143. Juch H, Blaschitz A, Dohr G, Hutter H. HLA class I expression in the human placenta. Wiener medizinische Wochenschrift 2012; 162(9-10): 196-200.
144. Kapasi K, Albert SE, Yie S, Zavazava N, Librach CL. HLA-G has a concentration-dependent effect on the generation of an allo-CTL response. Immunology 2000; 101(2): 191-200.
145. Karmakar S, Dhar R, Das C. Inhibition of cytotrophoblastic (JEG-3) cell invasion by interleukin 12 involves an interferon gamma-mediated pathway. J Biol Chem 2004; 279(53): 55297-307.
146. Kedzierska A, Turowski G. [Histocompatibility HLA system of man. Considerations in the light of current concepts. VII. Nonclassical HLA- E, F, and H loci]. Przegl Lek 2001; 58(11): 1009-12.
147. Keelan JA, Blumenstein M, Helliwell RJ, Sato TA, Marvin KW, Mitchell MD. Cytokines, prostaglandins and parturition--a review. Placenta 2003; 24 Suppl A: S33-46.
148. Kilburn BA, Wang J, Duniec-Dmuchowski ZM, Leach RE, Romero R, Armant DR. Extracellular matrix composition and hypoxia regulate the expression of HLA-G and integrins in a human trophoblast cell line. Biol Reprod 2000; 62(3): 739-47.
149. King A, Hiby SE, Verma S, Burrows T, Gardner L, Loke YW. Uterine NK cells and trophoblast HLA class I molecules. Am J Reprod Immunol 1997; 37(6): 459-62.
150. King A, Loke YW. On the nature and function of human uterine granular lymphocytes. Immunology today 1991; 12(12): 432-5.
151. Klein M, Graf A, Kiss H, Czerwenka K, Beck A, Egarter C, Husslein P. The relation between depth of trophoblastic invasion and beta-HCG levels in tubal pregnancies. Archives of gynecology and obstetrics 1995; 256(2): 85-8.
152. Koopman LA, Kopcow HD, Rybalov B, Boyson JE, Orange JS, Schatz F, Masch R, Lockwood CJ, Schachter AD, Park PJ, Strominger JL. Human decidual natural killer cells are a unique NK cell subset with immunomodulatory potential. J Exp Med 2003; 198(8): 1201-12.
153. Kurman RJ, Main CS, Chen HC. Intermediate trophoblast: a distinctive form of trophoblast with specific morphological, biochemical and functional features. Placenta 1984; 5(4): 349-69.
154. Le Bouteiller P, Piccinni MP. Human NK cells in pregnant uterus: why there? Am J Reprod Immunol 2008; 59(5): 401-6.
155. Kohler PO, Bridson WE. Isolation of hormone-producing clonal lines of human choriocarcinoma. J Clin Endocrinol Metab 1971; 32(5): 683-7.
156. Kohler PO, Bridson WE, Hammond JM, Weintraub B, Kirschner MA, Van Thiel DH. Clonal lines of human choriocarcinoma cells in culture. Acta Endocrinol Suppl (Copenh) 1971; 153: 137-53.
157. Kovats S, Main EK, Librach C, Stubblebine M, Fisher SJ, DeMars R. A class I antigen, HLA-G, expressed in human trophoblasts. Science 1990; 248(4952): 220-3.
158. Kyle PM. Drugs and the fetus. Current opinion in obstetrics & gynecology 2006; 18(2): 93-9. 159. Laemmli UK. Cleavage of structural proteins during the assembly of the head of bacteriophage
T4. Nature 1970; 227(5259): 680-5. 160. Laemmli UK, Beguin F, Gujer-Kellenberger G. A factor preventing the major head protein of
bacteriophage T4 from random aggregation. J Mol Biol 1970; 47(1): 69-85. 161. Latendresse G, Ruiz RJ, Wong B. Psychological distress and SSRI use predict variation in
inflammatory cytokines during pregnancy. Open J Obstet Gynecol 2013; 3(1A): 184-91. 162. Lee N, Goodlett DR, Ishitani A, Marquardt H, Geraghty DE. HLA-E surface expression depends
on binding of TAP-dependent peptides derived from certain HLA class I signal sequences. J Immunol 1998; 160(10): 4951-60.
163. Lee N, Ishitani A, Geraghty DE. HLA-F is a surface marker on activated lymphocytes. European journal of immunology 2010; 40(8): 2308-18.
164. Lefebvre S, Adrian F, Moreau P, Gourand L, Dausset J, Berrih-Aknin S, Carodella ED, Paul P. Modulation of HLA-G expression in human thymic and amniotic epithelial cells. Hum Immunol 2000; 61(11): 1095-101.
165. Lepin EJ, Bastin JM, Allan DS, Roncador G, Braud VM, Mason DY, van der Merwe PA, McMichael AJ, Bell JI, Powis SH, O’Callaghan CA. Functional characterization of HLA-F and binding of HLA-F tetramers to ILT2 and ILT4 receptors. European journal of immunology 2000; 30(12): 3552-61.
166. Licht P, Cao H, Lei ZM, Rao CV, Merz WE. Novel self-regulation of human chorionic gonadotropin biosynthesis in term pregnancy human placenta. Endocrinology 1993; 133(6): 3014-25.
181
167. Licht P, Russu V, Lehmeyer S, Wildt L. Molecular aspects of direct LH/hCG effects on human endometrium--lessons from intrauterine microdialysis in the human female in vivo. Reprod Biol 2001a; 1(1): 10-9.
168. Licht P, Russu V, Wildt L. On the role of human chorionic gonadotropin (hCG) in the embryo-endometrial microenvironment: implications for differentiation and implantation. Semin Reprod Med 2001b; 19(1): 37-47.
169. Lim LP, Lau NC, Garrett-Engele P, Grimson A, Schelter JM, Catle J, Bartel DP, Linsley PS, Johnson JM. Microarray analysis shows that some microRNAs downregulate large numbers of target mRNAs. Nature 2005; 433(7027): 769-73.
170. Llano M, Lee N, Navarro F, Garcia P, Albar JP, Geraghty DE, Lopez-Botet M. HLA-E-bound peptides influence recognition by inhibitory and triggering CD94/NKG2 receptors: preferential response to an HLA-G-derived nonamer. European journal of immunology 1998; 28(9): 2854-63.
171. Loke YW, King A. Immunology of implantation. Baillieres Best Pract Res Clin Obstet Gynaecol 2000; 14(5): 827-37.
172. Long EO, Kim HS, Liu D, Peterson ME, Rajagopalan S. Controlling natural killer cell responses: integration of signals for activation and inhibition. Annu Rev Immunol 2013; 31: 227-58.
173. Lyall F, Bulmer JN, Duffie E, Cousins F, Theriault A, Robson SC. Human trophoblast invasion and spiral artery transformation: the role of PECAM-1 in normal pregnancy, preeclampsia, and fetal growth restriction. The American journal of pathology 2001; 158(5): 1713-21.
174. Lynge Nilsson L, Djurisic S, Hviid TV. Controlling the Immunological Crosstalk during Conception and Pregnancy: HLA-G in Reproduction. Frontiers in immunology 2014; 5: 198.
175. Maccarrone M, Valensise H, Bari M, Lazzarin N, Romanini C, Finazzi-Agro A. Progesterone up-regulates anandamide hydrolase in human lymphocytes: role of cytokines and implications for fertility. J Immunol 2001; 166(12): 7183-9.
176. Maenaka K, Jones EY. MHC superfamily structure and the immune system. Curr Opin Struct Biol 1999; 9(6): 745-53.
177. Malassine A, Frendo JL, Evain-Brion D. A comparison of placental development and endocrine functions between the human and mouse model. Human reproduction update 2003; 9(6): 531-9.
178. Malm H. Prenatal exposure to selective serotonin reuptake inhibitors and infant outcome. Therapeutic drug monitoring 2012; 34(6): 607-14.
179. Mandelboim O, Pazmany L, Davis DM, Vales-Gomez M, Reyburn HT, Rybalov B. Multiple receptors for HLA-G on human natural killer cells. Proc Natl Acad Sci U S A 1997; 94(26): 14666-70.
180. Mannel DN, Falk W, Yron I. Inhibition of murine cytotoxic T cell responses by progesterone. Immunology letters 1990; 26(1): 89-94.
181. McCormick J, Whitley GS, Le Bouteiller P, Cartwright JE. Soluble HLA-G regulates motility and invasion of the trophoblast-derived cell line SGHPL-4. Hum Reprod 2009; 24(6): 1339-45.
182. Medawar P. Some immunological and endocrinological problems raised by the evolution of viviparity in vertebrate. Symposium of the Society for Experimental Biology; 1953.
183. Melero I, Hirschhorn-Cymerman D, Morales-Kastresana A, Sanmamed MF, Wolchok JD. Agonist antibodies to TNFR molecules that costimulate T and NK cells. Clin Cancer Res 2013; 19(5): 1044-53.
184. Menier C, Guillard C, Cassinat B, Carosella ED, Rouas-Freiss N. HLA-G turns off erythropoietin receptor signaling through JAK2 and JAK2 V617F dephosphorylation: clinical relevance in polycythemia vera. Leukemia 2008; 22(3): 578-84.
185. Meyer TS, Lamberts BL. Use of coomassie brilliant blue R250 for the electrophoresis of microgram quantities of parotid saliva proteins on acrylamide-gel strips. Biochimica et biophysica acta 1965; 107(1): 144-5.
186. Min G, Sherwood OD. Identification of specific relaxin-binding cells in the cervix, mammary glands, nipples, small intestine, and skin of pregnant pigs. Biol Reprod 1996; 55(6): 1243-52.
187. Miyaura H, Iwata M. Direct and indirect inhibition of Th1 development by progesterone and glucocorticoids. J Immunol 2002; 168(3): 1087-94.
188. Mjosberg J, Berg G, Jenmalm MC, Ernerudh J. FOXP3+ regulatory T cells and T helper 1, T helper 2, and T helper 17 cells in human early pregnancy decidua. Biol Reprod 2010; 82(4): 698-705.
182
189. Moffett A, Loke C. Implantation, embryo-maternal interactions, immunology and modulation of the uterine environment -- a workshop report. Placenta 2006; 27 Suppl A: S54-5.
190. Moffett A, Loke YW. The immunological paradox of pregnancy: a reappraisal. Placenta 2004; 25(1): 1-8.
191. Moffett-King A. Natural killer cells and pregnancy. Nature reviews Immunology 2002; 2(9): 656-63.
192. Moindjie H, Santos ED, Loeuillet L, Gronier H, de Mazancourt P, Barnea ER< Vialard F, Dieudonne MN. Preimplantation factor (PIF) promotes human trophoblast invasion. Biol Reprod 2014; 91(5): 118.
193. Mor G. Inflammation and pregnancy: the role of toll-like receptors in trophoblast-immune interaction. Ann N Y Acad Sci 2008; 1127: 121-8.
194. Mor G, Abrahams VM. Potential role of macrophages as immunoregulators of pregnancy. Reproductive biology and endocrinology : RB&E 2003; 1: 119.
195. Mor G, Cardenas I, Abrahams V, Guller S. Inflammation and pregnancy: the role of the immune system at the implantation site. Ann N Y Acad Sci 2011; 1221: 80-7.
196. Mor G, Straszewski-Chavez SL, Abrahams VM. Macrophage-trophoblast interactions. Methods in molecular medicine 2006; 122: 149-63.
197. Moreau P, Adrian-Cabestre F, Menier C, Guiard V, Gourand L, Dausset J, Carosella ED, Paul P. IL-10 selectively induces HLA-G expression in human trophoblasts and monocytes. Int Immunol 1999; 11(5): 803-11.
198. Moreau P, Rousseau P, Rouas-Freiss N, Le Discorde M, Dausset J, Carosella ED. HLA-G protein processing and transport to the cell surface. Cellular and molecular life sciences : CMLS 2002; 59(9): 1460-6.
199. Mosmann TR, Cherwinski H, Bond MW, Giedlin MA, Coffman RL. Two types of murine helper T cell clone. I. Definition according to profiles of lymphokine activities and secreted proteins. J Immunol 1986; 136(7): 2348-57.
200. Murphy VE, Smith R, Giles WB, Clifton VL. Endocrine regulation of human fetal growth: the role of the mother, placenta, and fetus. Endocr Rev 2006; 27(2): 141-69.
201. Nachtigall MJ, Kliman HJ, Feinberg RF, Olive DL, Engin O, Arici A. The effect of leukemia inhibitory factor (LIF) on trophoblast differentiation: a potential role in human implantation. J Clin Endocrinol Metab 1996; 81(2): 801-6.
202. Nagamatsu T, Fujii T, Matsumoto J, Yamashita T, Kozuma S, Taketani Y. Human leukocyte antigen F protein is expressed in the extra-villous trophoblasts but not on the cell surface of them. Am J Reprod Immunol 2006; 56(3): 172-7.
203. Naruse K, Innes BA, Bulmer JN, Robson SC, Searle RF, Lash GE. Secretion of cytokines by villous cytotrophoblast and extravillous trophoblast in the first trimester of human pregnancy. J Reprod Immunol 2010; 86(2): 148-50.
204. Norwitz ER, Schust DJ, Fisher SJ. Implantation and the survival of early pregnancy. The New England journal of medicine 2001; 345(19): 1400-8.
205. Nowak I, Majorczyk E, Ploski R, Senitzer D, Sun JY, Kusnierczyk P. Lack of KIR2DL4 gene in a fertile Caucasian woman. Tissue antigens 2011a; 78(2): 115-9.
206. Nowak I, Malinowski A, Tchorzewski H, Barcz E, Wilczynski JR, Banasik M, Crybos M, Kurpisz M, Luszczek W, Majorczyck E, Wisnieski A, Senitzer D, Sun JY, Kusnierczyk P. HLA-C C1C2 heterozygosity may protect women bearing the killer immunoglobulin-like receptor AA genotype from spontaneous abortion. J Reprod Immunol 2011b; 88(1): 32-7.
207. Ober C. HLA and pregnancy: the paradox of the fetal allograft. Am J Hum Genet 1998; 62(1): 1-5.
208. O'Farrell PH. High resolution two-dimensional electrophoresis of proteins. J Biol Chem 1975; 250(10): 4007-21.
209. Okabe H, Makino S, Kato K, Matsuoka K, Seki H, Takeda S. The effect of progesterone on genes involved in preterm labor. J Reprod Immunol 2014; 104-105: 80-91.
210. Orendi K, Kivity V, Sammar M, Grumpel Y, Gonen R, Meiri H, Lubzens E, Huppertz B. Placental and trophoblastic in vitro models to study preventive and therapeutic agents for preeclampsia. Placenta 2011; 32 Suppl: S49-54.
183
211. Osheroff PL, King KL. Binding and cross-linking of 32P-labeled human relaxin to human uterine cells and primary rat atrial cardiomyocytes. Endocrinology 1995; 136(10): 4377-81.
212. Padliya ND, Wood TD. Improved peptide mass fingerprinting matches via optimized sample preparation in MALDI mass spectrometry. Anal Chim Acta 2008; 627(1): 162-8.
213. Paidas MJ, Krikun G, Huang SJ, Jones R, Romano M, Annuziato J, Barnea ER. A genomic and proteomic investigation of the impact of preimplantation factor on human decidual cells. Am J Obstet Gynecol 2010; 202(5): 459 e1-8.
214. Palejwala S, Tseng L, Wojtczuk A, Weiss G, Goldsmith LT. Relaxin gene and protein expression and its regulation of procollagenase and vascular endothelial growth factor in human endometrial cells. Biol Reprod 2002; 66(6): 1743-8.
215. Parham P. NK cells and trophoblasts: partners in pregnancy. J Exp Med 2004; 200(8): 951-5. 216. Parham P, Norman PJ, Abi-Rached L, Hilton HG, Guethlein LA. Review: Immunogenetics of
human placentation. Placenta 2012; 33 Suppl: S71-80. 217. Petroff MG, Phillips TA, Ka H, Pace JL, Hunt JS. Isolation and culture of term human
trophoblast cells. Methods in molecular medicine 2006; 121: 203-17. 218. Pijnenborg R, Dixon G, Robertson WB, Brosens I. Trophoblastic invasion of human decidua
from 8 to 18 weeks of pregnancy. Placenta 1980; 1(1): 3-19. 219. Pongcharoen S, Supalap K. Interleukin-17 increased progesterone secretion by JEG-3 human
choriocarcinoma cells. Am J Reprod Immunol 2009; 61(4): 261-4. 220. Popat VB, Prodanov T, Calis KA, Nelson LM. The menstrual cycle: a biological marker of
general health in adolescents. Ann N Y Acad Sci 2008; 1135: 43-51. 221. Hawkins SM, Matzuk MM. The menstrual cycle: basic biology. Ann N Y Acad Sci 2008; 1135:
10-8. 222. PrabhuDas M, Bonney E, Caron K, Dey S, Erlebacher A, Fazleabas A, Fisher S, Golos T,
Matzuk M, McCune JM, Mor G, Schilz L, Soares M, Spencer T, Strominger J, Way SS, Yoshinaga K. Immune mechanisms at the maternal-fetal interface: perspectives and challenges. Nat Immunol 2015; 16(4): 328-34.
223. Preisler HD, Giladi M. Differentiation of erythroleukemic cells in vitro: irreversible induction by dimethyl sulfoxide (DMSO). J Cell Physiol 1975; 85(3): 537-46.
224. Ramu S, Stamatkin C, Timms L, Ruble M, Roussev RG, Barnea ER. PreImplantation factor (PIF) detection in maternal circulation in early pregnancy correlates with live birth (bovine model). Reproductive biology and endocrinology : RB&E 2013; 11: 105.
225. Rebmann V, da Silva Nardi F, Wagner B, Horn PA. HLA-G as a tolerogenic molecule in transplantation and pregnancy. Journal of immunology research 2014; 2014: 297073.
226. Ribatti D. Peter Brian Medawar and the discovery of acquired immunological tolerance. Immunology letters 2015; 167(2): 63-6.
227. Ristich V, Liang S, Zhang W, Wu J, Horuzsko A. Tolerization of dendritic cells by HLA-G. European journal of immunology 2005; 35(4): 1133-42.
228. Rizzo R, Hviid TV, Stignani M, Balboni A, Grappa MT, Melchiorri L, Baricordi OR. The HLA-G genotype is associated with IL-10 levels in activated PBMCs. Immunogenetics 2005; 57(3-4): 172-81.
229. Rodgers JR, Cook RG. MHC class Ib molecules bridge innate and acquired immunity. Nature reviews Immunology 2005; 5(6): 459-71.
230. Romero R, Gotsch F, Pineles B, Kusanovic JP. Inflammation in pregnancy: its roles in reproductive physiology, obstetrical complications, and fetal injury. Nutr Rev 2007; 65(12 Pt 2): S194-202.
231. Roobrouck VD, Vanuytsel K, Verfaillie CM. Concise review: culture mediated changes in fate and/or potency of stem cells. Stem Cells 2011; 29(4): 583-9.
232. Roth I, Corry DB, Locksley RM, Abrams JS, Litton MJ, Fisher SJ. Human placental cytotrophoblasts produce the immunosuppressive cytokine interleukin 10. J Exp Med 1996; 184(2): 539-48.
233. Roussev RG, Coulam CB, Kaider BD, Yarkoni M, Leavis PC, Barnea ER. Embryonic origin of preimplantation factor (PIF): biological activity and partial characterization. Molecular human reproduction 1996; 2(11): 883-7.
184
234. Roussev RG, Dons'koi BV, Stamatkin C, Ramu S, Chernyshov VP, Coulam CB, Barnea ER. Preimplantation factor inhibits circulating natural killer cell cytotoxicity and reduces CD69 expression: implications for recurrent pregnancy loss therapy. Reprod Biomed Online 2013; 26(1): 79-87.
235. Roussev RG, Higgins NG, McIntyre JA. Phenotypic characterization of normal human placental mononuclear cells. J Reprod Immunol 1993; 25(1): 15-29.
236. Rusterholz C, Hahn S, Holzgreve W. Role of placentally produced inflammatory and regulatory cytokines in pregnancy and the etiology of preeclampsia. Semin Immunopathol 2007; 29(2): 151-62.
237. Rygaard K, Revol A, Esquivel-Escobedo D, Beck BL, Barrera-Saldana HA. Absence of human placental lactogen and placental growth hormone (HGH-V) during pregnancy: PCR analysis of the deletion. Hum Genet 1998; 102(1): 87-92.
238. Sacks G, Sargent I, Redman C. An innate view of human pregnancy. Immunology today 1999; 20(3): 114-8.
239. Sacks G, Sargent I, Redman C. Innate immunity in pregnancy. Immunology today 2000; 21(4): 200-1.
240. Saito S. Th17 cells and regulatory T cells: new light on pathophysiology of preeclampsia. Immunol Cell Biol 2010; 88(6): 615-7.
241. Saito S. Cytokine network at the feto-maternal interface. J Reprod Immunol 2000; 47(2): 87-103. 242. Saito S, Nakashima A, Shima T, Ito M. Th1/Th2/Th17 and regulatory T-cell paradigm in
pregnancy. Am J Reprod Immunol 2010; 63(6): 601-10. 243. Salter RD. Chapter 1 - MHC Class I. In: Thomson MTLW, ed. Measuring Immunity. London:
Academic Press; 2005: 3-11. 244. Sanjabi S, Mosaheb MM, Flavell RA. Opposing effects of TGF-beta and IL-15 cytokines control
the number of short-lived effector CD8+ T cells. Immunity 2009b; 31(1): 131-44. 245. Sanjabi S, Zenewicz LA, Kamanaka M, Flavell RA. Anti-inflammatory and pro-i
nflammatory roles of TGF-beta, IL-10, and IL-22 in immunity and autoimmunity. Curr Opin Pharmacol 2009a; 9(4): 447-53.
246. Sargent IL, Borzychowski AM, Redman CW. NK cells and human pregnancy--an inflammatory view. Trends Immunol 2006; 27(9): 399-404.
247. Schneider H. The role of the placenta in nutrition of the human fetus. Am J Obstet Gynecol 1991; 164(4): 967-73.
248. Shajib MS, Khan WI. The role of serotonin and its receptors in activation of immune responses and inflammation. Acta Physiol (Oxf) 2015; 213(3): 561-74.
249. Shah D, Nagarajan N. Luteal insufficiency in first trimester. Indian J Endocrinol Metab 2013; 17(1): 44-9.
250. Shaikly V, Shakhawat A, Withey A, Morrison I, Taranissi M, Dealtry GB, Jabeen A, Cherry R, Fernandez N. Cell bio-imaging reveals co-expression of HLA-G and HLA-E in human preimplantation embryos. Reprod Biomed Online 2010; 20(2): 223-33.
251. Sharkey AM, Gardner L, Hiby S, Farrell L, Apps R, Masters L, Goodrigde J, Lathbury L, Stewart CA, Verma S, Moffett A. Killer Ig-like receptor expression in uterine NK cells is biased toward recognition of HLA-C and alters with gestational age. J Immunol 2008; 181(1): 39-46.
252. Shevchenko A, Wilm M, Vorm O, Mann M. Mass spectrometric sequencing of proteins silver-stained polyacrylamide gels. Anal Chem 1996; 68(5): 850-8.
253. Shimada S, Nishida R, Takeda M, Iwabuchi K, Kishi R, Onoe K, Minakami H, Yamada H. Natural killer, natural killer T, helper and cytotoxic T cells in the decidua from sporadic miscarriage. Am J Reprod Immunol 2006; 56(3): 193-200.
254. Shima T, Sasaki Y, Itoh M, Nakashima A, Ishii N, Suganura K, Saito S. Regulatory T cells are necessary for implantation and maintenance of early pregnancy but not late pregnancy in allogeneic mice. J Reprod Immunol 2010; 85(2): 121-9.
255. Shimonovitz S, Hurwitz A, Hochner-Celnikier D, Dushnik M, Anteby E, Yagel S. Expression of gelatinase B by trophoblast cells: down-regulation by progesterone. Am J Obstet Gynecol 1998; 178(3): 457-61.
256. Shobu T, Sageshima N, Tokui H, Omura M, Saito K, Nagatsuka Y, Nakanishi M, Hayashi Y, Hatake K, Ishitani A. The surface expression of HLA-F on decidual trophoblasts increases from mid to term gestation. J Reprod Immunol 2006; 72(1-2): 18-32.
185
257. Siiteri PK, Febres F, Clemens LE, Chang RJ, Gondos B, Stites D. Progesterone and maintenance of pregnancy: is progesterone nature's immunosuppressant? Ann N Y Acad Sci 1977; 286: 384-97.
258. Siiteri PK, Stites DP. Immunologic and endocrine interrelationships in pregnancy. Biol Reprod 1982; 26(1): 1-14.
259. Simpson KL, Keelan JA, Mitchell MD. Labor-associated changes in interleukin-10 production and its regulation by immunomodulators in human choriodecidua. J Clin Endocrinol Metab 1998; 83(12): 4332-7.
260. Singh R, Kolvraa S, Rattan SI. Genetics of human longevity with emphasis on the relevance of HSP70 as candidate genes. Front Biosci 2007; 12: 4504-13.
261. Sirotkin AV, Schaeffer HJ. Direct regulation of mammalian reproductive organs by serotonin and melatonin. The Journal of endocrinology 1997; 154(1): 1-5.
262. Soares MJ, Hunt JS. Placenta and Trophoblast - Methods and Protocols: Springer; 2006a. 263. Soares MJ, Hunt JS. Placenta and trophoblast: methods and protocols: overview II. Methods in
molecular medicine 2006b; 122: 3-7. 264. Spencer PS, Hakam SM, Laissue PP, Fernandez N. Key Cellular Components and Interactive
Histocompatibility Molecules Regulating Tolerance to the Fetal Allograft. American Journal of Reproductive Immunology 2012; 68(2): 95-9.
265. Stamatkin CW, Roussev RG, Stout M, Coulam CB, Triche E, Godke RA, Barnea ER. Preimplantation factor negates embryo toxicity and promotes embryo development in culture. Reprod Biomed Online 2011a; 23(4): 517-24.
266. Stamatkin CW, Roussev RG, Stout M, Absalon-Medina V, Ramu S, Goodman C, Coulam CB, Gilbert RO, Godke RA, Barnea ER. PreImplantation Factor (PIF) correlates with early mammalian embryo development-bovine and murine models. Reproductive biology and endocrinology : RB&E 2011b; 9: 63.
267. Staun-Ram E, Shalev E. Human trophoblast function during the implantation process. Reproductive biology and endocrinology : RB&E 2005; 3: 56.
268. Sutton ML, Gilchrist RB, Thompson JG. Effects of in-vivo and in-vitro environments on the metabolism of the cumulus-oocyte complex and its influence on oocyte developmental capacity. Human reproduction update 2003; 9(1): 35-48.
269. Szekeres-Bartho J. Immunological relationship between the mother and the fetus. Int Rev Immunol 2002; 21(6): 471-95.
270. Szekeres-Bartho J. Regulation of NK cell cytotoxicity during pregnancy. Reprod Biomed Online 2008; 16(2): 211-7.
271. Szekeres-Bartho J. Progesterone-mediated immunomodulation in pregnancy: its relevance to leukocyte immunotherapy of recurrent miscarriage. Immunotherapy 2009; 1(5): 873-82.
272. Szekeres-Bartho J, Balasch J. Progestagen therapy for recurrent miscarriage. Human reproduction update 2008; 14(1): 27-35.
273. Szekeres-Bartho J, Faust Z, Varga P, Szereday L, Kelemen K. The immunological pregnancy protective effect of progesterone is manifested via controlling cytokine production. Am J Reprod Immunol 1996; 35(4): 348-51.
274. Szekeres-Bartho J, Halasz M, Palkovics T. Progesterone in pregnancy; receptor-ligand interaction and signaling pathways. J Reprod Immunol 2009; 83(1-2): 60-4.
275. Szekeres-Bartho J, Wilczynski JR, Basta P, Kalinka J. Role of progesterone and progestin therapy in threatened abortion and preterm labour. Front Biosci 2008; 13: 1981-90.
276. Szukiewicz D, Kochanowski J, Mittal TK, Pyzlak M, Szewczyk G, Cendrowski K. CX3CL1 (fractalkine) and TNFalpha production by perfused human placental lobules under normoxic and hypoxic conditions in vitro: the importance of CX3CR1 signaling. Inflammation research : official journal of the European Histamine Research Society 2014; 63(3): 179-89.
277. Tadokoro CE. The delicate balance between inflammation, conception and pregnancy. Am J Reprod Immunol 2012; 68(5): 363-5.
278. Than NG, Paidas MJ, Mizutani S, Sharma S, Padbury J, Barnea ER. Embryo-placento-maternal interaction and biomarkers: from diagnosis to therapy--a workshop report. Placenta 2007; 28 Suppl A: S107-10.
279. Thaxton JE, Sharma S. Interleukin-10: a multi-faceted agent of pregnancy. Am J Reprod Immunol 2010; 63(6): 482-91.
186
280. Thellin O, Coumans B, Zorzi W, Igout A, Heinen E. Tolerance to the foeto-placental 'graft': ten ways to support a child for nine months. Curr Opin Immunol 2000; 12(6): 731-7.
281. Thellin O, Heinen E. Pregnancy and the immune system: between tolerance and rejection. Toxicology 2003; 185(3): 179-84.
282. Tilburgs T, Scherjon SA, van der Mast BJ, Haasnoot GW, Versteed –V D Woort-Maarschalk M, Roelen DL, van rood JJ, Claas FH. Fetal-maternal HLA-C mismatch is associated with decidual T cell activation and induction of functional T regulatory cells. J Reprod Immunol 2009; 82(2): 148-57.
283. Towbin H, Staehelin T, Gordon J. Electrophoretic transfer of proteins from polyacrylamide gels to nitrocellulose sheets: procedure and some applications. Proc Natl Acad Sci U S A 1979; 76(9): 4350-4.
284. Trowsdale J, Moffett A. NK receptor interactions with MHC class I molecules in pregnancy. Semin Immunol 2008; 20(6): 317-20.
285. Trundley A, Moffett A. Human uterine leukocytes and pregnancy. Tissue antigens 2004; 63(1): 1-12.
286. Veenstra van Nieuwenhoven AL, Heineman MJ, Faas MM. The immunology of successful pregnancy. Human reproduction update 2003; 9(4): 347-57.
287. Verma S, King A, Loke YW. Expression of killer cell inhibitory receptors on human uterine natural killer cells. European journal of immunology 1997; 27(4): 979-83.
288. Vicovac L, Jones CJ, Aplin JD. Trophoblast differentiation during formation of anchoring villi in a model of the early human placenta in vitro. Placenta 1995; 16(1): 41-56.
289. Vigano P, Mangioni S, Pompei F, Chiodo I. Maternal-conceptus cross talk--a review. Placenta 2003; 24 Suppl B: S56-61.
290. von Rango U. Fetal tolerance in human pregnancy--a crucial balance between acceptance and limitation of trophoblast invasion. Immunology letters 2008; 115(1): 21-32.
291. Wadsack C, Hrzenjak A, Hammer A, Hirschmugl B, Levak-Frank S, Desoye G, Sattler W, Malle E. Trophoblast-like human choriocarcinoma cells serve as a suitable in vitro model for selective cholesteryl ester uptake from high density lipoproteins. European journal of biochemistry / FEBS 2003; 270(3): 451-62.
292. Wainwright SD, Biro PA, Holmes CH. HLA-F is a predominantly empty, intracellular, TAP-associated MHC class Ib protein with a restricted expression pattern. J Immunol 2000; 164(1): 319-28.
293. Weetman AP. The immunology of pregnancy. Thyroid : official journal of the American Thyroid Association 1999; 9(7): 643-6.
294. Weil A. Mammalian evolution: upwards and onwards. Nature 2002; 416(6883): 798-9. 295. Weiss G, Goldsmith LT, Sachdev R, Von Hagen S, Lederer K. Elevated first-trimester serum
relaxin concentrations in pregnant women following ovarian stimulation predict prematurity risk and preterm delivery. Obstet Gynecol 1993; 82(5): 821-8.
296. Wilczynski JR. Th1/Th2 cytokines balance--yin and yang of reproductive immunology. Eur J Obstet Gynecol Reprod Biol 2005; 122(2): 136-43.
297. Williams PJ, Searle RF, Robson SC, Innes BA, Bulmer JN. Decidual leucocyte populations in early to late gestation normal human pregnancy. J Reprod Immunol 2009; 82(1): 24-31.
298. Wu HX, Jin LP, Xu B, Liang SS, Li DJ. Decidual stromal cells recruit Th17 cells into decidua to promote proliferation and invasion of human trophoblast cells by secreting IL-17. Cellular & molecular immunology 2014; 11(3): 253-62.
299. Xu SY, Wu D, Guo HY, Zheng AR, Zhang G. The level of feed intake affects embryo survival and gene expression during early pregnancy in gilts. Reprod Domest Anim 2010; 45(4): 685-93.
300. Yagel S, Geva TE, Solomon H, Shimonovitz S, Reich R, Finci-Yeheskel Z, Mayer M, Milwidsky A. High levels of human chorionic gonadotropin retard first trimester trophoblast invasion in vitro by decreasing urokinase plasminogen activator and collagenase activities. J Clin Endocrinol Metab 1993; 77(6): 1506-11
301. Yie SM, Li LH, Li GM, Xiao R, Librach CL. Progesterone enhances HLA-G gene expression in JEG-3 choriocarcinoma cells and human cytotrophoblasts in vitro. Hum Reprod 2006b; 21(1): 46-51.
302. Yie SM, Xiao R, Librach CL. Progesterone regulates HLA-G gene expression through a novel progesterone response element. Hum Reprod 2006a; 21(10): 2538-44.

187
303. Zakar T, Mesiano S. How does progesterone relax the uterus in pregnancy? The New England journal of medicine 2011; 364(10): 972-3.
304. Zingoni A, Sornasse T, Cocks BG, Tanaka Y, Santoni A, Lanier LL. NK cell regulation of T cell-mediated responses. Molecular immunology 2005; 42(4): 451-4.
305. Zourbas S, Dubanchet S, Martal J, Chaouat G. Localization of pro-inflammatory (IL-12, IL-15) and anti-inflammatory (IL-11, IL-13) cytokines at the foetomaternal interface during murine pregnancy. Clin Exp Immunol 2001; 126(3): 519-28.
306. Zygmunt M, Hahn D, Munstedt K, Bischof P, Lang U. Invasion of cytotrophoblastic JEG-3 cells is stimulated by hCG in vitro. Placenta 1998; 19(8): 587-93.
307. Zygmunt M, McKinnon T, Herr F, Lala PK, Han VK. HCG increases trophoblast migration in vitro via the insulin-like growth factor-II/mannose-6 phosphate receptor. Molecular human reproduction 2005; 11(4): 261-7.