The Role of Industry and Occupation in Recent U.S. Unemployment
46
The Role of Industry and Occupation in Recent U.S. Unemployment Differentials by Gender, Race and Ethnicity March 2012 Marios Michaelides (IMPAQ International) Peter Mueser (University of Missouri and IMPAQ International) ABSTRACT We document historical unemployment trends by gender, race, and ethnicity, and examine the role of the industrial and occupational composition of employment in explaining recent trends. Using Current Population Survey (CPS) data, we show that, in the past 50 years, the labor force proportions of women, nonwhites, and Hispanics have increased dramatically, while the unemployment rates for these groups have been converging to those of the rest of the population. We also show that the U.S. workforce shifted towards services and white collar jobs, which have lower and less volatile unemployment rates. Using 1992-2007 CPS March data, we document recent trends in unemployment and Unemployment Insurance (UI) receipt and examine whether these are explained by underlying differences in the industrial and occupational distributions. Results show that, controlling for industry and occupation, women have higher unemployment rates than men, nonwhites still have appreciably higher rates than whites, and Hispanics have similar rates to those of non-Hispanics. Our results also suggest that, controlling for industry and occupation, when faced with unemployment, women, nonwhites and Hispanics are less like than others to obtain UI benefits. JEL Codes: J11, J15, J16, J65. Keywords: Unemployment, Unemployment Insurance, Gender, Race, Ethnicity.
Transcript of The Role of Industry and Occupation in Recent U.S. Unemployment

The Role of Industry and Occupation in Recent U.S. Unemployment
Differentials by Gender, Race and Ethnicity
March 2012
Marios Michaelides (IMPAQ International)
Peter Mueser
(University of Missouri and IMPAQ International)
ABSTRACT
We document historical unemployment trends by gender, race, and ethnicity, and examine the role of the industrial and occupational composition of employment in explaining recent trends. Using Current Population Survey (CPS) data, we show that, in the past 50 years, the labor force proportions of women, nonwhites, and Hispanics have increased dramatically, while the unemployment rates for these groups have been converging to those of the rest of the population. We also show that the U.S. workforce shifted towards services and white collar jobs, which have lower and less volatile unemployment rates. Using 1992-2007 CPS March data, we document recent trends in unemployment and Unemployment Insurance (UI) receipt and examine whether these are explained by underlying differences in the industrial and occupational distributions. Results show that, controlling for industry and occupation, women have higher unemployment rates than men, nonwhites still have appreciably higher rates than whites, and Hispanics have similar rates to those of non-Hispanics. Our results also suggest that, controlling for industry and occupation, when faced with unemployment, women, nonwhites and Hispanics are less like than others to obtain UI benefits. JEL Codes: J11, J15, J16, J65. Keywords: Unemployment, Unemployment Insurance, Gender, Race, Ethnicity.

Page 1
1. Introduction
Over the past 50 years, there have been significant shifts in the socioeconomic structure of
the U.S. workforce. Some of the most important changes have been the increase in the labor
force shares of women, nonwhites, and Hispanics. In the 1950s, women accounted for only
about a third of the U.S. labor force, whereas, by the early 2000s, nearly half the U.S. labor force
participants were women. The labor force share of racial and ethnic minorities has more than
doubled over the past three decades and, at this pace, nonwhite and Hispanic workers will soon
account for a third of the U.S. workforce. At the same time, the U.S. economy has transitioned
from a system in which a large share of employment was in manufacturing and blue collar jobs
to one in which services and white collar jobs play a dominant role.
Shifts in the socioeconomic, industrial, and occupational composition of the labor force have
been associated with changes in unemployment differentials by gender, race, and ethnicity. Up
through the 1970s, women had higher unemployment rates than men, but, by the 1980s, the rates
had converged. The unemployment rates of nonwhites and Hispanics over the past few decades
have been appreciably higher than the rates for the remaining populations. These groups have
also faced higher unemployment durations and greater sensitivity to variation in the business
cycle. In the past 20 years, however, there is evidence of convergence in the unemployment
experience by race and Hispanic ethnicity. Another important change is the decline in
unemployment rates for manufacturing and blue collar workers over the past 30 years.
Nevertheless, manufacturing and blue collar jobs still have higher unemployment and business-
cycle volatility than services and white collar jobs, respectively.
There is an extensive literature examining unemployment patterns for key socioeconomic
groups and how these are related to overall unemployment patterns. There is also substantial

Page 2
research examining shifts in the industrial and occupational structure of the U.S. economy and
the extent to which these shifts affect overall employment and unemployment patterns. Perhaps
surprisingly, there is limited work documenting the unemployment rate patterns for women,
nonwhites, and Hispanics – three workforce groups that experienced dramatic growth over time
– and how these compare to the rest of the population. There is also very limited work
considering whether the changing unemployment experiences of these groups in recent years are
associated with the shifts in the industrial and occupational distribution of employment. Such
research is essential in gaining a better understanding of overall unemployment patterns of key
demographic groups and the importance of underlying economic development in explaining
changes in those patterns.
This paper fills these research gaps by documenting historical unemployment trends by
gender, race, and Hispanic ethnicity, and providing a decomposition of unemployment
differentials in terms of industry and occupation. Following our discussion of the literature in
section 2, section 3 provides a historical overview of the major changes in the socioeconomic,
industrial, and occupational composition of the U.S. labor force based on an analysis of the
Current Population Survey (CPS) monthly data from 1948 through 2007. This overview
highlights the growing importance of female, nonwhite, and Hispanic workers in the U.S. labor
force, as well as the shift of the U.S. workforce towards services and white collar jobs. Using the
same data, we present historical comparisons in the unemployment rates by gender, race,
ethnicity, industry, and occupation.
In section 4, we turn to CPS March Supplement data from 1988 through 2007 to document
more recent trends in the unemployment rate and in Unemployment Insurance (UI) receipt and to
examine the degree to which these trends are explained by underlying gender, race, and ethnicity
Page 3
differences in the industrial and occupational workforce distribution. These analyses reveal the
important role of industry and occupation in explaining overall unemployment patterns by
gender, race, and ethnicity in the modern U.S. economy. Results differ in important ways for the
three groups. An apparent full convergence in unemployment by gender is largely a result of
industry and occupational differences, which camouflage substantially higher unemployment for
women within industry-occupation categories. In contrast, although the race gap has declined,
unemployment for nonwhites remains much higher than for whites, even when we adjust for
industry and occupation. Finally, relative Hispanic unemployment has declined, and industry
and occupational differences explain much of the remaining gap.
2. Literature
Changes in the gender, race, and ethnicity distributions of the U.S. workforce are well
documented by previous work (Toossi, 2002; Lee and Mather, 2008). There is also an extensive
literature that has looked at the potential effects of socioeconomic changes in the labor market on
overall unemployment patterns. That research showed that changes in the age distribution are of
substantial importance in explaining variation in unemployment over time, but changes in the
gender and race/ethnicity composition have had little role in explaining this variation (Shimer,
1999; Sincavage 2004; Duca and Campbell, 2007). There are also several studies that examined
industrial and occupational shifts in the U.S. economy and their role in explaining overall
unemployment patterns. For example, Groshen and Potter (2003) argue that industrial shifts and
the difficulty that workers have in transitioning to jobs in new industries are partly responsible
for the failure of employment to grow robustly following the 2001 recession. Hipple (1997,
1999) compared rates of permanent displacement for workers by gender, race, industry, and
occupation for the mid-1990s with rates in the 1980s, and provided a very detailed picture of the
Page 4
decline in job loss that occurred with the economic boom of the 1990s. Although not focused
explicitly on industrial and occupational shifts, Wolff (2005) argued that increases in computer
use – which he notes is strongly associated with occupational shifts – were largely responsible
for an upward trend in unemployment duration over the 30 years beginning in 1960.
There has also been much discussion of the extent and basis for gender differences in
unemployment. Nearly 30 years ago, Johnson (1983) argued that higher unemployment rates for
women were an artifact of women’s greater involvement in nonmarket work and so were not
indicative of inferior market treatment. Despite long-term growth until the 1990s, women’s
labor force participation rates remain below those for men (Juhn and Potter, 2006), so Johnson’s
claims suggest that unemployment rates may remain artificially inflated. In a time-series
analysis using data for 1956-2002, Wasmer (2009) found that rapid growth of the female labor
supply increased unemployment for women in the U.S. This suggests that we might expect
declines in relative female unemployment in the U.S. with the peaking of female labor force
participation rates in the 1990s. Mohanty (2003) examined unemployment data by gender for
1977, 1988, and 1996, arguing that lower observed wages for women reduced their
unemployment rates. His findings implied that if women’s wages had been at the same level as
men’s, this would have increased women’s unemployment rates by about two percentage points.
Since the gender gap in unemployment had disappeared by the 1990s, this implied that higher
underlying unemployment for women was partly hidden by wage differentials.
The gap in unemployment rates by race has been a longstanding topic of concern. Using the
1990 CPS, Stratton (1993) found that up to 40% of the unemployment gap between black and
white men could be explained by education and region, whereas other demographic factors
played little role. Dawkins et al. (2005) used the PSID for the early 1990s to show that the racial

Page 5
unemployment differential was at least partly due to job accessibility difficulties associated with
residential segregation. Garston et al. (2006) used 2003 CPS data to estimate racial differences
in employment probability in order to identify the extent of employer discriminatory preferences.
Ewing et al. (2005) developed a model to predict unemployment over the period 1972-1999,
disaggregating by gender and race. They showed that while unemployment volatility was
affected by aggregate shocks, these effects were substantially greater for men and for whites.
Similarly, Abbring et al. (2001) looked at unemployment for these subgroups, focusing on the
decomposition between incidence and duration. They concluded that differences between these
groups in basic unemployment patterns over the economic cycle were relatively unimportant.
Quenean and Sen (2009) looked at both the gender and racial unemployment gaps for 1972-2008
using time-series methods. They confirmed that the gender gap had largely disappeared,
whereas the racial gap, while declining, remained substantial.
Hispanic unemployment rates have historically been above non-Hispanic white rates.
Updating the analyses of DeFreitas (1986), Ewing et al. (2008) undertook a time-series analysis
of Hispanic unemployment and the gap between Hispanic and non-Hispanic unemployment for
the period 1976-2008. They showed that, although the gap was over 3 percentage points in the
early portion of the period, it declined appreciably over time. Their cyclical analysis showed
greater Hispanic responsiveness to business cycles and a decline in the gap reflecting a secular
trend not tied to cycle.
Perhaps surprisingly, there is limited work considering the role of the industrial and
occupational structure of employment in understanding demographic differences in the
unemployment rate. Over 25 years ago, DeBoer and Seeborg (1984) examined changes in the
gender unemployment rate gap based on a shift-share analysis using industry (see also Seeborg

Page 6
and DeBoer, 1987). They found that the greater concentration of women in services largely
explained the converging unemployment rate from 1975-1982. The shift-share approach they
used, however, is based on an assumption that unemployment differentials across industries
result from difficulties in moving between declining and growing industries; it does not adjust
for differences in the long-run unemployment rates by industry.
Rives and Sosin (2002) examined unemployment differentials by gender from 1982 through
1998, controlling for the occupational structure of employment. They found that unemployment
rates within occupation were higher for women than men, but that women were
disproportionately in low-unemployment occupations, causing overall levels to be similar by
gender in periods of economic growth. In periods of recession, unemployment in male-
dominated occupations increased more than in female occupations, causing male rates to exceed
female rates. Their work did not consider the role of industry. In a particularly insightful
analysis, Farlie and Sundstrom (1999) decomposed the black-white unemployment gap for the
period 1880-1990 into differences due to education/literacy, region, and industry. Prior to 1940,
black unemployment was not consistently higher than white unemployment. Their methods
were able to explain much of the variation in the gap through 1960, including an increase in
relative black unemployment. In contrast, for the period 1960-1990, their model explained a
much smaller share of the growth in relative black unemployment.
The work examining differentials in use of UI is still more limited. Wittenburg et al. (1999)
examined variation in UI receipt for the three recessions in the period 1975-1992, showing that
variation could not be explained by demographic factors such as age, race, or gender. Burtless
(2009) provided an extensive discussion of the impact of labor market changes on UI
participation, including discussion of occupational and industry distributions, although he did not

Page 7
explicitly focus on differential UI receipt by gender, race, or ethnicity. Similarly, Vroman (2002,
2008, and 2009) examined the correlates of the decision to file for UI and UI receipt, although
his analysis did not permit an estimate of how differentials by gender, race or ethnicity have
changed over time.
To the best of our knowledge, there are no studies that examine the role of the industrial and
occupational structure of the U.S. economy in understanding differences in unemployment by
gender, race or ethnicity using data since 1990. In short, there is no analysis that examines how
the remaking of the U.S. economy over the last two decades has influenced these important
demographic unemployment differentials. Given that there are substantial differences in both
industrial and occupational structure by gender, race, and ethnicity, trends in unemployment
differentials are expected to reflect changes in industry and occupation. In the face of observed
convergence in unemployment rates for these groups, it is of interest to see what commonalities
may exist in their unemployment experiences.
3. Historical Overview
The socioeconomic, industrial, and occupational composition of the U.S. labor force has
changed substantially over the past 50 years. In this section, we provide an overview of the most
important changes using CPS monthly data from 1948 through 2007, starting with the dramatic
increase in the number of women in the labor force. The left graph in Figure 1 illustrates how
women’s proportions of the labor force and the unemployed population have changed over time.1
From the 1950s to the late 1980s, women’s labor force proportion increased steadily, from just
over 30% to around 45%. During the 1990s and 2000s, the trend in women’s labor force
proportion flattened out, stabilizing at about 47%. The same figure shows that, until the 1980s,
1 Figures 1-5 are based on 12-month moving averages of monthly CPS data to remove seasonal effects.

Page 8
women were overrepresented in the unemployed population. For example, in the early 1950s,
women made up just over 30% of the labor force but 35-40% of the unemployed. By the early
1970s, both proportions had increased, and women were nearly 40% of the labor force and 45-
50% of the unemployed. Between 1970 and 1980, the female labor force proportion continued
to rise while the female proportion of the unemployed did not exhibit any upward trend. As a
result, by the early 1980s, the two proportions were no longer systematically different.
The right side of Figure 1 provides a direct comparison of unemployment rates by gender. In
the 1960s and 1970s, women had higher unemployment rates than men, but after 1980, the two
rates corresponded closely, except during recessionary periods, when men’s unemployment rates
were higher. The increase in women’s unemployment between the economic peak in 1980 and
the 1984 trough was 3 percentage points, compared to an increase of more than 5 percentage
points for men. Similar gender differentials are apparent for recessions in 1989-1992, when the
unemployment rate increased by 1.5 points for women and 2.4 points for men, and 2000-2004,
when the unemployment rate increased by 1.1 points for women and by 2.1 points for men.
Another important change in the U.S. labor market is the gradual increase in the proportion
of nonwhites in the labor force.2 As shown in the left graph of Figure 2, in the 1950s, nonwhites
accounted for 11% of the labor force, a proportion that did not change much through 1970.
Beginning in the 1970s, there was a steady increase in the nonwhites’ labor force proportion
until, by 2007, more than 18% of the labor force was nonwhite. We observe a similar pattern for
the nonwhite proportion of the unemployed. Between the early 1950s and the mid 1970s,
nonwhites accounted for about 20% of the unemployed. This proportion increased steadily
through 2007, when approximately 28% of the unemployed were nonwhites.
2 Nonwhites are mostly black, but include other races as well (Asians, American Indians, and those who identify with more than one race). Hispanics are discussed later; they are not classified as a racial group.
Page 9
Although nonwhite labor force participants were overrepresented among the unemployed,
between 1954 and 1974, changes over time in the labor force and unemployed proportions
corresponded closely. However, between 1974 and 2007, the nonwhite proportion of the
unemployed increased less rapidly than the percentage of nonwhites in the labor force. This
resulted in a decline in the unemployment rate gap between nonwhites and whites, as shown in
the right graph of Figure 2. The race gap in the unemployment rate declined from 9 percentage
points in the early 1980s recession to 6 percentage points in the early 1990s recession. By the
early 2000s recession, this gap declined to below 5 percentage points. Despite this decline,
nonwhites were still overrepresented in the unemployed population, so the nonwhite
unemployment rate remained appreciably above that for the general population.
Perhaps the most striking change in the U.S. labor market has been the increase in the
Hispanic labor force. As the left graph of Figure 3 shows, the Hispanic labor force proportion
increased from 4-5% in the early- to mid-1970s to 14% in 2007. The Hispanic proportion of the
unemployed was higher than the Hispanic proportion of the labor force in all years between 1973
and 2007. In the 1980s and early 1990s, the Hispanic proportion of unemployed grew at a faster
pace than the Hispanic proportion of the labor force, whereas, beginning in the mid-1990s, the
growth was slower, and the proportion exhibited no upward trend in the 2000s despite the
continued growth of the Hispanic labor force. These trends are reflected in the right graph of
Figure 3. The unemployment gap between Hispanic and non-Hispanic workers declined from
4.9 percentage points in the early 1980s recession to 4.3 percentage points at the trough of the
early 1990s recession; in the early 2000s recession, the ethnicity unemployment rate gap was
only 2.0 percentage points.
In the past few decades, there have been significant shifts in the industrial and occupational

Page 10
composition of the U.S. labor force. Figure 4 presents the experienced labor force proportions
(left graph) and unemployment rates (right graph) of four major industry groups: manufacturing,
services, trade, and other.3 The most dramatic change in the industrial structure is the shift from
manufacturing to services. Between 1976 and 2002, the manufacturing experienced labor force
share declined from 23% to 12%, while the services labor force share increased from 28% to
37%. The right graph in Figure 4 shows that, over the entire period, services had the lowest and
least volatile unemployment rate. In contrast, the manufacturing unemployment rate was the
most volatile of all sectors. These patterns indicate that the shift of the U.S. economy towards
services would lead to lower and less volatile overall unemployment rates.
The shift toward white collar jobs was also dramatic. As the left graph of Figure 5 shows,
there was a dramatic increase in white collar high skill occupations4 and a decline in blue collar
low skill occupations.5 White collar high skill occupations accounted for less than 18% of the
experienced labor force in the early 1980s and for 26% of the labor force in the early 2000s; blue
collar low skill occupations declined from 29% in the early 1980s to 24% in the early 2000s.
The right graph in Figure 5 shows that, over the entire period, blue collar workers had higher
unemployment rates than white collar workers. Notably, the unemployment rate gaps between
blue collar and white collar workers were lower in the past two decades, largely because of
declines in the unemployment rates of blue collar workers.
3 For clarity, we present only four industry categories. Figures 4-7 extended only through 2002 because a change in the classification of major industries and occupations makes comparisons with later years inconsistent. In subsequent sections, our analyses will be based on individual data so we will use more detailed categories, and the analyses will extend to 2007. 4 White collar high skill occupations include: CEOs and managers; professional specialty occupations; engineers and scientists; and health care occupations. White collar low skill occupations include: teachers, community and social services; sales; and office and administrative support occupations. 5 Blue collar high skill occupations include: protective service; installation, maintenance, and repair; transportation and material moving; construction workers; and production occupations. Blue collar low skill occupations include: building and grounds cleaning and maintenance; food preparation and serving; farming, fishing, and forestry; other service-related occupations; and laborers.
Page 11
4. Recent Changes in the Unemployment Experience, by Gender, Race, and Ethnicity
The above overview shows that the role of women, nonwhites, and Hispanics in the U.S.
labor force has grown substantially over time, while there was a dramatic shift in the types of
industries and occupations in which U.S. workers are employed. In this section, we focus on
recent patterns in the unemployment rate and UI receipt by gender, race and ethnicity, and
examine the degree to which these are related to the changing industrial and occupational
composition of the experienced labor force. For this analysis, we use data from the March CPS
Supplement from 1992 to 2007. The March CPS supplement includes not only the basic CPS
monthly data (demographics, industry and occupation, and labor force status), but also income
information for each respondent in the year prior to the survey. The latter information enables us
to identify individuals who received UI benefits in the year prior to the survey, which is critical
for analyzing trends and patterns in UI receipt.
In order to consider the role of industry and occupation in explaining unemployment patterns,
we focus on the subsample of the unemployed who were previously employed, the experienced
unemployed. Based on this measure, we define the experienced unemployment rate, which is the
ratio of the experienced unemployed to the experienced labor force (employed plus experienced
unemployed). Since the experienced unemployment rate omits new entrants in the labor force
who are unemployed (i.e., unemployed workers who do not have a prior job to report), this
measure is slightly lower than the overall unemployment rate. Below, we examine experienced
unemployment rate patterns by gender, race, and ethnicity between 1992 and 2007; in our
discussion, we briefly consider differences between the experienced unemployment rate from the
CPS March data and overall unemployment rate from the monthly CPS and the CPS March data.
We then discuss gender, race, and ethnic differences in the industrial and occupational

Page 12
employment distribution and examine the extent to which these differences explain
unemployment rate and UI receipt patterns for these key demographic groups.
4.1 Gender, Race, and Ethnicity Gaps in the Experienced Unemployment Rate
The top graph in Figure 6 presents the experienced unemployment rate between 1992 and
2007 by gender, based on March CPS data. The experienced unemployment rate was generally
lower for women than for men in the March CPS data, in contrast to the unemployment rate
based on a moving average of monthly CPS data, which imply very similar rates (Figure 1, right
graph). Further investigation showed that this was due to the fact that men were overrepresented
in industries that experience slowdowns during winter, most notably construction.6 Despite the
difference, the experienced unemployment rate patterns by gender based on the March CPS data
are very similar to the total unemployment rate patterns based on the CPS monthly data. Further,
the March CPS experienced unemployment rate gap by gender is almost identical to the March
CPS overall unemployment rate gap over the 1992-2007 period (Appendix Figure A1). This
shows that gender differences in labor market experience do not account for the gender
unemployment gap or for changes in that gap at any point between 1992 and 2007.
The middle graph in Figure 6 shows that nonwhites had higher experienced unemployment
rates than nonwhites during the entire 1992-2007 period. However, the race gap declined from
more than 5 percentage points in the early 1990s to about 3 percentage points in the 2000s. If
this trend continues over the next two decades, it is possible that differences in unemployment
between nonwhites and whites may be largely eliminated. We also find that the experienced
unemployment rate gap by race based on March CPS data is consistent with the gap in overall
unemployment rates based on the monthly CPS data (Figure 2, right graph) and the overall 6 Although the unemployment rate in construction is higher during winter months for both genders, the male rate is consistently higher and much more volatile than the female rate. This analysis is available upon request.

Page 13
unemployment rate based on March CPS data (Appendix Figure A2).
Experienced unemployment rate differences between Hispanics and non-Hispanics based on
1992-2007 March CPS data are shown in the bottom graph of Figure 6. During the entire period,
Hispanics had higher rates than non-Hispanics, but the gap declined over time. In the early
1990s, the experienced unemployment rate gap was over 3.5 percentage points, whereas it
declined to about 2 percentage points in the early 2000s. After 2004, this gap declined to less
than 1 percentage point. These patterns are generally consistent with the overall unemployment
rate gap based on the CPS monthly data (Figure 3, right graph) and the March CPS data
(Appendix Figure A3). In fact, a comparison of the ethnicity gaps in the experienced
unemployment rate and the overall unemployment rate based on the March CPS data (Appendix
Figure A3), shows that the two gaps were almost identical from 1992 through 2000. Since 2000,
the experienced unemployment rate gap has been about a quarter of a percentage point higher
than the overall unemployment gap, implying that new labor force entrants are less important
among unemployed Hispanics than they are among other unemployed workers. Despite this
difference, it is clear that limiting consideration to the experienced labor force makes little
difference in comparing Hispanics and non-Hispanics.
4.2 Gender, Race, and Ethnicity Differences in Industry and Occupation
Based on the March CPS industry classifications, we define 17 industry categories. Table 1
presents unemployment rates for these industry categories, aggregated for the period 1992-2007,
starting from the sector with the highest average unemployment rate (construction), to the sector
with the lowest unemployment rate (health care services) during that period.7 The same table
7 Industry categories reported in Table 1 are based on our tabulations of the March CPS microdata, which have been coded to correspond with the North American Industry Classification System, which was instituted in the early 2000s. These are not fully reconcilable with the industry categories used in Figure 4, which are based on aggregated data for earlier periods and use the Standard Industrial Classification system.

Page 14
reports the experienced labor force distribution by industry for each gender, race, and ethnicity in
the same period.
Table 1 shows that, during this period, the experienced labor force distribution across
industries was quite different for men and women. For example, only 1% of women were
employed in construction relative to 12% of men. Women were also less likely to be employed
in manufacturing (durables and non-durables), in the “other industries” category (e.g.,
agriculture, mining, fishing, and forestry), and in transportation, warehousing, and utilities. In
contrast, a greater proportion of women were employed in health care services and in education
and social services. Women were also more likely than men to be employed in the entertainment
and recreation sector, and slightly more likely to be employed in the finance, real estate, and
insurance sector. Overall, women were clearly less likely to be employed in high unemployment
sectors relative to men.
Table 1 also shows that the nonwhite and white experienced labor force distributions across
industries were only marginally different from one another. Notably, whites were more likely
than nonwhites to be employed in construction but were equally likely to be employed in the
remaining high-unemployment sectors. A slightly different story emerges for Hispanic and non-
Hispanic workers. Hispanics were somewhat more likely to be employed in high unemployment
sectors like construction, food services, and nondurable manufacturing, and less likely to be in
low unemployment sectors like education and social services, and health care services.
Using the occupation classification in the March CPS, we define 5 blue collar and 7 white
collar occupation groups. Table 2 presents average unemployment by occupation group between
1992 and 2007, along with the experienced labor force distributions across occupations during

Page 15
the same period by gender, race, and ethnicity.8 Experienced labor force distributions across
occupations for women and men were even more discrepant than the industrial distributions –
66% of women were employed in white collar occupations compared to 47% of men. Women
were underrepresented relative to men in the three occupation categories with the highest
unemployment rates: construction workers, farming, fishing, and forestry workers, and other
blue collar occupations (e.g., laborers, extraction workers, and material moving workers).
Women, on the other hand, were greatly overrepresented in the two occupation groups with the
lowest unemployment rates: teachers and social workers and health care occupations. Therefore,
it is possible that women’s unemployment rates are lower and less volatile than men’s
unemployment rates due to gender differences in the experienced labor force distributions across
occupations.
Table 2 shows that the experienced labor force distributions across occupations for nonwhites
and whites were quite similar. Nonwhites were slightly less likely to be employed in white
collar occupations. Nonwhites were underrepresented in some low unemployment occupation
groups, such as CEOs and managers, and sales occupations, but were overrepresented in others,
such as health care and office and administrative support. In contrast, the occupational
distribution of Hispanics was dramatically different from that of non-Hispanics. Hispanics were
much less likely to be employed in white collar occupations, with only 41% of Hispanics
employed in white collar occupations compared to 63% of non-Hispanics. In fact, Hispanics
were underrepresented in all white collar occupation categories relative to non-Hispanics and
were overrepresented in most blue collar jobs.
These findings are consistent with previous work on gender, race, and ethnicity differentials 8 Occupation tabulations in Table 2 use an occupational classification system that was adopted in the early 2000s and applied to existing March CPS microdata. These categories are not fully consistent with the categories reported in Figure 5, which are based on aggregated tabulations of the occupation classifications used for earlier periods.

Page 16
in industry and occupation. Gender differences in occupation are longstanding. Self-selection,
reflecting perhaps household division of labor and tastes, has been stressed by some as the
primary reason for such differences (Polachek, 1981), while others attribute these differences to
labor market discrimination (England, 1985). Recent work shows that, despite the convergence
in educational attainment and declining differences in labor force participation, gender
differences in occupation and industry remain large (Blau et al., 2006; Weinberg, 2007). Racial
differences by occupation and industry were once very large, reflecting, in part, substantial
educational differences. In recent years, in the face of improvements in relative human capital
and declines in labor market discrimination, industry and occupational differentials by race have
declined (Smith, 2001; Queneau, 2009). In contrast, the substantial job segregation by ethnicity
has declined very little (Queneau, 2009).
4.3 Decomposing the Experienced Unemployment Rate Gaps
4.3.1 Methods
Based on the figures presented above, it is evident that there are important differences in the
industry and occupation distribution of employment by gender, race, and ethnicity. In this
section, we examine the extent to which such differences affect the observed unemployment rate
gaps. Our goal is not to explain industry/occupation differences between these groups but rather
to examine whether such differences affect overall unemployment patterns. Our approach
involves adjusting the experienced unemployment rate of one group (e.g., women) to reflect the
industry-occupation employment distribution of the other group (e.g., men). The difference
between the adjusted rate for one group and the observed rate for the other group provides a
measure of the gap adjusted for differences in the employment distribution. We point out below
that the results we report are equivalent to those of the Oaxaca-Blinder decomposition where
Page 17
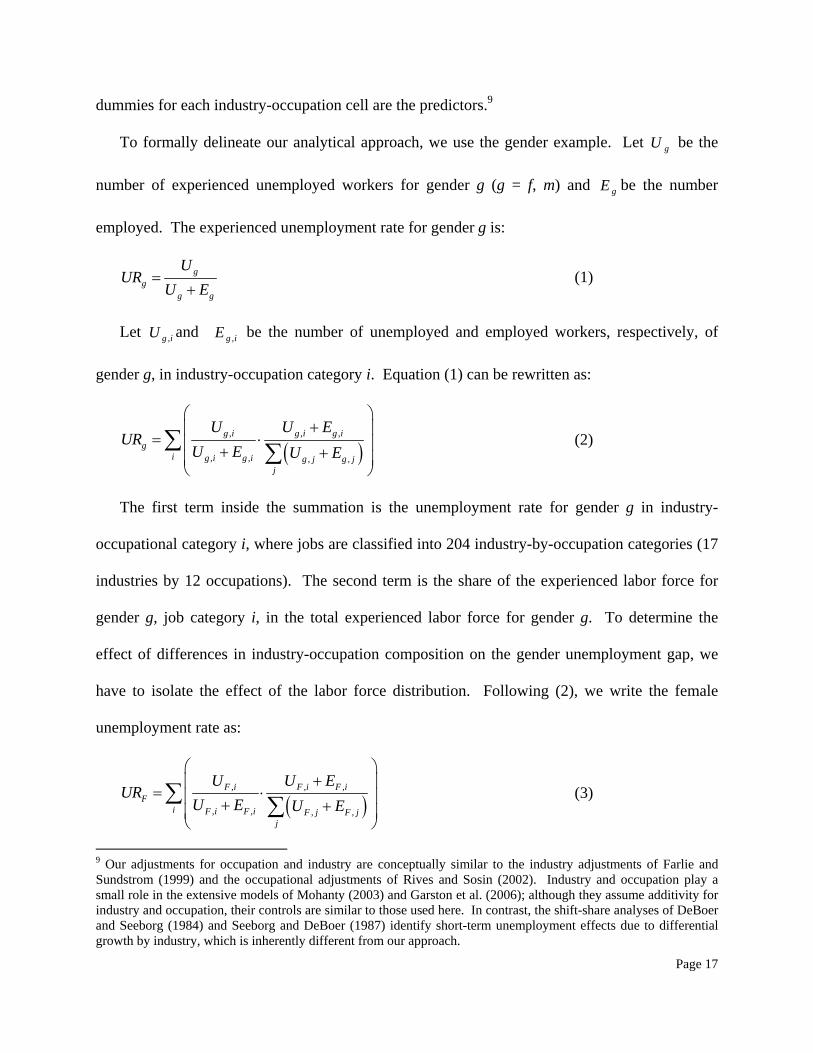
dummies for each industry-occupation cell are the predictors.9
To formally delineate our analytical approach, we use the gender example. Let gU be the
number of experienced unemployed workers for gender g (g = f, m) and gE be the number
employed. The experienced unemployment rate for gender g is:
gg
g g
UUR
U E=
+ (1)
Let igU , and igE , be the number of unemployed and employed workers, respectively, of
gender g, in industry-occupation category i. Equation (1) can be rewritten as:
( ), , ,
, , , ,
g i g i g ig
i g i g i g j g jj
U U EUR
U E U E
⎛ ⎞+⎜ ⎟
= ⋅⎜ ⎟+ +⎜ ⎟⎝ ⎠
∑ ∑ (2)
The first term inside the summation is the unemployment rate for gender g in industry-
occupational category i, where jobs are classified into 204 industry-by-occupation categories (17
industries by 12 occupations). The second term is the share of the experienced labor force for
gender g, job category i, in the total experienced labor force for gender g. To determine the
effect of differences in industry-occupation composition on the gender unemployment gap, we
have to isolate the effect of the labor force distribution. Following (2), we write the female
unemployment rate as:
( ), , ,
, , , ,
F i F i F iF
i F i F i F j F jj
U U EUR
U E U E
⎛ ⎞+⎜ ⎟
= ⋅⎜ ⎟+ +⎜ ⎟⎝ ⎠
∑ ∑ (3)
9 Our adjustments for occupation and industry are conceptually similar to the industry adjustments of Farlie and Sundstrom (1999) and the occupational adjustments of Rives and Sosin (2002). Industry and occupation play a small role in the extensive models of Mohanty (2003) and Garston et al. (2006); although they assume additivity for industry and occupation, their controls are similar to those used here. In contrast, the shift-share analyses of DeBoer and Seeborg (1984) and Seeborg and DeBoer (1987) identify short-term unemployment effects due to differential growth by industry, which is inherently different from our approach.

Page 18
and then adjust the female unemployment rate to the male distribution by applying the male
industry weights to Equation (3):
( ), , ,
, , , ,
F i M i M iADJF
i F i F i M j M jj
U U EUR
U E U E
⎛ ⎞+⎜ ⎟
= ⋅⎜ ⎟+ +⎜ ⎟⎝ ⎠
∑ ∑ (4)
This measure shows what the overall female unemployment rate would be if the female
unemployment rate within each industry-occupation cell remained the same but the female labor
force distribution across cells corresponded to that for males. It is equivalent to standardizing the
experienced labor force distribution of females to that of males. The difference between the
adjusted female unemployment rate ( ADJFUR ) and the actual male rate ( MUR ) provides one
measure of the unemployment gender gap after adjusting for gender differences in the
experienced labor force distributions.10 We can also use the same approach to adjust the male
unemployment rate to the female job distribution. Comparison of the adjusted male
unemployment rate ( ADJMUR ) to the actual female rate ( FUR ) provides an alternative measure of
the adjusted gender gap. Insofar as there is a positive association between male and female
unemployment rates across industry-occupation cells, these estimates will be similar.11
10 For example, let men and women be employed in only two industry/occupation groups, A and B; 50% of men in the experienced labor force are in A and 50% are in B, while 80% of women are in A and 20% are in B. Also assume that the unemployment rates for men are 4% for A and 8% percent for B, and for women are 5% for A and 10% for B. The actual overall unemployment rate would then be 6% for men (0.5 x 8% + 0.5 x 4%) and 6% for women (0.8 x 5% + 0.2 x 10%). So, even though women face higher unemployment rates than men within each group, men and women have the same overall unemployment rate. Our decomposition approach will adjust the women’s unemployment rate based on the men’s employment distribution (50% in A, 50% in B); thus, the adjusted unemployment rate for women would be 7.5% (0.5 x 5% + 0.5 x 10%). Comparing the actual male rate (6%) to the adjusted female rate (7.5%) reveals that women would have higher unemployment rates if they had the same employment distribution as men. This also shows that women face higher unemployment rates than men within industry-occupation group, when weighted by the male distribution. 11 The method requires modification for those industry-occupation cells that only contain men (for ADJ
FUR ) or only contain women ( ADJ
MUR ). In such cases, we use the unemployment rate for the industry-occupation cell that is available. Given the relatively small weight that applies to such cells, the exact method used in dealing with them does not affect the results.

Page 19
In terms of the Oaxaca-Blinder decomposition, URM – ADJFUR is the part of the gender
difference due to within-cell unemployment differentials, and ADJFUR – URF is the part due to the
distribution of employment across industry and occupation, taking the male employment
distribution as the base. Similarly, ADJMUR – URF and URM – ADJ
MUR are analogous measures
where the female employment distribution is taken as the base.
Our adjustment approach is limited to industry and occupation in order to focus attention on
the two elements that reflect important changes in the structure of employment over the period of
our study. It allows for us to interpret results in terms of relative unemployment within well-
defined job cells. However, it does leave open the possibility that there may be differences in
various characteristics across groups that partly explain unemployment gaps. Three obvious
possibilities are education, age, and region of the country. In order to test for such effects, we
predict unemployment for respondent i ( Ui ) as:
( )i Fi F NWi NW HISPi HISP INi OCi iU D D D D D Xβ β β γ δ= + + + × + (5)
where DFi, DNWi and DHISPi are dummies identifying women, nonwhites, and Hispanics; DINi x
DOCi is a collection of dummies identifying 204 industry by occupation categories; and Xi is a
vector of control variables, with coefficients estimated by ordinary least squares. This model
simplifies the previous structure in that it assume impacts of demographic characteristics are
additive.12 The regression results of models in (5) are discussed following the discussion of our
basic industry-occupation decomposition results.
12 To simplify interpretation, no interaction is fitted between the industry-occupation cell and the other variables, allowing us to identify a single impact of each measure. Such an assumption is consistent with our findings, reported below, showing that results are not sensitive to whether adjustment is to one distribution or the other.

Page 20
4.3.2 Results
Figure 7 presents the results of this exercise for gender. The adjusted female unemployment
rate, ADJFUR (black dashed line), was about 1 percentage point higher than the male
unemployment rate, MUR (grey solid line), between 2000 and 2007, even during the trough of
the 2002 recession. This indicates that within the same industry-occupation employment cell,
the unemployment rate for women was substantially higher than that for men between 1992 and
2007, based on a weighted average reflecting the male distribution across cells. This conclusion
also holds if we compare ADJMUR (grey dashed line) with FUR (black solid line), since ADJ
MUR is
below FUR for all years between 1992 and 2007. We can therefore conclude that if women held
the same jobs as men, their overall experienced unemployment rates would be higher than those
for men.
The graph shows that the lower volatility of the unemployment rate of women can also be
explained in part by the fact that women were less likely to be employed in cyclical sectors or
occupations. For example, between 2000 and 2003, as the labor market responded to the
recession, FUR increased by 1.2 percentage points, ADJFUR by 1.5 percentage points, and MUR by
2.0 percentage points. These numbers suggest that about a third of the volatility difference
between FUR and MUR , is explained by gender differences in employment by industry and
occupation. The conclusion is very similar based on the volatility of ADJMUR .
This same analysis is performed by race. Figure 8 shows that adjusting the nonwhite
unemployment rate for the white industry-occupation distribution does not explain the racial
unemployment gap or the racial differences in volatility. Similarly, adjusting white
unemployment to the nonwhite employment distribution has essentially no impact. Clearly,

Page 21
racial disparities in unemployment cannot be attributed to racial differences in the labor force
distribution across industry and occupation. Therefore, the nonwhite-white unemployment gap
reflects the fact that nonwhites face higher unemployment rates than whites within industry-
occupation cells. We find in fact that, between 1992 and 2007, nonwhites had higher average
unemployment rates than whites in 157 out of the 204 industry-occupation categories.
Figure 9 presents the actual and adjusted experienced unemployment rate by ethnicity. The
adjusted Hispanic experienced unemployment rate (black dashed line) is consistently 1
percentage point lower than the actual Hispanic rate (black solid line), indicating that differences
in the industry-occupation distribution plays an important role in accounting for the higher
unemployment rate observed for Hispanics. Comparing the adjusted Hispanic experienced
unemployment rate with the actual non-Hispanic rate (grey solid line), we find that, between
1992 and 1998, about half the unemployment gap was explained by differences in the labor force
distributions across industries and occupations between the two groups. After 1998 through the
early 2000s nearly three quarters of the gap was explained by such differences, and, by the
middle of the decade, the adjusted Hispanic unemployment rate was identical to the non-
Hispanic rate. Therefore, although differences in the labor force distributions cause Hispanic
unemployment to be higher, this effect has not changed over time, even as the unemployment
gap by ethnicity has declined. Looking at the adjustment of the non-Hispanic unemployment
rate for the Hispanic labor force distribution provides a very similar conclusion, although the
impact of the adjustment was somewhat smaller at the beginning of the study period. After the
recession of the early 2000s, differences in the labor force distribution by industry and
occupation account for slightly more than the observed gap in unemployment.
These results show that differences in the types of jobs held by workers in key demographic
Page 22
groups often play an important role in their overall unemployment rates. Women are
disproportionately employed in jobs with low unemployment and low business cycle volatility,
which reduces their overall unemployment and its volatility. Given that unadjusted
unemployment is similar for men and women, the implication of this result is that women have
higher unemployment rates than men once we control for the types of jobs they hold. In
contrast, the remaining nonwhite-white unemployment gap cannot be attributed to racial
disparities in the employment distribution. Our most notable finding is that not only has the
unemployment rate for Hispanics been steadily converging to that for non-Hispanics, but
controlling for differences in the industrial and occupational employment distribution eliminates
most of the remaining difference. This suggests that, although Hispanics are concentrated in
blue collar occupations with high levels of unemployment, their unemployment rates are similar
to others within those occupations.
As noted above, we also fitted models that include controls for gender, race and ethnicity
together, as well controls for age, education and region in examining the impacts of occupation
and industry. Results are presented in the Appendix Table A1, with analyses focused on three
time periods (1992-1994, 1995-2000, and 2001-2007). When we control only for gender, race,
and ethnicity (columns 1, 4, and 7), results show that women’s unemployment rates are, on
average, nearly two percentage points below those of men during the recession of the early
1990s, and less than a percentage point for the more recent periods. When controls for industry
and occupation are included (columns 2, 5, and 8), consistent with the decomposition results of
Figure 7, the increment becomes positive, in the range of about a half a percentage point. When
age, education, and region are included as controls (columns, 3, 6, and 9), although the positive
increment declines slightly, it remains close to half a percentage point. We also examined

Page 23
models that control for age, education, and region without controlling for industry or occupation
(estimates not reported), and such adjustments had no impact on the gender gap. These results
confirm the importance of industry and occupation in explaining gender unemployment gaps and
clearly show that other measured demographic factors have no impact on substantive
conclusions.
In the case of race, again the estimates from our alternative model presented in Table A1
confirm the results presented earlier. The racial gap in unemployment, estimated to be 4.4
percentage points in the early 1990s, 3.6 points in 1995-2000, and 3.3 points in 2001-2007, is
reduced very little by controls for occupation and industry or controls for age, education and
region. In large part this is because differences across race on these measures are small.13
In contrast, the analyses for Hispanics suggest that there are important additional factors
beyond occupation and industry that mediate the unemployment gap. The estimates of the
unadjusted gap (columns 1, 4, and 7), consistent with Figure 9, show a decline from nearly 4
percentage points to less than 2 percentage points over the period of our study. Controlling for
occupation and industry reduces the gap by 1 to 1.5 percentage points. However, we found that
these reductions largely reflected differences in education; Hispanics have substantially lower
levels of education than non-Hispanics as a group. In fact, specifications that included only
education (coefficients not reported), showed that education alone explains about 2 percentage
points of the observed unemployment differential. Controls for industry, occupation, and other
factors together only explain an additional half percentage point.
Looking at the most recent period, results imply that when all the factors we have considered
are controlled, adjusted Hispanic unemployment rates are 0.7 percentage points lower than those
13 Nonwhites are more likely to live in the South, but regional differences in unemployment rates are not substantial enough to alter our results.
Page 24
of non-Hispanics. In short, controls for those additional factors suggest that the relative
improvement in the position of Hispanics leaves them relatively more advantaged than implied
by controls for industry and occupation. It is worth noting that, for Hispanics, there may be
important unmeasured differences that are of importance. Hispanics differ in a variety of ways
from non-Hispanics, including immigrant status, English language skills, and related factors. An
attempt to take such factors into account would put us far beyond the scope of the analysis here.
4.4. Gender, Race, Ethnicity and the Unemployment Insurance Program
Changes in the U.S. labor force over the past few decades may have also affected the
proportions of women and minorities who receive Unemployment Insurance (UI).14 In this
section, we examine disparities in the utilization of UI benefits by gender, race, and Hispanic
ethnicity. We also examine how differences in the industry and occupation distribution of the
experienced labor force for these groups affect differences in participation in the UI program.
We use information on income sources for the prior year reported in the CPS March Supplement,
which includes UI benefits received, to calculate the number of UI recipients in the prior year.
We construct the UI receipt rate by dividing the total number of individuals in the March CPS
receiving UI at some point in the prior year by an estimate of the labor force in that year.15 Then,
14 The UI program is designed and implemented by states but must conform to federal guidelines. Federal legislation specifies that the program serve those who have lost their jobs through no fault of their own and are available for work. See Nicholson and Needels (2006) for a review of the UI program. 15 Labor force in the previous year is estimated as the number of individuals in the March CPS with earnings or with UI benefits in the previous year. Unemployed individuals who did not receive UI benefits and were never employed during the year are therefore omitted. The receipt rate constructed here differs from a measure of UI participation at a single point in time both because the time period for receipt covers a full year and because occupation and industry apply to March, when the survey was taken, in the subsequent year. Note that our analysis of unemployment above is based on reports of employment status at the time of the March survey, so it is not subject to these limitations. These measures of UI benefit receipt could cause bias in our estimates of group differentials if some groups were appreciably more likely to be omitted from the risk pool than others because they were unemployed but received no UI payments. Although such selection may exist, we would expect such individuals to be disproportionately individuals with no labor market experience, given that this group is not eligible for UI benefits. Our comparisons reported above between the overall and experienced unemployment rate differentials suggest that the bias due to this difference is minor.

Page 25
we use the same method as in the previous section to adjust the UI receipt rates for the industry
and occupation distribution of the experienced labor force, allowing us to determine the degree
to which disparities in UI receipt by gender, race, and ethnicity can be attributed to differences in
the experienced labor force distributions.
Figure 10 presents the UI receipt rate by gender.16 Comparing the actual UI receipt rate
between women (black solid line) and men (grey solid line), it is clear that female labor force
participants were generally less likely than their male counterparts to receive UI benefits.
Comparing the two recessions, in 1992, 5.3% of women and 8.5% of men received UI benefits,
whereas, in 2003, 4.2% of women and 5.9% of men received UI benefits. Although the UI
receipt rate was countercyclical for both genders, male receipt was significantly more volatile.
During the period of economic growth in the 1990s, the UI receipt rate declined by 5.5
percentage points for men but only 2.4 percentage points for women; in the early 2000s, the
growth in the UI receipt rate was 3.0 points for men but only 1.2 points for women.
Part of the difference between male and female UI receipt rates may be a product of gender
differences in the industry and occupation distribution. The black dashed line in Figure 10
shows that, if we adjust the women’s UI receipt rate to the men’s industry and occupation
distributions, the adjusted UI receipt rate for women is equal to or exceeds the actual UI receipt
rate for men. The lower observed UI receipt rate for women is therefore more than explained by
the types of jobs they hold. Adjusting the men’s UI receipt rate (grey dashed line) provides a
similar conclusion, with the gender difference in the UI receipt rate largely eliminated.
The greater cyclical variability for men is also explained in part by industry and occupation.
We see that when we adjust the women’s UI receipt rate for job type, cyclical sensitivity
16 Note that the period covered in Figures 10-12 is 1991-2006, reflecting the fact that UI benefit receipt refers to the prior year, rather than 1992-2007 for unemployment in prior graphs, which applied to the year of the survey.

Page 26
increases, although the adjusted trough-to-peak variation remains generally lower for women
than it is for men. Similarly, the adjusted UI receipt rate for men has lower cyclical sensitivity
than their actual UI receipt rate. Either adjustment yields a pattern for which the peak-to-trough
change is an approximate compromise between the patterns for men and women, so, roughly
speaking, about half the gender difference in the cyclical sensitivity of the UI receipt rate is
explained by industry and occupation.
Figure 11 shows that the nonwhite and white UI receipt rates (solid black and solid grey
lines, respectively) were very similar through the 1990s, but, beginning in about 2000, the
nonwhite rate was higher by about half a percentage point. Since the racial unemployment rate
gap after 2000 was about 2 percentage points (see Figure 8) and the UI receipt rate gap was
appreciably less than 1 percentage point, unemployed nonwhites were less likely to receive UI
benefits than unemployed whites. This may reflect the fact that, even in the same industries and
occupations, nonwhites suffer greater employment instability and lower earnings, making them
less likely to meet states’ minimum earnings or employment requirements (Holzer, 2000; Lee,
2004). They may also be more likely to separate from jobs under circumstances that make them
ineligible for benefits, that is, they may be more likely to quit their jobs or be dismissed for cause
(Rangarajan and Razafindrakoto, 2004; Vroman, 2008). The dashed lines show that adjustments
for industry and occupation have no important role in explaining UI benefit receipt differences.
Figure 12 presents the UI receipt rates for Hispanic and non-Hispanic labor force participants
between 1991 and 2006. As we might expect, the UI receipt rate for Hispanics was higher than
that for non-Hispanics in the early 1990s, a period during which the Hispanic unemployment rate
was also higher. However, the gap in the unemployment rate was approximately 4 percentage
points (see Figure 9), much larger than the UI receipt rate gap, which was less than 1 percentage

Page 27
point. Following 2000, the UI receipt rate gap disappears and, after 2004, non-Hispanics became
slightly more likely to receive UI benefits than Hispanics.
Figure 12 shows that adjusting the Hispanic UI receipt to the non-Hispanic employment
distribution implies that, until the late 1990s, the entire difference in UI receipt was explained by
industry and occupation. By the end of our study period, we see that UI receipt rates for
Hispanics adjusted for industry and occupation were appreciably below those for non-Hispanics.
We also see that when we adjust the non-Hispanic UI receipt rates for the Hispanic employment
distribution, the non-Hispanic UI receipt rate is appreciably higher than those observed for
Hispanics. Both results imply that, within industry-occupation cells, Hispanic UI receipt rates
were, on average, 1.0 to 1.5 percentage points lower than those of non-Hispanics. Given that the
adjusted unemployment rates for Hispanics and non-Hispanics are similar by the end of our
period (Figure 9), this implies a lower take-up rate for unemployment Hispanics. The lower
take-up rate may indicate that Hispanic labor force participants are less likely to know that they
are eligible to receive UI benefits if they become unemployed (Vroman, 2008). Unemployed
Hispanics may also be less likely to be eligible to receive UI benefits compared to unemployed
non-Hispanics, as a result of work history or citizenship status (Hansen, 2006).
We also fitted models predicting UI receipt that control for additional measures, using the
approach corresponding with model (5). Table A2 shows that controls for age, education, and
region had minimal impacts on our estimates of the UI receipt differences by gender or race. For
both measures, these factors alter the adjusted gap by no more than a fifth of a percentage point.
Perhaps surprisingly, given the importance of such measures in explaining the ethnicity gap in
unemployment, adjustment for these factors altered the UI receipt difference between Hispanics
and non-Hispanics very little, by no more than one tenth of a percentage point. In conclusion,

Page 28
results based on a model that controls for a variety of factors in addition to industry and
occupation, are fully consistent with those of our primary analyses.
5. Discussion and Conclusion
Our analyses show that, as the female proportion of the labor force has increased in the past
50 years, the female unemployment rate has converged with the male unemployment rate.
However, we find that there remained substantial gender differences in the employment
distribution by industry and occupation, and that these differences had a large effect on the
gender unemployment rate gap. When we adjust for such differences, the female unemployment
rate is higher than the male unemployment rate. Our analysis also indicates that women were
appreciably less likely than men to receive UI benefits in the past two decades. However, this
difference is explained by differences in the industry-occupation distribution; in fact, women in
the same kinds of jobs as men had the same or greater likelihood of receiving UI benefits. But
given that their unemployment rates after adjustment for type of job are above those of men,
unemployed women are somewhat less likely to receive UI than unemployed men.
These results belie the claims that the convergence of unemployment rates reflects a growing
similarity in the experiences of men and women in the labor market. On the contrary, when we
compare men and women in similar jobs, substantial difference in unemployment and UI receipt
suggest that their experiences are largely discrepant. In an earlier period, much emphasis was
placed on disparities in the types of jobs that men and women held, with policy efforts focused
on “comparable worth” policies that attempted to raise wages in female-dominated jobs
(Killingsworth, 1990). The analysis here confirms the view that gender segregation remains
important, but it suggests that gender differences are not exclusively due to such segregation. In
a broader sense, our results are consistent with those who find that gender wage differentials are
Page 29
substantial even when occupation and personal characteristics are taken into account (Weinberg,
2007; Miller, 2008). Whether due to direct discrimination, social pressure or personal choice,
differential labor market experiences by gender remain significant.
Racial differences in unemployment are of longstanding importance. Even the most casual
reference to unemployment and UI statistics reveals that nonwhite levels of unemployment
remain substantially above those for whites. Despite this conclusion, our analyses provide some
evidence of convergence. In the last decade, the nonwhite increment in unemployment rates has
declined somewhat; while differences remain large, they are less dramatic than they were two
decades ago. Although nonwhites were more likely to experience unemployment than whites,
the UI receipt rates for the two groups were not very different. This indicates that unemployed
nonwhites were less likely than unemployed whites to receive UI benefits.
In contrast to the case of gender, the unemployment gap by race is not influenced by the
occupation or industry distribution of employment, primarily because differences in the
distribution by race are small, and, secondly, because racial differences in occupation and
industry are not related to differences in rates of unemployment. For those who would attempt to
address differential unemployment by pursuing policies to assure that blacks have the same jobs
as whites, these results are notably discouraging. Insofar as the solution lies in human capital
development, it will require augmenting skills within jobs rather than providing training for new
jobs. Our conclusions suggest that the same factors that cause nonwhite earnings to trail those of
whites may be relevant for explaining the unemployment gap.
The story of Hispanics is more clearly one of convergence. In the face of growth in the
number of Hispanics in the labor market, the unemployment gap between Hispanics and non-
Hispanics has declined dramatically. When we adjust for differences in the industry-occupation

Page 30
distribution, we find that the Hispanic unemployment rate in the last several years is essentially
the same as the non-Hispanic unemployment rate. We do find that Hispanics are now somewhat
less likely to receive UI benefits, although differences are fairly modest. Overall, the evidence
suggests that, at least in terms of unemployment patterns, Hispanic labor force participants are
becoming increasingly similar to non-Hispanic labor force participants. Given the large share of
Hispanics who are recent immigrants (Hansen, 2006), we would expect over time that their
occupational distribution would tend to converge to that of non-Hispanics (White and Glick,
2009, chapter 6), causing the gap in overall unemployment to decline. Policies to aid Hispanics
in training for better jobs might well support moves toward labor market parity.
We conclude that the experiences of the three groups are less similar than they appear on the
surface. Both women and Hispanics have markedly different industrial and occupational
distributions than non-Hispanic men, and the apparent convergence in unemployment hides
substantial underlying differences in average rates within industry and occupation. The cases of
women and Hispanics clearly differ from that of nonwhites, whose industrial and occupational
composition plays no role in explaining continued higher unemployment levels. Our results
illustrate the importance of considering the industry and occupation distribution in analyses of
unemployment and UI receipt patterns by major demographic groups in the U.S. labor force.
This is particularly true for analyses of differences in the unemployment experience between
men and women and between Hispanics and non-Hispanics. In contrast, racial differences in the
types of jobs do not influence the overall differences in the unemployment experience for
nonwhites and whites. In addition, our findings reemphasize the important demographic,
industrial, and occupational shifts in the U.S. economy and shed more light on how these
changes may affect overall unemployment and UI receipt patterns.
Page 31
References
Abbring J.H., van den Berg G.J., van Ours J.C. (2001). Business Cycles and Compositional
Variation in U.S. Unemployment. Journal of Business and Economic Statistics, Vol. 19, No. 4, pp. 436-448.
Blau F.D, Ferber M.A., Winkler A.E. (2006). The Economics of Women, Men, and Work. Fifth
Edition. Upper Saddle River, NJ: Prentice Hall. Burtless G. (2009). Trends in the Structure of the Labor Market and Unemployment:
Implications for U.S. Unemployment Insurance. ETA Occasional Paper 2009-9, U.S.
Department of Labor. Dawkins C.J., Shen Q., Sanchez T.W. (2005). Race, Space, and Unemployment Duration. Urban
Economics, Vol. 58, pp. 91-113.
DeBoer L., Seeborg M. (1984). The Female-Male Unemployment Differential: Effects of Changes in Industry Employment. Monthly Labor Review, November 1984, pp. 8-15.
DeFreitas G. (1986). A Time-Series Analysis of Hispanic Unemployment. Journal of Human
Resources, Vol. 21, No. 1, pp. 24-43.
Duca J.V., Campbell C.M. (2007). The Impact of Evolving Labor Practices and Demographics on U.S. Inflation and Unemployment. Federal Reserve Bank of Dallas Working Paper 0702.
England P. (1985). The Failure of Human Capital Theory to Explain Occupational Sex
Segregation. Journal of Human Resources, Vol. 17, pp. 358-70. Ewing B.T., Reyes A.L. III, Thompson M.A., Wetherbe J.C. (2008). Examination and
Comparison of Hispanic and White Unemployment Rates. Journal of Business Valuation and
Economic Loss Analysis, Vol. 3, No. 1, Article 11. Ewing B. T., Levernier W., Malik F. (2005). Modeling Unemployment Rates by Race and
Gender: A Nonlinear Time Series Approach. Eastern Economic Journal, Vol. 31, No. 3, pp.
333-347. Fairlie R.W., Sundstrom W.A. (1999). The Emergence, Persistence, and Recent Widening of the
Racial Unemployment Gap. Industrial and Labor Relations Review, Vol. 52, No. 2, pp. 252-
270. Garston N., Larson T., Mohanty M.S. (2006). A Voucher Supplement to Existing Anti-
Discrimination Programs in the Job Market. Eastern Economic Journal, Vol. 32, No. 2, pp.
331-354.
Groshen E.L., Potter S. (2003). Has Structure Change Contributed to a Jobless Recovery?
Page 32
Federal Reserve Bank of New York, Vol. 9, No. 8, pp. 1-7.
Hansen G. (2006). Illegal Migration from Mexico to the United States. Journal of Economic Literature, Vol. 44, pp. 869-924.
Hipple S. (1997). Worker Displacement in an Expanding Economy. Monthly Labor Review,
December 1997, pp. 25-39. Hipple S. (1999). Worker Displacement in the Mid-1990s. Monthly Labor Review, July 1999.
Holzer H.J. (2000). Unemployment Insurance and Welfare Recipients: What Happens When the
Recession Comes? The Urban Institute Paper Series A, No. A-46. Johnson J. (1983). Sex Differentials in Unemployment Rates: A Case for No Concern. Journal of
Political Economy, Vol. 91, No. 2, pp. 293-303.
Juhn C., Potter S. (2006). Changes in Labor Force Participation in the United States. Journal of
Economic Perspectives, Vol. 20, No. 3, pp. 27-46. Killingsworth M.R. (1990). The Economics of Comparable Worth. Kalamazoo, Michigan:
Upjohn.
Lee C.H. (2004). The Role of State Policies and Discrimination in Reducing the Chances of African Americans Receiving Unemployment Insurance. Review of Black Political Economy,
Vol. 32, No. 2, pp. 55-59.
Lee M.A., Mather M. (2008). U.S. Labor Force Trends. Population Bulletin, Vol. 63, No. 2, June 2008, pp. 3-16.
Miller P.W., (2009). The Gender Pay Gap in the US: Does Sector Make a Difference? Journal of
Labor Research, Vol. 30, pp. 52-74. Mohanty M. S. (2003). The Equality of Male and Female Unemployment Rates in the U.S.
Labor Market in the Late 1980s. Eastern Economic Journal, Vol. 29, No. 1, pp. 69-92.
Polachek S. (1981). Occupational Self-Selection: A Human Capital Approach to Sex Differences
in Occupational Structure. Review of Economics and Statistics, Vol. 63, pp. 60-69.
Nicholson W., Needels K. (2006). Unemployment Insurance: Strengthening the Relationship
between Theory and Policy. Journal of Economic Perspectives, Vol. 20, No. 3, pp. 47-70. Queneau H. (2009) Trends in Occupational Segregation by Race and Ethnicity in the USA:
Evidence from Detailed Data. Applied Economics Letters, Vol. 16, pp. 1347-1350.
Queneau H., Sen A. (2009). Regarding the Unemployment Gap by Race and Gender in the United States. Economics Bulletin, Vol. 29, No. 4, pp. 2749-2757.
Rangarajan A., Razafindrakoto C. (2004). Unemployment Insurance as a Potential Safety Net for
TANF Leavers: Evidence from Five States. Final Report. Mathematica Policy Research for
Page 33
the U.S. Department of Health and Human Services.
Rives J., Sosin K. (2002). Occupational and Cyclical Behavior of Gender Unemployment Rates. Journal of Socio-Economics, Vol. 31, pp. 287-299.
Seeborg M., DeBoer L. (1987). The Narrowing Male-Female Unemployment Differential.
Growth and Change, Vol. 13, pp. 24-37. Shimer R. (1999). Why is the U.S. Unemployment Rate So Much Lower? NBER
Macroeconomics Annual 1998, 1999, Vol. 13, (Cambridge, Mass: MIT Press) pp. 11-61.
Sincavage J.R. (2004). The Labor Force and Unemployment: Three Generations of Change. Monthly Labor Review, June 2004, pp. 34-41.
Smith J.P. (2001). Race and Ethnicity in the Labor Market: Trends Over the Short and Long
Term. Pp. 52-97 in National Research Council, America Becoming: Racial Trends and Their
Consequences (Neil Smelser et al., Eds.). Washington, DC: National Academy Press. Stratton L.S. (1993). Racial Differences in Men’s Unemployment. Industrial and Labor
Relations Review, Vol. 46, No. 3, pp. 451-463.
Toossi M. (2002). A Century of Change: The U.S. Labor Force, 1950-2050. Monthly Labor Review, May 2002, pp. 15-28.
Vroman W. (2002). Low Benefit Recipiency in State Unemployment Insurance Programs. ETA
Occasional Paper 2002-2, U.S. Department of Labor. Vroman W. (2008). An Analysis of Unemployment Insurance Non-Filers: 2005 CPS Supplement
Results, ETA Occasional Paper 2009-7, U.S. Department of Labor.
Vroman W. (2009). Unemployment Insurance Recipients and Nonrecipients in the CPS. Monthly Labor Review, October 2009, pp. 44-53.
Wasmer E. (2009). Links between Labor Supply and Unemployment: Theory and Empirics.
Journal of Population Economics, Vol. 22, pp. 773-802.
Weinberg D.H. (2007). Earnings by Gender: Evidence from Census 2000. Monthly Labor
Review, July/August 2007, pp. 26-34.
White M., Glick J.E. (2009). Achieving Anew: How New Immigrants Do in American Schools, Jobs, and Neighborhoods. New York: Russell Sage.
Wittenburg D.C., Fishman M., Stapleton D., Scrivner S., Tucker A. (1999). Literature Review
and Empirical Analysis of Unemployment Insurance Recipiency Ratios, Final Report Prepared by the Lewin Group for the U.S. Department of Labor.
Wolff E.N. (2005). Computerization and Rising Unemployment Duration. Eastern Economic
Journal, Vol. 31, pp. 507-536.

Page 34
Figure 1: Labor Force Proportions, Unemployed Proportions, and Unemployment Rate, by Gender, 1948-2007
25
30
35
40
45
50
55
Women Proportion of the Unemployed Women Proportion of the LF
2
3
4
5
6
7
8
9
10
11
Men Women
Unemployment Rate
Source: Current Population Survey monthly values, 1948-2007. Values represent 12-month centered moving averages.
Figure 2: Labor Force Proportions, Unemployed Proportions, and Unemployment Rate, by Race, 1954-2007
8
12
16
20
24
28
32
Nonwhites Proportion of the Unemployed Nonwhites Proportion of the LF
2
4
6
8
10
12
14
16
18
20
Whites Nonwhites
Unemployment Rate
Source: Current Population Survey monthly values, 1948-2007. Values represent 12-month centered moving averages.

Page 35
Figure 3: Labor Force Proportions, Unemployed Proportions, and Unemployment Rate, by Ethnicity, 1973-2007
3
6
9
12
15
18
Hispanics Proportion of the Unemployed Hispanics Proportion of the LF
3
5
7
9
11
13
15
Non-Hispanics Hispanics
Unemployment Rate
Source: Current Population Survey monthly values, 1948-2007. Values represent 12-month centered moving averages.
Figure 4: Experienced Labor Force Proportions and Unemployment Rate, by Industry, 1976-2002
10
15
20
25
30
35
40
Manufacturing Services Trade Other
Labor Force Proportions
2
4
6
8
10
12
Manufacturing Services Trade Other
Unemployment Rate
Source: Current Population Survey monthly values, 1948-2007. Values represent 12-month centered moving averages.
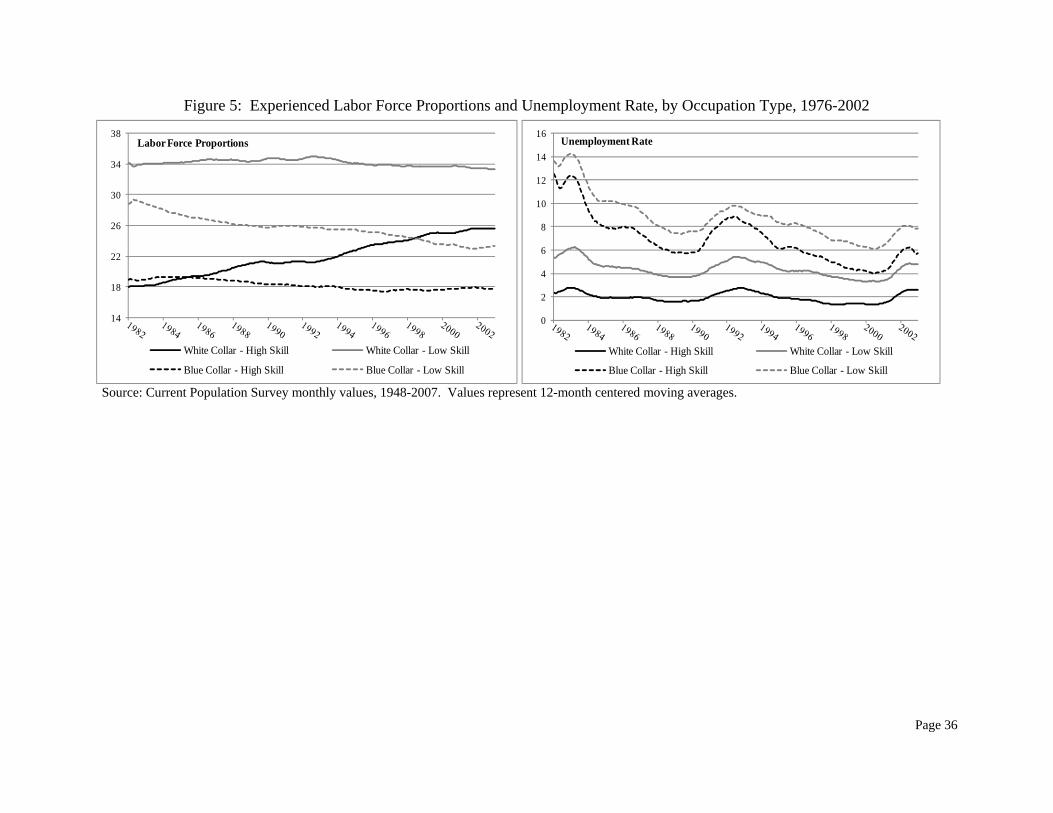
Page 36
Figure 5: Experienced Labor Force Proportions and Unemployment Rate, by Occupation Type, 1976-2002
14
18
22
26
30
34
38
White Collar - High Skill White Collar - Low Skill
Blue Collar - High Skill Blue Collar - Low Skill
Labor Force Proportions
0
2
4
6
8
10
12
14
16
White Collar - High Skill White Collar - Low Skill
Blue Collar - High Skill Blue Collar - Low Skill
Unemployment Rate
Source: Current Population Survey monthly values, 1948-2007. Values represent 12-month centered moving averages.
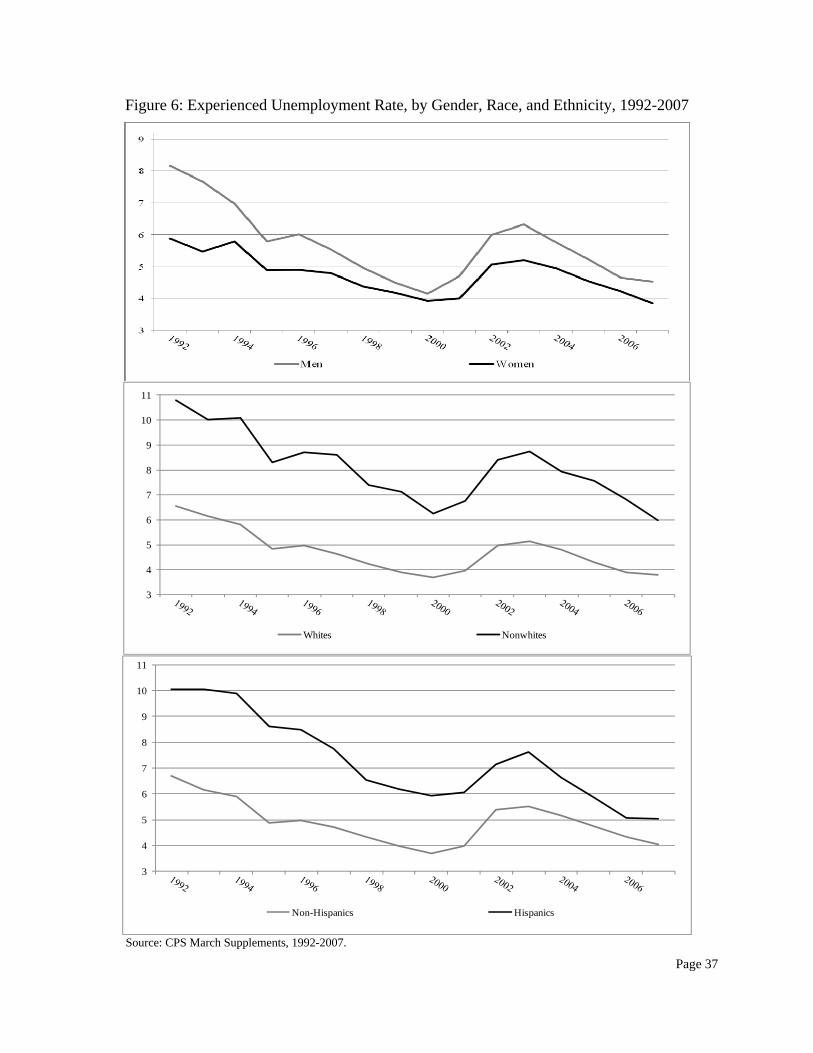
Page 37
Figure 6: Experienced Unemployment Rate, by Gender, Race, and Ethnicity, 1992-2007
3
4
5
6
7
8
9
10
11
Whites Nonwhites
3
4
5
6
7
8
9
10
11
Non-Hispanics Hispanics
Source: CPS March Supplements, 1992-2007.

Page 38
Figure 7: Experienced Unemployment Rate, by Gender, Actual and Adjusted for Industry-Occupation
3
4
5
6
7
8
9
Men - Actual Men - Adjusted Women - Actual Women - Adjusted
Source: CPS March Supplements, 1992-2007. Solid lines represent the actual experienced unemployment rates. Dashed lines represent the experienced unemployment rates adjusted for the industry-employment distribution of the comparison group.
Figure 8: Experienced Unemployment Rate, by Race, Actual and Adjusted for Industry-Occupation
3
4
5
6
7
8
9
10
11
Whites - Actual Whites - Adjusted Nonwhites - Actual Nonwhites - Adjusted
Source: CPS March Supplements, 1992-2007. Solid lines represent the actual experienced unemployment rates. Dashed lines represent the experienced unemployment rates adjusted for the industry-employment distribution of the comparison group.
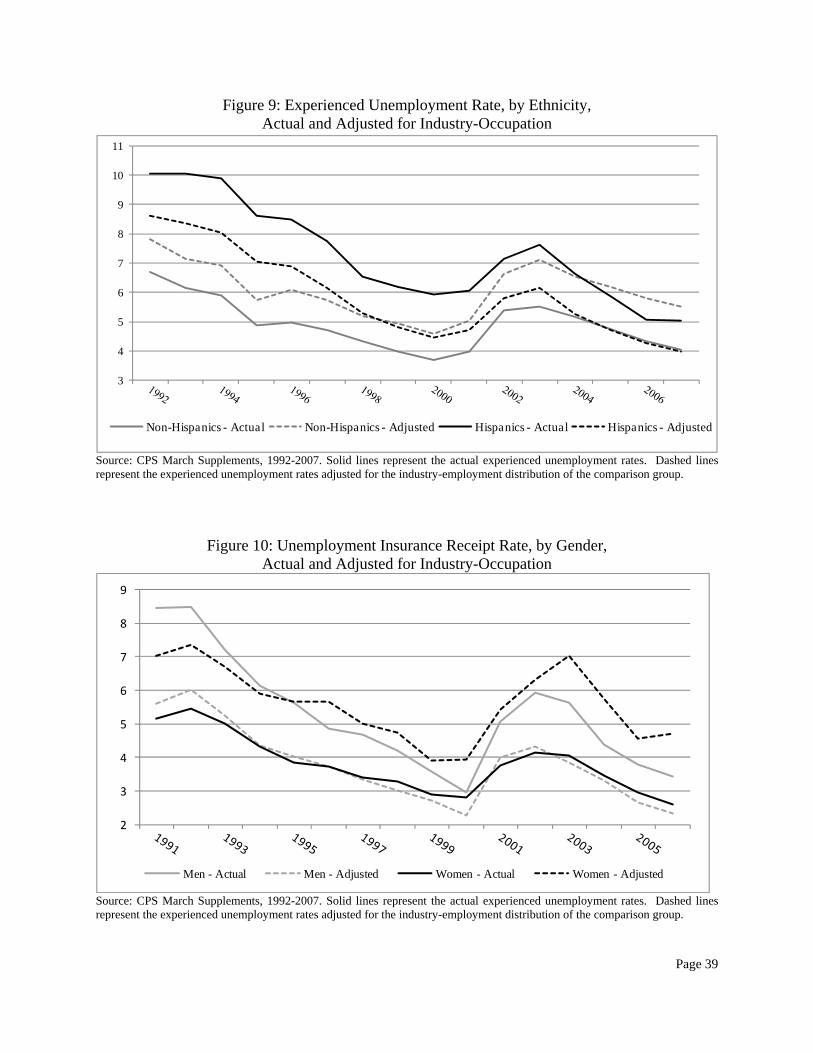
Page 39
Figure 9: Experienced Unemployment Rate, by Ethnicity, Actual and Adjusted for Industry-Occupation
3
4
5
6
7
8
9
10
11
Non-Hispanics - Actual Non-Hispanics - Adjusted Hispanics - Actual Hispanics - Adjusted
Source: CPS March Supplements, 1992-2007. Solid lines represent the actual experienced unemployment rates. Dashed lines represent the experienced unemployment rates adjusted for the industry-employment distribution of the comparison group.
Figure 10: Unemployment Insurance Receipt Rate, by Gender, Actual and Adjusted for Industry-Occupation
2
3
4
5
6
7
8
9
Men - Actual Men - Adjusted Women - Actual Women - Adjusted
Source: CPS March Supplements, 1992-2007. Solid lines represent the actual experienced unemployment rates. Dashed lines represent the experienced unemployment rates adjusted for the industry-employment distribution of the comparison group.

Page 40
Figure 11: Unemployment Insurance Receipt Rate, by Race, Actual and Adjusted for Industry-Occupation
2
3
4
5
6
7
8
Whites - Actual Whites - Adjusted Nonwhites - Actual Nonwhites - Adjusted
Source: CPS March Supplements, 1992-2007. Solid lines represent the actual experienced unemployment rates. Dashed lines represent the experienced unemployment rates adjusted for the industry-employment distribution of the comparison group.
Figure 12: Unemployment Insurance Receipt Rate, by Ethnicity, Actual and Adjusted for Industry-Occupation
2
3
4
5
6
7
8
9
Non-Hispanics - Actual Non-Hispanics - AdjustedHispanics - Actual Hispanics - Adjusted
Source: CPS March Supplements, 1992-2007. Solid lines represent the actual experienced unemployment rates. Dashed lines represent the experienced unemployment rates adjusted for the industry-employment distribution of the comparison group.
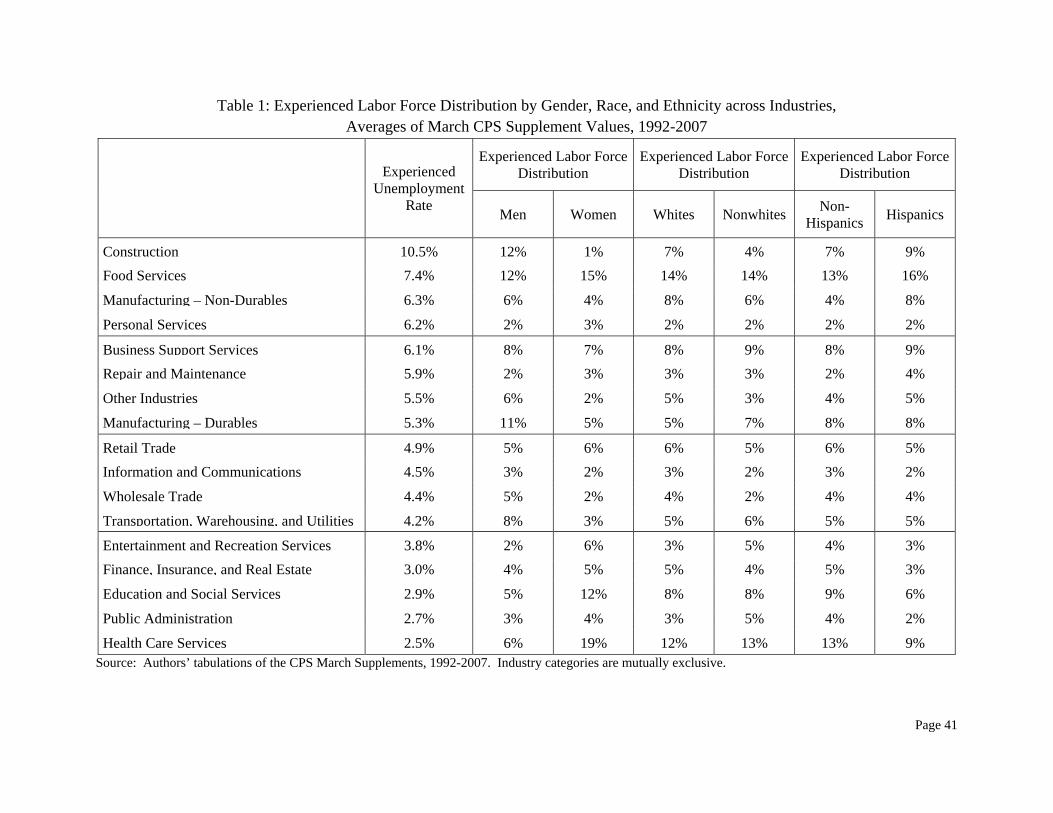
Page 41
Table 1: Experienced Labor Force Distribution by Gender, Race, and Ethnicity across Industries, Averages of March CPS Supplement Values, 1992-2007
Experienced
Unemployment Rate
Experienced Labor Force Distribution
Experienced Labor ForceDistribution
Experienced Labor ForceDistribution
Men Women Whites Nonwhites Non-Hispanics Hispanics
Construction 10.5% 12% 1% 7% 4% 7% 9%Food Services 7.4% 12% 15% 14% 14% 13% 16%
Manufacturing – Non-Durables 6.3% 6% 4% 8% 6% 4% 8%
Personal Services 6.2% 2% 3% 2% 2% 2% 2%
Business Support Services 6.1% 8% 7% 8% 9% 8% 9%Repair and Maintenance 5.9% 2% 3% 3% 3% 2% 4%
Other Industries 5.5% 6% 2% 5% 3% 4% 5%
Manufacturing – Durables 5.3% 11% 5% 5% 7% 8% 8%
Retail Trade 4.9% 5% 6% 6% 5% 6% 5%Information and Communications 4.5% 3% 2% 3% 2% 3% 2%
Wholesale Trade 4.4% 5% 2% 4% 2% 4% 4%
Transportation, Warehousing, and Utilities 4.2% 8% 3% 5% 6% 5% 5%
Entertainment and Recreation Services 3.8% 2% 6% 3% 5% 4% 3%Finance, Insurance, and Real Estate 3.0% 4% 5% 5% 4% 5% 3%
Education and Social Services 2.9% 5% 12% 8% 8% 9% 6%
Public Administration 2.7% 3% 4% 3% 5% 4% 2%
Health Care Services 2.5% 6% 19% 12% 13% 13% 9%Source: Authors’ tabulations of the CPS March Supplements, 1992-2007. Industry categories are mutually exclusive.

Page 42
Table 2: Experienced Labor Force Distribution by Gender, Race, and Ethnicity across Occupations, Averages of March CPS Supplement Values, 1992-2007
Experienced Unemployment
Rate
Experienced Labor Force Distribution
Experienced Labor Force Distribution
Experienced Labor Force Distribution
Men Women Whites Nonwhites Non-Hispanics Hispanics
Blue Collar Occupations 7.8% 53% 34% 40% 43% 37% 59%Construction Workers 11.4% 10% 0% 6% 4% 5% 9%
Farming, Fishing, and Forestry 9.8% 3% 1% 2% 1% 2% 4%
Other Blue Collar Occupations 7.8% 22% 8% 15% 18% 14% 23%
Other Service-Related Occupations 7.0% 12% 15% 13% 17% 13% 19%
Mechanics and Repairers 4.4% 6% 0% 4% 3% 4% 4%
White Collar Occupations 3.5% 47% 66% 60% 57% 63% 41%
Sales Occupations 5.4% 11% 13% 12% 10% 12% 9%
Office and Administrative Support 4.5% 6% 25% 14% 16% 15% 14%
Engineers and Scientists 2.9% 7% 3% 5% 5% 5% 2%
Professional Specialty Occupations 2.7% 4% 5% 4% 4% 5% 2%
Health Care Occupations 2.5% 2% 11% 6% 8% 7% 4%
CEOs and Managers 2.4% 13% 11% 13% 9% 13% 7%
Teachers and Social Workers 1.6% 3% 8% 6% 5% 6% 3%Source: Authors’ tabulations of the CPS March Supplements, 1992-2007. Occupation categories are mutually exclusive.
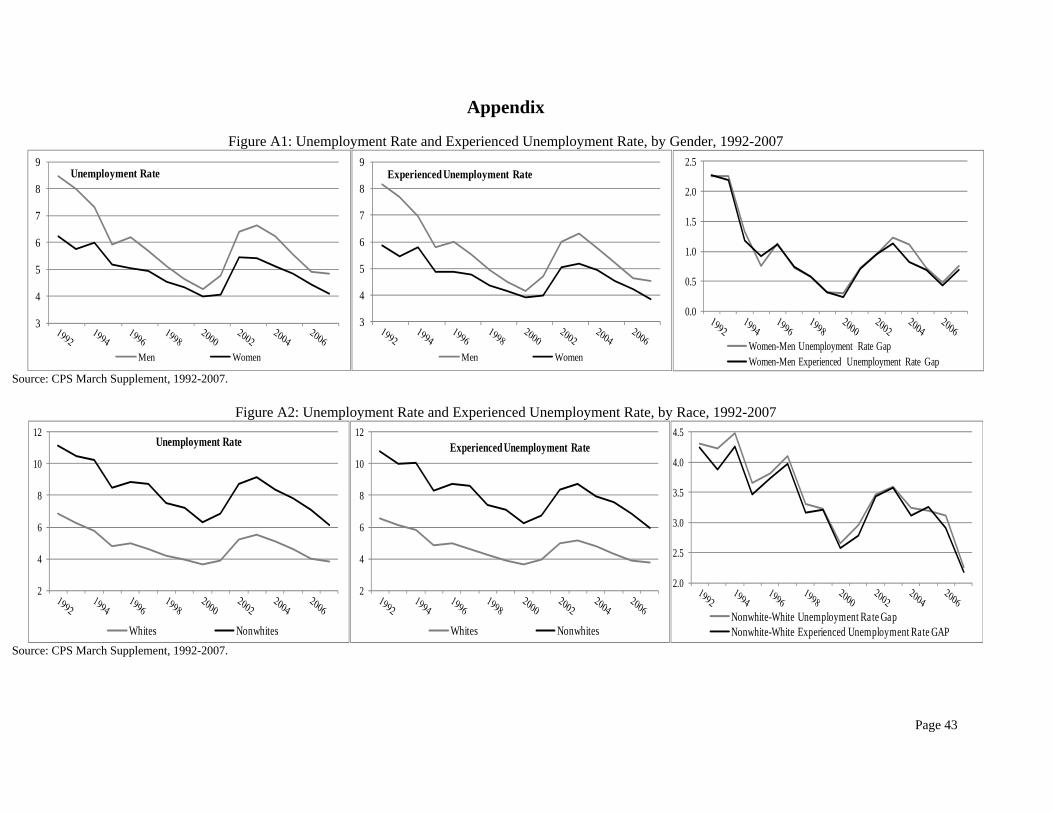
Page 43
Appendix
Figure A1: Unemployment Rate and Experienced Unemployment Rate, by Gender, 1992-2007
3
4
5
6
7
8
9
Men Women
Unemployment Rate
3
4
5
6
7
8
9
Men Women
Experienced Unemployment Rate
0.0
0.5
1.0
1.5
2.0
2.5
Women-Men Unemployment Rate GapWomen-Men Experienced Unemployment Rate Gap
Source: CPS March Supplement, 1992-2007.
Figure A2: Unemployment Rate and Experienced Unemployment Rate, by Race, 1992-2007
2
4
6
8
10
12
Whites Nonwhites
Unemployment Rate
2
4
6
8
10
12
Whites Nonwhites
Experienced Unemployment Rate
2.0
2.5
3.0
3.5
4.0
4.5
Nonwhite-White Unemployment Rate GapNonwhite-White Experienced Unemployment Rate GAP
Source: CPS March Supplement, 1992-2007.

Page 44
Figure A3: Unemployment Rate and Experienced Unemployment Rate, by Ethnicity, 1992-2007
3
4
5
6
7
8
9
10
11
Non-Hispanic Hispanic
Unemployment Rate
3
4
5
6
7
8
9
10
11
Non-Hispanic Hispanic
Experienced Unemployment Rate
0.0
0.5
1.0
1.5
2.0
2.5
3.0
3.5
4.0
Hispanic-Non-Hispanic Unemployment Rate GapHispanic-Non-Hispanic Experienced Unemployment Rate Gap
Source: CPS March Supplement, 1992-2007.

Page 45
Table A1: Regression Results – Dependent Variable: Likelihood of Unemployment
Period: 1992-1994 Period: 1995-2000 Period: 2001-2007 (1) (2) (3) (4) (5) (6) (7) (8) (9)
Female -.018 (.003)**
.005 (.001)**
.004 (.002)*
-.006 (.001)**
.007 (.001)**
.006 (.001)**
-.008 (.001)**
.006 (.000)**
.004 (.000)**
Nonwhite .044 (.001)**
.041 (.002)**
.040 (.001)**
.036 (.002)**
.034 (.002)**
.033 (.002)**
.033 (.002)**
.031 (.002)**
.031 (.002)**
Hispanic .039 (.002)**
.026 (.001)**
.013 (.001)**
.031 (.002)**
.018 (.002)**
.006 (.002)*
.018 (.002)**
.003 (.002)
-.007 (.001)**
Industry x Occupation Yes Yes Yes Yes Yes Yes
Age Yes Yes Yes Education Yes Yes Yes Region Yes Yes Yes Year Yes Yes Yes Yes Yes Yes Yes Yes Yes
Note: Reported are linear regression coefficient estimates with standard errors in parenthesis. *Significant at the 0.05 level **Significant at the 0.01 level
Table A2: Regression Results – Dependent Variable: Likelihood of Unemployment Insurance Receipt
Period: 1992-1994 Period: 1995-2000 Period: 2001-2007
(1) (2) (3) (4) (5) (6) (7) (8) (9)
Female -.025 (.003)**
.004 (.001)**
.003 (.001)**
-.011 (.002)**
.007 (.001)**
.006 (.001)**
-.012 (.002)**
.006 (.000)**
.005 (.001)**
Nonwhite .001 (.000)
-.001 (.001)
.001 (.001)
.002 (.001)**
.001 (.001)
.003 (.001)**
.005 (.001)**
.004 (.000)**
.006 (.001)**
Hispanic .009 (.002)**
-.003 (.002)
-.003 (.001)**
.003 (.001)**
-.006 (.001)**
-.006 (.001)**
-.004 (.001)**
-.014 (.001)**
-.013 (.001)**
Industry x Occupation Yes Yes Yes Yes Yes Yes
Age Yes Yes Yes Education Yes Yes Yes Region Yes Yes Yes Year Yes Yes Yes Yes Yes Yes Yes Yes Yes
Note: Reported are linear regression coefficient estimates with standard errors in parenthesis. *Significant at the 0.05 level **Significant at the 0.01 level