BRUNEI DARUSSALAM RECENT ECONOMIC … Documents Library/NDP/Policy research/Brunei...BRUNEI...
28
BRUNEI DARUSSALAM RECENT ECONOMIC PERFORMANCE 27 th August 2015 Prepared by: Department of Economic Planning and Development
Transcript of BRUNEI DARUSSALAM RECENT ECONOMIC … Documents Library/NDP/Policy research/Brunei...BRUNEI...
BRUNEI DARUSSALAMRECENT ECONOMIC PERFORMANCE
27th August 2015
Prepared by:
Department of Economic Planning and Development

BRUNEI VISION 2035
GOAL I
Well-educated, highly skilled and accomplished people
GOAL II
High quality of life
GOAL III
Dynamic and sustainable economy
(with a per capita income among the top 10 countries in the world)

PRIMARY OBJECTIVES FOR ECONOMIC POLICY MAKERS
Sustainable Economic Growth Rate,
Growth Target ~ 5% to 6% per annum
Low Inflation Rate, Inflation Target ~ 2%
Full Employment, Unemployment Target ~ 4%
Trade Balance ~ Surplus

GDP AT CURRENT PRICESIN 2014
• Brunei Darussalam economy was about BND21.7 billion (USD16.7 bil) in current prices in2014.
• With population of 411,900, Brunei Darussalam’s per capita GDP in 2014 was BND52,614.(USD40,472).
• In current prices, oil and gas sector contributed 63.3% of GDP in 2014.
Oil and gas , 63.3%
Agriculture, Forestry and Fishery, 0.8%
Manufacturing, 0.9%Electricity & Water, 0.7%
Construction, 1.9%
Trade, 4.2%
Transportation, 1.7%
Communication, 1.3%
Finance, 4.3%
Real Estate, 3.0%
Hotels & Restaurants, 0.8%
Health & Education Services, 3.8%
Business Services, 2.2%
Private Services, 0.4%
Government Services , 10.3% Oil and gas
Agriculture, Forestry and Fishery
Manufacturing
Electricity & Water
Construction
Trade
Transportation
Communication
Finance
Real Estate
Hotels & Restaurants
Health & Education Services
Business Services
Private Services
Government Services
Source: Department of Economic, Planning and Development (DEPD)

0.8% 0.9% 0.7%1.9%
4.2%1.7% 1.3%
4.3%3.0%
0.8%
3.8%2.2%
0.4%
10.3%
0.0%2.0%4.0%6.0%8.0%
10.0%12.0%
NON-OIL AND GAS SECTOR(36.7% OF GDP)
Oil and Gas Sector63.3%
Non oil and Gas Sector 36.7%
BY SECTOR 48.3%
15.0%
0.0%
10.0%
20.0%
30.0%
40.0%
50.0%
60.0%
Oil and Gas Mining Manufacture of liquefied natural gas andmethanol
OIL AND GAS SECTOR(63.3% OF GDP)
Source: Department of Economic, Planning and Development (DEPD)
GDP DISTRIBUTION IN 2014

Source: Department of Economic, Planning and Development (DEPD)
GDP BY EXPENDITURE
In 2014:2010 2011 2012 2013 2014
Government final consumption expenditure
22.2% 18.7% 18.4% 20.2% 21.6%
Household final consumption expenditure 14.7% 12.8% 13.8% 15.3% 15.6%
Investment 23.5% 25.9% 32.8% 39.5% 27.3%
Construction 10.5% 10.4% 12.6% 13.4% 11.1%
Machinery 13.0% 15.5% 20.2% 26.0% 16.2%
Exports of goods and services 67.4% 69.5% 70.2% 68.0% 71.0%
Goods 64.0% 66.8% 67.6% 65.3% 68.2%
Services 3.4% 2.7% 2.5% 2.7% 2.8%
Imports of goods and services 28.0% 30.0% 35.5% 42.9% 35.7%
Goods 18.7% 20.2% 21.6% 27.1% 21.7%
Services 9.2% 9.8% 13.9% 15.8% 13.9%
Government final
consumption expenditure,
21.6%
Household final consumption expenditure,
15.6%
Investment, 27.3%
Net Exports, 35.3%

GDP Growth Performance

8
8
OIL PRODUCTION DECLINING
NEGATIVE ECONOMIC GROWTH
3.7
0.9
(2.1) (2.3)
(10.0)
(5.0)
0.0
5.0
10.0
2011 2012 2013 2014
%
Oil and GasSector
Non Oil and GasSector
Real GDPGrowth
Source: DEPD & EDPMO
REAL GDP GROWTH AND OIL PRODUCTION (ANNUALLY)
165,873 159,012
135,160
126,425
120,000
140,000
160,000
180,000
2011 2012 2013 2014
bar
rels
per
day

9
9
Source: DEPD & EDPMO
REAL GDP GROWTH AND OIL PRODUCTION (1985-2014)
50,000
100,000
150,000
200,000
250,000
-15.0
-10.0
-5.0
0.0
5.0
10.0
15.0
19
85
19
86
19
87
19
88
19
89
19
90
19
91
19
92
19
93
19
94
19
95
19
96
19
97
19
98
19
99
20
00
20
01
20
02
20
03
20
04
20
05
20
06
20
07
20
08
20
09
20
10
20
11
20
12
20
13
20
14
Bar
rels
per
day
Y-o
-y g
row
th r
ate
(%)
Oil & gas Non-oil & gas GDP Oil Production
10
10
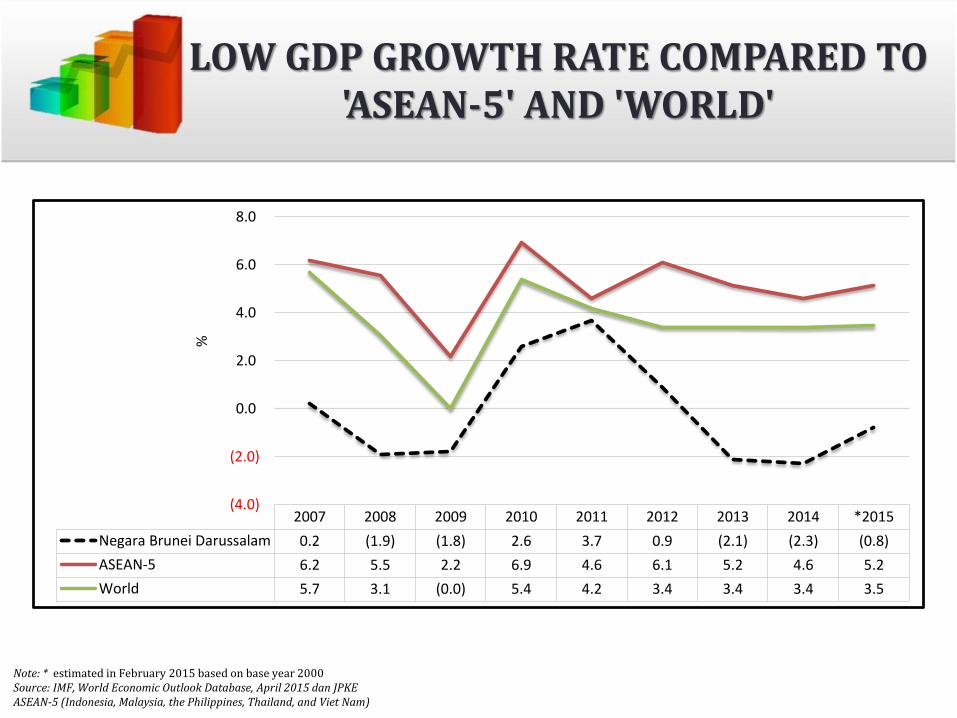
LOW GDP GROWTH RATE COMPARED TO'ASEAN-5' AND 'WORLD'
2007 2008 2009 2010 2011 2012 2013 2014 *2015
Negara Brunei Darussalam 0.2 (1.9) (1.8) 2.6 3.7 0.9 (2.1) (2.3) (0.8)
ASEAN-5 6.2 5.5 2.2 6.9 4.6 6.1 5.2 4.6 5.2
World 5.7 3.1 (0.0) 5.4 4.2 3.4 3.4 3.4 3.5
(4.0)
(2.0)
0.0
2.0
4.0
6.0
8.0%
Note: * estimated in February 2015 based on base year 2000Source: IMF, World Economic Outlook Database, April 2015 dan JPKEASEAN-5 (Indonesia, Malaysia, the Philippines, Thailand, and Viet Nam)

11
11
GDP GROWTH RATE COMPARED TO'ASEAN-5' AND 'WORLD'
Note: * estimated in February 2015 based on base year 2000Source: IMF, World Economic Outlook Database, April 2015 dan JPKEASEAN-5 (Indonesia, Malaysia, the Philippines, Thailand, and Viet Nam)
-10.0
-8.0
-6.0
-4.0
-2.0
0.0
2.0
4.0
6.0
8.0
10.0
19
85
19
86
19
87
19
88
19
89
19
90
19
91
19
92
19
93
19
94
19
95
19
96
19
97
19
98
19
99
20
00
20
01
20
02
20
03
20
04
20
05
20
06
20
07
20
08
20
09
20
10
20
11
20
12
20
13
20
14
20
15
%
World ASEAN-5 Brunei Darussalam

Inflation

INFLATION RATES UNTIL JULY 2015
Source: Department of Economic, Planning and Development (DEPD)
INFLATION RATE IS LOW AND DECLINING
0.1
1.1 0.9
0.7 1.0
0.2
(0.8)
0.0 (0.1)0.2
(0.2)
0.2
(0.2) (0.3) (0.4)(0.7)
(1.3)
1.2
0.5
(0.8)
(0.1)(0.3) (0.3)
(0.5)
(0.4)
(2.0)
(1.5)
(1.0)
(0.5)
0.0
0.5
1.0
1.5
2.0
Jul Aug Sep Oct Nov Dec Jan Feb Mar Apr May Jun Jul Aug Sep Oct Nov Dec Jan Feb Mar Apr May Jun Jul
2014 2015
CPI Food Non-food

INFLATION RATES(BASE YEAR=2010)
Weights 2011 2012 2013 20142015
Jan-July
OVERALL INDEX 10,000 0.1 0.2 0.4 -0.2 -0.3
Food And Non-alcoholic Beverages 1,911 0.0 0.0 0.1 -0.2 0.5
Clothing And Footwear 424 0.6 0.0 0.6 -2.4 -4.2
Housing, Water, Electricity, Gas And Other Fuels 1,114 0.0 0.0 -0.1 -0.7 2.1
Furnishings, Household Equipment And Routine Household Maintenance
1,101 0.0 0.0 -0.7 -2.2 -1.3
Health 132 0.0 0.0 -0.3 0.4 2.1
Transport 1,883 0.0 0.1 2.2 0.4 -2.3
Communication 601 0.0 0.0 -0.2 0.1 1.4
Recreation And Culture 913 0.2 0.4 0.4 -2.0 -0.6
Education 390 0.1 1.3 0.8 2.7 -2.5
Restaurants And Hotels 885 0.1 0.1 0.2 2.0 1.5
Miscellaneous Goods And Services 646 1.2 0.1 -0.9 0.9 0.6
Source: Department of Economic, Planning and Development (DEPD)

Merchandise Trade

16
MERCHANDISE TRADE WITH OIL AND GAS EXPORTS – TRADE SURPLUS
Source: Department of Economic, Planning and Development (DEPD)
PERFORMANCE OF INTERNATIONAL TRADE UP TO SECOND QUARTER 2015
MERCHANDISE TRADE WITHOUT OIL AND GAS EXPORTS – TRADE DEFICIT
3,386.5
2,541.3 2,790.0 3,047.7 3,330.1
2,283.4 2,029.5 2,145.4
2,998.7 2,395.6
1,955.3 1,492.6 1,663.4
1,092.4
-
1,000.0
2,000.0
3,000.0
4,000.0
5,000.0
Q1 Q2 Q3 Q4 Q1 Q2 Q3 Q4 Q1 Q2 Q3 Q4 Q1 Q2
2012 2013 2014 2015
BN
D M
illio
n
Total Exports Total Imports Trade Balance
(1,026.4) (1,158.3)(995.4) (888.3) (909.8)
(1,133.5) (1,077.8) (1,004.1)
(538.6)
(1,027.5) (966.0)(1,197.5)
(725.9)(1,081.5) (1,500.0)
(1,000.0)
(500.0)
-
500.0
1,000.0
1,500.0
2,000.0
Q1 Q2 Q3 Q4 Q1 Q2 Q3 Q4 Q1 Q2 Q3 Q4 Q1 Q2
2012 2013 2014 2015
BN
D M
illio
n
Total Exports w/o Oil & Gas Total Imports Trade Balance

17
SURPLUS TRADE BALANCE WITH 90% EXPORTS COME FROM OIL AND GAS
TRADE BALANCE BECOMES DEFICIT WITHOUT OIL AND GAS EXPORTS
TRADE BALANCE (ANNUALLY)
Source: Department of Economic, Planning and Development (DEPD)
8,390.4
11,294.7
6,943.0 8,660.3
11,150.0 11,765.6 9,788.4 8,842.1
-
4,000.0
8,000.0
12,000.0
16,000.0
2007 2008 2009 2010 2011 2012 2013 2014
BN
D m
illio
n
Total Exports Total Imports Trade Balance
(2,720.3) (3,320.7) (3,080.5) (2,995.9)(4,045.2) (4,068.4) (4,125.2) (3,729.6)
(5,000.0)
(3,000.0)
(1,000.0)
1,000.0
3,000.0
5,000.0
2007 2008 2009 2010 2011 2012 2013 2014
BN
D m
illio
n
Total Exports w/o Oil & Gas Total Imports Trade Balance
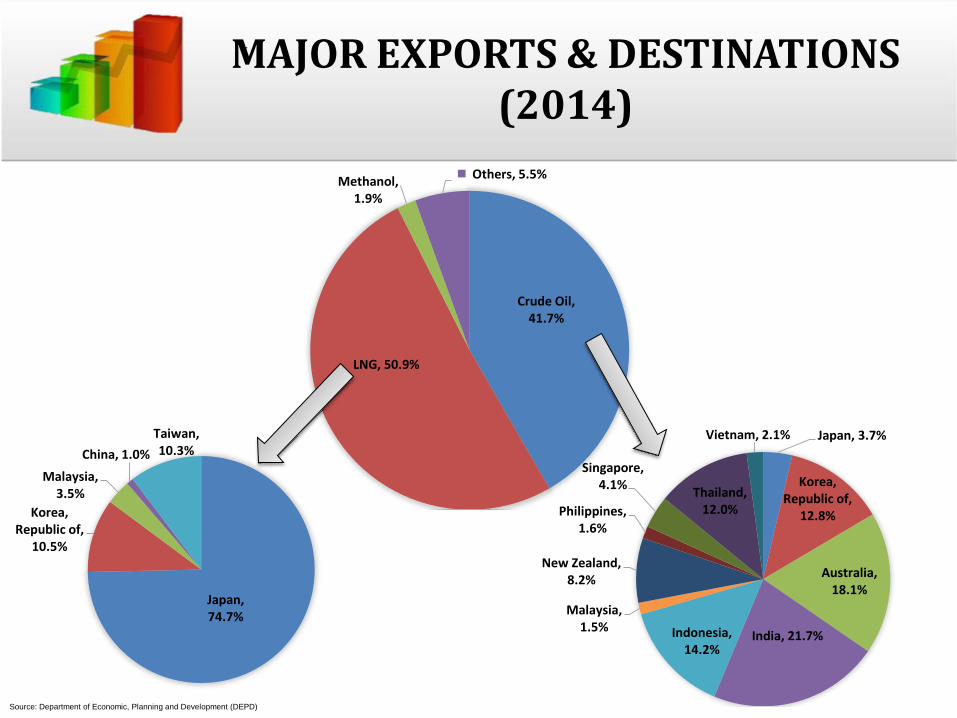
Japan, 3.7%
Korea, Republic of,
12.8%
Australia, 18.1%
India, 21.7%Indonesia, 14.2%
Malaysia, 1.5%
New Zealand, 8.2%
Philippines, 1.6%
Singapore, 4.1%
Thailand, 12.0%
Vietnam, 2.1%
Crude Oil, 41.7%
LNG, 50.9%
Methanol, 1.9%
Others, 5.5%
Japan, 74.7%
Korea, Republic of,
10.5%
Malaysia, 3.5%
China, 1.0%
Taiwan, 10.3%
MAJOR EXPORTS & DESTINATIONS (2014)
Source: Department of Economic, Planning and Development (DEPD)

Source: Department of Economic, Planning and Development (DEPD)
IMPORTS & ORIGIN(2014)
Machinery and transport
equipment38.5%
Manufactured goods 15.0%
Food 13.5%
Miscellaneous manufactured
articles11.0%
Mineral fuels 10.2%
Chemicals 8.4%
Beverages and tobacco
1.4%
Crude materials inedible
1.0%
Animal and vegetable oils and
fats0.4%
Miscellaneous transaction
0.5%
21.6%
14.9%
11.1%8.6%
7.1%
0.0
5.0
10.0
15.0
20.0
25.0
Korea, Republicof
USA Singapore China Japan
More Than 50% of Machinery & Transport Equipment Imported From:
26.3%
17.5%14.9%
0.0
5.0
10.0
15.0
20.0
25.0
30.0
China Malaysia (Peninsular) singapore
More Than 50% Of Manufactured Goods Imported From:

Fiscal Balance
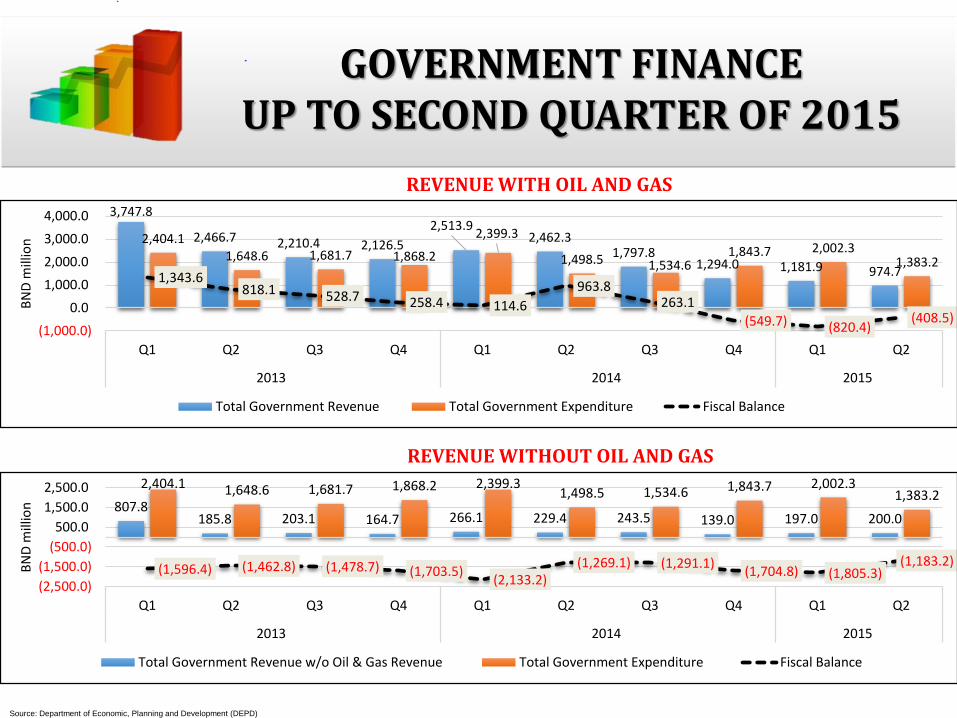
REVENUE WITHOUT OIL AND GAS
Source: Department of Economic, Planning and Development (DEPD)
GOVERNMENT FINANCE UP TO SECOND QUARTER OF 2015
REVENUE WITH OIL AND GAS3,747.8
2,466.7 2,210.4 2,126.5
2,513.9 2,462.3
1,797.8 1,294.0 1,181.9 974.7
2,404.1 1,648.6 1,681.7 1,868.2
2,399.3
1,498.5 1,534.6 1,843.7 2,002.3
1,383.2 1,343.6
818.1 528.7 258.4 114.6
963.8 263.1
(549.7) (820.4)(408.5)
(1,000.0)
0.0
1,000.0
2,000.0
3,000.0
4,000.0
Q1 Q2 Q3 Q4 Q1 Q2 Q3 Q4 Q1 Q2
2013 2014 2015
BN
D m
illio
n
Total Government Revenue Total Government Expenditure Fiscal Balance
807.8 185.8 203.1 164.7 266.1 229.4 243.5 139.0 197.0 200.0
2,404.1 1,648.6 1,681.7 1,868.2 2,399.3 1,498.5 1,534.6 1,843.7 2,002.3
1,383.2
(1,596.4) (1,462.8) (1,478.7) (1,703.5)(2,133.2)
(1,269.1) (1,291.1)(1,704.8) (1,805.3)
(1,183.2)
(2,500.0)
(1,500.0)
(500.0)
500.0
1,500.0
2,500.0
Q1 Q2 Q3 Q4 Q1 Q2 Q3 Q4 Q1 Q2
2013 2014 2015
BN
D m
illio
n
Total Government Revenue w/o Oil & Gas Revenue Total Government Expenditure Fiscal Balance

22
SURPLUS FISCAL BALANCE AS 90% OF REVENUE COMES FROM OIL AND GAS
DEFICIT FISCAL BALANCE WITHOUT OIL AND GAS REVENUE
FISCAL BALANCE FROM 2008 – 2014
Source: Department of Economic, Planning and Development (DEPD)
14,309.6
6,650.3 8,202.9
12,895.9 11,134.1 10,551.4
8,067.9 6,146.1 6,037.8 6,761.5 6,923.0 7,376.4 7,602.6 7,276.0
8,163.5
612.4 1,441.4
5,972.9 3,757.7 2,948.8
791.8 0.0
5,000.0
10,000.0
15,000.0
20,000.0
2008 2009 2010 2011 2012 2013 2014
BN
D m
illio
n
Total Government Revenue Total Government Expenditure Fiscal Balance
908.3 803.2 900.0 1,106.4 809.7 1,361.3 877.9
6,146.1 6,037.8 6,761.5 6,923.0 7,376.4 7,602.6 7,276.0
(5,237.7) (5,234.6) (5,861.5) (5,816.6) (6,566.7) (6,241.3) (6,398.1)
(10,000.0)
(5,000.0)
0.0
5,000.0
10,000.0
2008 2009 2010 2011 2012 2013 2014
BN
D m
illio
n
Total Government Revenue w/o Oil & Gas Revenue Total Government Expenditure Fiscal Balance

Unemployment

Source: Department of Economic, Planning and Development (DEPD)
HIGH UNEMPLOYMENT RATE
3.6
4.7
7.2
9.3
6.9
0
3
6
9
1981 1991 2001 2011 2014
%
12,137 11,834
14,267 15,272 14,950 14,814 15,081
14,116 13,854 14,065
-
2,000
4,000
6,000
8,000
10,000
12,000
14,000
16,000
18,000
Sept Oct Nov Dec Jan Feb Mar Apr May Jun
2014 2015
No
. of
loca
ls u
nem
plo
yed
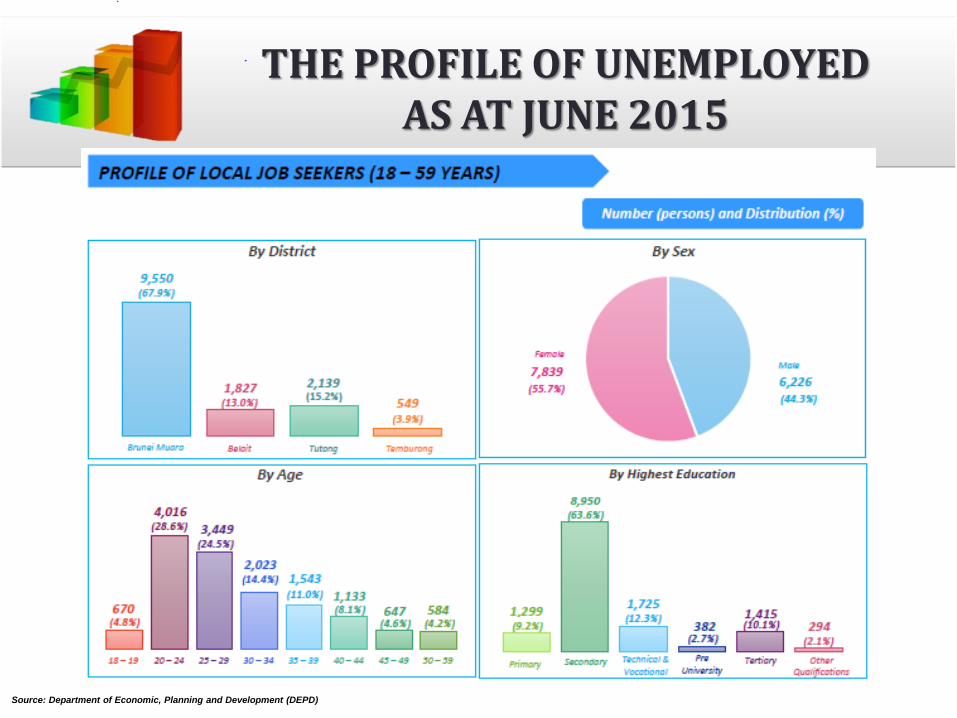
Source: Department of Economic, Planning and Development (DEPD)
THE PROFILE OF UNEMPLOYEDAS AT JUNE 2015

Evaluation Performance

OBJECTIVE TARGET ACTUAL ASSESSMENT
Economic
Growth5% to 6%
-2.3% in 2014Unsatisfactory:
Negative growth rate, below the regional annual growth rate,
and dominated by oil and gas in terms of output. NOT
DIVERSIFIED
Inflation
Rate2% annually or lower -0.2% in 2014
Satisfactory:
Mainly due the the support from subsidies. However, negative
can be a concern.
Unemployment
Rate4% or lower 6.9% in 2014
Unsatisfactory:
The rate is too high, particularly amongst youths, the majority
of whom are having only secondary and primary level of
education.
Trade
BalanceSurplus Surplus
Satisfactory:
Around 95% of exports were contributed by the oil and gas
sector, which implies that the economy is NOT DIVERSIFIED.

Thank you


![BRUNEI DARUSSALAM[1]](https://static.fdocuments.us/doc/165x107/577d24101a28ab4e1e9b8871/brunei-darussalam1.jpg)