The Role of EMS in the Hellenic Power Grid - Strath · The Role of EMS in the Hellenic Power Grid...
86
1 Department of Mechanical Engineering University of Strathclyde Glasgow, Scotland Technical Thesis The Role of EMS in the Hellenic Power Grid By Evangelos Mantzavinatos Submitted to the Department of Mechanical Engineering University of Strathclyde in partial fulfilment of the requirements for the MSc in Energy Systems and the Environment Glasgow, September 2002
Transcript of The Role of EMS in the Hellenic Power Grid - Strath · The Role of EMS in the Hellenic Power Grid...

1
Department of Mechanical Engineering
University of Strathclyde
Glasgow, Scotland
Technical Thesis
The Role of EMS in the Hellenic Power Grid
By
Evangelos Mantzavinatos
Submitted to the Department of Mechanical Engineering
University of Strathclyde in partial fulfilment of the requirements for the MSc in Energy Systems and the
Environment
Glasgow, September 2002

2
ACKNOLEDGMENTS I would like to express my sincere thanks to my supervisor, Dr. Slobodan
Jovanovic, for his help and support during this project.
I am also indepted to Professor Joe Clarke, Miss Lori McElroy and the
academic staff of ESRU for their support and help during this year.
Last but not least, thanks to all my colleagues of the MSc in Energy
Systems and the Environment for a wonderful working atmosphere,
without you all the work would not have been such a fun.

3
A B S T R A C T
This Thesis deals with the Hellenic Energy Control System. The
main issues described are the technical specifications, the appliance in
wind power technology and the upgrade of the system.
The first two chapters describes the most important parts and
functions of the system.
At the second part the appliance of such a system in a wind farm is
described and there is the first objective of the Thesis, the creation of a
Load Management Algorithm. This algorithm has also been converted
into C programming language.
Finally at the last chapter there are some proposals and a method
to use in order to upgrade the current system, and this is the second
objective of the Thesis.

4
CHAPTER 1
TECHNICAL SPECIFICATIONS FOR THE
HELLENIC ENERGY CONTROL SYSTEM
INTRODUCTION OBJECT OF SPECIFICATION
The Public Power Corporation of Greece (thereafter designated by
PPC) has considered the installation of a system which would use the
most advanced computing elements, hardware and software subsystems
to provide monitoring, supervisory control, and energy management of
the Hellenic generation and transmission electrical power system. This
control system will be hereafter designated as “Energy Control System” or
“ECS”.
This hierarchical control system consists of :
a) Master Control Stations with redundant computers for the
National Control Centre and for the two Regional Control
Centres the “Northern” and “Southern” with corresponding
responsibility for the geographical Northern and Southern
areas of the interconnected system.
The National Control Centre and the Southern Regional
Control Centre are installed in Ag. Stefanos area (Athens) in
the same premises while the Northern Regional Control
Centre are installed in the Ptolemaida area.

5
b) Remote Terminal Units are located at the various power
plants and transmission system substations.
c) Transducers, and generator unit controllers.
d) Power Line Carrier communications with redundant paths
and transmission equipment.
e) Miscellaneous equipment.
The System collects, transmits, computes, displays, alarms and
logs all the data necessary for the real-time supervision, control and
operation of the Hellenic Power Generation and Transmission System. It
also controls the operation of the circuit breakers of the 400 KV and 150
KV stations. In addition the system performs all the functions specified
herein.
The System provides improvements in the Power System operation
regards power system security, quality of service, and economy.
Economic considerations, however, become secondary when abnormal
operating conditions occur in the Power System, while security related
functions all the time aim at reducing the probability that system-wide
emergencies ever develop. The System provides the Power System
dispatchers with the real-time information and the short-term predictions
required to make better and faster judgements concerning the Power
System taking into consideration that the decision making role always lies
with the dispatcher.
DESCRIPTION OF THE HELLENIC POWER SYSTEM Generation
PPC is the sole authority in Greece responsible for the generation
transmission, and distribution of electric energy to the ultimate consumer.
PPC’s main objectives are :
a) To meet in an economical way the country’s constantly
increasing requirements in electric energy.

6
b) To utilize in full all domestic sources of energy.
c) To supply electric power to all consumers in towns and
villages of the country.
PPC has conducted extensive studies in order to meet the
increased power demand of the next decade, taking into consideration
the progressive independence from imported oil. The major part of the
generation is produced from local sources i.e. lignite and water.
There are two power plant complexes. The one in the North, in an
area of about 40 km radius from Ptolemaida with an installed lignite and
hydro capacity 55% of the total system capacity, and the other in the west
in an area of 70 KM radius from Kremaste with hydro capacity 16,3% of
the total. The distance of these two areas is about 360 KM from Athens.
78% of the energy is produced in the Ptolemaida power complexes, while
32% of the energy is consumed in the Athens area and vicinity.

7
Transmission The transmission of electric energy to the entire mainland and to a
few adjacent islands is carried out by means of 400 KV, 150 KV and 66
KV lines.
The 66 KV voltage level is used only for the interconnection of the
Kerkyra island with the mainland.
Some of the 150 KV lines (radial) in the Athens area have
distribution task. The distribution network is radially operated. The
medium voltage is 20 KV and the low voltage 380/220 V. In some regions
still exist 15 KV lines which are gradually converted to 20 KV and in
Athens area 22 KV.
Due to the necessity of installing the lignite and hydro units in the
vicinity of the lignite fields and the respective rivers which, however, are
distant from the load centres, the transmission becomes even more
significant with increased reliability requirements.
The 400 KV network is the bulk power transmission network and
consists of the following axes transporting energy from the generating
centres to major metropolitan areas :
- The Ptolemaida region – Athens axis ;
- The Ptolemaida rergion – Thessaloniki axis ;
- The Acheloos region – Athens axis ; and
- The Lavrion – Athens axis.

8
While the 400 KV network are being expanding to be used as the
bulk power transmission system the 150 KV network will also continue
expanding bringing about amore well meshed network to be used as a
secondary energy transmission system.
Most 400 KV substations have 3 bus – bars arrangements and
many 150 KV oens 2 bus – bars schemes with bus ties. Step – down
400/150 KV substations have 3 or 4 pairs of autotransformers with on–
load tap changers and one shunt reactor per pair connected on the 30 KV
side on either of the autotransformers and in many substations, capacitor
banks are connected to the 20 KV side of 150 KV distribution substations.
Considering the bulk energy transfers and the generating
incremental costs, it is worthwhile to play on the dispatch of real power
generation and on the action of tap changers, shunt reactors and static
condensers to minimize network losses and cost.
The scarcity of water resources imposes a careful unit scheduling. Lignite
plants supply the base load with hydro plants picking-up peak load.
Power and Energy Forecasts - Seasonal variations in the consumption are small.
- The weekly consumption is characterized by four types of
days : Saturday, Sunday, Monday and Weekdays.
A brief general information for the Hellenic System concerning the
present situation is given below :
1. Medium and low voltage consumers : 5.187.436
2. Number of Industrial customers directly connected to the
high voltage transmission system : 25 + 3 Lignite Mines
3. Net production of electrical energy of the interconnected
system.
Lignite ...................................... .... 16155 GWH (65,5%)

9
Hydro ........................................... 2791 GWH (11,3%)
Oil ............................................... 4969 GWH (20,1%)
Intertie Balance ............................ 739 GWH (3,1%)
Total ............................................ 24654 GWH (100%)
4. Number and installed capacity of HV S/S’s of the
interconnected system :
400 / 150 KV 12 7890 MVA
150/20 , 150/22 , 150/15 KV 103 7242 MVA
150/66 , 66/15 , 66/20 KV 3 208 MVA
Step-up S/S’s MV/150 KV 17 5250 MVA
Total 135 20590 MVA
5. Number of C8’s of the interconnected system :
400 KV 94
150 KV 580
66 KV 6
30, 22, 20, 15 KV 1206
Total 1886
6. Transmission line lengths of the interconnected system :
400 KV double circuit line 1115 km
400 KV single “ “ 168 km
150 KV double “ “ 2175 km
150 KV single “ “ 4156 km
66 KV “ “ “ 39 km
Total length 7653 km
7. Distribution line lengths :
HV (150 KV cables) 113 km; (66 KV cables) 4.7 km;
MV 61.227 km
LV 69.156 km
Total 130.501 km

10
POWER SYSTEM MANAGEMENT Voltage Control Equipment Voltage control of the transmission network is achieved by :
- Capacitor banks.
- Shunt reactors.
- The hydraulic and thermal generators.
- One 50 MVAR shunt reactor per pair connected on the 30
KV side on either of the 400/150 KV autotransformers.
- On – load tap changers of the 400/150 KV autotransformers
and the 150 KV / MV transformers.
Tie Lines The Hellenic transmission system is interconnected with :
- The Yugoslavian system through one 150 KV line
(PTOLEMAIDA – BITOLA) and one 400 KV line
(THESSALONIKI – NEGOTINO).
- The Bulgarian system through a 400 KV line
(THESSALONIKI – BLAGOEVGRAD).
- The Albanian system through a 150 KV line (IGOUMENITSA
– BISTRICA) and one 400 KV line (KARDIA – ELBASAN).
The AC simultaneous interconnection of the power systems of
Greece, Yugoslavia, and Bulgaria is not technically possible because
Greece and Yugoslavia are in synchronous parallel operation with the
interconnected power systems of the West – European countries
(U.C.P.T.E.), while Bulgaria is in synchronous parallel operation with the
interconnected power systems of the member countries of the Council for
Mutual Economic Assistance (C.M.E.A.).
The tie lines which are connecting Greece to the East and West
European grids are more sensitive to outages of large portions of
generation; since Greece is at the extreme end of the European grids,
therefore, local load shedding is anticipated.

11
SYSTEM DESIGN PHILOSOPHY National Control Centre
The responsibilities of the National Control Centre related to power
generation and transmission management consist of operation planning,
and weekly and daily scheduling.
The system design philosophy associates certain functions with
each of these responsibilities.
The Operation Planning includes :
• Long Range Analysis related to annual planning and
management of system load, unit scheduling, unit maintenance,
interchanges, power flows, water reservoirs and fuel supplies.
• Evaluation of the effectiveness of short range management and
scheduling functions as performed by the on-line power
application programs.
• Collection of Statistical and historical data related to system
planning requirements to be used by mathematical system
models.
The Weekly and Daily Scheduling includes :
• Formulating and implementing of operating procedures and
policies for normal and emergency conditions within the PPC
system and with other countries.
• Management of international interconnections by implementing
the Interchange Scheduling and Interchange Evaluation
functions.
• Automatic Generation Control (closed loop control) together with
AC Performance Monitor, Economic Dispatch and Reserve
Monitor.
• System Energy Monitor.

12
• Security Analysis function as :
- Network Configuration
- State Estimation
- Real – time Load Flow
- Security Analysis with contingency selection
• Unit Commitment
• Bus – Load Forecast
• Dispatcher’s Load Flow
• Production cost
• Optimal Power Flow
The NCC operator is able to initiate the following actions for remote
control :
• Load Shedding / Restoration
• 400 KV Breaker’s Control
• Tap change control of the 400/150 KV autotransformers
• Shunt reactor control
When initiating any of the above control actions, they are carried
out automatically by the RCC supervisory control software.
At any time the RCC control operator is able to initiate the same
types of control actions as the NCC control operator, providing that the
NCC and the RCC are not acting to control the same substation
simultaneous and only after the NCC operator has changed the tag of the
substation from National to Regional Control.
The NCC is responsible for the operation of its computers,
software, MMI, and communications subsystems as well as for the
operators training by implementing a Dispatcher Training Simulator
Program.

13
Regional Control Centres The Regional Control Centres, an integral part of the ECS, are
primarily operating centres. The system design philosophy associates the
following functions with the regional management responsibilities :
• Implementing control for the respective regions for the 150 KV
and 400 KV transmission system either automatically or in
response to a communicated directive from the NCC.
• Executing the Automatic Generation Control (AGC), Economic
Dispatch (ED), Regulation Margin Dispatch (RMD), Penalty
Factors, Reserve Monitoring (RM), and AGC Performance
Monitoring together with the Interchange Scheduling (IS)
function only in the NRCC if at the NCC the execution of the
AGC is interrupted.
• Directly controlling the regional transmission network 150 KV
and 66 KV based on policies communicated from the NCC,
either automatically or by dispatching personnel to the
substation.
• Collecting and processing data through RTU’s and
communication system for use at the NCC and maintaining files
for historical purposes.
• Operating the RCC’s software, computers, MMI, and
communication subsystems.
• Autonomous emergency decisions in case of serious incidents
are expected to be made in accordance with general directives
pre-issued by the NCC.
14
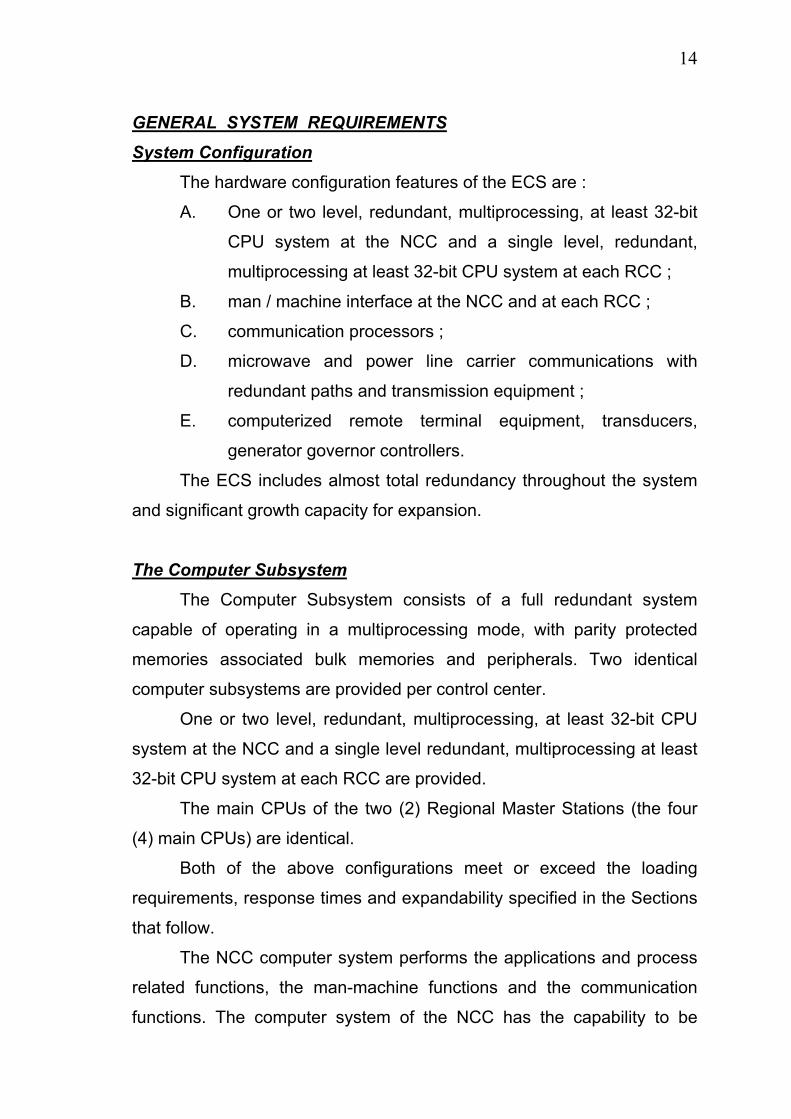
GENERAL SYSTEM REQUIREMENTS System Configuration
The hardware configuration features of the ECS are :
A. One or two level, redundant, multiprocessing, at least 32-bit
CPU system at the NCC and a single level, redundant,
multiprocessing at least 32-bit CPU system at each RCC ;
B. man / machine interface at the NCC and at each RCC ;
C. communication processors ;
D. microwave and power line carrier communications with
redundant paths and transmission equipment ;
E. computerized remote terminal equipment, transducers,
generator governor controllers.
The ECS includes almost total redundancy throughout the system
and significant growth capacity for expansion.
The Computer Subsystem The Computer Subsystem consists of a full redundant system
capable of operating in a multiprocessing mode, with parity protected
memories associated bulk memories and peripherals. Two identical
computer subsystems are provided per control center.
One or two level, redundant, multiprocessing, at least 32-bit CPU
system at the NCC and a single level redundant, multiprocessing at least
32-bit CPU system at each RCC are provided.
The main CPUs of the two (2) Regional Master Stations (the four
(4) main CPUs) are identical.
Both of the above configurations meet or exceed the loading
requirements, response times and expandability specified in the Sections
that follow.
The NCC computer system performs the applications and process
related functions, the man-machine functions and the communication
functions. The computer system of the NCC has the capability to be

15
interfaced with the Management Information System (MIS) and to a
PRIME computer model 550.
The RCC computer system utilizes a one level, fully redundant
configuration supporting among other, Man / Machine Interface functions,
communications with RTUs and the NCC, as well as, for only the NRCC
Automatic Generation Control (AGC), Economic Dispatch (ED) with
Regulating Margin Dispatch (RMD), Penalty factors, Reserve Monitoring
(RM) and AGC Performance Monitoring together with the interchange
scheduling (IS) function if at the NCC the execution of the AGC is
interrupted.
All key systems components are duplicated or otherwise backed up
to achieve high reliability for critical system functions. No single failure
cause loss of a critical function.
The peripherals in the system at each level are individually
accessed by either computer through dual ported design and through
specific peripheral switches except in the case that dedicated CPU
peripherals are used. Peripheral switches are CPU A or CPU B and
permit both manual and CPU – directed modes except for line printers. In
the CPU – directed mode, either of the CPUs is capable of controlling the
switch position. Regardless of operational mode, same level CPUs
receive an indication of the actual switch position. The failure of a single
CPU does not prevent the proper functioning of any switched data path or
device connected to the other CPUs, including the ability to switch the
device(s) away from the failed CPU. If the dual port or dual access type
devices are used, similar recommends for non – interference in the case
of CPU failure are met.
All real – time I/O devices are switchable between computers.
Redundant power supplies (in case of redundant devices installed in
same cabins transient suppression devices are provided. Failed devices
are automatically replaced by back – up devices if such devices are
available. A back-up data base including non-recoverable data (manually

16
entered data, tags, calculated values, etc) should not be lost upon
failover. Methods of CPU – to – CPU data transfers are acceptable so
long as the operational reliability and data transfer requirements (to
complete one data transfer of all the real-time data within ten (10)
seconds) are maintained.
Normally one of the computers, designated as “primary” performs
the real-time functions while the other computer, designated as
“secondary” are maintained in a backup, not standby, position to take
over the primary functions in case the primary computer fails. The
designation of primary or “secondary” computer is determined
automatically by the system when a computer is brought up. In case of
failure an automatic “fail-over” procedure is implemented.
There are four modes of operation of these two computers :
• Backup mode
• Pseudo – primary mode
• Training mode
• Stand alone mode
The communication between the NCC and the Southern RCC is
direct because of the physical proximity of the NCC and RCC computers.
Communication with the Northern Regional Control Center are via
three microwave communication channels and are low speed 4800 BPS
mixed microwave link and PLC link as back-up.
The NCC computer subsystem includes :
A. Application level computers with terminals (in case of two
levels configuration.
B. Process level computers with terminals (in case of two levels
configuration or application and process computers with
terminals (in case of one level configuration).
C. Controllers and Peripheral Switches.
D. CPU – CPU Link

17
E. Peripherals :
- Line printers
- Discs
- Magnetic tapes
- Loggers
- Programmers terminals
F. Multiple MMI equip. controllers for :
- Consoles
- Strip chart drivers
- Mapboard drivers
- Time and Frequency subsystem
G. Multiple communication processors for :
- Remote Consoles / Loggers
- Data Links
Each RCC computer subsystem includes :
A. Application and Process computers with terminals.
B. Controllers and Peripheral Switches
C. CPU – CPU ling
D. Peripherals :
- Line printer
- Discs
- Magnetic tapes
- Loggers
- Programmers terminals
E. Multiple MMI equip. controllers for :
- Consoles
- Strip chart Drivers
- Mapboard drivers
- Time & Frequency subsystem
F. Multiple communication processors for :
- Remote Consoles / Loggers

18
- RTU’s
- Data Links
Man / Machine Interface (MMI) Subsystem Man / Machine Interface (MMI) at the NCC The MMI hardware at the NCC provides a completely redundant
real – time control with interactive and full – graphics capabilities.
The man / machine interface in the Control Room of the National
Control Center consists of :
A. Consoles with CRT’s trackball, alphanumeric keyboard,
functional keyboard and telephone communications
switchboard ;
B. A dynamic mimic wall board containing the map of the 400
KV and 150 KV power system driven by the computers ;
C. Strip Chart Recorders driven by the computers ;
D. Loggers ;
E. Video color printer ;
F. Telephone communications recording system.
Man / Machine Interface (MMI) at the RCC’s The MMI hardware in each Regional Control Center is identical
except in quantities of units, and provides a completely redundant real –
time control with interactive and full – graphics capabilities.
The man / machine hardware of each RCC consists of :
A. Consoles with CRT’s, trackball, alphanumeric keyboard,
functional keyboard and telephone communications
switchboard ;
B. A dynamic mimic wall board containing the map of the 400
KV and 150 KV area power system driven by the computers ;
C. Strip chart Recorders driven by the computers ;
D. Loggers ;

19
E. Video color printer ;
F. Telephone communications recording system required only
for the NRCC, since the SRCC is served by the same
recording system as the NCC.
Communications Subsystem The communications subsystem includes all hardware necessary
for data communication between the system RTUs and the Northern and
Southern Regional Control Centres except microwave equipment.
It also includes all hardware necessary to perform the data and voice
communication between the RCCs and NCC in Aghios Stefanos (Athens)
area. Existing Microwave and PLC equipment together with existing line
traps, coupling capacitors, tuning elements and HF cables are extensively
used for the data transmission.
Overall System Design The communications subsystem for the Hellenic Energy Control
System requires the greatest reliability that is practical to ensure the flow
of data from all parts of the remote stations to the Regional Control
Centres (Northern and Southern) and to the National Control Centre.
Power line is used in the majority to form the communication network
between the Regional Control Centres and the remote stations and
microwave channels serve as a communication path in the portion of the
Hellenic Energy Control System that requires high density and / or high –
speed data transmission. Each important portion of the data flow that is
required at the Regional Control Centres from the Remote Terminal Units,
is provided with a back – up route for reaching its destination should the
prime signal path be interrupted during a fault condition.

20
Southern RCC to NCC Computer to Computer Data Links The data communications between the Southern RCC and the
NCC, both situated at Ag. Stefanos NCC & SRCC building, are realized
via 3 direct computer to computer data links at speed of 19200 bps. Two
of the links in operation and one hot standby.
Northern RCC to NCC Computer to Computer Data links The data communications between the Northern RCC in
Ptolemaida area and the NCC in Athens area is realized via 3 microwave
data communication links at 9600 bps (two operating and one hot
standby) all in parallel a fallback Microwave and PLC data commnication
link at a lower transmission 4800 bps. The latter will be transformed into a
fully 9600 bps microwave link in the near future.
Remote Equipment Equipment is installed at each of the remote facilities to interface
with the power system. The equipment consists of remote terminal units,
transducers and generator governor controllers.
Power Supply Equipment General The Ag.Stefanos National Control Centre (NCC) and Southern
Regional Control Centre (SRCC), and the Ptolemaida Northern Regional
Control Centre (NRCC) buildings are supplied each one from two
independent substations by separate cables as well as from a standby
quick starting diesel generator set as a back–up. The primary source is
380/220 V, 3–phase, 4–wire, 50 Hz.
Ag. Stefanos Building (NCC + SRRCC)
a. Uninterruptible Power Supply (UPS) unit consisting of a fully
redundant parallel operating system with all the necessary
controls, static switch, manual bypass switch, e.t.c.
21
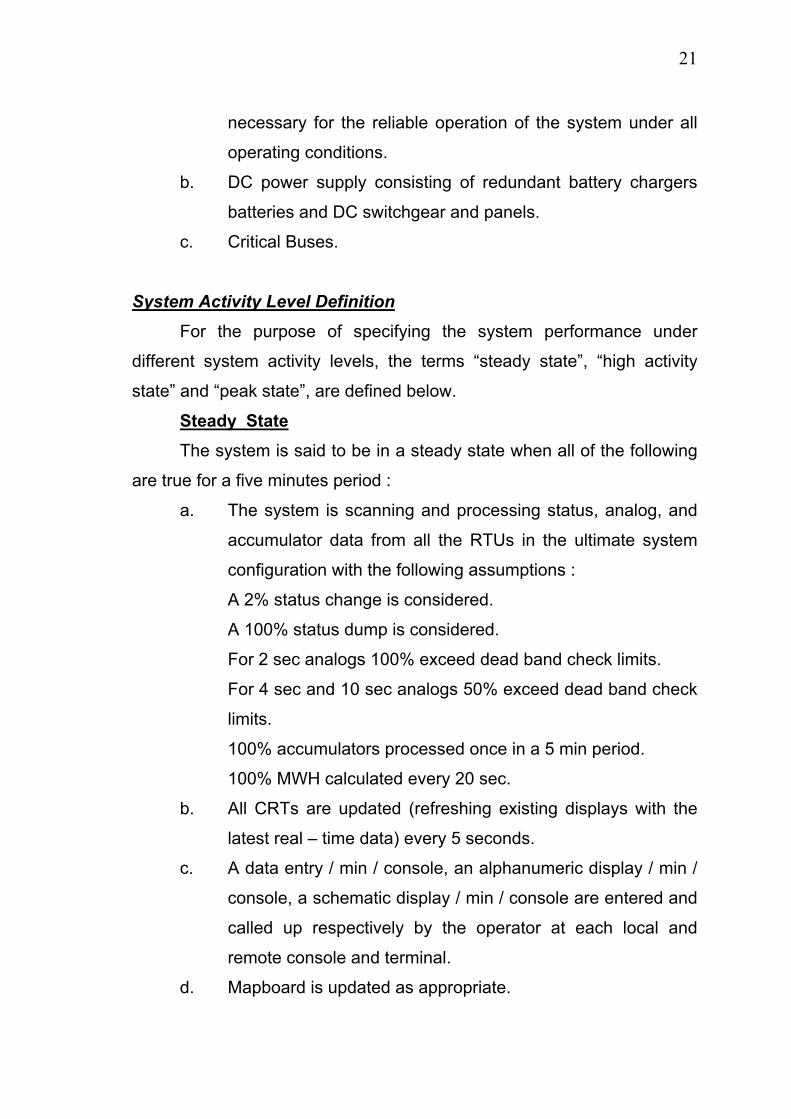
necessary for the reliable operation of the system under all
operating conditions.
b. DC power supply consisting of redundant battery chargers
batteries and DC switchgear and panels.
c. Critical Buses.
System Activity Level Definition For the purpose of specifying the system performance under
different system activity levels, the terms “steady state”, “high activity
state” and “peak state”, are defined below.
Steady State The system is said to be in a steady state when all of the following
are true for a five minutes period :
a. The system is scanning and processing status, analog, and
accumulator data from all the RTUs in the ultimate system
configuration with the following assumptions :
A 2% status change is considered.
A 100% status dump is considered.
For 2 sec analogs 100% exceed dead band check limits.
For 4 sec and 10 sec analogs 50% exceed dead band check
limits.
100% accumulators processed once in a 5 min period.
100% MWH calculated every 20 sec.
b. All CRTs are updated (refreshing existing displays with the
latest real – time data) every 5 seconds.
c. A data entry / min / console, an alphanumeric display / min /
console, a schematic display / min / console are entered and
called up respectively by the operator at each local and
remote console and terminal.
d. Mapboard is updated as appropriate.
22
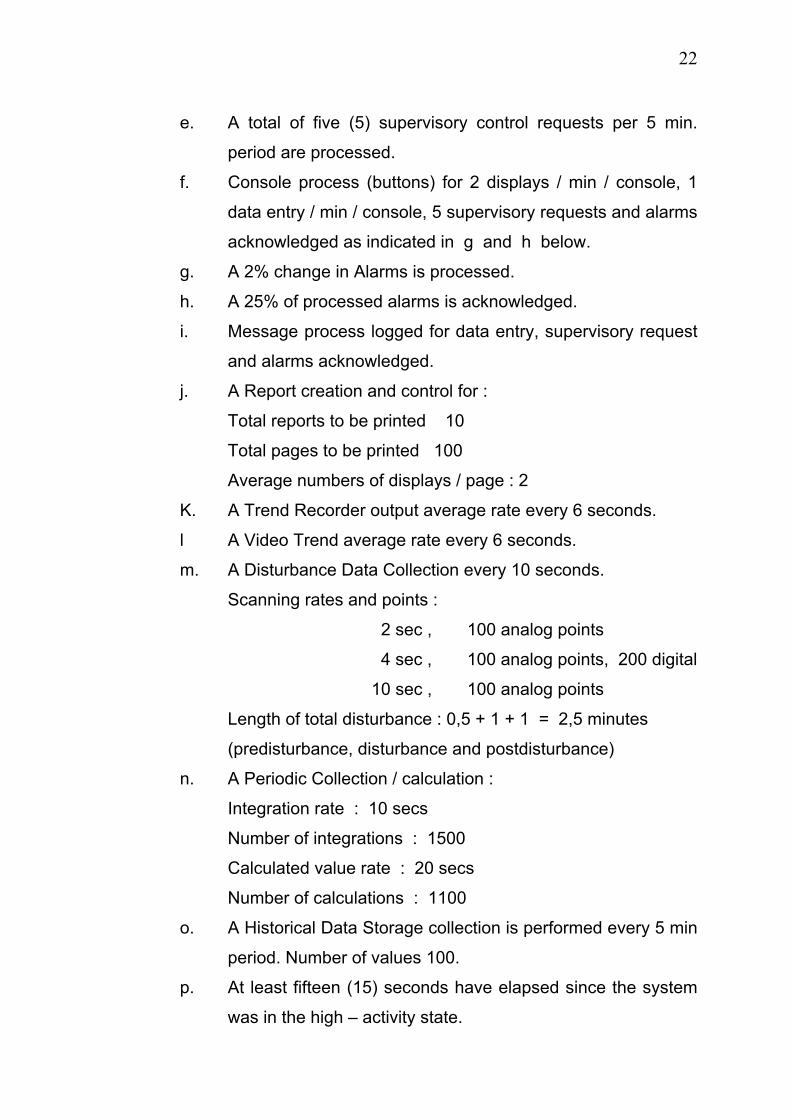
e. A total of five (5) supervisory control requests per 5 min.
period are processed.
f. Console process (buttons) for 2 displays / min / console, 1
data entry / min / console, 5 supervisory requests and alarms
acknowledged as indicated in g and h below.
g. A 2% change in Alarms is processed.
h. A 25% of processed alarms is acknowledged.
i. Message process logged for data entry, supervisory request
and alarms acknowledged.
j. A Report creation and control for :
Total reports to be printed 10
Total pages to be printed 100
Average numbers of displays / page : 2
K. A Trend Recorder output average rate every 6 seconds.
l A Video Trend average rate every 6 seconds.
m. A Disturbance Data Collection every 10 seconds.
Scanning rates and points :
2 sec , 100 analog points
4 sec , 100 analog points, 200 digital
10 sec , 100 analog points
Length of total disturbance : 0,5 + 1 + 1 = 2,5 minutes
(predisturbance, disturbance and postdisturbance)
n. A Periodic Collection / calculation :
Integration rate : 10 secs
Number of integrations : 1500
Calculated value rate : 20 secs
Number of calculations : 1100
o. A Historical Data Storage collection is performed every 5 min
period. Number of values 100.
p. At least fifteen (15) seconds have elapsed since the system
was in the high – activity state.

23
q. AGC is operating normally.
r. All on–line programs are operating normally with the
following number of runs completed within 5 minutes period.
PROGRAM PERIOD
(sec) NUMBER OF
RUNS WITHIN 5 MIN. PERIOD
- AUTOMATIC GENERATION CONTROL (AGC)
- AGC PERFORMANCE MONITOR (APM)
- ECONOMIC DISPATCH (ED) WITH
REGULATING MARGIN DISPATCH (RMD)
- TARGET PASS GENERATION DISPATCH
(TPGD)
- INTERCHANGE SCHEDULING (IS)
- RESERVE MONITOR (RM)
- SYSTEM ENERGY MONITOR (SEM)
(20 secs period for digital integration
calculation)
- SYSTEM ENERGY MONITOR (SEM)
hourly for reports
- SHORT TERM LOAD FORECAST (STLF)
- INTERCHANGE EVALUATION (IEV)-ECONB
FOR A TWELVE (12) HOUR TRANSACTION
- REAL – TIME PRODUCTION COST (PC)
- OPTIMAL POWER FLOW (OPF)
- REAL – TIME SYSTEM STATUS
PROCESSOR (SSP)
- STATE ESTIMATION (SE) WITH
UNOBSERVABLE NETWORK CALCULATION
- REAL – TIME LOAD – FLOW (RTLF)
- NETWORK LOSS FACTORS (NLF)
4
300
60
20
300
75
1
1
1
1
5
15
1
1
1
1
1
1
1
1
1

24
- CONTINGENCY ANALYSIS (CA)
REAL – TIME (60 single and 60 multiple
for screening, 30 single and 30 multiple for
analysis)
- STUDY MODE (60 single and 60 multiple
for screening, 30 single and 30 multiple
for analysis).
1
1
High – Activity State The system is said to be in the high – activity state when both the
following are true :
a. The system has been in the steady state and is performing
all the steady state functions
b. Three (3) alarms per second are being processed by the
System and acknowledged by the operators.
Peak State
The system is said to be in the peak state when both of the
following are true :
a. The system has been in the steady state and is performing
all the steady state functions.
b. A burst of five hundred (500) status and / or alarms occur
within a fifteen (15) second period.
Scan Time Requirements Data is retrieved from RTU’s at the following rates :
• AGC analogs every two (2) seconds
• State Estimation analogs every four (4) seconds
• Other analogs every ten (10) seconds
• Fuel consumption, Water discharge,

25
Water head analogs every nine hundred (900) seconds
• Circuit Breakers (CB) Status every four (4) seconds or if the
RTU supports it, the status can be retrieved by exception. In the
last case then there is a status dump to verify that the status at
the RTU matches the system’s data base.
• Isolators (IL) and Earthing.
Switchers Status and Alarms every ten (10) seconds
• Transformer taps indications every ten (10) seconds
• AGC control every four (4) seconds
• Status Dump every six hundred (600) seconds
Steady State Utilization When the system is in the steady state, the system utilization is as
follows :
a. The average utilization of each CPU over any five (5) minute
period is fifty percent (50%) or less.
b. Over any five (5) minute period, each bulk memory
subsystem is not be busy with data transfers for more than
fifty percent (50%) of the time. The average utilization factor
is fifty percent (50%) or less over any five (5) minute period.
High – Activity State Utilization When the system is in the high – activity state, the system
utilization is as follows :
a. The average utilization of each CPU over any five (5) minute
period is sixty percent (60%) or less.
b. Over any five (5) minute period, each bulk memory
subsystem is not busy with the data transfers for more than
sixty percent (60%) of the time. The average utilization factor
is sixty percent (60%) or less over any five (5) minute period.
26
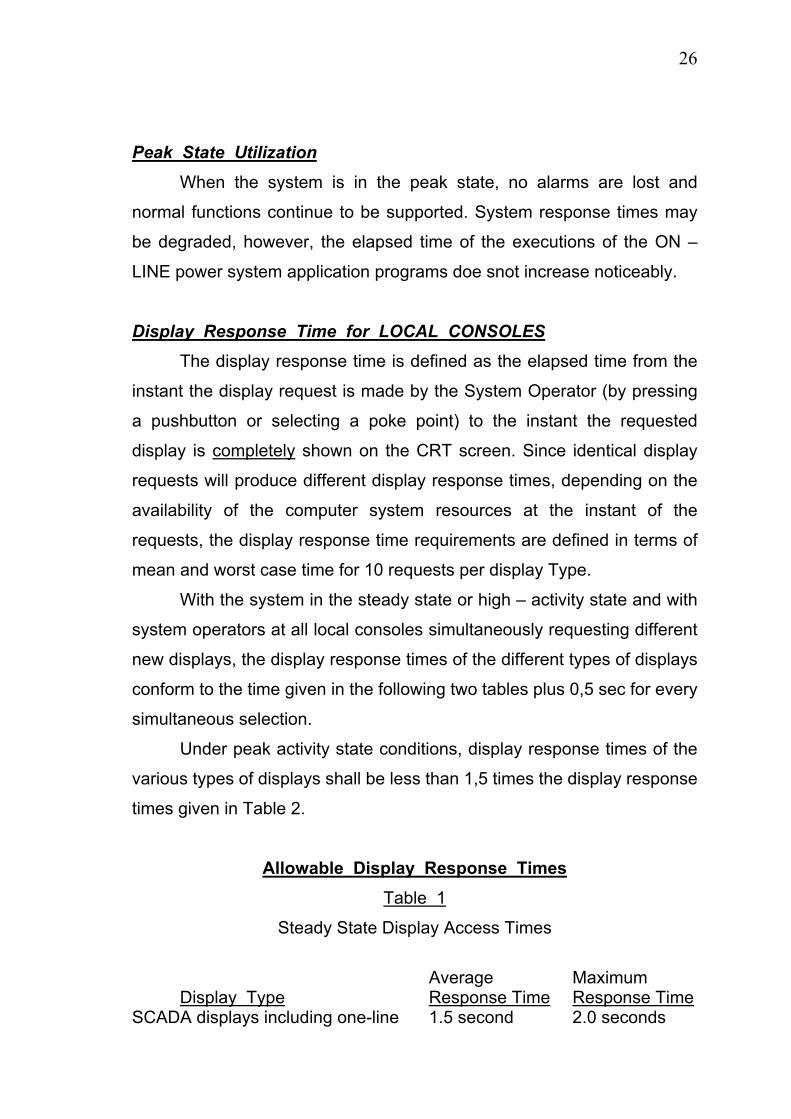
Peak State Utilization When the system is in the peak state, no alarms are lost and
normal functions continue to be supported. System response times may
be degraded, however, the elapsed time of the executions of the ON –
LINE power system application programs doe snot increase noticeably.
Display Response Time for LOCAL CONSOLES The display response time is defined as the elapsed time from the
instant the display request is made by the System Operator (by pressing
a pushbutton or selecting a poke point) to the instant the requested
display is completely shown on the CRT screen. Since identical display
requests will produce different display response times, depending on the
availability of the computer system resources at the instant of the
requests, the display response time requirements are defined in terms of
mean and worst case time for 10 requests per display Type.
With the system in the steady state or high – activity state and with
system operators at all local consoles simultaneously requesting different
new displays, the display response times of the different types of displays
conform to the time given in the following two tables plus 0,5 sec for every
simultaneous selection.
Under peak activity state conditions, display response times of the
various types of displays shall be less than 1,5 times the display response
times given in Table 2.
Allowable Display Response Times Table 1
Steady State Display Access Times
Average Maximum
Display Type Response Time Response Time SCADA displays including one-line 1.5 second 2.0 seconds

27
diagrams EMS displays including unit and 1.5 second 2.0 seconds system summaries Static Background of Window 1.5 second 2.0 seconds I/O display types Dynamic Portions of Window 2.0 seconds 3.0 seconds I/O displays Static background of Applications 1.5 second 2.0 seconds displays requiring calculations of formatted from disc Dynamic Portion of Applications 2.0 seconds 3.0 seconds displays requiring calculations or formatted from disc Dynamic Summary displays 2.0 seconds 3.0 seconds formatted from Queues Tabulars 2.0 seconds 3.0 seconds
Table 2
High Activity Display Access Times
Average Maximum
Display Type Response Time Response Time SCADA displays including one-line 2,0 seconds 2.5 seconds diagrams EMS displays including unit and 2.0 seconds 2.5 seconds system summaries Static Background of Window 2.0 seconds 2.5 seconds I/O display types Dynamic Portions of Window 2.5 seconds 3.5 seconds I/O displays Static Background of Application 2.0 seconds 2.5 seconds displays requiring calculations

28
or formatted from disc Dynamic Portions of Application 2.5 seconds 3.5 seconds displays requiring calculations or formatted from disc Dynamic Summary displays 2.5 seconds 3.5 seconds formatted from Queues Tabulars 2.5 seconds 3.5 seconds
Alarm Response Time With the system in the steady state or high – activity state, an alarm
(analog and / or status) detected at an RTU is reported by audible and
visual alarms at the Master Station within the scan time period for the
particular data point in alarm, plus one second.
If the appropriate alarm summary display and / or station display
containing the point alarm are already being shown on the CRT’s, then
the appropriate entry on the display is also updated within the above
specified time period.
With the system in the peak activity state, all alarms are secured
against loss and then processed at the maximum practical rate to result in
completion of processing of the entire alarm burst within a maximum of
100 seconds.
System Operator Request Completion Time With the system in the steady state or the high – activity state, the
system completes the response to a System Operator request within the
time period indicated here below :
• Point selection on a CRT : CRT display confirmation of point
selection within one (1) second.
• Alarm Acknowledgement : stop flashing, within one (1) second,
message print – out started within 10–15 secs following
acknowledgement.

29
• Data entry verify : data verified, unacceptable entries identified
within two (2) seconds during the high activity state.
• Hardcopy request : start printing within five (5) secs.
• Control request : the system confirms the control action selected
within one (1) second.
• Control execute : message sent to the RTU within five (5) secs
during the high activity state.
• Control point tagged : tag shown on CRT, message print out
started within five (5) seconds.
• Status / analog point deactivation : processing on the point
stopped deactivation indication shown on the appropriate
displays within one (1) second.
• Alarm inhibit : alarm checking on the point stopped, inhibit
indication shown on the appropriate displays, within one (1)
second.
Under peak activity conditions, the response to a System Operator
request does not add more than 2,25 seconds for each of the above
requests.
For System Operator requests which are normally expected to
exceed one (1) second, such as those requiring lengthy calculations, the
system posts a requested – accepted message within one (1) second
followed by an action completed message (or some other appropriate
indication) when the given function is completed.
SUPERVISORY CONTROL AND DATA ACQUISITION (SCADA) Data Acquisition The data acquisition function is responsible for handling all the
communications with the RTUs. It supports the message exchange

30
sequences for all scan modes and generate the necessary commands to
retrieve supervisory data and status information. It also perform all
required error checking to ensure the validity of the received data and / or
proper completion of scans.
Transmission and error checking of control functions are handled
by the data acquisition system. Command functions have priority over the
normal scan and are initiated as soon as the current activity in the
communication channel is completed. Scanning shall then resume from
the point of interruption.
The data acquisition function contains provisions for scheduling the
data scans as well as the following :
• Automatic diagnostic checks of all Data Acquisition CPUs and
peripherals including auxiliary and / or back up devices when
used to ensure proper operation of these devices.
• Automatic diagnostic checks of all communication line
controllers, including auxiliary and / or back up devices when
used to ensure proper operation of these devices.
• Initialization scan to be performed at system reload or
initialization such as following a power failure. This scan consists
of a complete system data and status update.
Following this initialization scan the normal scanning sequence
shall resume.
• Provide an updated data base accessible to application
programs via standardized access routines. Each data point in
the data base has indications of whether the data was
successfully retrieved (updated) on the last scan, the point was
deactivated, or the value was manually updated by the
dispatcher.
• Initiate and process the verification of all supervisory control
functions.
31
• Allow a dispatcher to define an RTU as being on or off the
scanning sequence.
• Allow a dispatcher to tag a point and (if applicable) thus prevent
supervisory control actions from being sent to the remote point.
• Allow a dispatcher to inhibit a point from CRT and audible
alarming and logging.
• Allow a dispatcher to remove a point from processing.
Data Scanning The data acquisition function provides for initiation of an RTU
scanning sequence based on any or several criteria :
• Periodic scans at one or more of at least eight pre-defined rates.
• Initialization scan upon starting up the System or an RTU.
• Program triggered scans.
For the case of periodic scans, scan – frequency assignment and
scan – priority assignment there are data base parameters, changeable
through the interactive data base editor.
The scan priority scheme dictates that initiation of data scanning for
a priority scan group interrupts the scan of data in a lower priority scan
group at the next instant the RTU is available to receive a scan request
message. Upon completion of the high priority scan, the scanning of the
data group having the next highest priority is resumed.
The linkages between scans and triggering mechanisms are data
base parameters, changeable through the use of the interactive data
base editing function.
Communication Error Checking Each reported data message is immediately checked for certain
basic error conditions, including incorrect response, message length

32
error, communication failure detected by hardware checking or message
security codes, etc. Detected errors are filtered before alarms are
generated to preclude excessive alarms due to noisy channel conditions.
Attempts shall be made to recover from the error conditions by repeating
the particular data scan for a predetermined number of times
(configurable). If no more errors are detected in at least one of the retries,
then the earlier error shall be considered as a recoverable error.
Otherwise, it shall be considered as a non-recoverable error. Statistics
(number of detected errors for pre-defined time period) shall be kept on
recoverable errors. The detection of a non-recoverable error or the
occurence of a high number of recoverable errors (e.g., 30%;
configurable parameter) shall be considered as channel – failure and
shall result in the suspension of scanning for the particular RTU, along
with an alarm. The dispatcher then will be able to restart the scanning.
Scan Suspension The capability is provided to interactively (via CRT displays)
suspend the scanning of any given RTU upon dispatch request. This
action is not the same as the deactivate action for individual data points,
in which a particular point is scanned but it is not further processed. The
quality – coding indications for every data point within a CRT for which
the scan is suspended reflects the fact that the data will not be further
updated.
Supervisory Control The functional requirements for supervisory control are described in
this section. Four types of supervisory control are provided :
∙ Digital Control
∙ Autotransformer Tap Control
∙ Generator Raise / Lower Control
∙ Setpoint Control

33
The system supports partitioned operation whereby supervisory
control types may be permitted from certain console positions and denied
from others.
The system provides the capability for imposing software
interlocking conditions between selected sets of points. This holds for the
disconnecting and grounding switches of the 400 KV substations.
Digital Control All digital control commands to the RTU’s are treated with priority.
These control commands are used to control circuit breakers, isolators,
earthing switches, reactor breakers, and other types of substation devices
with 2 state control.
The supervisory control function involved in the control of two state
devices have the following safe capabilities :
a. All dispatcher – requested control selections are checked for
proper conditions for control of the device (no other control
actions in progress at this RTU, this point not selected for
control at some other console, control of the said point
allowed from this console, no control inhibit, tag effective for
this point, interlocking in effect for this point).
b. The system acknowledges the above and indicate to the
dispatcher that this selection has been verified (select –
before – operate).
c. The dispatcher either cancels his selection or executes the
control command within a predetermined time interval
(configurable). In the latter case, the system performs the
select – before – operate sequence from master to RTU and
after completion acknowledges the execution of his
command.
d. It is possible to choose different time – out durations for each
controllable device at the time of data base generation. The

34
time – out period are variable from one second to ten
minutes. After expiration of the time – out, the system
initiates an alarm message.
e. After detection of change of state in the RTU the status is
analyzed to ascertain that the proper control action took
place.
f. The system updates the data base.
g. If communication errors occur during the select – before –
operate sequence, the system retries the operation up to
three times in succession (programmable number). If it is
impossible to obtain proper communication or if the RTU
does not respond with the proper message, the dispatcher is
alarmed with an appropriate message different from the time
out message.
Generator Raise / Lower Control For purposes of controlling generator units, a special form of digital
control is required, as follows :
∙ Control commands between master and RTU are direct
operated rather than select – before – operate.
∙ Control commands from master to RTU include the desired
raise or lower pulse length to be output by the RTU. It is possible
to vary raise and lower pulse lengths between 0 and 1.5 secs in
0.1 second increments.
∙ No limitation is placed on multiple raise / lower control
operations occurring simultaneously.
Setpoint Control The System supports setpoint control, whereby control commands
are issued to the RTU to establish desired analog value handoffs.

35
Setpoint commands employ a select – before – operate message
sequence between master and RTU or an equivalent safe procedure.
DATA PROCESSING Real – Time Analog Data Processing After requested analog data from an RTU have been received
without error, they are subjected to limit checking.
Every analog value is checked against predefined and changeable
high and low limits which are to be individually specified for each point.
These limits are :
High / Low Reasonability Limits : The maximum and the minimum
readings of the transducers – Beyond these limits readings are to
be considered unreasonable and are not used to update the
system data base.
High and Low Emergency Limits : A reading beyond one of these
limits is an indication of an emergency state of the power system or
power device.
High and Low Operational Limits : A reading beyond these limits is
an indication of a deviation from the normal operational guidelines.
Detection of a limit violation results in appropriate audible alarm,
timely display update, and logging of the alarm. A return – to – normal
indication and logging is also provided when this alarm condition returns
to normal. Each of the above three sets of alarm limits is treated
separately ; e.g., an analog data which has returned to normal from a
reasonability limit alarm may still be in the emergency – limit alarm state
and / or in the operational limit alarm state. A deadband which is equal to
a percentage of the difference between the high limit and the low limit, is
applied to the magnitude of each of the limits to derive the return – to
normal level.
Selected analog data (for any 200 analog data) is checked for rate
– of – change of limit values.

36
For each selected analog value, the total net change in value over
the scan interval is computed as an engineering unit value change per
second. The computed change is compared against a predefined rate –
of – change limit value, also expressed as an engineering unit value per
second. An alarm is generated if the limit is exceeded.
The system provides for A/D drift detection. Two data integrity
points are provided for analog – to – digital (A/D) converters in each RTU.
These precision reference points are sampled and utilized to determine
the extent of errors of the A/D converters. If the A/D values retained for
these integrity points drift outside predefined high / low limits, a system
alarm is generated to indicate the problem and the analog points in that
RTU are set to telemetry error.
The basic conversion of analog values to engineering units is made
by assuming a linear transducer characteristic of the general form
Y=mX+b, where m and b are the coefficients defining the scaling and
offset of the analog point.
To eliminate surge and spikes caused by electromagnetic
interference analog data is filtered by use of filtering techniques.
Real – Time Status Data Processing Status data is processed for every scan period when such data are
received. The newly received status is compared against the current
status in the data base to determine if changes have taken place (unless
report – by – exception is used). Change of status of power system
devices not initiated by the operator result in appropriate audible alarming
display update, and logging of the changes. Operator – initiated change
of status does not result in an alarm but the change shall be logged on
the event logger. The system is designed to ensure that no change of
status is lost due to communication errors or other causes except in the
case of total failure of the system.

37
The alarm / indication data is processed to determine the current
status and to report any change of status. Each alarm / indication point is
monitored though a dry contact which may be a form “a” or “b” contact ;
the correspondence to open or closed states is a data base assignable
parameter. Both the alarm conditions and return – to – normal conditions
are reported. The correspondence between a “normal” condition and the
dry contact status (open or closed) is a data base parameter changeable
through the CRT – interactive data base modification procedure.
Motor – operated switches are monitored by separate contacts to
indicate fully closed and fully open positions. The system correctly
interprets and show switch position as being fully closed, fully open or in
transit. Some motor – operated switches are equipped for automatic
operation (changing position without operator initiation).
Breakers equipped with reclosers are monitored with status – with
– memory (change detection) inputs. The breaker status and the change
detection status are correctly interpreted to indicate and record the
following breaker operations which may occur within one scan time
period :
∙ From close to trip
∙ From close to trip to close
∙ From close to trip to close to trip
∙ From trip to close
∙ From trip to close to trip
Return – to – normal conditions is alarmed and logged.
Real – Time Accumulator Data Processing Selected points have watt – hour meters which report data to the
pulse accumulators at the RTU. Accumulator readings are retrieved and
processed every 15 minutes (configurable). The following functions are
performed on pulse accumulator input data :
∙ Data conversion to engineering units.

38
∙ Data storage in the data base and in historical files.
If one or more accumulator readings are missing due to RTU
failure, master station failure at the time of scheduled accumulator scan,
or communication error, the scaled accumulations for the associated time
periods are flagged as being bad in the data base and historical files. At
least M retries, where M is a changeable parameter, are attempted before
an accumulator reading is declared “bad”. Appropriate alarming is
provided for these conditions :
The accumulator reading is flagged as “bad” for any hour in which
the RTU has experienced a power failure.
If the operator manually enters hourly accumulators data, the
values he enters are saved in the system data base and otherwise
processed just like “good” accumulator data received from the RTU.
Calculated Data A calculated point is a point whose value or state is a function of
the value (s) or states of one or more points (component points). The
component points may be points being monitored at several RTU’s, local
analog inputs, data or states received from the data link (s), and / or
dispatcher – entered data or other calculated points. The value or state of
a calculated point are calculated by using a predefined algorithm.
The value of a calculated point is calculated and updated due to
one of the following predefined triggering events :
∙ Periodically at defined multiples of one second
∙ At specified status changes
∙ Operator demand
∙ Specified time of day
A calculated point is stored in the data base for display, logging,
and other functions, in such a way that whether it is calculated or a
monitored point, appears identical to the accessing programs.

39
Like the monitored analog and status data, each calculated value is
checked against preset high and low limits or against defined normal and
abnormal states, and limit alarm messages and return – to – normal
messages are provided when appropriate.
The algorithm is pre – stored and available from a CRT display
such that a calculated point can be defined by simply specifying the
component data points and referencing the particular algorithm desired by
the dispatcher.
DEVICE TAGGING The System provides the capability of tagging a device with any
one of the following tag definitions :
The required tags are :
Out of Scan May be associated with an point
type-data base value or state – Is
not to be updated with new
telemetered data.
Tap Changer Control Inhibited May only be associated with a data
base point that has been defined as
having control – No control
commands are allowed to be sent to
the RTU for this point.
Open/Close Control Inhibited May only be accociated with a data
base point that has been defined as
having control – No open / close
commands are allowed to be sent to
the RTU for this point.
Information Only May be associated with any point
type – Allows a comment to be
associated with a point but does not

40
restrict the interface with point in
any way.
Alarm Inhibit May be associated with any point
type – Does not allow alarm
processing for this point.
Each tag type causes a unique single character tag indicator to be
displayed on dispatcher screens that show the value or state of the
associated point. This indicator optionally defines variable positions as
part of the screen definition. The tag types have a unique priority and the
highest priority tag present on a point determine which tag indicator to
display.
Each tag contains at least the following information for log and
tabular display :
∙ Point name
∙ Station name
∙ Date
∙ Time
∙ Minimum or 15 characters of dispatcher entered comments.
The System is capable of supporting tagging operations (add and
delete) from any display in the system that the associated point appears
on. All tag operations are logged on the Alarm and Event Log upon
occurence.
LOAD SHEDDING / RESTORATION (LS / R) The Load shedding / restoration (LS/R) function operates on a
computer – directed semi – automatic mode by the dispatcher. This
function provides the dispatcher with a convenient and rapid method of
opening and closing groups of circuit breakers without the need to
individually select and operate each breaker separately.

41
The data base used by the program contains a pre – stored list of
circuit breakers which can be operated by the LS/R program. This list
could be modified by the programmer / engineer using appropriate
editing. Only those devices contained in this list are affected by the LS/R
function.
Using the appropriate LS/R displays, showing groups of breakers
with total group megawatts (associated with controllable breakers), the
dispatcher is able to open or close all circuit breakers in a group which
are in a controllable state. The dispatcher has displayed the total amount
of group MW which can be shed if the controllable breakers are operated.
This amount of power will be retained on the display for his reference in
restoring service to the group loads which have been shed.
The LS/R program supports at least 20 control groups with each
group containing at least 40 breakers.

42
CHAPTER 2
TERMINAL UNITS OF THE PPC
GENERAL DESCRIPTION The terminal units of the ECS are installed in selected points in the
power grid and have been selected by the PPC.
The aim of these units is to gather information from the network,
transmit these information to the control centres, receive information from
them, decode them and transmit them to the relevant substation.
All the information from and to the substation are gathered in the
first cabin of the ECS, in the TDB (Transducer Distribution Board).
In this unit the transducers, interposing relays, which are used for
remote control are installed.
The next unit is the RTU (Remote Terminal Unit), which is the most
important unit of the terminal station. It consists of the central processing
unit, the communication cards and the analog and digital input and output
cards.
The PLC unit gathers the telecommunications equipment of the
substation. The major unit is the PLC (Power Line Carrier), which is
connected to the high voltage line through the proper devices.
There are specific occasions where two substations are connected
with underground cables specially installed by the PPC. In this occasion
the PPC uses specialised equipment for high voltage protection installed
to the PCTB (Pilot Cable Terminating Board).
The interconnection between ECS and PPC takes place through
telephone lines installed at the LFD (Low Frequency Distribution) cabin.

43
TDB UNIT The TDB unit is the interposing level for the interconnection of the
PPC substation with the ECS. In this unit all the information from and to
the PPC are gathered.
The analog values are interpreted through transducers which
convert the analog input signal (usually alternating current or alternating
voltage) in such a format that can be easily read by the RTU. (DC of 0 –
10 mA or + 10 mA). The transducers have a pulse output which is
measured by the equivalent measuring card of the RTU.
The transmission of remote control commands from the RTU to the
PPC takes place through interposing relays installed at the front side of
the TDB and to the telecommunication network so that they can be easily
connected to the field.
At last there are communication lines for the connection of the
digital input signals and the analog output signals. In these occasions
knife disconnected terminals are used so that every signalled can be
isolated, without the need of disconnecting the cables.
It is interesting to mention that the ECS uses 227 TDB cabins. In
those cabins there are 502 active/idle power transducers, 76 energy
transducers, 865 current transducers and 120 voltage transducers.
REMOTE TERMINAL UNIT (RTU) The RTU is the major unit of the system. It consists from a
computer specially designed for industrial environment and from a
number of peripheral cards specially designed for the communication and
execution of specific commands.
The RTU collects all the information ( analog or digital), elaborates
them and transforms them to a proper format in order to send them to the
control centre. At the same time it receives signals from the control
centre, examines their correctness and does their execution.

44
The RTU equipment is placed into a 2.2 x 0.8 x 0.8 metres cabin. In
this cabin there can be one to four racks. The card which consist the RTU
are :
∙ MP41, MP49, ME45
This is the Central Processing Unit (CPU). The microprocessor is
the 6809 in 2 MHz.
It has communication lines with peripheral devices such as PCs or
printers.
The total memory capacity is 4 pages of 64 Kbytes RAM and 128
Kbytes EEPROM.
There is parity control for every information which is stored and read
from the RAM unit. At the same time the RAM has a battery for the
information protection in case of a power outage.
∙ AL07
Digital input card. It has 32 input channels with galvanic isolation
organised in 4 bytes. The nominal voltage is 48V.
∙ RL 02
Digital output card with relays. It has 16 output channels and the
ability to control the circuit and the working status of the relays.
∙ RL 00
Digital output card with relays. It has 8 double channels and it is
specially designed to control devices that demand a separate contact for
ON and OFF condition. This card prevents the system to give a
simultaneous ON and OFF condition in a device.
∙ AA 12
Digital input card. It has 32 input channels. Every input is galvanic
isolated through a ‘flying capacitor’ circuit.
∙ AA 05
This card converts the analog signal to digital. The parity is 12 bits +
sign + overflow index. The precision is 0.1 % and it has selfcontrol ability.
∙ RA 00
45
Analog output card with 4 channels. It has galvanic isolation and the
ability to drive a load of up to 3 Kohm. The precision is 1 % and the output
current can be 0 – 5 mA, 4 – 20 mA, +- 5 mA, +- 10 mA, +- 2.5 mA.
∙ AC 00
Pulse measurement card. It has 4 channels with galvanic isolation
and measurement ability of 7 or 8 bits. It is used for energy measurement.
∙ CS 41
It is the ‘watchdog’ card of the system. It also has a temperature
control circuit and it gives an alarm signal at 50 or 60 C. Furthermore it
has a control circuit for the remote control voltage.
∙ CS 00, CS 01, CS 05
They are used to transfer the RTU bus to the extension racks.
∙ AI 01, AI 02, AI 03
Feeding cards. They accept –48 VDC and they produce all the
necessary system feeding voltages. (+5V, +-12V and +-15V).
The communication between RTU and control centre takes place
through a MODEM device. The main features of this device are :
∙ Serial Full Duplex transmission.
∙ FSK configuration.
∙ Communication speeds of 50, 100, 200, 300, 600 and 1200
Bauds.
∙ 55 receipt and transmission programmable channels.
∙ Set- up of the receipt and transmission parameters with the aid
of a portable computer.
∙ Estimation of the signal to sound ratio.
The communication speeds of the ECS are 300, 600 and 1200 BPS.
PLC CABIN The dimensions of the cabin are: 2.2 x 0.7 x 0.65 metres. It contains
the PLC (Power Line Carrier), the terminating set and the EMM 312 unit.
The above constitute the telecommunication equipment of the system.

46
PLC (Power Line Carrier) The PLC is used to transmit information through the high voltage
lines. The operation is bi-directional and the SSB (Single Side Band)
method is used to transmit the 300 – 3700 Hz frequencies to the 40 – 500
KHz area. The transmission takes place through 3 sequential
configurations. The acoustic information is primarily configured at 24 KHz
and filtered in order to live only the bottom side zone. After that there is a
second configuration at 600 KHz and after the filter only the upper side
zone exists. The final configuration takes place through a digital
frequency synthesizer.
After the filter only the bottom side zone exists and the signal
enters the power amplifier and through the exit filter and proper device to
the high voltage line.
At the receiver stage we have the opposite procedure in order to
decode the signal and reverse the frequencies at their basic values of 300
– 3700 Hz.
In order to counterbalance the losses from the transmission line we
use an AGC (Automatic Gain Control) circuit. A predefined frequency is
being sent from the emitter to the receiver. Any change at the amplitude
of the frequency is identified by the receiver and through the proper circuit
the receiving gain is regulated in order to stabilise the frequency’s
amplitude.
Through this procedure the receiving signal remains stable despite
the fluctuations of the losses of the transmission line.
The maximum power of the amplifier is 60 W/ 75 Ohms and its last
stage comprises of MOSFETs of A – B class polarity which has as a
result very low distortions. It also has the ability to drive lines of 50, 75
and 150 Ohms.

47
TERMINATING SET Through this unit it is feasible to transmit voice and data
simultaneously at the same communication channel. The acoustic spectre
300 – 3700 Hz is separated in two zones with the appropriate filters. The
first zone 300 – 2000 Hz is used to transmit voice while the second zone
2280 – 3400 Hz is used to transmit data.
The terminating set has the connection ability with a simple
telephone line (2 – wire) or a telephone centre (4 – wire and E + M
signalling and control line frequency at 2220 Hz).
At the same time there is the ability of telephone connection of two
directly connected substations through a ‘staff telephone’.
EMM 312 UNIT
(Modular Multifunction Equipment)
The EMM 312 unit is designed to provide a series of functions for
the integration of the telecommunication equipment.
Its basic capabilities are :
∙ The distribution and concentration of the communication
channels (Diffusor – concentrator). In that way it is to transmit a
channel in different directions and to gather channels from
different directions in one channel.
∙ The transposition and filtering of a communication channel.
∙ In order to achieve these functions the device uses the digital
signal processing method. In that way the signal converts from
analog to digital. The processing takes place through software
(ADSP 2101 microprocessor) and after that is converted to
analog in order to reach the output in this format.
LFD (LOW FREQUENCY DISTRIBUTION) UNIT This unit (0.8 x 0.4 x 0.2 metres) is the interposing
telecommunication stage between the ECS and the PPC.

48
It consists of telephone lines with the ability to temporarily interrupt
the connection in order to perform other interconnections to the network
and perform the necessary controls and checks.
PCTB (PILOT CABLE TERMINATING BOARD) UNIT It is necessary to protect the telecommunication equipment from
high voltages, especially when this equipment is installed in PPC’s
substations, where the telecommunication cables may be in parallel with
High Voltage lines.
For this reason there protection devices installed at the PCTB
cabin. These devices consist of isolation transformer, varistors, arrestors
and suppressor diodes.
FEED AND AUTONOMY SUBSTATION UNIT In order to provide current for the devices the appropriate voltage is
–48VDC. The feeding device is a switching mode one with the ability to
provide current of 15 to 135A. At the same time it charges the Ni – Cd
batteries which are used to feed the substation’s equipment in case of
interruption at the main voltage of 220VAC. The autonomy can last at
least for two hours. The capacity of the batteries is from 18 to 240Ah
accordingly to the consumption level of each substation.

49
CHAPTER 3
SUPERVISORY CONTROL IN WIND FARMS
INTRODUCTION
It is a fact that wind energy has done a remarkable progress the
last years and it is now feasible to integrate it and produce power. Under
specific circumstances the cost of wind energy is now comparable with
the cost of power from fossil fuels. It also has the advantage of being an
environmental friendly energy, something which is very important for our
society.
The Public Power Corporation of Greece (PPC) has started an
extensive program of exploiting the wind energy especially in the islands
of the Aegean sea with the financial help of the EU.
A wind energy unit is usually much smaller than the usual diesel
units of a small power station.
The most common sizes of wind turbines are 55, 75, and 100 KW.
We are not sure that this is the ultimate size for financial exploitation
since the last years there is a tendency to install wind turbines of 200 and
300 KW. Of course there have been installed much bigger wind turbines
but usually for experimental reasons. Usually an area with an amount of
10 wind turbines and more is called Wind Farm (WF), which is monitored
from a control system. The WF is connected to the local electricity grid at
the middle voltage of 15 KV or 20 KV of the island through transformers
of 220 KV. The rest of the electricity grid is using diesel engines.
In every WF there are several meteorological instruments installed.
The measurements from these instruments are transferred, together with
other information for the function of the WF, to the Energy Control System

50
from where the engineers can adjust the function of the WF. At the same
time other information regarding the oil units of the station are gathered.
At this point it will be useful to see a brief analysis of the Energy
Control System of 50 wind turbines in 7 WFs in islands of the Aegean
Sea. (Limnos, Hios, Karpathos, Samothraki, Ikaria, Samos)
FUNCTIONS The Energy Control System of the Wind Turbines (WT) consists of
three different levels of electronic equipment. These three levels
correspond to the (WF), to the autonomous generation station (AGS) and
to the directorate of renewable energy of the PPC (DRE) in Athens.
The functions in each level are:
1. Wind Farm (WF) level
Collection of the necessary data for the function of the WTs,
the meteorological data and the data from the (AGS).
Supervision of the lines and equipment for the
telecommunications of the units.
Keeping of records with the data from the WTs and the diesel
electricity production couples (EPC) of the (AGS).
Reception of remote control commands from the computer of
the (AGS) and transmission to the WTs.
Entry from the user through keyboard/monitor interface of the
commands for the remote control of the WTs. This will be necessary only
in the case that the WTs cannot be controlled from the AGS.
Man – Machine Interface (MMI) through keyboard/monitor and
printer for the following functions :
∙ The decision if the remote control of the WTs will take place
from the control room of the WF or from the control room of the
AGS and the transmission of the proper commands to the WTs.

51
∙ The ability for the user to have real time and recorded data for
both the WF and AGS.
∙ The generation of computer programs for the control of the WTs
or the computer of the AGS.
2. Autonomous Generation Station (AGS) level.
Collection of the functional data of the EPC of the AGS and
transmission of them to the computer of the WF.
Collection of data for the function of the WTs from the
computer of the AGS.
Communication with independent Energy Control System of
the AGS for the exchange of functional data for the diesel EPC.
Communication with the computer of the DRE in Athens for
the transfer of real – time data of both the WF and AGS. At the
same time there is transfer of data regarding the function of the
WTs and the EPC.
Execution of the load management program, issue of commands
for the remote control of the WTs and transfer of these commands to the
computer of the WF.
MMI through keyboard/monitor and printer for :
∙ Entry of remote control commands for the WTs and transfer of
them to the computer of the WF through keyboard and monitor.
∙ Presentation of real time and recorded data for the function of
both the WF and AGS.
∙ Modification of input data for the load management program.
∙ Generation of computer programs for the remote control of the
units.
3. Αthens Directorate of Renewable Energy (DRE).
Automated telephone calls through scanning to the various
AGSs in order to transfer the data from the function of the WF and the
AGS.
Reception of the above data and creation of records.

52
Execution of programs for the analysis of the functional data.
Man – Machine Interface (MMI) through keyboard/monitor for the above.
EQUIPMENT – COMMUNICATIONS The electronic equipment of each WT relies upon a microprocessor
and gives the ability of serial communication with the Information
Collector (IC) of the WF.
Apart from the IC in the WF who communicates with the WTs and
receives the data from the meteorological stations, there is also a
personal computer for the handling of this data.
There is also similar equipment i.e IC and PC in the AGS for the
collection of data from the diesel generators and the supervision and
management of the system.
The communication with the DRE in Athens, where there is also a
PC for every AGS, is achieved through the public telecommunication
network through an automated choice.
The equipment of the WF and the AGS consists of specific circuits
for the protection from thunders and power outages.
ELABORATION OF SIGNALS AND MEASUREMENTS The data gathered in every scan are :
For every WT :
KW – produced active power
KVAR – produced idle power
WSP – speed of wind/wing/generator
T - temperature of gearing box, small generator, large
generator
Operation time for the small generator
Operation time for the large generator
Total amount of energy produced by the WT.

53
Operational condition (fuselage position, brakes, connection
to the grid etc.).
Operation errors
For the WF :
V – network voltage
WSP – wind speed
WDIR – wind direction
TEM – external temperature
PRESS – pressure
For every generator :
KW – produced active power
KVAR – produced idle power
Generator switch position
Operational limits
For the AGS :
V – 20 KV bus voltage
F – grid frequency
KW – total active production
KVAR – total idle production
KW – total production capability
KW - WF line active power
KVAR – WF line idle power
WF line switch position
WTs remote control commands (Direction, START, STOP)
KW – departure active power
KVAR – departure idle power
KW – internal consumption active power
KVAR – internal consumption idle power
The above information is collected from the Information Collectors
and are transferred to both the WF computer and AGS computer. Every

54
10 minutes a ‘historical record’ is created with the maximum, minimum
and middle values of the most important measurements.
The above data is necessary for the statistical analysis which takes
place at the AGS or DRE computer in Athens.
The system operator has the ability through his monitor to access
the WTs operational data and handle the diagnostic messages of every
different category.
There is a database at the AGS computer that handles all the WTs
measurements and signals. This database works in real time mode so the
system operator has the ability to remote control the WTs function and
the normal connection of the WF to the power grid of the island.
LOAD MANAGEMENT The load management program exists at the AGS computer with
the aim to produce the ultimate amount of energy taking into
consideration the safety rules for the diesel EPC and the whole system in
general. The criteria which are taken into consideration are :
∙ WTs start availability
∙ Wind speed and duration (stability)
∙ System reserve and ability to start or interrupt a number of WTs
∙ WT participation in the production of electricity
∙ WT circular function
The operator supervises the system and decides upon the
following :
∙ Diesel unit start/stop
∙ Load redistribution in the available diesel units
∙ Capacitors connection/disconnection
The wind turbines are automatically accessed into the system if
they are available.

55
CONCLUSIONS The EMS system is absolutely vital for the WTs function in an
island’s autonomous power grid, especially when the amount of electricity
produced by the WTs is increased.
The AGS has to have a high reserve for the load increase or
decrease, especially in the case of strong wind that may exceed the
operational limit and stop the WTs function.
The statistical handling of the data in every AGS, will help us to
evaluate the wind energy potential and have a better view for our future
strategy not only in the existing WFs but also in other islands in the
Hellenic territory.

56 GENERAL SYSTEM LAYOUT
WT WT WT DATA WT COLLECTION ------------------------------------------------------------------------------------------------------------------------ V MONITOR WIND FARM EQUIPMENT < = UPS ~~~~~~~~~~~~~~~~~~~~ PC WF RTU WF MODEM Telecommunication Cable
~ = ------------------------------------------------------------------------------------------------------------------------ ~ = : Analog and AUTONOMOUS GENERATION digital inputs EQUIPMENT ~~~~~~~~~~~~~~~~~~~~~~~~~
~ = Telecommunication Cable MODEM RTU AGS PC AGS PRINTER
T UPS => MODEM MONITOR R COLOR A MONITOR P
E
Telecommunication R : ROBOX switch Cable
------------------------------------------------------------------------------------------------------------------------
Directorate of Renewable Energy EQUIPMENT
~~~~~~~~~~~~~~~~~~~~~~~~~~~
MODEM PC DRE PRINTER T
COLOR A MONITOR P
E

57
LOAD MANAGEMENT ALGORITHM
The following algorithm is a method to manage the Load in wind farms.
It relies upon the equipment that exists in the area and gives all the necessary data
to the operator in order to supervise and control the function of the wind turbines.
The approach used here is the combined operation with Diesel engines. The
importance of Diesel engines is vital here because the wind farm is supposed to be
installed in a Hellenic island. The conditions in such an area are dynamic and
frequent changes in the air direction and speed are very usual. In order to avoid
such problems and possible power outages in the island we assume the use of
Diesel engines for the Power production during the time that the turbines are out of
use. This can be done due to wind speed exceeding the minimum and maximum
levels, which are set to 3.5 m/s and 24 m/s.
The first function of this algorithm is to establish the communication between wind
farm and RTU. The following task is to check the working condition of the Diesel
engines. After this check the operator gets from the instruments the diesel Power.
Furthermore the operator gets from his instruments the wind speed and if it is out of
limits puts the wind turbines that operate at the moment out of use. If the wind is
within the limits, the power from the wind turbines is calculated with the use of the
following equation:
P = 0.5 p A V3
Where P is the produced power
0.5 Cp number of 0.5
p is the air density (1.25)
A is the rotor diameter (52 m)
V is the wind speed
This power is compared to the expected diesel power and the operator has the
chance to see the efficiency of the wind turbines and decide which wind turbines

58will be operational and which will stop. The choice is done after the consideration
of the working hours for each wind turbine.
If the operator is not satisfied with the production he compares the expected wind
power with the minimum diesel power and decides upon to start another wind
turbine.
The wind farm, which is assumed here consists of 10 wind turbines.

59LOAD MANAGEMENT ALGORITHM FOR WIND FARMS
A
WIND SPEED WITHIN LIMITS = READ THE FALSE USER’S PARAMETERS CALCULATE THE ACTIVE POWER FOR THE WTs PC – RTU NO COMMUNICATION CORRECT ? YES WTs ACTIVE YES STOP THE POWER > DIESEL WT WITH THE ACTIVE POWER ? MOST WORKING RET HOURS DIESEL EQUIPMENT NO CHECK
WIND SPEED NO WITHIN LIMITS = RET TRUE ? DIESEL POWER YES PRODUCTION CALCULATE THE POWER WHICH CORRESPONDS TO THE WIND SPEED CHECK THE NO ALGORITHM RET CONDITIONS
EXPECTED WT YES YES POWER > TOTAL RET DIESEL POWER ?
WIND TIME WIND SPEED NO WITHIN LIMITS > WITHIN LIMITS = T USER ? FALSE
TOTAL DIESEL POWER - YES
EXPECTED WIND TURBINE RET POWER < MINIMUM
DIESEL POWER ? Α NO
START THE WT WITH THE LESS WORKING HOURS
RET

60
PROGRAMMING APPROACH
One of the main focus of this thesis is to turn the above algorithm
into a program, which could be used with the simulation tools or the
equipment of the wind farm and the measurements that come from each
single device. One of the main problems was to choose the proper
language for the programming approach. It is a wide belief that the
knowledge of one programming language can lead to other languages
with similar structure. My previous knowledge of Pascal was not enough
in order to overcome the difficulties of this problem so I tried to get
familiar with C and try to develop the program in this language.
One reason for C’s success and staying power is that programmers like it.
C combines subtlety and elegance with raw power and flexibility. It is a
structured language that does not constraint. C is also a language that
puts the programmer firmly in charge. C was created by a programmer for
programmers. It is not the contrived product of a committee, but rather the
outcome of programmers seeking a better programming language.
C is important for another reason. It is the gateway to the world’s two
other professional programming languages: C + + and Java. C + + is built
upon C, and Java is built upon C + +. Thus, C is at the foundation of all
modern programming, and knowledge of C is fundamental to the
successful creation of high – performance, high – quality software.
The main aspects of the program rely upon the good communication
between PC – RTU which is checked at the beginning of the algorithm.
Also the user is prompted to check the good working conditions for the
Diesel engines from the measurements he has available and then go on
with the rest of the procedure.
The main aspect for the functionality of the wind turbines is the wind
speed. At this speed there are two limits the upper (24 m/s) and the

61
minimum level (3.5 m/s). If the wind is within these limits the power from
the working wind turbines is given by the equation:
P = 0.5 * 1.25 * 52 * windspeed * windspeed * windspeed
The above equation stands for the working wind turbines. The number of
working wind turbines is determined by the wind speed and the database, which
is constructed into the program, and calculates the working hours for each wind
turbine.
Furthermore there is a minimum Diesel power which has been set to 300
KW and this is to compare with the expected power from the wind
turbines and start or stop one or some of them. Also there is a
comparison with the random or expected power from the Diesel Electricity
Production Couples. It is natural most of these data to be directly fed to
the program by the special instruments that exist at the wind farm.
Unfortunately at this case there is not the real data that could be used but
the program could be easily used in order to work together with such
equipment.
For more information about the following program there is an executable
version that could be sent upon request.

62
#include <stdio.h> #include <stdlib.h> #include <time.h> void init_gen(); void control(); void stop_generator(void); void start_generator(void); void power_compare(void); int communication(void); int diesel_func(void); double wind_total(void); double wind_speed(void); double diesel_kw(void); double dieselpower = 0; double windpower = 0; double windspeed = 0; double windtotal = 0; long gen_hours[10]; int gen_run[10]; double dieselmin = 300; /* minimum power produced by diesel */ int main(void) { printf("wind generator control, abort with ^C\n"); /* program can be stop by pressing control c */ /* assign working hours for wind generators */ init_gen(); /* loop execution of function for ever */ while (1) control();

63
} void control(void) /* program main function */ { if (!communication()) { puts("communication with diesel not available\n\r"); return; } if (!diesel_func()) { puts("communication with diesel out of order\n\r"); return; } windspeed = wind_speed(); if ((windspeed < 3.5) || (windspeed > 24)) { printf("wind speed (%f m/s) out of range\n", windspeed ); stop_generator(); return; } else { windpower = (0.5 * 1.25 * 52 * windspeed * windspeed * windspeed) / 1000; /* in kw ? */ printf("wind speed %f m/s, power which one wind generator can produce: %f\n", windspeed, windpower); } dieselpower = diesel_kw(); /* get user input for diesel power */ windtotal = wind_total(); /* determine number of active wind generators */ printf("Active Wind Generators: %f, Total Power of Wind Generators: %f, Power of Diesel: %f\n", windtotal, windpower * windtotal, dieselpower);

64
if ((windtotal * windpower) > dieselpower) { printf("total power of wind generators is greater then diesel power (%f)\n", windtotal * windpower); return; } else { windpower = (0.5 * 1.25 * 52 * windspeed * windspeed * windspeed /1000) * windtotal; if ((dieselpower - windpower) < dieselmin) { printf("Diesel Power - Wind Generator Power < min. Diesel Power\n"); return; } else { start_generator(); return; } } } int communication(void) /* determine if communication with wind generators is available */ { srand(time(0)); return (int) rand() % 20; /* return > 0 communication available return 0 communication NOT available */ } int diesel_func(void)

65
/* determine if diesel is functional */ { srand(time(0)); return (int) rand() % 20; /* return > 0 diesel functional return 0 diesel NOT functional */ } double diesel_kw(void) /* get diesel power in kw from user input */ { float kw; char buf[10]; printf("enter diesel kw: "); while (1) { scanf("%f", &kw, buf); if (kw > 0) { if (kw <= dieselmin) printf("input value must be greater than Diesel min. power %f, enter diesel kw: ", dieselmin); else return (double) kw; } else printf("invalid input, enter diesel kw: "); } }

66
double wind_speed(void) { srand(time(0)); return (double) (rand() % 3000) / 100; /* calculate wind speed in 0-3000 cm per sec. */ } void start_generator(void) /* start wind generator with smalles amount of working hours */ { long minhours = gen_hours[0]; int i,min = -1; for (i = 0; i < 10; i++) { if ((gen_run[i] == 0) && (gen_hours[i] <= minhours)) { minhours = gen_hours[i]; min = i; } } if (min == -1) printf("all wind generators running\n"); else { gen_run[min] = 1; printf("wind generator #%d with %D hours started\n", min + 1, minhours); } } void stop_generator(void) /* stop wind generator with most working hours */ {

67
long maxhours = 0; int i,max = -1; for (i=0; i < 10; i++) if ((gen_run[i] == 1) && (gen_hours[i] > maxhours)) { maxhours = gen_hours[i]; max = i; } if (max == -1) printf("all wind generators stopped\n"); else { gen_run[max] = 0; printf("wind generator #%d with %D hours stopped\n", max + 1, maxhours); } } double wind_total(void) /* determine how many wind generators are active */ { int i, total = 0; for (i = 0; i < 10; i++) { if (gen_run[i] == 1) { total++; } } return (double) total; } void init_gen(void)

68
/* intialize working hours of wind generators in the range from 0 to 300 hours */ { int i; srand(time(0)); for (i=0; i < 10; gen_hours[i++] = rand() % 300) { gen_run[i-1] = 0; printf("wind generator %d - %D hours\n", i+1 , gen_hours[i-1]); } }

69
CHAPTER 4
UPGRADE PROPOSALS FOR THE EXISTING ENERGY CONTROL SYSTEM
SYLLABUS The operational life of a remote control system lasts from 10 – 15
years. The most important reasons that lead to the replacement of the
system is the obsolescence of the equipment, the more rapid control of
the controlled networks, maintenance difficulties regarding the software,
the configured operation system etc. It is very important to take into
consideration two major parts during the renewal of such a system. The
first one is the design of the new system and the second is the alteration
from the existing system to the new one. During the design we should be
able to identify all the strong assets of the new system, the ability to
incorporate a part of the old system and achieve a gradual modernisation,
the gains from the old experience in order to overcome difficulties that we
may have faced in the past. During the alteration of the remote control
system the function of the ECS should be as less as possible influenced,
and this depends on the extension of the work and the method used. It is
vital to have a plan ready for this renewal, in order to maintain the
functionality of the system, reduce the time needed, and avoid disturbing
the operators. This plan should take into consideration all the major works
and steps, the personnel involved, the time needed and the most critical
functions.

70
USUAL PROBLEMS IN THE REMOTE CONTROL SYSTEMS It is a fact that the rapid techniques in the design of the equipment
oblige the producers to design new products as far as they can cover the
production cost for the current equipment. This presupposes the
production of new devices every 4 – 5 years. The older equipment is
maintained for 6 – 8 years more from the manufacturers.
The equipment used in a remote control system is defined at the design
stage that lasts at least 2 – 3 years before its operation, so there is a
great risk for the equipment to be obsolescent before the 10 – 15 years of
its operational life. Apart from that we have to take into consideration the
increased maintenance cost that sometimes is above the acceptable
levels.
A financial balance should take place in certain periods in order to
compare the initial cost and the maintenance cost for the new and
obsolescent equipment. The result could show that it is preferable to
replace the current equipment although the manufacturer guarantees the
maintenance of it. It is also common to identify problems because the
personnel are not used to work on out of date and market equipment.
CONTROL CENTER INADEQUACY At the design stage of the remote control system it is necessary to
take into consideration the extension of the ECS ( more substations, or
data gathered) further than the operational life, so that the new functions
could be easily adopt in the future.
Even if the designers pay close attention to the design of the
system there is always a chance of mistakes that could lead to a
malfunction of the system.
A periodical control should take place in order to assure that the
quality is of the maximum possible level. As maximum level we could
define the ability of the system to perform all the necessary functions in a
71
time margin that allows the examination of all the alternative solutions.
The maximum levels concern the equipment, software and operational
environment.
For the time, availability and response time of the CPU the user
should determine the data for the configuration level with a closer look to
the point that refers to power outages. It is also important to pay attention
during the reception controls in order to assure that the necessary values
have been achieved in detail.
Furthermore a periodical control should be done in order to show if
the real values are still satisfactory.
SOFTWARE MAINTENANCE There are usually deficiencies in the software used in the remote
control systems. These deficiencies become obvious after the first
operational years of the system, when there is a need to input new
function or more data. That is why the designer should be very careful in
order to avoid the following situations:
- The software is developed in unusual programming language
for the current PCs or for the manufacturer and this could
cause problems to the personnel.
- There is a lack of software aids (software tools, e.g.
assembler, compiler, test aids, utility programs etc.) in order
to develop new programs.
- The operational system is inadequate to manage new input –
output channels or new memory areas for the execution of
new programs.
- There is poor written program documentation and poor
readability.
- The programs are not correct structured and the software
areas are interconnected without tolerance. In this case an

72
alteration to a block could cause malfunctions to the other
blocks.
INSUFFICIENT DATABASES It is obvious that the size of the electricity grid will increase during
the operational life of the remote control system. Normally this increase is
taken into consideration during the design stage of the system, but there
are some cases that major alterations at the grid are not expected and
the database does not have the right dimensions in order to receive a
greater number of data or it cannot be extended in order to receive these
data.
It is somehow interesting to reassure during the initial stage of the
design that the database can be altered later on.
Other problems may occur due to the structure of the database
which may not be flexible enough to define new data tables for new
application programs.
The electricity grid is changing all the time from its nature, that is
why there is the need for databases that can be renewed all the time in
order to describe the network. This procedure should be easy, simple and
not time consuming.
ALTERATIONS AT THE OPERATIONAL DEMANDS During the lifetime of the system it is common to change the
operational environment for different reasons such as:
- Change of responsibilities at the different levels due to a
different structure of the company.
- The installation of new equipment at the generation stations (
data recorders, oscillographs etc.).
- The need to exchange data through control centres that
belong to other companies.

73
- The need to increase the operators at the control centres.
- The need to improve the graphical interface with the use of
new monitors with higher resolution and ‘Pan’ and ‘Zoom’
capabilities.
- The need to show to the operators only synoptical data
during power abnormalities in order to avoid an extreme
number of messages and alarm signals, which make it very
difficult to understand the cause of the problem and find the
best solution.
- The need to transmit and receive data from other computer
units that may belong to the data processing department or
to the research department.
The current control centre may not be adequate to compensate
with the new operational needs due to insufficient equipment or software.
SOLUTION METHOD DETERMINATION OF THE DEMANDS
In order to upgrade an existing remote control system we have to
face two major points :
a) The design of the new system.
b) The alteration from the current to the new system.
It is of great importance to define :
- All the strong assets of the new system.
- The ability to use a part of the current system and then to
achieve the total integration of the new system.
- The advantages from past experiences that can be useful in
order to overcome difficulties during the installation of the
new system.

74
The determination of the demands is the first and probable most
important phase in the upgrade of the system. A mistake at this phase
could lead to serious functional and financial problems.
In order to define our demands from the system we have to answer
two questions:
- Which are the operational needs now, at the near future and
later on?
- Which are the reasons that lead us to upgrade the current
system?
Finally there are two more questions that we have to answer :
- Which parts of the current system should we upgrade?
- Which is the time needed in order to have the new system
operational?
At the previous parts there was a try to describe the different
problems that may occur to a remote control system. Fortunately a
current system will not face every problem but it is important to define and
classify all the possible difficulties.
That is why the proper classification is the key to define the
installation and upgrade demands of the system. The classification should
have the same structure with the system and also have the same design:
- Data processing subsystem (real time systems installed at
the control centre).
- Data transfer subsystem.
- Management subsystem (database creation,
telecommunication network management, real time error and
malfunction supervision, installation control, monitoring
functions).
The close examination of the current limits helps to define the
priorities for the upgrade and prepares the research for the operational
demands. This is due to the knowledge we have obtained from the
different problems.

75
DEFINEMENT OF THE POSSIBLE SOLUTIONS There are many variations for the replacement or upgrade of a
control system.
Some of these variations are :
1. Addition or replacement of the current monitors (VDUS) and
peripherals.
2. Addition of front – end processors or replacement with new
and more powerful.
3. Addition of new major PCs or replacement of the main PC
with a newer and more powerful which has the same operating system or
a new better one.
4. Replacement of all the data from the control centre into the
current or new building.
The different choices depend on the following factors :
1. The formation (composition) of the current system.
2. The support from the company that provides the main PC.
3. The ability to replace the current PC with a new more
powerful that uses a compatible operational system with the current one.
4. The ability to add a new device or replace current devices
with new ones, which help the control centre to cover the new demands.
5. The ability of the PCs to work in a structured network, which
will prevent the total failure of the remote control system.
6. The ability to use a big part of the software.
There are some cases when big EMS have been upgraded during
a weekend with the installation of bigger and more powerful PCs, which
have the ability to perform better regarding the network and safety. In
other cases it is possible to convert a double composition to quad or a
quad to a six unit system in order to increase the computing power. This
is very easy to adopt when all the PCs are of the same type and
manufacturer. It is also possible to increase the computing power by

76
adding new PCs from different manufacturers or with different operating
systems and connect them together at the same communication gates.
Faster PCs, more PCs or more microprocessors can be connected in a
LAN or through communication cables. This can be a very simple and
cost effective upgrade method, only if the computers are of the same
type, manufacturer, same operating system, same interfaces to the LAN.
It can be more complicated if the control functions or interfaces are
different.
UPGRADE PHASE The operation of an ECS should be as less as possible influenced
from the upgrade of the system. It is common that the problems are not
taken into consideration before the alterations and they are understood
later on by the operators. This depends on the extension of the project
and the method used, but the transition phase could last from a few
weeks to some years. The electricity companies rely heavily on the
remote control systems in order to reassure the operation of the network,
and every problem could be used in order to gain experience for the
operators but also it should be overcome easily and effectively. So, it is
very important to establish a strategy in order to achieve the best results
during the upgrade phase and avoid most of the problems.
The most important targets that the company should have are :
- To maintain the functionality of the system.
- To reduce the time needed in order to achieve the upgrade
of the system.
- To minimize the problems caused to the operators.
A strategy should be established from the beginning of the project.
This strategy should determine all the major works and steps of the
project. It is vital to use the best method in order to accomplish this
particular task.

77
Additionally this strategy should identify all the personnel involved
in the project. For example, maintenance personnel, operators, system
engineers, and the role that everyone should play, their needs and their
training.
The strategy should also give a guideline for the minimum
operational standards that the system should maintain during the upgrade
phase. As an example we could mention the time during the day that the
system could be easily maintained or the most major functions that
cannot be interrupted and the functions that take place during the power
restoration procedure. At last, there should be a program to monitor the
project and verify that the upgrade goals are being achieved. Of course, it
is important for the project to be flexible and have the ability to alter some
steps in order to conform to the needs that the engineers may face in the
future.

78
BIBLIOGRAPHY S. Hunt and G. Shuttleworth, ‘Unlocking the Grid,’ IEEE Spectrum, July 1996, pp. 20 - 25 L. Day, ‘Interchange Scheduling Discipline or Disorder,’ IEEE Computer Applications in Power, Vol. 9, Number 4, October 1996, pp. 27 – 32 S. Vadari and J. Hammerly, ‘New Faces and Functions in a Competitive Market,’ IEEE Computer Applications in Power, Vol. 10, Number 1, January 1997, pp. 47 – 52. G. Cauley, P. Hirsch, et al., ‘Information Network Supports Open Access,’ IEEE Computer Applications in Power, Vol. 9, Number 3, July 1996, pp. 12 – 19. ‘EPRI’s API Guidelines,’ EPRI Web Site, http:// www.epri.com G. Martire and D. Nuttall, ‘Open Systems and Databases,’ IEEE Transactions on Power Systems, Vol. 8, Number 2, May 1993, pp. 434 – 440. D. Tkach, Object Technology in Application Development, Benjamin and Cummings, 1994. Arthur van Hoff, Sami Shaio, et al, Hooked on Java, Addison Wesley Developers Press, 1996. ‘Visual Basic 5.0,’ Microsoft Visual Basic Users’ Manual, Microsoft Press, 1997. H. Schildt, ‘Teach Yourself C,’ Osborne McGraw – Hill, 1997 H. Schildt, ‘C: The Complete Reference,’ Osborne McGraw – Hill, 1998 H. Schildt, ‘Windows 95 Programming in C and C + +,’ Osborne McGraw – Hill, 1996 T. Alevizou, A. Kampoureli, ‘Turbo Pascal V.4/5,’ Papasotiriou, Athens 1994. A. Tsouroplis, S. Klimopoulos, ‘Introduction to Information Technology,’ Pelekanos, Athens 1991.

79
Symposium on Expert Systems Application to Power Systems, Stockholm, Helsinki, (August 22 – 26, 1998) Second Symposium on Expert Systems Application to Power Systems, Seattle, Washington, USA, (July 17 – 20, 1989) Hudlicka Eva, ‘Construction and use of a causal model for diagnosis’. International Journal of Intelligent Systems, Vol. 3, page 315 – 349, (1988) Bobrow, D.G., Editor, Qualitative Reasoning about Physical Systems, MIT Press, Cambridge, MA, (1985) Steels, L., Second Generation Expert Systems. Future Generation Computer Systems, North – Holland pub. Amsterdam, (1985) Fink, Pamela and Lusth, John ‘Expert systems and diagnostic expertise in the mechanical and electrical domains’, IEEE trans on Systems, Man, and Cybernetics, Vol, SMC – 17, no 3, (May/June 1987) Castagnoli, V and Demartini, G, ‘Automatic data supply for an on – line network configuration’, Proceedings of the Seventh Power Systems Computation Conference, Lausanne, pages 1105 – 1110, (July 12 – 17, 1981) Steels, L and De Velde W V, ‘Learning in second generation expert systems’, Knowledge Based Problem Solving, e.d Janusz S, Kowalik, Prentice – Hall, Englewood Cliffs, New Jersey, (1986) H. Lee Willis, Hahn Tram, ‘Distribution Load Forecasting’; IEEE Tutorial on Power Distribution Planning, EH0361 – 6 – PWR, 1992. H. Lee Willis, Spatial Electric Load Forecasting, Marcel Dekker, Inc, 1996. Padmakumari K. Mohandas KP, Thiruvengadam S, ‘Land – use based distribution load forecasting – A Case study using three different modelling techniques’ Journal of Institution of Engineers (India), vol. 77, August, 1996, pp. 84 – 87. Timothy J. Ross, Fuzzy Logic with Engineering applications, McGraw Hill, 1995. Ned Gulky, Roger Jang, Fuzzy Logic Tool Box for use with MATLAB. Mathworks Inc. (1995)

80
Schweppe, F.C., Wildes, J. ‘Power system static – state estimation’ Part I and II, Transaction on Power Apparatus and Systems, PAS – 89, (1970), 120 – 135. Schweppe, F.C, Handshin, E.J. ‘Static state estimation in electric power systems’, Proceedings of the IEEE 62, (1974), 972 – 982. E. A. Feigenbaum, ‘Knowledge Engineering: The Applied Side of Artificial Intelligence’, Stanford Heuristic Programming Project Memo HPP – 80, 14 July, 1980. Dy Liacco, T.E.; Mathematical Challenges in Electric Power System Operation: An Overview’, in Electric Power Problems – The Mathematical Challenge, (1980). Lasdon, L.; Optimization Theory for Large Systems, McMillan, New York, (1970). Teixeira, M.J., Pinto, H.J.C.P., Pereira, M.V.F. and McCoy, M.F.; ‘Developing Concurrent Processing Applications to Power System Planning and Operations’, Sixteenth PICA Conference, Seattle, USA, (1989). Quinn, M.J.; Designing Efficient Algorithms for Parallel Computers, McGraw – Hill, (1987). An International Survey of the Present Status and the Perspective of Expert Systems on Power System Analysis and Techniques, CIGRE SC 38 02 TF 07 report (March 1988). Liu, C. C., and Dillon, T.S. ‘State – of – the – art of expert system applications to power systems,’ to appear in Int. J. Electrical Power and Energy Systems. (1989). Liu, C. C., and Damborg, M. J. Development of Expert Systems as On – Line Power System Operational Aids, EPRI report EL – 5635 (February 1988). Marathe, H. Y., Liu, C. C., Tsai, M. S., Rogers, R. G., and Maurer, J. M. ‘An on – line operational expert system with data validation capabilities,’ Proceedings 1989 PICA, pp. 56 – 63. D.C. Karnopp, D.L. Margolis, R.C. Rosenberg, System Dynamics: a Unified Approach, John Wiley and Sons, 1990.

81
P. Gawthrop and D. Balance, ‘ Symbolic algebra and physical – model – based control, ‘IEEE Computing and control Engineering Journal, April, 1997, pp. 70 – 76. A.F. Neyer, F. F. Wu and K. Imhof, ‘Object – Oriented Programming for Flexible Software, Example of a Load Flow’, IEEE Transactions on Power Systems, vol. 5, No. 3, Aug. 1990, pp. 689 – 696.
Mike Foley, Anjan Bose, ‘Object – Oriented on – line Network Analysis,’ IEEE PWRS Winter Meeting, New York, pp 216 – 2, Jan., 1994.
S. J. Pollinger, C. C. Liu and M. J. Damborg, ‘Design Guidelines for Object – Oriented Software with an Ems Man – Machine Interface Application,’ Electrical Power and Energy Systems, Vol. 14, No. 213, April/June 1992, pp. 122 – 130.
J. Rumbaugh, M. Blaha, W. Premerlani, F. Eddy, W. Lorensen, Object – Oriented Modelling and Design, Prentice Hall, 1991.
Grady Booch, ‘Object – Oriented Development,’ IEEE Trans. Software Eng., Vol. SE – 12, No. 2, February 1986.
M. Shaw, ‘Abstraction techniques in modern programming languages,’ IEEE Software, Vol. 1, No. 4, p 10, Oct. 1984.
Hellenic Public Power Corporation ‘ Power System Operation Manual,’ July 1995.
Y. Arita, et al., ‘Development of an operation supporting expert system for power system networks in an integrated control center,’ Trans. IEE Japan, Vol. 110 – B, No. 6, pp. 504 – 510, 1990. H. Marathe, C. Liu, et al., ‘An On – Line Operational Expert System with Data Validation Capabilities,’ Proc. PICA Conference, 1989, pp. 56 – 63.
B. Wollenberg and T. Sakaguchi, ‘Artificial Intelligence in Power System Operations,’ Proceedings of the IEEE, 1987, pp. 1678 – 1685.
C. Liu, ‘Knowledge – Based Systems in Power Systems: Applications and Development Methods,’ Trans. IEE of Japan, April 1990, pp. 241 – 250.
C. Liu and T. Dillon, ‘State of the Art,’ Expert System Applications in Power Systems, Prentice Hall, UK, 1990, Eds T. Dillon and M. Laughton, Chapter 11.

82
S. Moriguchi, et al., ‘A Large – Scale SCADA System with Real – Time Knowledge – Based Functions,’ Proceedings of Second Symposium on Expert Systems Application to Power Systems, July 1989, pp. 21 – 27. T. Nguyen, et al., ‘Knowledge Base Verification,’ AI Magazine, Summer 1987, pp. 69 – 75. M. Suwa, A. Scott, and E. Shortliffe, ‘An Approach to Verifying Completeness and Consistency in a Rule – Based Expert System,’ AI Magazine, Fall 1982, pp. 16 – 21. H. Marathe, T. Ma, and C. Liu, ‘An Algorithm for Identification of Relations Among Rules,’ Proc. IEEE International Workshop on Tools for Artificial Intelligence, 1989, pp. 360 – 367. H. Sasaki, K. Kawahara, et al., ‘A Novel Scheme for Validation and Verification of Rule Bases in Expert Systems,’ Proceedings of Second Symposium on Expert Systems Application to Power Systems, July 1989, pp. 416 – 422. K. Matsumoto and T. Sakaguchi, ‘An Approach to the Dynamic Verification of Knowledge – Based Systems,’ Proceedings of Second Symposium on Expert Systems Application to Power Systems, July 1989, pp. 423 – 427. Concordia, C. ‘Equipment Modelling Loads,’ GE Power System Stability Seminar, September, 1973. IEEE Committee Report, ‘Dynamic Models for Steam and Hydro Turbines in Power System Studies,’ paper T73 – 089 – 9, IEEE PES Winter Meeting, Jan. 28 – Feb. 2, 1973, New York. IEEE Committee Report, ‘Survey Report on Current Operational Problems,’ Paper 81 WM 032 – 2, IEEE PES Winter Power Meeting, Atlanta, 1981. IEEE Committee Report, ‘An Updated List of Current Operational Problems,’ IEEE Trans. on Power Apparatus and Systems, PAS – 97, (Jan/Feb 1978), pp. 140 – 148. IEEE Meeting Group on Power Plant Response to Load Changes,’MW Response of Fossil Fueled Steam Units,’ IEEE Trans. on Power Apparatus and Systems, March/April 1973, Vol. PAS – 92, No. 2.

83
T. E. DyLiacco, ‘System Security: The Computer’s Role’, IEEE Spectrum, Vol. 15, June 1978, pp. 43 – 50. R. P. Schulte et. al., (Systems Operations Subcommittee, Current Operational Problems Working Group Report), ‘Survey Report on Current Operational Problems,’ IEEE Trans. Power Apparatus and Systems, Vol. PAS – 104, June 1985, pp. 1315 – 1320. A.Monticelli and F. F. Wu, ‘A Method That Combines Internal State Estimation and External Network Modelling,’ IEEE Trans Power App. and Systems, Vol. PAS – 104, pp. 91 – 103, Jan. 1985. J. J. Koglin, and H. Muller, ‘Corrective Switching: A New Dimension in Optimal Load Flow,’ Electrical Power and Energy Systems, Vol. 4, Apr. 1982, pp. 142 – 149. H. Kronig and H. Glavitsch, ‘A Systematic Approach to Corrective Switching in Power Networks,’ CIGRE – IFAC Symp. Control Applications for Power System Security, Paper 206 – 01, Florence, Sept. 1983. Partanen, J., Juuti, P., Lakervi, E. ‘A PC Based System for Radial Distribution Network Design’, Proceedings of the Ninth Power Systems Computation Conference, Cascais, 1987. Makinen, A., Partanen, J., Lakervi, E., Koivuranta, K., ‘A Practical Approach for the Reliability Evaluation of Distribution Networks’, CIRED 1989, Brighton, IEE Conf. Publ. No 305. Lakervi, E. and Holmes, E. J., Electricity Distribution Network Design, 320 p, Peter Peregrinus Ltd, 1989. Task Group on State of the Art Distribution System Design Working Group on Distribution System Design, Distribution Subcommittee: ‘Biography on Distribution Automation, 1967 – 1982’, IEEE Trans. PAS, Vol. PAS – 103, No. 6, June (1984). D. W. Ross, J.Patton, A. I. Choen and M. Carson: New Methods for Evaluating Distribution Automation and Control (DAC) System Benefits’, IEEE Trans. PAS, Vol. PAS – 100, No. 6 June (1981). C. A. Castero Jr., and A. L. M. Franca: ‘ Automatic Power Distribution Reconfiguration Algorithm Including Operating Constraints’, IFAC Electric Energy Systems, Rio de Janeiro (1985).

84
D. T. Rizy et al.: ‘Distribution Automation Applications Software for the ATHENS UTILITIES BOARD’ IEEE Trans. PWRD, Vol. PWRD – 4 No. 1 (1989). K. Aoki, K. Nara et al.: ‘Totally Automated Switching Operation in Distribution System’, IEEE 1989 T and D Conference, 89 TD 447 – 4 PWRD (1989) K. Aoki, H. Kuwabara, T. Satoh and M. Kanezashi: ‘An Efficient Algorithm for Load Balancing of Transformer and Feeders by Switch Operation in Large Scale Distribution Systems’, IEEE Trans. PWRD, Vol. PWRD – 3 No. 4 (1988) A.M Stankovic and M. S. Calovic: ‘Graph Oriented Algorithm for the Steady – State Security Enhancement in Distribution Networks’, IEEE Trans. PWRD, Vol. PWRD – 4 No. 1 (1989) K. Aoki, T. Ichimori and M. Kanezashi: ‘Normal State Optimal Load Allocation in Distribution Systems’, IEEE Trans. PWRD, Vol. PWRD – 2, No. 1 (1987) S. Civanlar, J. J. Grainger et al.: ‘Distribution Feeder Reconfiguration for Loss Reduction’, IEEE Trans. PWRD, Vol. PWRD – 3, No. 3 (1988) S. Senju and Y. Toyoda: ‘An Approach to Linear Programming with 0 – 1 Variables’, Management Science, Vol. 15, No. 4 (1968) Y. Toyoda: ‘A Simplified Algorithm for Obtaining Approximate Solution to Zero – One Programming Problems’, Management Science, Vol. 21, No. 12 (1975) Laycock W J, 1995, ‘Enhancing the Performance of Distribution Networks’, IEE Colloquim. J. G. Waight, K. Nodehi, M. Rafian, H. VanMeeteren, A. Bose, R. Wasley, E. Stackfleth, E. Dobrowolski: An Advanced Transportable Operator Training Simulator; IEEE/PES PROC. PICA, Baltimore, Maryland, May 7 – 10th, 1991, pp. 164 – 170. E. Mariani et al, ‘Field experiences in reenergization of electrical networks from thermal and hydro units’, IEEE Trans. on PAS, Vol. PAS – 103, No. 7, July 1984, pp. 1707 – 1713. ‘Report on Hellenic Power System Blackout’, 1989, PPC internal correspodence.

85
C. D. Vournas, N. D. Hatziargiriou, B. C. Papadias, ‘ Interactive Power System Simulation Program – Application to the Hellenic system’, paper 38 – 206, CIGRE 1990 Session, 26 Aug – 1 Sep, Paris. N. A. Fountas, N. D. Hatziargiriou, ‘Fast Simulation of Power System Mid – Term Dynamics’, IFAC LSS 1995 proceedings, pp. 527 – 532, London, UK 11 – 13 July, 1995.
C. C. Liu et al., ‘Development of an Expert System as Power System Operational Aid,’ IEEE International Workshop on Artificial Intelligence for Industrial Applications, pp. 70 – 75, May 1988. C. Forgy, ‘OPS83 Users Manual,’ Computer Science Department, Carnegie – Mellon University, 1983. Hughes, Ian McKenzie Smith, ‘Electrical Technology’ Prentice Hall 1995. Robert A. Ristinen, Jack J. Kraushaar, ‘Energy and the Environment’ John Wiley and Sons, INC, New York 1999. Godfrey Boyle, ‘Renewable Energy: Power for a Sustainable Future’, Oxford University Press, The Open University, 1998. Anthony Croft, Robert Davison, Martin Hargreaves,’Engineering Mathematics’ Addison – Wesley 1998. P. N. Paraskevopoulos, Digital Control Systems, Prentice Hall, London, 1996. P. N. Paraskevopoulos, Introduction to Automatic Control Systems, Prentice Hall, 1999. G. A. Perdikakis, Computer Controlled Systems, Theory and Applications, Kluwer Academic Publishers, London, 1991. Burch, S. F. and Ravenscroft, F. (1992) Computer Modelling of the UK Wind Energy Resource: Final Overview Report, ETSU WN7055, ETSU. Chris Blandford Associates (1994): Wind Power Station Construction Monitoring Study, Countryside Counsil for Wales. Freris, L. L (ed.) (1990) Wind Energy Conversion Systems, Prentice Hall.

86