the roadmap - uttipec.nic.in · for the participating transit agency ... streets create shorter...
50
Transit Oriented Development the roadmap Transit Oriented Development the roadmap UTTIPEC April ’09 UTTIPEC April ’09
-
Upload
nguyendiep -
Category
Documents
-
view
217 -
download
0
Transcript of the roadmap - uttipec.nic.in · for the participating transit agency ... streets create shorter...

Transit Oriented Developmentthe roadmap
Transit Oriented Developmentthe roadmap
UTTIPEC April ’09UTTIPEC April ’09

MPD 2021 identifies a current Modal Split of 60-40 (Public-Private Transport). It sets the following Targets for the near future:
“70-30 Modal Split by 2011”
“80-20 Modal Split by 2021”
However, RITES study has recently revealed that the modal split of Delhi has actually dropped from 60-40 to 45-55!
Clearly – the direction where we are headed is contrary to the Spirit and direction intended by the Masterplan.
Clearly – a paradigm shift is needed.
Where we are…. Where we want to go….
MPD-2021 Statements & Goals:
12.4.1 SYNERGY BETWEEN TRANSPORT AND LAND USE
The concept of the Master Plan for Delhi 1962 was based on a poly-nodal, polycentric, distribution of work centres, largely based on road transport nodes. A major fall-out of this has been distortion between infrastructure, transport and land use.
To achieve spatial balance, development should take place according to new corridors of mass movement. This has implications in terms of land use planning along major transport corridors and the Mass Rapid Transport/ Transit System.
This would not only help to solve, to some extent, the enormous problems of mass transportation, but would also generate a dynamic potential for growth and employment.
(p72)

MPD Statements & Goals:
Major Sources of Air Pollution:
Vehicular Emission = 70%; Industrial = 20%; Gensets; Cooking, etc = 10%
Public transportation planning must, therefore, drive the future policy.(p57)
“The Plan contemplates a mechanism for the
restructuring of the city based on mass transport.”
(p3)

MPD Statements & Goals:
3.3.1. REDEVELOPMENT STRATEGY
“ The proposed MRTS network will bring sizable urban area within walking distance from the proposed stations.
This changed scenario provides opportunities for city restructuring and optimum utilization of the land along the MRTS corridors.
… a sizable proportion of the additional population with requisite facilities and employment can be absorbed along
these corridors.”
(p14)

~ 60% of the urban area will be within 15-minute walking distance from the proposed MRTS stations…

Transit Oriented Development of Delhi is therefore not just about redevelopment &
redensification along 500 M of MRTS corridors.
It is about structuring a Transit Oriented City.
Premise:

So What IS TOD?

Transit Oriented Development is essentially any development – be it macro
or micro scale – that induces people to prefer the use of public transit.
“Transit-Oriented Development (TOD) is compact, mixed use development near new
or existing public transportation infrastructure that provides housing, employment,
entertainment and civic functions within walking distance of transit.
The pedestrian-oriented design features of TODs encourages residents and
workers to drive their cars less and ride public transit more.
Transit Oriented Development can be a significant source of non-farebox revenue
for the participating transit agency.
Definition Source: APTAhttp://www.apta.com/research/info/briefings/briefing_8.cfm
TOD Definition:

The 3 ‘D’s of T.O.D.
• (High) Density • Diversity (Mixed Use, Mixed Income)
• Design (Safe, Comfortable, active 24x7)
TOD Components:(Source: Dr. Robert Cervero, U C Berkeley)

Starting with:
What is NOT TOD….

Current Trends: within 5-min walk of Metro Stations
5 min bike5 min bike
5 min walk5 min walk
NOT TODNOT TODNo Walkable Design.
No Street Frontage.
No Diversity.
Not enough Density.

5 min bike5 min bike
5 min walk5 min walk
• High Density Housing, Retail and Employment uses
Recommended:Recommended:
Within 5 min walk of Station (500 M)…
Principle A) Density & Diversity & Design:- Minimized Walking & Biking Distance / Environment from MRTS & Amenities.

• High Density Housing, informal retail, commercial, public spaces.
• FAR bonuses provided for affordable housing, public spaces and parks, & infrastructure.
5 min bike5 min bike
5 min walk5 min walk
Within 10 min walk of Station (1000 M)…
Principle A) Density & Diversity & Design:- Minimized Walking & Biking Distance / Environment from MRTS & Amenities.
Recommended:Recommended:

• Incorporating bicycles and pedestrians in street and building design guidelines
Bike lanes in most streets Bike parking at destinations, transit stops
Within 5 min Cycle or Rickshaw-ride from Station:
5 min bike5 min bike
5 min walk5 min walk
Principle A) Density & Diversity & Design:- Minimized Walking & Biking Distance / Environment from MRTS & Amenities.
Recommended:Recommended:

Rapid Transit
DIMMTS
Principle B) Feeder Networks:
Within 500 M
- Rerouted DTC buses- Battery operate feeders (p65 MPD)
- Rerouted DTC busesBeyond 500 M
~ 500m Beyond 500m
- Pedestrians- Cycles, NMVs

Most of Delhi within 5 min walking/cycling/rickshaw distance of proposed MRTS.Therefore…

…Private Car: is the undesirable feeder…Private Car: is the undesirable feeder
Destination
Origin
FeederMost valuable real
estate should not be
used for cars parked
all day for 8-15% of
population.
• Car Parkingbeyond 500 M
• Only at terminal park-n-ride Stns.
5 min walk
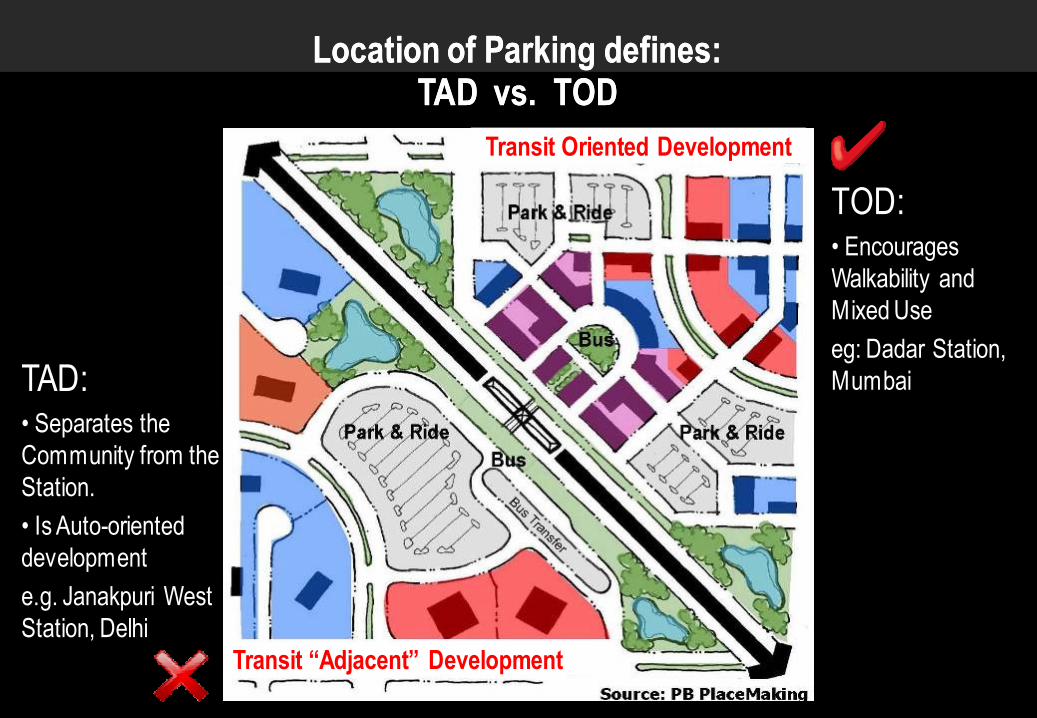
Location of Parking defines:TAD vs. TOD
Location of Parking defines:TAD vs. TOD
TOD:• Encourages
Walkability and
Mixed Use
eg: Dadar Station,
MumbaiTAD:• Separates the
Community from the
Station.
• Is Auto-oriented
development
e.g. Janakpuri West
Station, Delhi
Transit Oriented Development
Transit “Adjacent” Development
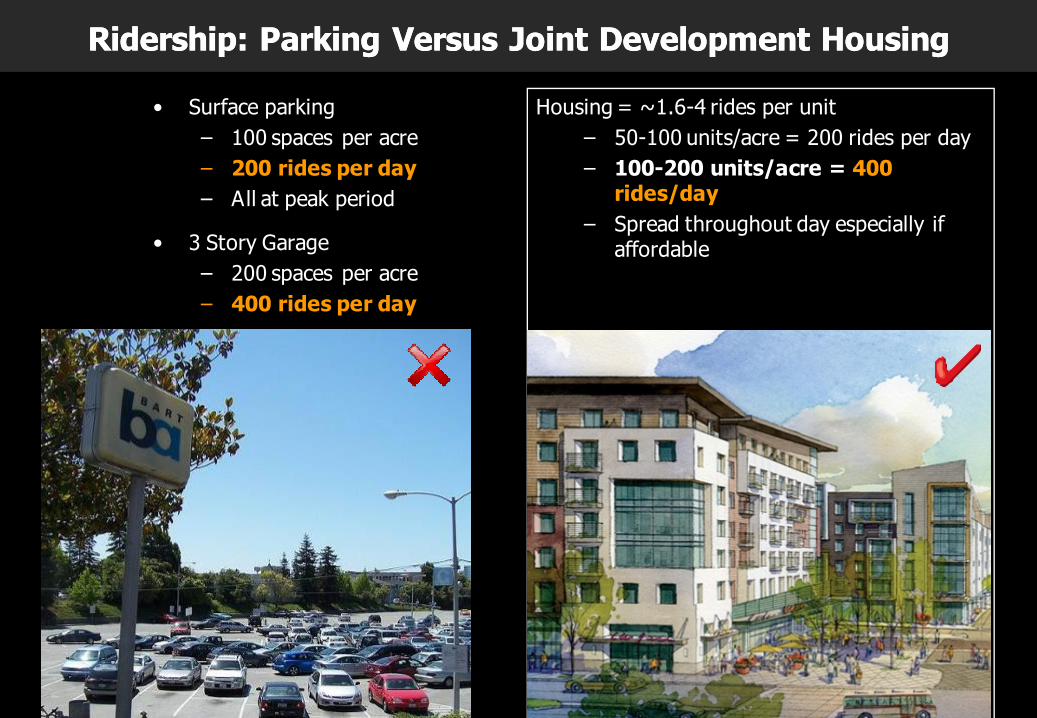
Ridership: Parking Versus Joint Development HousingRidership: Parking Versus Joint Development Housing
• Surface parking
– 100 spaces per acre
– 200 rides per day
– All at peak period
Housing = ~1.6-4 rides per unit
– 50-100 units/acre = 200 rides per day
– 100-200 units/acre = 400 rides/day
– Spread throughout day especially if affordable• 3 Story Garage
– 200 spaces per acre
– 400 rides per day
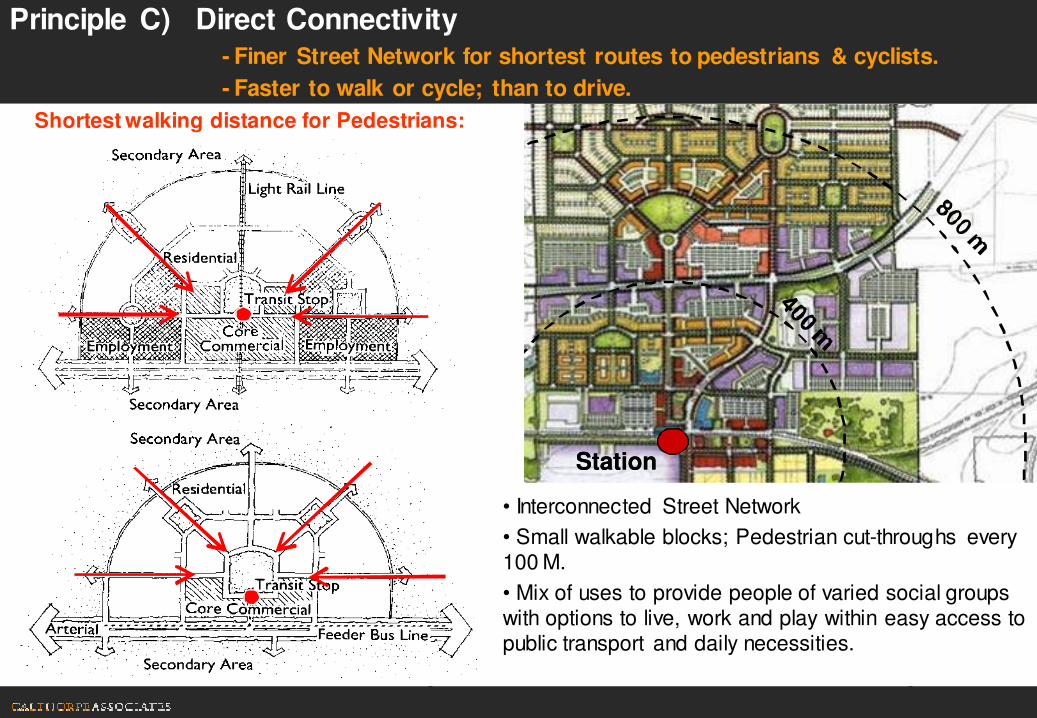
• Interconnected Street Network
• Small walkable blocks; Pedestrian cut-throughs every 100 M.
• Mix of uses to provide people of varied social groups with options to live, work and play within easy access to public transport and daily necessities.
StationStation
Shortest walking distance for Pedestrians:
Principle C) Direct Connectivity- Finer Street Network for shortest routes to pedestrians & cyclists.
- Faster to walk or cycle; than to drive.
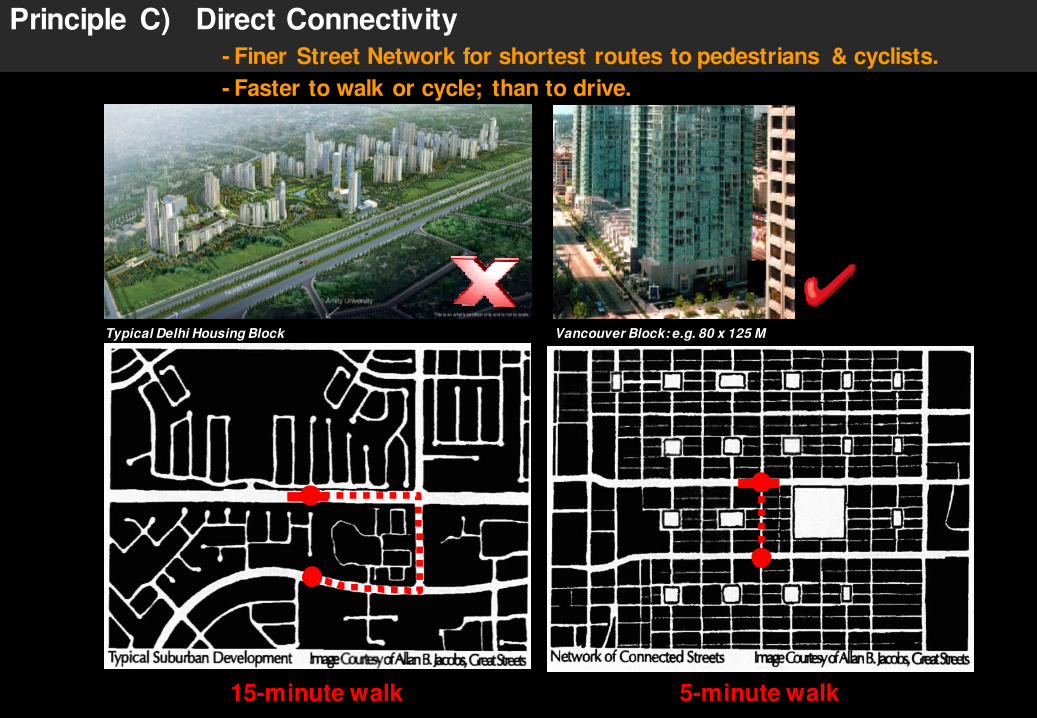
Vancouver Block: e.g. 80 x 125 M
15-minute walk 5-minute walk
Typical Delhi Housing Block
Principle C) Direct Connectivity- Finer Street Network for shortest routes to pedestrians & cyclists.
- Faster to walk or cycle; than to drive.

Vancouver Block: e.g. 80 x 125 MTypical Delhi Housing Block
Concentrated traffic: Fewer, wider streets Distributed traffic: More & narrower streets
Principle C) Direct Connectivity- Finer Street Network for shortest routes to pedestrians & cyclists.
- Faster to walk or cycle; than to drive.
only [email protected]
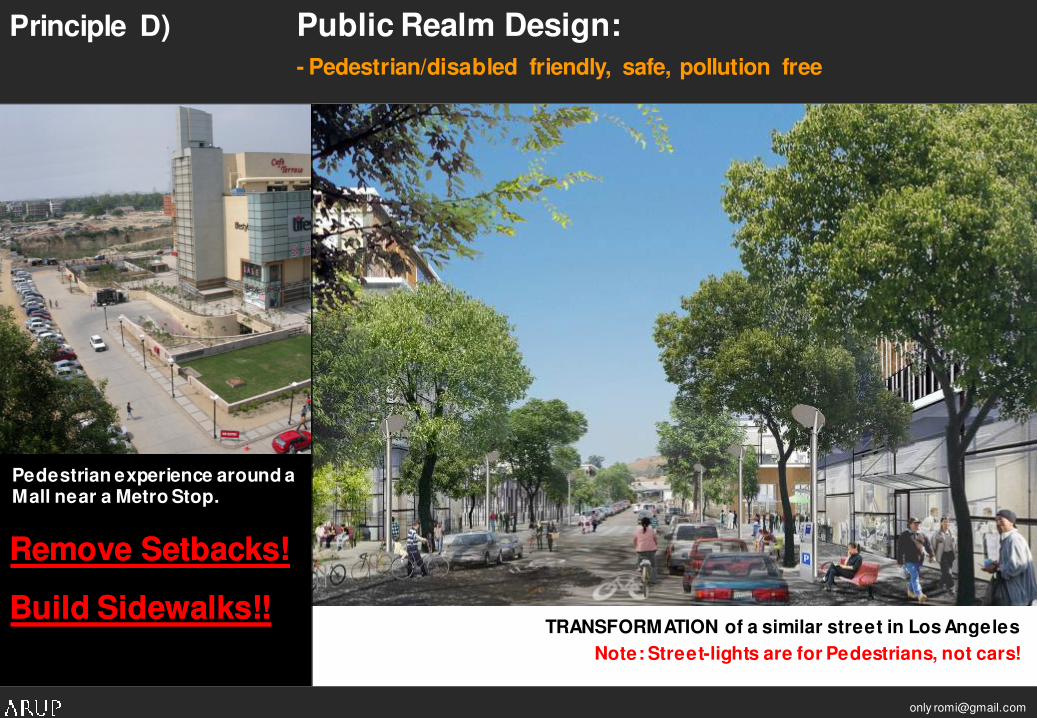
TRANSFORMATION of a similar street in Los Angeles
Note: Street-lights are for Pedestrians, not cars!
Remove Setbacks!Remove Setbacks!
Build Sidewalks!!Build Sidewalks!!
Principle D) Public Realm Design:
- Pedestrian/disabled friendly, safe, pollution free
Pedestrian experience around a Mall near a Metro Stop.

only [email protected]
Building Entries/ windows on Sidewalk (eyes on the street -provides safety for pedestrians)
Remove Setbacks,
Require Entries on sidewalks
Regulate
Maximum Block Widths,Minimum Frontages
Design Street Guidelines
for pedestrians, not cars!
Streets for Trains, Buses, cars and Pedestrians.
Built-to-edge Buildings for Safety & Comfort.
Sidewalks, Bio-swales
Smaller blocks, interconnected streets create shorter travel routes for pedestrians.
Multimodal, pedestrian-oriented.
Critical Zoning Laws that may need to be introduced:

• Create Places, not gated developments.
• Build communities:Create interaction places, public plazas, markets and parks – near public transport nodes & along daily paths of people.
• Mix of uses to provide people of varied social groups with options to live, work, shop and play
within easy access to public transport and daily necessities.
Principle E) - PlaceMaking
Nanj ing Lu, ShanghaiNanj ing Lu, Shanghai Mizner Park, FloridaMizner Park, Florida
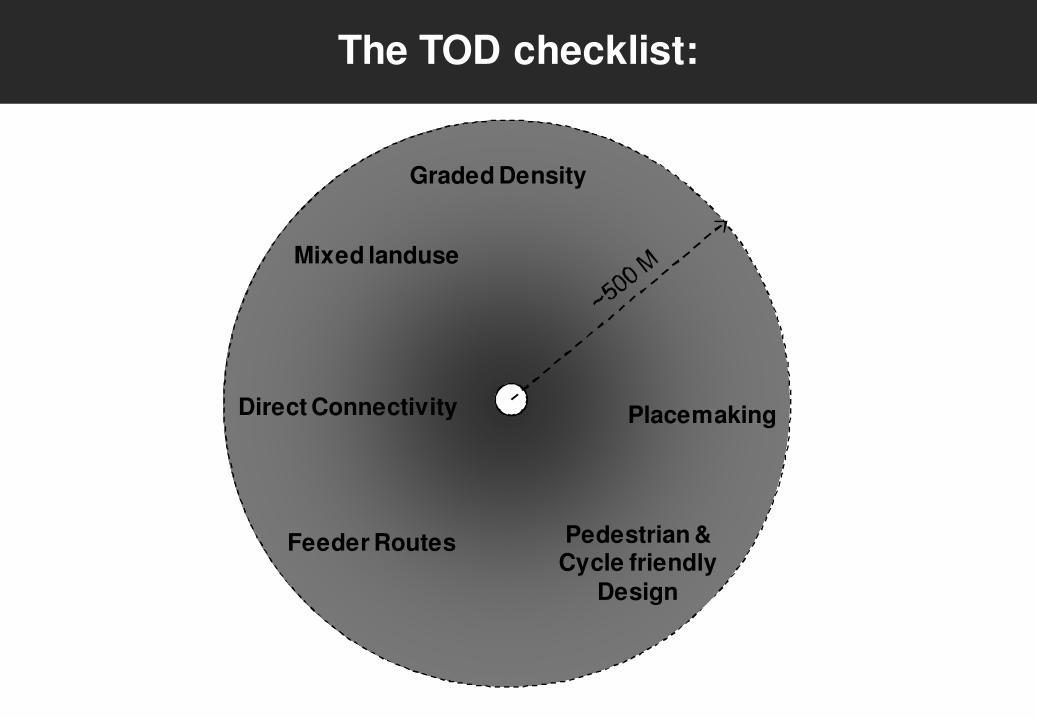
Graded Density
Feeder Routes
Mixed landuse
Pedestrian & Cycle friendly
Design
Placemaking
The TOD checklist:
Direct Connectivity
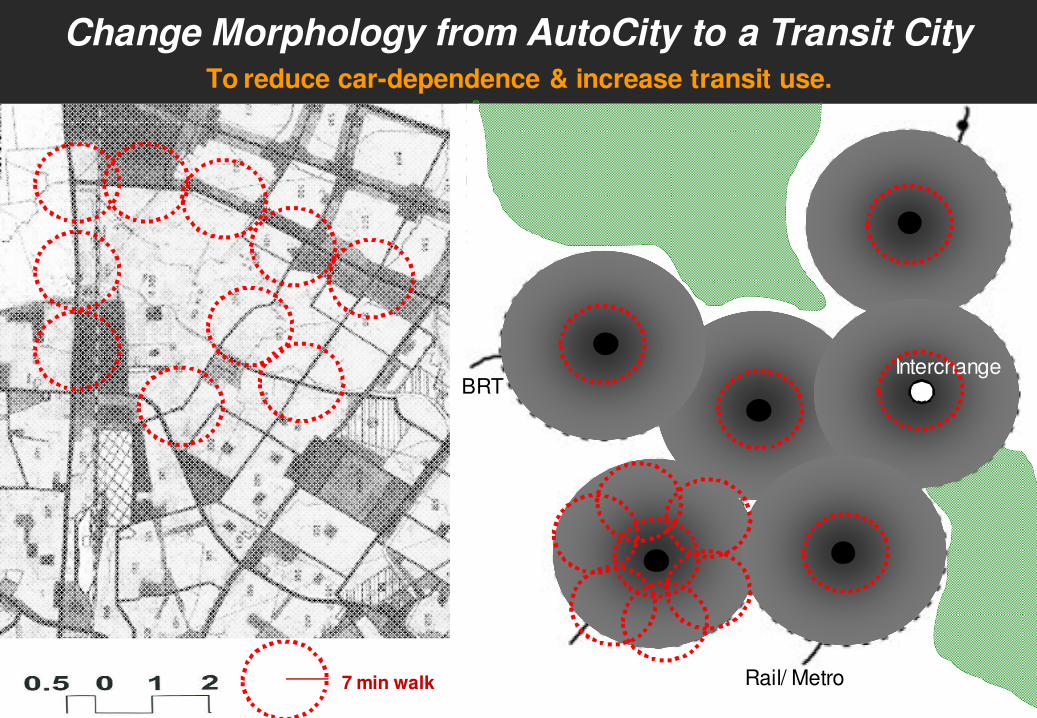
Rail/ Metro
BRTInterchange
Change Morphology from AutoCity to a Transit City
7 min walk
To reduce car-dependence & increase transit use.
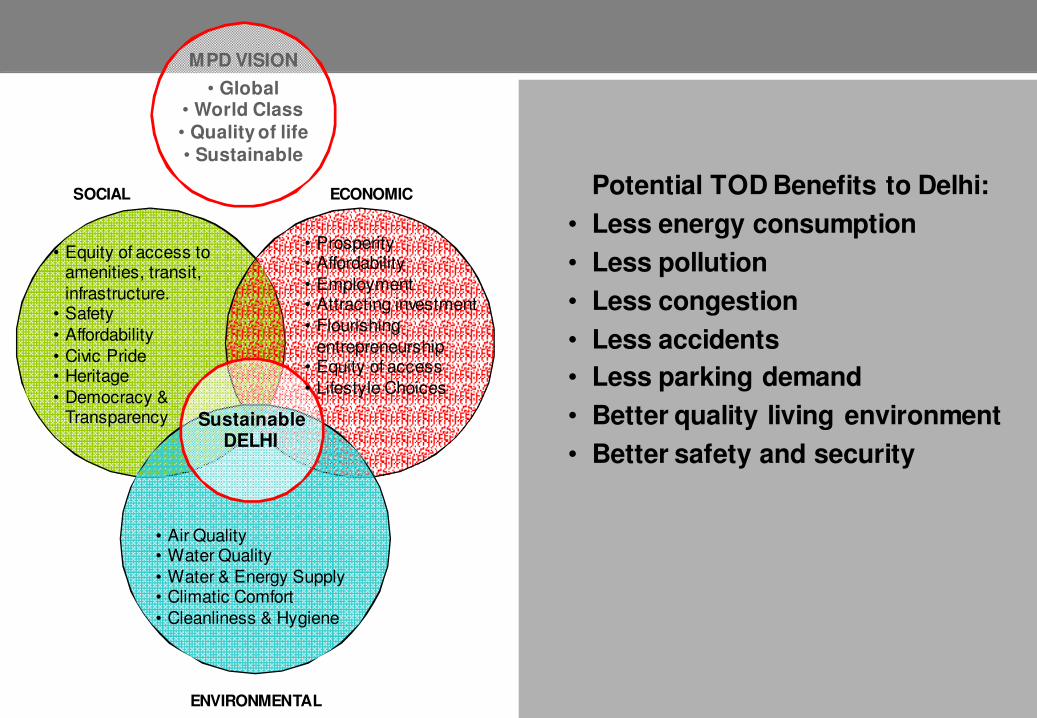
Potential TOD Benefits to Delhi:
• Less energy consumption
• Less pollution
• Less congestion
• Less accidents
• Less parking demand
• Better quality living environment
• Better safety and security
MPD VISION
• Global • World Class
• Quality of life
• Sustainable
SustainableDELHI
ECONOMIC
ENVIRONMENTAL
• Prosperity• Affordability
• Employment• Attracting investment
• Flourishing
entrepreneurship• Equity of access
• Lifestyle Choices
SOCIAL
• Equity of access to amenities, transit,
infrastructure.• Safety
• Affordability
• Civic Pride• Heritage
• Democracy & Transparency
• Air Quality• Water Quality
• Water & Energy Supply• Climatic Comfort
• Cleanliness & Hygiene
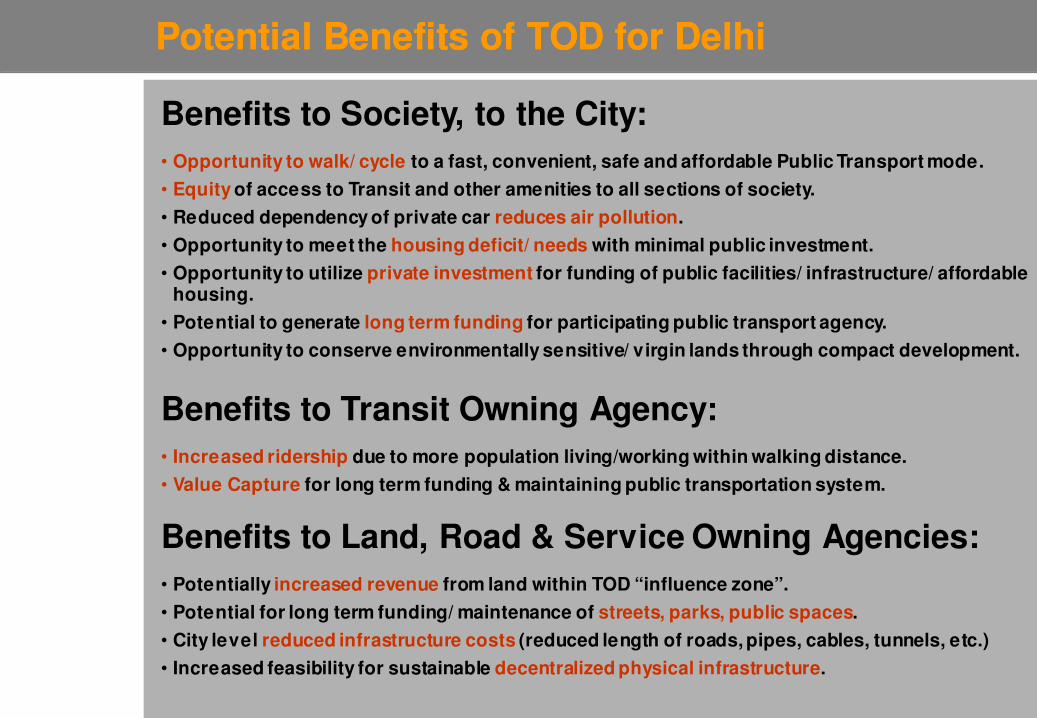
Benefits to Society, to the City:
Potential Benefits of TOD for DelhiPotential Benefits of TOD for Delhi
Benefits to Land, Road & Service Owning Agencies:
Benefits to Transit Owning Agency:
• Opportunity to walk/ cycle to a fast, convenient, safe and affordable Public Transport mode.
• Equity of access to Transit and other amenities to all sections of society.
• Reduced dependency of private car reduces air pollution.
• Opportunity to meet the housing deficit/ needs with minimal public investment.
• Opportunity to utilize private investment for funding of public facilities/ infrastructure/ affordable housing.
• Potential to generate long term funding for participating public transport agency.
• Opportunity to conserve environmentally sensitive/ virgin lands through compact development.
• Increased ridership due to more population living/working within walking distance.
• Value Capture for long term funding & maintaining public transportation system.
• Potentially increased revenue from land within TOD “influence zone”.
• Potential for long term funding/ maintenance of streets, parks, public spaces.
• City level reduced infrastructure costs (reduced length of roads, pipes, cables, tunnels, etc.)
• Increased feasibility for sustainable decentralized physical infrastructure.

Spirit of MPD 2021
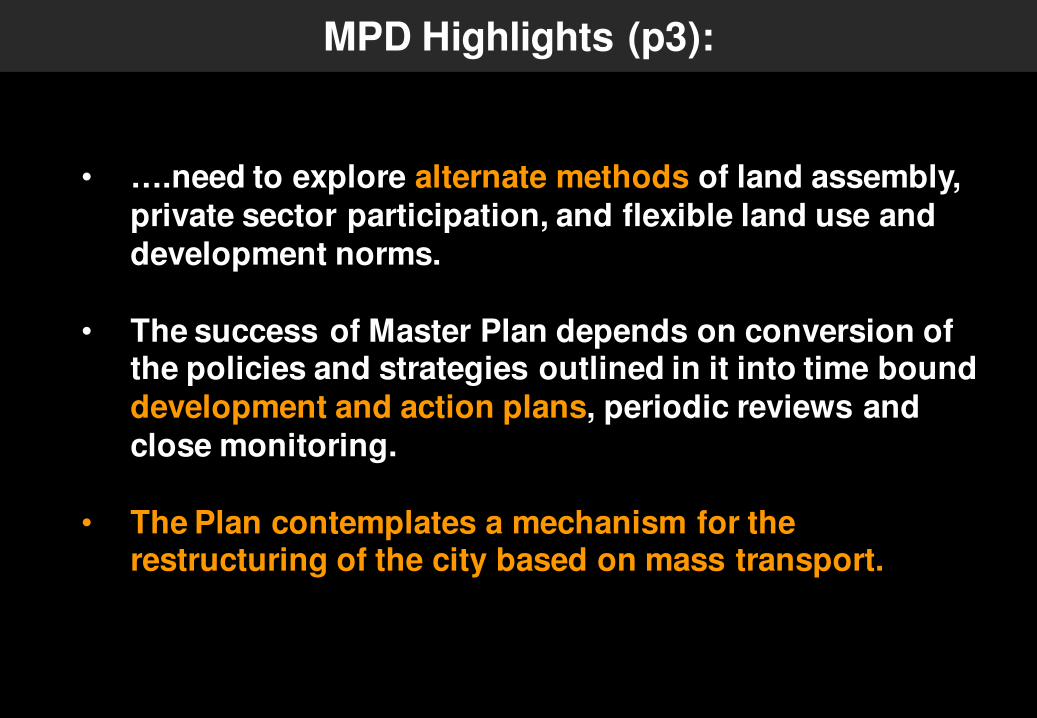
MPD Highlights (p3):
• ….need to explore alternate methods of land assembly,
private sector participation, and flexible land use and
development norms.
• The success of Master Plan depends on conversion of the policies and strategies outlined in it into time bound
development and action plans, periodic reviews and
close monitoring.
• The Plan contemplates a mechanism for the restructuring of the city based on mass transport.

Achieving MPD Goals for Delhi……
• Population & Employment Targets
• Optimum Utilization of Land
• Efficient & prioritized Public Transportation
• Reduce air & noise Pollution
• Meeting the Housing Deficit & Demand in a time bound manner
• Provide adequate and Equitable access to Infrastructure
• Better safety & security, & Quality of Life.
• Public Participation and time bound implementation.
….through Transit Oriented Development?

MPD Goal: MODAL SPLIT
Current: 60-40
OR: 55-45?
INDICATOR: 70-30 Modal Split by 2011
80-20 Modal Split by 2021
Goal: Reduce 70% air pollution source: i.e. primarily private vehicles

Transport Model already being built!
Dynamic landuse-transport modeling would help us make
decisions that would achieve the desired Modal Split for Delhi

Romi Roy UTTIPEC
Base Case Vision
Scenario Building:Already being done by RITES… needs to
be coordinated and taken further….
Evaluate Pros and Cons through Technical Evaluation
New Infrastructure Costs
7.1
3.6
0 2 4 6 8
Base Case
Vision Scenario
Billions of Dollars
Annual Vehicle Hours Traveled
44 3
394
200 250 300 350 400 450
Base Case
Vision Scenario
Millions of VHT
Annual Transit Trips
96
132
0 50 100 150
Base Case
Vision Scenario
Millions of Trips

MPD Goal: SHELTER
Accommodating: 230 Lakh people
83.82 Lakh jobs by 2021.
Providing: 3.5 lakh Redev. DUs 3.5 lakh New DUs by 2011
10 lakh Redev. DUs 14 lakh New DUs by 2021

Delhi has a long history of forced eviction of ‘illegal’ squatter or slumcommunities,and an equallylong historyof immigration into the city.
� The low-income population was originally living in “illegal” squattersettlements or slums or JJC – because there was not adequateaffordable housing supply for them in the centre city – when they
originallyarrived in the city to work and aid in its economic growth.
� Displaced low-income population is most often located at the outskirts
of the city. This puts tremendous pressure on the transportinfrastructure of the city, as well as the finances of the low income
families – as they have to now commute every day to their place ofwork in the city. Moreover, secondary sources of family income(women working locally, etc.) are often severed, thus making the
family poorer. Children are disconnected from schools and new socialand physical; infrastructure is not provided. Shared amenities
originally available in the city centre are also out of reach afterrelocation.
� The above situation often forces the poor to move back into the cityand live as squatters or slums in dilapidated conditions again, just tobe close to jobs & amenities.
Source: Housing and Land Rights Network, Habitat International Coalition
Need:
It is therefore essential that low income groups are located near their sources of employment and within walking distance of informal sources of employment like higher income households and other
amenities within the city. Low income groups need to be “mixed” with other income groups in order to reduce social segregation and stigma
and build civic pride.
SHELTER: Spatial and social integration of ‘urban poor’ into larger urban community.
Study Source: Housing and Land Rights Network, Habitat International Coalition

Low income communities have generally been located in large concentrations (from 50,000 to 1 lakh population) at a single location, without adequate provision of social amenities and infrastructure services.
� Due to lack of investment in civic amenities and basic social infrastructure – these areas often perpetuate unemployment, crime and very unsanitary living
conditions.
� Mono-cultural concentration & Isolation leads to
social stigma, & severe lack of civic pride.
Sultanpuri, Mangolpuri – low income social ghettos of Delhi
Dakshinpuri…
Image Source: The Tribune, India, 2006
Seelampur, Delhi Seemapuri, Delhi
Image Source: Mackenzie Berg, 2008
“Shelter” Current large concentrations of low-income social ‘ghettos’ creating Social Stigma

Uniform densification? Or Transit Oriented Densification?

Uniform densification? Or Transit Oriented Densification?

42SITE SELECTION
There are several possible options for delivering low-income housing near public rapid transit (i.e. Metro, BRT) and near other middle to high income homes and employment centres:
Option 1: - Mandatory Reservation for % of low-income housing in private developments near public transit.
According to the Delhi Masterplan, all private
developments are to provide and maintain 15% of the total FSI for low-income groups. Other states are likely to adopt this mandate under the JNURM guidelines. This would be a mandatory requirement for projects to obtain planning approvals.
Option 2:
- FSI-density bonuses for market-rate developments to pay for, or construct nearby low-income communities.
- Density bonuses for providing and maintaining shared public parks, facilities and social infrastructure.
Option 3:
- Government built low income housing within 800 M walking distance from a rapid transit stations, limiting the size of each community to a maximum of 250 families.
Rapid Transit Station(Metro/ BRT)
Low income housing(Size < 250 families)
High/ Middle income housing
Commercial
Offices/ Light Industrial
Schools/ Libraries/ Civic uses
Public Parks
500 M walkingradius
Image Source: Paromita (Romi) Roy
Source: Spatial Inclusion and Sustainable Design of low-income communities

Commercial Hierarchy: Transit based vs. Freeway based
Hospitals
High Density Residential/ MU
HD Affordable Housing
Supporting Social/Physical Infrastructure
Warehousing Wholesale Freight Industries
MM Transit InterchangeComm. Centres
MM Transit InterchangeComm. Centres
Me
tro
/ BR
T
CBDCBD
• Universities
• Large Schools
• Regional Retail
• Stadia/ Large Sports Facilities
• Airports
• Multimodal Stations
Metro

Cross Subsidization of Social & Physical Infrastructure.Benefits:
Private Investment
Private Investment
IncentivesIncentives BonusesBonuses
TaxesTaxes RequisitesRequisitesIn-situ Upgradation/ Redevelopment of slums
and/ or provision of low-income housing near stations.
In-situ Upgradation/ Redevelopment of slums
and/ or provision of low-income housing near stations.
Designated Neighborhood level Open Space Provision and
Maintenance.
Designated Neighborhood level Open Space Provision and
Maintenance.
Provision of schools and civic facilities.Provision of schools and civic facilities.
Maintenance of public realm.Maintenance of public realm.

Vision MPD Vision TOD

2: Proposed Work ProgrammeFor TOD Implementation

MPD Goal: IMPLEMENTATION & MONITORING
& REVIEW OF PLAN POLICIES (p128)
Part 1: TOD Pilot Projects
Part 2: TOD Combined Modeling Scenario
– Multimodal Transportation - Landuse Coordination
Transit Oriented Development – Implementation
Overall TOD Vision Document + Draft Policy Framework+ 3 months
Prepared in consultation with TOD Core Team (DDA Depts. MCD Plg. & DIMTS)
Two parallel exercisesthat inform each other

TOD ‘Test Sites’ for implementation:
• Infill TOD
• Greenfield TOD
• Redevelopment TOD
Stage 1:
Based on Travel
Demand Modeling
Stage 2:
Based on Overall
Sustainability Parameters
VARYING BY:
• Locational Context
• Public Need
• Ownership
• Implementation model

VISION ISSUES GOALS TARGETS DRAFT Policy
Guidelines
DRAFT Urban Design
Guidelines
Pilot Project: Type 1
Action Plan+
Implementation
(LAP)+
Monitoring
Pilot Project: Type 2
Pilot Project: Type 3
TOD in Delhi:Vision & Policy Framework Diagram
Review / Feedback Loop
TOD Principles

Public Transit System:
Provision & Funding
Equitably distribute
Public realm
Landuse-Transportation
Synergy:
1 2
4
Discourage Private Car
3
Transit Oriented Development : The ROADMAP