The relationship between foreign direct investment (FDI ...
73
The relationship between foreign direct investment (FDI) and manufacturing exports and imports in South Africa PIETER OPPERMAN Research report presented in partial fulfilment of the requirements for the degree of Masters in Development Finance at the University of Stellenbosch Supervisor: Prof Charles Adjasi Degree of confidentiality: A December 2012
Transcript of The relationship between foreign direct investment (FDI ...

The relationship between foreign direct investment (FDI)
and manufacturing exports and imports in South Africa
PIETER OPPERMAN
Research report presented in partial fulfilment
of the requirements for the degree of
Masters in Development Finance
at the University of Stellenbosch
Supervisor: Prof Charles Adjasi
Degree of confidentiality: A December 2012

ii
Declaration
By submitting this research report electronically, I, Pieter Opperman, declare that the entirety of the
work contained therein is my own, original work, that I am the owner of the copyright thereof
(unless to the extent explicitly otherwise stated) and that I have not previously in its entirety or in
part submitted it for obtaining any qualification.
16155904
P. Opperman
October 2012
Copyright © 2012 Stellenbosch University All rights reserved
Stellenbosch University http://scholar.sun.ac.za

iii
Acknowledgements
I would like to acknowledge and express my gratitude to my supervisor Professor Charles Adjasi
for his interest shown in the research report and for his ever timely feedback and guidance
throughout the year. I dedicate this thesis to my parents on whose support and encouragement I
could always count throughout my studies.
Stellenbosch University http://scholar.sun.ac.za

iv
Abstract
In recent years South Africa has started to embark on policies to increase FDI and boost the
country’s manufacturing sector. FDI inflows are important for their perceived role of bridging the
savings-investment gap, while increasing the country’s manufacturing capacity will help diversify
the economy and could contribute towards job creation. The literature has revealed that the debate
on causality between FDI and trade has not yet been resolved. Furthermore, the FDI/trade
relationship has not been adequately addressed in African literature.
The research study has investigated the causal link between FDI and manufacturing exports and
FDI and manufacturing imports in South Africa for the period 1994 – 2011. Unit root tests of
stationarity were performed on the respective time series and it was found that the included
variables are non-stationary at their levels, but stationary at first differences. Tests of cointegration
revealed that FDI and manufacturing exports as well as FDI and manufacturing imports and vice
versa were cointegrated, implying a long-run relationship between the two sets of variables. The
study then utilised causality tests based on the significance of the ECM coefficient as well simple
Granger causality tests in a bivariate setting.
The results indicate one-way causality from manufacturing exports to FDI and from manufacturing
imports to FDI. These results suggest that exports and imports of the manufacturing sector matter
in the locational inflows of FDI in South Africa. It is recommended that the South African
government should encourage FDI policies that have an export component or export strategy. This
could attract more FDI inflows that would close the investment gap in the manufacturing sector.
Stellenbosch University http://scholar.sun.ac.za

v
Table of contents
Declaration ii
Acknowledgements iii
Abstract iv
List of tables vii
List of figures viii
List of acronyms ix
CHAPTER 1 ORIENTATION 1
1.1 INTRODUCTION 1
1.2 PROBLEM STATEMENT AND RESEARCH OBJECTIVES 4
1.3 OBJECTIVE OF THE STUDY 5
1.4 BROAD RESEARCH QUESTION 5
1.4.1 Sub Research Questions 5
1.5 IMPORTANCE OF THE STUDY 5
1.6 RESEARCH DESIGN AND METHODOLOGY 5
1.7 CHAPTER OUTLINE 7
1.8 CHAPTER SUMMARY 7
CHAPTER 2 LITERATURE REVIEW 8
2.1 THEORETICAL FRAMEWORK 8
2.2 EMPIRICAL LITERATURE 11
2.2.1 Determinants of FDI 11
2.2.2 Indirect (spillover) studies of FDI and exports 12
2.2.3 Direct studies of FDI and exports 14
2.2.4 FDI and trade 16
2.3 CHAPTER SUMMARY 17
CHAPTER 3 FDI AND MANUFACTURING IN SOUTH AFRICA 19
3.1 FDI IN SOUTH AFRICA 19
3.2 MANUFACTURING IN SOUTH AFRICA 23
3.3 EXPORT PROMOTION 27
3.4 CHAPTER SUMMARY 30
CHAPTER 4 RESEARCH METHODOLOGY 31
4.1 DATA COLLECTION 31
4.2 DATA ANALYSIS 31
4.2.1 Model 32
Stellenbosch University http://scholar.sun.ac.za

vi
4.2.2 Stationarity 32
4.2.3 Cointegration 34
4.2.4 Error Correction Model (ECM) 35
4.3 CHAPTER SUMMARY 35
CHAPTER 5 RESULTS 36
5.1 STATIONARITY 36
5.2 COINTEGRATION 38
5.3 ECM 39
5.3.1 Granger causality 40
5.4 NON-ECONOMETRIC ANALYSIS OF MANUFACTURING LEVEL DATA 41
5.5 DISCUSSION 43
5.6 CHAPTER SUMMARY 44
CHAPTER 6 CONCLUSION 45
6.1 SUMMARY 45
6.2 DISCUSSION 46
6.3 RECOMMENDATIONS 47
6.4 LIMITATIONS OF THE STUDY AND POSSIBLE FUTURE RESEARCH 48
REFERENCES 49
APPENDIX A1 ADF TESTS 55
APPENDIX A2 ADF TESTS ON FIRST DIFFERENCES 58
APPENDIX A3 COINTEGRATION TESTS 61
APPENDIX A4 ECM 62
Stellenbosch University http://scholar.sun.ac.za
vii
List of tables
Table 3.1: FDI inflows and outflows (US$bn) 19
Table 3.2: Regional sources of South African FDI, 1994–2005 20
Table 3.3: Individual country sources of FDI, 1994–2005 21
Table 3.4: Total direct investment in manufacturing as at 31 December (Rm) 21
Table 3.5: FDI related policies per institution 22
Table 3.6: Manufacturing sub-sectors’ share of total manufacturing by real value added (%) 25
Table 3.7: Total South African manufacturing trade (Rbn) 26
Table 5.1: ADF test results 37
Table 5.2: ADF test results for first differences 37
Table 5.3: Causality test results based on the significance of ECM coefficient 40
Table 5.4: Descriptive statistics 42
Table 5.5: Correlation coefficient 43
Stellenbosch University http://scholar.sun.ac.za

viii
List of figures
Figure 3.1: South African manufacturing trade balance 26
Figure 3.2: South African exports to Brazil, China and India 29
Figure 3.3: South Africa’s exports to Brazil, China and India as a percentage of total exports 30
Figure 5.1: Quarterly logarithms of FDI, EXP and IMP, South Africa, 1994–2011 36
Figure 5.2: Regression of LFDI and LEXP 38
Figure 5.3: Regression of LFDI and LIMP 38
Figure 5.4: PP unit root test on S (residuals of regression of LFDI and LEXP) 39
Figure 5.5: PP unit root test on S1 (residuals of regression of LFDI and LIMP) 39
Figure 5.6: Granger causality test of LFDI and LEXP 41
Figure 5.7: Granger causality test of LFDI and LIMP 41
Figure 5.8: Annual manufacturing FDI stock data, 1997–2010 (Rmillions) 42
Figure 5.9: Annual manufacturing stock data, manufacturing exports and manufacturing imports,
1997–2010 (Rmillions) 43
Stellenbosch University http://scholar.sun.ac.za

ix
List of acronyms
ADF augmented Dickey-Fuller
AEG augmented Engle-Granger
AIEC Automotive Industry Export Council
ANC African National Congress
ARDL autoregressive distributed lag
BRICS Brazil, Russia, China, India and South Africa
COSATU Congress of South African Trade Unions
CSA customs secured area
DSM decision support model
DTI Department of Trade and Industry
ECM error correction mechanism
ECT error correction term
EG Engle-Granger
EMIA Export Marketing & Investment Assistance Scheme
EPZ export processing zone
EXP manufacturing exports
FDI foreign direct investment
GDP gross domestic product
GEAR Growth, employment and redistribution
IDZ Industrial Development Zone Programme
IMP manufacturing imports
IPAP Industrial Policy Action Plan
ISC industries and services corridor
LEXP natural logarithm of manufacturing exports
LFDI natural logarithm of foreign direct investment
LIMP natural logarithm of manufacturing imports
MENA Middle Eastern and North African
MIDP Motor Industry Development Programme
MNE multinational enterprise
MNEs multinational enterprises
NAACAM National Association of Automotive Component and Allied Manufacturers
NGP New Growth Path
NPC National Planning Commission
OLI ownership, location and internalisation
OLS ordinary least squares
PP Phillips-Perron
Stellenbosch University http://scholar.sun.ac.za

x
R&D research and development
ROI return on investment
SADC Southern African Development Community
SARB South African Reserve Bank
SATIEC SA Textile Industry Export Council
TIPS Trade & Industrial Policy Strategies
TISA Trade and Investment South Africa
UNCTAD United Nations Conference on Trade and Development
Stellenbosch University http://scholar.sun.ac.za

CHAPTER 1
ORIENTATION
1.1 INTRODUCTION
The integration of foreign direct investment (FDI) into trade theory has been the focus of recent
trade related theoretical studies (Bezuidenhout & Naude, 2008:1). Trade theories are concerned
with why countries trade with each other while FDI theories attempt to explain the pattern of FDI
between countries, i.e. why a firm would invest in production facilities in a foreign country (Hill,
2007:238). FDI is important for recipient countries as it closes the investment gap as well as
facilitates the transfer of new technologies and best practices (Yao, 2006:340). In attracting export-
oriented FDI, export promotion policies should not be neglected (UNCTAD, 2005:57). The
Southeast Asian experience has demonstrated the success of having an export orientation as part
of industrial policy (AbuAl-Foul & Soliman, 2008:5). The rationale for export-oriented industries is
further enhanced by the pace of urbanisation (UNCTAD, 2005:55).
South Africa appears to have embarked on policies to increase FDI and export flows. The recently
launched South African New Growth Path (NGP) consists of a package of macroeconomic and
microeconomic policy interventions. Development trade policies are part of the microeconomic
package and seek to promote exports (Republic of South Africa, 2010b:24). An industrial policy
that focuses on exports, as opposed to import replacement, has the potential of leveraging global
demand and by implication needs to be competitive (Laubscher, 2010:3). South Africa’s
manufacturing exports increased by nearly 12 percent in 2010 to R321bn after a decrease of
almost 29 percent in 2009. Regionally the European Union was the largest recipient of South
African manufacturing exports with the United States of America (USA) being the largest single
recipient country (Republic of South Africa, 2011).
In Africa, FDI as capital source has grown in importance for its perceived role of bridging the
savings-investment gap and the ability of assisting the attainment of Millennium Development
Goals (Ayayi, 2006:12). Hence, a major part of developing strategies for developing countries has
been to promote and attract FDI.
FDI in being a source of long-term capital for investment in infrastructure and other development
initiatives also provides the following ripple effects (Ernst & Young, 2011:8):
Job creation. The literature stated that FDI has helped create 1.6m new jobs in Africa the
previous eight years.
Developing local suppliers. Through local procurement policies, the supply chains of local
providers can be extended.
Stellenbosch University http://scholar.sun.ac.za

2
Facilitating skill, technology and knowledge transfer.
Being a catalyst for economic diversification – something which would benefit most African
countries whose economies are mostly reliant on natural resources.
The literature on FDI identified four main motives for investing abroad, namely resource seeking,
market seeking, efficiency seeking and strategic asset seeking (Ajayi, 2006:15). Resource seeking
FDI pertains to investors locating abroad to secure inputs of raw materials while the goal of market
seeking FDIs is to open new markets in FDI recipient countries. Efficiency seeking FDI has the
goal of producing in as few countries as possible with each country having its own advantages of
location, endowment and government incentives. Finally, strategic asset seeking FDI chooses
locations where advantage can be taken of research and development and other benefits.
Ruane (2008:66) stated that globalisation has limited host countries’ policy options regarding
attracting FDI and has resulted in the liberalisation of product- and capital markets. Trade and
exchange rate policies may henceforth be of limited use. Challenges for smaller host economies
are increasing competition from other host economies seeing that smaller economies are
constrained by fiscal and political considerations. Furthermore, calculating the benefits and costs
associated with FDI incentives poses a further challenge as well as the ability of host economies to
clearly show how FDI will contribute to the economic development of the host country (Ruane,
2008:71).
Opportunities for smaller host economies to attract FDI require that, as globalisation and the
liberalisation of product- and capital markets continue, the size of the domestic market becomes
less of a factor considered by multinational enterprises (MNEs) (Ruane, 2008:72). Ruane noted an
apparent shift from market seeking- to efficiency seeking FDI.
However, relatively little is known empirically about FDI’s effect on the export behaviour of firms in
African countries (Abor, Adjasi & Hayford, 2008:446). Prior African studies revealed that FDI
positively affected either manufacturing export performance or export growth (Abor et al., 2008;
AbuAl-Foul & Soliman, 2008; Ancharaz, 2003). A South African study that investigated the
relationship between agricultural FDI and agricultural exports revealed a bi-directional causality
(Dlamini & Fraser, 2010). The essence of this research report was to examine the link between FDI
and manufacturing exports in South Africa. It has expanded on the work by Dlamini and Fraser by
concentrating on manufacturing exports and has also incorporated imports as has been suggested
in the theoretical literature.
After the 2009 general elections in South Africa a new power block within the ruling African
National Congress (ANC) emerged and has led to certain economic policy interventions by the
South African government. The NGP and the Industrial Policy Action Plan (IPAP2) being the
Stellenbosch University http://scholar.sun.ac.za

3
aforementioned. The incumbent President Zuma, owing much of his support to alliance partner, the
Congress of South African Trade Unions (COSATU), duly created a Department of Economic
Development with a former union leader as Minister (Hirsch, 2011:56). The NGP, under the ambit
of the Department of Economic Development, has job creation as main concern with the goal of
creating five million jobs within the next decade (Republic of South Africa, 2010b:8). With an official
unemployment rate back up to 25 percent in the first quarter of 2011, it is not surprising that the
President indicated that 2011 would be the year of job creation as unemployment is politically
untenable. The NGP, by incorporating IPAP2, targets labour-absorbing activities across various
economic sectors, of which manufacturing is one. Increasing manufacturing capacity will diversify
the economy from a dependence on commodities and could provide opportunities for faster
productivity growth (UNCTAD, 2005:55).
As the South African government aims to increase its fixed investment from 20 to 25 percent of
gross domestic product (GDP), of which FDI comprises three to five percent, targeted initiatives
with other member countries of BRICS are being sought (Lund, 2011a:20). More specifically, the
state has targeted R115 billion in foreign investment within three years, this figure being part of the
Trade and Industry Minister’s performance contract signed with the President (Ensor, 2011).
According to the Minister, this target will be met by his department. Total FDI inflows in South
Africa have recently been declining. After increasing from $5.7bn in 2007 to $9bn in 2008, FDI
declined to $5.7bn and $1.3bn in 2009 and 2010 respectively (African Economic Outlook, 2011;
Hazelhurst, 2011:13). The decrease in FDI inflows in South Africa was in contrast to developing
countries overall where FDI in total increased by ten percent during 2010 (Hazelhurst, 2011:13).
In 2008, manufacturing accounted for the largest share of the production base in the South African
economy with those sectors that are capital- and energy intensive, performing relatively well
(Republic of South Africa, 2010a:11).
During the economic boom years of the previous decade, job creation mainly occurred in the
wholesale, retail and business service sectors with the former two service sectors largely reliant on
private credit extension (Republic of South Africa, 2010a:12).
Hence, many jobs were lost when the extension of credit contracted and this is a further indication
that consumption driven growth needs to be replaced by a stronger production base (Republic of
South Africa, 2010a:12). Economic growth further declined because of a decrease in trade and
thus South Africa experienced both a developed country credit contraction as well as a developing
country trade and investment decline (Hirsch, 2011:56).
A further consequence of the global economic crisis was that patterns of trade and investment
have changed as can be seen in the economic recovery of certain emerging market economies
(Republic of South Africa, 2010b:4). With South Africa having recently joined the group of BRICS
Stellenbosch University http://scholar.sun.ac.za
4
countries – Brazil, Russia, China, India and South Africa – opportunities and challenges abound
which South Africa has to leverage to enhance trade and investment. Opportunities include
exposure to more export markets, while the current trade relationship with China could be seen as
a challenge.
Encouragingly, South Africa and China signed a Comprehensive Strategic Partnership in 2010
which is aimed at improving the current structure of trade between the two countries (Republic of
South Africa, 2010b:4). At a recent news conference the Trade and Industry Minister stated that
the South African government has indicated to China that it must increase its imports of
manufactured value-added products (Roos, 2011). BRICS membership should not only be about
political clout, but also translate into tangible economic benefits for South Africa. As wages
continue to rise in China and other parts of Asia, could Africa attract FDI in manufacturing? (Lund,
2011b:20). Some commentators have argued that China is already shedding manufacturing jobs,
pointing out Bangladesh’s garment exports are up to $12 billion from $5 billion in 2002 (Norbrook,
2010:67). Other reasons put forward why China will shed manufacturing jobs in the near future
include demographics, value-chain ambitions and currency pressure (Norbrook, 2010:70).
Therefore, could manufacturing exports also be a pre-requisite to attract FDI?
1.2 PROBLEM STATEMENT AND RESEARCH OBJECTIVES
The empirical work of Ahmed, Cheng and Messinis (2010) and Anwar and Nguyen (2011b) have
highlighted the need to take into account imports as well as exports when investigating the
relationship between FDI and manufacturing exports. As the previously mentioned studies have
shown, the interrelatedness of FDI, exports and imports necessitated the inclusion of imports.
Pacheco–Lopez (2005:1171) noted that possible bi-directional causality might not only exist
between exports and FDI, but also between imports and FDI. The latter can be explained as
follows - if imports signify evidence of an existing market, FDI might be attracted to the country in
order to produce the product locally. In turn, FDI could also stimulate imports as MNEs after having
been established in a country start importing certain supplies in order to satisfy internally required
standards.
The objective of the research was to investigate the relationship between FDI and manufacturing
trade in South Africa; specifically the causal link between manufacturing FDI, manufacturing
exports and manufacturing imports in order to recommend commensurate policies.
The debate on causality between FDI and trade has not yet been resolved (Bezuidenhout &
Naude, 2008:16). The research report aims to contribute regarding the FDI/trade causality debate
seeing that a lack of empirical studies, especially in South Africa, exists. The main question raised
is whether FDI contributes to promote manufacturing exports in South Africa.
Stellenbosch University http://scholar.sun.ac.za

5
1.3 OBJECTIVE OF THE STUDY
The objective of the research was to investigate the relationship between FDI and manufacturing
trade in South Africa; specifically the causal link between manufacturing FDI, manufacturing
exports and manufacturing imports in order to recommend commensurate policies.
1.4 BROAD RESEARCH QUESTION
Does FDI promote manufacturing trade in South Africa? If so what kind of international trade does
FDI promote; exports or imports or both?
1.4.1 Sub Research Questions
Are there causal links between FDI and manufacturing exports in South Africa?
Are there causal links between FDI manufacturing imports in South Africa?
What is the nature of the link between FDI and manufacturing exports or imports in South
Africa?
1.5 IMPORTANCE OF THE STUDY
The current research project is relevant given the importance of the manufacturing sector for South
Africa in relation to the NGP and IPAP2 as the country seeks to broaden its production base and
lessen its dependence on commodities. Government’s proposed new legal framework for FDI is
further impetus for the current field of research. The National Planning Commission’s (NPC’s)
National Development Plan Vision for 2030 also identified labour intensive industries,
manufacturing and exports as those areas that have the greatest potential for growth and job
creation (GIBS, 2011:49)
Wider manufacturing capacity offers prospects of integration across different economic sectors,
between the urban and rural economies and consumers, intermediate and capital goods industries
and could create a demand structure connecting domestic wages and consumption with domestic
production (UNCTAD, 2005:55). The report noted that late-industrialising economies, by adopting
such a pattern of internal integration, attracted manufacturing FDI.
Of importance is that if a causal direction is known between FDI and manufacturing trade, an
investment-attraction programme specific to the manufacturing sector can be mapped that could
translate to increased FDI inflows, bolstering the government’s aim of increasing fixed investment.
1.6 RESEARCH DESIGN AND METHODOLOGY
The related literature review has revealed that FDI, manufacturing exports and manufacturing
imports are related. In addition, a complementary relationship between FDI and exports is
Stellenbosch University http://scholar.sun.ac.za

6
predicted by an export platform model (Abor et al., 2008:452). The following causality relationships
are to be tested in a bivariate setting:
FDI ↔ EXP
FDI ↔ IMP
Where,
FDI is the aggregated FDI flow data;
EXP is manufacturing exports;
IMP is manufacturing imports.
Time series data of FDI in the manufacturing sector, manufacturing exports and manufacturing
imports are relevant for the current study and thus had to be considered when choosing the
appropriate method. Based on the theoretical and empirical literature review, it is expected that FDI
and trade hold some long-run relationship. Therefore, possible co-integrating relationships may
exist.
A natural starting point for time series data analysis was to test for stationarity of the particular time
series involved (Aziakpono, 2008: 198). According to Brooks (2008: 326), most economic time
series contain a single unit root and are thus non-stationary. Popular unit root tests are the Dickey-
Fuller (DF) test and the augmented Dickey-Fuller (ADF) test. In the ADF test, the lagged difference
terms of the regress are added to take into account possible serial correlation of the error terms
(Gujarati & Porter, 2009:758).
Co-integration between two time series occurs when their linear combination cancels out the
stochastic trends in the series (Gujarati & Porter, 2009:762). A linear combination of variables
containing a unit root will be stationary if the variables are cointegrated (Brooks, 2008: 336). As a
result the regression of one variable on another would be meaningful and not spurious.
The direction of causation between FDI and manufacturing trade is of interest. The causality test
method to use depends on the stationarity or not of the time series, and if non-stationary, whether
the time series are cointegrated or not (Aziakpono, 2008:200). According to Bashier and Bataineh
(2007:12), if the test results determine that the variables are integrated of order one and not
cointegrated, a Granger causality test should be implemented using the first differences of the
variables. They further posit that should the variables be stationary and cointegrated, an error
correction model should be used. The error correction mechanism (ECM) reconciles the short-run
behaviour of an economic variable with its long-run behaviour (Gujarati & Porter, 2009:769).
To summarise, economic time series are involved that, according to Brooks (2008:326), would
suggest non-stationarity. A unit root test was conducted to confirm the suspected non-stationarity
Stellenbosch University http://scholar.sun.ac.za

7
or not. Following the unit root test, the time series were tested for cointegration after which the
appropriate causality test method was employed.
Software requirements for the research project were essentially EViews 7 and spread sheets. As
only secondary data was used and as all the data is available in the public domain, issues of
ethical considerations are not applicable.
1.7 CHAPTER OUTLINE
This research report is divided into six chapters. Chapter 1 has provided the introduction and
overview. Included were the context, problem statement and research design of the research
report. In Chapter 2 the related theoretical and empirical literature will be reviewed. Chapter 3 will
discuss FDI, the manufacturing sector and export promotion in South Africa post-apartheid; while
Chapter 4 will cover issues pertaining to the research methodology employed. Chapter 5 will
present and discuss the empirical results with Chapter 6 to conclude. The conclusion will seek to
address the limitations of the research project, possible policy implications arising and highlight
future research avenues.
1.8 CHAPTER SUMMARY
Chapter 1 has provided an introduction to the research report. The problem statement and
research objectives were stated next. The importance of the research report and the research
design were discussed and the chapter concluded with the chapter outline.
Stellenbosch University http://scholar.sun.ac.za

8
CHAPTER 2
LITERATURE REVIEW
2.1 THEORETICAL FRAMEWORK
Initial research regarding the relationship between FDI and trade has focussed on whether the
relationship is complementary or whether FDI and trade act as substitutes (Xuan & Xing,
2008:190).
The seminal work of Mundell (1957) demonstrated capital mobility as a substitute for trade.
Accordingly, price differentials in goods and factor markets would be eliminated by factor mobility
as a result of differences in factor prices between countries. Thereafter, trade impediments
enhance factor movements and vice versa, resulting in FDI and exports being alternative means of
involvement in foreign markets (Bajo-Rubio & Montero-Munoz, 2001:312).
Markusen (1983) presented several models where factor mobility lead to an increase in world
trade. He stated that the models shared a common characteristic in that the basis for trade was not
brought about by differences in relative factor endowment. Other bases for trade put forward
include imperfect competition, production and factor taxes, returns to scale, different production
technology and factor market distortions. It is argued that in all these cases factor mobility leads to
differences in factor proportions which in turn indicate an additional motive for trade in goods (Bajo-
Rubio & Montero-Munoz, 2001:312).
Consequently, Markusen (1983) concluded that the idea of trade in goods and factors being
substitutes is a result and general characteristic of factor proportion models. In addition, Goldberg
and Klein (1999:2) indicated that subsequent theoretical work where models diverge from the
standard Heckscher-Ohlin-Samuelson model assumptions (which emphasises differences in factor
endowments), as used by Mundell (1957), can lead to findings of a complementary relationship.
The product-life cycle theory suggests that FDI and trade are substitutes (Vernon, 1966).
According to the theory, firms will undertake FDI at different stages in the product’s life cycle. In
Vernon’s time most new products were developed and introduced in the USA. His argument was
that as demand in the USA matures, cost considerations become the main concern and thereby
switch the locus of production to other developed and developing countries (Hill, 2007:182). The
USA then ceases being an exporter of the product. Another earlier theory used to explain FDI is
from Knickerbocker (1973) that suggests FDI can be explained from the perspective that firms
operating in oligopolistic industries imitate each other (Hill, 2007:249). The link between FDI and
trade is, however, not addressed.
Stellenbosch University http://scholar.sun.ac.za

9
According to Bajo-Rubio and Montero-Munoz (2001:312), theories of the multinational enterprise
(MNE) first propagated by Hymer (1976) stated that MNEs must have some specific advantage
over local firms in the host country. They further posited that because of such an ownership
advantage it would be beneficial for the MNE to internalise it within the firm by way of FDI, on
condition that the foreign country has a location advantage over the local country, making FDI
preferred over exporting. The essence of Dunning’s ownership, location and internalisation (OLI)
paradigm is apparent.
Dunning’s OLI paradigm was the dominant analytical framework for accommodating economic
theories of the determinants of FDI and trade in the last part of the 20th century (Dunning,
2000:163). According to the OLI, or eclectic paradigm, foreign production of MNEs is determined
by the interaction of the interdependent three OLI variables, which comprise three sub-paradigms
as well.
Ownership (O), the first sub-paradigm, avers that MNEs with greater competitive advantage,
relative to other MNEs and domestic firms in the foreign country seeking to invest, are more likely
to engage or increase foreign production. The location (L) sub-paradigm avers that the more MNEs
resource endowments (natural resources, labour, etc.), which need to be used in conjunction with
their competitive advantage, favour a foreign location, MNEs will engage in FDI to exploit that
competitive advantage. The internalisation (I) sub-paradigm concerns ways in which MNEs
organise and exploit their competitive advantage, given the location advantages of the foreign
location. MNEs will engage in FDI rather than licensing, the greater the benefits of internalising
foreign intermediate product markets (Dunning, 2000:164). Internalisation is a way to protect
MNEs’ competitive advantage (Anwar & Nguyen, 2011a:179).
Di Mauro (2000:3) stated that the main problem concerning the OLI framework is that although
explaining the existence of MNEs, explaining more recent trends in FDI has become problematic.
He further elucidated that there has been a surge in FDI among similar countries, implying
horizontal FDI, and furthermore stated that there is an absence of soundly generated empirical
models to compare real data with theory.
Helpman (1984) incorporated OLI considerations in developing a simple general equilibrium model
of international trade. Ownership and location advantages are combined in a monopolistic
competition model that includes horizontally differentiated goods and where MNEs develop specific
and specialised inputs, i.e. management, marketing and product specific R&D, that cannot be
traded (Bajo-Rubio & Montero-Munoz, 2001:312). Existing differences in factor endowments will
enable firms from the country that is relatively abundant in headquarter services to become MNEs
resulting in both intra-industry trade in differentiated products to appear as well as intra-firm trade
in specialised inputs to appear (Bajo-Rubio & Montero-Munoz, 2001:312).
Stellenbosch University http://scholar.sun.ac.za

10
Ethier (1986) incorporated direct investment in a simple general equilibrium model of international
trade with the analysis attempting to endogenise the internalisation decision. In contrast to
Helpman (1984), Ethier (1986) found that both greater uncertainties faced by the firm as well as a
greater similarity in factor endowments between countries will more likely translate in FDI that
leads to two-way FDI and relatively higher intra-industry and intra-firm trade (Bajo-Rubio &
Montero-Munoz, 2001:313).
New trade theory that emerged in the 1970s differs from the Heckscher-Ohlin theory which
highlights the importance of endowment of production factors for trade (Hill, 2007:186). The
importance of economies of scale and first mover advantages are emphasised by new trade theory
(Hill, 2007:184). Later new trade theory models incorporated FDI and thus trade and FDI were
classified as horizontal or vertical (Abor et al., 2008:451; Xuan & Xing, 2008:191).
According to Di Mauro (2000:3), new trade theory refers mainly to ownership and location
advantage that arises endogenously and where MNEs are introduced in general equilibrium
models. He posited that exponents of the theory’s early literature derived the activities of MNEs
when they tried to explain intra-firm trade being an additional component of international trade. The
theory assumed transport costs to be zero and MNEs to split their production process between a
headquarter activity and the foreign plant production. The rationale for multinational activities to
arise comes about from the factor proportions in the two MNE activities that differ and are
recognisable as vertical FDI where firms will take advantage of factor price differentials across
countries and separate the production process (Di Mauro, 2000:3).
Horizontal FDI is investment in the same industry at a foreign location, thus a duplication of the
production process while with vertical FDI the production process is decomposed into stages. To
attain economies of scale, production is located at different locations to exploit differences in factor
cost. Of importance concerning the relationship between FDI and trade is that horizontal FDI
reduces or substitutes trade while vertical FDI stimulates or complements trade (Aizenman & Noy,
2006:318). The same authors posited that according to economic reasoning, horizontal FDI would
be more common among industrialised countries, while vertical FDI would be found more often
between industrialised and developing countries.
The link between trade and FDI has received further attention following a recent contribution by
Helpman, Melitz and Yeaple (2003). They developed a model of international trade through which
firms can serve the local market, export, or engage in FDI with the aim to serve foreign markets.
The Helpman et al. (2003) model stressed the impact of heterogeneity on internationalisation
decisions and to test the implications of the model would require firm- or bank-level data (Buch &
Lipponer, 2007:807).
Stellenbosch University http://scholar.sun.ac.za

11
According to Helpman et al. (2003:28), because of heterogeneous firms, different productivity
levels exist that produce different organisational forms. The least productive firms would cease to
exist; low productivity firms would serve the local market with the remaining firms serving the local
and foreign markets. However, the mode of operation in foreign markets would differ with the most
productive firms in the group choosing the FDI route with less productive firms exporting.
Furthermore, FDI is assumed to be horizontal with the model containing a proximity-concentration
trade-off that predicts that with higher economies of scale or lower trade frictions, foreign markets
would be served more by exports relative to FDI.
The integration strategies of MNEs have become more complex in recent years, therefore the
traditional classification of FDI as horizontal or vertical has become less meaningful in practice
(Helpman, 2006:590). In particular, MNEs are investing in countries with a lower cost base to
create export platforms to serve other countries around the globe, resulting in large flows of FDI
across industrial nations that cannot be suitable classified as horizontal FDI (Helpman, 2006:591).
According to Abor et al. (2008:452), a complementary relationship between FDI and domestic
country exports is predicted by an export platform model.
2.2 EMPIRICAL LITERATURE
2.2.1 Determinants of FDI
The following section will review some of the determinants of FDI as found in the empirical
literature.
A South African study by Rusike (2007:73) revealed that long run determinants of FDI were
openness, the exchange rate and financial development. Increased openness and financial
development would attract FDI while a depreciating exchange rate would deter FDI to South Africa.
Policy recommendations were a relaxation of exchange controls and easing regulatory burdens for
foreign investors. The appeal of three cabinet ministers to the Competition Tribunal’s approval of
the R16,5bn Wal-Mart/Massmart merger in 2011 is therefore regrettable from an FDI viewpoint.
Fedderke and Romm (2006:738) investigated the growth impact and determinants of FDI in South
Africa from 1956–2003. Positive technological spillovers from foreign to domestic capital were
found with FDI in South Africa tending to be capital intensive, suggesting horizontal FDI.
Determinants of FDI found from their empirical findings allowed for the following policy
prescriptions: reducing political risk, lowering corporate tax rates, wage moderation and
strengthening growth in market sizes. The openness of the economy also impacted strongly on FDI
with increasing imports lowering FDI and increasing exports raising FDI.
Stellenbosch University http://scholar.sun.ac.za

12
In Mauritius, trade openness, wages and the quality of the country’s labour were found to be
instrumental factors (Seetanah & Rojid, 2011:24). A lesson for the South African context is that the
state should ensure that labour costs remain competitive and should not appreciate faster relative
to other FDI recipient countries. Singhania and Gupta (2011:79) found adjusted GDP, the inflation
rate and research and development to have significant impact on FDI inflows in India.
The determinants of FDI were investigated in another emerging economy, Brazil. De Angelo, Eunni
and Fouto (2010:203) found that aggregate consumer sales as proxy for internal market growth,
were a significant determinant of FDI inflows. The practical implication of the study was that in
larger emerging market economies, policy makers should avert using fiscal and monetary policies
to attract FDI but rather stimulate growth of their internal markets.
Morris and Aziz (2011:408) echoed the sentiments of De Angelo et al. (2010), namely that it seems
as if large multinationals are not always persuaded by ease of doing business factors when making
investment decisions regarding African and Asian countries. Asia, especially China and India, have
millions of middle class consumers that would provide a market for the goods and services of
multinationals. Currently Africa lacks the domestic markets compared to other BRIC economies.
Foreign investment decisions are complex and producing a list of determining factors cannot be
exhaustive. Ajayi (2006:16) stated that there is no unanimously accepted single factor that
determines the flow of investment. He summarised that FDI is influenced by factors that range from
the size of the market, quality of labour, the availability of resources and infrastructure and
institutions.
2.2.2 Indirect (spillover) studies of FDI and exports
It is important to make a distinction between the direct- and indirect (spillover) effect of FDI on
exports. The effect of FDI on the manufacturing exports of South Africa would be an example of
the direct effect. Most spillover studies focus on either technology spillovers or export spillovers
from FDI. Domestic firms becoming more export-oriented as a result of FDI would be an example
of positive export spillover effect (Anwar & Nguyen, 2011a: 177).
Most export spillover studies revealed positive spillovers from FDI (Sun, 2009:1203). More than a
decade ago Head and Ries (1999:2) already noted the aforementioned. They stated that most
theories of FDI postulated that firms would choose the mode of entry into foreign markets that
would yield the highest profit, depending on factors such as transportation costs, trade barriers and
fixed costs. Intuitively, one would thus expect FDI to displace exports. However, most empirical
work up to that point in time indicated a complementary relationship where countries, industries
and firms that invest heavily in foreign countries were also the source of large volumes of exports
to those FDI recipient countries (Head & Ries, 1999:2).
Stellenbosch University http://scholar.sun.ac.za

13
In their empirical work, Head and Ries (1999:19) stated that addressing the issue of a spurious
statistical relationship was an important aspect when investigating the effects of FDI on exports.
They argued that it would be incorrect to interpret a simultaneous rise in FDI and exports as proof
of a complementary relationship. In addition, firms that have superior products could follow both
modes of entry and as such it is not indicative that FDI generates more exports. Head and Ries
used a panel dataset of 25 years to address the previous issues and employed fixed firm effects
that would enable them to identify the influence of FDI on exports based on within-firm variation. In
addition, only lagged effects of investment on current exports were considered and
macroeconomic shocks affecting all firms were controlled for.
As most other studies up to that point in time, Head and Ries (1999:19) found FDI and exports to
have a complementary relationship. The panel dataset contained data on 932 Japanese firms and
Head and Ries demonstrated important differences across firms. Firms least likely to supply
foreign production facilities with intermediate inputs were less likely to have FDI stimulate exports.
Abor et al. (2008:446) used a probit model to indicate FDI’s positive influence on the export
decisions of Ghanaian firms. Using panel data regression, their results overall demonstrated that
FDI had a positive effect on firms’ decisions to export and on firms’ export performance. Their
results confirmed the findings of other empirical studies regarding the export decision and were
explained through the fact that as a result of FDI, improved technologies and management skills
were brought on board that would entail productivity enhancement and hence the decision to
export. Put forward as another explanation concerning the decision to export, where firms receiving
a foreign capital injection were more likely be in a better position to finance the sunk costs
associated with entering the export market and foreign-owned firms having links with foreign
markets and would as such be more motivated to export.
By estimating a Heckman sample selection model, Sun (2009:1221) demonstrated export
spillovers from FDI in China’s cultural, educational and sporting product manufacturing industry. He
found the export impact from FDI on firms to be varied in that the scale depended positively on firm
geographical location in Central China while in Western China a negative dependency was found
with regard to sales cost to sales revenue ration, ownership structure and geographical location.
Anwar and Nguyen (2011a:177), by also using a Heckman type selection model, found that the
presence of foreign firms in Vietnam, through horizontal and vertical linkages, had a significant
positive effect on the Vietnamese firms’ decision to export and their export share. Their results
continued to hold after taking into account factors such as domestic firms’ level of technology,
domestic firms’ ownership structure, the orientation of foreign firms and the geographical proximity
to foreign firms.
Stellenbosch University http://scholar.sun.ac.za

14
Wang and Yu (2007:404) provided clear evidence of a curvilinear relationship between foreign
presence and spillover benefits to firms in the Chinese manufacturing industry. This finding is in
contrast to a linear relationship found in previous studies with the curvilinear relationship being
particularly strong in labour-intensive industries.
An interesting study by Wei and Liu (2006:554), based on a panel of more than 10 000 Chinese
and foreign-invested firms, found that government incentives may hasten competition for exports
between domestic and foreign-invested Chinese firms in the same industry. Hence, they presented
evidence of negative intra-industry spillovers as opposed to most other export spillover studies
revealing positive export spillovers from FDI.
Results from Thangavelu and Owyong (2003:623) indicated that FDI intensive industries were the
key contributors to productivity growth in manufacturing industries with regard to export
performance and economies of scale when compared to non-FDI intensive industries. Data were
used from ten major industries in Singapore’s manufacturing sector with the ten industries divided
into FDI intensive and non-FDI intensive, based on the share of foreign equity.
Assessing the impact of inward FDI on the performance of Chinese manufacturing firms, findings
from Buckley, Clegg and Wang (2002:637) revealed that non-Chinese MNEs generate
technological and international market access spillover benefits for local firms with overseas
Chinese investors conferring only market access benefits.
2.2.3 Direct studies of FDI and exports
Regarding the direct effect of FDI on exports, an earlier study by Zhang and Song (2000:395)
using a simple regression model to calculate a correlation coefficient, found a strong correlation
between exports and FDI in China. Their findings supported the view that increased FDI positively
affects manufacturing exports.
Kim and Kang (1996:39) examined the relationship between outward FDI and exports in South
Korea and Japan by using cross-sectional data. The purpose of the study was to investigate
whether or not FDI substitutes or decreases exports from the domestic country that will help in
predicting the effect on domestic industries. Results indicated that FDI does not substitute exports
from the domestic country. Retaining foreign export markets as a determinant of FDI was found
more important in Japan than in South Korea which might imply that outward FDI in Japan is more
of a market-oriented type while in South Korea more of a cost-oriented type.
Ancharaz (2003) found that FDI contributed to export growth in Mauritius. The impact on export
competitiveness has however been negligible. The study examined FDI flows to the Mauritian
export processing zone (EPZ) with the economic model specifying FDI as a function of daily
average wages in the EPZ, a foreign interest rate variable, real exchange rate variable, the
Stellenbosch University http://scholar.sun.ac.za

15
domestic capital stock in the EPZ and a dummy variable to capture the period of trade liberalisation
in Mauritius.
AbuAl-Foul and Soliman (2008:4) investigated FDI’s effect on manufacturing export in four Middle
Eastern and North African (MENA) countries, namely Egypt, Morocco, Tunisia and Turkey. By
using panel data from 1975 – 2003 and making use of a gravity model, their results indicated that
FDI positively affects the domestic country’s manufacturing exports. The findings revealed that for
the respective host countries, a ten percent increase in FDI inflows would lead to a 1.2 percent
increase in manufacturing exports while a similar ten percent increase in FDI stock would lead to a
3.4 percent increase in manufacturing exports. What is of note to mention is that the authors
comment that country-level data might hide sector- or firm-specific aspects of FDI activities as well
as the nature of their interaction with local firms. Disaggregated data could thus also be considered
if available.
By employing a gravity model and equations, the findings of Xuan and Xing (2008:183)
demonstrated that FDI has been a major contributor in driving Vietnam’s export growth. FDI has
significantly aided Vietnam’s exports to the 23 FDI source countries on which the analysis was
based. Specifically, a one percent increase in FDI inflows would lead to a 0.13 percent increase in
Vietnam’s exports to those source countries.
Ahmed et al. (2010:23), using the autoregressive distributed lag (ARDL) approach in the
examination of a Granger test of causality, found evidence of a bi-directional causality between FDI
and exports in Ghana, Kenya and Nigeria. In South Africa the Granger causality was from FDI to
exports, while in Zambia the causality was from exports to FDI. When the findings were further
examined using Pedroni’s estimation approach that allows for heterogeneity across individual
countries, the evidence revealed that FDI had a significant positive impact on exports.
Bajo-Rubio and Montero-Munoz (2001) analysed the relationship between FDI and exports in
Spain by using quarterly data for the period 1977–1998. By means of Granger causality tests in a
cointegration framework, their results indicated a complementary relationship between the
variables with the Granger causality running in from FDI to exports in the short run, and a bilateral
causality in the long run.
The findings of Dlamini and Fraser (2010:57) indicated a bi-directional causality between FDI and
exports in the South African agricultural industry. The Dlamini and Fraser (2010) study used
Granger causality tests and an error correction model in a bivariate setting. The study’s economic
model was based on the assumption that FDI is a function of agricultural exports and GDP in the
agricultural sector. The authors recommended that since FDI had a complementary relationship
with agricultural exports, priority should be given to providing an enabling environment for
Stellenbosch University http://scholar.sun.ac.za

16
agricultural productivity rather than on attracting FDI because an increase in the rate of agricultural
productivity would translate into more FDI.
An indirect way of empirically testing FDI’s impact on employment is to gauge the relationship
between exports and FDI (Di Mauro, 2000:11). The objective would be to inspect whether FDI
substitutes for exports and as such indirectly harms local employment in the exporting sector. Di
Mauro (2000:11) adopted a methodology in which gravity equations for exports and FDI are
estimated with the residuals of the estimations and are then regressed against each other. The
method presumes to remove the influence of common factors on FDI and on exports by using the
gravity equations. Complementarity would be found if there is a positive correlation between the
two residuals.
Di Mauro’s (2000) working paper assessed the impact of economic integration on FDI and exports
by using a gravity approach and the paper also dealt with the complementarity versus
substitutability debate concerning the FDI and exports relationship. Economic integration between
European Union countries was the primary focus. In the working paper, the residuals from the FDI
gravity equation were the dependent variable and regressed against the residuals from the exports
gravity equation. For the three years considered, it was found that the coefficients were positive
and highly significant, implying a complementary relationship between FDI and exports.
Di Mauro (2000:21) highlighted that the previously mentioned method could only account for a
complementary or substitutability relationship between FDI and exports at an aggregate level and
that studies investigating different sectors of the economy might reveal different results.
As opposed to most of the empirical literature that focuses on non-financial MNEs, Buch and
Lipponer (2007:806) used bank-level data to investigate the FDI versus export decision for German
Banks. Their findings revealed that FDI and cross-border services were complements. They also
tested Helpman et al. (2003) theories of MNEs, which highlighted the importance of firm
heterogeneity, and found that the heterogeneity of banks had a significant impact on the
internationalisation decision.
2.2.4 FDI and trade
Aizenman and Noy (2006:333) stated that the feedback effect between FDI and trade was stronger
in developing countries than in industrialised countries. The aforementioned is in line with the
inference that the bulk of FDI heading to developing countries has been vertical. Furthermore,
Aizenman and Noy posited that this notion does offer a partial motivation for trade and financial
liberalisation policies undertaken by developing countries in recent times.
Anwar and Nguyen (2011b:39) used a gravity model to investigate FDI’s impact on exports,
imports and net exports in Vietnam. In addition, the study also considered FDI’s impact on the
Stellenbosch University http://scholar.sun.ac.za

17
previously mentioned trade during three sub periods concerning the Asian financial crisis; pre-
Asian crisis, post-Asian crisis and during the Asian financial crisis. The analysis was based on a
panel dataset covering 19 of Vietnam’s trading partners for the years 1990–2007. Their results
showed a complementary relationship between FDI and exports as well as between FDI and
imports. FDI’s impact on net exports was found to be significantly positive in the post-Asian
financial crisis period.
Ahmed et al. (2010:23), by using Granger-type causality tests to demonstrate the interrelatedness
of exports, FDI and import variables, confirmed the concern of Anwar and Nguyen (2011b:39)
regarding the effect of FDI on imports. Specifically, whether manufacturing industries attracting FDI
relies on significant inputs of imported goods? Hence, Anwar and Nguyen (2011b:40) hypothesized
that the direct effect of FDI on net-exports may not be significant or even negative.
According to Bezuidenhout and Naude (2008:16), inconclusive evidence still exists as to whether
FDI causes trade or whether trade causes FDI. In their working paper, they investigated the
relationship between trade and FDI in the Southern African Development Community (SADC).
Before using a gravity model, Bezuidenhout and Naude (2008:16) examined the causality between
trade and FDI by using a Granger causality test. The results indicated that in the case of the 20
countries involved in the study, trade caused FDI. Hence, in their model estimation, the FDI proxy
was treated as the dependent variable. Further findings revealed that distance and political
instability were negative determinants of FDI to SADC countries; while regarding trade patterns, a
complementary relationship between FDI and trade to SADC in the case of continental Europe was
observed.
Pacheco-Lopez (2005:1157) analysed the liberation of FDI in Mexico and its relationship with
exports and imports. By using Granger causality methodology and an ARDL model to estimate an
error correction model, it was found that although MNEs promoted exports in Mexico, the
displacement of local firms through higher import content has limited the country’s economic
development. Hence, bi-directional Granger causality between exports, imports and FDI were
found.
2.3 CHAPTER SUMMARY
The chapter provided the theoretical framework upon which the research report has been based.
The related empirical literature review distinguished between direct- and indirect studies of FDI and
manufacturing exports and FDI and trade. Based on the related empirical literature review, the key
message pertaining to the current research report suggested that FDI and manufacturing exports
are related. Few studies incorporated imports when investigating the aforementioned relationship.
Stellenbosch University http://scholar.sun.ac.za

18
If FDI has resulted in a significant increase in imports, the empirical literature has revealed that it
would make sense to also consider the relationship between FDI and imports.
Stellenbosch University http://scholar.sun.ac.za

19
CHAPTER 3
FDI AND MANUFACTURING IN SOUTH AFRICA
3.1 FDI IN SOUTH AFRICA
While accounting for only a small part of global FDI flow, South Africa dominates FDI in the
Southern Africa Development Community (Akinboade, Siebrits & Roussot, 2006:178). The authors
noted that FDI has been consistently positive although disappointing in terms of quantity after
1994. It is further mentioned that evidence of the relatively low levels of FDI inflows could be seen
from the fact that foreign portfolio capital flows have generally exceeded FDI inflows by a
considerable margin.
Rusike (2007:40) echoed the sentiment that FDI has appeared to increase over time since 1994,
but relative to the size of the South African economy and other similar developing markets, FDI is
below levels expected. Mergers and acquisitions as opposed to Greenfield investments was found
to account for most FDI activity. Greenfield projects would enhance more job creation opportunities
as large acquisitions only provide a once-off capital inflow and a subsequent drain of dividends.
Rusike (2007:40) also compared inward FDI as a share of GDP with other developing countries
and found net inflows in South Africa to be very low at generally less than one percent of GDP,
apart from a couple of exceptional years. Compared to other developing countries which average
three – five percent, this is not good. Table 3.1 provides FDI inflows for South Africa, Africa and
developing markets.
Table 3.1: FDI inflows and outflows (US$bn)
Year South Africa Africa Developing markets
2005 6,647 38,16 332,343
2006 -0,527 46,259 429,459
2007 5,695 63,132 573,072
2008 9,006 73,413 658,002
2009 5,696 60,167 510,578
2010 1,553 55,05 573,561
Source: African Economic Outlook, 2011; Thomas, 2011:45.
Disconcerting from Table 3.1 is that while developing markets attracted greater FDI inflows
following the financial crisis, South Africa’s inflows of FDI slumped to US$ 1,55bn in 2010. South
Africa’s attraction of less than three percent of the continents FDI inflow is also uninspiring.
Stellenbosch University http://scholar.sun.ac.za

20
Thomas (2011:45) reported that among 54 African countries, South Africa ranked 9th in terms of
FDI inflows, behind countries such as Angola, Egypt and Nigeria.
Thomas (2011:45) further reported that economists reckoned that the previously alluded to
portfolio inflows have replaced FDI because of the country’s strict labour policies and other
government interventions with owning shares on the JSE offering more liquidity. Other reasons put
forward for low FDI inflows were the size of the consumer market in South Africa being small and
constrained by excessive debt as well as the country’s export base being handicapped by transport
costs. As example Thomas cited research that indicated that the cost of loading or offloading a
container ship at the Durban port was between 80–170 percent greater than at European ports.
South Africa’s natural resource wealth will keep attracting investors and, compared to the rest of
Africa, the relatively well educated labour force helps to draw funds into non-resource sectors of
the economy as well (Ernst & Young, 2011:40). This is evident by inspecting the top five sectors in
number of FDI projects from 2003–2010, namely software and IT services, business services,
financial services, metals and the automotive sector. The Ernst & Young report listed the top five
investor countries in number of FDI projects from 2003–2010 as the US, UK, Germany, India and
Australia.
Rusike (2007:44) analysed FDI inflows to South Africa from 1994 – 2005 and found that Europe
was by far the largest regional source of FDI. Table 3.2 presents his findings.
Table 3.2: Regional sources of South African FDI, 1994–2005
Region Amount(Rm) Percentage
Europe 2 315 091 86
Americas 234 510 9
Africa 30 109 1
Australia 5 415 0.002
Asia 111 727 4
Source: Rusike, 2007:44.
Rusike (2007:45) further analysed FDI inflows from individual countries. Table 3.3 presents his
findings.
Stellenbosch University http://scholar.sun.ac.za

21
Table 3.3: Individual country sources of FDI, 1994–2005
Country Amount(Rm) Percentage
UK 1 803 309 70
USA 212 711 8
Germany 197 442 8
Netherlands 104 757 4
Switzerland 73 821 3
Malaysia 52 940 2
France 41 746 2
Other Europe 37 953 1
Japan 35 305 1
Luxumborg 16 106 1
Source: Rusike, 2007:45.
From Table 3.2 and Table 3.3 it is evident that European countries have been the most significant
contributors regarding FDI inflows to South Africa since the end of apartheid in 1994. It would
appear that the trend still persists. SARB Quarterly Bulletin International economic relations for
December 2010 revealed that for that year alone, Europe accounted for 84 percent of total FDI
with the UK again by far the greatest individual source country.
FDI annual manufacturing stock figures as collected from the South African Reserve Bank (SARB)
Quarterly Bulletin are presented in Table 3.4.
Table 3.4: Total direct investment in manufacturing as at 31 December (Rm)
Year FDI stock in the manufacturing sector
2003 75 427
2004 111 354
2005 136 028
2006 165 432
2007 197 099
2008 204 754
2009 242 217
2010 262 920
Source: SARB Quarterly Bulletins.
In 2010, FDI stock in the manufacturing sector was 25.89 percent of total FDI stock with mining
and quarrying at 38.28 percent and financial intermediation, insurance, real estate and business
Stellenbosch University http://scholar.sun.ac.za
22
services at 23.81 percent of total FDI stock. As Table 3.4 indicates, there has been an upward
trend in FDI manufacturing stock in recent years.
Given South Africa’s history of discriminatory laws, FDI was not actively pursued prior to 1994.
According to Rusike (2007:31), although the country acknowledged the importance of FDI within
the broader macroeconomic spectrum, no specific and coherent FDI policy that acted as guidance
to attract FDI existed. Hence, the macroeconomic strategy of GEAR (Growth, employment and
redistribution) of 1996 aimed to provide a favourable environment as point of origin in attracting
FDI. Specific sectors of the economy have pursued FDI related policies (Rusike, 2007:31). Rusike
noted that a number of departments and units including the DTI, the Department of Minerals and
Energy and the SARB, have all had the responsibility of formulating and implementing different FDI
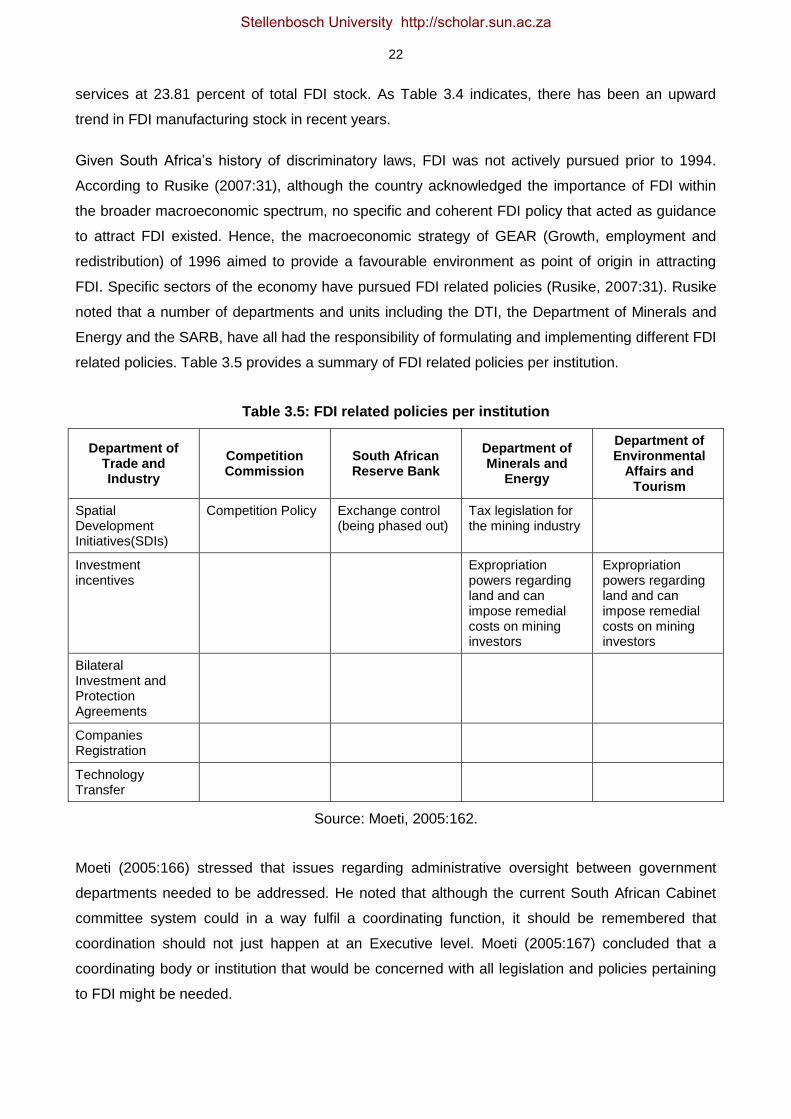
related policies. Table 3.5 provides a summary of FDI related policies per institution.
Table 3.5: FDI related policies per institution
Department of Trade and Industry
Competition Commission
South African Reserve Bank
Department of Minerals and
Energy
Department of Environmental
Affairs and Tourism
Spatial Development Initiatives(SDIs)
Competition Policy Exchange control (being phased out)
Tax legislation for the mining industry
Investment incentives
Expropriation powers regarding land and can impose remedial costs on mining investors
Expropriation powers regarding land and can impose remedial costs on mining investors
Bilateral Investment and Protection Agreements
Companies Registration
Technology Transfer
Source: Moeti, 2005:162.
Moeti (2005:166) stressed that issues regarding administrative oversight between government
departments needed to be addressed. He noted that although the current South African Cabinet
committee system could in a way fulfil a coordinating function, it should be remembered that
coordination should not just happen at an Executive level. Moeti (2005:167) concluded that a
coordinating body or institution that would be concerned with all legislation and policies pertaining
to FDI might be needed.
Stellenbosch University http://scholar.sun.ac.za

23
Sello (2007:34) stated that most of South Africa’s incentive schemes in attracting FDI are
administrated by the DTI. According to him, examples of these schemes include the Industrial
Development Zone Programme (IDZ), Skills Support Programme, Critical Infrastructure Fund and
the Strategic Industrial Projects Incentive. Regarding IDZs, Sello (2007:35) noted that unlike Export
Processing Zones in other countries, these industrial zones are relatively new with the first one
designated in 2001. These zones have been developed in Port Elizabeth and East London,
Richards Bay and at the OR Tambo International Airport in Johannesburg.
Two operational zones characterises an industrial zone, a customs secured area (CSA) and an
industries and services corridor (ISC). Businesses operating within the CSA have duty-free imports
of production inputs, supplies procured from South Africa have zero VAT rate and these
enterprises can sell finished products in South Africa after paying normal input duties without the
imposition of quotas. In the ISCs service providers to CSA businesses find an industrial and office
park environment (Sello, 2007:35).
Disconcertingly, Sello (2007:39) found that FDI to South Africa was accompanied by small linkages
to the local economy. He concluded that although incentive packages may influence FDI inflow, the
main determinants of a host country’s FDI attractiveness may not be specific incentives. He also
provided an example of access to foreign markets, as in the case of Lesotho’s access to the US
market and in South Africa’s case the generally stable political and economic climate as possibly
more important determinants of FDI attractiveness.
3.2 MANUFACTURING IN SOUTH AFRICA
Mbeki (2011:61) contended that while the virtues of globalisation are quickly extolled, casualties
such as South Africa’s manufacturing sector also exist. He stated that in 1980, 30 percent of the
country’s output came from manufacturing a situation which does not compare favourably to 15
percent contribution of manufacturing output currently. This he said has contributed to the
unacceptable levels of unemployment. Unlike China and India, South Africa already had a
successful manufacturing sector and while developed countries rushed to supply the newly
industrialised Asian nations with capital goods to fuel their growth, the South African manufacturing
sector was left behind.
At sectorial level, the slowing down in South African growth could be attributed chiefly to the poor
performance of the secondary sector, particularly manufacturing (TIPS, 2009:1). The TIPS study
echoed Mbeki’s (2011) sentiment that this is important given that manufacturing has for many
decades been the main driver and measure of economic growth locally and internationally. The
report further noted that prior to the crisis, utilisation of manufacturing production capacity
increased faster than investments in manufacturing which is an important point, considering
investment is required to foster additional job creation.
Stellenbosch University http://scholar.sun.ac.za

24
Whereas a decade ago the manufacturing sector was the largest employer in the country, the
sector is currently well behind government services. Together with a parallel drop in the mining and
agricultural sectors, the South African economy has been totally reconfigured into a raw mineral
exporter and consumer economy (Mbeki, 2011:61). Mbeki alarmingly concluded that South Africa
is becoming a colony in economic relations with China and India and that the country is “eating
ourselves through our natural resource wealth”.
The South African Government is aware of the situation and through the IPAP2 attempts to
promote long-term industrialisation and industrial diversification that will hopefully bring about less
reliance on commodities. The lofty purpose of the IPAP2 is to expand production in value-added
sectors of the economy with high employment and growth multipliers that can be competitive in
export markets and compete locally against imports (Republic of South Africa, 2010a:1).
The IPAP2 document further accentuated the urgency of the situation in that it stated that South
Africa has no alternative action than the proposals in the policy action plan. Manufacturing is seen
as an engine of long-term sustainable growth and job creation for developing countries. The policy
document portrayed South African growth in the past as being reliant on growth in consumption,
fuelled by credit extension. The document stated that between 1994 and 2008, 7.7 percent annual
growth was recorded in consumption driven sectors compared to the 2.9 percent annual growth in
the productive sectors of the economy. This has meant that even at the height of the South Africa’s
average annual growth of 5.1 percent between 2005 and 2007, unemployment still hovered near
the 23 percent level.
The relative profitability of manufacturing, as part of value added production, has been low as a
result of a number of factors that include (Republic of South Africa, 2010a:5):
A volatile and lack of a sufficient competitive Rand;
The cost of capital relative to South Africa’s trading partners and particularly the capital
channelled towards value added sectors such as manufacturing that results in the limited
allocation of said capital;
Monopolistic provision and pricing of key inputs;
Aged, unreliable and expensive infrastructure system;
Weak skills base and system;
Inability to adequately leverage public capital and other areas of public expenditure.
Stellenbosch University http://scholar.sun.ac.za

25
Further worsening for the sector has been the recent electricity price hikes that will adversely affect
the economy’s production side. Recently, Stewart Jennings, the Chairperson of South Africa’s
Manufacturing Circle, argued that having already adopted compound increases of 140 percent
over the past four years, a further envisioned two increases at the 25 percent level would have
serious consequences for a sector that has shed 300 000 jobs since 2008 (Lamprecht, 2011).
Roger Pitot, Executive Director of the National Association of Automotive Component and Allied
Manufacturers (NAACAM), echoed the previous sentiment and reported that for some of their
affiliated member companies, electricity currently comprises 15 percent of their total cost
(Lamprecht, 2011). According to Pitot, in the short term relief is needed for manufacturers that are
heavy electricity users. In the medium term, government should upgrade infrastructure, especially
in ports and rail, as the amount of products transported per road is too high. Government should
also focus to ensure labour stability as strikes greatly dampen productivity.
The manufacturing sector revealed heterogeneous performances at sub-sector level prior to the
global financial crisis. Market changes were observed since the 2000s with some industries
shrinking while other sub-sectors were sustaining and even growing (TIPS, 2009:1). The report
further noted that prior to the global financial crisis, utilisation of manufacturing production capacity
increased faster than investment in manufacturing which is important considering investment is
required to create additional jobs. Table 3.6 indicates real value addition of certain manufacturing
sub-sectors.
Table 3.6: Manufacturing sub-sectors’ share of total manufacturing by real value added (%)
Sub-sector 1994 2000 2008
Food 6.7 4.4 5.3
Textiles 6.1 4.1 2.6
Paper and paper products 8.5 6.8 7.3
Coke and refined petroleum products
1.3 2.5 4.1
Basic chemicals 8.0 11.4 13.1
Plastic products 6.0 5.3 5.2
Basic iron and steel 7.2 8.7 8.9
Machinery and equipment 8.6 5.4 4.2
Motor vehicles, parts and accessories
8.6 15.5 19.4
Other manufacturing 1.2 0.9 0.8
Source: TIPS, 2009:1.
Analysing the above table, the TIPS report highlighted the performance of the motor vehicles, parts
and accessories sub-sector that has more than doubled its operations since 1994 and the report
Stellenbosch University http://scholar.sun.ac.za

26
attributed it to the Motor Industry Development Programme (MIDP). Textiles have performed poorly
and are significantly down from 1994 levels in terms of real value added.
Table 3.7 presents South African total manufacturing trade from 2005–2011 with Figure 3.1
displaying the country’s manufacturing trade balance.
Table 3.7: Total South African manufacturing trade (Rbn)
Year Manufacturing exports Manufacturing imports
2005 203,779 295,409
2006 242,392 381,821
2007 304,857 462,399
2008 404,211 563,779
2009 287,372 428,418
2010 320,952 477,195
2011 360,938 590,344
Source: Republic of South Africa, 2011.
Figure 3.1: South African manufacturing trade balance
Source: Republic of South Africa, 2011.
As seen from Table 3.7 and Figure 3.1, manufacturing imports have been consistently greater than
manufacturing exports. Pacheco-Lopez (2005:1168) stated that imports could be seen as evidence
that a market exists and as such FDI might be attracted to the local economy. Put differently,
evidence of a rise in imports in a local country could justify the investment and production of MNEs.
The importance of also taking manufacturing imports into consideration when investigating the
relationship between FDI and manufacturing exports as per Ahmed et al. (2010), Anwar and
Nguyen (2011b) and Pacheco-Lopez (2005) is therefore appropriate for South Africa.
Stellenbosch University http://scholar.sun.ac.za

27
3.3 EXPORT PROMOTION
In South Africa, the DTI’s trade and investment support body, Trade and Investment South Africa
(TISA), aims to increase export capacity and support direct investment flows through strategies
directed at targeted markets by managing a network of foreign trade offices (Republic of South
Africa, 2012). The four business units that comprise TISA are:
Investment Promotion and Facilitation
Export Promotion
Export Development
Foreign Service Management.
The export promotion directorate’s promotion offerings include market intelligence and advice,
trade-lead facilitation and in-market support, trying to facilitate exports by matching potential
exporters and buyers and administrating an incentive scheme, Export Marketing & Investment
Assistance Scheme (EMIA), that will partially compensate exporters for certain costs incurred
when products and services are marketed abroad. The following assistance is provided under the
EMIA scheme (Van Aarde, 2007:53):
National Pavilions
Individual Exhibitions
Primary Export Marketing Research Scheme
Foreign Direct Investment Research Scheme
Sector Specific Assistance
Outward Selling Trade Missions
Outward Investment Recruitment Missions
Inward Buying Trade Missions
Inward investment Missions.
According to the DTI, eligible enterprises are South African manufacturers and exporters, export
trading houses and commission agents from South Africa that represent at least three SMMEs or
businesses owned by previous disadvantaged individuals as well as South African export councils
and industry associations that represent a minimum of five local entities. In the manufacturing
sector, examples of industry-based export councils are the Automotive Industry Export Council
(AIEC) and the SA Textile Industry Export Council (SATIEC).
Van Aarde (2007) aimed to determine the return on investment (ROI) for national pavilions and
trade missions which were the largest programmes under the EMIA scheme. It was found that ROI
per sector for these export promotion programmes produced positive results. However, in order to
Stellenbosch University http://scholar.sun.ac.za
28
achieve sustainable export growth, the DTI would have to develop new evaluation criteria as well
as focus more on the manufacturing and services industries.
The Van Aarde (2007:92) study recommended that the DTI should establish a permanent
evaluation unit that would incorporate international best practices regarding export promotion
evaluations. The evaluation unit should be aligned with the department’s strategic objectives for if
programmes are to be managed effectively, they would have to be monitored appropriately.
Optimal resource allocation and policies targeted at higher value added programmes would follow.
Related to appropriate evaluation, Van Eldik and Viviers (2005:1) commented that many South
African companies experience difficulty in entering export markets and achieving sustainable
export growth. They stated that a possible reason is that companies are not export ready. It was
further noted that export promotion programmes in South Africa were based on results obtained
from export readiness questionnaires that were not scientifically designed and as a result should
not be used to gauge the export readiness of the evaluated companies.
For African countries new opportunities abound as the promise of international entrepreneurship is
enhanced due to the economic successes of Brazil, China and India. These countries have also
been described as the ‘southern engines of growth’ in the world economy (Pearson, Viviers,
Cuyvers & Naude, 2010:355).
By employing a decision support model (DSM) and adapting the context to South Africa, Pearson
et al. (2010:355) found that the results from the DSM suggested significant potential for further
exports to China and India, and to a lesser extent, Brazil. Export promotion activities in these
emerging markets should not be neglected. In Figure 3.2 the overall growth in exports to Brazil,
China and India is indicated.
Stellenbosch University http://scholar.sun.ac.za

29
Figure 3.2: South African exports to Brazil, China and India
Source: Pearson et al., 2010:348.
Pearson et al. (2010:347) noted that export growth to these three countries was relatively similar
up to 1999, from when export growth to China and India accelerated. Up to 2002, the higher export
growth to China and India was almost similar after which export growth to China increased faster.
The faster export growth to China does remind one of the South African Trade and Industry
Minister’s signing of the Comprehensive Strategic Partnership with China in 2010 and the South
African Government’s appeal to China to increase its imports of value-added products in order to
improve the current structure of trade between the two countries.
Stellenbosch University http://scholar.sun.ac.za

30
Figure 3.3: South Africa’s exports to Brazil, China and India as a percentage of total exports
Source: Pearson et al., 2010:347.
From Figure 3.3, it can be seen that South Africa’s relative presence is still small in the said
countries. Pearson et al. (2010:356) reported that because of a larger private sector involvement
through sectorial associations and export councils, a different blend of export instruments would be
needed in order to implement an offensive market expansion strategy. These instruments could for
example be incentives for participating in sectorial trade fairs and targeting press campaigns in the
local press.
3.4 CHAPTER SUMMARY
The chapter provided an overview of FDI, manufacturing sector and export promotion in South
Africa. It has been noted that the manufacturing sector is key for government in terms of job
creation potential. The sector’s current relatively low profitability is worrying and the chapter
highlighted the different performances at sub-sector level. Recent trends regarding South African
FDI were discussed. FDI inflows in South Africa have recently been disappointing and more
greenfield investments rather than mergers and acquisitions are required to facilitate job creation.
FDI manufacturing stock levels in recent years have trended upwards. Also noted was that no
specific and coherent FDI policy exists. The proposed new legal framework for FDI in South Africa
is welcomed.
Stellenbosch University http://scholar.sun.ac.za

31
CHAPTER 4
RESEARCH METHODOLOGY
4.1 DATA COLLECTION
The empirical literature review has revealed that FDI flow data and FDI stock data have been
mostly used as variables for FDI. FDI flow data is available in quarterly figures, but only in
aggregated form, i.e. there is no quarterly data available according to economic activity, for
instance manufacturing (Swart, 2012).
Further complicating the usability of FDI data was that according to Naidoo (2012), the South
African Reserve Bank (SARB) only started measuring FDI manufacturing stock data from 1997.
Therefore, with annual FDI manufacturing stock data having been obtained from 1997–2010, the
ensuing time series only had 14 data points that could hamper meaningful analysis. Dlamini and
Fraser (2010:60) sought to overcome the limitation of only having annual FDI stock data available
in the agricultural sector by deriving quarterly figures by using mainly the GDP of the agricultural
sector and a model suggested by Nijman and Palm (1986).
Employing the aforementioned method with regards to the current research project was
considered. However, it was decided to use aggregated quarterly FDI flow data for econometric
analysis and then use disaggregated FDI stock data for additional non-econometric analysis on the
variations rather than using interpolation or model-based approaches to account for the missing
quarterly observations. Aggregated quarterly FDI flow data was therefore also obtained from the
SARB and quarterly data for manufacturing exports and – imports were obtained from the DTI.
Data for the previous mentioned three variables were obtained from 1994–2011.
For the econometric analysis the data was transformed to natural logarithms to ease interpretation.
By using natural logarithms the relative change instead of the level change could be observed.
Another advantage of using natural logarithms is that data could possibly be made normal and the
variances decreased.
4.2 DATA ANALYSIS
The related literature review has revealed that FDI, manufacturing exports and manufacturing
imports are related. In addition, a complementary relationship between FDI and exports is
predicted by an export platform model (Abor et al., 2008:452). The following causality relationships
are to be tested in a bivariate setting:
FDI ↔ EXP
FDI ↔ IMP
Stellenbosch University http://scholar.sun.ac.za

32
Where,
FDI is the aggregated FDI flow data;
EXP is manufacturing exports;
IMP is manufacturing imports;
Time series data of FDI in the manufacturing sector, manufacturing exports and manufacturing
imports is relevant for the current study and thus had to be considered when choosing the
appropriate method. Based on the theoretical and empirical literature review, it is expected that FDI
and trade hold some long-run relationship. Therefore, possible cointegrating relationships may
exist.
As the direction of causality between FDI and manufacturing trade is of interest for the current
research project, Granger causality tests had to be employed. The causality test method to use
depends on the stationarity or not of the time series, and if non-stationary whether the time series
are cointegrated or not (Aziakpono, 2008:200). According to Bashier and Bataineh (2007:12), if the
test results determine that the variables are integrated of order one and not cointegrated, a
Granger causality test should be implemented using the first differences of the variables. They
further posited that should the variables be stationary and cointegrated, an error correction model
should be used.
4.2.1 Model
The letter L denotes the natural logarithm.
LFDI = a + a LEXP +
LFDI = a + a LIMP +
Where,
LFDI is the aggregated FDI flow data;
LEXP is manufacturing exports;
LIMP is manufacturing imports.
The a priori assumptions are that manufacturing exports have an associated effect on FDI and
manufacturing imports also have an associated effect on FDI.
4.2.2 Stationarity
Apart from whether a model should be estimated using a single equation approach or a systems
estimator, it is also important to consider the underlying properties of the processes involved when
generating the time series variables (Harris, 1995:14). The problem of spurious regression can
result from models containing non-stationary variables that would suggest a statistical significant
Stellenbosch University http://scholar.sun.ac.za

33
relationship in the regression model when all that was actually obtained was proof of
contemporaneous correlations rather than any causal relationship (Harris, 1995:14).
Furthermore, if a time series is non-stationary, one can only study its behaviour for a particular
period and as a consequence generalisation to other time periods and forecasting may be of little
practical value (Gujarati & Porter, 2009:741). Brooks (2008:320) stated that when non-stationary
variables are used in a regression model, it can be proven that standard assumptions concerning
asymptotic analysis will not be valid. Put differently, the t-statistics will not conform to a t-
distribution and likewise the F-statistic will not follow an F-distribution.
Practically, if we want to understand the relationship between variables using regression analysis
for time series data, some sort of stability over time is required (Wooldridge, 2009:379). Hence, a
natural starting point for time series data analysis would be to test for stationarity of the particular
time series involved (Aziakpono, 2008: 198). Wooldridge (2009:378) contended that the notion of
stationarity has played an important part when analysing time series data and defined a stationary
time series process as one where the probability distributions are stable over time. Gujarati and
Porter (2009:741) stated that if a time series is stationary, the mean, variance and auto covariance
(at different lags) will remain the same irrespective at what point they are measured. Thus, time
invariant.
If a non-stationary time series has to be differenced d times in order to induce stationarity, the time
series is said to be integrated of order d, I(d) (Brooks, 2008:326; Gujarati & Porter, 2009:747;
Harris, 1995:22). A stationary time series is said to be integrated of order zero, I(0), and according
to the authors, the majority of economic and financial time series are integrated of order one, I(1),
meaning that these time series normally become stationary only after taking their first differences.
By differencing I(1) variables before using them in linear regression models is a safe course to
follow, but by always differencing I(1) variables, the scope of the questions that can be answered is
being limited (Wooldridge, 2009:637). Gujarati and Porter (2009:760) also cautioned that when
transforming a non-stationary time series to make it stationary, the transformation method used will
depend on whether the time series is difference stationary or trend stationary. The authors pointed
out that if a difference stationary time series is treated as trend stationary then under-differencing
will occur and if a trend stationary series is treated as difference stationary then over-differencing
will result.
The unit root test is a test of stationarity (or non-stationarity) that has become popular in recent
years (Gujarati & Porter, 2009:754). Early pioneering work for unit root testing in time series data
was done by Dickey and Fuller and the Dickey-Fuller(DF) tests are also known as τ (tau) tests with
these authors having computed the critical values of the τ-statistic through Monte Carlo simulations
Stellenbosch University http://scholar.sun.ac.za

34
(Gujarati & Porter, 2009:755). These tests can be conducted to allow for an intercept, or intercept
and deterministic trend, or neither when applying the test regression (Brooks, 2008:327).
The DF test assumed that the error term was uncorrelated, but if that is not the case Dickey and
Fuller have developed another test known as the augmented Dickey-Fuller(ADF) test where the
lagged values of the dependent variable are added (Gujarati & Porter, 2009:757). A problem that
now arises is determining the optimal number of lags to be included (Brooks, 2008:329). If too few
lags are included not all of the autocorrelation will be removed and with too many lags the
coefficient of the standard errors will be increased.
Brooks (2008:329) suggested using two simple rules of thumb to determine the optimal lag length.
Firstly, the frequency of the data can be used so that if the data were quarterly, four lags would be
used and so forth. Secondly, information criterion such as Akaide, Schwarz and other could be
used. Gujarati and Porter (2009:757), in demonstrating an ADF-regression, used quarterly data
and then decided to use four lags.
4.2.3 Cointegration
If a linear combination of I(1) variables become I(0), the variables are said to be cointegrated
(Brooks, 2008:336). The linear combination therefore becomes stationary. Put differently, the linear
combination has cancelled out the stochastic trends in the respective time series (Gujarati &
Porter, 2009:762). Cointegration therefore makes regressions with I(1) variables potentially useful
(Wooldridge, 2009:637).
Many non-stationary time series display a characteristic of “moving together” over time which
would imply that the two series are bound in the long run by some relationship. The cointegrating
relationship is also said to be an equilibrium phenomenon for it is possible for the cointegrating
variables to deviate in the short run, but their long run relationship or association would return
(Brooks, 2008:336).
For Harris (1995:25), when non-stationary time series is involved, the cointegration concept is
synonymous with equilibrium. Further noted was that a failure to establish cointegrating
relationships would often lead to spurious regressions that would not be indicative of a long-run
economic relationship, but rather be a reflection of trends contained in the non-stationary time
series. Authors often cite Granger (1986) who aptly described a test for cointegration as a pre-test
to avoid situations where spurious regressions may result (Dlamini & Fraser, 2010:62; Gujarati &
Porter, 2009:762).
A comparatively simple method to test for cointegration is to estimate a regression, obtain the
residuals and use DF or ADF tests (Gujarati & Porter, 2009:763). However, caution should be
exercised since a test employed on the residuals of a model would change the critical values
Stellenbosch University http://scholar.sun.ac.za

35
compared to a DF or ADF test. These new critical values have been calculated by Engle and
Granger and the DF and ADF tests are now known as the Engle-Granger(EG) and augmented
Engle-Granger(AEG) tests (Gujarati & Porter, 2009:763). According to Brooks (2008:340), the
Phillips-Perron (PP) unit root test for non-stationarity of the residuals can also be used.
4.2.4 Error Correction Model (ECM)
As has been stated, if time series were cointegrated, there would be a long-term or equilibrium
relationship. In the short run there may be disequilibrium and the ECM that was popularised by
Engle and Granger would correct for this disequilibrium (Gujarati & Porter, 2009:764). The authors
noted that an important theorem, the Granger representation theorem, stated that if variables Y
and X were cointegrated, an ECM could be used to express the relationship between the variables.
An ECM would thus enable one to investigate the short-run dynamics in the relationship between Y
and X (Wooldridge, 2009:643). Harris (1995:25) concluded that cointegration and short-run ECM
provided a useful link in short- and long-run approaches to econometric modelling.
An ECM overcomes the problem of only using first differences (e.g. limited scope and equilibrium
relationship not investigated) by using a combination of first differences and lagged levels of
cointegrated variables (Brooks, 2008:338). The following equation is an example of an ECM:
( )
If and are cointegrated with cointegrating coefficient γ then( ), the error
correction term will be I(0) even though the other parts are I(1) (Brooks, 2008:338). OLS and other
statistical inference procedures are valid to use.
4.3 CHAPTER SUMMARY
To summarise, economic time series are involved that according to Brooks (2008:326) would
suggest non-stationarity. A unit root test would be conducted to confirm the suspected non-
stationarity or not. Following the unit root test the time series was tested for cointegration after
which the appropriate causality test method was employed. If cointegration was found, an ECM
was used.
Stellenbosch University http://scholar.sun.ac.za

36
CHAPTER 5
RESULTS
5.1 STATIONARITY
In Figure 5.1 the time series are plotted in order to obtain a glimpse of the growth rate of the
respective series. It appears that the LEXP and LIMP are trending upwards which could suggest
that the mean of LEXP and LIMP have been changing with the series perhaps being non-
stationary. The trend in LFDI is less apparently upwards than the other two series but could have a
stochastic trend and thus also possibly be non-stationary containing unit root processes.
Figure 5.1: Quarterly logarithms of FDI, EXP and IMP, South Africa, 1994–2011
The ADF test is used to test for stationarity. For this research report the test was used to test for
the existence of unit root processes in two cases: with an intercept only and with an intercept and a
trend. The null hypothesis stated that the respective time series has a unit root. Hence, if the ADF
test statistic is less (in absolute value) than the critical value, the null hypothesis of a unit root
cannot be rejected and it can be concluded that the time series is non-stationary at levels. Table
5.1 presents the results of the unit root tests for LFDI, LEXP and LIMP for their levels.
2
4
6
8
10
12
14
1994 1996 1998 2000 2002 2004 2006 2008 2010
LEXPORTS LFDI LIMPORTS
Stellenbosch University http://scholar.sun.ac.za

37
Table 5.1: ADF test results
Variable Intercept Trend and intercept
LFDI -1.547 (-2.981) -2.475 (-3.595)
LEXP -1.512 (-2.909) -2.243 (-3.478)
LIMP -0.890 (-2.911) -3.014 (-3.478)
Parenthesis () denote test critical values at 5% level of significance.
The results reported for LEXP (both intercept only and intercept and trend) and LIMP (intercept
only) used Akaike’s information criterion to automatically select the appropriate lag length in
EViews. If Schwarz’s information criterion had been used, the conclusions from those results would
have been the same. For LIMP (intercept and trend), the Akaike – and Schwarz’s information
criterion respectively used generated results from which different conclusions would be made. It
was therefore decided to run the ADF test again and since quarterly data was used to employ four
lags and that result is reported in Table 5.1.
Concerning LFDI (both intercept only and intercept and trend), when the natural logarithm of the
variable was taken, missing observations for some periods were generated as a logarithm for a
negative value cannot be generated. That has meant that the automatic selection option using the
chosen information criterion could not be used and thus it was also decided to run the ADF test
using four lags and that result is reported in Table 5.1.
The results presented in Table 5.1 indicate that at a five percent level of significance, the null
hypothesis of a unit root cannot be rejected for all three variables (both intercept only and intercept
and trend) and it can be concluded that the three time series are non-stationary at their levels.
In order to determine the stationary property of the three time series, the ADF test was also applied
to the first differences as presented in Table 5.2.
Table 5.2: ADF test results for first differences
Variable Intercept Trend and intercept
LFDI -2.812 (-3.012) -2.506 (-3.645)
LEXP -3.981 (-2.906) -4.356 (-3.479)
LIMP -3.849 (-2.911) -3.878 (-3.487)
Parenthesis () denotes test critical values at 5% level of significance.
The results reported for LIMP (both intercept only and intercept and trend) and LEXP (intercept
only) used Akaike’s information criterion to automatically select the appropriate lag length in
Stellenbosch University http://scholar.sun.ac.za

38
EViews. If Schwarz’s information criterion had been used, the conclusions from those results would
have been the same. For LEXP (intercept and trend), the Akaike – and Schwarz’s information
criterion respectively used generated results from which different conclusions would be made. It
was therefore decided to run the ADF test again and quarterly data was used to employ four lags
and that result is reported in Table 5.2. LFDI was reported using four lags.
The results presented in Table 5.2 indicate that at a five percent level of significance, the null
hypothesis of a unit root can be rejected for LEXP and LIMP (both intercept only and intercept and
trend) and it can be concluded that the two time series are stationary at first differences. The null
hypothesis of a unit root cannot be rejected for LFDI and it can be concluded that the LFDI time
series is still a non-stationary series, even at a first difference level. This implies it may be an I(2)
series, however, the problems with missing data generation could account for this.
5.2 COINTEGRATION
In Figure 5.2 and Figure 5.3 the long run equations are estimated. In Figure 5.2 LEXP is
statistically significant at a one percent level of significance. A one percent change in LEXP has a
2.8 percent associated increase, on average, on LFDI, ceteris paribus. In Figure 5.3 LIMP is
statistically significant at a one percent level of significance. A one percent change in LIMP has a
3.09 percent associated increase, on average, on LFDI, ceteris paribus.
Dependent Variable: LFDI
Method: Least Squares
Date: 09/07/12 Time: 09:48
Sample: 1994Q1 2011Q4
Included observations: 63 Variable Coefficient Std. Error t-Statistic Prob. C -19.47850 7.733037 -2.518868 0.0145
LEXPORTS 2.806376 0.833647 3.366383 0.0013
TIME -0.055464 0.028555 -1.942373 0.0568
Figure 5.2: Regression of LFDI and LEXP
Dependent Variable: LFDI
Method: Least Squares
Date: 09/07/12 Time: 09:49
Sample: 1994Q1 2011Q4
Included observations: 63 Variable Coefficient Std. Error t-Statistic Prob. C -23.58602 11.10894 -2.123156 0.0379
LIMPORTS 3.092858 1.140214 2.712523 0.0087
TIME -0.059641 0.036671 -1.626407 0.1091
Figure 5.3: Regression of LFDI and LIMP
Stellenbosch University http://scholar.sun.ac.za

39
To test for cointegration, a regression between LFDI and LEXP and between LFDI and LIMP both
with a time trend would be run respectively and then a unit root test would be performed on the
residuals. Under the null hypothesis a unit root exists in the potentially cointegrating regression
residuals while the alternative hypothesis would state that the residuals are stationary. If the null
hypothesis of a unit root can be rejected, there would be evidence of a cointegrating relationship.
Null Hypothesis: S has a unit root
Exogenous: None
Bandwidth: 4 (Newey-West automatic) using Bartlett kernel Adj. t-Stat Prob.* Phillips-Perron test statistic -7.692528 0.0000
Test critical values: 1% level -2.608490
5% level -1.946996
10% level -1.612934 *MacKinnon (1996) one-sided p-values.
Figure 5.4: PP unit root test on S (residuals of regression of LFDI and LEXP)
Null Hypothesis: S1 has a unit root
Exogenous: None
Bandwidth: 4 (Newey-West automatic) using Bartlett kernel Adj. t-Stat Prob.* Phillips-Perron test statistic -7.540231 0.0000
Test critical values: 1% level -2.608490
5% level -1.946996
10% level -1.612934 *MacKinnon (1996) one-sided p-values.
Figure 5.5: PP unit root test on S1 (residuals of regression of LFDI and LIMP)
Evident from Figure 5.4 and Figure 5.5 is that the absolute value of the test statistic is greater than
any of the critical values and as such the null hypothesis in both cases can be rejected. It is
concluded that the estimated residuals in both cases are stationary. Therefore, LFDI and LEXP,
and LFDI and LIMP and vice versa are cointegrated, implying a long-run relationship exists
between the two sets of variables.
5.3 ECM
As the previous test results have indicated cointegration between the two sets of variables, an
ECM can be used in order to ascertain the direction of Granger causality.
Stellenbosch University http://scholar.sun.ac.za

40
Table 5.3: Causality test results based on the significance of ECM coefficient
Dependent variable ΔLFDI
Variable Coefficient t-Stat R² DW
ΔLEXP 1.443 1.070 0.52 2.08
ECT -0.875(0.000)* 7.429
Dependent variable ΔLFDI
ΔLIMP 1.091 0.680 0.51 2.12
ECT -0.835(0.000)* 7.229
Dependent variable ΔLEXP
ΔLFDI 0.015 1.070 0.03 1.87
ECT 0.019(0.255) 1.152
Dependent variable ΔLIMP
ΔLFDI 0.008 0.680 0.02 1.62
ECT 0.015(0.302) 1.044
Parenthesis () denotes p-values. DW=Durbin-Watson stat. * denotes significance at 1% level. Δ denotes first
differenced data.
The focus in the ECM is the sign and statistical significance of the error correction coefficient. The
error correction coefficient is expected to be negative. The results in Table 5.3 indicate that the
effect of LEXP on LFDI and LIMP on LFDI is statistically significant and the error correction
coefficient is negative. These two empirical regressions’ ECMs are as follows:
ΔLFDI = 0.130017 + 1.443020ΔLEXP – 0.874523( )
ΔLFDI = 0.133836 + 1.090648ΔLIMP – 0.83484( )
The effect of LEXP on LFDI would suggest that LFDI adjusts to LEXP with a lag. The speed of
adjustment from short-run discrepancy to correction to long-run equilibrium is very fast with
87.5percent of the discrepancy corrected within a quarter. Regarding the effect of LIMP on LFDI,
the results would suggest that LFDI about 83 percent of the discrepancy from short-term to long-
term equilibrium is corrected within a quarter. The estimation results of the ECM therefore indicate
that a causality relationship runs from LEXP to LFDI and from LIMP to LFDI.
5.3.1 Granger causality
In Figure 5.6 and Figure 5.7 simple Granger causality tests are employed to investigate the
possibility of bi-directional causality between LFDI and LEXP and between LFDI and LIMP. In
Stellenbosch University http://scholar.sun.ac.za

41
Figure 5.6 the hypothesis that LEXP does not (Granger) cause LFDI is rejected at a five percent
level of significance. Hence, LEXP does (Granger) cause LFDI and it is therefore concluded that
the direction of causality runs from LEXP to LFDI. In Figure 5.7 the hypothesis that LIMP does not
(Granger) cause LFDI is rejected at a one percent level of significance. Hence, LIMP does
(Granger) cause LFDI and it is therefore concluded that the direction of causality runs from LIMP to
LFDI. No evidence of bi-directional causality is found and the simple Granger causality test results
confirm the causality test results based on the significance of the ECM coefficient.
Pairwise Granger Causality Tests
Date: 09/07/12 Time: 10:35
Sample: 1994Q1 2011Q4
Lags: 2 Null Hypothesis: Obs F-Statistic Prob. LEXPORTS does not Granger Cause LFDI 46 5.11764 0.0104
LFDI does not Granger Cause LEXPORTS 0.18010 0.8358
Figure 5.6: Granger causality test of LFDI and LEXP
Pairwise Granger Causality Tests
Date: 09/07/12 Time: 10:35
Sample: 1994Q1 2011Q4
Lags: 2 Null Hypothesis: Obs F-Statistic Prob. LIMPORTS does not Granger Cause LFDI 46 5.69908 0.0065
LFDI does not Granger Cause LIMPORTS 0.96657 0.3889
Figure 5.7: Granger causality test of LFDI and LIMP
5.4 NON-ECONOMETRIC ANALYSIS OF MANUFACTURING LEVEL DATA
The econometric analysis performed in the previous sections used aggregated quarterly FDI flow
data in order to obtain a suitable sample size. With no disaggregated FDI flow data available in
quarterly form, disaggregated annual FDI stock data for the manufacturing sector in total could be
obtained from 1997–2010. Table 5.4 provides the descriptive statistics. Figure 5.4 provides the
trend of the disaggregated FDI manufacturing stock data for the period while Figure 5.5 compares
the aforementioned trend with the annual manufacturing exports and – imports’ trend.
Stellenbosch University http://scholar.sun.ac.za

42
Table 5.4: Descriptive statistics
FDI Exports Imports
Mean 128048.4 198972.2 286594.7
Median 100398.5 181686.3 243547.9
Maximum 262290.0 404211.3 563779.8
Minimum 34688.0 69740.39 107462.6
Std.Dev 74347.14 101423.9 150202.1
Skewness 0.512173 0.479219 0.461223
Kurtosis 1.954767 2.270406 1.860840
From Figure 5.8 and Figure 5.9 it can be seen that manufacturing FDI stock has trended steadily
upwards, apart from 2002. The effect of the global financial crisis in 2009 on manufacturing exports
and – imports is further apparent. The standard deviation of the FDI manufacturing stock data is
smaller than the standard deviations of the other two variables implying that the variance of the FDI
stock data have been smaller than the variances of manufacturing exports and – imports. The FDI
stock data appear to move along with the other variables over time and the correlation coefficient
would be of interest. Whilst FDI may be lagging the other variables, it has a more steady
movement upwards over the period.
Figure 5.8: Annual manufacturing FDI stock data, 1997–2010 (Rmillions)
0
40,000
80,000
120,000
160,000
200,000
240,000
280,000
97 98 99 00 01 02 03 04 05 06 07 08 09 10
FDI
Stellenbosch University http://scholar.sun.ac.za

43
Figure 5.9: Annual manufacturing stock data, manufacturing exports and manufacturing
imports, 1997–2010 (Rmillions)
Table 5.5 presents the correlation coefficients.
Table 5.5: Correlation coefficient
FDI and EXP 0.899462
FDI and IMP 0.923832
In both instances evidence is found of a strong positive relationship between the respective
variables. Care should be taken not make any causal inferences since these are only degrees of
association effects.
5.5 DISCUSSION
The findings of the research report differ from the findings of Ahmed et al. (2010) which found the
Granger causality running from FDI to total exports in South Africa. In Mexico, Pacheco-Lopez
(2005) reported bi-directional causality between FDI and exports and between FDI and imports
respectively. Dlamini and Fraser (2010) reported bi-directional causality between FDI and exports
in the South African agricultural sector. The current findings are supported by the Bezuidenhout
and Naude (2008) study that investigated 20 SADC countries and found that the Granger causality
test results indicated in all of the 20 countries that trade caused FDI.
0
100,000
200,000
300,000
400,000
500,000
600,000
97 98 99 00 01 02 03 04 05 06 07 08 09 10
EXPORTS FDI IMPORTS
Stellenbosch University http://scholar.sun.ac.za

44
Pacheco-Lopez (2005:1170) explained the causality running from exports to FDI that as MNEs
start trading in foreign markets and after learning more about local conditions, i.e. economic,
social, political and the ruling conditions of their trading partners, these MNEs may open
subsidiaries in the local country or opt for joint ventures with local firms that would result in FDI
inflows. Regarding the causality running from imports to FDI, Pacheco-Lopez (2005:1171) stated
that imports could be seen as evidence of the existence of a market in a host country and as such
FDI might be attracted to that country in order to produce that product domestically.
With the findings revealing that the causal relationship running from LEXP to LFDI, the DTI’s trade
and investment support body, TISA’s aim of increasing export capacity through business units
focussing on export promotion and export development is vindicated. The development trade
policies of the NGP that seek to promote exports are encouraging.
Regarding South Africa’s current export promotion policies, the research report findings highlight
the need for having industry-based export councils within the manufacturing sector. With the
manufacturing sector currently under pressure, the DTI should investigate how the EMIA scheme
can be made more accessible for these councils. Van Aarde’s (2007:92) recommendation of
having a permanent evaluation unit within the DTI that would incorporate export promotion best
practices should be implemented.
5.6 CHAPTER SUMMARY
The chapter presented the results of the research report. ADF tests were performed in order to
ascertain the stationary properties of the time series involved and after finding that the respective
series contained unit root processes, tests for cointegration were conducted. It was found that LFDI
and LEXP as well as LFDI and LIMP and both vice versa were cointegrated, implying a long-run
relationship between the two sets of variables. An ECM was employed to ascertain Granger
causality and it was found that a causal relationship runs from LEXP to LFDI and from LIMP to
LFDI. Simple Granger causality test results confirmed the causality test results based on the
significance of the ECM coefficient. Additional non-econometric analysis of the disaggregated data
was also performed revealing a strong positive correlation between FDI and EXP and FDI and
IMP.
Stellenbosch University http://scholar.sun.ac.za
45
CHAPTER 6
CONCLUSION
6.1 SUMMARY
The importance of international capital flows has increased as a result of the globalisation and
regionalisation of economies (Bezuidenhout & Naude, 2008:1). In recent years South Africa has
started to embark on policies to increase FDI and export flows. The importance of the
manufacturing sector for job creation has also been highlighted in policy documents such as the
NGP and IPAP2. Examining the link between FDI and manufacturing exports was the essence of
the research report. However, the empirical literature has highlighted the need to take into account
imports as well when investigating the said relationship.
FDI inflows to South Africa have been disappointing in recent years compared to FDI inflows to
other developing countries. The relatively low profitability of the country’s manufacturing sector is
an area of concern and the sector displayed heterogeneous performances at sub-sector level. As
yet, no specific and coherent FDI policy in South Africa exists. Export promotion in South Africa is
mainly facilitated through the DTI’s trade and investment support body, TISA.
According to Bezuidenhout and Naude (2008:3) the relationship between FDI and trade has not
been adequately addressed in African literature. A complementary relationship between FDI and
host country exports is predicted by an export platform model (Abor et al., 2008:452). The key
message obtained from the related empirical literature review suggested that FDI and
manufacturing exports are related.
The objective of the research was to investigate the relationship between FDI and manufacturing
trade in South Africa. The research report therefore contributed towards understanding the
aforementioned relationship in South Africa seeing that there is a lack of empirical studies in that
regard. The author of the research report is not aware of another study that focuses on the
FDI/trade relationship specifically in the manufacturing sector of South Africa.
Aggregated quarterly FDI flow data as well as quarterly manufacturing exports and – imports from
1994–2011 were the three time series of interest. Causality relationships between FDI and
manufacturing exports as well as between FDI and manufacturing imports were tested in a
bivariate setting.
Unit root tests of stationarity were performed on the respective time series and it was found that
the included variables were non-stationary at their levels, but stationary at first differences. Tests of
cointegration revealed that FDI and manufacturing exports as well as FDI and manufacturing
Stellenbosch University http://scholar.sun.ac.za

46
imports and vice versa were cointegrated, implying a long-run relationship between the two sets of
variables.
Causality tests based on the significance of the ECM coefficient revealed a causal relationship
running from manufacturing exports to FDI and from manufacturing imports to FDI. A simple
Granger causality test between the two sets of variables confirmed the aforementioned finding.
Non-econometric analysis of disaggregated data using total FDI manufacturing stock as variable
revealed a strong positive correlation between FDI and manufacturing exports as well as between
FDI and manufacturing imports.
Bezuidenhout and Naude (2008) stated that for developed countries, most of the evidence
suggested that FDI causes trade and that little FDI is being caused by trade. The results of the
research project therefore suggest that in the case of South Africa FDI can be caused by trade. Put
differently, exports and imports of the manufacturing sector matter in the locational inflows of FDI in
South Africa.
6.2 DISCUSSION
The South African Government’s proposed new legal framework for FDI is welcomed seeing that
no specific and coherent policy on FDI exists. A long-term and consistent policy environment is
necessary in order to promote South Africa as a foreign investment destination. A single legal
framework governing all forms of investment is desirable as a repeat of the Walmart-Massmart
merger where Ministers from three different departments filed papers with the Competition Appeal
Court should be avoided. Incentives regarding FDI must be rules based and not on discretion
(Ruane, 2008:73). The new legal framework on FDI should include local procurement policies in
order for the supply chains of local providers to be extended. This could enhance the country’s
ability to compete against imports.
Closely related to the aforementioned point is Moeti’s (2005:167) recommendation of having a
coordinating body or institution that would be tasked with overseeing all legislation and policies
relating to FDI. This coordinating body would be able to ease administrative oversight between
government departments and it is recommended that this coordinating body be housed within the
DTI as the DTI already has a trade and investment support body, TISA. Seeing that challenges
identified for smaller economies were calculating benefits and costs associated with FDI as well as
the ability to demonstrate how FDI would aid in economic development, this coordinating
institution’s role could be enhanced to help overcome these challenges.
With the European Union, as South Africa’s largest regional source of FDI, embroiled in economic
turbulence, more investment from BRIC countries should be sought. In addition, South Africa’s
exports to the BRIC countries are still small in relation to total exports. Hence, considerable scope
Stellenbosch University http://scholar.sun.ac.za

47
for trade and investment opportunities exists. The importance of BRIC countries increasing their
imports of value-added products is essential in any trade and investment negotiations.
The need to invest more resources in order to upgrade the country’s human capital has never been
more urgent. As skilled workers are hard to come by, labour force training and re-training should
remain a high priority on the economic development policy agenda. The enhancement of the host
country’s labour force competence must be complemented by any FDI incentive package (Ruane,
2008:73).
The controversial issue of labour markets being inflexible in South Africa has a bearing on the
country’s manufacturing sector. For instance, in the struggling clothing and textile industry under
pressure from workers, the South African Clothing and Textile Workers Union agreed with industry
to offer 30 percent lower entry-level wages (Lund, 2011c:28). This agreement was rightly hailed in
the press as this particular industry faces a host of challenges including competition from legal and
illegal imports. This type of collaboration between unions and industry should be sought in other
struggling industries within the manufacturing sector.
Infrastructure upgrading is paramount for South Africa to attract substantial FDI inflows.
Government’s recently established Presidential Infrastructure Coordinating Commission being
chaired by President Zuma is welcomed.
According to Sello (2007:46), the notion that FDI can facilitate technology and knowledge spillover
in host countries is widely accepted although the benefit seen in Africa has been limited. Increased
competition for FDI and African countries’ limited bargaining power with large MNEs has made it
difficult for local governments to demand some form of performance requirement from MNEs that
would ensure that the local economy receives the benefits from FDI. Sello (2007:47)
recommended that African countries should pool their resources and align investment policies and
regulatory environments. Regional trade blocks should take the lead and address these issues.
Although greater regional collaboration would benefit South Africa as well, South Africa should
already leverage its position as dominant economy in Africa and its natural resources to demand
greater performance requirements from MNEs, such as requiring specific investment in certain
industries within the manufacturing sector.
6.3 RECOMMENDATIONS
Since the performance of manufacturing exports stimulates more FDI inflows to the country, the
South African government should encourage FDI policies that have an export component or export
strategy. This could attract more FDI inflows that would close the investment gap in the
manufacturing sector.
Stellenbosch University http://scholar.sun.ac.za

48
6.4 LIMITATIONS OF THE STUDY AND POSSIBLE FUTURE RESEARCH
As has been pointed out in the research methodology chapter, total aggregated FDI flow data was
used in the econometric analysis as opposed to using the more appropriate FDI flow data within
the manufacturing sector, if this data had been available. Another limitation was the sample size of
the disaggregated data, i.e. annual FDI stock in the manufacturing sector, used in the non-
econometric analysis.
In addition, considering the scope of the research report, the study was conducted in a bivariate
setting. Ahmed et al. (2010:17) stated that a multivariate causality setting could be more reliable
seeing that in a bivariate causality framework omitted variable bias may exist. Ahmed further stated
that relationships may be more complex than only a two-way causation. In a multivariate
framework, the possibility of multiple cointegrating relationships may also be uncovered through
the use of a systems approach to cointegration.
Possible future empirical research could investigate reasons for the heterogeneous performance at
sub-sector level within the manufacturing sector and the corresponding link between investment
and trade.
Stellenbosch University http://scholar.sun.ac.za

49
REFERENCES
Abor, J., Adjasi, C.K.D. & Hayford, M. 2008. How does foreign direct investment affect the export
decisions of firms in Ghana? African Development Review, 20(3), 446-465.
AbuAl-Foul, B.M. & Soliman, M. 2008. Foreign direct investment and LDC exports. Emerging
Markets Finance & Trade, 44(2), 4-14.
African Economic Outlook. 2011. Data & Statistics. [Online] Available:
www.africaneconomicoutlook.org Accessed: 13 July 2011.
Ahmed, A.D., Cheng, E. & Messinis, G. 2010. The role of exports, FDI and imports in development:
New evidence from Sub-Saharan African countries. Applied Economics, 43(26), 3719-3731.
Aizenman, J. & Noy, I. 2006. FDI and trade – Two-way linkages? The Quarterly Review of
Economics and Finance, 46(3) 317-337.
Ajayi, S.I. 2006. Foreign Direct Investment in Sub-Sahara Africa: Origins, Targets, Impact and
Potential. In Ajayi, S.I. (ed.) The determinants of foreign direct investment in Africa: A survey of the
evidence. Nairobi: African Economic Research Consortium, 11-32.
Akinboade, O.A., Siebrits, F.K. & Roussot, E.N. 2006. Foreign Direct Investment in Sub-Sahara
Africa: Origins, Targets, Impact and Potential. In Ajayi, S.I. (ed.) Foreign direct investment in South
Africa. Nairobi: African Economic Research Consortium, 177-208.
Ancharaz, V.D. 2003. FDI and export performance of the Mauritian manufacturing sector. Reduit:
University of Mauritius, Faculty of Social Studies and Humanities.
Anwar, S. & Nguyen, L.P. 2011a. Foreign direct investment and export spillovers: Evidence from
Vietnam. International Business Review, 20(1), 177-193.
Anwar, S. & Nguyen, L.P. 2011b. Foreign direct investment and trade: The case of Vietnam.
Research in International Business and Finance, 25(1), 39-52.
Aziakpono, M.J. 2008. Financial and monetary autonomy and interdependence between
SouthAfrica and other SACU countries. South African Journal of Economics, 76(2), 189-211.
Bajo-Rubio, O. & Montero-Munoz, M. 2001. Foreign direct investment and trade: a causality
Analysis. Open Economics Review, 12(3), 305-323.
Bashier, A. & Bataineh, T.M. 2007. The causal relationship between foreign direct investment and
savings in Jordan: an error correction model. International Management Review, 3(4), 12-18.
Stellenbosch University http://scholar.sun.ac.za

50
Bezuidenhout, H. & Naude, W. 2008. Foreign direct investment and trade in the Southern African
development community. Working Papers RP2008/88. World Institute for Development Economic
Research.
Brooks, C. 2008. Introductory Econometrics for Finance. 2nd edition. New York: Cambridge
University Press.
Buch, C.M. & Lipponer, A. 2007. FDI versus exports: Evidence from German banks. Journal of
Banking & Finance, 31(3), 805-826.
Buckley, P.J., Clegg, J. & Wang, C. 2002. The impact of inward FDI on the performance of
Chinese manufacturing firms. Journal of International Business Studies, 4(33), 637-655.
De Angelo, C.F., Eunni, R.V. & Fouto, N.M.M.D. 2010. Determinants of FDI in emerging markets:
evidence from Brazil. International Journal of Commerce and Management. 20(3), 203-216.
Di Mauro, F. 2000. The impact of economic integration on FDI and exports: a gravity approach.
Working paper no. 156. Brussels: Centre for European Policy Studies.
Dlamini, T.S. & Fraser, G.C.G. 2010. Foreign direct investment in the agriculture sector of South
Africa: Do GDP and exports determine locational inflows? Journal of Studies in Economics and
Econometrics, 34(2), 57-68.
Dunning, J.H. 2000. The eclectic paradigm as an envelope for economic and business theories of
MNE activity. International Business Review, 9, 163-190.
Ensor, L. 2011. State targets R115 bn foreign investment. Business Day, 20 April.
Ernst & Young. 2011. Africa attractiveness survey. Ernst & Young.
Fedderke, J.W. & Romm, A.T. 2006. Growth impact and determinants of foreign direct investment
into South Africa, 1956-2003. Economic Modelling. 23(5), 738-760.
GIBS. 2011. Manuel on SA’s vision for 2030. Finweek, 1 December, 49.
Goldberg, L.S. & Klein, M.W. 1999. International trade and factor mobility: An empirical
investigation. Working Paper no. 7196. New York: NBER.
Gujarati, D.N. & Porter, D.C. 2009. Basic Econometrics. 5th edition. New York: McGraw-Hill.
Harris, R. 1995. Cointegration analysis in econometric modelling. Hertfordshire: Prentice Hall.
Hazelhurst, E. 2011. FDI slumps 80% as mining debate deters investors. STAR. 19 January, 13.
Stellenbosch University http://scholar.sun.ac.za

51
Head, K. & Ries, J. 1999. Overseas investment and firm exports. Review of International
Economics, 9, 108-122.
Helpman, E. 2006. Trade, FDI and the organization of firms. Journal of Economic Literature, 44(3),
589-630.
Helpman, E. 1984. A simple theory of international trade with multinational corporations. Journal of
Political Economy, 92(3), 451-471.
Helpman, E., Melitz, M.J. & Yeaple, S.R. 2003. Exports versus FDI. Working Paper no. 9439.
Cambridge: NBER.
Hill, C.W.L. 2007. International business: Competing in the global marketplace. 6th edition. New
York: McGraw-Hill.
Hirsch, A. 2011. Behind the debate on South Africa’s New Growth Path. The Africa Report, March,
56-57.
Kim, J. & Kang, I. 1996. Outward FDI and exports: The case of South Korea and Japan. Journal of
Asian Economics, 8(1) 39-50.
Lamprecht, I. 2011. Stygende koste eis sy tol, se vervaardigers. Sake 24, 2 Oktober.
Laubscher, J. 2010. An evaluation of South Africa’s industrial policy. [Online] Available:
http://www.sanlam.co.za/wps/wcm/connect/Sanlam_EN/sanlam/media+centre/expert+opinions/an
+evaluation+of+south+africas+industrial+policy Accessed: 27 April 2011.
Lund, T. 2011a. Brics wall. Finweek, 5 May, 20-21.
Lund, T. 2011b. Charming China. Finweek, 19 May, 20-21.
Lund, T. 2011c. Unions losing the numbers game. Finweek, 15 December, 28-29.
Markusen, J.R. 1983. Factor movements and commodity trade as compliments. Journal of
International Economics, 14(3-4), 341-356.
Mbeki, M. 2011. Moeletsi Mbeki’s call for change. Finweek, 8 September, 61.
Moeti, K.B. 2005. Rationalisation of government structures concerned with foreign direct
investment policy in South Africa. Unpublished doctoral dissertation. Pretoria: University of
Pretoria.
Stellenbosch University http://scholar.sun.ac.za

52
Morris, R. & Aziz, A. 2011. Ease of doing business and FDI inflow to Sub-Sahara Africa and Asian
countries. Cross Cultural Management. 18(4), 400-411.
Mundell, R. 1957. International trade and factor mobility. American Economic Review, 47(3), 321-
355.
Naidoo, K. 2012. Foreign liabilities of South Africa by kind of economic type. E-mail to P.
Opperman, 2 July. Available e-mail: [email protected].
Norbrook, N. 2010. Manufacturing made in Africa. The Africa Report, December, 66-72.
Pacheco-Lopez, P. 2005. Foreign direct investment, exports and imports in Mexico. World
Economy. 28(8), 1157-1172.
Pearson, J., Viviers, W., Cuyvers, L. & Naude, W. 2010. Identifying export opportunities for South
Africa in the southern engines: A DSM approach. International Business Review, 19(4), 345-359.
Republic of South Africa. 2012. Department of Trade and Industry. Trade and Investment South
Africa. [Online] Available: www.thedti.gov.za Accessed: 18 June 2012.
Republic of South Africa. 2011. Department of Trade and Industry. Trade Statistics. [Online]
Available: www.thedti.gov.za Accessed: 13 July 2011.
Republic of South Africa. 2010a. Department of Trade and Industry. 2010/11–2012/13 Industrial
Policy Action Plan. Pretoria: Government Printer.
Republic of South Africa. 2010b. Department of Economic Development. The New Growth Path:
The Framework. Pretoria: Government Printer.
Roos, P. 2011. Brics se voordele begin deurskemer. Sake 24, 18 April.
Ruane, M.C.M. 2008. Attracting foreign direct investments: Challenges and opportunities for
smaller host economies. In Maniam, B., (ed.) Journal of International Business Research, 7(2), 65-
74.
Rusike, T.G. 2007. Trends and determinants of inward foreign direct investment to South Africa.
Unpublished MCom-dissertation. Grahamstown: Rhodes University.
Seetanah, B. & Rojid, S. 2011. The determinants of FDI in Mauritius: a dynamic time series
investigation. African Journal of Economic and Management Studies. 2(1), 24-41.
Sello, R. 2007. The significance of host country incentives in attracting Foreign Direct Investment
(FDI). Unpublished MBA-dissertation. Bellville: University of Stellenbosch.
Stellenbosch University http://scholar.sun.ac.za

53
Singharia, M. & Gupta, A. 2011. Determinants of foreign direct investment in India. Journal of
International Law and Policy. 10(1), 64-82.
South African Reserve Bank, Quarterly Bulletins. Various Issues: Pretoria.
Sun, S. 2009. How does FDI affect domestic firms’ exports? Industrial evidence. The World
Economy. 32(8), 1203-1222.
Swart, P. 2012. Foreign liabilities of South Africa by kind of economic type. E-mail to P. Opperman,
3 July. Available e-mail: [email protected].
Thangavelu, S.M. & Owyong, D.T. 2003. The impact of export growth and scale economies on
productivity in Singapore’s manufacturing industries. Journal of Economic Studies, 30(6), 623-635.
Thomas, S. 2011. SA loses its lustre. Financial Mail, August, 45.
Trade & Industrial Policy Strategies (TIPS). 2009. Climate change risks and opportunities for the
South African economy. Economic sector review: Manufacturing. [Online] Available:
www.climateriskandopportunity.co.za Accessed: 18 April 2012.
United Nations Conference on Trade and Development (UNCTAD). 2005. Economic Development
in Africa: Rethinking the role of foreign direct investment. New York: United Nations Publications.
Van Aarde, N. 2007. Export promotion in South Africa: Criteria for the evaluation of its success.
Unpublished MCom-dissertation. Potchefstroom: North-West University.
Van Eldik, S. & Viviers, W. 2005. The measurement of export readiness of companies in South
Africa. Southern African Business Review. 9(2), 1-11.
Vernon, R. 1966. International investment and international trade in the product cycle. Quarterly
Journal of Economics, 80(2), 190-207.
Wang, C. & Yu, L. 2007. Do spillover benefits grow with rising foreign direct investment? An
empirical examination of the case of China. Applied Economics, 39, 397-405.
Wei, Y. & Liu, X. 2006. Productivity spillovers from R&D, exports and FDI in China’s manufacturing
sector. Journal of International Business Studies, 37(4), 544-557.
Wooldridge, J.M. 2009. Introductory econometrics: A modern approach. 4th edition. New York:
Thomson South-Western.
Xuan, N.T. & Xing, Y. 2008. Foreign direct investment and exports: The experiences of Vietnam.
Economics in Transition, 16(2), 183-197.
Stellenbosch University http://scholar.sun.ac.za

54
Yao, S. 2006. On economic growth, FDI and exports in China. Applied Economics, 38, 339-351.
Zhang, K.H. & Song, S. 2000. Promoting exports: The role of inward FDI on China. China
Economic Review, 11(4), 385-396.
Stellenbosch University http://scholar.sun.ac.za

55
APPENDIX A1
ADF TESTS
Null Hypothesis: LEXPORTS has a unit root
Exogenous: Constant
Lag Length: 0 (Automatic - based on SIC, maxlag=11) t-Statistic Prob.* Augmented Dickey-Fuller test statistic -1.795647 0.3798
Test critical values: 1% level -3.525618
5% level -2.902953
10% level -2.588902 *MacKinnon (1996) one-sided p-values.
Null Hypothesis: LEXPORTS has a unit root
Exogenous: Constant
Lag Length: 9 (Automatic - based on AIC, maxlag=11) t-Statistic Prob.* Augmented Dickey-Fuller test statistic -1.512278 0.5209
Test critical values: 1% level -3.540198
5% level -2.909206
10% level -2.592215 *MacKinnon (1996) one-sided p-values.
Null Hypothesis: LEXPORTS has a unit root
Exogenous: Constant, Linear Trend
Lag Length: 0 (Automatic - based on SIC, maxlag=11) t-Statistic Prob.* Augmented Dickey-Fuller test statistic -2.933102 0.1587
Test critical values: 1% level -4.092547
5% level -3.474363
10% level -3.164499 *MacKinnon (1996) one-sided p-values.
Null Hypothesis: LEXPORTS has a unit root
Exogenous: Constant, Linear Trend
Lag Length: 4 (Automatic - based on AIC, maxlag=11) t-Statistic Prob.* Augmented Dickey-Fuller test statistic -2.243492 0.4582
Test critical values: 1% level -4.100935
5% level -3.478305
10% level -3.166788
Stellenbosch University http://scholar.sun.ac.za

56
*MacKinnon (1996) one-sided p-values.
Null Hypothesis: LIMPORTS has a unit root
Exogenous: Constant
Lag Length: 0 (Automatic - based on SIC, maxlag=11) t-Statistic Prob.* Augmented Dickey-Fuller test statistic -1.001952 0.7485
Test critical values: 1% level -3.525618
5% level -2.902953
10% level -2.588902 *MacKinnon (1996) one-sided p-values.
Null Hypothesis: LIMPORTS has a unit root
Exogenous: Constant
Lag Length: 11 (Automatic - based on AIC, maxlag=11) t-Statistic Prob.* Augmented Dickey-Fuller test statistic -0.889537 0.7850
Test critical values: 1% level -3.544063
5% level -2.910860
10% level -2.593090 *MacKinnon (1996) one-sided p-values.
Null Hypothesis: LIMPORTS has a unit root
Exogenous: Constant, Linear Trend
Lag Length: 0 (Automatic - based on SIC, maxlag=11) t-Statistic Prob.* Augmented Dickey-Fuller test statistic -3.382050 0.0620
Test critical values: 1% level -4.092547
5% level -3.474363
10% level -3.164499 *MacKinnon (1996) one-sided p-values.
Null Hypothesis: LIMPORTS has a unit root
Exogenous: Constant, Linear Trend
Lag Length: 9 (Automatic - based on AIC, maxlag=11) t-Statistic Prob.* Augmented Dickey-Fuller test statistic -5.550199 0.0001
Test critical values: 1% level -4.113017
5% level -3.483970
10% level -3.170071 *MacKinnon (1996) one-sided p-values.
Stellenbosch University http://scholar.sun.ac.za

57
Null Hypothesis: LIMPORTS has a unit root
Exogenous: Constant, Linear Trend
Lag Length: 4 (Fixed) t-Statistic Prob.* Augmented Dickey-Fuller test statistic -3.013957 0.1362
Test critical values: 1% level -4.100935
5% level -3.478305
10% level -3.166788 *MacKinnon (1996) one-sided p-values.
Null Hypothesis: LFDI has a unit root
Exogenous: Constant
Lag Length: 4 (Fixed) t-Statistic Prob.* Augmented Dickey-Fuller test statistic -1.546551 0.4948
Test critical values: 1% level -3.711457
5% level -2.981038
10% level -2.629906
*MacKinnon (1996) one-sided p-values.
Null Hypothesis: LFDI has a unit root
Exogenous: Constant, Linear Trend
Lag Length: 4 (Fixed) t-Statistic Prob.* Augmented Dickey-Fuller test statistic -2.474897 0.3365
Test critical values: 1% level -4.356068
5% level -3.595026
10% level -3.233456 *MacKinnon (1996) one-sided p-values.
Stellenbosch University http://scholar.sun.ac.za
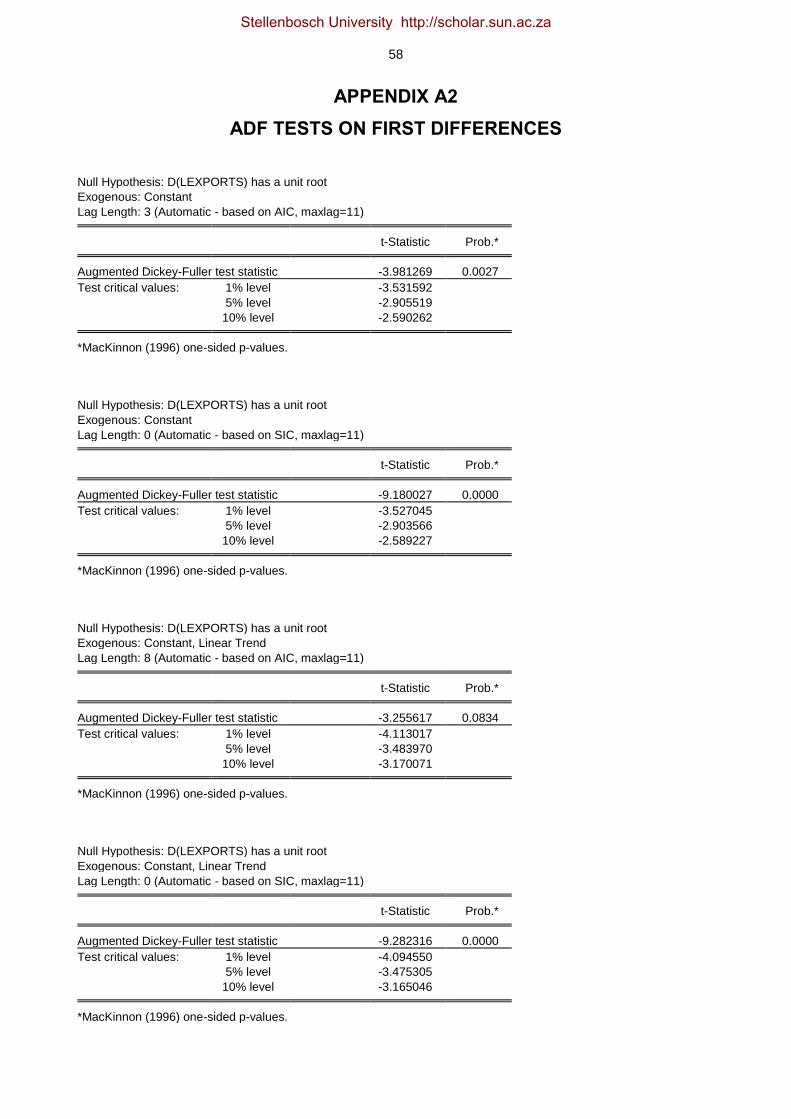
58
APPENDIX A2
ADF TESTS ON FIRST DIFFERENCES
Null Hypothesis: D(LEXPORTS) has a unit root
Exogenous: Constant
Lag Length: 3 (Automatic - based on AIC, maxlag=11) t-Statistic Prob.* Augmented Dickey-Fuller test statistic -3.981269 0.0027
Test critical values: 1% level -3.531592
5% level -2.905519
10% level -2.590262 *MacKinnon (1996) one-sided p-values.
Null Hypothesis: D(LEXPORTS) has a unit root
Exogenous: Constant
Lag Length: 0 (Automatic - based on SIC, maxlag=11) t-Statistic Prob.* Augmented Dickey-Fuller test statistic -9.180027 0.0000
Test critical values: 1% level -3.527045
5% level -2.903566
10% level -2.589227 *MacKinnon (1996) one-sided p-values.
Null Hypothesis: D(LEXPORTS) has a unit root
Exogenous: Constant, Linear Trend
Lag Length: 8 (Automatic - based on AIC, maxlag=11) t-Statistic Prob.* Augmented Dickey-Fuller test statistic -3.255617 0.0834
Test critical values: 1% level -4.113017
5% level -3.483970
10% level -3.170071 *MacKinnon (1996) one-sided p-values.
Null Hypothesis: D(LEXPORTS) has a unit root
Exogenous: Constant, Linear Trend
Lag Length: 0 (Automatic - based on SIC, maxlag=11) t-Statistic Prob.* Augmented Dickey-Fuller test statistic -9.282316 0.0000
Test critical values: 1% level -4.094550
5% level -3.475305
10% level -3.165046 *MacKinnon (1996) one-sided p-values.
Stellenbosch University http://scholar.sun.ac.za

59
Null Hypothesis: D(LEXPORTS) has a unit root
Exogenous: Constant, Linear Trend
Lag Length: 4 (Fixed) t-Statistic Prob.* Augmented Dickey-Fuller test statistic -4.356379 0.0048
Test critical values: 1% level -4.103198
5% level -3.479367
10% level -3.167404 *MacKinnon (1996) one-sided p-values.
Null Hypothesis: D(LIMPORTS) has a unit root
Exogenous: Constant
Lag Length: 10 (Automatic - based on AIC, maxlag=11) t-Statistic Prob.* Augmented Dickey-Fuller test statistic -3.848901 0.0042
Test critical values: 1% level -3.544063
5% level -2.910860
10% level -2.593090
*MacKinnon (1996) one-sided p-values.
Null Hypothesis: D(LIMPORTS) has a unit root
Exogenous: Constant
Lag Length: 0 (Automatic - based on SIC, maxlag=11) t-Statistic Prob.* Augmented Dickey-Fuller test statistic -8.199882 0.0000
Test critical values: 1% level -3.527045
5% level -2.903566
10% level -2.589227 *MacKinnon (1996) one-sided p-values.
Null Hypothesis: D(LIMPORTS) has a unit root
Exogenous: Constant, Linear Trend
Lag Length: 10 (Automatic - based on AIC, maxlag=11) t-Statistic Prob.* Augmented Dickey-Fuller test statistic -3.877762 0.0191
Test critical values: 1% level -4.118444
5% level -3.486509
10% level -3.171541 *MacKinnon (1996) one-sided p-values.
Stellenbosch University http://scholar.sun.ac.za

60
Null Hypothesis: D(LIMPORTS) has a unit root
Exogenous: Constant, Linear Trend
Lag Length: 0 (Automatic - based on SIC, maxlag=11) t-Statistic Prob.* Augmented Dickey-Fuller test statistic -8.145643 0.0000
Test critical values: 1% level -4.094550
5% level -3.475305
10% level -3.165046 *MacKinnon (1996) one-sided p-values.
Null Hypothesis: D(LFDI) has a unit root
Exogenous: Constant
Lag Length: 4 (Fixed) t-Statistic Prob.* Augmented Dickey-Fuller test statistic -2.812447 0.0735
Test critical values: 1% level -3.788030
5% level -3.012363
10% level -2.646119 *MacKinnon (1996) one-sided p-values.
Null Hypothesis: D(LFDI) has a unit root
Exogenous: Constant, Linear Trend
Lag Length: 4 (Fixed) t-Statistic Prob.* Augmented Dickey-Fuller test statistic -2.506140 0.3219
Test critical values: 1% level -4.467895
5% level -3.644963
10% level -3.261452 *MacKinnon (1996) one-sided p-values.
Stellenbosch University http://scholar.sun.ac.za
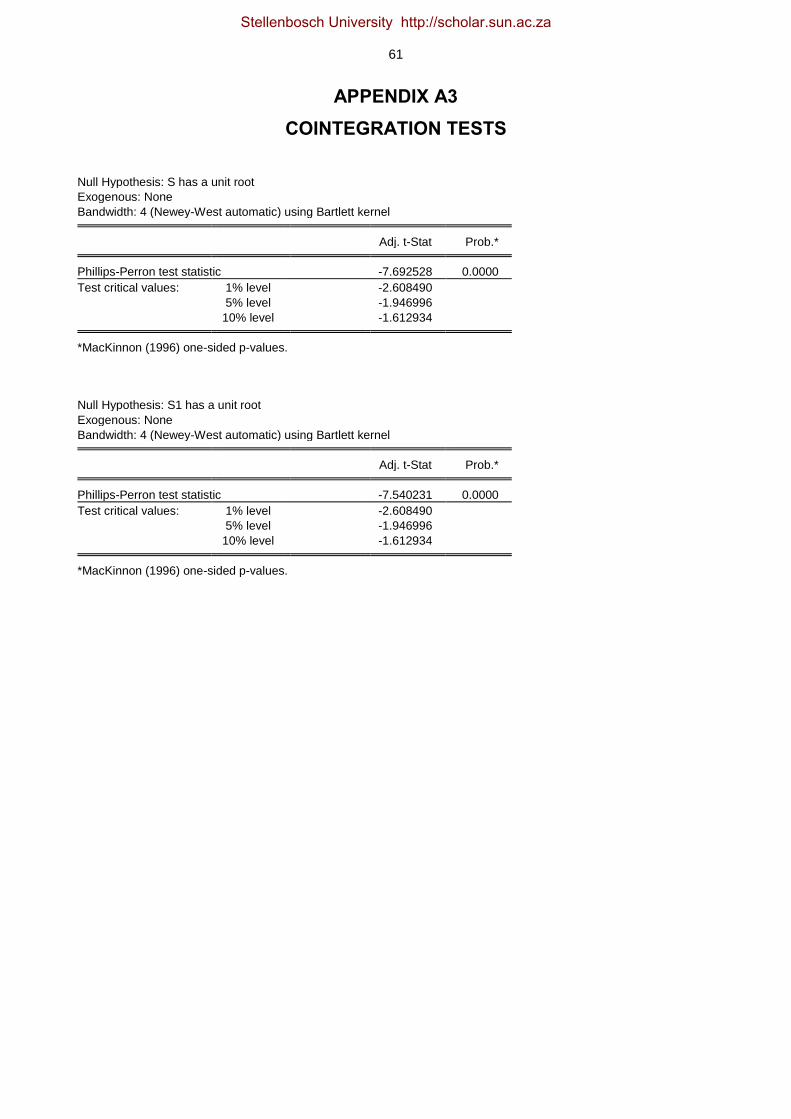
61
APPENDIX A3
COINTEGRATION TESTS
Null Hypothesis: S has a unit root
Exogenous: None
Bandwidth: 4 (Newey-West automatic) using Bartlett kernel Adj. t-Stat Prob.* Phillips-Perron test statistic -7.692528 0.0000
Test critical values: 1% level -2.608490
5% level -1.946996
10% level -1.612934 *MacKinnon (1996) one-sided p-values.
Null Hypothesis: S1 has a unit root
Exogenous: None
Bandwidth: 4 (Newey-West automatic) using Bartlett kernel Adj. t-Stat Prob.* Phillips-Perron test statistic -7.540231 0.0000
Test critical values: 1% level -2.608490
5% level -1.946996
10% level -1.612934 *MacKinnon (1996) one-sided p-values.
Stellenbosch University http://scholar.sun.ac.za
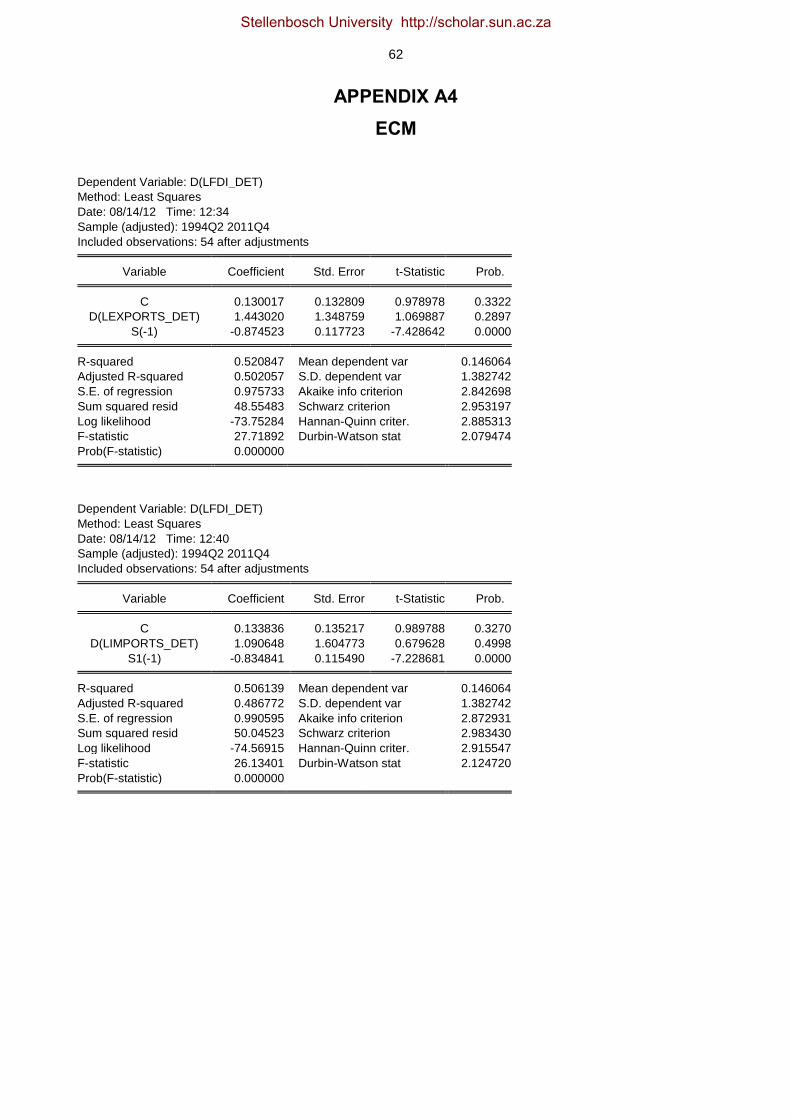
62
APPENDIX A4
ECM
Dependent Variable: D(LFDI_DET)
Method: Least Squares
Date: 08/14/12 Time: 12:34
Sample (adjusted): 1994Q2 2011Q4
Included observations: 54 after adjustments Variable Coefficient Std. Error t-Statistic Prob. C 0.130017 0.132809 0.978978 0.3322
D(LEXPORTS_DET) 1.443020 1.348759 1.069887 0.2897
S(-1) -0.874523 0.117723 -7.428642 0.0000 R-squared 0.520847 Mean dependent var 0.146064
Adjusted R-squared 0.502057 S.D. dependent var 1.382742
S.E. of regression 0.975733 Akaike info criterion 2.842698
Sum squared resid 48.55483 Schwarz criterion 2.953197
Log likelihood -73.75284 Hannan-Quinn criter. 2.885313
F-statistic 27.71892 Durbin-Watson stat 2.079474
Prob(F-statistic) 0.000000
Dependent Variable: D(LFDI_DET)
Method: Least Squares
Date: 08/14/12 Time: 12:40
Sample (adjusted): 1994Q2 2011Q4
Included observations: 54 after adjustments Variable Coefficient Std. Error t-Statistic Prob. C 0.133836 0.135217 0.989788 0.3270
D(LIMPORTS_DET) 1.090648 1.604773 0.679628 0.4998
S1(-1) -0.834841 0.115490 -7.228681 0.0000 R-squared 0.506139 Mean dependent var 0.146064
Adjusted R-squared 0.486772 S.D. dependent var 1.382742
S.E. of regression 0.990595 Akaike info criterion 2.872931
Sum squared resid 50.04523 Schwarz criterion 2.983430
Log likelihood -74.56915 Hannan-Quinn criter. 2.915547
F-statistic 26.13401 Durbin-Watson stat 2.124720
Prob(F-statistic) 0.000000
Stellenbosch University http://scholar.sun.ac.za

63
Dependent Variable: D(LEXPORTS_DET)
Method: Least Squares
Date: 08/14/12 Time: 12:43
Sample (adjusted): 1994Q2 2011Q4
Included observations: 54 after adjustments Variable Coefficient Std. Error t-Statistic Prob. C -0.002972 0.013757 -0.216006 0.8298
D(LFDI_DET) 0.015212 0.014219 1.069887 0.2897
S(-1) 0.019834 0.017218 1.151882 0.2547 R-squared 0.027674 Mean dependent var -0.001151
Adjusted R-squared -0.010456 S.D. dependent var 0.099663
S.E. of regression 0.100182 Akaike info criterion -1.709694
Sum squared resid 0.511863 Schwarz criterion -1.599195
Log likelihood 49.16174 Hannan-Quinn criter. -1.667079
F-statistic 0.725785 Durbin-Watson stat 1.871202
Prob(F-statistic) 0.488875
Dependent Variable: D(LIMPORTS_DET)
Method: Least Squares
Date: 08/14/12 Time: 12:47
Sample (adjusted): 1994Q2 2011Q4
Included observations: 54 after adjustments Variable Coefficient Std. Error t-Statistic Prob. C 0.005414 0.011834 0.457490 0.6493
D(LFDI_DET) 0.008229 0.012109 0.679628 0.4998
S1(-1) 0.014744 0.014124 1.043847 0.3015 R-squared 0.021053 Mean dependent var 0.006526
Adjusted R-squared -0.017338 S.D. dependent var 0.085311
S.E. of regression 0.086048 Akaike info criterion -2.013874
Sum squared resid 0.377616 Schwarz criterion -1.903375
Log likelihood 57.37461 Hannan-Quinn criter. -1.971259
F-statistic 0.548386 Durbin-Watson stat 1.623048
Prob(F-statistic) 0.581251
Stellenbosch University http://scholar.sun.ac.za