Forecasting Foreign Direct Investment (FDI) in Sri Lanka ... · Forecasting Foreign Direct...
12
International Journal of Arts and Commerce ISSN 1929-7106 www.ijac.org.uk 34 Forecasting Foreign Direct Investment (FDI) in Sri Lanka for the period from year 2014-2064 Dr. Prasanna Perera, W.L. Senior Lecturer in Economics & Statistics, Dept. of Economics and Statistics, University of Peradeniya, Sri Lanka. Email: [email protected] ABSTRACT This paper forecasts the value of FDI for Sri Lanka for the period 2014-2064. This study applies times series data from 1970 to 2013. The analysis indicates both mean and variance change with an increasing trend for the forecasting period. FDI data is stationary according to the Augmented Dickey-Fuller Test. The papered entities minimum AIC value and presents ARIMA (1, 1, 6) and ARIMA (1,0,6) models as optimal models to forecast FDI in Sri Lanka. Box-Ljung test is employed to illustrate the randomization of residuals. Total value of FDI expected for the next fifty years (2014-2064) is $48021.094million and expected average FDI is $ 960.422million for Sri Lanka. Total value of FDI for 2014-2028 is $14243.935million and it is $28719.860 for 2014-2043. Average FDI for 2014-2028 is$949.596 million and it is $957.329 million for 2014-2043. Keywords: Foreign Direct Investment, forecasting, time series, Box-Jenkins models, ARIMA, Sri Lanka. 1. Introduction: Foreign direct investment (FDI) is defined as an investment that involves a long-term relationship, interest, and management influence by a resident of one economy (foreign direct investor / parent enterprise) in an enterprise residing in an economy other than that of the foreign direct investor (OECD, 1996).FDI implies that the investor exerts a significant degree of influence on the management of the enterprise resident in the other economy. FDI may be undertaken by individuals as well as business entities. FDI in one country by the residents of another includes equity transactions, reinvested earnings and various intercompany capital transactions. If a foreign investor has over 10 percent or more voting shares in a Sri Lankan company, such a foreign investment is categorized as FDI in Sri Lanka. FDI is generally considered to be motivated by long term considerations than portfolio investment in tradable securities. FDI is the most important and influential factor of economic growth in the contemporary world. FDI mainly contributes to accelerate the productivity of the national economy, reducing unemployment, creating job opportunities, solving balance of payments problems and updating technology. FDI provides capital,
Transcript of Forecasting Foreign Direct Investment (FDI) in Sri Lanka ... · Forecasting Foreign Direct...
International Journal of Arts and Commerce ISSN 1929-7106 www.ijac.org.uk
34
Forecasting Foreign Direct Investment (FDI) in Sri Lanka for the
period from year 2014-2064
Dr. Prasanna Perera, W.L.
Senior Lecturer in Economics & Statistics,
Dept. of Economics and Statistics,
University of Peradeniya, Sri Lanka.
Email: [email protected]
ABSTRACT
This paper forecasts the value of FDI for Sri Lanka for the period 2014-2064. This study applies times series
data from 1970 to 2013. The analysis indicates both mean and variance change with an increasing trend for
the forecasting period. FDI data is stationary according to the Augmented Dickey-Fuller Test. The papered
entities minimum AIC value and presents ARIMA (1, 1, 6) and ARIMA (1,0,6) models as optimal models to
forecast FDI in Sri Lanka. Box-Ljung test is employed to illustrate the randomization of residuals. Total
value of FDI expected for the next fifty years (2014-2064) is $48021.094million and expected average FDI
is $ 960.422million for Sri Lanka. Total value of FDI for 2014-2028 is $14243.935million and it is
$28719.860 for 2014-2043. Average FDI for 2014-2028 is$949.596 million and it is $957.329 million for
2014-2043.
Keywords: Foreign Direct Investment, forecasting, time series, Box-Jenkins models, ARIMA, Sri Lanka.
1. Introduction:
Foreign direct investment (FDI) is defined as an investment that involves a long-term relationship, interest,
and management influence by a resident of one economy (foreign direct investor / parent enterprise) in an
enterprise residing in an economy other than that of the foreign direct investor (OECD, 1996).FDI implies
that the investor exerts a significant degree of influence on the management of the enterprise resident in the
other economy. FDI may be undertaken by individuals as well as business entities. FDI in one country by
the residents of another includes equity transactions, reinvested earnings and various intercompany capital
transactions. If a foreign investor has over 10 percent or more voting shares in a Sri Lankan company, such a
foreign investment is categorized as FDI in Sri Lanka. FDI is generally considered to be motivated by long
term considerations than portfolio investment in tradable securities.
FDI is the most important and influential factor of economic growth in the contemporary world. FDI mainly
contributes to accelerate the productivity of the national economy, reducing unemployment, creating job
opportunities, solving balance of payments problems and updating technology. FDI provides capital,
International Journal of Arts and Commerce Vol. 4 No. 1 January, 2015
35
technology, managerial skills, and entrepreneurial ability and finally creates jobs for developing countries.
Profits generated through FDI contribute to the co-operate tax revenue of the receiving country.
FDI is proven to be resilient to financial crisis. For instances during the East Asian financial crisis from
1997-98, FDI was remarkably stable (Lipsey, 2001). After the 2012 economic downturn, global FDI
returned to growth, with inflows rising 9 percent in 2013, to $1.45 trillion. UNCTAD projects that FDI
flows could rise to $1.6 trillion in 2014, $1.7 trillion in 2015 and $1.8 trillion in 2016, with relatively larger
increases in developed countries (UNCTAD, 2014). However, in 2000, FDI flows into developing and
transitional economies accounted for just 19 per cent of the global total FDI. Nevertheless, FDI to
developing countries had grown to almost 60 percent in 2013 compared to 2012.
During the recent past, peaceful domestic environment, favourable government policies, improved investor
confidence and recovery of global economy have facilitated all the key sectors to demonstrate a
commendable performance in FDI in Sri Lanka. Relatively low wages, skilled labour and geographical
location make the Sri Lankan post war economy a natural destination for FDI. Reflecting positive investor
confidence, Sri Lanka recorded the highest gross inflows of FDI in 2011 recording$ 981 million (with net
inflow of $ 896 million), however, the gross FDI inflows in 2013 is less than $ 916 million (net inflow of
851 million)(Central Bank of Sri Lanka, 2013). According to the Board of Investment (BOI) of Sri Lanka,
45 percent of the FDI contribution was for infrastructure development, 28 percent was for the production
sector and 19 percent was for hotels and restaurants in 2012. Before 2010, the telecommunications sector
received most of the FDI and this was overtaken by the hotels and restaurant sector in 2011, which was then
overtaken by infrastructure development projects in 2012.From the gross FDI received in 2013, 57 percent
of total FDI received was for telephone and telecommunication networks as well as for housing and property
development and ports and container terminals, 26 percent was for the manufacturing sector and 17 percent
was direct toward the service sector which includes tourism, education, communication and IT sector
(Central Bank, Annual Report 2013).
Gross FDI including foreign loans to BOI companies were 2.1 percent of GDP in 2013. However, FDI
inflow is 1.6 percent as a percentage of GDP and it was only a 0.003 percent in 1975 (WDI, 2012). Although
as a percentage of GDP the total FDI inflow is low, Sri Lanka’s economy relies increasingly on FDI to
narrow down its savings and investment gap and the deficit in the current account of the balance of payment
in Sri Lanka. Thus, FDI provides capital, technology, managerial skills, and entrepreneurial ability, whilst
creating much needed job opportunities for Sri Lankans, and also fills the country’s savings-investment gap.
Compared to other South Asian countries, Sri Lanka formed a FDI friendly macroeconomic environment
long time before. In the recent past, Sri Lanka received less inward FDI compared to other South Asian
countries like India, Bangladesh and Pakistan. During the period of 2000-2013, Sri Lanka’s average inward
FDI is less than 3 percent compared to 15 percent in the 1990s. Bulk of the inward FDI in the South Asia
goes to India, accounting 85 percent of regional inward FDI. Bangladesh receives 5 percent of inward FDI
in the region, while Pakistan receives 4 percent. Therefore, more than 90 percent of regional inward FDI is
shared by India, Bangladesh and Pakistan.
Sri Lanka liberalized its economy in 1978 and after that provided more incentives to attract FDI. Cooperate
tax incentives, import duty exceptions, exemptions on tax on dividends and customs duties for foreign
investors are among these. Sri Lanka also follows liberal investment policies, which invite foreign
investment and spend more on infrastructure development projects. Successive governments have further
liberalized the economy, leading to deregulation, greater privatization and opening the economy to
international competition. Transparent investment laws aim to foster foreign direct investments. Sri Lankan
commercial laws are based on British laws and Sri Lanka has had a highly independent judicial system. The
Sri Lankan government gives priority to mega economic infrastructure projects and one of its targets is to
International Journal of Arts and Commerce ISSN 1929-7106 www.ijac.org.uk
36
have more FDI to reach level of a upper middle income country by the year 2016. Sri Lanka expects to
achieve a US$ 100 billion economy with US$ 4000 per capita income by 2016.
After ending 30 years of civil war in 2009, the Sri Lankan government has high expectations on attracting
more FDI. FDI in the immediate post-war period was around 1.5 percent of GDP and Sri Lanka expects to
maintain FDI as 2 percent of GDP in the coming years. Taking advantage of Sri Lanka’s strategic location
and resources, the government has planned to transform Sri Lanka into a strategically important economic
centre by developing five +1 strategic hubs; a knowledge hub, a commercial hub, a naval & maritime hub,
an aviation hub, an energy hub, and tourism hub.
Although Sri Lanka received less FDI compared to India, Bangladesh and Pakistan, Sri Lanka ranked as the
most liberalized economy in South Asia and was placed in the 85th position in the World Bank’s 2014 doing
business index (World Bank, WDI, 2014). Sri Lanka has dynamic and resilient private sector, which if
necessary can be joint venture partners for foreign investors. However, foreign investors are allowed to own
100% ownership of an investment. Concessions granted under an agreement with the BOI – for qualifying
investment projects - remain valid over the lifetime of the enterprise. Sri Lanka has signed 28 bilateral
agreements and 38 double tax avoiding agreements with important partner countries (BOI, 2014).
This paper forecasts inward FDI to Sri Lanka based on the past behaviour. The process of forecasting inward
FDI involves wider use of statistical methods and models. It is important to note here that economic
forecasting is not an exact science, however, the outcome of this research is significant for policy makers
and investors who, based on such projections, formulate financial and investment policies, strategies and
decisions to attract more FDI to Sri Lanka and or design make investments in countries like Sri Lanka.
1.1. Objectives of the Study:
The main objective of this study is to forecast the value of FDI of Sri Lanka for the next 50 years from 2014-
2064. This study also estimates the total and average FDI for the period 2014-2064 with breakdown in the
analysis presented for the periods 2014-2027 and 2014-2042.
1.2. Structure of the Paper:
Following the introductory note, the paper presents a literature review with relevant theories and empirical
studies. Subsequently, the research methodology used in the study is presented. This is followed by a
discussion on findings and results, ending with a brief concluding section.
1.3. Literature Review:
There are quite a few but significant empirical attempts made by researchers to examine the growth of FDI
inflows and forecast using the ARIMA models. Batchelor, R., (2000) compares the accuracy and
information content of macroeconomic economic forecasts for G7 countries made in the 1990s by the
OECD and IMF. This study finds with few exceptions, the private sector forecasts are less biased and more
accurate in terms of mean absolute error and root mean square error compared to OECD and IMF.
Al-Abdulrazag and Bataineh (2007) forecast FDI inflows into Jordan for the period 2004-2025 using Box-
Jenkins methodology. This study used ARIMA model based on time series data for the period 1976-2003 for
Jordan. The study found that ARIMA (0, 1, 1) is the optimal model for forecasting FDI in Jordan for the
period of 2004-2025. Rajan, Rongala and Ghosh (2008) presented forecasts of inwards direct investment of
India for the years 2008 to 2012 and the projected figure of FDI inflows is $ 60 billion for the year 2012.
Tsai, B. H. (2010) forecasted FDI for Taiwan applying Modified Diffusion Model. This study aimed at the
profitability impact on foreign direct investment (FDI) in Taiwan and on integrated circuit (IC)
International Journal of Arts and Commerce Vol. 4 No. 1 January, 2015
37
manufacturing industry based on genetic algorithms (GA) methods in numerical simulations. This study
predicted FDI using alternative models.
T. Al-Rawashdeh, Jaafar H. Nsour and Rafat S. Salameh(2011) forecasted FDI for Jordan for the period
2011 -2030 using ARIMA models based on the time series data covering the period 1981-2010. This study
only focused on fitting ARIMA model for 20 years. This study was identified the variable FDI was not
stationary in its levels and to make FDI data stationary (ARIMA) models are applied after identifying first
order of difference. This study was based on the computer program (Minitab, 14 and Eviews, 3.1) for data
analysis and forecasting of FDI. The study recommends that there is a need to provide appropriate
investment environment through providing necessary incentives and facilities to investors away from
bureaucracy, the need to work on a comprehensive economic plan, especially in the aftermath of the global
financial crisis that affect the world m the region including Jordan, to make a comprehensive review of all
legislations governing (FDI). This study provided some useful insights to the current study on the
application of ARIMA model for Sri Lanka.
Kumar, G.and Dhingra, N. (2012) forecasted growth of FDI inflows to Sri Lanka and generated the short
term forecasts of FDI inflows to Sri Lanka for the period of 2011-2020 using SPSS (7.5). This study used
the ARIMA model but the performance of FDI and compared Sri Lanka with other South Asian countries.
This study applied Double Exponential Smoothing using Holt’s approach. However, Double Exponential
Smoothing model is best suited to address the type of data which exhibits either an increasing or decreasing
trend over time or when the data is non-stationary in nature. The forecasting was based on the sample of data
from 1990 to 2010.
Trading Economics forecasts (2014) FDI flow to countries like America, Europe, Asia and Africa, using an
ARIMA model. After modelling the past behaviour of a time series they forecast for those region and
selected countries. In case of Sri Lanka, it was found that FDI data was available only up to 2010 and their
forecasting does not include Sri Lanka.
2. Methodology:
The data employed in the study are extracted from the Central Bank of Sri Lanka, the World Development
Indicators of the World Bank, International Financial Statistics Year Books of the International Monetary
Fund and the Department of Census and Statistics of Sri Lanka. FDI data is recorded in the financial account
of the balance of payments of Sri Lanka. However, this study mainly employs inward FDI data recorded in
the country fact sheet: Sri Lanka of the World Investment Reports (Various years up to 2014) published by
the United Nations Conference on Trade and Development (UNCTAD).
According to inward FDI data set, time series analysis forecast the value of FDI in Sri Lanka using R
software version 3.0.3 tseries, stats, lawstat packages and WEKA software version 3.7.11 time series
Forecasting packages .Shapiro-Wilk normality test checked the normality of the FDI data. Stationary of FDI
series is identified using Augmented Dickey-Fuller Test. After examining the stationary of the data, the
study plotted the Auto Correlation Function (ACF) and Partial Auto Correlation Function (PACF). After that
it was used Box-Jenkins models to select the best suited model for the current study. Selected Box-Jenkins
models are estimated and identified the best optimal model using minimum Akaike information criterion
(AIC) value. ARIMA (1,1,6) model is identified as the best suited model to investigate the adequacy and
residuals randomizations. The same ARIMA (1,1,6) model is applied to forecast the inward FDI to Sri
Lanka for the period 2014-2064.
International Journal of Arts and Commerce ISSN 1929-7106 www.ijac.org.uk
2.1. Sampling Scheme:
The target population is UNCTAD inward FDI data for Sri Lanka, sampling scheme is1970 to 2013and
values are expressed in $ million. There is a consistency with the data sample and there is no need for any
conversion of the data.
2.2. Model Stability Diagnostic Tests:
• The testing procedure for the ADF test is the same as for the Dickey–Fuller test but it is applied to
the model
(01)
Whereα is a constant, β the coefficient on a time trend and p the lag order of the autoregressive process.
The unit root test is then carried out under the null hypothesis γ = 0,
(02)
• The Ljung–Box test
(03)
Where n is the sample size,ρ� is the sample autocorrelation at lag k, and h is the number of lags being
tested.
• According to the FDI data set, forecasting the volume of FDI in Sri Lanka using time series analysis,
2.3 Data:
Required data was collected primarily from the, Country Fact Sheet: Sri Lanka World Investment Reports
(various years), up to 2014.
3. Results and Discussion:
3.1 Descriptive Statistics of inward FDI:
The main features of the descriptive statistics during the period of 1970 to 2013 are qualitatively presented
in the Table 1 using Minitab 16.
Table 1 Descriptive Statistics of FDI
Mean Standard deviation IQR N
201.2437 269.1753 202.54 44
3.2 Normality Tests for FDI Volume:
Minitab 16 is applied to test whether the data are normally distributed or not. It tested the following
hypothesis.
H0: Data / Variables are normally distributed in the population and
H1: Data / Variables are not normally distributed in the population
Table 2 Shapiro-Wilk normality test provided P-value <0.05, H0 is rejected at 5% significance level, above
results indicate that the series of FDI data is not normally distributed population.
Although there are some rigorous statistical and econometrical tests that can be performed, often a visual
inspection of time series plot will provide important information (underlying ) on whether the time series
�������, , � �04�
User
Typewritten Text
38
International Journal of Arts and Commerce Vol. 4 No. 1 January, 2015
39
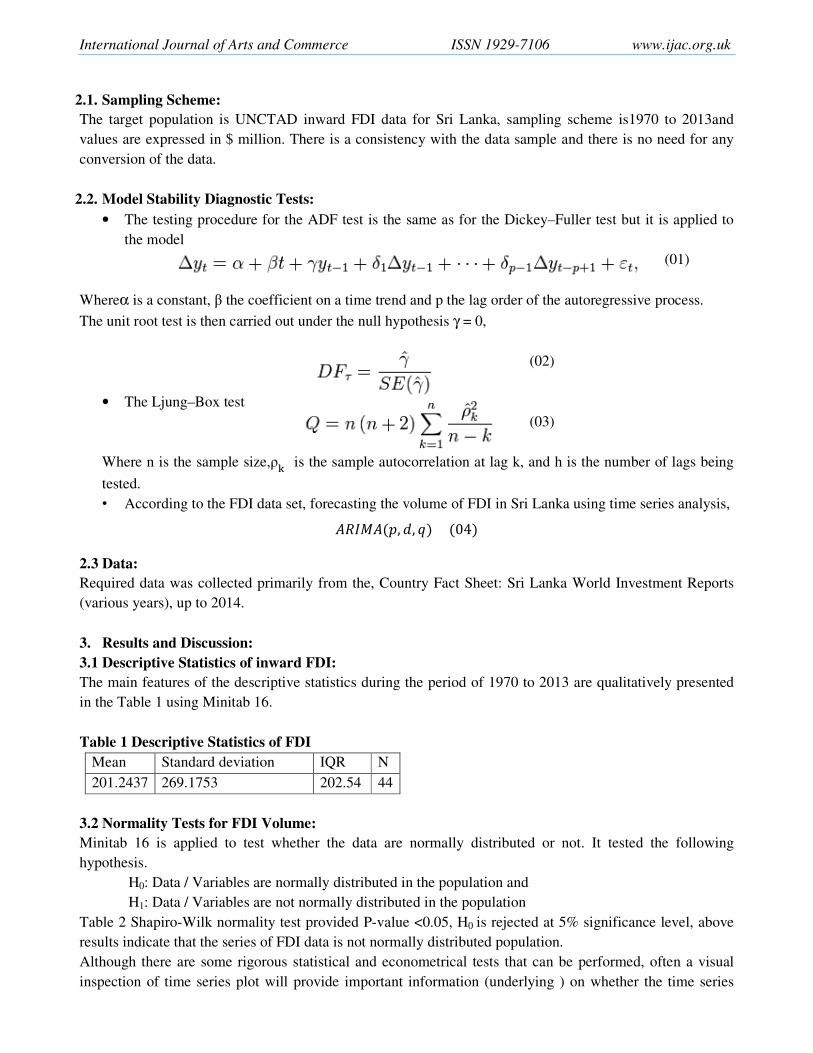
data are stationary or not. Therefore, the present study first presents the visual inspection of data. The visual
presentation demonstrates the periodical behaviour of the time series data of the variables of this study.
In the visual inspection of Figure 1, it appears that mean and variance changed with time (year). Both the
mean and variance are dependent on time and FDI data series is not stationary. Visual inspection reveals an
increasing trend during the selected period especially after 1978 and 1995. This trend reflects the economic
policy changes that took placed in Sri Lanka after 1978 and 1995.
Table 2 Shapiro-Wilk normality test
Shapiro-Wilk normality test
W = 0.7355, p-value = 1.499e-07
Figure 1. Time series plot of the FDI (1970-2013)
3.3 Verification of stationary:
A stationary process has the property that the mean, variance and covariance structure do not change over
time. It is important to perform the unit root tests in the order of integration of the form to identify the
variable FDI in its first difference.
Hypothesis:
H0: Data is not stationary.
H1: Data is stationary.
Table 3 presents Augmented Dickey Fuller Tests result, which indicates that the variable FDI is non-
stationary in level and stationary in first difference (I).
P-value > 0.05, H0 is rejected at 5% significance level, therefore FDI data series is stationary.
According to Table 4.3, P-value >0.05, H0 is rejected at 5% significance level, therefore Sri Lankan FDI data
series is stationary.
Table 3. Augmented Dickey-Fuller Test
Dickey-Fuller = 0.8262, Lag order = 3, p-value = 0.99 (01), (02)
-200
0
200
400
600
800
1000
1200
1970 1972 1974 1976 1978 1980 1982 1984 1986 1988 1990 1992 1994 1996 1998 2000 2002 2004 2006 2008 2010 2012
Sri Lanka FDI US $ millions
International Journal of Arts and Comme
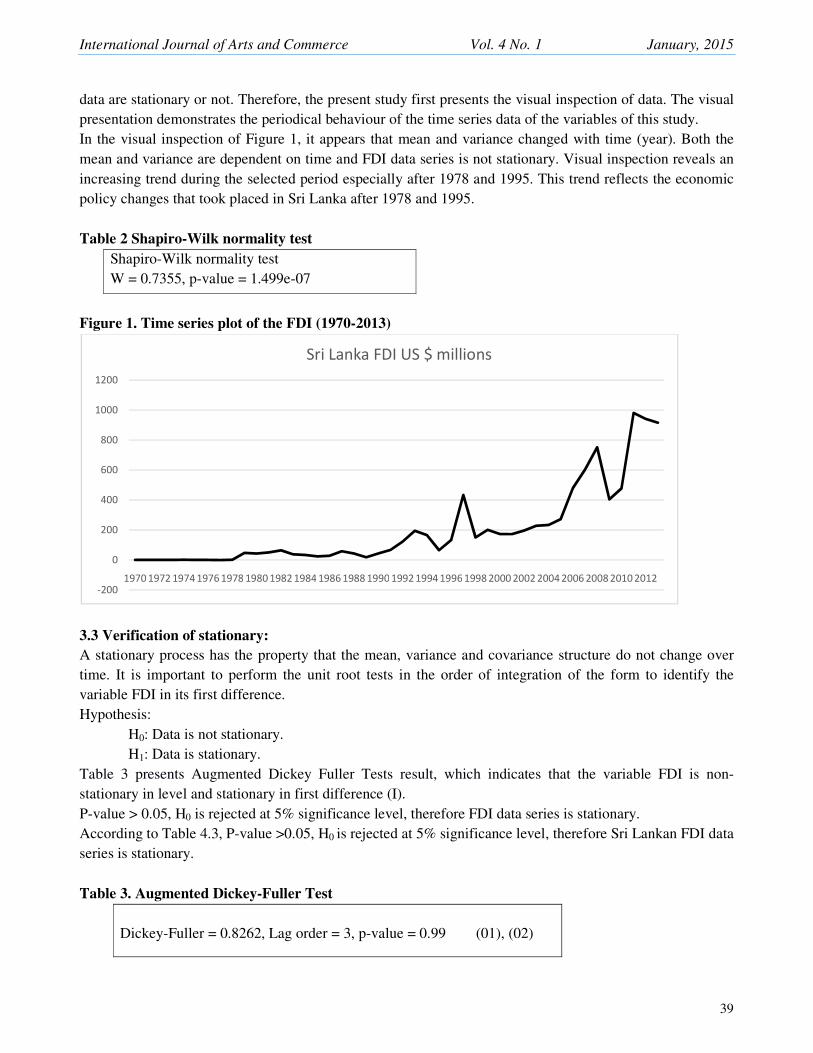
3.4 Model identification:
According to the Figure 2, Auto Correla
dies down moderately.
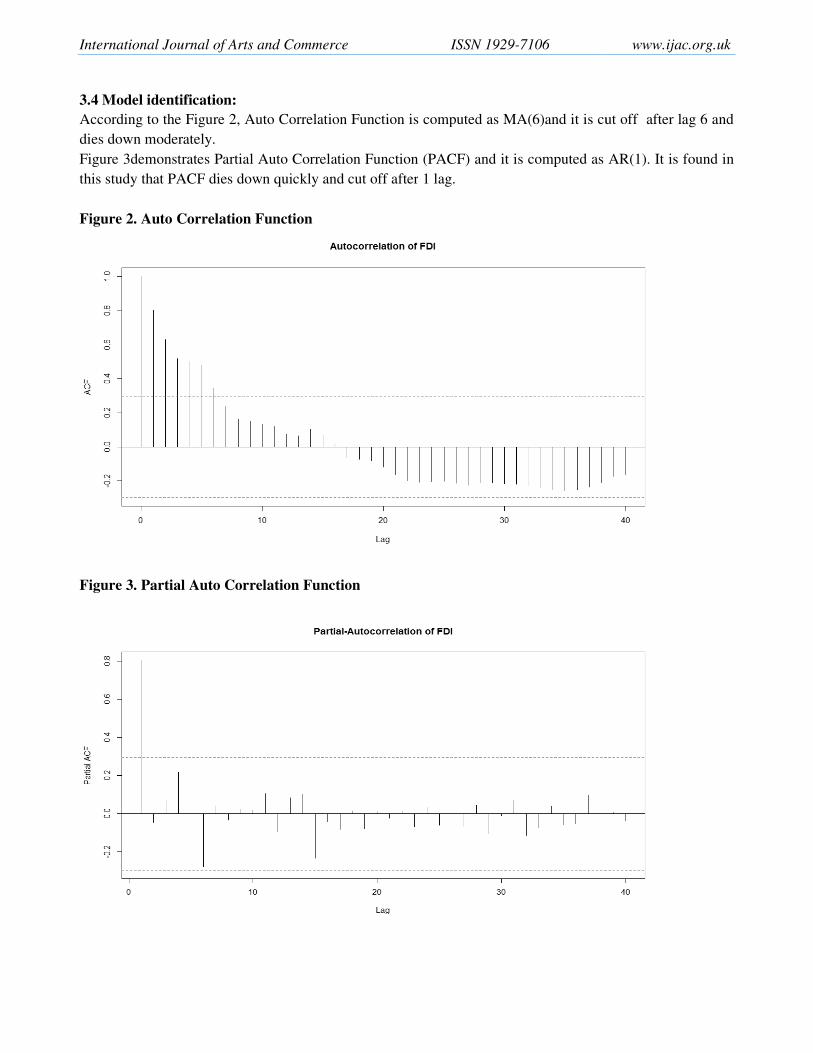
Figure 3demonstrates Partial Auto Corre
this study that PACF dies down quickly
Figure 2. Auto Correlation Function
Figure 3. Partial Auto Correlation Fun
merce ISSN 1929-7106
lation Function is computed as MA(6)and it is cu
rrelation Function (PACF) and it is computed as
ly and cut off after 1 lag.
unction
www.ijac.org.uk
cut off after lag 6 and
AR(1). It is found in
User
Typewritten Text
40
International Journal of Arts and Commerce Vol. 4 No. 1 January, 2015
41
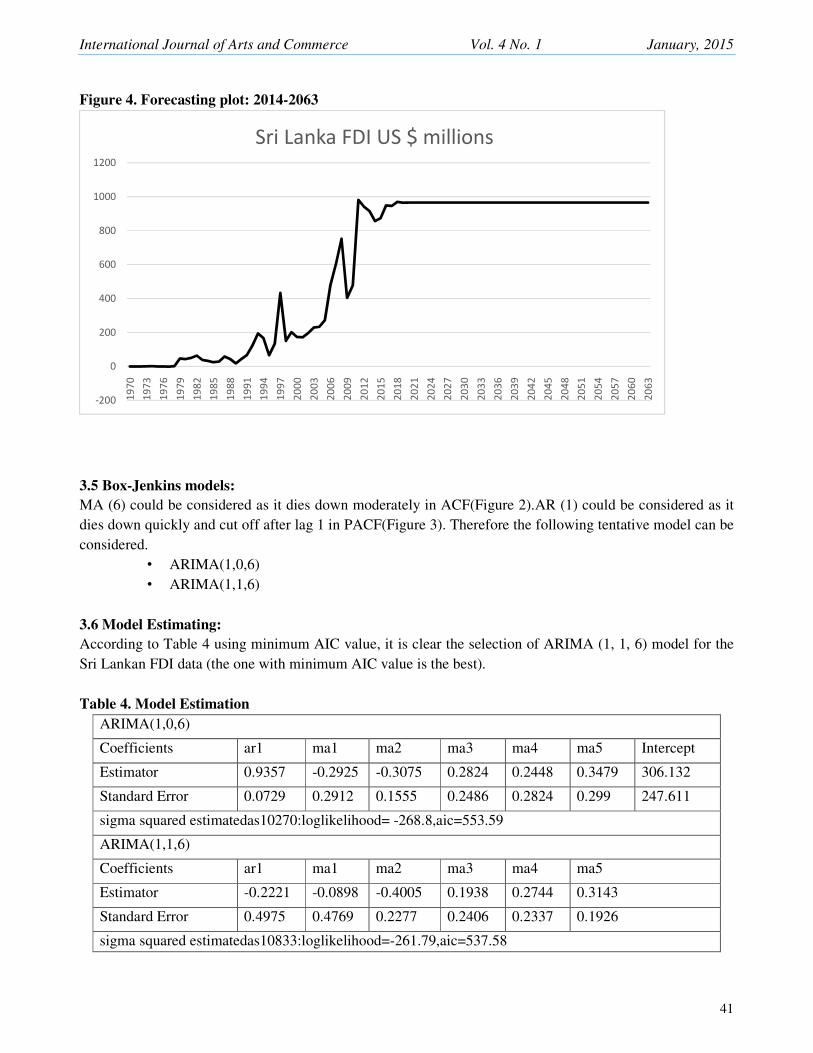
Figure 4. Forecasting plot: 2014-2063
3.5 Box-Jenkins models:
MA (6) could be considered as it dies down moderately in ACF(Figure 2).AR (1) could be considered as it
dies down quickly and cut off after lag 1 in PACF(Figure 3). Therefore the following tentative model can be
considered.
• ARIMA(1,0,6)
• ARIMA(1,1,6)
3.6 Model Estimating:
According to Table 4 using minimum AIC value, it is clear the selection of ARIMA (1, 1, 6) model for the
Sri Lankan FDI data (the one with minimum AIC value is the best).
Table 4. Model Estimation
ARIMA(1,0,6)
Coefficients ar1 ma1 ma2 ma3 ma4 ma5 Intercept
Estimator 0.9357 -0.2925 -0.3075 0.2824 0.2448 0.3479 306.132
Standard Error 0.0729 0.2912 0.1555 0.2486 0.2824 0.299 247.611
sigma squared estimatedas10270:loglikelihood= -268.8,aic=553.59
ARIMA(1,1,6)
Coefficients ar1 ma1 ma2 ma3 ma4 ma5
Estimator -0.2221 -0.0898 -0.4005 0.1938 0.2744 0.3143
Standard Error 0.4975 0.4769 0.2277 0.2406 0.2337 0.1926
sigma squared estimatedas10833:loglikelihood=-261.79,aic=537.58
-200
0
200
400
600
800
1000
1200
19
70
19
73
19
76
19
79
19
82
19
85
19
88
19
91
19
94
19
97
20
00
20
03
20
06
20
09
20
12
20
15
20
18
20
21
20
24
20
27
20
30
20
33
20
36
20
39
20
42
20
45
20
48
20
51
20
54
20
57
20
60
20
63
Sri Lanka FDI US $ millions
International Journal of Arts and Commerce ISSN 1929-7106 www.ijac.org.uk
42
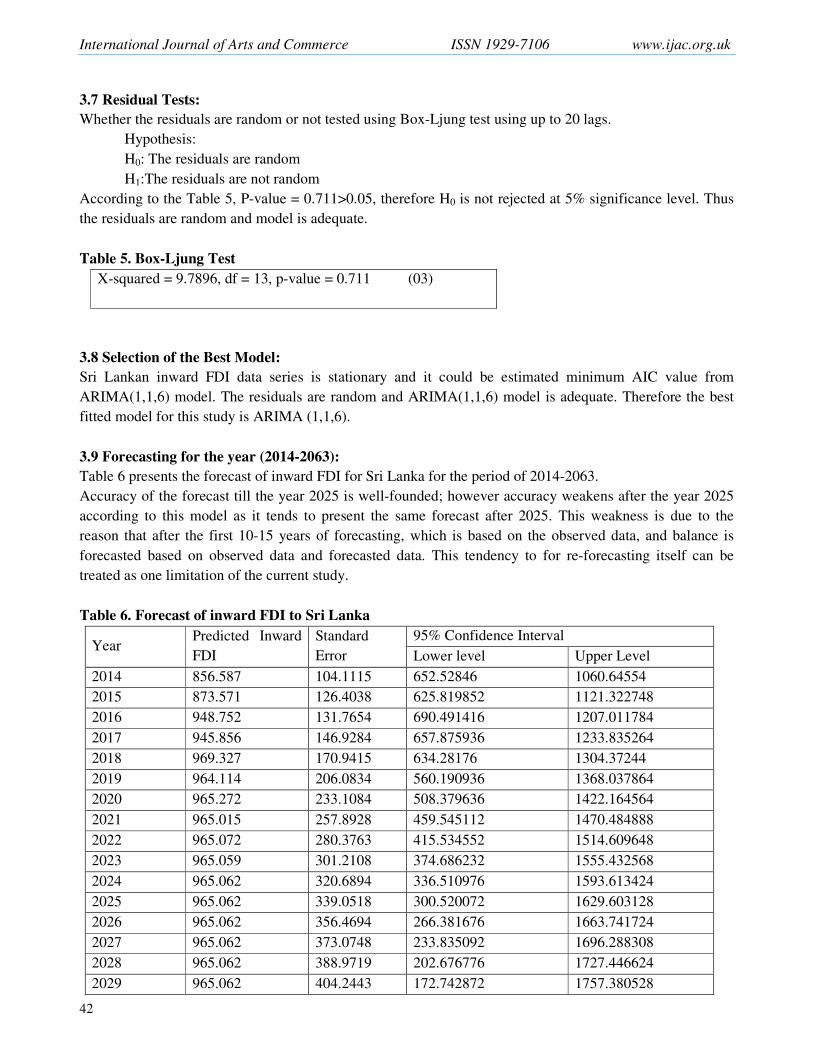
3.7 Residual Tests:
Whether the residuals are random or not tested using Box-Ljung test using up to 20 lags.
Hypothesis:
H0: The residuals are random
H1:The residuals are not random
According to the Table 5, P-value = 0.711>0.05, therefore H0 is not rejected at 5% significance level. Thus
the residuals are random and model is adequate.
Table 5. Box-Ljung Test
X-squared = 9.7896, df = 13, p-value = 0.711 (03)
3.8 Selection of the Best Model:
Sri Lankan inward FDI data series is stationary and it could be estimated minimum AIC value from
ARIMA(1,1,6) model. The residuals are random and ARIMA(1,1,6) model is adequate. Therefore the best
fitted model for this study is ARIMA (1,1,6).
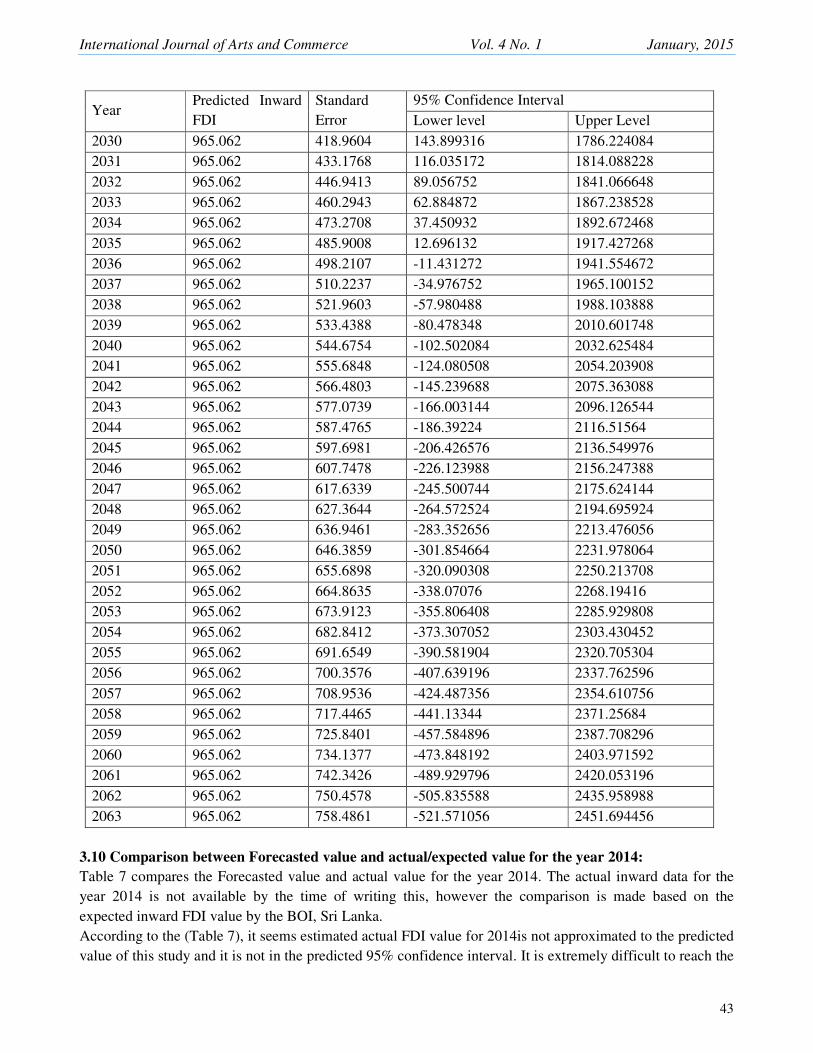
3.9 Forecasting for the year (2014-2063):
Table 6 presents the forecast of inward FDI for Sri Lanka for the period of 2014-2063.
Accuracy of the forecast till the year 2025 is well-founded; however accuracy weakens after the year 2025
according to this model as it tends to present the same forecast after 2025. This weakness is due to the
reason that after the first 10-15 years of forecasting, which is based on the observed data, and balance is
forecasted based on observed data and forecasted data. This tendency to for re-forecasting itself can be
treated as one limitation of the current study.
Table 6. Forecast of inward FDI to Sri Lanka
Year Predicted Inward
FDI
Standard
Error
95% Confidence Interval
Lower level Upper Level
2014 856.587 104.1115 652.52846 1060.64554
2015 873.571 126.4038 625.819852 1121.322748
2016 948.752 131.7654 690.491416 1207.011784
2017 945.856 146.9284 657.875936 1233.835264
2018 969.327 170.9415 634.28176 1304.37244
2019 964.114 206.0834 560.190936 1368.037864
2020 965.272 233.1084 508.379636 1422.164564
2021 965.015 257.8928 459.545112 1470.484888
2022 965.072 280.3763 415.534552 1514.609648
2023 965.059 301.2108 374.686232 1555.432568
2024 965.062 320.6894 336.510976 1593.613424
2025 965.062 339.0518 300.520072 1629.603128
2026 965.062 356.4694 266.381676 1663.741724
2027 965.062 373.0748 233.835092 1696.288308
2028 965.062 388.9719 202.676776 1727.446624
2029 965.062 404.2443 172.742872 1757.380528
International Journal of Arts and Commerce Vol. 4 No. 1 January, 2015
43
Year Predicted Inward
FDI
Standard
Error
95% Confidence Interval
Lower level Upper Level
2030 965.062 418.9604 143.899316 1786.224084
2031 965.062 433.1768 116.035172 1814.088228
2032 965.062 446.9413 89.056752 1841.066648
2033 965.062 460.2943 62.884872 1867.238528
2034 965.062 473.2708 37.450932 1892.672468
2035 965.062 485.9008 12.696132 1917.427268
2036 965.062 498.2107 -11.431272 1941.554672
2037 965.062 510.2237 -34.976752 1965.100152
2038 965.062 521.9603 -57.980488 1988.103888
2039 965.062 533.4388 -80.478348 2010.601748
2040 965.062 544.6754 -102.502084 2032.625484
2041 965.062 555.6848 -124.080508 2054.203908
2042 965.062 566.4803 -145.239688 2075.363088
2043 965.062 577.0739 -166.003144 2096.126544
2044 965.062 587.4765 -186.39224 2116.51564
2045 965.062 597.6981 -206.426576 2136.549976
2046 965.062 607.7478 -226.123988 2156.247388
2047 965.062 617.6339 -245.500744 2175.624144
2048 965.062 627.3644 -264.572524 2194.695924
2049 965.062 636.9461 -283.352656 2213.476056
2050 965.062 646.3859 -301.854664 2231.978064
2051 965.062 655.6898 -320.090308 2250.213708
2052 965.062 664.8635 -338.07076 2268.19416
2053 965.062 673.9123 -355.806408 2285.929808
2054 965.062 682.8412 -373.307052 2303.430452
2055 965.062 691.6549 -390.581904 2320.705304
2056 965.062 700.3576 -407.639196 2337.762596
2057 965.062 708.9536 -424.487356 2354.610756
2058 965.062 717.4465 -441.13344 2371.25684
2059 965.062 725.8401 -457.584896 2387.708296
2060 965.062 734.1377 -473.848192 2403.971592
2061 965.062 742.3426 -489.929796 2420.053196
2062 965.062 750.4578 -505.835588 2435.958988
2063 965.062 758.4861 -521.571056 2451.694456
3.10 Comparison between Forecasted value and actual/expected value for the year 2014:
Table 7 compares the Forecasted value and actual value for the year 2014. The actual inward data for the
year 2014 is not available by the time of writing this, however the comparison is made based on the
expected inward FDI value by the BOI, Sri Lanka.
According to the (Table 7), it seems estimated actual FDI value for 2014is not approximated to the predicted
value of this study and it is not in the predicted 95% confidence interval. It is extremely difficult to reach the
International Journal of Arts and Commerce ISSN 1929-7106 www.ijac.org.uk
44
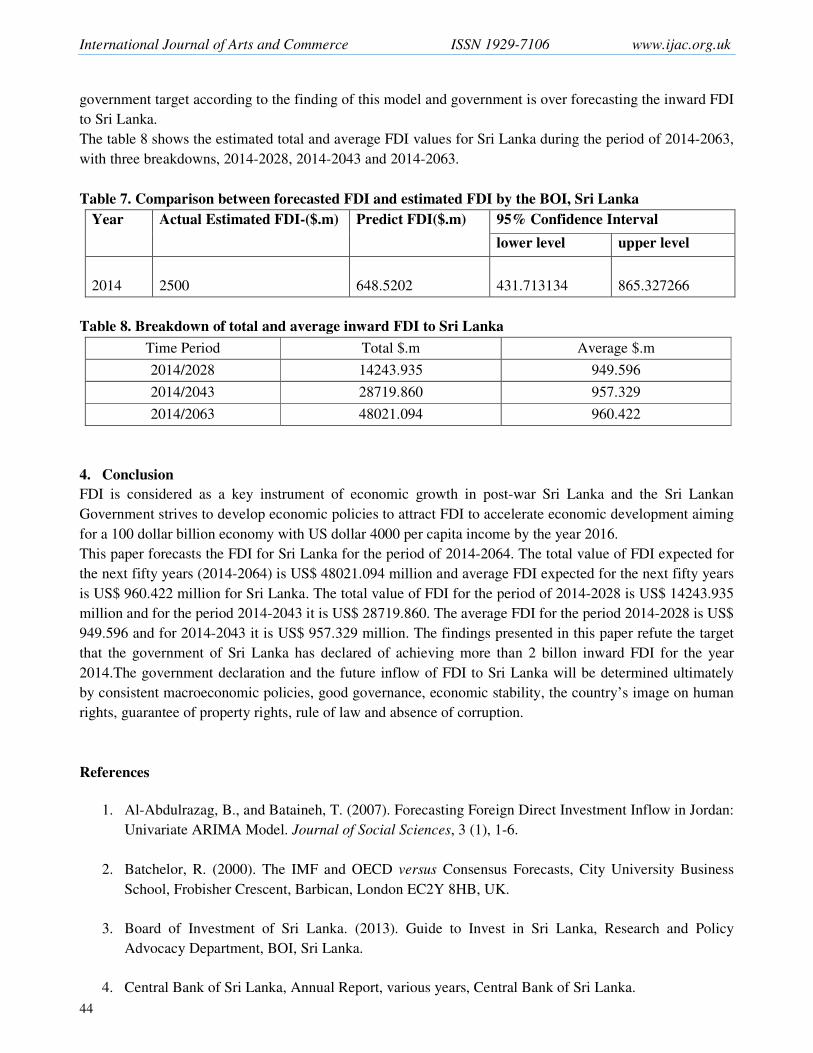
government target according to the finding of this model and government is over forecasting the inward FDI
to Sri Lanka.
The table 8 shows the estimated total and average FDI values for Sri Lanka during the period of 2014-2063,
with three breakdowns, 2014-2028, 2014-2043 and 2014-2063.
Table 7. Comparison between forecasted FDI and estimated FDI by the BOI, Sri Lanka
Year Actual Estimated FDI-($.m) Predict FDI($.m) 95% Confidence Interval
lower level upper level
2014
2500
648.5202 431.713134 865.327266
Table 8. Breakdown of total and average inward FDI to Sri Lanka
Time Period Total $.m Average $.m
2014/2028 14243.935 949.596
2014/2043 28719.860 957.329
2014/2063 48021.094 960.422
4. Conclusion
FDI is considered as a key instrument of economic growth in post-war Sri Lanka and the Sri Lankan
Government strives to develop economic policies to attract FDI to accelerate economic development aiming
for a 100 dollar billion economy with US dollar 4000 per capita income by the year 2016.
This paper forecasts the FDI for Sri Lanka for the period of 2014-2064. The total value of FDI expected for
the next fifty years (2014-2064) is US$ 48021.094 million and average FDI expected for the next fifty years
is US$ 960.422 million for Sri Lanka. The total value of FDI for the period of 2014-2028 is US$ 14243.935
million and for the period 2014-2043 it is US$ 28719.860. The average FDI for the period 2014-2028 is US$
949.596 and for 2014-2043 it is US$ 957.329 million. The findings presented in this paper refute the target
that the government of Sri Lanka has declared of achieving more than 2 billon inward FDI for the year
2014.The government declaration and the future inflow of FDI to Sri Lanka will be determined ultimately
by consistent macroeconomic policies, good governance, economic stability, the country’s image on human
rights, guarantee of property rights, rule of law and absence of corruption.
References
1. Al-Abdulrazag, B., and Bataineh, T. (2007). Forecasting Foreign Direct Investment Inflow in Jordan:
Univariate ARIMA Model. Journal of Social Sciences, 3 (1), 1-6.
2. Batchelor, R. (2000). The IMF and OECD versus Consensus Forecasts, City University Business
School, Frobisher Crescent, Barbican, London EC2Y 8HB, UK.
3. Board of Investment of Sri Lanka. (2013). Guide to Invest in Sri Lanka, Research and Policy
Advocacy Department, BOI, Sri Lanka.
4. Central Bank of Sri Lanka, Annual Report, various years, Central Bank of Sri Lanka.
International Journal of Arts and Commerce Vol. 4 No. 1 January, 2015
45
5. Kumar, G., & Dhingra, N. (2012). Growth performance and forecasts of FDI inflows to Sri Lanka.
E3 Journal of Business Management and Economics, 3(8), 307-317.
6. Lipsey, E.R.(2001). Foreign Direct Investors in Three Financial Crisis, NBBR working paper No.
8084, Cambridge, Massachusetts, National Bureau of Economic Research.
7. OECD. (1996). Detailed Benchmark Definition of Foreign Direct Investment, (3rdEd.), Organization
for Economic Co-operation and Development.
8. Rajan, R.S., Sunil, R., Ramya, G. (2008). ‘Attracting Foreign Direct Investment (FDI) to India’,
www.freewebs.com.
9. Salah T. Al-rawashdeh, Jaafar H. Nsour, Rafat S. Salameh. (2011). Forecasting Foreign Direct
Investment in Jordan for the Years (2011 -2030). International Journal of Business and Management,
ISSN 1833-3850.
10. Trading Economics.(2014).from http://www.tradingeconomics.com/forecast/foreign-direct-
investment.
11. Tsai, B.H. (2010). Forecasting Foreign Direct Investment with Modified Diffusion Model.
International Science Index Vol:4, No:5, 2010 waset.org/Publication/5464.
12. UNCTAD. World Investment Report, Various Years.