The purpose driven assessment system
51
The purpose driven assessment program John Cronin, Ph.D. Director of Education Research Northwest Evaluation Association
-
Upload
john-cronin -
Category
Education
-
view
227 -
download
1
Transcript of The purpose driven assessment system

The purpose driven assessment programJohn Cronin, Ph.D.
Director of Education ResearchNorthwest Evaluation Association
The pursuit of compliance is exhausting because it
is always a moving target. Governors move
on, the party in power gets replaced, a new
president is elected, and all want to put their own
stamp on education. . It is saner and less
exhausting to define your own course and
align compliance requirements to that
The problem of compliance-based assessment systems
Characteristics of compliance-based assessment systems

Control of the assessment system is assumed to be external – tests are mandated and not chosen.

Assessments are focused on accountability and are perceived as punitive
The district’s assessment program changes anytime federal and state mandates change.

Seven standards that define the purpose driven assessment system

The standards1. The purposes of all assessments are defined and the
assessments are valid and useful for their purposes.2. Teachers are educated in the proper administration
and application of the assessments used in their classrooms.
3. Assessment results are aligned to the needs of their audiences.
4. Redundant, misaligned, or unused assessments are eliminated.
5. Assessment results are delivered in a timely and useful manner.
6. The metrics and incentives used encourage a focus on all learners.
7. The assessment program contributes to a climate of transparency and objectivity with a long-term focus.

The purposes of all assessments are defined and the assessments are valid and useful for their purposes.1

Making Assessment Matter – Students and Educators Want Tests that Support Learning.Northwest Evaluation Association and Grunwald Associates - 2014
https://www.nwea.org/content/uploads/2014/04/MakeAssessmentMatter_5-2014.pdf

Teacher and Administrator perceptions on the purposes of assessments
Purpose Teachers Administrators
Evaluate School Performance 78% 82%
Evaluate Teacher and Administrator Performance
67% 68%
Measure Student Growth 67% 91%
Evaluate Program Effectiveness
47% 80%
Inform Instructional Practice 45% 93%
To the best of your knowledge, please indicate which of the following ways your district is using assessment data

Too much time is spent on preparing for and taking assessments - teachers
53%

Too much time is spent on preparing for and taking assessments - administrators
40%

ChicagoShelby Cty, TN
BaltimoreAnchorage
Washington DCBoston
Los AngelesDenver
IndianapolisAtlanta
HoustonCleveland
0 5 10 15 20 25 30
State Mandated District
Classroom Hours
Estimated Time Devoted to Testing in Third Grade – 12 Urban School Systems
Source: Teoh, M., Coggins, C., Guan, C. and Hiller, H. (2014, Winter). The Student and the Stopwatch. How much time do American students spend on testing? Teach Plus.

K 1 2 3 4 5 6 7 8 9 10 11 120
102030405060708090
100
State MandatedBenchmarkLocal
Grade in school
Clas
sroo
m h
ours
Nelson, H. (2013). Testing More Teaching Less. What America’s Obsession with Student Testing Costs in Terms of Money and Time. Washington, D.C. – American Federation of Teachers
Estimated time devoted to test preparation in one midwestern school system.

Teachers are educated in the proper administration and application of the assessments used in their classrooms.2

Percent of teachers and administrators who correctly matched the assessment term with it’s definitionAssessment Term Teachers Administrators
Performance tasks 61% 86%
Classroom/teacher-developed assessments
51% 70%
End of year accountability 49% 70%
Diagnostic assessments 42% 59%
Summative classroom assessments
40% 66%
Interim assessments 30% 43%
Formative assessment practice
29% 47%

What types of extra help, if any, does your teacher or school give you if you do not do well on a…
Classroom test State Standardized Test
Before and/or after school support 43% 24%
One to one support 32% 19%
Access to added resources 29% 22%
Small group support 24% 17%
No extra support provided 20% 38%

Assessment results are used to support students
Teachers Administrators0%
10%
20%
30%
40%
50%
60%
70%
80%
90%
100%
68%88%
Agree

Assessment results are used to support teachers
Teachers Administrators0%
10%
20%
30%
40%
50%
60%
70%
80%
90%
100%
48%73%
Agree

I care about doing well on tests
Girls Boys0%
10%
20%
30%
40%
50%
60%
70%
80%
90%
100%
97% 93%
Agree

Tests are a waste of time
Girls Boys0%
10%
20%
30%
40%
50%
60%
70%
80%
90%
100%
39% 46%
Agree

Assessment results are aligned to the needs of their audiences.3

• School Board• Students• Teachers• Parents• Principals, school administrators, and teacher leaders
• District Administrators• Community members• State and federal officials
Assessment audiences

What kind of data do parents want?
Monitoring general progress
Knowing when to be concerned
Determining readiness for next grade
Knowing if I need to seek extra help
Monitoring standards
Communicating with teacher/admin
Measuring high quality teaching
Helping my child with homework
Adjust content to student needs
Providing activities for home
0%10%
20%30%
40%50%
60%70%
80%90%
100%
95%
95%
93%
92%
91%
90%
88%
84%
79%
77%
Source – Northwest Evaluation Association (2012) – NWEA Assessment Perceptions Study. Survey conducted by Grunwald Associates LLC

What parents want their students to get out of school – Harris Poll
Goal White ranking
African American ranking
Hispanic Ranking
Asian ranking
Learns good study habits and self-discipline
1st (tie) 1st (tie) 1st 2nd
Develops strong critical thinking skills
1st (tie) 1st (tie) 3rd 1st
Learns strong verbal and written communication skills
3rd 1st (tie) 2nd 3rd
Is prepared for college 5th 4th 4th 9th
Zeehandelaar and Winkler (2013, August). What parents want: Education preferences and tradeoffs. Washington, DC: Thomas B. Fordham Institute

What parents want for their students to get out of school– Harris Poll
Goal White ranking
African American ranking
Hispanic Ranking
Asian ranking
Learns how to work with people of diverse backgrounds
10th 8th 10th 10th
Is able to work collaboratively in teams
12th 12th 12th 12th
Is accepted at a top tier college
15th 13th 13th 13th
Develops fluency in a foreign language
17th 16th 16th 17th
Zeehandelaar and Winkler (2013, August). What parents want: Education preferences and tradeoffs. Washington, DC: Thomas B. Fordham Institute

What parents want from their school– Harris Poll
Goal White ranking
African American ranking
Hispanic Ranking
Asian ranking
Offer a strong core curriculum in reading and mathematics
1st 1st 1st 1st
Emphasize STEM 2nd 2nd 2nd 2nd
Educate in life skills 3rd 3rd 3rd 4th
Hold students to high academic standards
5th 4th 4th 3rd
Hold students to high standards for behavior
4th 5th 5th 5th
Zeehandelaar and Winkler (2013, August). What parents want: Education preferences and tradeoffs. Washington, DC: Thomas B. Fordham Institute

What parents want from their school– Harris Poll
Goal White ranking
African American ranking
Hispanic Ranking
Asian ranking
Prepares students for taking state tests
19th 10th 10th 20th
Emphasizes arts and music instruction
20th 22nd 22nd 20th
Has strong athletic program
26th 23rd 25th 24th
Offers longer school day or school year
28th 28th 28th 28th
Zeehandelaar and Winkler (2013, August). What parents want: Education preferences and tradeoffs. Washington, DC: Thomas B. Fordham Institute
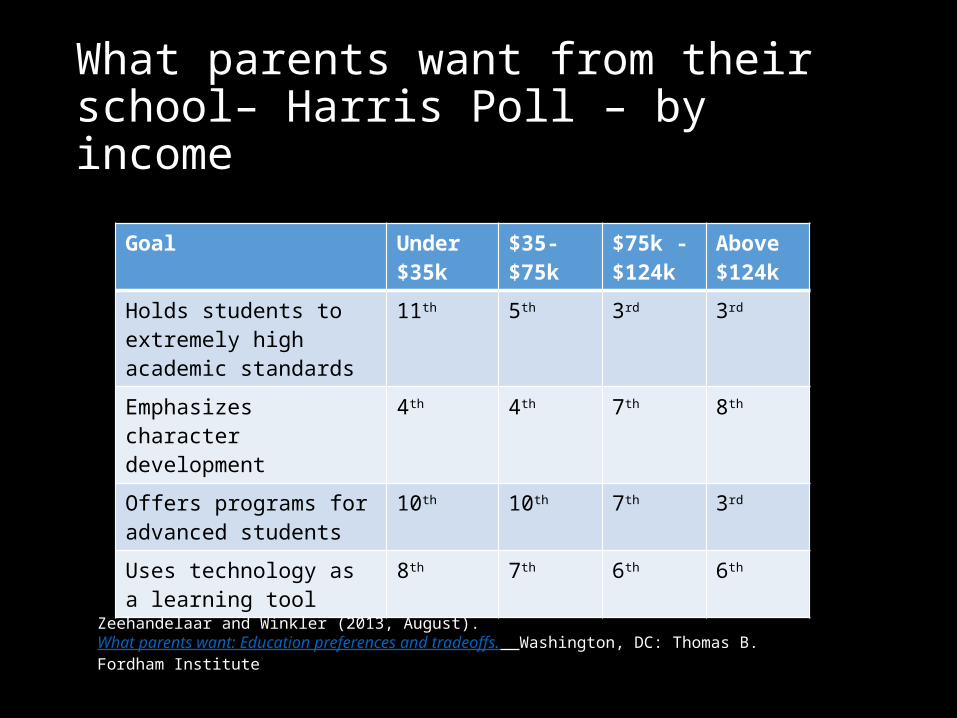
What parents want from their school– Harris Poll – by income
Goal Under $35k
$35-$75k $75k - $124k
Above $124k
Holds students to extremely high academic standards
11th 5th 3rd 3rd
Emphasizes character development
4th 4th 7th 8th
Offers programs for advanced students
10th 10th 7th 3rd
Uses technology as a learning tool
8th 7th 6th 6th
Zeehandelaar and Winkler (2013, August). What parents want: Education preferences and tradeoffs. Washington, DC: Thomas B. Fordham Institute

What parents want from their school– Harris Poll – by income
Goal Under $35k
$35-$75k $75k - $124k
Above $124k
Prepares students for taking state tests
13th 18th 18th 15th
Offers programs for struggling students or students with special needs
6th 11th 14th 18th
Has strong athletic program 26th 26th 26th 23rd
Zeehandelaar and Winkler (2013, August). What parents want: Education preferences and tradeoffs. Washington, DC: Thomas B. Fordham Institute

Questions parents want answered from assessment
• Core question – Do you know and care for my child?
• What are my child’s strengths and weaknesses?
• Is my child on track for the next grade?• Is my child on track for college?• Is my child showing improvement?• Should I be concerned?

Questions teachers want answered from assessment
• What does each student know and not know?
• What does this student need to learn next?
• What resources will help this student?• How can I group these students for
instruction?

Redundant, mis-aligned, or unused assessments are eliminated.4

Compare assessments and their purposes to find unnecessary overlaps and gaps
Be careful about different grade levels and subjects
Identify Redundancies & Gaps

Assessment results are delivered in a timely and useful manner.5

Percent of students who say they do not receive their state accountability test results.
37%

The metrics and incentives used encourage a focus on all learners.6

The New York Case Study

New York state introduces new assessments that reflect the Common Core and “college and career” ready standards.
2012
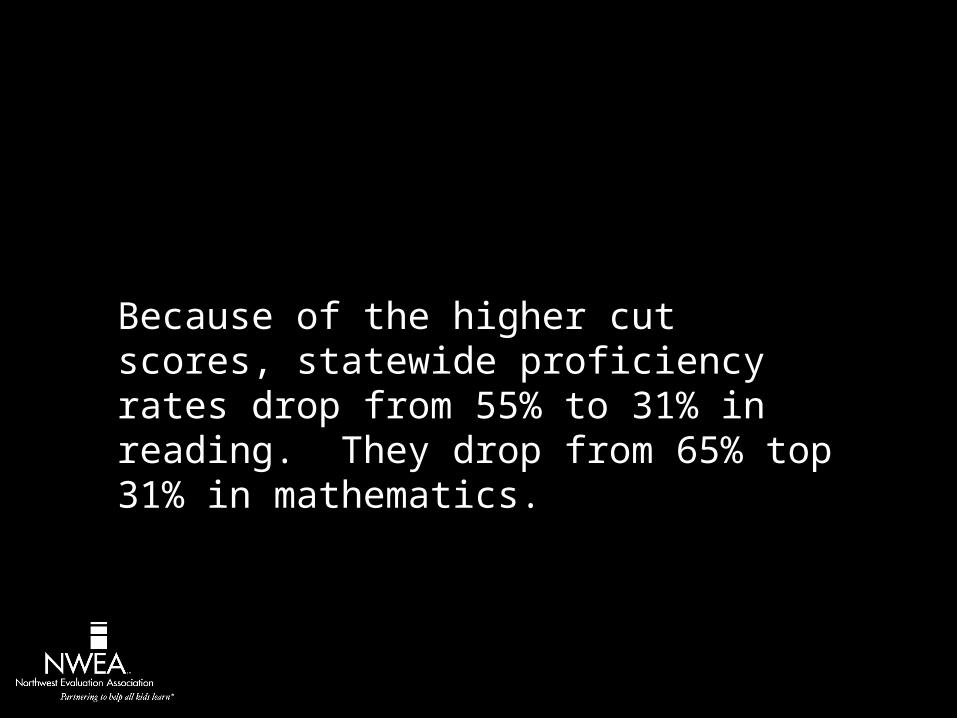
Because of the higher cut scores, statewide proficiency rates drop from 55% to 31% in reading. They drop from 65% top 31% in mathematics.
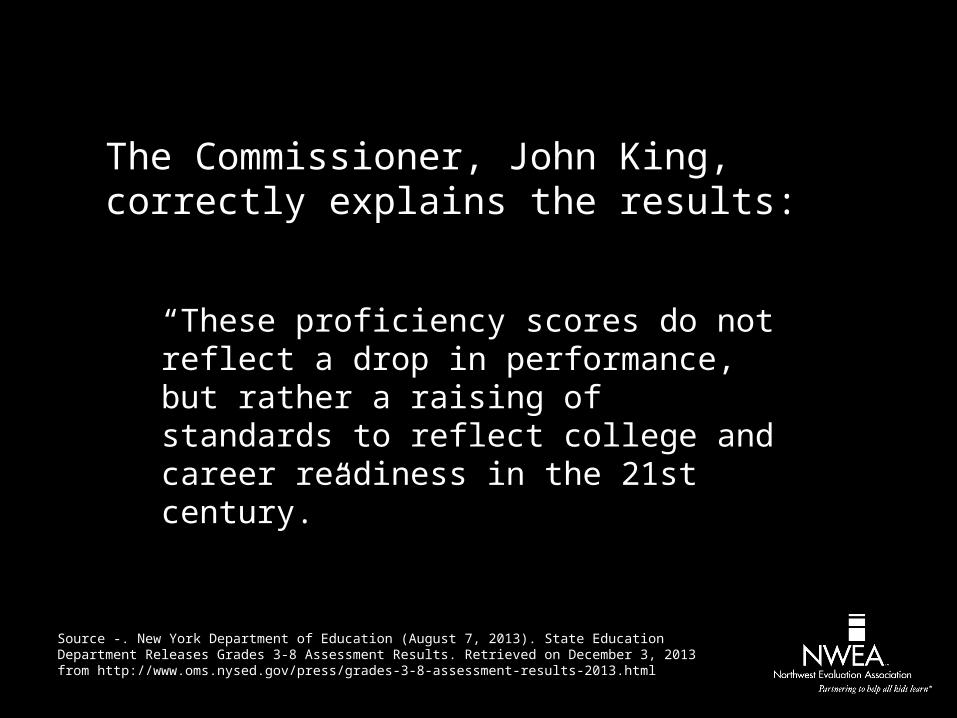
The Commissioner, John King, correctly explains the results:
“These proficiency scores do not reflect a drop in performance, but rather a raising of standards to reflect college and career readiness in the 21st century.”
Source -. New York Department of Education (August 7, 2013). State Education Department Releases Grades 3-8 Assessment Results. Retrieved on December 3, 2013 from http://www.oms.nysed.gov/press/grades-3-8-assessment-results-2013.html

The subsequent New York Times headline:
Test Scores Sink as New York Adopts Tougher Benchmarks
Source -.Hernandez, J. and Gebeloff, G. (August 7, 2013). Test Scores Sink as New York Adopts Tougher Benchmarks. New York Times. Retrieved on December 3, 2013 from http://www.nytimes.com/2013/08/08/nyregion/under-new-standards-students-see-sharp-decline-in-test-scores.html

Raising the bar doesn’t make one less of a high jumper

High Jumping Fitness – Minimum Competency
97%
3%Standard = 1 ft.

High jumping fitness – Physically fit
37%
63% Standard = 3.5 feet

High jumping fitness – Scholarship athlete
4%
96%Standard = 6 feet
As Common Core or College and Career Ready aligned tests are introduced in more states, the New York story will be repeated in other states.

The Smarter Balanced Assessment Consortium released cut scores on their new Common Core aligned test this winter. NWEA has estimated the difficulty of these cut scores as they compare to many states’ prior assessments.
The estimates are available at:https://public.tableau.com/profile/publish/ThePhantomCollapseofStudentAchievement/Dashboard4#!/publish-confirm

An illustration of the phantom collapse

The assessment program contributes to a climate of transparency and objectivity with a long-term focus7