
THE PROJECT FOR GROUNDWATER RESOURCES ...open_jicareport.jica.go.jp/pdf/12248613_01.pdfDecember 2015...
106
December 2015 Japan International Cooperation Agency Kokusai Kogyo Co., Ltd. THE PROJECT FOR GROUNDWATER RESOURCES ASSESSMENT IN THE MIDDLE AWASH RIVER BASIN IN THE FEDERAL DEMOCRATIC REPUBLIC OF ETHIOPIA FINAL REPORT MAIN REPORT The Federal Democratic Republic of Ethiopia Ministry of Water, Irrigation and Electricity
Transcript of THE PROJECT FOR GROUNDWATER RESOURCES ...open_jicareport.jica.go.jp/pdf/12248613_01.pdfDecember 2015...
December 2015
Japan International Cooperation Agency
Kokusai Kogyo Co., Ltd.
THE PROJECT FOR GROUNDWATER RESOURCES ASSESSMENT IN THE
MIDDLE AWASH RIVER BASIN IN THE FEDERAL DEMOCRATIC REPUBLIC OF
ETHIOPIA
FINAL REPORTMAIN REPORT
The Federal Democratic Republic of EthiopiaMinistry of Water, Irrigation and Electricity

Composition of the Report
Executive Summary
Main Report
Supporting Report
Data Book
Geological and Hydrogeological Maps
This Report is prepared based on the price level and exchange rate of July 2015.
The exchange rate is:
US$1.0 = ETB20.6298 = JPY123.80

!!!
!!!
!!
!!!
!!!
!!!
!!!
!!
!!!
!!! !!!
!!
!!
!!!
!!
!!!!!!
!!!!!!
!!
!!
!!!
!!
!!!
!!!
!!
!!!
!!!
!!!
!!!
!!!
!!
!!
!!!
!!!
!!!
!!!
!!!
!!!
!!!
!!!!!!
!!
!!!
!!!
!!!
!!!
!!!!!!
!!!
!!!
!!!
!!
!!!!!!
!!!
!!!
!!!
!!!
!!!
!!!
!!!
!!!
!!
!!!
!
!!!
!!!
!!!
!!
!!!
!!
!!
!!!
!!!
!!!
!!!
!!
!5
!!
!!!
!!!
!!!
!!!
!!!
!!!
!!
!!!
!!
!!!
!!!
!!!
!!!
!!!
!!
!!!
!!
!!!
!!!
!!
!!!
!!
!!
!!!
!!!
!!
!!!
!!
!!
!!
!!
!!
!!!
!!!
!!!
!!!
!!
!!
!!
!!!
!!!
!!
!!!
!!!
!!!
!!
!!
!!!
!!
!!!
!!
!!!
!!!
!!!
!!!
!!
\
!!
!!!
!!!
!!
!!
!!!
!!!
!!!
!!!
!!
!!!
!!!
!!!
!!
!!
!!!
!!!
!!
!!!
!!!
!!
!!!
!!!
Lake Ziway
Lake Koka
Lake Yardi
Lake Ertele
Lake Abijata
Lake DendiLake Ala Semite
Lake Wenchi
Lake Dalay
Lake Goletsho
Awash Wenz
Abay
Ramis
J ema
Bilate Wabe Shebele Wenz
Wechti Wenz
MugerW
enz
Addis Abeba
Nazret
Yilu
Gola
Lemi
Mine
Guna
Meki
Dera
Kula
Rago
Bube
Robi
Hobe
Bu-i
Teji
Ambo
Doba
Erer
GotaBike
Hirna
Wanje
Akaki
Chole
Iteya
Arara
Suten
Ada-a
Kibet
Deder
Asela
Ramis
Ziway
Magna
ModjoHmero
Harew
Sheno
Fiche
Robit
Sagure
Diksis
Arerti
Agemti
Molale
Sodoma
Merewa
Woliso
Huruta
Hujufa
Tibila
Koshim
Ombole
Dilila
Bedesa
Godina
Ginchi
Asebot
Mesala
Chacha
Gewane
Dalocha
Chancho
Fulensa
Gelemso
Melkasa
Endibir
Roepeyh
Enewari
Meranga
Rukeyisa
Butajira
Gunchire
Dida Adi
Metehara
Aro Dimtu
Adis Amba
Tulu Bolo
Muke Ture
Haro Kile
Adis Alem
Harawacha
Tarma Ber
Welenchiti
Mucha Roba
Melka Jilo
Debre Sina
Goha Tsion
Debre Tsige
Arba Reketi
Midre Kebda
Bantu Liben
Addis Hiwot
Chefe Donsa
Debre Zeyit
Alem Ketema
Gojo (Jeldu)
Guba Koricha
Asebe Teferi
Shola Gebeya
Debre Birhan
Teferi Birhan
Anchar Bedeyi
Gebre Guracha
Ejere N Shewa
Sire W Hararghe
Arb Gebeya W Shewa
Abomsa (Tinsae Birhan)
Loko
Bofa
Arba
Muger
Eurdo
Koshe
Fetra
Duber
Beltu
Jihur
Sembo
Afdem
Dejen
Ejersa
Boreda
Segele
Kutara
Gebiba
Deneba
Fitale
Mezezo
Jebuha
Adulala
Ankober
Kechemo
Sululta
Ginager
Chifara
Mechara
Berehet
KurkuraDinkiti
Kachisi
Mendida
Tedo Ber
Delajebo
Jima Arsi
Alem Tena
Yemistina
Adami Tulu
Mama Midir
Sirtu Ager
Alem Gebeya
Melka Werer
Biyo Karaba
Tikur Chika
Hagere Sernay
Sheik Hussein
Melka Kunture
41°0'0"E
41°0'0"E
40°0'0"E
40°0'0"E
39°0'0"E
39°0'0"E
38°0'0"E
38°0'0"E
10°0
'0"N
10°0
'0"N
9°0'
0"N
9°0'
0"N
8°0'
0"N
8°0'
0"N
400000
400000
500000
500000
600000
600000
700000
700000
9000
00
9000
00
1000
000
1000
000
1100
000
1100
000
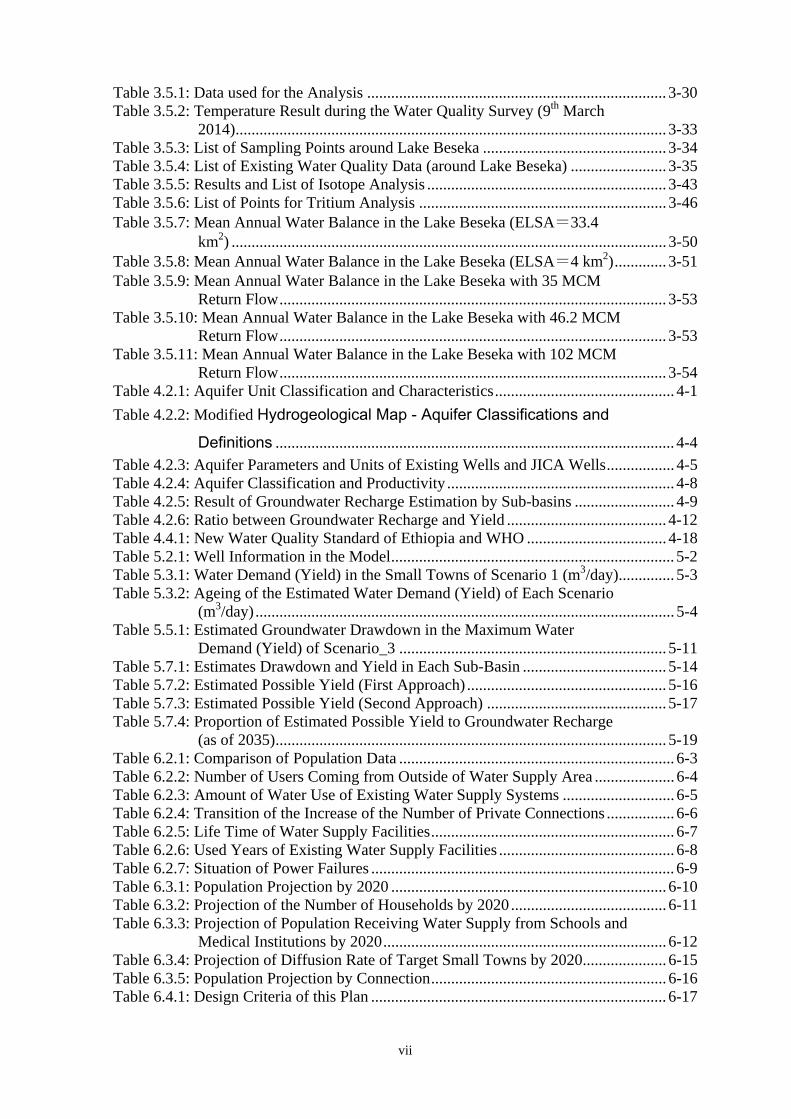
LegendStudy Area
Towns
\ Capital
!5 Regional Capital
!!! Major towns
!! Other towns
Major Rivers
Roads
Trunk
Link
Main Access
Feeder
Collector
New Proposed
Unclassified
0 5025km
´
LOCATION MAP
AbbayAwash
Wabi Shebele Aysha
Genale-Dawa
Tekeze
Omo-Gibe
Denakle
Baro-Akobo
Rift Valley
Mereb
Aysha
OROMIA
SOMALI REGION
AMHARA
AFAR
TIGRAY
SOUTHERN REGIO
50°0'0"E
45°0'0"E
45°0'0"E
40°0'0"E
40°0'0"E
35°0'0"E
35°0'0"E
15°0
'0"N
10°0
'0"N
10°0
'0"N
5°0'
0"N
5°0'
0"N
LegendStudy Area
Region
Major Basin 0 200 400100km
´
Addis Ababa
Project Area
Federal Democratic Republic of Ethiopia
Project Area
i
CONTENTS Location Map Contents List of Tables List of Figures Abbreviations Project Photo
Page:
1 Project Summary ................................................................. 1-1
1.1 Introduction ..................................................................................................... 1-1
1.2 Background of the Project ............................................................................... 1-1 1.3 Objectives of the Project .................................................................................. 1-2
1.4 Scope of the Project ......................................................................................... 1-2
1.5 Work schedule ................................................................................................. 1-2
1.6 Project area and target areas ............................................................................ 1-4 1.6.1 Project area .......................................................................................... 1-4 1.6.2 Target towns ........................................................................................ 1-4
1.7 Project team and persons involved .................................................................. 1-6 1.7.1 Project team ......................................................................................... 1-6 1.7.2 Persons of the Ethiopian side involved ................................................ 1-6
2 Natural and Socio-Economic Conditions in the Middle Awash River Basin .............................................................. 2-1
2.1 Introduction ..................................................................................................... 2-1
2.2 Natural conditions ............................................................................................ 2-1 2.2.1 Meteorology and Hydrology ................................................................ 2-1 2.2.2 Location, access and physiography ................................................... 2-14 2.2.3 Geology .............................................................................................. 2-16 2.2.4 Correlation of stratigraphy with previous studies .............................. 2-47 2.2.5 Geological structure and volcanic activity ......................................... 2-49 2.2.6 Hydrogeology .................................................................................... 2-50
2.3 Socio-economic conditions ............................................................................ 2-62 2.3.1 Development plan and related laws ................................................... 2-62 2.3.2 Socio-economic conditions in the Middle Awash River Basin ......... 2-62 2.3.3 Socio-economic conditions in the woredas with target small
towns .................................................................................................. 2-68
3 Hydrology and Hydrogeology Analysis around Lake Beseka ................................................................................ 3-1
3.1 Introduction ..................................................................................................... 3-1
3.2 The Lake Beseka Issues ................................................................................... 3-1 3.2.1 Current situation of Lake Beseka ......................................................... 3-1

ii
3.2.2 Water level of Lake Beseka and change in outflow ............................ 3-2 3.2.3 Irrigation plan and current situation around Lake Beseka ................... 3-2
3.3 Topography, geology and geological structure ............................................... 3-3 3.3.1 Topography .......................................................................................... 3-3 3.3.2 Geology ................................................................................................ 3-5 3.3.3 Geological structure ........................................................................... 3-17
3.4 Hydrogeology ................................................................................................ 3-19 3.4.1 Aquifer classification and groundwater Flow .................................... 3-19 3.4.2 Hydrogeological map and cross-sections .......................................... 3-26
3.5 Inflow situation of springs and irrigation water ............................................ 3-29 3.5.1 Ageing of spring inflow by satellite image analysis .......................... 3-29 3.5.2 Results of water quality testing .......................................................... 3-33 3.5.3 Estimation of irrigation return flow ................................................... 3-46
3.6 Analyses on Groundwater Recharge and Movement for Lake Beseka Area ............................................................................................................... 3-58 3.6.1 Return flow from the irrigation area .................................................. 3-58 3.6.2 The result of 1st analysis (criteria) ..................................................... 3-58 3.6.3 The result of 2nd analysis (criteria) .................................................... 3-59 3.6.4 The result of 3rd analysis (Criteria) .................................................... 3-60 3.6.5 Comparison between the irrigation return flow and water
level rise in Lake Beseka ................................................................... 3-61
3.7 Discussions .................................................................................................... 3-62
4 Groundwater Potential ........................................................ 4-1
4.1 Introduction ..................................................................................................... 4-1
4.2 Groundwater potential ..................................................................................... 4-1 4.2.1 Aquifer classification and characteristics ............................................ 4-1 4.2.3 Groundwater recharge and yield .......................................................... 4-9
4.3 Hydrogeological map and groundwater flow ................................................ 4-12 4.4 Water quality testing ...................................................................................... 4-16
4.4.1 Analysis items, methodology and analysis results ............................. 4-16 4.4.2 Characteristics of the water quality ................................................... 4-21
4.5 Summary ........................................................................................................ 4-26
5 Groundwater Modeling to Simulate Future Water Use and Evaluate Potential for Groundwater Development ....... 5-1
5.1 Introduction ..................................................................................................... 5-1
5.2 Specifications of planned wells ....................................................................... 5-1
5.3 Future pumping scenarios ................................................................................ 5-2
5.4 Specification in analysis of transient flow ....................................................... 5-5 5.4.1 Parameter ............................................................................................. 5-5 5.4.2 Period specification .............................................................................. 5-5 5.4.3 Rainfall specification ........................................................................... 5-5
5.5 Results of future simulation ............................................................................. 5-6

iii
5.5.1 The fluctuation of groundwater ........................................................... 5-6 5.5.2 Result of drawdown of groundwater ................................................. 5-11
5.6 Effect of groundwater drawdown on surrounding areas ............................... 5-11
5.7 Approaches to the evaluation of potential amount by the groundwater development ............................................................................. 5-12 5.7.1 Estimated yield and prediction of groundwater fluctuation ............... 5-13 5.7.2 Estimation of the possible yield ......................................................... 5-16
6 Water Supply Plan of Small Towns ..................................... 6-1
6.1 Introduction ..................................................................................................... 6-1
6.2 Review of the results of basic survey .............................................................. 6-2 6.2.1 Population for water supply ................................................................. 6-2 6.2.2 Users coming from outside of water supply area ................................ 6-2 6.2.3 Amount of water usage ........................................................................ 6-4 6.2.4 Increase of the number of private connections .................................... 6-6 6.2.5 The condition of wear and tear (aging) of the existing water
supply facilities .................................................................................... 6-7 6.2.6 Condition of commercial electric power supply .................................. 6-9
6.3 Target year and estimated population .............................................................. 6-9 6.3.1 Target year ........................................................................................... 6-9 6.3.2 Estimated population of each year ..................................................... 6-10
6.4 Water demand ................................................................................................ 6-17 6.4.1 Planning criteria ................................................................................. 6-17 6.4.2 Daily average water supply amount ................................................... 6-17 6.4.3 Planning daily average water supply amount and daily
maximum water supply amount ......................................................... 6-19
6.5 Groundwater development ............................................................................ 6-20 6.5.1 Evaluation of groundwater potential .................................................. 6-20 6.5.2 Aquifer classification and characteristic ............................................ 6-23 6.5.3 Possibility of groundwater development ........................................... 6-24
6.6 Water supply plan of small towns ................................................................. 6-27 6.6.1 Verification of rationality to elaborate water supply plan in
small towns ........................................................................................ 6-27 6.6.2 Outline of provisional water supply planning .................................... 6-30 6.6.3 Water supply scheme and scale for new water supply
facilities .............................................................................................. 6-32 6.6.4 Design criteria of water supply facilities ........................................... 6-33 6.6.5 Facility plan and general design ........................................................ 6-34 6.6.6 Outline of water supply facility plan ................................................. 6-38 6.6.7 Provisional estimation for water supply plan .................................... 6-39 6.6.8 Study of alternative water supply plan .............................................. 6-42
6.7 Operation and maintenance plan for water supply facility ............................ 6-44 6.7.1 Current organization and administration of existing water
office .................................................................................................. 6-44 6.7.2 Issues of water supply office ............................................................. 6-49 6.7.3 Operation and maintenance plan ........................................................ 6-51 6.7.4 Operation and maintenance cost ........................................................ 6-53

iv
6.7.5 Capacity development plan ................................................................ 6-56
7 Environmental and Social Consideration ............................ 7-1
7.1 Introduction ..................................................................................................... 7-1
7.2 Outline of the Project components .................................................................. 7-1
7.3 Basic environmental and social conditions ..................................................... 7-1 7.3.1 General information of natural environmental condition .................... 7-1 7.3.2 General information of social condition .............................................. 7-1
7.4 Classification of environmental category ........................................................ 7-2
7.5 Environmental system and organization in Ethiopia ....................................... 7-2
7.6 Alternatives include zero options .................................................................... 7-3
7.7 Scoping and TOR of environmental and social consideration ........................ 7-3
7.8 Results of survey ............................................................................................. 7-3 7.9 IEE, mitigation measures and plan of environmental monitoring ................... 7-4
7.10 Discussions with stakeholder ........................................................................... 7-4
7.11 Conclusions ..................................................................................................... 7-4
8 Evaluation of Provisional Water Supply Plans and Selection of Priority Small Towns ........................................ 8-1
8.1 Introduction ..................................................................................................... 8-1 8.2 Groundwater development potential ............................................................... 8-1
8.2.1 Potential of water quantity ................................................................... 8-1 8.2.2 Potential of water quality ..................................................................... 8-1
8.3 Difficulty of access to safe drinking water ...................................................... 8-3 8.3.1 Current volume of safe drinking water supply .................................... 8-3 8.3.2 Sufficiency rate of safe drinking water ................................................ 8-4
8.4 Beneficial impact ............................................................................................. 8-4 8.4.1 Beneficial impact ................................................................................. 8-4 8.4.2 Cost effectiveness ................................................................................ 8-5
8.5 O&M capacities ............................................................................................... 8-6 8.5.1 O&M organization ............................................................................... 8-6 8.5.2 Willingness to pay water tariff ............................................................. 8-7
8.6 Environmental and social impacts ................................................................... 8-8 8.6.1 Environmental impact .......................................................................... 8-8 8.6.2 Social impact ........................................................................................ 8-8
8.7 Scoring criteria for selecting priority small towns .......................................... 8-9
8.8 Conclusion ..................................................................................................... 8-10
9 Conclusions and Recommendations ................................... 9-1
9.1 Conclusions ..................................................................................................... 9-1 9.1.1 Natural conditions ................................................................................ 9-1
v
9.1.2 Hydrology, Geology and Hydrogeology Analysis around Lake Beseka ......................................................................................... 9-3
9.1.3 Socio-economic conditions, water supply plan of small towns, and project evaluation for the selection of priority small towns .......................................................................................... 9-4
9.2 Lessons learned and recommendations ........................................................... 9-6 9.2.1 Introduction .......................................................................................... 9-6 9.2.2 Actual use of groundwater database .................................................... 9-6 9.2.3 Recommendations to the Ethiopia side of good practices for
the drilling wells monitoring and improvement of drilling technology ............................................................................................ 9-7
9.2.4 Effective utilization of the water supply plan ...................................... 9-8 9.2.5 Groundwater development and management ...................................... 9-9 9.2.6 Countermeasure for the control of Lake Beseka level rise ................ 9-12
vi
List of Tables
Page: Table 1.6.1: Target Small Town ......................................................................................... 1-4 Table 1.7.1: JICA Project Team ......................................................................................... 1-6 Table 1.7.2: List of Steering Committee Members ............................................................ 1-7 Table 1.7.3: List of C/P Personnel ...................................................................................... 1-7 Table 2.2.1: Monthly Mean Evaporation at 11 Observatories ........................................... 2-4 Table 2.2.2: Temperature, Relative Humidity, and Sunshine Hours at Several
Stations in and around the Middle Awash River Basin ................................ 2-4 Table 2.2.3: Mean 10-day Runoff at Major Stations on the Middle Awash ...................... 2-6 Table 2.2.4: Summary of Sub-basins ................................................................................. 2-9 Table 2.2.5: Selected Stations for BFI Calculation .......................................................... 2-10 Table 2.2.6: Mean Annual Runoff and Rainfall for Selected Stations ............................. 2-11 Table 2.2.7: Annual Groundwater Recharge in 12 Station’s Catchments ........................ 2-12 Table 2.2.8: Result of Groundwater Recharge Estimation by Sub-basins ....................... 2-13 Table 2.2.9: Water Balance in Sub-basins ........................................................................ 2-14 Table 2.2.10: Stratigraphy in Adama Town-Mt. Boseti ................................................... 2-18 Table 2.2.11: Stratigraphy in Kone-Mt. Fentale and its Surrounding Areas .................... 2-19 Table 2.2.12: Stratigraphy in Mojo Town-Arerti Town-Debre Birhan Town and
Surrounding Areas ....................................................................................... 2-20 Table 2.2.13: Stratigraphy in Awash Town-Asebe Teferi Town ..................................... 2-21 Table 2.2.14: Correlation of Stratigraphy in the Study Area ........................................... 2-22 Table 2.2.15: Correlation of Stratigraphy with Existing Documents and Maps .............. 2-48 Table 2.2.16: List of References ....................................................................................... 2-50 Table 2.2.17: Number of Data by Parameter in Well Database (with coordinates) ......... 2-53 Table 2.2.18: Aquifer Lithology and Composition Ratio of Existing Wells .................... 2-57 Table 2.2.19: Main Aquifer Information of Existing Wells ............................................. 2-58 Table 2.2.20: Existing and JICA Wells Correlated with Strata ........................................ 2-59 Table 2.2.21: Strata Observed in JICA Wells and Results of Pumping Tests .................. 2-60 Table 2.3.1: Population Census Data of each Ethiopian Regional State in 1994,
in 2007, and in 2013 .................................................................................... 2-62 Table 2.3.2: 18 Zones in Oromia Region ......................................................................... 2-63 Table 2.3.3: Characteristics of Legend between the Target Towns (for Access
Route Map) .................................................................................................. 2-66 Table 2.3.4: Construction Period and Route for Ethiopia-China Railway Project
from Addis Ababa to Djibouti ..................................................................... 2-68 Table 2.3.5: Number of Schools in Woredas ................................................................... 2-69 Table 2.3.6: Numbers of Children and the School Attendance in Woredas ..................... 2-69 Table 2.3.7: Composition of Land Use Conditions in Woredas ....................................... 2-70 Table 2.3.8: Main Crops Yield of Agriculture in 2013 in Woredas ................................. 2-71 Table 2.3.9: Number of Livestock in Woredas ................................................................ 2-71 Table 2.3.10: Number of Agriculture and Livestock-related Facilities ............................ 2-72 Table 2.3.11: Number and Type of Water-related Diseases in Woredas ......................... 2-72 Table 2.3.12: Type and Number of Latrine Facilities in Woredas ................................... 2-73 Table 3.2.1: Major Irrigation Schemes in the Lake Beseka Watershed ............................. 3-2 Table 3.3.1: Classification and Characteristics of Topography around Lake
Beseka ........................................................................................................... 3-4 Table 3.4.1: Existing Wells and JICA Wells with Columnar Section around Lake
Beseka ......................................................................................................... 3-23 Table 3.4.2: Aquifer Unit Classification and Characteristics around Lake Beseka ......... 3-25
vii
Table 3.5.1: Data used for the Analysis ........................................................................... 3-30 Table 3.5.2: Temperature Result during the Water Quality Survey (9th March
2014) ............................................................................................................ 3-33 Table 3.5.3: List of Sampling Points around Lake Beseka .............................................. 3-34 Table 3.5.4: List of Existing Water Quality Data (around Lake Beseka) ........................ 3-35 Table 3.5.5: Results and List of Isotope Analysis ............................................................ 3-43 Table 3.5.6: List of Points for Tritium Analysis .............................................................. 3-46 Table 3.5.7: Mean Annual Water Balance in the Lake Beseka (ELSA=33.4
km2) ............................................................................................................. 3-50 Table 3.5.8: Mean Annual Water Balance in the Lake Beseka (ELSA=4 km2) ............. 3-51 Table 3.5.9: Mean Annual Water Balance in the Lake Beseka with 35 MCM
Return Flow ................................................................................................. 3-53 Table 3.5.10: Mean Annual Water Balance in the Lake Beseka with 46.2 MCM
Return Flow ................................................................................................. 3-53 Table 3.5.11: Mean Annual Water Balance in the Lake Beseka with 102 MCM
Return Flow ................................................................................................. 3-54 Table 4.2.1: Aquifer Unit Classification and Characteristics ............................................. 4-1 Table 4.2.2: Modified Hydrogeological Map - Aquifer Classifications and
Definitions .................................................................................................... 4-4 Table 4.2.3: Aquifer Parameters and Units of Existing Wells and JICA Wells ................. 4-5 Table 4.2.4: Aquifer Classification and Productivity ......................................................... 4-8 Table 4.2.5: Result of Groundwater Recharge Estimation by Sub-basins ......................... 4-9 Table 4.2.6: Ratio between Groundwater Recharge and Yield ........................................ 4-12 Table 4.4.1: New Water Quality Standard of Ethiopia and WHO ................................... 4-18 Table 5.2.1: Well Information in the Model ....................................................................... 5-2 Table 5.3.1: Water Demand (Yield) in the Small Towns of Scenario 1 (m3/day).............. 5-3 Table 5.3.2: Ageing of the Estimated Water Demand (Yield) of Each Scenario
(m3/day) ......................................................................................................... 5-4 Table 5.5.1: Estimated Groundwater Drawdown in the Maximum Water
Demand (Yield) of Scenario_3 ................................................................... 5-11 Table 5.7.1: Estimates Drawdown and Yield in Each Sub-Basin .................................... 5-14 Table 5.7.2: Estimated Possible Yield (First Approach) .................................................. 5-16 Table 5.7.3: Estimated Possible Yield (Second Approach) ............................................. 5-17 Table 5.7.4: Proportion of Estimated Possible Yield to Groundwater Recharge
(as of 2035) .................................................................................................. 5-19 Table 6.2.1: Comparison of Population Data ..................................................................... 6-3 Table 6.2.2: Number of Users Coming from Outside of Water Supply Area .................... 6-4 Table 6.2.3: Amount of Water Use of Existing Water Supply Systems ............................ 6-5 Table 6.2.4: Transition of the Increase of the Number of Private Connections ................. 6-6 Table 6.2.5: Life Time of Water Supply Facilities ............................................................. 6-7 Table 6.2.6: Used Years of Existing Water Supply Facilities ............................................ 6-8 Table 6.2.7: Situation of Power Failures ............................................................................ 6-9 Table 6.3.1: Population Projection by 2020 ..................................................................... 6-10 Table 6.3.2: Projection of the Number of Households by 2020 ....................................... 6-11 Table 6.3.3: Projection of Population Receiving Water Supply from Schools and
Medical Institutions by 2020 ....................................................................... 6-12 Table 6.3.4: Projection of Diffusion Rate of Target Small Towns by 2020..................... 6-15 Table 6.3.5: Population Projection by Connection ........................................................... 6-16 Table 6.4.1: Design Criteria of this Plan .......................................................................... 6-17

viii
Table 6.4.2: Daily Average Water Supply Amount ......................................................... 6-18 Table 6.4.3: Planning Daily Average Water Supply Amount and Daily
Maximum Water Supply Amount ............................................................... 6-19 Table 6.5.1: Result of Groundwater Recharge Estimation by Sub-basin ......................... 6-22 Table 6.5.2: Ratio between Groundwater Recharge and Yield ........................................ 6-23 Table 6.5.3: Classification of Aquifer in the Middle Awash River Basin ....................... 6-24 Table 6.5.4: Well Specification and Hydrogeology in Target Small Towns ................... 6-26 Table 6.6.1: Excluded Small Towns from Water Supply Planning ................................. 6-28 Table 6.6.2: Small Towns which Overlap with Other Projects ........................................ 6-28 Table 6.6.3: Small Towns judged to have Insufficient Water Quality to be
excluded from the Water Supply Planning ................................................. 6-29 Table 6.6.4: Small Towns judged to have Sufficient Water Supply and to not
need Water Supply Planning Assistance ..................................................... 6-30 Table 6.6.5: Small Towns for which Provisional Water Supply Plans are
developed .................................................................................................... 6-31 Table 6.6.6: Share of Water Supply Volume between Existing Facilities and
New Facilities .............................................................................................. 6-32 Table 6.6.7: Specifications of Boreholes .......................................................................... 6-34 Table 6.6.8: Specifications of Intake Facilities ................................................................ 6-35 Table 6.6.9: Specifications of Submersible Motor Pump and Diesel Generator .............. 6-36 Table 6.6.10: Quantity of New Distribution Pipelines ..................................................... 6-37 Table 6.6.11: Outline of Construction Plan of New Water Supply Facilities .................. 6-38 Table 6.6.12: Outline of Renewal Plan of Existing Water Supply Facilities ................... 6-38 Table 6.6.13: Adopted Unit Prices for Provisional Estimation ........................................ 6-39 Table 6.6.14: Construction Cost of New Water Supply Facilities ................................... 6-40 Table 6.6.15: Renewal Cost of Existing Water Supply Facilities .................................... 6-40 Table 6.6.16: Implementation Cost .................................................................................. 6-41 Table 6.6.17: Assumed Implementation Cost by Japan’s Grant Aid ............................... 6-41 Table 6.6.18: Necessary Numbers of Boreholes with Hand Pump .................................. 6-42 Table 6.6.19: Comparison of Assumed Intake Capacity and Borehole Depth
between Piped Water Supply System and Borehole with Hand Pump ............................................................................................................ 6-43
Table 6.6.20: Specification and Quantities of Boreholes ................................................. 6-43 Table 6.6.21: Adopted Unit Price ..................................................................................... 6-43 Table 6.6.22: Implementation Cost .................................................................................. 6-43 Table 6.7.1: Operation and Maintenance Management Organization, Meeting
Situation and Income Record Documentation Situation ............................. 6-45 Table 6.7.2: Water Tariff of Target Towns ...................................................................... 6-46 Table 6.7.3: Type and Number of Staff of O&M Organization ....................................... 6-48 Table 6.7.4: Revenue, Expense and Remaining Funds (unit: Birr) .................................. 6-49 Table 6.7.5: Stakeholders and Their Roles on Operation and Maintenance
System of Water Supply Facilities .............................................................. 6-51 Table 6.7.6: Operation and Maintenance Organizations in 19 Small Towns ................... 6-52 Table 6.7.7: Manpower Plan ............................................................................................ 6-52 Table 6.7.8: Operation and Maintenance Cost ................................................................. 6-55 Table 6.7.9: Capacity Development Plan for Operation and Maintenance ...................... 6-56 Table 7.5.1 List of Projects that Require a Preliminary Study ........................................... 7-2 Table 8.2.1: Result of Water Quality Potential Evaluation ................................................ 8-1 Table 8.2.2: Result of Water Quality Potential Evaluation ................................................ 8-3 Table 8.3.1: Safe Drinking Water Supply Volume ............................................................ 8-3 Table 8.3.2: Sufficiency Rate of Safe Drinking Water ...................................................... 8-4

ix
Table 8.4.1: Projected Population as of 2020 ..................................................................... 8-5 Table 8.4.2: Classification of Target Small Towns as Towns or Kebele ........................... 8-6 Table 8.5.1: Existing Organization for Operation and Maintenance in Target
Small Towns .................................................................................................. 8-7 Table 8.5.2: Willingness to Pay Water Tariff ..................................................................... 8-7 Table 8.6.1: Environmental Impact .................................................................................... 8-8 Table 8.6.2: Social Impact .................................................................................................. 8-9 Table 8.7.1: Scoring Criteria for Selecting Priority Small Towns ................................... 8-10 Table 8.8.1: High Priority Small Towns .......................................................................... 8-11 Table 8.8.2: Results of the Scoring and Order of Prioritization of Target Small
Towns .......................................................................................................... 8-12 Table 9.1: Monitoring Items ............................................................................................. 9-11

x
List of Figures
Page: Figure 1.5.1: Outline of the Project Schedule .................................................................... 1-2 Figure 1.5.2: Workflow of the Project ................................................................................ 1-3 Figure 1.6.1: Project Area .................................................................................................. 1-5 Figure 2.2.1: Meteorological Stations in and around the Middle Awash River
Basin .............................................................................................................. 2-1 Figure 2.2.2: Historical Trend of Annual Rainfall at Addis Ababa (1951–2011) .............. 2-2 Figure 2.2.3: Isohyetal Map of the Middle Awash River Basin ......................................... 2-2 Figure 2.2.4: Historical Trend of Annual Rainfall in the Middle Awash River
Basin .............................................................................................................. 2-3 Figure 2.2.5: Monthly Evaporation at Three Observatories ............................................... 2-4 Figure 2.2.6: Monthly Temperature and Relative Humidity at Several Stations in
and around the Middle Awash River Basin .................................................. 2-5 Figure 2.2.7: Mean 10-day Runoff Hydrograph at Major Stations on the Middle
Awash ............................................................................................................ 2-6 Figure 2.2.8: Procedure of the Hydrological Analysis ....................................................... 2-8 Figure 2.2.9: Basin Division for Groundwater Recharge Estimation ................................ 2-8 Figure 2.2.10: Location Map of Selected Stations for BFI Calculation ........................... 2-10 Figure 2.2.11: Relationship between Catchment Area and BFI Values ........................... 2-11 Figure 2.2.12: Relationship between Catchment Area and Runoff Coefficient ............... 2-12 Figure 2.2.13: Location of the Study Area ....................................................................... 2-15 Figure 2.2.14: Distribution of African Rift Valley ........................................................... 2-16 Figure 2.2.15: Location Map of Outcrops ........................................................................ 2-23 Figure 2.2.16: Outcrop Photos of Alaji Basalts ................................................................ 2-25 Figure 2.2.17: Outcrop Photos of Huse Ridge Rhyolites ................................................. 2-25 Figure 2.2.18: Outcrop Photos of Debre Birhan Ignimbrite ............................................. 2-26 Figure 2.2.19: Outcrop Photos of Anchar Basalts ............................................................ 2-27 Figure 2.2.20: Outcrop Photos of Chefeko Rhyolites ...................................................... 2-28 Figure 2.2.21: Outcrop Photos of Birenti-Hada Rhyolites ............................................... 2-29 Figure 2.2.22: Outcrop Photos of Bokan Rhyolites ......................................................... 2-29 Figure 2.2.23: Outcrop Photos of Gara Gumbi Rhyolites ................................................ 2-30 Figure 2.2.24: Outcrop Photos of Lower Nazret Pyroclastic Deposits ............................ 2-31 Figure 2.2.25: Outcrop Photos of Upper Nazret Pyroclastic Deposits ............................. 2-32 Figure 2.2.26: Outcrop photos of Chilalo Trachybasalts.................................................. 2-32 Figure 2.2.27: Outcrop Photos of Bofa Basalts ................................................................ 2-33 Figure 2.2.28: Outcrop Photos of Dino Ignimbrite .......................................................... 2-35 Figure 2.2.29: Outcrop Photos of Pleistocene Rhyolites .................................................. 2-35 Figure 2.2.30: Outcrop Photos of Chefe Donsa Pyroclastic Deposits .............................. 2-36 Figure 2.2.31: Outcrop Photos of Zikwala Trachytes ...................................................... 2-36 Figure 2.2.32: Outcrop Photos of Sobebor Volcanic Sand Beds ..................................... 2-38 Figure 2.2.33: Outcrop Photos of Pleistocene Basalts ..................................................... 2-39 Figure 2.2.34: Outcrop Photos of Kone Ignimbrite .......................................................... 2-40 Figure 2.2.35: Outcrop Photos of Boseti-Kone Pumice Fall Deposits ............................. 2-41 Figure 2.2.36: Outcrop Photos of Fentale Volcanic Rocks .............................................. 2-41 Figure 2.2.37: Outcrop Photos of Fentale Ignimbrite ....................................................... 2-42 Figure 2.2.38: Outcrop Photos of Holocene Basalts ........................................................ 2-43 Figure 2.2.39: Outcrop Photos of Recent Rhyolitic Domes & Lava Flows ..................... 2-44 Figure 2.2.40: Geological Map of Study Area ................................................................. 2-45 Figure 2.2.41: Geological Cross-Section of Study Area .................................................. 2-46

xi
Figure 2.2.42: En Echelon” Arrangement of the Active Volcano-tectonic Axis within the Northern Part of the Ethiopian Rift ............................................ 2-50
Figure 2.2.43: Location Map of Existing Wells ............................................................... 2-54 Figure 2.2.44: Yield of Existing Wells ............................................................................. 2-55 Figure 2.2.45: Yield and Drilling Depth in West Hararge Zone ...................................... 2-56 Figure 2.2.46: Yield and Drilling Depth in East Shewa Zone, Amhara Region
and Others ................................................................................................... 2-56 Figure 2.3.1: Related Chart of Ethiopian Water Sector Policies and Plan ....................... 2-62 Figure 2.3.2: Organization Structure of the Relevant Department in MoWIE ................ 2-64 Figure 2.3.3: Organization Structure of the Relevant Departments in OWMEB ............. 2-65 Figure 2.3.4: Location and Access Road for 30 Target Towns in Oromia Region .......... 2-67 Figure 3.2.1: Location Map of Lake Beseka ...................................................................... 3-1 Figure 3.2.2: Time Series of Water Level of Lake Beseka (1912–2009) ........................... 3-2 Figure 3.2.3: Irrigation Projects in and around the Lake Beseka Watershed ..................... 3-3 Figure 3.3.1: Elevation Map around Lake Beseka ............................................................. 3-4 Figure 3.3.2: Topographic Classification Map around Lake Beseka (background:
shaded relief map created from ASTER DEM data) ..................................... 3-5 Figure 3.3.3: Geological Map around Lake Beseka ........................................................... 3-6 Figure 3.3.4: Geological Section around Lake Beseka ...................................................... 3-7 Figure 3.3.5: Outcrop Photos of Birenti-Hada Rhyolites ................................................... 3-8 Figure 3.3.6: Outcrop Photos of the Older Ignimbrite ....................................................... 3-9 Figure 3.3.7: Outcrop Photos of the Nura Hira Basalts .................................................... 3-10 Figure 3.3.8: Outcrop Photos of Dino Ignimbrite ............................................................ 3-10 Figure 3.3.9: Outcrop Photos of Sobebor Volcanic Sand Beds ....................................... 3-11 Figure 3.3.10: Outcrop Photos of the Pleistocene Basalts ................................................ 3-13 Figure 3.3.11: Outcrop Photos of Kone Ignimbrite .......................................................... 3-14 Figure 3.3.12: Outcrop Photos of the Fentale Volcanic Rocks ........................................ 3-15 Figure 3.3.13: Outcrop Photos of the Fentale Ignimbrite ................................................. 3-16 Figure 3.3.14: Outcrop Photos of the Recent Basalts ....................................................... 3-17 Figure 3.3.15: Photos of Alluvial Plains and Deposits ..................................................... 3-17 Figure 3.3.16: Outcrop Photos of Faults distributed in the Detailed Study Area ............. 3-18 Figure 3.4.1: Geological Map, Existing Wells and JICA Wells around Lake
Beseka ......................................................................................................... 3-20 Figure 3.4.2: Columnar Section of JICA Well (AW BH-3) and Geological
Correlation ................................................................................................... 3-21 Figure 3.4.3: Columnar Section of JICA Well (AW BH-4N) and Geological
Correlation ................................................................................................... 3-21 Figure 3.4.4: Columnar Section of JICA Well (AW BH-5) and Geological
Correlation ................................................................................................... 3-22 Figure 3.4.5: Groundwater Level Contour Map around Lake Beseka (Less than
100 m depth of Existing Wells) ................................................................... 3-24 Figure 3.4.6: Groundwater Level Contour Map around Lake Beseka (More than
100 m depth of Existing Wells) ................................................................... 3-24 Figure 3.4.7: Well Depth and Fluoride Concentration around Lake Beseka ................... 3-26 Figure 3.4.8: Hydrogeological Map around Lake Beseka ................................................ 3-27 Figure 3.4.9: Hydrogeological Section around Lake Beseka ........................................... 3-28 Figure 3.5.1: Result of Water Temperature Study around Lake Beseka .......................... 3-29 Figure 3.5.2: The Analysis Flow of Surface Temperature using Landsat Data ............... 3-30 Figure 3.5.3: Comparison of Surface Temperatures between Lake Beseka and
Lake Koka ................................................................................................... 3-31 Figure 3.5.4: Surface Temperature Distribution of Lake Beseka ..................................... 3-32

xii
Figure 3.5.5: Location Map of Water Quality Testing Points around Lake Beseka ........ 3-35 Figure 3.5.6: Trilinear Diagram around Lake Beseka ...................................................... 3-37 Figure 3.5.7: Hexadiagram at Sampling Points around Lake Beseka .............................. 3-38 Figure 3.5.8: Hexadiagram of Main Sampling Points at West of Lake Beseka ............... 3-39 Figure 3.5.9: Hexadiagram of Main Sampling Points at South West of Lake
Beseka ......................................................................................................... 3-40 Figure 3.5.10: Hexadiagram of Main Sampling Points at South of Lake Beseka ............ 3-41 Figure 3.5.11: Delta Diagram of Stable Isotope around Lake Beseka ............................. 3-45 Figure 3.5.12: Irrigation Efficiency Calculation Used in this Project .............................. 3-47 Figure 3.5.13: Water Balance in Isolated Lake Catchment .............................................. 3-49 Figure 3.5.14: Mean Annual Water Balance in the Lake Beseka (ELSA=33.4
km2) ............................................................................................................. 3-50 Figure 3.5.15: Mean Annual Water Balance in the Lake Beseka with Loss “Y”
(ELSA=4 km2) ........................................................................................... 3-51 Figure 3.5.16: Observed and Simulated Historical Changes of the Lake Water
Level ............................................................................................................ 3-52 Figure 3.5.17: Observed and Simulated Historical Changes of the Lake Surface
Area ............................................................................................................. 3-52 Figure 3.5.18: Mean Annual Water Balance in the Lake Beseka with 35 MCM
Return Flow ................................................................................................. 3-53 Figure 3.5.19: Mean Annual Water Balance in the Lake Beseka with 46.2 MCM
Return Flow ................................................................................................. 3-54 Figure 3.5.20: Mean Annual Water Balance in the Lake Beseka with 102 MCM
Return Flow ................................................................................................. 3-55 Figure 3.5.21: Simulated Time Series of the Lake Water Level with Irrigation
Return Flow ................................................................................................. 3-55 Figure 3.5.22: Simulated Time Series of the Lake Surface Area with Irrigation
Return Flow ................................................................................................. 3-56 Figure 3.5.23: Annual Additional Inflow to the Lake required for Explanation of
Actual Lake Rise ......................................................................................... 3-57 Figure 3.6.1: Results of Irrigation Return Flow and Water Level (50% of
Irrigation Return Flow) ............................................................................... 3-59 Figure 3.6.2: Result of Irrigation Return Flow and Water Level (Equal to the
Irrigation Return Flow) ............................................................................... 3-60 Figure 3.6.3: Result of Irrigation Return Flow and Water Level (Double of
Irrigation Return Flow) ............................................................................... 3-61 Figure 3.6.4: Comparison of the Water Level at Lake Beseka and Irrigation
Return Flow ................................................................................................. 3-61 Figure 4.2.1: Relationship between Well Depth and Yield in Project Area ....................... 4-6 Figure 4.2.2: Location Map of Sub-Basin, Small Towns and Model Existing
Wells ............................................................................................................ 4-11 Figure 4.3.1: Hydrogeological Map in the Middle Awash River Basin ........................... 4-13 Figure 4.3.2: Hydrogeological Cross Sections ................................................................. 4-14 Figure 4.3.3: Groundwater Table Contour Map ............................................................... 4-15 Figure 4.4.1: Location Map of Sampling Points for Water Quality Testing .................... 4-17 Figure 4.4.2: Point Map of High Concentration of Fluoride in Study Area (All
Types) .......................................................................................................... 4-20 Figure 4.4.3: Distribution Map of Concentration of Fluoride in Study Area ................... 4-20 Figure 4.4.4: Relationship between Well Depth and Concentration of Fluoride ............. 4-21 Figure 4.4.5: Trilinear Diagram (All Data) ...................................................................... 4-22 Figure 4.4.6: Distribution Map of the Hexadiagram (All Data) ....................................... 4-25
xiii
Figure 5.2.1: Location Map of the Target Small Towns (with Wells) ............................... 5-1 Figure 5.3.1: Aging Figure of Estimated Water Demand (Yield) of Each
Scenario ......................................................................................................... 5-4 Figure 5.4.1: Annual Mean Rainfall ................................................................................... 5-5 Figure 5.5.1: Estimated Groundwater Level Fluctuation (ES-12) ..................................... 5-6 Figure 5.5.2: Estimated Groundwater Level Fluctuation (ES-8) ....................................... 5-6 Figure 5.5.3: Estimated Groundwater Level Fluctuation (ES-9) ....................................... 5-7 Figure 5.5.4: Estimated Groundwater Level Fluctuation (ES-4) ....................................... 5-7 Figure 5.5.5: Estimated Groundwater Level Fluctuation (AR-1) ....................................... 5-7 Figure 5.5.6: Estimated Groundwater Level Fluctuation (AR-7) ....................................... 5-8 Figure 5.5.7: Estimated Groundwater Level Fluctuation (ES-2) ....................................... 5-8 Figure 5.5.8: Estimated Groundwater Level Fluctuation (ES-5) ....................................... 5-8 Figure 5.5.9: Estimated Groundwater Level Fluctuation (AR-4) ....................................... 5-9 Figure 5.5.10: Estimated Groundwater Level Fluctuation (AR-5) ..................................... 5-9 Figure 5.5.11: Estimated Groundwater Level Fluctuation (WH-2) ................................... 5-9 Figure 5.5.12: Estimated Groundwater Level Fluctuation (WH-3) ................................. 5-10 Figure 5.5.13: Estimated Groundwater Level Fluctuation (WH-5) ................................. 5-10 Figure 5.5.14: Estimated Groundwater Level Fluctuation (WH-7) ................................. 5-10 Figure 5.6.1: Drawdown Map of the Surrounding Area in the Second Layer
(Scenario 3) ................................................................................................. 5-12 Figure 5.6.2: Drawdown Map of the Surrounding Area in the Third Layer
(Scenario 3) ................................................................................................. 5-12 Figure 5.7.1: Correlation Chart of Estimates Drawdown and Yield in Three
Sub-Basins ................................................................................................... 5-15 Figure 5.7.2: Groundwater Level Contour Map ............................................................... 5-18 Figure 6.3.1: Logistic Curve Formula .............................................................................. 6-13 Figure 6.3.2: Model of Diffusion Rate ............................................................................. 6-14 Figure 6.5.1: Groundwater Recharge in Sub-Basin .......................................................... 6-21 Figure 6.6.1: Procedure for Screening of 30 Small Towns .............................................. 6-27 Figure 6.6.2: Groundwater Supply System with Distribution Reservoir on the
Ground ......................................................................................................... 6-33 Figure 6.6.3: Groundwater Supply System with Elevated Distribution Reservoir .......... 6-33 Figure 6.6.4: Groundwater Supply System with Hand Pump .......................................... 6-42 Figure 6.7.1: Support Structure for Maintenance Management ....................................... 6-47 Figure 8.2.1: Relationship between Fluoride Concentration Distribution and
Location of Small Towns .............................................................................. 8-2

xiv
Abbreviations AAU Addis Ababa University AGRAP Alidge Groundwater Resources Assessment Project AIDS Acquired Immune Deficiency Syndrome ALOS Advanced Land Observing Satellite ASTER Advanced Spaceborne Thermal Emission and Reflection Radiometer ASTER-GDEM ASTER-Global Digital Elevation Model BFI Base Flow Index CAD Computer Aided Design (System) CDE Center for Development and Environment, Ministry of Agriculture CFC Chloride Fluoride Carbon CREC China Railway Engineering Corporation CSA Central Statistical Agency CSE The Conservation Strategy of Ethiopia C/P Counterpart (organization or personnel) DB Datebase DCI Ductile Cast Iron DEM Digital Elevation Model DF/R Draft Final Report DTH Down-the-hole Hammer DWL Dynamic Water Level EA Environmental Assessment EC Electric Conductivity EEPCO Ethiopia Electric Power Corporation EGRAP Ethiopian Groundwater Resources Assessment Program EIA Environmental Impact Assessment EIGS Ethiopian Institute of Geological Survey, now renamed as Geological Survey of
Ethiopia (GSE) EL Elevation ELC Elc electroconsult milano and Geotermica italiana pisa, Italia (an Italian
Consultant) ELSA Equilibrium Lake Surface Area EMA Ethiopia Mapping Agency ENGDA Ethiopian National Groundwater Database ENGWIS Ethiopian National Groundwater Information System EPA Environmental Protection Agency, now renamed as Ministry of Environment
and Forest (MEF) EPC Environmental Protection Council ERA Ethiopian Road Authority ERC Ethiopian Railway Corporation ESA Ethiopian Standard Agency ESIA Environmental and Social Impact Assessment ET Evapotranspiration EWCA Ethiopian Wildlife Conservation Authority EWTEC Ethiopia Water Technology Center, now renamed as Ethiopia Water
Technology Institute (EWTI) EWTI Ethiopia Water Technology Institute, formerly known as Ethiopia Water
Technology Center (EWTEC) F/R Final Report FAO Food and Agriculture Organization of the United Nations FAO-AGLW FAO Water Resource, Development and Management Services FDM Finite Difference Method FEM Finite Element Method GD Groundwater Directorate (of MoWIE)

xv
GDP Gross Domestic Product GHB General Head Boundary GIS Geographical Information System GL Ground Level GNI Gross National Income GPS Global Positioning System GSE Geological Survey of Ethiopia GSP Galvanized Steel Pipe GTP Growth and Transformation Plan GWR Groundwater Recharge HIV Human Immunodeficiency Virus IAEA International Atomic Energy Agency IC/R Inception Report IEE Initial Environmental Examination IMF International Monetary Fund INGEIS Instituto de Geocronología y Geología Isotópica (Institute of Geochronology
and Geology, Argentine) ISO International Standard Organization ISODATA The Iterative Self-Organizing Data Analysis Technique IT/R Interim Report ITCZ Inter-tropical Convergence Zone JICA Japan International Cooperation Agency LEL Local Evaporation Line LMWL Local Meteoric Water Line M&E Monitoring and Evaluation M/M Minutes of Meeting MCM Million Cubic Meter MDGs Millennium Development Goals MEF Ministry of Environment and Forest, formerly known as Environmental
Protection Agency (EPA) MER Main Ethiopian Rift MOA Ministry of Agriculture MoWR Ministry of Water Resources, now renamed as Ministry of Water, Irrigation and
Electricity (MoWIE) MoWE Ministry of Water and Energy, now renamed as Ministry of Water, Irrigation
and Electricity (MoWIE) MoWIE Ministry of Water, Irrigation and Electricity, formerly known as Ministry of
Water, Irrigation and Energy(MoWIE), Ministry of Water and Energy (MoWE) or Ministry of Water Resources (MoWR)
MSE Metehara Sugar Estate MWL Meteoric Water Line NASA National Aeronautics and Space Administration, USA NGI National Groundwater Institute NGO Non-Governmental Organization NMA National Meteorology Agency OLEPB Oromia Land and Environmental Protection Bureau ORP Oxidation and Reduction Potential O(R)WMEB Oromia (Regional) Water, Material and Energy Development Bureau OWNP One WASH National Program OWWDSE Oromia Water Works Design and Supervision Enterprise P/R Progress Report PA Preliminary (Environmental) Assessment PASDEP Plan for Accelerated and Sustained Development to End Poverty PC Personal Computer

xvi
PPP Purchasing Power Parity PRSP Poverty Reduction Strategy Paper PVC Polyvinyl Chloride R/D Record of Discussions REA Regional Environmental Agencies RESTEC Remote Sensing Technology Center of Japan RVLB Rift Valley Lakes Basin SC Steering Committee SCM Steering Committee Member or Steering Committee Meeting SDPRP Sustainable Development and Poverty Reduction Program SEA Strategic Environmental Assessment SFGS Streamflow Gauging Station SP Spontaneous potential SPOT Satellite Pour l'Observation de la Terre (French Satellite for Earth Observation)SRTM Shuttle Radar Topography Mission SS Suspended Solids TDS Total Dissolved Solids TEM Transient (or Time-domain) Electromagnetic Method TIR Thermal Infrared TM Thematic Mapper TOR Terms of Reference TU Tritium Unit TWSSO Town Water Supply Service Office TWSSSE Town Water Supply and Sewerage Service Enterprise UAP Universal Access Program UNEP United Nations Environment Programme UNESCO United Nations Educational, Scientific and Cultural Organization UNICEF United Nations Children’s Fund uPVC Unplasticized Polyvinyl Chloride USBR United States Bureau of Reclamation USGS United States Geological Survey UTM Universal Transversal Mercator VES Vertical Electrical Sounding VIP Ventilation Improved Pit WASH Water Supply, Sanitation and Hygiene Program WB World Bank WC Water Committee WFB Wonji Fault Belt WHO World Health Organization WSDP Water Sector Development Program WSSM Water Supply and Sanitation Master Plan WWDSE Water Works Design and Supervision Enterprise WWMEO Woreda Water, Mineral and Energy Office ZWMEO Zonal Water, Mineral and Energy Office
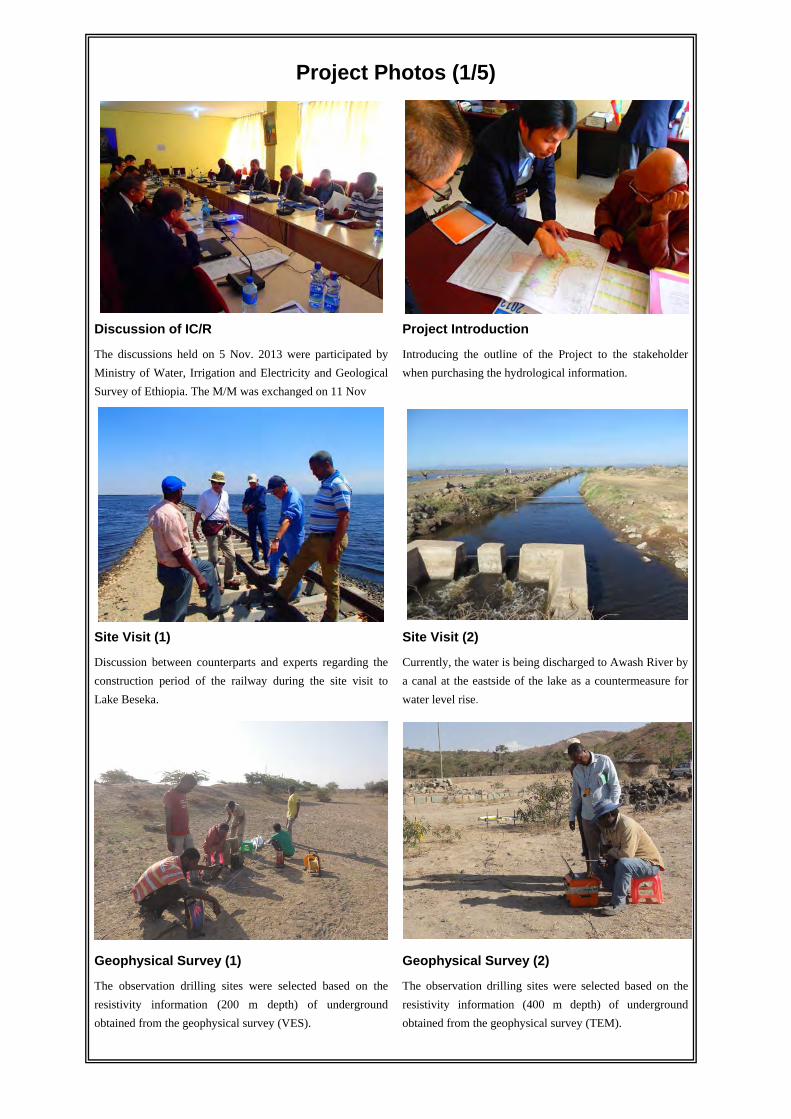
Project Photos (1/5)
Discussion of IC/R
The discussions held on 5 Nov. 2013 were participated by Ministry of Water, Irrigation and Electricity and Geological Survey of Ethiopia. The M/M was exchanged on 11 Nov
Project Introduction
Introducing the outline of the Project to the stakeholder when purchasing the hydrological information.
Site Visit (1)
Discussion between counterparts and experts regarding the construction period of the railway during the site visit to Lake Beseka.
Site Visit (2)
Currently, the water is being discharged to Awash River by a canal at the eastside of the lake as a countermeasure for water level rise.
Geophysical Survey (1)
The observation drilling sites were selected based on the resistivity information (200 m depth) of underground obtained from the geophysical survey (VES).
Geophysical Survey (2)
The observation drilling sites were selected based on the resistivity information (400 m depth) of underground obtained from the geophysical survey (TEM).

Project Photos (2/5)
Geological Survey (1) The C/P from MoWIE has accompanied the experts in the geological survey for at least 3 months to finalize the geological map.
Geological Survey (2) Megacha highly welded tuff that overlies Bofa Basalt to the west of Bofa.
Socio-Economic Survey Focus Group discussions regarding water use status at Kinteri Town of Oromia Region.
Water Usage Inventory Survey (1) Survey of existing water facilities at Geldiya Town in Oromia Region.
Water Usage Inventory Survey (2) Situation at the public water tap of Areda Town of Oromia Region. Twenty litres of water cost around 2 Japanese Yen.
Sampling for IAEA Analysis The tubing method of sampling Helium gas using copper pipe was instructed in order to facilitate IAEA stable isotope analysis.
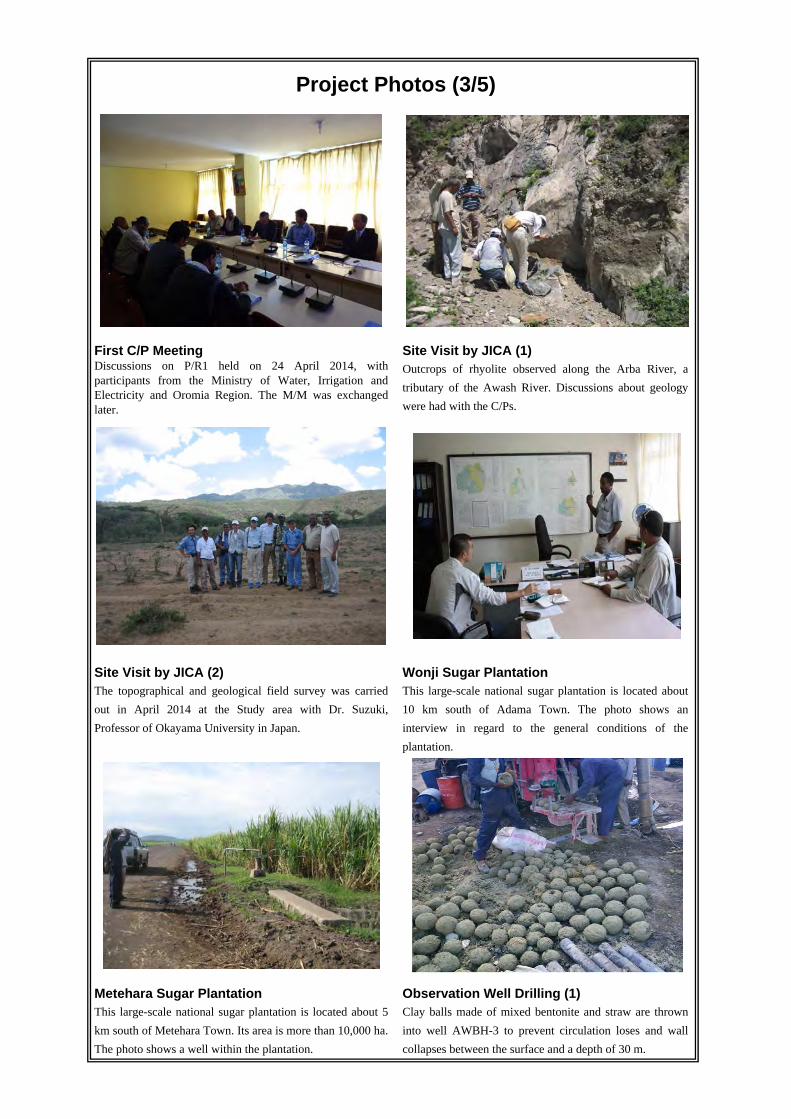
Project Photos (3/5)
First C/P Meeting Discussions on P/R1 held on 24 April 2014, with participants from the Ministry of Water, Irrigation and Electricity and Oromia Region. The M/M was exchanged later.
Site Visit by JICA (1) Outcrops of rhyolite observed along the Arba River, a tributary of the Awash River. Discussions about geology were had with the C/Ps.
Site Visit by JICA (2) The topographical and geological field survey was carried out in April 2014 at the Study area with Dr. Suzuki, Professor of Okayama University in Japan.
Wonji Sugar Plantation This large-scale national sugar plantation is located about 10 km south of Adama Town. The photo shows an interview in regard to the general conditions of the plantation.
Metehara Sugar Plantation This large-scale national sugar plantation is located about 5 km south of Metehara Town. Its area is more than 10,000 ha. The photo shows a well within the plantation.
Observation Well Drilling (1) Clay balls made of mixed bentonite and straw are thrown into well AWBH-3 to prevent circulation loses and wall collapses between the surface and a depth of 30 m.

Project Photos (4/5)
Observation Well Drilling (2) Well cleaning at AWBH-11: High-pressured air is sent into the well to discharge the remaining mud after the completion of the well.
Observation Well Drilling (3) Pumping test at AWBH-1: The volume of pumped groundwater is measured by reading the water level (cm) which overflows the triangular notch tank.
Sampling for Water Quality Test (1) Water for quality testing was sampled in existing wells, springs, river water, lake water, and so on. The water quality was classified by analysis. The photo shows the sampling of a deep well in East Shewa
Sampling for Water Quality Test (2) The photo shows the sampling of spring water at the west side of Lake Beseka. The results of analysis of the spring flowing into Lake Besaka are different from that of other springs.
Sampling for Water Quality Test (3)
Water quality sampling was undertaken in the irrigation farm. The result shows the similar characteristic as south shore of Lake Beseka with high HCO3 which caused by the vegetation.
Discussion of Progress Report 2
Discussion of P/R2 was held on 24th July 2014 attended by the C/P from Ministry of Water, Irrigation and Energy and Oromia Region. The M/M was exchanged later.

Project Photos (5/5)
GIS Workshop
GIS Workshop was held on 30th January 2015 at MoWIE. The theme was about the outline of GIS database for groundwater resources assessment.
Tone Spring
Tone spring is located at the southwest of Lake Beseka. The discharge volume could not be measured since it is submerged though the spring can be observed.
Environmental and Social Consideration
Situation during an interview at Department of Education at Woreda Office in Mojo. The information/data related to water fetching situation enrollment rate was collected.
Discussion of Interim Report
Discussion of IT/R was held on 11th July 2015. The contents have been discussed with the Deputy Minister of MoWIE. The M/M was exchanged later.
Technology Transfer Seminar
The Technology Transfer Seminar was held on 27th October 2015. The presentation includes the output, tasks and recommendations. The seminar was attended by C/Ps (MoWIE, EWTI, GSE, OWMEB and AAU) and NGOs.
Discussion of Draft Final Report
Discussion of DF/R was held on 27th October 2015 and the utilization method of this reports after the Project period have been discussed. The M/M was exchanged later.

Chapter 1
Project Summary

The Project for Groundwater Resources Assessment JICA in the Middle Awash River Basin, Final Report (Main Report) KOKUSAI KOGYO CO., LTD.
1-1
1 Project Summary
1.1 Introduction
This report was prepared to report the whole outputs of the Project for Groundwater Resources Assessment in the Middle Awash River Basin in the Federal Democratic Republic of Ethiopia (hereafter referred to as “the Project”) based on the results of the records of the discussions (hereafter referred to as “R/D”) agreed and signed by the Federal Democratic Republic of Ethiopia and the Japan International Cooperation Agency (hereafter referred to as “JICA”) on 27 May 2013. JICA organized a team of consultants (the Project Team) made up of 12 members to implement the Project. The Project started in October 2013 and completed in December 2015. The Project was executed through close collaboration between the Project Team and the counterpart personnel (hereafter referred to as “C/P”) of Ethiopia.
1.2 Background of the Project
The access ratio to improved drinking water sources in Ethiopia is 42% (96% in urban and 32% in rural areas) (UNICEF/WHO, 2008), which is far lower than the average coverage rate of 60% in Sub-Sahara Africa. Therefore, urgent action needs to be taken to secure safe water in Ethiopia. In 2011, the Government of Ethiopia (hereinafter referred to as “GoE”) formulated a national development plan called the Growth and Transformation Plan (GTP). The GTP set out four objectives with seven strategies. Improvement of access to safe water is mentioned in the strategy of “enhancing expansion and quality of social development”. In 2011, the GoE revised its Universal Access Program (UAP), which was originally issued in 2006 as a strategy for the water and sanitation sector. The updated UAP (UAP2) aims to improve the national average water supply access rate from 91.5% (estimation of UAP, 2010) to 100% in urban areas and from 65.8% (estimation of UAP, 2010) to 98% in rural areas by 2015 based on a water consumption per capita of 20 liters and 15 liters per day in urban and rural areas, respectively.
To achieve the aforementioned goal, it is important to develop groundwater sources that have a generally stable quantity with only slight seasonal fluctuations and relatively good quality. For better groundwater development in the Middle Awash River Basin, the plan shall be formulated based on the information of groundwater recharge and flow mechanisms and stored/developable amount (groundwater potential).
Under such circumstances, the GoE has requested the Government of Japan (hereinafter referred to as “GoJ”) to support a technical cooperation project for development of geological and hydrogeological maps on a scale of 1:250,000 in the Middle Awash River Basin and formulation of a provisional water supply scheme development plan in small towns in the Oromia Region. The area extends across three regions (the area of each region is: Oromia 55%, Afar 25% and Amhara 20%) and borders on the objective area of “the Study on Groundwater Resources Assessment in the Rift Valley Lakes Basin” in 2012 (hereinafter referred to as “the Rift Valley Study 2012”) in the southwest. It is crossed by the Blue Nile River Basin, which also contains National Highway No.1 and runs in a northwesterly direction. The area faces the Shebelle River Basin in the southeast.
In response to the above request, JICA dispatched a Detailed Planning Survey Team in September 2012 and formulated the framework of the Project through discussions with the GoE side. The Project includes the following: production of geological and hydrogeological maps, evaluation of groundwater potential, formulation of a provisional water supply scheme

The Project for Groundwater Resources Assessment JICA in the Middle Awash River Basin, Final Report (Main Report) KOKUSAI KOGYO CO., LTD.
1-2
development plan for the proposed 30 small towns (population of 15,000 or less) in the Oromia Region, selection of about 10 priority plans, etc. In addition, the project includes a study on the groundwater recharge and flow mechanism in Lake Beseka, which has caused severe inundation damage in the lakeside area due to its sudden and drastic surface water level rise since the 1960s.
1.3 Objectives of the Project
The objective of the Project is to enhance the capacities for the groundwater development planning and implementation of the Groundwater Directorate (hereafter referred to as “GD”) of Ministry of Water, Irrigation and Electricity (hereafter referred to as “MoWIE”) and Oromia Regional Water, Mineral and Energy Bureau (hereafter referred to as “OWMEB”) through the following activities: production of geological and hydrogeological maps, assessment of groundwater potential, formulation of provisional water supply facility scheme plans and selection of the priority plans therefrom.
1.4 Scope of the Project
The Project was implemented in accordance with the R/D, signed on May 27, 2013 and the Minutes of Meeting (hereafter referred to as “M/M”) relevant to the R/D. The Project Team undertaken the work items mentioned in the work schedule below to achieve the objectives mentioned above. The Project Team prepared the study reports as interim outputs and discussions thereon have been made among the Project Team, the GoE and JICA.
1.5 Work schedule
This Project, which commenced in October 2013, was completed in December 2015. The work plan of the Project is shown in Figure 1.5.1 and Figure 1.5.2 below:
Figure 1.5.1: Outline of the Project Schedule
Source: the Project Team, Data: JICA Instruction Document
Phases
Japanese FY
Months 10 11 12 1 2 3 4 5 6 7 8 9 10 11 12 1 2 3 4 5 6 7 8 9 10 11 12
Works in ETH
Works in JPN
Note: IC/R: Inception Report P/R: Progress Report IT/R: Interim ReportDF/R: Draft Final Report F/R: Final Report
FY2013
Seminar
Reports
Phase-I Phase-II
FY2015FY2014
〔A〕1st Works (Phase-I)〔D〕1st Works (Phase-II)
〔B〕1st Works (Phase-I) 〔C〕1st Works (Phase-II)
▲IC/R
▲IT/R
▲P/R1
▲DF/R
▲F/R
〔E〕2nd Works (Phase-II)
〔F〕2nd Works (Phase-II)
▲P/R2

The Project for Groundwater Resources Assessment JICA in the Middle Awash River Basin, Final Report (Main Report) KOKUSAI KOGYO CO., LTD.
1-3
Phase-Ⅱ2013 2014 2015
Month Oct Nov Dec Jan Feb Mar Apr May Jun Jul Aug Sep Oct Nov Dec Jan Feb Mar Apr May Jun Jul Aug
Works in Ethiopia
Phase-I
Works in Japan
ReportsSep Oct Nov Dec
A.3 Preparation of Inception Report
B.2 Procurement of Equipment
P/R 1 ▲ P/R 2 ▲IC/R ▲
A.4 Predeparture Meeting in Japan
A.1 Review of Existing Data / Information
B.1 Discussions on Inception Report
B.3 Satellite Image Analysis
B.4 Collection of existing Hydrogeological Information
B.5 Survey on Volcanic Geology
B.6 Hydrogeological Survey
B.7 Collection of existing Hydrometeorological Information
B.8 Hydrological Analysis
B.10 Test Well Drilling/Pumping Test (Sub-contract)
B.11 Automatic Gauge Setting / Groundwater Monitoring
B.12 Water Quality Survey (Sub-contract)
B.13 Preparation of GIS Database
B.9 Physical Exploration
B.19 Preparation of Progress Report 2
B.5 Survey on Volucanic Geology
B.6 Hydrogeological Survey
B.17 Survey on Environmental/Social Considerations
B.15 Survey on existing Water Supply Facilities in 30 Towns
B.16 Survey on Water Use in 30 Towns (Sub-contract)
B.14 Socio-economic Survey on 30 Towns in Oromia Region (Sub-contract)
B.18 Preparation of Progress Report 1
C.2 Groundwater Monitoring
C.3 Preparation of GIS Database
C.5 Production of Geological/Hydrogeological Maps
IT/R ▲ DF/R ▲ F/R ▲
C.5 Preparation of Interim Report
C.12 Preliminary Water Supply Planning in 30 Towns
C.11 Water Demand Projection in 30 Towns
C.4 Hydrological & Hydrogeological Survey on Lake Besaka
C.9 Study on Groundwater Recharge and Flow in Lake Besaka
D.2 Predeparture Meeting in Japan
D.1 Preparation of Draft Final Report
F.1 Preparation of Final Report
E.2 Technology Transfer Seminar
E.1 Discussions on Draft Final Report
Analyses on Lake Besaka
Tasks for Estimation of Groundwater Potential and Production of Geological / Hydrogeological Maps
Tasks for Groundwater Modeling
Tasks of Water Supply Planning for 30 Small Towns in Oromia Region
C.8 Evaluation of Groundwater Potential
C.7 Construction of Groundwater Model
C.12 Survey on Environmental/Social Considerations
C.10 Recommendations on Groundwater Development & Management
C.14 Evaluation of Water Supply Plans (Selection of Priority Plans)
A.2 Preparation of Basic Approach to the Study
C.1 Test Well Drilling/Pumping Test (Sub-contract)
Figure 1.5.2: Workflow of the Project
Source: the Project Team, Data: JICA Instruction Document

The Project for Groundwater Resources Assessment JICA in the Middle Awash River Basin, Final Report (Main Report) KOKUSAI KOGYO CO., LTD.
1-4
1.6 Project area and target areas
1.6.1 Project area
The Project area is the Middle Awash River Basin. Its coverage area is approx. 29,000 km2, and the areas subject to the hydrogeological map production and the water supply planning are approx. 20,000 km2 and 15,000 km2, respectively. The Project area is shown in Figure 1.6.1.
1.6.2 Target towns
Thirty (30) small towns, which are the target towns for the provisional water supply plan in the Oromia Region in the middle Awash River Basin, were selected with technical notes exchanged between the JICA Team and OWMEB. As a result of the field survey, Woredas and the small town names were confirmed. The target small towns are shown in Table 1.6.1.
Table 1.6.1: Target Small Town
Adama Zuriya Wonji Shewa Alemtena TownAdama Zuriya Geldiya TownAda A Dire TownBoset Bofa TownBoset Bole TownAda A Ude Dhankaka TownAda A Bekejo TownLume Kamise TownGimbichu Chefe Donsa TownGimbichu Areda TownLume Biyo TownLiben Chikuala Adulala TownSire Sire TownJeju Bolo TownJeju Arboye TownAseko Aseko TownMerti Golegota TownTiyo Gonde TownLodehetosa Arbe Gebeya TownAnchar Chorora TownAnchar Bedeyi TownGuba Qoricha Hardim TownGuba Qoricha BubeMieso Mieso TownMieso HargetiMieso Bordede TownMieso KinteriMieso AnenoMieso BeloMieso Kora
East Shewa
Arsi
West Hararge
Zone Woreda Town
Source: the Project Team, Data: OWMEB

The Project for Groundwater Resources Assessment JICA in the Middle Awash River Basin, Final Report (Main Report) KOKUSAI KOGYO CO., LTD.
1-5
Figure 1.6.1: Project AreaSource: the Project Team, Data: OWMEB
(m)
(m)
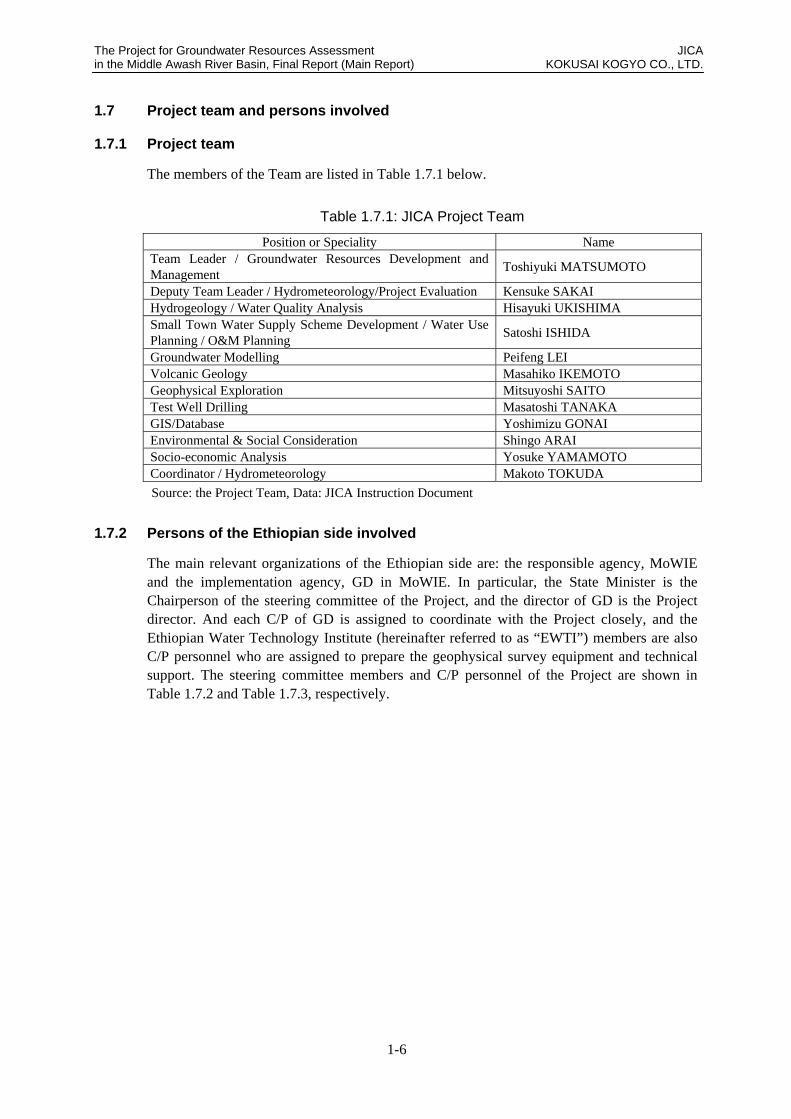
The Project for Groundwater Resources Assessment JICA in the Middle Awash River Basin, Final Report (Main Report) KOKUSAI KOGYO CO., LTD.
1-6
1.7 Project team and persons involved
1.7.1 Project team
The members of the Team are listed in Table 1.7.1 below.
Table 1.7.1: JICA Project Team
Position or Speciality Name Team Leader / Groundwater Resources Development and Management Toshiyuki MATSUMOTO
Deputy Team Leader / Hydrometeorology/Project Evaluation Kensuke SAKAI Hydrogeology / Water Quality Analysis Hisayuki UKISHIMA Small Town Water Supply Scheme Development / Water Use Planning / O&M Planning Satoshi ISHIDA
Groundwater Modelling Peifeng LEI Volcanic Geology Masahiko IKEMOTO Geophysical Exploration Mitsuyoshi SAITO Test Well Drilling Masatoshi TANAKA GIS/Database Yoshimizu GONAI Environmental & Social Consideration Shingo ARAI Socio-economic Analysis Yosuke YAMAMOTO Coordinator / Hydrometeorology Makoto TOKUDA
1.7.2 Persons of the Ethiopian side involved
The main relevant organizations of the Ethiopian side are: the responsible agency, MoWIE and the implementation agency, GD in MoWIE. In particular, the State Minister is the Chairperson of the steering committee of the Project, and the director of GD is the Project director. And each C/P of GD is assigned to coordinate with the Project closely, and the Ethiopian Water Technology Institute (hereinafter referred to as “EWTI”) members are also C/P personnel who are assigned to prepare the geophysical survey equipment and technical support. The steering committee members and C/P personnel of the Project are shown in Table 1.7.2 and Table 1.7.3, respectively.
Source: the Project Team, Data: JICA Instruction Document
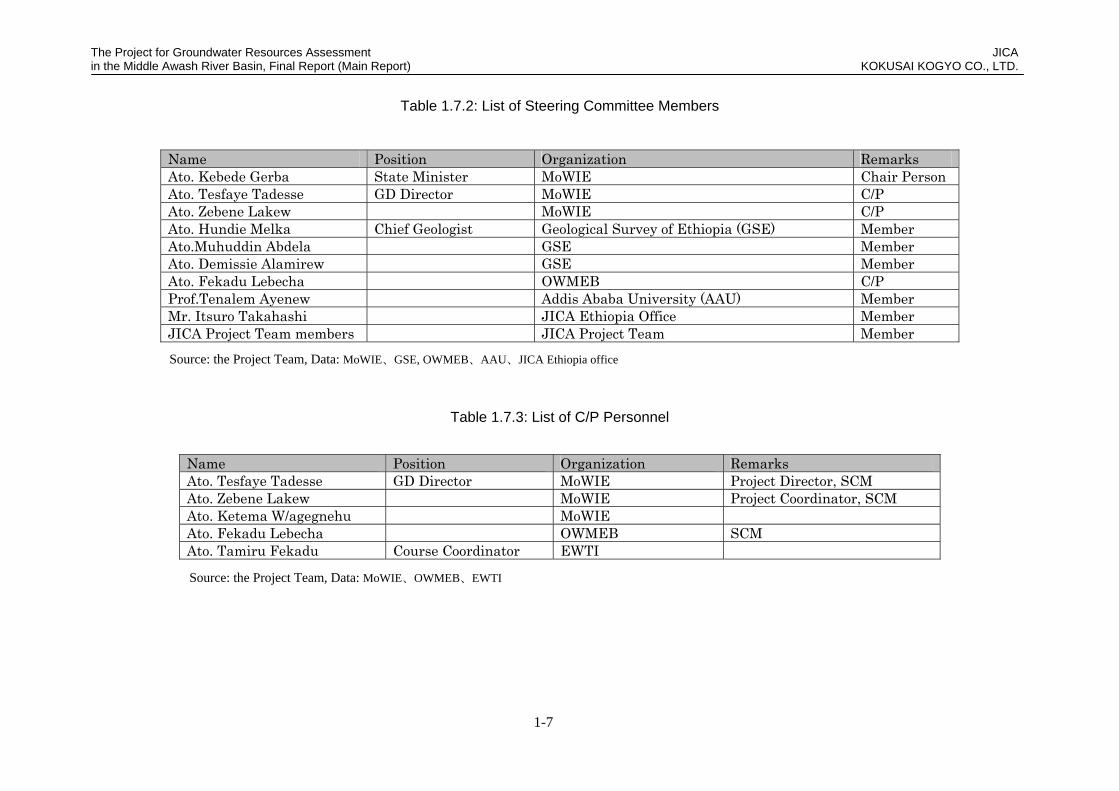
The Project for Groundwater Resources Assessment JICA in the Middle Awash River Basin, Final Report (Main Report) KOKUSAI KOGYO CO., LTD.
1-7
Table 1.7.2: List of Steering Committee Members
Table 1.7.3: List of C/P Personnel
Name Position Organization RemarksAto. Kebede Gerba State Minister MoWIE Chair PersonAto. Tesfaye Tadesse GD Director MoWIE C/P Ato. Zebene Lakew MoWIE C/P Ato. Hundie Melka Chief Geologist Geological Survey of Ethiopia (GSE) MemberAto.Muhuddin Abdela GSE MemberAto. Demissie Alamirew GSE Member Ato. Fekadu Lebecha OWMEB C/PProf.Tenalem Ayenew Addis Ababa University (AAU) MemberMr. Itsuro Takahashi JICA Ethiopia Office MemberJICA Project Team members JICA Project Team Member
Name Position Organization RemarksAto. Tesfaye Tadesse GD Director MoWIE Project Director, SCMAto. Zebene Lakew MoWIE Project Coordinator, SCMAto. Ketema W/agegnehu MoWIEAto. Fekadu Lebecha OWMEB SCMAto. Tamiru Fekadu Course Coordinator EWTISource: the Project Team, Data: MoWIE、OWMEB、EWTI
Source: the Project Team, Data: MoWIE、GSE, OWMEB、AAU、JICA Ethiopia office
Chapter 2
Natural and Socio-Economic Conditions in the Middle Awash
River Basin

The Project for Groundwater Resources Assessment JICA in the Middle Awash River Basin, Final Report (Main Report) KOKUSAI KOGYO CO., LTD.
2-1
2 Natural and Socio-Economic Conditions in the Middle Awash River Basin
2.1 Introduction
This chapter describes the general condition concerning the national and social situations in the study area. It is bounded by the limits of 38000’ – 40000’ east longitude and 8000’ – 9030’ north latitude, and its coverage area is approx. 29,000 km2. The Adama, the provincial capital of Oromia Region, is located about 80 km southeast of the capital Addis Ababa. The area is topographically characterized by a depression zone with steep marginal faults along its edges and high land partly. The study area is a basin within the middle Awash River area called the middle Awash River Basin (which lies within the independent Awash River Basin). The middle Awash River Basin consists of three Regions (the area of each region is: Oromia 55%, Afar 25% and Amhara 20%) with a population of about 6.5 million (including 2.7 million in Addis Ababa) as of 2007. The main industries are agriculture, manufacturing, and services in middle Awash Basin.
2.2 Natural conditions
2.2.1 Meteorology and Hydrology
a. Review of meteorology data
Meteorological stations in Ethiopia are managed by the National Meteorological Agency (hereafter referred to as “NMA”). Location map of the NMA’s meteorological stations in and around the Middle Awash River Basin is shown in Figure 2.2.1.
Source: NMA
Figure 2.2.1: Meteorological Stations in and around the Middle Awash River Basin
Meteorological data collected from NMA were analyzed as described in the following subsections.
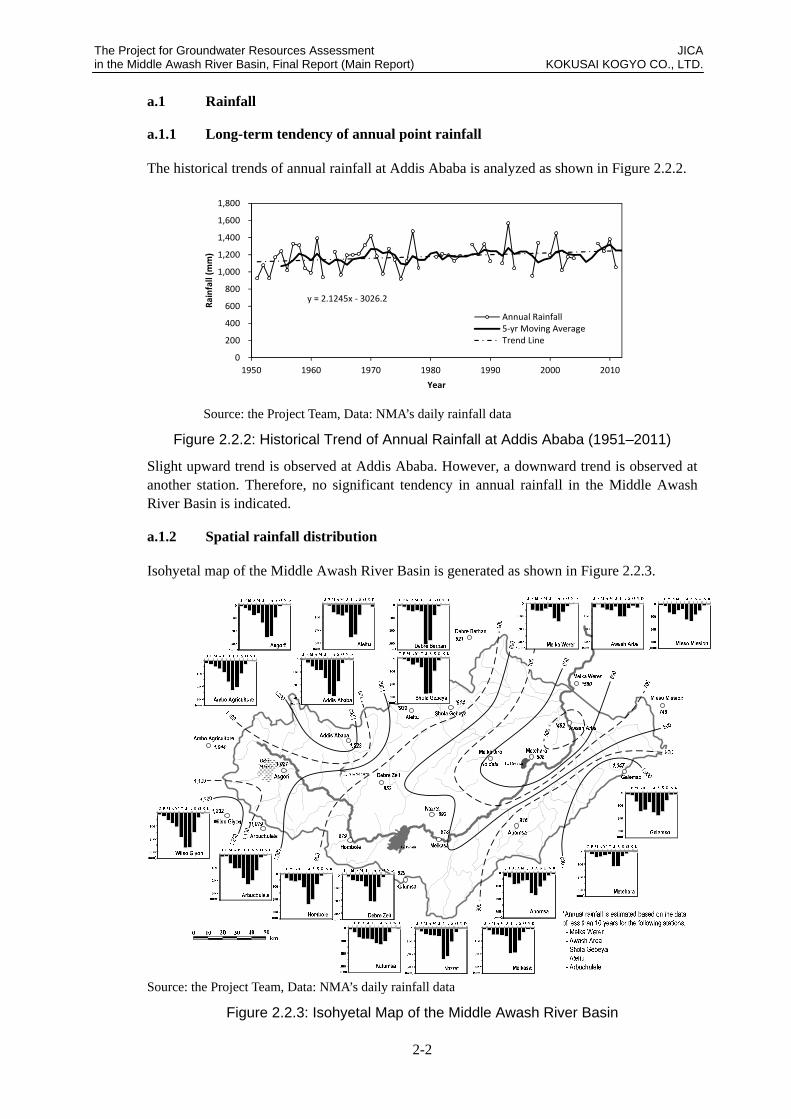
The Project for Groundwater Resources Assessment JICA in the Middle Awash River Basin, Final Report (Main Report) KOKUSAI KOGYO CO., LTD.
2-2
a.1 Rainfall
a.1.1 Long-term tendency of annual point rainfall
The historical trends of annual rainfall at Addis Ababa is analyzed as shown in Figure 2.2.2.
y = 2.1245x - 3026.2
0
200
400
600
800
1,000
1,200
1,400
1,600
1,800
1950 1960 1970 1980 1990 2000 2010
Rain
fall
(mm
)
Year
Annual Rainfall5-yr Moving AverageTrend Line
Source: the Project Team, Data: NMA’s daily rainfall data
Figure 2.2.2: Historical Trend of Annual Rainfall at Addis Ababa (1951–2011)
Slight upward trend is observed at Addis Ababa. However, a downward trend is observed at another station. Therefore, no significant tendency in annual rainfall in the Middle Awash River Basin is indicated.
a.1.2 Spatial rainfall distribution
Isohyetal map of the Middle Awash River Basin is generated as shown in Figure 2.2.3.
Source: the Project Team, Data: NMA’s daily rainfall data
Figure 2.2.3: Isohyetal Map of the Middle Awash River Basin

The Project for Groundwater Resources Assessment JICA in the Middle Awash River Basin, Final Report (Main Report) KOKUSAI KOGYO CO., LTD.
2-3
The annual rainfall is larger in the northwestern (i.e., upstream) part of the basin. The areas with low annual rainfall are found in the downstream. Annual rainfall in the western and northwestern areas reaches more than 1,000 mm. The annual rainfall in the middle reaches of the Middle Awash around Lake Koka is 800–900 mm. Rainfall of 500 mm or less is observed in the downstream of the Middle Awash from Metehara.
According to Figure 2.2.3, prominent peaks of monthly rainfall can be seen in July and August. Small rainfall peaks are found in March and April in many observatories. The Middle Awash River Basin is located in the climate area characterized by three distinct seasons: Bega (dry season; October–January), Bleg (small rainy season; February–May), and Kiremt (main rainy season; June–September).
a.1.3 Basin mean rainfall over the Middle Awash River Basin
The annual mean rainfall over the Middle Awash River Basin was calculated by the Thiessen method. Historical trend of the annual mean rainfall over the Middle Awash River Basin for current 30 years (1983–2012) is depicted in Figure 2.2.4 together with the annual rainfall data at three representative rainfall stations, i.e., Addis Ababa, Melkasa, and Metehara, for upstream, middle-reaches, and downstream areas, respectively.
0
200
400
600
800
1,000
1,200
1,400
1,600
1983
1984
1985
1986
1987
1988
1989
1990
1991
1992
1993
1994
1995
1996
1997
1998
1999
2000
2001
2002
2003
2004
2005
2006
2007
2008
2009
2010
2011
2012
Annu
al R
ainf
all (
mm
)
Year
Addis AbabaMelkasaMeteharaBasin Mean
Source: the Project Team, Data: NMA’s daily rainfall data
Figure 2.2.4: Historical Trend of Annual Rainfall in the Middle Awash River Basin
The average annual mean rainfall at the Middle Awash River Basin for the period of 1983–2012 is 876 mm, while the average annual point rainfall at Addis Ababa, Melkasa, and Metehara is 1,283 mm, 818 mm, and 508 mm, respectively.
a.2 Evaporation
Monthly evaporation amounts are estimated on the basis of the daily evaporation data through averaging the total evaporation for the months without missing data. For example, in an observatory, if the complete data for the month of January is available in 1998, 2000, and 2005, the monthly mean evaporation at this observatory is estimated as the simple average of the total evaporation in January for those 3 years.
The estimated monthly mean evaporation at the 11 observatories are shown in Table 2.2.1.

The Project for Groundwater Resources Assessment JICA in the Middle Awash River Basin, Final Report (Main Report) KOKUSAI KOGYO CO., LTD.
2-4
Table 2.2.1: Monthly Mean Evaporation at 11 Observatories
Unit: mmAbomsa Addis Ababa Ambo
Agriculture Debre Zeit DebreBerhan Gelemso Kulumsa Metehara Mieso
MissionShola
GebeyaWolisoGiyon
Elevation(m amsl) 1,630 2,386 2,068 1,900 2,750 1,739 2,211 944 1,332 2,500 2,058
Jan 190 165 217 193 153 244 200 250 204 152 260Feb 203 167 229 233 173 288 195 245 215 202 290Mar 226 184 229 227 163 242 207 272 222 192 259Apr 232 153 195 221 147 180 192 242 222 194 245May 303 170 185 238 193 150 197 288 289 253 177Jun 298 104 83 150 163 139 147 306 309 174 80Jul 224 61 50 100 68 131 115 234 267 78 51
Aug 163 58 47 92 56 116 96 185 222 64 51Sep 144 89 62 117 85 108 93 198 176 104 76Oct 184 161 161 222 127 162 203 273 242 159 178Nov 205 165 193 226 143 237 217 274 228 164 265Dec 210 169 216 214 151 244 207 255 197 160 306
Total 2,585 1,646 1,867 2,232 1,622 2,240 2,069 3,023 2,794 1,895 2,239 Note: Locations of the above observatories are shown in Figure 2.2.3. Source: the Project Team, Data: NMA’s daily evaporation data The annual evaporation varies between 1,622 mm at Debre Berhan (outside the Awash but adjoining) and 3,023 mm at Metehara. Monthly evaporation at three observatories, i.e., Addis Ababa (EL 2,386 m), Debre Zeit (EL 1,900 m), and Metehara (EL 944 m), is graphically shown in Figure 2.2.5.
0
50
100
150
200
250
300
350
Jan
Feb
Mar Ap
rM
ay Jun Jul
Aug
Sep
Oct
Nov De
c
Evap
orat
ion
(mm
)
Month
0
50
100
150
200
250
300
350
Jan
Feb
Mar Ap
rM
ay Jun Jul
Aug
Sep
Oct
Nov De
c
Evap
orat
ion
(mm
)
Month
0
50
100
150
200
250
300
350
Jan
Feb
Mar Ap
rM
ay Jun Jul
Aug
Sep
Oct
Nov De
c
Evap
orat
ion
(mm
)
Month
Addis Ababa Debre Zeit Metehara Source: the Project Team, Data: NMA’s daily evaporation data
Figure 2.2.5: Monthly Evaporation at Three Observatories
Evaporation shows its minimal value in the main rainy season, July to September. There is no dominant peak of monthly evaporation and the amount is constantly high during dry and minor rainy seasons.
a.3 Temperature
Maximum and minimum temperatures and relative humidity in and around the Middle Awash River Basin is summarized in Table 2.2.2 and Figure 2.2.6.
Table 2.2.2: Temperature, Relative Humidity, and Sunshine Hours at Several Stations in and around the Middle Awash River Basin
Station Elevation (m a.m.s.l)
Max. Temperature
(°C)
Min. Temperature
(°C)
Annual Mean
Temperature (°C)
Annual Mean Relative
Humidity (%)
Annual Mean Sunshine
Hours (hours/day)
Abomsa 1,630 31.0 (Jun.) 13.2 (Dec.) 21.9 59.3 7.5

The Project for Groundwater Resources Assessment JICA in the Middle Awash River Basin, Final Report (Main Report) KOKUSAI KOGYO CO., LTD.
2-5
Station Elevation (m a.m.s.l)
Max. Temperature
(°C)
Min. Temperature
(°C)
Annual Mean
Temperature (°C)
Annual Mean Relative
Humidity (%)
Annual Mean Sunshine
Hours (hours/day)
Addis Ababa Obs 2,386 24.9 (Mar.) 7.7 (Dec.) 16.5 60.4 6.6Ambo Agriculture 2,068 28.4 (Mar.) 10.5 (Nov.) 18.9 61.2 6.4Awash Arba 780 38.9 (Jun.) 14.3 (Dec.) 26.8 - -Debre Berhan 2,750 22.0 (Jun.) 2.8 (Nov.) 13.1 64.7 -Debre Zeit 1,900 28.6 (May) 8.6 (Dec.) 18.9 - -Gelemso 1,739 28.1 (Mar.) 10.0 (Nov.) 20.0 64.0 6.7Kulumsa 2,211 25.2 (Mar.) 7.8 (Dec.) 16.6 65.8 7.0Melka Werer 740 38.1 (Jun.) 15.3 (Jan.) 26.7 - -Melkasa 1,540 31.2 (May) 10.6 (Nov.) 21.2 64.8 8.4Metehara 944 36.9 (Jun.) 13.6 (Dec.) 25.8 30.4 8.5Mieso Mission 1,332 33.3 (Jun.) 10.5 (Dec.) 22.7 - -Shola Gebeya 2,500 22.0 (May) 6.5 (Dec.) 14.7 - -Wilso Giyon 2,058 27.6 (Mar.) 11.7 (Sep.) 18.9 62.3 --: Data is not available or has not been collected.
Source: the Project Team, Data: NMA’s climatic data
Source: the Project Team, Data: NMA’s climatic data
Figure 2.2.6: Monthly Temperature and Relative Humidity at Several Stations in and around the Middle Awash River Basin
Maximum temperature is observed in the late small rainy season or in the beginning of the main rainy season, i.e., from May to June, at every observatory. In the main rainy season, although the maximum temperature reduces, the minimum temperature is higher. The fluctuation of temperature is, therefore, small in the main rainy season. The maximum temperature reaches more than 36 °C at the stations of downstream regions such as Awash Arba, Melka Werer, and Metehara. The temperature drops less than 10 °C in the high lands such as Addis Ababa, Debre Zeit, Kulumsa, and Shola Gebeya.

The Project for Groundwater Resources Assessment JICA in the Middle Awash River Basin, Final Report (Main Report) KOKUSAI KOGYO CO., LTD.
2-6
In terms of relative humidity, the peak is observed in the main rainy season and annual mean value ranges 60–65% except for the points in dry regions such as Metehara, where annual mean relative humidity is only 30%.
b. Review of hydrological data
Mean 10-day runoff at several water level gauging stations on the Middle Awash is calculated based on the daily discharge data from 1980 to 2009 and presented in Figure 2.2.7 and Table 2.2.3 below:
0
50
100
150
200
250
3000
50
100
150
200
250
300
350
1 2 3 1 2 3 1 2 3 1 2 3 1 2 3 1 2 3 1 2 3 1 2 3 1 2 3 1 2 3 1 2 3 1 2 3
JAN FEB MAR APR MAY JUN JUL AUG SEP OCT NOV DEC
Rai
nfa
ll (m
m)
Dis
char
ge (
m3 /
sec)
0
50
100
150
200
250
3000
50
100
150
200
250
300
350
1 2 3 1 2 3 1 2 3 1 2 3 1 2 3 1 2 3 1 2 3 1 2 3 1 2 3 1 2 3 1 2 3 1 2 3
JAN FEB MAR APR MAY JUN JUL AUG SEP OCT NOV DEC
Rai
nfal
l (m
m)
Dis
char
ge (
m3 /
sec)
0
50
100
150
200
250
3000
50
100
150
200
250
300
350
1 2 3 1 2 3 1 2 3 1 2 3 1 2 3 1 2 3 1 2 3 1 2 3 1 2 3 1 2 3 1 2 3 1 2 3
JAN FEB MAR APR MAY JUN JUL AUG SEP OCT NOV DEC
Rai
nfa
ll (
mm
)
Dis
char
ge (
m3 /
sec)
0
50
100
150
200
250
3000
50
100
150
200
250
300
350
1 2 3 1 2 3 1 2 3 1 2 3 1 2 3 1 2 3 1 2 3 1 2 3 1 2 3 1 2 3 1 2 3 1 2 3
JAN FEB MAR APR MAY JUN JUL AUG SEP OCT NOV DEC
Rai
nfal
l (m
m)
Dis
char
ge (
m3 /
sec)
0
50
100
150
200
250
3000
50
100
150
200
250
300
350
1 2 3 1 2 3 1 2 3 1 2 3 1 2 3 1 2 3 1 2 3 1 2 3 1 2 3 1 2 3 1 2 3 1 2 3
JAN FEB MAR APR MAY JUN JUL AUG SEP OCT NOV DEC
Rai
nfal
l (m
m)
Dis
char
ge (
m3 /
sec)
0
50
100
150
200
250
3000
50
100
150
200
250
300
350
1 2 3 1 2 3 1 2 3 1 2 3 1 2 3 1 2 3 1 2 3 1 2 3 1 2 3 1 2 3 1 2 3 1 2 3
JAN FEB MAR APR MAY JUN JUL AUG SEP OCT NOV DEC
Rai
nfa
ll (m
m)
Dis
char
ge (
m3 /
sec)
Source: the Project Team, Data: MoWIE’s hydrologic data and NMA’s rainfall data
Figure 2.2.7: Mean 10-day Runoff Hydrograph at Major Stations on the Middle Awash
Table 2.2.3: Mean 10-day Runoff at Major Stations on the Middle Awash
Melka Kuntire
Melka Homble
Below Koka Dam Nura Hera Awash Sta. Melka Werer
Catchment (km2) 4,580 7,780 11,300 14,550 21,230 29,280
Dis
char
ge (m
3 /sec
)
Jan 1 1.5 3.7 36.7 34.9 32.2 33.42 1.6 3.9 36.3 34.4 33.6 35.23 1.4 4.3 36.0 34.3 35.7 36.7
Feb 1 1.4 4.0 36.1 31.9 34.9 33.92 1.4 4.2 34.7 33.1 38.7 40.03 1.4 4.7 35.4 36.2 33.7 39.1
Mar 1 1.8 6.0 35.8 35.3 35.3 40.82 2.0 5.1 34.9 36.1 40.8 46.23 2.6 6.2 35.6 32.4 39.3 49.2
Apr 1 4.0 8.9 35.1 35.2 47.8 52.42 3.7 8.8 34.6 34.0 42.9 48.93 4.0 9.1 35.1 35.1 43.1 46.3
May 1 5.3 8.0 35.0 30.3 37.2 40.22 4.1 8.9 37.7 36.0 42.6 40.83 4.0 9.0 37.0 44.6 43.8 37.8

The Project for Groundwater Resources Assessment JICA in the Middle Awash River Basin, Final Report (Main Report) KOKUSAI KOGYO CO., LTD.
2-7
Melka Kuntire
Melka Homble
Below Koka Dam Nura Hera Awash Sta. Melka Werer
Jun 1 6.9 11.4 38.7 39.2 38.1 31.62 11.2 17.5 38.7 36.8 41.2 28.93 21.7 29.6 36.2 41.6 42.6 33.7
Jul 1 38.6 49.3 37.1 52.2 61.5 51.92 63.5 85.7 36.2 60.6 81.0 81.93 102.0 144.8 39.9 58.0 99.6 120.5
Aug 1 129.8 191.7 43.6 66.3 106.1 150.72 146.2 223.2 65.2 73.9 131.0 184.33 149.4 216.9 94.7 88.9 140.8 186.8
Sep 1 121.5 175.1 110.2 116.2 159.7 174.82 80.9 113.2 101.6 110.8 158.2 150.53 39.2 61.0 66.8 83.6 107.4 108.2
Oct 1 19.0 26.4 49.9 60.6 69.2 69.62 10.0 17.5 40.6 42.3 49.2 54.53 5.8 9.9 36.9 38.0 40.0 48.2
Nov 1 3.5 8.3 35.6 34.8 36.4 41.62 2.7 6.6 34.7 36.6 35.8 36.03 2.2 5.8 34.2 38.3 31.4 33.0
Dec 1 1.9 4.9 35.5 37.5 32.3 33.62 1.8 4.3 35.5 36.8 31.4 33.93 1.6 3.9 35.7 36.4 31.8 33.0
Ann. Mean (m3/sec) 27.8 41.7 44.0 47.6 58.5 64.1Height (mm/yr) 191 169 123 103 87 69
Source: the Project Team, Data: MoWIE’s hydrologic data According to the information above:
Peak runoffs are observed during the period from the middle of August to the beginning of September while peak of rainfall is observed in July and August;
The Lake Koka releases constant discharge of approximately 35 m3/sec in dry season;
Annual runoff height at Melka Werer, the downstream end of the Middle Awash, is 69 mm, and this is less than 8% of the annual basin mean rainfall of 876 mm (1983 – 2012).
c. Hydrological analysis
c.1 Introduction
c.1.1 Purpose of the hydrological analysis
One of the main purposes of the hydrological analysis in this Project is to evaluate the available groundwater resources in the Middle Awash River Basin and formulate a groundwater development plan based on the evaluation. The hydrological analysis is to estimate annual groundwater recharge in the Middle Awash River Basin. In this section, groundwater recharge, which is equivalent to available groundwater resources, is estimated using general relationship between river runoff and groundwater recharge, and other relevant data/information.
c.1.2 Procedure
The analysis is undertaken through the procedure shown in Figure 2.2.8.

The Project for Groundwater Resources Assessment JICA in the Middle Awash River Basin, Final Report (Main Report) KOKUSAI KOGYO CO., LTD.
2-8
Source: the Project Team, Data: Result of hydrology survey in this Project
Figure 2.2.8: Procedure of the Hydrological Analysis
First, river flow at selected discharge stations in the Middle Awash River Basin is analyzed to obtain base flow amount (or index), which is considered to be equivalent to groundwater recharge. The relationship between base flow amount and catchment area is then analyzed. Second, total river runoff at the selected discharge stations is compared with the stations’ basin mean rainfall amount to analyze the relationship between runoff coefficient and catchment area. Further, the groundwater recharge in the sub-basins is estimated by applying the relationships analyzed above.
c.1.3 Sub-basins
The Middle Awash River Basin is divided into 13 sub-basins as shown in Figure 2.2.9.
SB5-L
SB2-L
SB4-R
SB3-R
SB1-R
SB5-RSB1-L
SB2-R
SB-BSK-W
SB3-L
SB-BSK
SB4-L-U
SB4-L-D
Lake Ziway
Lake Koka
Lake Beseka
Lake Abijata
Lake DendiLake Ala Semite
Lake Langano
Lake Wenchi
Lake Goletsho
Awash Wenz
Bilat
e
Muger Wenz
Wab
e Sheb
ele
Wenz
Source: the Project Team, Data: Result of hydrology survey in this Project
Figure 2.2.9: Basin Division for Groundwater Recharge Estimation

The Project for Groundwater Resources Assessment JICA in the Middle Awash River Basin, Final Report (Main Report) KOKUSAI KOGYO CO., LTD.
2-9
Outlines of the sub-basins are tabulated below. The catchment areas of sub-basins vary from 310 km2 to 5,710 km2:
Table 2.2.4: Summary of Sub-basins
No Name Outlet Area [km2] Description
1 SB1-L Awash 2,068 Catchment of the left bank side of the Awash upstream “Melka Kuntire” SFGS (stream flow gauging station).
2 SB1-R Awash 2,508 Catchment of the right bank side of the Awash upstream “Melka Kuntire” SFGS.
3 SB2-L Awash 4,860 Catchment of the left bank side of the Awash between “Below Koka Dam” and “Melka Kuntire” SFGSs
4 SB2-R Awash 1,859 Catchment of the right bank side of the Awash between “Below Koka Dam” and “Melka Kuntire” SFGSs
5 SB3-L Awash 508 Catchment of the left bank side of the Awash between “Nura Hera” and “Below Koka Dam” SFGSs
6 SB3-R Awash 2,743 Catchment of the right bank side of the Awash between “Nura Hera” and “Below Koka Dam” SFGSs
7 SB4-L-U Awash 435 Catchment of the left bank side of the Awash between the bridge on the Awash at the entrance of Metehara Sugar Plantation and “Nura Hera” SFGS
8 SB4-L-D Awash 312 Catchment of the left bank side of the Awash between “Awash Station” SFGS and the bridge on the Awash at the entrance of Metehara Sugar Plantation
9 SB4-R Awash 3,367 Catchment of the right bank side of the Awash between “Awash Station” and “Nura Hera” SFGSs
10 SB5-L Awash 5,710 Catchment of the left bank side of the Awash between “Melka Werer” and “Awash Station” SFGSs
11 SB5-R Awash 2,347 Catchment of the right bank side of the Awash between “Melka Werer” and “Awash Station” SFGSs
12 SB-BSK-W Depression (no outlet is confirmed topographically) 2,041 Catchment in the western side of the Lake Beseka Catchment
13 SB-BSK Lake Beseka, Awash (through a Drainage Channel) 532 Catchment of the Lake Beseka
Total 29,289
Source: the Project Team, Data: Result of hydrology survey in this Project c.2 River flow analysis
c.2.1 Separation of river flow components (BFI calculation)
The ratio of the groundwater component in a river flow is defined as base flow index (hereafter referred to as “BFI”). Many methods have been developed and used to separate the groundwater (base flow) component and direct runoff component from daily river flow data. However, the result will naturally differ depending on the method employed. In this analysis, two methods (programs) were selected since both are considered to be reliable. They are “PART” (United States Geological Survey: USGS, 2007)1 and “BFI” (United States Bureau of Reclamation: USBR, 2013)2.
c.2.2 Selection of streamflow gauging stations for BFI calculation
As hydrological stations subject to BFI calculation, following 12 stations are selected:
1 http://water.usgs.gov/ogw/part/ 2 http://www.usbr.gov/pmts/hydraulics_lab/twahl/bfi/
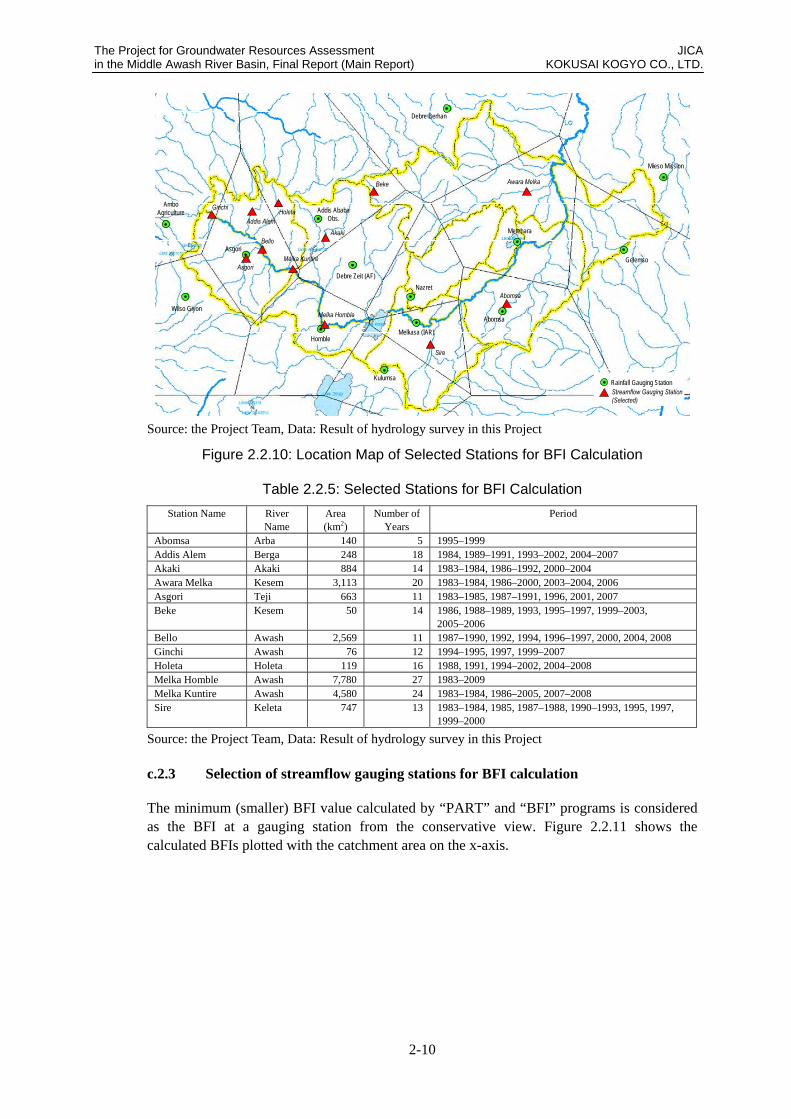
The Project for Groundwater Resources Assessment JICA in the Middle Awash River Basin, Final Report (Main Report) KOKUSAI KOGYO CO., LTD.
2-10
Wilso Giyon
Ambo Agriculture
Asgori
Addis Ababa Obs.
Debre Zeit (AF)
Homble
Kulumsa
Melkasa (IAR)
Nazret
Abomsa
Metehara
Gelemso
Mieso Mission
Debre Berhan
Melka Homble
Melka Kuntire
Bello
Asgori
Addis Alem
GinchiHoleta
Akaki
Beke
Sire
Abomsa
Awara Melka
Rainfall Gauging StationStreamflow Gauging Station(Selected)
Source: the Project Team, Data: Result of hydrology survey in this Project
Figure 2.2.10: Location Map of Selected Stations for BFI Calculation
Table 2.2.5: Selected Stations for BFI Calculation
Station Name River Name
Area (km2)
Number of Years
Period
Abomsa Arba 140 5 1995–1999 Addis Alem Berga 248 18 1984, 1989–1991, 1993–2002, 2004–2007 Akaki Akaki 884 14 1983–1984, 1986–1992, 2000–2004 Awara Melka Kesem 3,113 20 1983–1984, 1986–2000, 2003–2004, 2006 Asgori Teji 663 11 1983–1985, 1987–1991, 1996, 2001, 2007 Beke Kesem 50 14 1986, 1988–1989, 1993, 1995–1997, 1999–2003,
2005–2006 Bello Awash 2,569 11 1987–1990, 1992, 1994, 1996–1997, 2000, 2004, 2008 Ginchi Awash 76 12 1994–1995, 1997, 1999–2007 Holeta Holeta 119 16 1988, 1991, 1994–2002, 2004–2008 Melka Homble Awash 7,780 27 1983–2009 Melka Kuntire Awash 4,580 24 1983–1984, 1986–2005, 2007–2008 Sire Keleta 747 13 1983–1984, 1985, 1987–1988, 1990–1993, 1995, 1997,
1999–2000
Source: the Project Team, Data: Result of hydrology survey in this Project c.2.3 Selection of streamflow gauging stations for BFI calculation
The minimum (smaller) BFI value calculated by “PART” and “BFI” programs is considered as the BFI at a gauging station from the conservative view. Figure 2.2.11 shows the calculated BFIs plotted with the catchment area on the x-axis.

The Project for Groundwater Resources Assessment JICA in the Middle Awash River Basin, Final Report (Main Report) KOKUSAI KOGYO CO., LTD.
2-11
Source: the Project Team, Data: Result of hydrology survey in this Project
Figure 2.2.11: Relationship between Catchment Area and BFI Values
The graph shows high correlation (r > 0.70) between catchment area and BFI. According to the figure, the larger the catchment area, the larger is the BFI.
c.3 Water balance analysis
c.3.1 Runoff coefficient at selected 12 gauging stations
BFI is the percentage of base flow to the total river runoff. Therefore, the groundwater recharge amount can be quantitatively estimated if the river runoff amount is available.
Runoff coefficient at 12 stations is calculated as the percentage of annual river runoff to annual basin mean rainfall. Annual river runoff can be obtained from the daily discharge record. Annual basin mean rainfall is estimated on the basis of the point rainfall data by applying the Thiessen method (see Figure 2.2.10 for the Thiessen polygons).
Calculated mean annual rainfall and runoff are shown in Table 2.2.6.
Table 2.2.6: Mean Annual Runoff and Rainfall for Selected Stations
Station Name River Name
Area (km2)
Runoff (mm/yr)
Rainfall (mm/yr)
Runoff Coefficient
Period
Abomsa Arba 140 301 1,018 0.295 1995–1999 Addis Alem Berga 248 357 1,136 0.315 1984, 1989–1991, 1993–2002,
2004–2007 Akaki Akaki 884 331 1,198 0.276 1983–1984, 1986–1992, 2000–2004Awara Melka Kesem 3,113 135 824 0.164 1983–1984, 1986–2000,
2003–2004, 2006 Asgori Teji 663 189 1,115 0.169 1983–1985, 1987–1991, 1996,
2001, 2007 Beke Kesem 50 682 1,249 0.546 1986, 1988–1989, 1993,
1995–1997, 1999–2003, 2005–2006Bello Awash 2,569 111 1,098 0.101 1987–1990, 1992, 1994,
1996–1997, 2000, 2004, 2008 Ginchi Awash 76 364 979 0.372 1994–1995, 1997, 1999–2007 Holeta Holeta 119 393 1,220 0.322 1988, 1991, 1994–2002, 2004–2008Melka Homble Awash 7,780 172 1,066 0.162 1983–2009 Melka Kuntire Awash 4,580 188 1,103 0.171 1983–1984, 1986–2005, 2007–2008

The Project for Groundwater Resources Assessment JICA in the Middle Awash River Basin, Final Report (Main Report) KOKUSAI KOGYO CO., LTD.
2-12
Station Name River Name
Area (km2)
Runoff (mm/yr)
Rainfall (mm/yr)
Runoff Coefficient
Period
Sire Keleta 747 242 806 0.300 1983–1984, 1985, 1987–1988, 1990–1993, 1995, 1997, 1999–2000
Source: the Project Team, Data: Result of hydrology survey in this Project In general, the larger the catchment area, the smaller is the runoff coefficient. This can be said for the Middle Awash River Basin. The relationship between catchment area and runoff coefficient is depicted in Figure 2.2.12.
Source: the Project Team, Data: Result of hydrology survey in this Project
Figure 2.2.12: Relationship between Catchment Area and Runoff Coefficient
c.3.2 Annual Groundwater Recharge in the Selected 12 Gauging Station’s
Catchments
Based on the above, annual groundwater recharge (hereafter referred to as “GWR”) can be expressed as follows:
BFICRGWR where, GWR: Annual groundwater recharge (mm/year) R: Annual basin mean rainfall (mm/year) C: Runoff coefficient (-) BFI: Base flow index (-)
The annual groundwater recharge at selected 12 gauging stations’ catchments is estimated as shown in Table 2.2.7.
Table 2.2.7: Annual Groundwater Recharge in 12 Station’s Catchments
Station Name River Name
Area [km2]
Rainfall (R)[mm/yr]
Runoff Coefficient
(C)
Base Flow Index (BFI)
Groundwater Recharge (GWR) [mm/yr]
GWR/R
Abomsa Arba 140 1,018 0.295 0.26 77 7.6%Addis Alem Berga 248 1,136 0.315 0.40 144 12.7%Akaki Akaki 884 1,198 0.276 0.28 91 7.6%Awara Melka Kesem 3,113 824 0.164 0.33 44 5.4%Asgori Teji 663 1,115 0.169 0.27 50 4.5%

The Project for Groundwater Resources Assessment JICA in the Middle Awash River Basin, Final Report (Main Report) KOKUSAI KOGYO CO., LTD.
2-13
Station Name River Name
Area [km2]
Rainfall (R)[mm/yr]
Runoff Coefficient
(C)
Base Flow Index (BFI)
Groundwater Recharge (GWR) [mm/yr]
GWR/R
Beke Kesem 50 1,249 0.546 0.21 145 11.6%Bello Awash 2,569 1,098 0.101 0.74 82 7.4%Ginchi Awash 76 979 0.372 0.21 76 7.8%Holeta Holeta 119 1,220 0.322 0.39 154 12.6%Melka Homble Awash 7,780 1,066 0.162 0.52 90 8.5%Melka Kuntire Awash 4,580 1,103 0.171 0.57 108 9.8%Sire Keleta 747 806 0.300 0.46 111 13.8%
Source: the Project Team, Data: Result of hydrology survey in this Project c.4 Water balance analysis
The annual groundwater recharge in the divided 13 sub-basins (see Figure 2.2.9 and Table 2.2.4) is estimated in the same procedure as that in 12 stations’ catchments. In this estimation, both BFI and runoff coefficient (C) are assumed to be the function of catchment area as shown below (see Figure 2.2.11 and Figure 2.2.12 also):
BFICRGWR 170.0121.0 ABFI
236.0090.1 AC where, GWR: Annual groundwater recharge (mm/year) R: Annual basin mean rainfall (mm/year) C: Runoff coefficient (-) BFI: Base flow index (-) A: Catchment area (km2)
The annual rainfall over sub-basins is calculated on the basis of the point rainfall data by applying the Thiessen polygon method (see Figure 2.2.10 for the Thiessen polygons).
Then, annual basin mean rainfall is multiplied by the runoff coefficient and BFI, which are estimated using the equations stated above. The annual groundwater recharge is estimated as in Table 2.2.8.
Table 2.2.8: Result of Groundwater Recharge Estimation by Sub-basins
SL No.
Sub-basin Area (A)
[km2]
Annual Rainfall (R)
[mm/yr]
Runoff Coefficient
(C) [-]
Base Flow Index (BFI)
[-]
Annual Groundwater Recharge (GWR) GWR/R
[%] [mm/yr] [106 m3/yr]
1 SB1-L 2,068 1,097 0.18 0.44 87.2 180.3 7.9%2 SB1-R 2,508 1,075 0.17 0.46 84.4 211.6 7.8%3 SB2-L 4,860 982 0.15 0.51 73.7 358.4 7.5%4 SB2-R 1,859 867 0.18 0.43 69.4 129.0 8.0%5 SB3-L 508 853 0.25 0.35 74.4 37.8 8.7%6 SB3-R 2,743 832 0.17 0.46 64.9 178.1 7.8%7 SB4-L-U 435 824 0.26 0.34 72.5 31.6 8.8%8 SB4-L-D 312 548 0.28 0.32 49.3 15.4 9.0%9 SB4-R 3,367 806 0.16 0.48 62.0 208.8 7.7%
10 SB5-L 5,710 779 0.14 0.53 57.9 330.8 7.4%11 SB5-R 2,347 870 0.17 0.45 68.6 161.0 7.9%12 SB-BSK-W 2,041 740 0.18 0.44 58.9 120.2 8.0%13 SB-BSK 532 548 0.25 0.35 47.6 25.3 8.7%
All Basin 29,290 876 - - 67.9 1,988.3 7.7%Source: the Project Team, Data: Result of hydrology survey in this Project

The Project for Groundwater Resources Assessment JICA in the Middle Awash River Basin, Final Report (Main Report) KOKUSAI KOGYO CO., LTD.
2-14
The estimated groundwater recharge ranges between 47 mm/year and 87 mm/year and is equivalent to 7.4%–9.0% of the annual rainfall.
The water balance in each sub-basin is estimated as in Table 2.2.9 by assuming that all losses are incorporated in the form of evapotranspiration.
Table 2.2.9: Water Balance in Sub-basins
SL. No. Sub-basin Area (A)
[km2]
Incoming Outgoing
Annual Rainfall (R) [mm/yr]
Direct Runoff [mm/yr]
Base Flow (Groundwater
Recharge) [mm/yr]
Evapotranspiration [mm/yr]
1 SB1-L 2,068 1,097 110 87 900 2 SB1-R 2,508 1,075 100 84 891 3 SB2-L 4,860 982 71 74 837 4 SB2-R 1,859 867 90 69 707 5 SB3-L 508 853 139 74 639 6 SB3-R 2,743 832 75 65 692 7 SB4-L-U 435 824 141 73 610 8 SB4-L-D 312 548 105 49 394 9 SB4-R 3,367 806 67 62 677
10 SB5-L 5,710 779 52 58 669 11 SB5-R 2,347 870 83 69 719 12 SB-BSK-W 2,041 740 75 59 607 13 SB-BSK 532 548 88 48 412
All Basin 29,290 876 78 68 730 Source: the Project Team, Data: Result of hydrology survey in this Project
2.2.2 Location, access and physiography
a. Location and access
The study area is located about 180 km east of the capital Addis Ababa. It is bounded by the limits of 38000’ – 40000’ east longitude and 8000’ – 9030’ north latitude. The area is topographically characterized by the depression zone with steep marginal faults along its edges. The study area is an independent basin, therefore it is called middle Awash River Basin.

The Project for Groundwater Resources Assessment JICA in the Middle Awash River Basin, Final Report (Main Report) KOKUSAI KOGYO CO., LTD.
2-15
Figure 2.2.13: Location of the Study Area
b. Physiography
The study area belongs to African Rift. The African Rift originates from the Aden Junction (see Figure 2.2.14) and continues in the direction of SW- SSW traverse longitudinally through the eastern African countries such as Djibouti, Eritrea, Ethiopia, Kenya, Uganda, and Tanzania.
Generally the valley is characterized by the geological occurrence of active faults, active volcanoes and hot springs, which indicates it is a geothermal area. Geophysical and petrological data show that lithosphere is thinning by intrusion of hot mantle below the valley.
The valley is considered to be a separation boundary of the African Plate. The eastern plate is called the Somalian Plate and the western is the Nubian Plate. The two plates are separating at a speed of 5 mm/year (Stamps et. al, 2008).
Lake Beseka

The Project for Groundwater Resources Assessment JICA in the Middle Awash River Basin, Final Report (Main Report) KOKUSAI KOGYO CO., LTD.
2-16
Source: http://people.dbq.edu/faculty/deasley/Essays/EastAfricanRift.html
Figure 2.2.14: Distribution of African Rift Valley
2.2.3 Geology
a. Outline
a.1 Adama town, Mt. Boseti and its surrounding areas
Adama town–Mt. Boseti and its surrounding areas are located in the central MER. The rift floor is widely covered by Pleistocene to Holocene volcanic deposits. The lowest unit, named Alaji basalts, is observed at the scarps of the eastern margin and the NE-SW trending faults. Alaji basalts is distributed widely in the survey area and has a chronological age of 24-23Ma according to Chernet et. al, 1998, 14.4Ma according to Kuntz et al., 1975, 28-15Ma according to Morbideli et al., 1975, and 21.06±1.5Ma, 14.94±1.5Ma, 17.4±1.-0Ma according to Kazumin, et al., 1978. Chefeco rhyolites and Pliocene rhyolites overlie Alaji basalts and have formed hilly topography. Nazret pyroclastic deposits are mainly observed at the scarps of the rift margin. Chilalo trachybasalts is observed at the northern foot of Mt. Chilalo. Bofa basalts from Late Pliocene to Pleistocene is well observed at the area, and has a chronological age of 1.21Ma by Kazmin et.al, 1978, and 6.1-4.4 Ma by Morton et al., 1979. Pleistocene, Dino ignimbrite, Quaternary rhyolites, Chefe Donsa pyroclastic deposits and Pleistocene basalts are widely observed on the rift floor. In the Late Pleistocene period, pumice fall from Mt. Boseti, and Fentale ignimbrite are widely distributed on the rift floor and fault scarps. In Holocene, rift floor basalts from volcanic activities in the eastern side of Mt. Boseti.
a.2 Kone – Mt. Fentale and its surrounding areas
Kone-Mt. Fentale and its surrounding areas are located in the central MER. The basin floor is widely covered by volcanic deposits from the Pleistocene to Holocene periods. WFB (Wonji Fault Belt) is well developed on the floor and margin of the MER in the area. Therefore, Pliocene – Pleistocene strata are generally observed at the scarps of these faults. The lowest unit, named Birenti-Hada rhyolites, is observed at the foot of Mount Bosena. Bofa basalts overlies Birenti-Hada rhyolites at the southern foot of Mt. Bosena, and is widely observed at a gentle slope at the lava plateau. Dino ignimbrite is observed at the northern foot of Kone
Aden Junction
STUDY AREA

The Project for Groundwater Resources Assessment JICA in the Middle Awash River Basin, Final Report (Main Report) KOKUSAI KOGYO CO., LTD.
2-17
caldera, the western foot of Mt. Fentale, and is widely distributed at the flat plain of the southeastern plateau. Dino ignimbrite has a chronological age of 1.5 Ma according to Mobidelli et. al, 1975, and 1.51 Ma according to Kazmin, et al, 1978. Tuff ring, Pleistocene basalts, Kone ignimbrite, Kone pumice fall, Fentale volcanic rocks and Fentale ignimbrite are observed in the surroundings of Kone caldera and Mt. Fentale. In Holocene, rift floor basalts and recent obsidian flows from volcanic activity are observed in the southwest of Lake Besaka.
A more detailed geological survey was carried out around Lake Besaka. The details are described in Chapter 3.
a.3 Mojo town – Arerti town – Debre Birhan town and its surrounding areas
Mojo town-Arerti town, Debre Birhan town and its surrounding areas are located in the central Ethiopian plateau and the central MER. The plateau area is mainly covered by Miocene volcanic deposits and the basin floor is widely covered by Pleistocene deposits. The lowest unit, named Kesem basalts, is observed at the Kesem River. In Debre Birhan, ignimbrite, which consists of ignimbrite and conglomerated stone that is cemented by white ash, overlies Kesem basalts and is widely observed at the northern plateau of the Kesem River. Tarmaber-Megezeze basalts forms a high mountain range, and has a chronological age of 13 Ma according to Zanettin, et al, 1974, and 10.4 Ma according to Chernet et al, 1998. In Pliocene, Bokan rhyolites, Nazret pyroclastic deposits, and Tulu Rie basalts are observed on the basin floor. Nazret pyroclastic deposits are widely observed at the southern flat plain of the Kesem River. Tulu Rie basalts, contrasted as a part of the Bofa Basalt, is observed at the surrounding Mojo area, and has a chronological age of 2.7±0.1 Ma according to INGEIS-Buenos Aires, and 1.44±0.03 Ma according to Chernet et. al, 1998. In Pleistocene, Dino ignimbrite, Chefe Donsa pyroclastic deposits, Zkikala trachyte, Maar deposits, Boseti Pumice Fall, and Fentale ignimbrite are observed at the basin floor.
a.4 Awash town – Asebe Teferi town and its surrounding areas
Awash town-Asebe Teferi town and its surrounding areas are located in the central MER. The basin floor is widely covered by Holocene deposits. WFB is well developed on the floor and margin of the MER in the area. Therefore Pliocene – Pleistocene strata are generally observed at the scarps of these faults. The lowest unit, named Alaji basalts, is observed at the southern mountain chain. Huse Ridge rhyolites and Anchar basalts overlie Alaji basalts, and are observed at the southern mountain chain with a NE-SW trend. Anchar basalts has a chronological age of 12.4 Ma, according to Kazmin et.al, 1978. Gara Gumbi rhyolites is observed on the basin floor of the remaining hills. Also, Adele rhyolitic tuffs and Bofa basalts are widely observed at the basin floor. In Pleistocene, Dino ignimbrite, Dofan basalts, Asebot welded tuff, Awash acidic volcano-sedimentary rocks and Fentale ignimbrite are widely distributed on the basin floor.
Stratigraphy in each area are shown in Table 2.2.10, Table 2.2.11, Table 2.2.12 and Table 2.2.13, and correlation chart of each stratigraphy is shown in Table 2.2.14.
In addition, location map of each outcrop number mentioned in this chapter is shown in Figure 2.2.15.

The Project for Groundwater Resources Assessment JICA in the Middle Awash River Basin, Final Report (Main Report) KOKUSAI KOGYO CO., LTD.
2-18
Table 2.2.10: Stratigraphy in Adama Town-Mt. Boseti
Stratigraphy Age
Qal Alluvium sand, clay, lucstrin
Recent rhyolitic domes &lava flows rhyolitic domes with obsidian lava flows
glassy basalt
aphyric basalt and scoria cone
Fantale ignimbrite pare green strongly welded tuff with fiamme 168,000±38,000 y (OWWDSE ,2013)
Boseti pumice fallspumice fall
(Mt. Boseti)
Pleistocene basalts aphyric basalt
Chefe Donsa pyroclasticdeposits
Pumice and tuff with intercalated with poorlywelded tuff
Chefe Donsa pyroclastic deposits : 1.71±0.04 Ma(Morrtonet al.,1979), 2.24±0.3 Ma(IGGI-Pisa)
Pleistocene rhyolites rhyolite
Dino ignimbrite Greenish grey welded tuff with fiammeDino : 1.5my (Mobidelli et al., 1975), 1.51 Ma (Kazmun, etal.,1978)
Bofa basalts aphyric basalt
Tulu Rie basalt: 2.7±0.1 Ma(INGEIS-Buenos Aires), 1.44±0.03 Ma(Chernet et al., 1998)Bofa : 1.21 Ma (Kazumin, et al., 1978), 6.1-4.4 Ma(Mortonet al.,1979)
Chilalo Trachybasalts Trachytes and Trachybasalts
light to dark grey welded tuff with fiammeNwp : 3.5±0.1 Ma, 3.2±0.1 Ma(IGGI-Pisa), 4.7±0.7 Ma,5.4±0.2 Ma(INGEIS-Buenos Aires), 3.32±0.06 Ma, 3.11±0.06 Ma(Morton et al., 1979)
pumice and tuff
Chefeko rhyolites rhyolite with pumiceous tuff
Alaji basalts plagioclase phyric basalt24-23Ma (Chernet et al., 1998), 14.4 Ma (Kuntz et al.,1975), 28-15 Ma (Morbidelli et al., 1975), 21.06±1.5 Ma,14.94±1.5 Ma, 17.4±1.0 Ma (Kazumin, et al., 1978)M
ioce
ne
Nazret pyroclasticdeposits
Plio
cene
Terti
ary
Qua
rtern
ary
Hol
ocen
ePl
eist
ocen
e
Recent basalts
Cai
nozo
icAge Major Lithology
Qi3
Qp2
Qb1
Qp1
Qi1
Tb3
Ti3
Tr2
Tb1
Qr2
Qb2
Qr1
Tt
Ti2
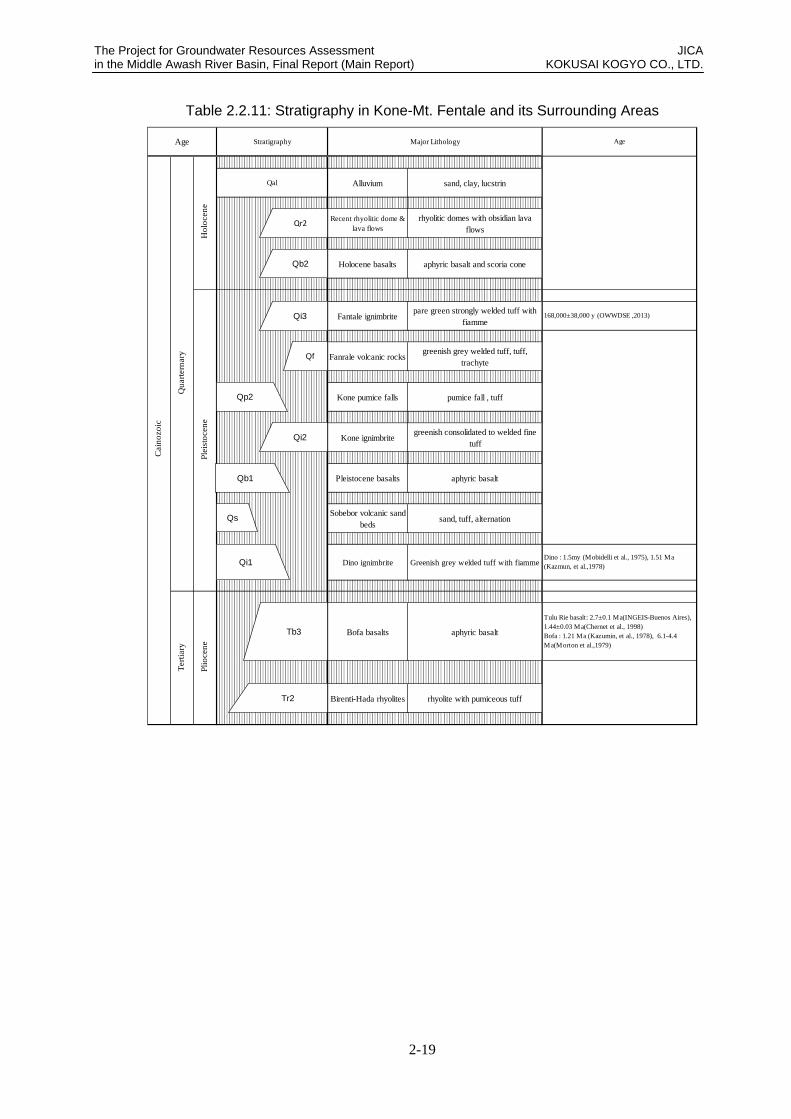
The Project for Groundwater Resources Assessment JICA in the Middle Awash River Basin, Final Report (Main Report) KOKUSAI KOGYO CO., LTD.
2-19
Table 2.2.11: Stratigraphy in Kone-Mt. Fentale and its Surrounding Areas
Stratigraphy Age
Qal Alluvium sand, clay, lucstrin
Recent rhyolitic dome &lava flows
rhyolitic domes with obsidian lavaflows
Holocene basalts aphyric basalt and scoria cone
Fantale ignimbritepare green strongly welded tuff with
fiamme168,000±38,000 y (OWWDSE ,2013)
Fanrale volcanic rocksgreenish grey welded tuff, tuff,
trachyte
Kone pumice falls pumice fall , tuff
Kone ignimbritegreenish consolidated to welded fine
tuff
Pleistocene basalts aphyric basalt
Sobebor volcanic sandbeds
sand, tuff, alternation
Dino ignimbrite Greenish grey welded tuff with fiammeDino : 1.5my (Mobidelli et al., 1975), 1.51 Ma(Kazmun, et al.,1978)
Bofa basalts aphyric basalt
Tulu Rie basalt: 2.7±0.1 Ma(INGEIS-Buenos Aires),1.44±0.03 Ma(Chernet et al., 1998)Bofa : 1.21 Ma (Kazumin, et al., 1978), 6.1-4.4Ma(Morton et al.,1979)
Birenti-Hada rhyolites rhyolite with pumiceous tuff
Major LithologyAgeC
aino
zoic
Plio
cene
Plei
stoc
ene
Terti
ary
Qua
rtern
ary
Hol
ocen
e
Qi3
Qp2
Qb1
Qs
Qi1
Tb3
Tr2
Qr2
Qb2
Qi2
Qf
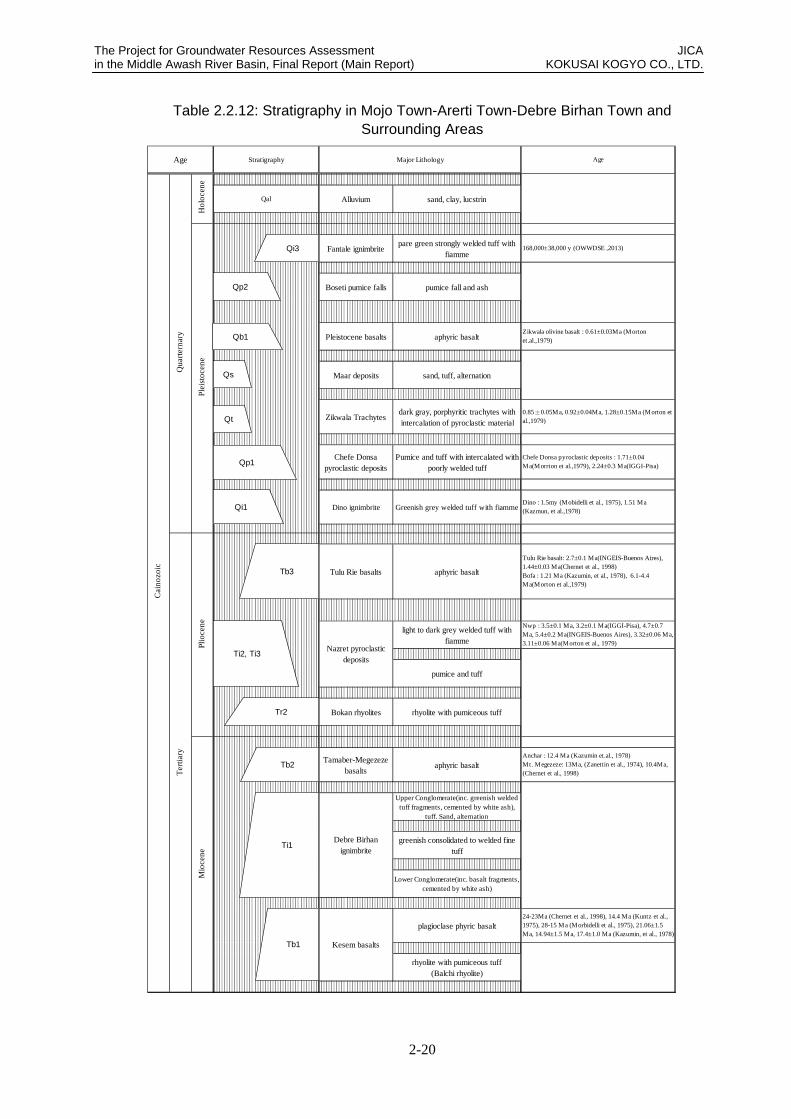
The Project for Groundwater Resources Assessment JICA in the Middle Awash River Basin, Final Report (Main Report) KOKUSAI KOGYO CO., LTD.
2-20
Table 2.2.12: Stratigraphy in Mojo Town-Arerti Town-Debre Birhan Town and Surrounding Areas
Stratigraphy Age
Qal Alluvium sand, clay, lucstrin
Fantale ignimbritepare green strongly welded tuff with
fiamme168,000±38,000 y (OWWDSE ,2013)
Boseti pumice falls pumice fall and ash
Pleistocene basalts aphyric basaltZikwala olivine basalt : 0.61±0.03Ma (Mortonet.al.,1979)
Maar deposits sand, tuff, alternation
Zikwala Trachytesdark gray, porphyritic trachytes withintercalation of pyroclastic material
0.85±0.05Ma, 0.92±0.04Ma, 1.28±0.15Ma (Morton etal.,1979)
Chefe Donsapyroclastic deposits
Pumice and tuff with intercalated withpoorly welded tuff
Chefe Donsa pyroclastic deposits : 1.71±0.04Ma(Morrton et al.,1979), 2.24±0.3 Ma(IGGI-Pisa)
Dino ignimbrite Greenish grey welded tuff with fiammeDino : 1.5my (Mobidelli et al., 1975), 1.51 Ma(Kazmun, et al.,1978)
Tulu Rie basalts aphyric basalt
Tulu Rie basalt: 2.7±0.1 Ma(INGEIS-Buenos Aires),1.44±0.03 Ma(Chernet et al., 1998)Bofa : 1.21 Ma (Kazumin, et al., 1978), 6.1-4.4Ma(Morton et al.,1979)
light to dark grey welded tuff withfiamme
Nwp : 3.5±0.1 Ma, 3.2±0.1 Ma(IGGI-Pisa), 4.7±0.7Ma, 5.4±0.2 Ma(INGEIS-Buenos Aires), 3.32±0.06 Ma,3.11±0.06 Ma(Morton et al., 1979)
pumice and tuff
Bokan rhyolites rhyolite with pumiceous tuff
Tamaber-Megezezebasalts
aphyric basaltAnchar : 12.4 Ma (Kazumin et.al., 1978)Mt. Megezeze: 13Ma, (Zanettin et al., 1974), 10.4Ma,(Chernet et al., 1998)
Upper Conglomerate(inc. greenish weldedtuff fragments, cemented by white ash),
tuff. Sand, alternation
greenish consolidated to welded finetuff
Lower Conglomerate(inc. basalt fragments,cemented by white ash)
plagioclase phyric basalt24-23Ma (Chernet et al., 1998), 14.4 Ma (Kuntz et al.,1975), 28-15 Ma (Morbidelli et al., 1975), 21.06±1.5Ma, 14.94±1.5 Ma, 17.4±1.0 Ma (Kazumin, et al., 1978)
rhyolite with pumiceous tuff(Balchi rhyolite)
Age Major LithologyC
aino
zoic
Qua
rtern
ary
Hol
ocen
ePl
eist
ocen
e
Terti
ary
Plio
cene
Nazret pyroclasticdeposits
Mio
cene
Debre Birhanignimbrite
Kesem basalts
Qi3
Qp2
Qb1
Qs
Qp1
Qi1
Tb3
Ti2, Ti3
Tr2
Tb2
Ti1
Tb1
Qt

The Project for Groundwater Resources Assessment JICA in the Middle Awash River Basin, Final Report (Main Report) KOKUSAI KOGYO CO., LTD.
2-21
Table 2.2.13: Stratigraphy in Awash Town-Asebe Teferi Town
Stratigraphy Age
Qal Alluvium sand, clay, lucstrin
Fantale ignimbritepare green strongly welded tuff with
fiamme168,000±38,000 y (OWWDSE ,2013)
Asebot welded tuffs yellowish brown pumiceous tuff withhornblend & plagioclase
Dofan basalts dark grey porhyritic plagioclase basalt
Awash ArbaVolcano-sedimentary
rocks
Pumice and tuff with intercalated withpoorly welded tuff
Chefe Donsa pyroclastic deposits : 1.71±0.04Ma(Morrton et al.,1979), 2.24±0.3 Ma(IGGI-Pisa)
Dino ignimbrite Greenish grey welded tuff with fiammeDino : 1.5my (Mobidelli et al., 1975), 1.51 Ma (Kazmun,et al.,1978)
Bofa basalts aphyric basalt
Tulu Rie basalt: 2.7±0.1 Ma(INGEIS-Buenos Aires),1.44±0.03 Ma(Chernet et al., 1998)Bofa : 1.21 Ma (Kazumin, et al., 1978), 6.1-4.4Ma(Morton et al.,1979)
Adele rhyolitic tuffspumice and tuff with minor welded
tuff
Nwp : 3.5±0.1 Ma, 3.2±0.1 Ma(IGGI-Pisa), 4.7±0.7 Ma,5.4±0.2 Ma(INGEIS-Buenos Aires), 3.32±0.06 Ma, 3.11±0.06 Ma(Morton et al., 1979)
Gara Gumbi rhyolites rhyolite with pumiceous tuff
Anchar basalts black fine ol-basaltAnchar : 12.4 Ma (Kazumin et.al., 1978)Mt. Megezeze: 13Ma, (Zanettin et al., 1974), 10.4Ma,(Chernet et al., 1998)
Huse Ridge rhyolites light grey to pare pink rhyolitic fineslightly welded tuff
Alaji basalts plagioclase phyric basalt24-23Ma (Chernet et al., 1998), 14.4 Ma (Kuntz et al.,1975), 28-15 Ma (Morbidelli et al., 1975), 21.06±1.5 Ma,14.94±1.5 Ma, 17.4±1.0 Ma (Kazumin, et al., 1978)
Age Major Lithology
Cai
nozo
ic
Qua
rtern
ary
Hol
ocen
ePl
eist
ocen
ePl
ioce
ne
Terti
ary
Mio
cene
Qi3
Qb1
Qp1
Qi1
Tb3
Tr2
Tb1
Qi2
Ti2
Tb2
Tr1

The Project for Groundwater Resources Assessment JICA in the Middle Awash River Basin, Final Report (Main Report) KOKUSAI KOGYO CO., LTD.
2-22
Table 2.2.14: Correlation of Stratigraphy in the Study Area
168,000±38,000 y (OWWDSE ,2013)
Zikwala olivine basalt : 0.61±0.03Ma (Morton et.al.,1979)
0.85±0.05Ma, 0.92±0.04Ma, 1.28±0.15Ma (Morton et al.,1979)
Chefe Donsa pyroclastic deposits : 1.71±0.04 Ma(Morrton et al.,1979), 2.24±0.3Ma(IGGI-Pisa)
Dino ignimbrite: 1.5my (Mobidelli et al., 1975), 1.51 Ma (Kazmun, et al.,1978)
Tulu Rie basalt: 2.7±0.1 Ma(INGEIS-Buenos Aires),1.44±0.03 Ma(Chernet et al., 1998)Bofa : 1.21 Ma (Kazumin, et al., 1978), 6.1-4.4 Ma(Morton et al.,1979)
Upper Upper
Lower Lower
Anchar : 12.4 Ma (Kazumin et.al., 1978)Mt. Megezeze: 13Ma, (Zanettin et al., 1974), 10.4Ma, (Chernet et al., 1998)
24-23Ma (Chernet et al., 1998), 14.4 Ma (Kuntz et al., 1975), 28-15 Ma (Morbidelli et al.,1975), 21.06±1.5 Ma, 14.94±1.5 Ma, 17.4±1.0 Ma (Kazumin, et al., 1978)
Debre Birhan ignimbrite(Ti1)
Huse Ridge rhyolites(Tr1)
Huse Ridge rhyolites
Adele rhyolitic tuffs
Birenti-Hada rhyolites Mt. Bokan rhyolites Gara Gumbi rhyolitesBirenti-Hada rhyolites
(Tr)
AgeAreas
Stratigraphy of the whole study area AgeNazret-Mt.Boseti Kone-Mt.Fantale Mojo-Arerti-Debre Birhan Awash-Asebe Teferi Lake Besaka (1:100,000)
Cai
nozo
ic
Qua
rter
nary
Hol
ocen
e
Alluvium Alluvium Alluvium
Holocene basalts Holocene basalts
Fantale volcanic rocks
AlluviumAlluvium
(Qa)Alluvium
(Qal)
Recent rhyolitic domes & lava flows Recent rhyolitic domes & lava flowsRecent rhyolitic domes & lava flows
(Qr2)
Holocene basalts(Qb2)
Holocene basalts(Qb2)
Ple
isto
cene
bas
alt
Fantale ignimbrite Fantale ignimbrite Fantale ignimbrite Fantale ignimbriteFentale ignimbrite
(Qi3)Fentale ignimbrite
(Qi3)
Fentale volcanic rocks(Qf)
Fentale volcanic rocks(Qf)
Boseti pumice falls Kone pumice falls Boseti pumice fallsBoseti-Kone pumice fall deposits
(Qp2)
Kone ignimbrite Asebot welded tuffsKone ignimbrite
(Qi2)Kone ignimbrite
(Qi2)
Pleistocene basalts Pleistocene basalts Pleistocene basalt Dofan basaltPleistocene basalts
(Qb1)Pleistocene basalts
(Qb1)
Tuff ring deposits Maar depositsSobebor volcanic sand beds
(Qs)Sobebor volcanic sand beds
(Qs)
Zikwala TrachytesZikwala Trachytes
(Qt)
Dino ignimbrite(Qi1)
Chefe Donsa pyroclastic deposits Chefe Donsa pyroclastic depositsAwash Arba Volcano-sedimentary
rocksChefe Donsa pyroclastic deposits
(Qp1)
Pleistocene rhyolitesPleistocene rhyolites
(Qr1)
Dino ignimbrite
Alaji basalts
Dino ignimbrite Dino ignimbrite Dino ignimbrite
Chilalo Trachybasalts(Tt)
Nazretpyroclastic
deposits
Nazretpyroclastic
deposits
Old ignimbrite(Ti)
Upper Nazret pyroclastic deposit(Ti3)
Dino ignimbrite(Qi1)
Alaji basalts(Tb1)
Lower Nazret pyroclastic deposits(Ti2)
Ter
tiar
y
Plio
cene
Bofa basalt Bofa basalts Tulu Rie basalts Bofa basalt
Chefeko rhyolites
Alaji basalts
Nwp : 3.5±0.1 Ma, 3.2±0.1 Ma(IGGI-Pisa), 4.7±0.7 Ma, 5.4±0.2 Ma(INGEIS-BuenosAires), 3.32±0.06 Ma, 3.11±0.06 Ma(Morton et al., 1979)
Nura Hira basalts(Tb)
Bofa basalts(Tb3)
Chilalo Trachybasalts
Debre Birhan ignimbrite
Pliocene rhyolites(Tr2)
Mio
cene
Tarmaber-Megezeze basalts Anchar basaltsAnchar basalts
(Tb2)
Kesem basalts

The Project for Groundwater Resources Assessment JICA in the Middle Awash River Basin, Final Report (Main Report) KOKUSAI KOGYO CO., LTD.
2-23
Figure 2.2.15: Location Map of Outcrops

The Project for Groundwater Resources Assessment JICA in the Middle Awash River Basin, Final Report (Main Report) KOKUSAI KOGYO CO., LTD.
2-24
b. Characteristics of geological units
b.1 Miocene-Pliocene
b.1.1 Alaji Basalts: porphyritic to aphyric basalt lavas: Tb1
Lithology: Consists of porphyritic basalt lavas with large plagioclase and aphyric basalt lavas. At Arba Rekete (L-AA59), the unit is divided by two flow units: from the lowest, dark grey porphyritic basalt lava (more than 10 m in thickness), light gray to dark grey porphyritic plagioclase basalt lava with columnar joints (more than 10 m in thickness). At Komena (L-AA35), the unit is divided in lower porphyritic plagioclase-basalt and upper aphyric basalt. This unit is unconformably overlain by Huse ridge rhyolites at Huse ridge (L-AA53), 10 km northwest of Asebe Teferi town. At Balchi (L-MAD14), the unit is divided by three lithological facies; from the lowest, pale blue to light grey rhyolite (more than 40 m in thickness, Balchi rhyolite), light gray to pale blue tuff containing white pumice (2 m in thickness), and bluish-grey porphyritic plagioclase basalt lava (more than 20m in thickness). At Tigre Ridge in northeast Welenchiti town (L-MAD22), the unit is divided by three lithological facies; from the lowest, reddish-brown tuff breccia (more than 2m in thickness), black fine plagioclase-basalt lava with columnar joint (17m in thickness), and black massive fine basalt (17m in thickness).This unit is overlain by the lower conglomerate of Debre Birhan ignimbrite along the Arerti town – Kesem river route (L-MAD29).
Distribution: Around Arba Rekete town, Huse ridge in northwest of Asebe Teferi town, and around Cheleleka town. Western cliff of Sire town, Hula near Arboye town, and Kelefa river near Huruta town. Widely distributed in the Kesem river basin, around Balchi town, NE-SW direction cliff of western Melka Jilo town.
Thickness: More than 20m at Arba Rekete, 5km southwest of Asebe Teferi town (L-AA59). More than 30m at Kelefa river (L-AB21). More than 62m at Balchi (L-MAD14). More than 200m along the Kesem valley.
Dark grey porphyritic to plagioclase phyric basalt. Kelefa River (L-AB21)
The unit is divided into two flow units, dark grey porphyritic basalt lava and light gray to dark grey porphyritic plagioclase basalt lava. Arba Rekete
(L-AA59)

The Project for Groundwater Resources Assessment JICA in the Middle Awash River Basin, Final Report (Main Report) KOKUSAI KOGYO CO., LTD.
2-25
Plagioclase-basalt. Komena (L-AA35) Plagioclase-basalt. Cheleleka (L-AA09)
Bluish-grey porphyritic to plagioclase phyric basalt. Balchi (L-MAD14)
Balchi rhyolite which is distributed at the lowest part. Balchi(L-MAD15)
Source: the Project Team, Data: Result of geological survey in this Project
Figure 2.2.16: Outcrop Photos of Alaji Basalts
b.1.2 Huse Ridge Rhyolites: Rhyolite, rhyolitic tuff: Tr1
Lithology: Consists mainly of white to bluish-grey, rarely pale pink rhyolite and tuff. The unit is unconformably overlain by Anchar basalts at the query of Asebe Teferi town (L-AA55). At Huse Ridge (L-AA53), the unit forms NE-SW ridge (more than 50 m high).
Distribution: Beka town to NE-SW distribution at Huse Ridge in 10km southeast of Mieso town.
Thickness: More than 50m at Huse Ridge, 10km southeast of Mieso town (L-AA53)
Rhyolitic Tuff at Huse Ridge (L-AA53) Source: the Project Team, Data: Result of geological survey in this Project
Figure 2.2.17: Outcrop Photos of Huse Ridge Rhyolites

The Project for Groundwater Resources Assessment JICA in the Middle Awash River Basin, Final Report (Main Report) KOKUSAI KOGYO CO., LTD.
2-26
b.1.3 Debre Birhan Ignimbrite: ignimbrite, conglomerates, and tuff: Ti1
This unit is divided by three lithological facies; the lower part consists of conglomerate, alternation of sands, tuff and minor pumice (lower conglomerate), the widely distributed middle part consists of consolidated to highly welded finer to medium tuff and unwelded to slightly welded pumiceous tuff (ignimbrite) and the upper part consists of conglomerate included pebble of Debre Birhan ignimbrite, alternation of sands, tuff and minor pumices (upper conglomerate). The lower conglomerate is distributed only in the Arerti town – Kesem river route.
Lithology: Consists of greenish-blue to light green consolidated to welded fine to medium tuff. At Aroge Minjar (L-MAD29), the unit is unconformably overlain by Nazret pyroclastic deposits, and is unconformably overlain by Tarmaber-Megezeze basalts at Balchi (L-MAD14).
Distribution: Widely distributed in the plains surrounding the Kesem river and the Kebena river, form the flat plain along Sendefa town to Seno town route.
Thickness: More than 25m at Kosfe (L-MAD33, L-MAD35) for ignimbrite layers. More than 8m of the lower conglomerate, and more than 7.5m of the upper conglomerate at Aroge Minjar, along the Arerti town – Kesem river route (L-MAD29).
The unit unconformably overlies Kesem basalts Aroge Minjar (L-MAD29)
The unit is unconformably overlain by Tarmaber-Megezez basalt. Balchi (L-MAD14)
The unit is unconformably overlain by Tarmaber-Megezez basalt. Gobemsa (L-MAD25)
Conglomarates and ignimbrite layers. Aroge Minjar (L-MAD29)
Source: the Project Team, Data: Result of geological survey in this Project
Figure 2.2.18: Outcrop Photos of Debre Birhan Ignimbrite
b.1.4 Anchar Basalts: massive basalt lavas and tuff breccia: Tb2
Lithology: Consists of massive aphyric basalt lavas and tuff breccia. At Asebe Teferi

The Project for Groundwater Resources Assessment JICA in the Middle Awash River Basin, Final Report (Main Report) KOKUSAI KOGYO CO., LTD.
2-27
(L-AA59), the unit is divided by three lithological facies; from the lowest, dark grey to black olivine-basalt with columnar joint (more than 40 m in thickness), reddish-brown auto-brecciated olivine-basalt (6m in thickness), reddish brown to grey auto-brecciated basalt (6m in thickness), and reddish-brown basaltic tuff breccia (6m in thickness). At the Awash river (L-KF45), the unit is overlain by a Bofa basalt unconformity. At Gidm Asfa (L-MAD21), the unit unconformably overlies Debre Birhan ignimbrite. At Balchi (L-MAD14), the unit unconformably overlies Debre Birhan ignimbrite and is unconformably overlain by Nazret pyroclastic deposits.
Distribution: NE-SW distribution at the southern mountain chain, around Awash town, Asebot town, Debala town and Chelelka town and widely distributed in the Kesem river basin.
Thickness: More than 58m at Asebe Teferi town (L-AA59). More than 20m at around Gidm Asfa (L-MAD21).
The unit unconformably overlies Huse ridge rhyolites. Asebe Teferi (L-AA57)
Outcrop of dark grey aphyric basalt. Agemti (L-AA20)
The unit unconformably overlies Debre Birhan ignimbrite. Gidm Asfa (L-MAD21)
The unit unconformably overlies Debre Birhan ignimbrite. Zongo (L-MAD10)
Source: the Project Team, Data: Result of geological survey in this Project
Figure 2.2.19: Outcrop Photos of Anchar Basalts
b.2 Pliocene
b.2.1 Pliocene Rhyolites: Rhyolite: rhyolitic tuff, pumice tuff: Tr2
b.2.1.1 Chefeko Rhyolites: Rhyolite: rhyolitic tuff, pumice tuff
Lithology: Consists mainly of white to bluish grey rhyolite lava flows and tuff, white pumice and hard tuff including obsidians. This unit is unconformably

The Project for Groundwater Resources Assessment JICA in the Middle Awash River Basin, Final Report (Main Report) KOKUSAI KOGYO CO., LTD.
2-28
overlain by Dino ignimbrite at Tulu near Itaya town (L-AB10). At Chefeko, (L-AB08) the rhyolite lava is observed to have developed platy joints and obsidians forming along chilled margin.
Distribution: Mt. Debeso, Chefeko, Lugo, forms a hill at Dera, Sodere, and Sara, and NE-SW distribution at Korkada Ridge.
Thickness: Around 150m at Chefeko, 5km northwest of Iteya town (L-AB08)
This unit is overlain unconformably by Dino ignimbrite (L-AB07r)
Hard tuff including obsidians at Chefeko (L-AB08)
Rhyolitic tuff, obsidian distributed at Mt. Debeso outcrop (L-AB09) Source: the Project Team, Data: Result of geological survey in this Project
Figure 2.2.20: Outcrop Photos of Chefeko Rhyolites
b.2.1.2 Birenti-Hada Rhyolites: Rhyolite, rhyolitic tuff, pumice tuff
Lithology: Consists mainly of white to bluish gray rhyolite lava flows and tuff, white pumice, pitchstone and hard tuff including obsidians. At Mt. Birenti (L-KF15), the unit is divided by six lithological facies; from the lowest, bluish-white rhyolitic fine tuff (more than 20m in thickness), bluish-grey pumice fall deposits (more than 5m in thickness), bluish-white rhyolitic pumice-tuff (more than 25m in thickness), white pumice-tuff (more than 3m in thickness), pitchstone (5m in thickness), and bluish- white rhyolitic tuff (more than 10m in thickness). At the southwestern part and northeastern part of the Kone caldera wall, the unit is observed more than 200 m from the bottom.
Distribution: Forms a NE-SW distribution hill at Bosena, Abadir Shero at Abadir Farm, Mt. Birenti and Dimtu Ridge south of Metehara Sugar Plantation.
Thickness: More than 80m at Bosena, northwest of Melka Jilo town (L-KF02).
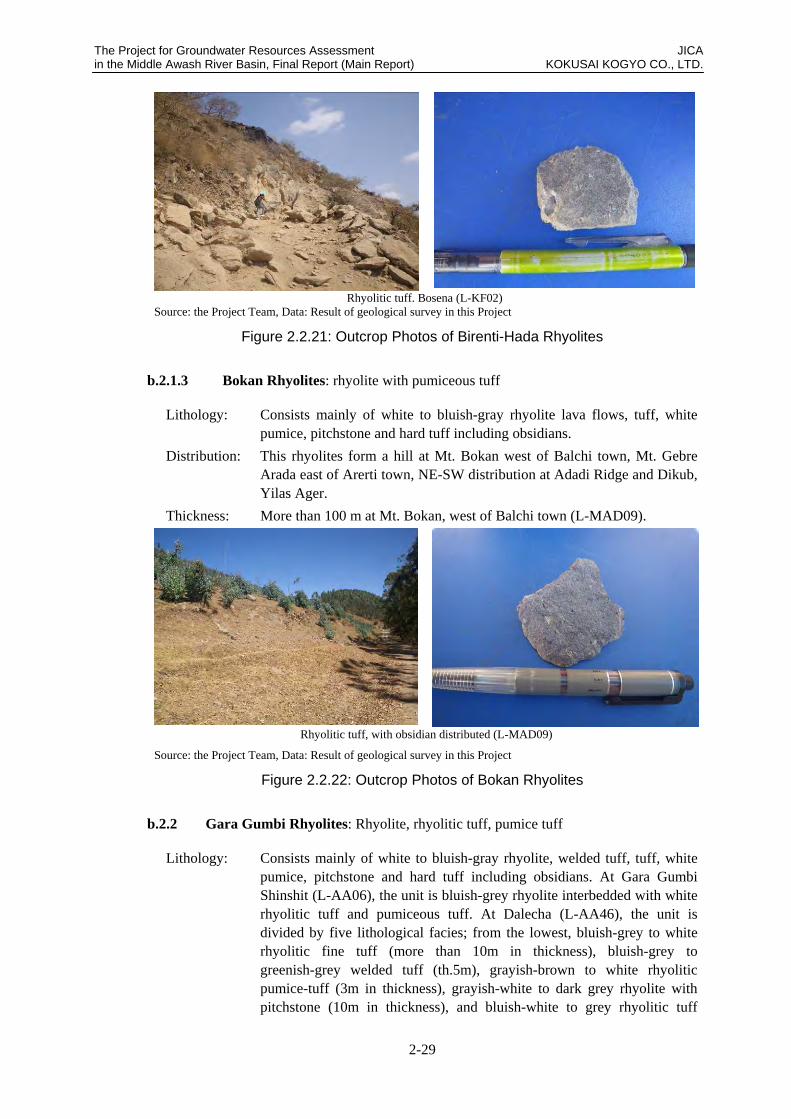
The Project for Groundwater Resources Assessment JICA in the Middle Awash River Basin, Final Report (Main Report) KOKUSAI KOGYO CO., LTD.
2-29
Rhyolitic tuff. Bosena (L-KF02) Source: the Project Team, Data: Result of geological survey in this Project
Figure 2.2.21: Outcrop Photos of Birenti-Hada Rhyolites
b.2.1.3 Bokan Rhyolites: rhyolite with pumiceous tuff
Lithology: Consists mainly of white to bluish-gray rhyolite lava flows, tuff, white pumice, pitchstone and hard tuff including obsidians.
Distribution: This rhyolites form a hill at Mt. Bokan west of Balchi town, Mt. Gebre Arada east of Arerti town, NE-SW distribution at Adadi Ridge and Dikub, Yilas Ager.
Thickness: More than 100 m at Mt. Bokan, west of Balchi town (L-MAD09).
Rhyolitic tuff, with obsidian distributed (L-MAD09)
Source: the Project Team, Data: Result of geological survey in this Project
Figure 2.2.22: Outcrop Photos of Bokan Rhyolites
b.2.2 Gara Gumbi Rhyolites: Rhyolite, rhyolitic tuff, pumice tuff
Lithology: Consists mainly of white to bluish-gray rhyolite, welded tuff, tuff, white pumice, pitchstone and hard tuff including obsidians. At Gara Gumbi Shinshit (L-AA06), the unit is bluish-grey rhyolite interbedded with white rhyolitic tuff and pumiceous tuff. At Dalecha (L-AA46), the unit is divided by five lithological facies; from the lowest, bluish-grey to white rhyolitic fine tuff (more than 10m in thickness), bluish-grey to greenish-grey welded tuff (th.5m), grayish-brown to white rhyolitic pumice-tuff (3m in thickness), grayish-white to dark grey rhyolite with pitchstone (10m in thickness), and bluish-white to grey rhyolitic tuff

The Project for Groundwater Resources Assessment JICA in the Middle Awash River Basin, Final Report (Main Report) KOKUSAI KOGYO CO., LTD.
2-30
(more than 20m in thickness). Distribution: Gara Gumbi, Dalecha Mountain Asebot town, forms a hill at northern part
of Mieso town. Thickness: More than 65 m at Gara Gumbi Shinshit (L-AA06), more than 50 m at
Dalecha (L-AA46)
Rhyolitic tuff and pumiceous tuff at Gara Gumbi Shinshit. (L-AA06)
Rhyolitic Tuff including Obsidians. (L-AA46)
Source: the Project Team, Data: Result of geological survey in this Project
Figure 2.2.23: Outcrop Photos of Gara Gumbi Rhyolites
b.2.3 Nazret Pyroclastic Deposits: Welded tuff, rhyolitic slightly welded tuff and tuff
breccia, pumice, tuff, and crystal tuff
This unit is divided by two lithological facies; the lower part consists of yellowish white pumice fall deposits, tuff, crystal tuff, alternation of fine volcanic sands and pumiceous tuff (Ti2), and the upper part consists of white to bluish-gray welded tuff, rhyolitic consolidated tuff and tuff breccia which contain white pumice, rhyolitic lava fragments, crushed and/or slightly weathered obsidian fragments and sometimes reddish-brown basaltic lava fragments (Ti3).
b.2.3.1 Lower Nazret pyroclastic deposits: Ti2
Lithology: Consists of yellowish white pumice fall deposits, tuff, crystal tuff, alternation of fine volcanic sands and pumiceous tuff. At Boko (L-AB11), alternation of dark grey medium tuff, reddish-brown fine tuff, white pumiceous tuff, dark grey lapilli tuff and bluish-grey fine tuff are observed. The strike is N150W and the dip is 22 0W. This unit is overlain unconformably by Bofa basalts at the Wakleso river in Doni town (L-AB43).
Distribution: Boru river, Sire, Huruta town, Ufura Ridge. Samasembet in eastern Ejere town, NE-SW directional cliff of western Melka Jilo town. Around Adele, Kora town, Jejeba to Wangeyu southeastern foot of Gara Gumbi, northern part of Debala town.
Thickness: More than 15m at Boko (L-AB11). More than 85m at Samasembet (L-MAD11). More than 20m at Adele (L-AA30)

The Project for Groundwater Resources Assessment JICA in the Middle Awash River Basin, Final Report (Main Report) KOKUSAI KOGYO CO., LTD.
2-31
Tuff breccia of lower part. Sire (L-AB35) The unit consists of pumice tuff and alternated tuff. Boko (L-AB11)
The unit consists of pumice tuff and alternated tuff. Samasembet (L-MAD11)
The unit consists of pumice tuff and alternated tuff. Adele (L-AA30)
The basaltic dyke is encountered in this unit. (L-AA29)
Source: the Project Team, Data: Result of geological survey in this Project
Figure 2.2.24: Outcrop Photos of Lower Nazret Pyroclastic Deposits
b.2.3.2 Upper Nazret pyroclastic deposits: Ti3
Lithology: Consists of white to bluish-gray rhyolitic compacted tuff, grayish green welded tuff with fiamme and tuff breccia which contain white pumice, rhyolitic lava fragments, crushed and/or slightly weathered obsidian fragments and rare reddish brown basaltic lava fragments.
Distribution: Boru river, Huruta town, and the northeastern shore of Lake Koka. Widely distributed in the plains surrounding Ejere town to Arerti town forms a gentle slope along the Kesem river basin.
Thickness: More than 2m Koka Dam (L-AB02), more than 30m at Rukecha (L-MAD40)
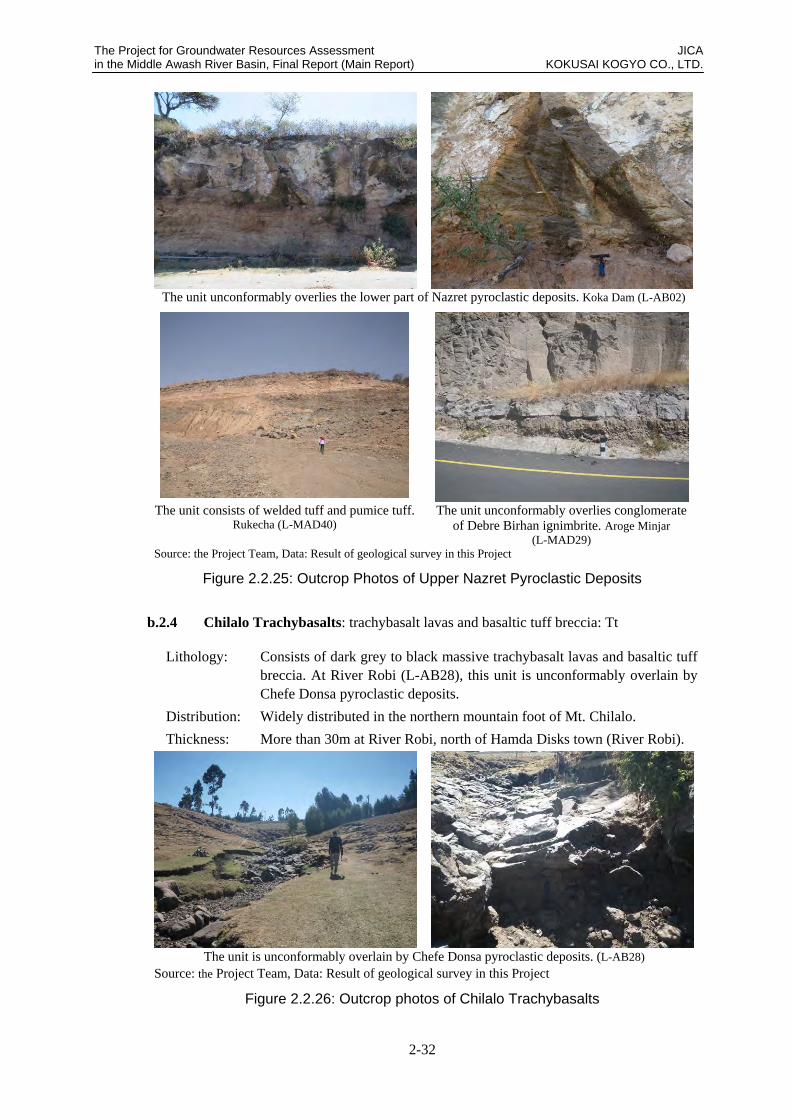
The Project for Groundwater Resources Assessment JICA in the Middle Awash River Basin, Final Report (Main Report) KOKUSAI KOGYO CO., LTD.
2-32
The unit unconformably overlies the lower part of Nazret pyroclastic deposits. Koka Dam (L-AB02)
The unit consists of welded tuff and pumice tuff.
Rukecha (L-MAD40) The unit unconformably overlies conglomerate
of Debre Birhan ignimbrite. Aroge Minjar (L-MAD29)
Source: the Project Team, Data: Result of geological survey in this Project
Figure 2.2.25: Outcrop Photos of Upper Nazret Pyroclastic Deposits
b.2.4 Chilalo Trachybasalts: trachybasalt lavas and basaltic tuff breccia: Tt
Lithology: Consists of dark grey to black massive trachybasalt lavas and basaltic tuff breccia. At River Robi (L-AB28), this unit is unconformably overlain by Chefe Donsa pyroclastic deposits.
Distribution: Widely distributed in the northern mountain foot of Mt. Chilalo. Thickness: More than 30m at River Robi, north of Hamda Disks town (River Robi).
The unit is unconformably overlain by Chefe Donsa pyroclastic deposits. (L-AB28) Source: the Project Team, Data: Result of geological survey in this Project
Figure 2.2.26: Outcrop photos of Chilalo Trachybasalts
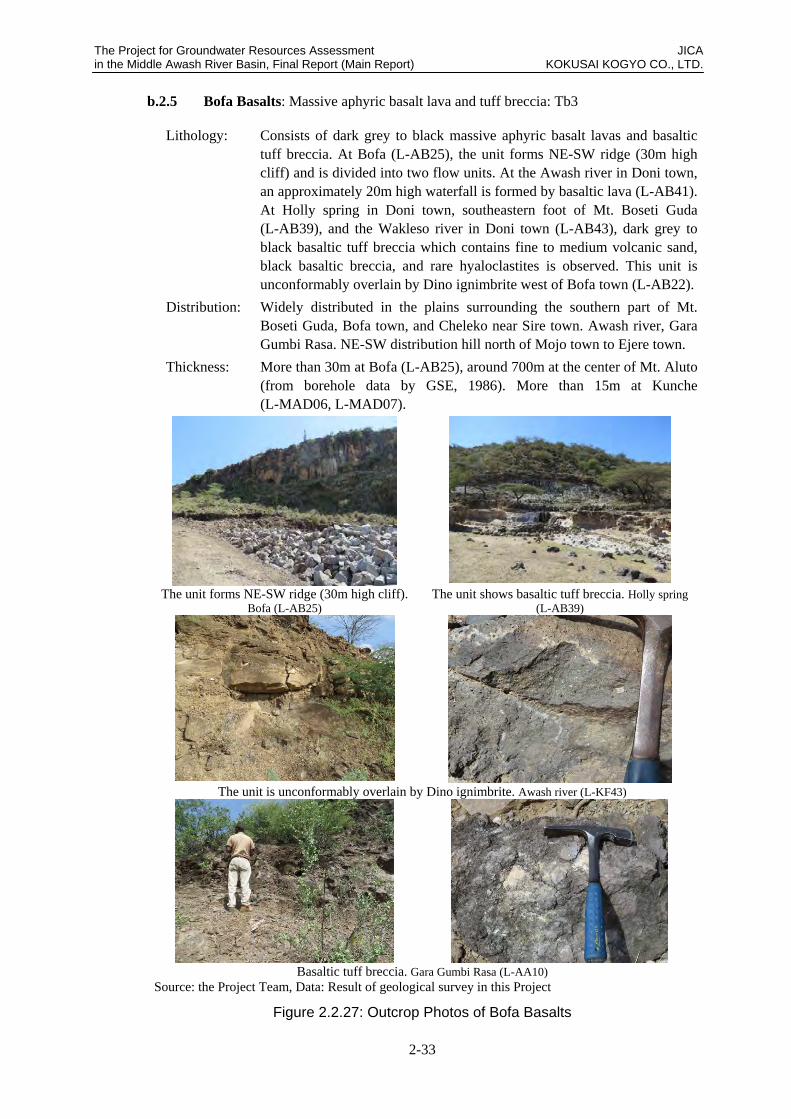
The Project for Groundwater Resources Assessment JICA in the Middle Awash River Basin, Final Report (Main Report) KOKUSAI KOGYO CO., LTD.
2-33
b.2.5 Bofa Basalts: Massive aphyric basalt lava and tuff breccia: Tb3
Lithology: Consists of dark grey to black massive aphyric basalt lavas and basaltic tuff breccia. At Bofa (L-AB25), the unit forms NE-SW ridge (30m high cliff) and is divided into two flow units. At the Awash river in Doni town, an approximately 20m high waterfall is formed by basaltic lava (L-AB41). At Holly spring in Doni town, southeastern foot of Mt. Boseti Guda (L-AB39), and the Wakleso river in Doni town (L-AB43), dark grey to black basaltic tuff breccia which contains fine to medium volcanic sand, black basaltic breccia, and rare hyaloclastites is observed. This unit is unconformably overlain by Dino ignimbrite west of Bofa town (L-AB22).
Distribution: Widely distributed in the plains surrounding the southern part of Mt. Boseti Guda, Bofa town, and Cheleko near Sire town. Awash river, Gara Gumbi Rasa. NE-SW distribution hill north of Mojo town to Ejere town.
Thickness: More than 30m at Bofa (L-AB25), around 700m at the center of Mt. Aluto (from borehole data by GSE, 1986). More than 15m at Kunche (L-MAD06, L-MAD07).
The unit forms NE-SW ridge (30m high cliff). Bofa (L-AB25)
The unit shows basaltic tuff breccia. Holly spring (L-AB39)
The unit is unconformably overlain by Dino ignimbrite. Awash river (L-KF43)
Basaltic tuff breccia. Gara Gumbi Rasa (L-AA10) Source: the Project Team, Data: Result of geological survey in this Project
Figure 2.2.27: Outcrop Photos of Bofa Basalts
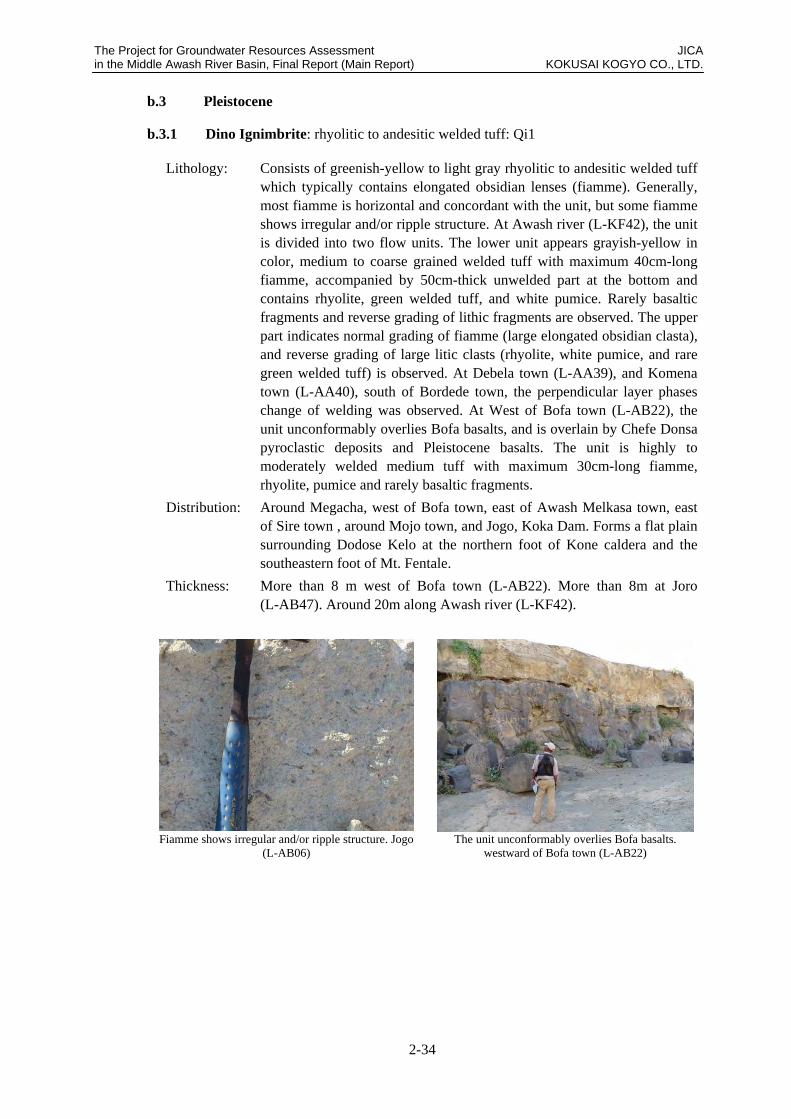
The Project for Groundwater Resources Assessment JICA in the Middle Awash River Basin, Final Report (Main Report) KOKUSAI KOGYO CO., LTD.
2-34
b.3 Pleistocene
b.3.1 Dino Ignimbrite: rhyolitic to andesitic welded tuff: Qi1
Lithology: Consists of greenish-yellow to light gray rhyolitic to andesitic welded tuff which typically contains elongated obsidian lenses (fiamme). Generally, most fiamme is horizontal and concordant with the unit, but some fiamme shows irregular and/or ripple structure. At Awash river (L-KF42), the unit is divided into two flow units. The lower unit appears grayish-yellow in color, medium to coarse grained welded tuff with maximum 40cm-long fiamme, accompanied by 50cm-thick unwelded part at the bottom and contains rhyolite, green welded tuff, and white pumice. Rarely basaltic fragments and reverse grading of lithic fragments are observed. The upper part indicates normal grading of fiamme (large elongated obsidian clasta), and reverse grading of large litic clasts (rhyolite, white pumice, and rare green welded tuff) is observed. At Debela town (L-AA39), and Komena town (L-AA40), south of Bordede town, the perpendicular layer phases change of welding was observed. At West of Bofa town (L-AB22), the unit unconformably overlies Bofa basalts, and is overlain by Chefe Donsa pyroclastic deposits and Pleistocene basalts. The unit is highly to moderately welded medium tuff with maximum 30cm-long fiamme, rhyolite, pumice and rarely basaltic fragments.
Distribution: Around Megacha, west of Bofa town, east of Awash Melkasa town, east of Sire town , around Mojo town, and Jogo, Koka Dam. Forms a flat plain surrounding Dodose Kelo at the northern foot of Kone caldera and the southeastern foot of Mt. Fentale.
Thickness: More than 8 m west of Bofa town (L-AB22). More than 8m at Joro (L-AB47). Around 20m along Awash river (L-KF42).
Fiamme shows irregular and/or ripple structure. Jogo (L-AB06)
The unit unconformably overlies Bofa basalts. westward of Bofa town (L-AB22)

The Project for Groundwater Resources Assessment JICA in the Middle Awash River Basin, Final Report (Main Report) KOKUSAI KOGYO CO., LTD.
2-35
Rhyolitic to andesitic Welded Tuff. (L-KF39) The unit unconformably overlies Tulu Rie basalts. Jolo (L-AB47)
Source: the Project Team, Data: Result of geological survey in this Project
Figure 2.2.28: Outcrop Photos of Dino Ignimbrite
b.3.2 Pleistocene Rhyolites: Rhyolite, rhyolitic tuff, pumice tuff: Qr1
Lithology: Consists mainly of white to bluish-gray rhyolite lava flows and tuff, white pumice, pitchstone and hard tuff including obsidians. At the northeastern part of the Gademsa caldera wall, the unit is observed more than 100m from the bottom.
Distribution: Caldera wall of Gademsa. Thickness: More than 100 m at northeastern cliff of Gademsa caldera.
The unit consists of rhyolitic tuff, obsidian. (L-AB05) Source: the Project Team, Data: Result of geological survey in this Project
Figure 2.2.29: Outcrop Photos of Pleistocene Rhyolites
b.3.3 Chefe Donsa Pyroclastic Deposits: pumice flow, pumice tuff: Qp1
Lithology: Consists mainly of pumice flow, white pumice tuff, bluish white pumice and white tuff. At Boru river (L-AB19), the unit consists of at least three layers with a paleosoil unconformity. The lower part contains a lot of lapilli and the upper part contains a lot of pumice, indicating normal grading in the unit. The unit, which consists of pumice tuff, tuff and paleosoil, unconformably overlies Dino ignimbrite east of Sire town (L-AB37).
Distribution: Around Mojo town, Dire town, Sire town and northeast of Adama town, Debra Zeyt town, Chefe Donsa town. Widely distributed, forms a flat

The Project for Groundwater Resources Assessment JICA in the Middle Awash River Basin, Final Report (Main Report) KOKUSAI KOGYO CO., LTD.
2-36
plain which is located around Awash Arba town. Thickness: More than 70m at Boru river about 10km east of Dera town (L-AB19).
More than 20m at Chefe Donsa town (L-MAD02). More than 6m at Jejeba (L-AA03).
The unit consists of pumice tuff with a paleosoil unconformity. Boru river (L-AB19)
The unit unconformably overlies Dino ignimbrite. Sire (L-AB37)
The unit unconformably overlies Nazret pyroclastic deposits. (L-MAD02)
Pumiceous tuff. Jejeba (L-AA03)
Source: the Project Team, Data: Result of geological survey in this Project
Figure 2.2.30: Outcrop Photos of Chefe Donsa Pyroclastic Deposits
b.3.4 Zikwala Trachytes: Trachytes: Qt
Lithology: The unit consists of dark gray, porphyritic trachytes with intercalation of pyroclastic material.
Distribution: Around Mt. Zikwala (L-MAD41). Thickness: More than 130m at Mt. Zikwala (L-MAD41).
The unit consists of dark gray, porphyritic trachytes. Mt. Zikwala (L-MAD41)
Source: the Project Team, Data: Result of geological survey in this Project
Figure 2.2.31: Outcrop Photos of Zikwala Trachytes
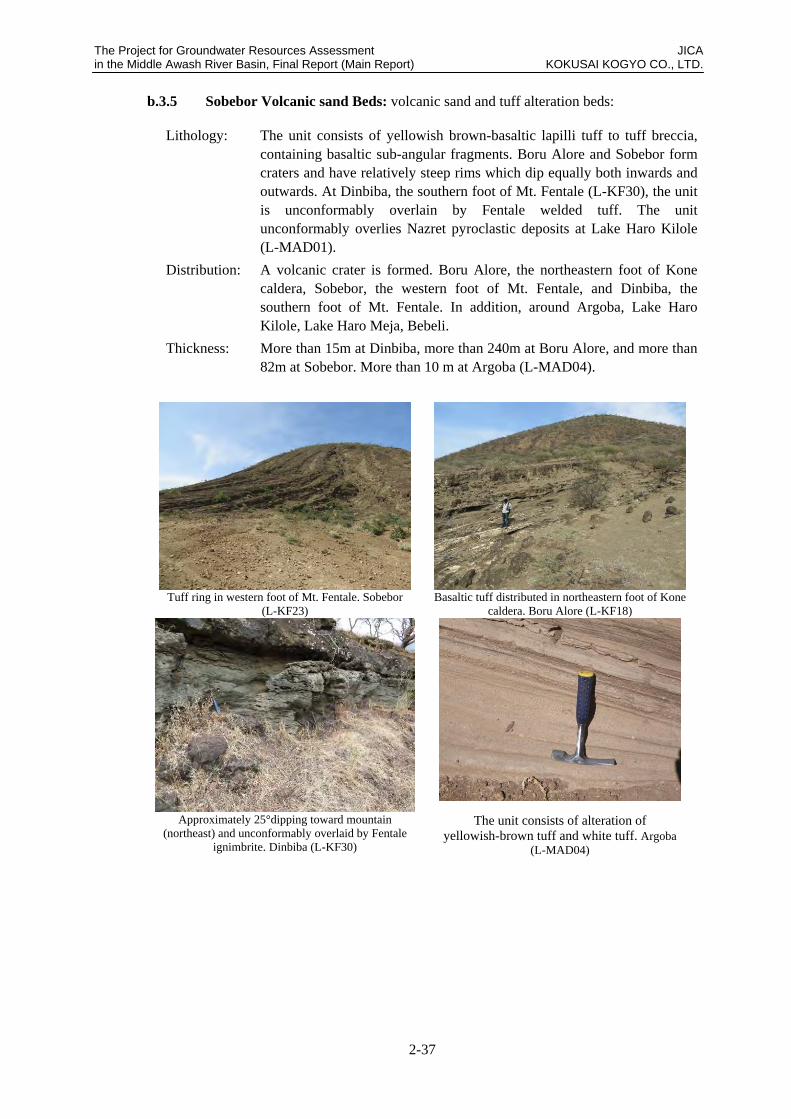
The Project for Groundwater Resources Assessment JICA in the Middle Awash River Basin, Final Report (Main Report) KOKUSAI KOGYO CO., LTD.
2-37
b.3.5 Sobebor Volcanic sand Beds: volcanic sand and tuff alteration beds:
Lithology: The unit consists of yellowish brown-basaltic lapilli tuff to tuff breccia, containing basaltic sub-angular fragments. Boru Alore and Sobebor form craters and have relatively steep rims which dip equally both inwards and outwards. At Dinbiba, the southern foot of Mt. Fentale (L-KF30), the unit is unconformably overlain by Fentale welded tuff. The unit unconformably overlies Nazret pyroclastic deposits at Lake Haro Kilole (L-MAD01).
Distribution: A volcanic crater is formed. Boru Alore, the northeastern foot of Kone caldera, Sobebor, the western foot of Mt. Fentale, and Dinbiba, the southern foot of Mt. Fentale. In addition, around Argoba, Lake Haro Kilole, Lake Haro Meja, Bebeli.
Thickness: More than 15m at Dinbiba, more than 240m at Boru Alore, and more than 82m at Sobebor. More than 10 m at Argoba (L-MAD04).
Tuff ring in western foot of Mt. Fentale. Sobebor (L-KF23)
Basaltic tuff distributed in northeastern foot of Kone caldera. Boru Alore (L-KF18)
Approximately 25°dipping toward mountain (northeast) and unconformably overlaid by Fentale
ignimbrite. Dinbiba (L-KF30)
The unit consists of alteration of yellowish-brown tuff and white tuff. Argoba
(L-MAD04)
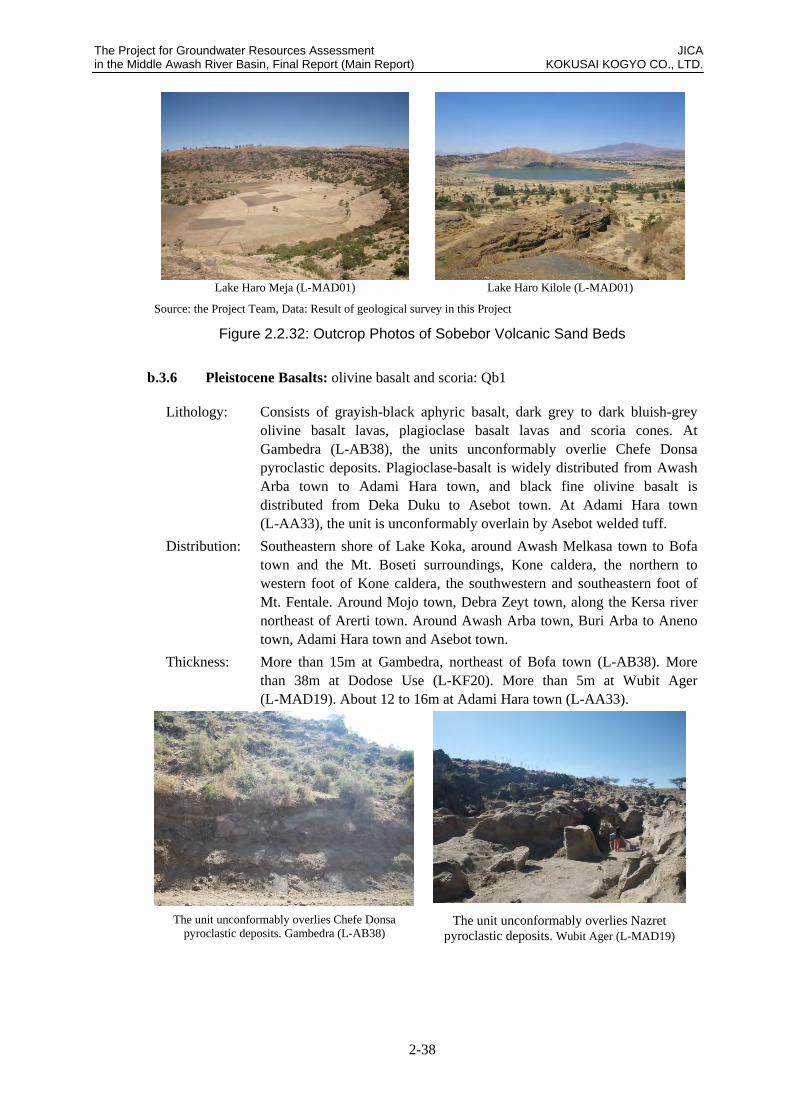
The Project for Groundwater Resources Assessment JICA in the Middle Awash River Basin, Final Report (Main Report) KOKUSAI KOGYO CO., LTD.
2-38
Lake Haro Meja (L-MAD01) Lake Haro Kilole (L-MAD01)
Source: the Project Team, Data: Result of geological survey in this Project
Figure 2.2.32: Outcrop Photos of Sobebor Volcanic Sand Beds
b.3.6 Pleistocene Basalts: olivine basalt and scoria: Qb1
Lithology: Consists of grayish-black aphyric basalt, dark grey to dark bluish-grey olivine basalt lavas, plagioclase basalt lavas and scoria cones. At Gambedra (L-AB38), the units unconformably overlie Chefe Donsa pyroclastic deposits. Plagioclase-basalt is widely distributed from Awash Arba town to Adami Hara town, and black fine olivine basalt is distributed from Deka Duku to Asebot town. At Adami Hara town (L-AA33), the unit is unconformably overlain by Asebot welded tuff.
Distribution: Southeastern shore of Lake Koka, around Awash Melkasa town to Bofa town and the Mt. Boseti surroundings, Kone caldera, the northern to western foot of Kone caldera, the southwestern and southeastern foot of Mt. Fentale. Around Mojo town, Debra Zeyt town, along the Kersa river northeast of Arerti town. Around Awash Arba town, Buri Arba to Aneno town, Adami Hara town and Asebot town.
Thickness: More than 15m at Gambedra, northeast of Bofa town (L-AB38). More than 38m at Dodose Use (L-KF20). More than 5m at Wubit Ager (L-MAD19). About 12 to 16m at Adami Hara town (L-AA33).
The unit unconformably overlies Chefe Donsa pyroclastic deposits. Gambedra (L-AB38)
The unit unconformably overlies Nazret pyroclastic deposits. Wubit Ager (L-MAD19)

The Project for Groundwater Resources Assessment JICA in the Middle Awash River Basin, Final Report (Main Report) KOKUSAI KOGYO CO., LTD.
2-39
Northeastern foot of Kone caldera . Dodote Use (L-KF20)
Southwestern foot of Mt. Fentale. The unit is overlain by a Fentale ignimbrite unconformity.
Bogda (L-KF25)
The unit is unconformably overlain by Asebot welded tuff. Adami Hara (L-AA33)
The unit unconformably overlies Adele rhyolitic tuff. Buri Korkoda Ridge (L-AA22)
Source: the Project Team, Data: Result of geological survey in this Project
Figure 2.2.33: Outcrop Photos of Pleistocene Basalts
b.3.7 Kone Ignimbrite: greenish consolidated to welded fine tuff: Qi2
Lithology: Consists of greenish-blue to light green rhyolitic to andesitic consolidated to welded tuff. At Kone (L-KF13), the unit is unconformably overlain by Kone pumice fall deposits. At Mt. Asebot (L-AA44), the unit is divided into four lithological phases; from lower, dark grey to light grey moderately welded tuff (6m in thickness), yellowish-brown pumiceous tuff (0.8m in thickness), grayish-brown slightly welded tuff with elongated obsidian lenses (fiamme, 0.8m in thickness), and grayish-purple moderately welded tuff (more than 5m in thickness). At Kulbas, southwestern foot of Mt. Asebot (L-AA38), dark grey to light grey moderately welded tuff of this unit is observed to increase with higher altitudes in the northeast (Mt. Asebot).
Distribution: Kone caldera and the caldera wall of Korke surroundings. Widely distributed in the plains surrounding Buri Arba town to Aneno town, Adami Hara, and Asebot town.
Thickness: More than 20m at the Kersa Alore plain (L-KF08). More than 36m at Mt. Asebot (L-AA44), more than 60 m at Kulbas (L-AA37).

The Project for Groundwater Resources Assessment JICA in the Middle Awash River Basin, Final Report (Main Report) KOKUSAI KOGYO CO., LTD.
2-40
The unit is unconformably overlain by Kone pumice fall deposits. Kone (L-KF13)
Southwestern foot of Kone caldera. Ofe (L-KF03)
Yellowish brown pumiceous tuff. Mt. Asebot (L-AA44) Source: the Project Team, Data: Result of geological survey in this Project
Figure 2.2.34: Outcrop Photos of Kone Ignimbrite
b.3.8 Boseti-Kone Pumice Fall Deposits: pumice fall deposits, pumice tuff and tuff:
Qp2
Lithology: Consists mainly of pale grey pumice fall deposits, light grey fine ash, white pumice tuff, bluish-white pumice and white tuff. The unit unconformably overlies Pleistocene basalts at Welensu (L-AB17) and Kone ignimbrite at Kone (L-KF13).
Distribution: Southwest of Mt. Boseti, Lake Koka and Adama town surroundings. NE-SW trending cliff of western Melka Jilo town. Kone caldera surroundings, and Mt. Fentale.
Thickness: More than 8 m at Mt. Boseti (L-AB30). More than 8m at Borchota (L-MAD23). More than 10m at Korke (L-KF10).
The unit unconformably overlies Pleistocene basalts. Welensu (L-AB17).
The unit consists of pumice fall deposits and ash. Mt. Boseti (L-AB29)

The Project for Groundwater Resources Assessment JICA in the Middle Awash River Basin, Final Report (Main Report) KOKUSAI KOGYO CO., LTD.
2-41
The unit consists of pumice fall deposits and ash. Borchota (L-MAD23)
Pumice fall deposits and ash. Korke (L-KF10)
Source: the Project Team, Data: Result of geological survey in this Project
Figure 2.2.35: Outcrop Photos of Boseti-Kone Pumice Fall Deposits
b.3.9 Fentale Volcanic Rocks: rhyolite to trachyte lavas: Qf
Lithology: This unit is acidic volcanic rocks which form the main body of Mt. Fentale. The volcanic rocks are composed of rhyolite and trachyte lavas in which phenocrysts of alkali feldspar and hornblende are scattered. The lava surface is block type with a diameter from several dozen cm to about 1 m. The lavas are generally very glassy and are black to deep green in color.
Distribution: Mt. Fentale body and mountain foot. Thickness: More than 100m at the foot of Mt. Fentale.
View of Mt. Fentale from the southern foot. Trachyte lava distributed in the southern foot of Mt. Fentale.
Source: the Project Team, Data: Result of geological survey in this Project
Figure 2.2.36: Outcrop Photos of Fentale Volcanic Rocks
b.3.10 Fentale Ignimbrite: rhyolitic to andesitic welded tuff: Qi3
Lithology: Consists of greenish-blue to light yellow rhyolitic to andesitic welded tuff which typically contains elongated obsidian lenses (fiamme). Generally, fiamme is horizontal and concordant with the unit. At Dinbiba, the southern foot of Mt. Fentale (L-KF31), the unit is divided into three lithological facies; from lowest, greenish-blue highly welded tuff with fiamme, pumice fall deposits, and light yellow highly welded tuff with fiamme. At Dinbiba (L-KF30), the unit unconformably overlies Sobebor volcanic sand beds and is overlain by Holocene basalts. The unit is highly

The Project for Groundwater Resources Assessment JICA in the Middle Awash River Basin, Final Report (Main Report) KOKUSAI KOGYO CO., LTD.
2-42
to moderately welded medium tuff with maximum 20cm-long fiamme, rhyolite, pumice and strongly welded tuff fragments.
Distribution: All around the foot of Mt. Fentale. NE-SW directional cliff of western Melka Jilo town. Widely distributed, forms a flat plain which is located around Awash town and Awash Arba town.
Thickness: More than 12m at Bogda, western foot of Mt. Fentale (L-KF24). More than 5m at Borchota (L-MAD23). More than 15m at Awash Arba (L-KF40).
The unit overlies a Mt. Boseti pumice fall deposit unconformity. (L-MAD37)
The unit consists of rhyolitic to andesitic welded tuff. Lake Koka (L-AB10)
The fiamme is horizontal and concordant with the unit. (southern foot of Mt. Fentale). Dinbiba (L-KF31)
The unit unconformably overlies Sobebor volcanic sand beds. Southern foot of Mt. Fentale (L-KF30)
The unit is unconformably overlain by Holocene basalts. Southern foot of Mt. Fentale (L-KF34)
Source: the Project Team, Data: Result of geological survey in this Project
Figure 2.2.37: Outcrop Photos of Fentale Ignimbrite
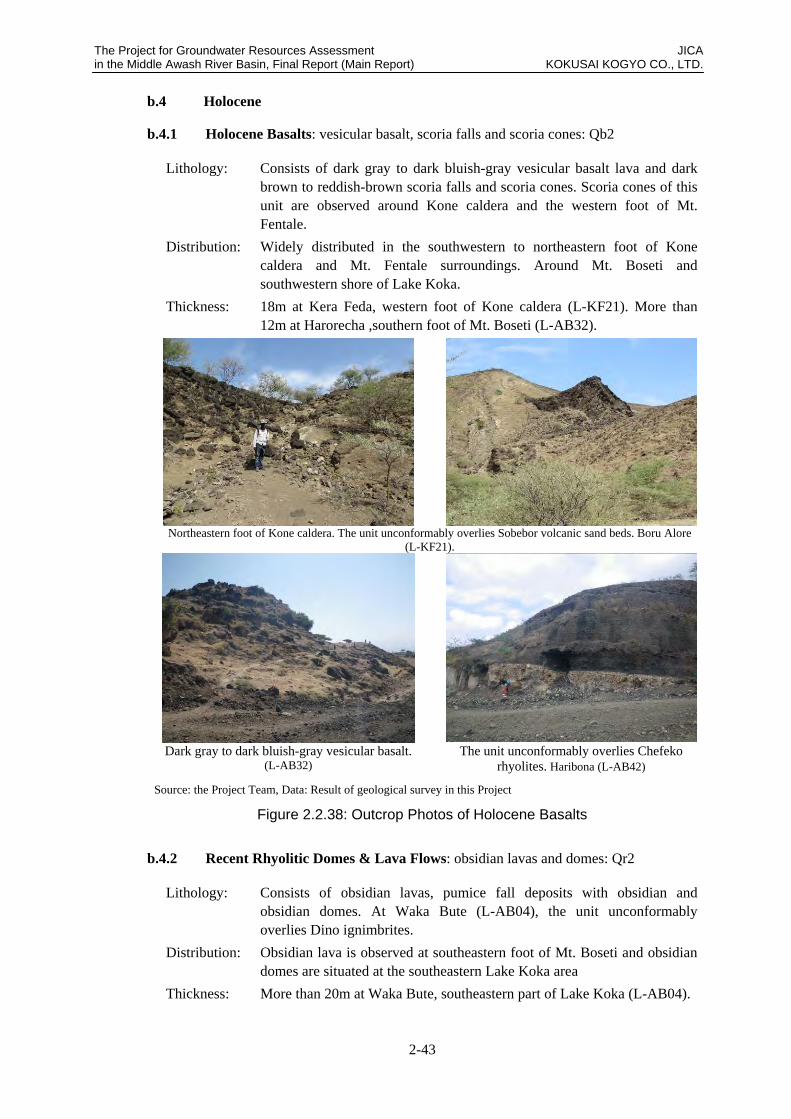
The Project for Groundwater Resources Assessment JICA in the Middle Awash River Basin, Final Report (Main Report) KOKUSAI KOGYO CO., LTD.
2-43
b.4 Holocene
b.4.1 Holocene Basalts: vesicular basalt, scoria falls and scoria cones: Qb2
Lithology: Consists of dark gray to dark bluish-gray vesicular basalt lava and dark brown to reddish-brown scoria falls and scoria cones. Scoria cones of this unit are observed around Kone caldera and the western foot of Mt. Fentale.
Distribution: Widely distributed in the southwestern to northeastern foot of Kone caldera and Mt. Fentale surroundings. Around Mt. Boseti and southwestern shore of Lake Koka.
Thickness: 18m at Kera Feda, western foot of Kone caldera (L-KF21). More than 12m at Harorecha ,southern foot of Mt. Boseti (L-AB32).
Northeastern foot of Kone caldera. The unit unconformably overlies Sobebor volcanic sand beds. Boru Alore (L-KF21).
Dark gray to dark bluish-gray vesicular basalt. (L-AB32)
The unit unconformably overlies Chefeko rhyolites. Haribona (L-AB42)
Source: the Project Team, Data: Result of geological survey in this Project
Figure 2.2.38: Outcrop Photos of Holocene Basalts
b.4.2 Recent Rhyolitic Domes & Lava Flows: obsidian lavas and domes: Qr2
Lithology: Consists of obsidian lavas, pumice fall deposits with obsidian and obsidian domes. At Waka Bute (L-AB04), the unit unconformably overlies Dino ignimbrites.
Distribution: Obsidian lava is observed at southeastern foot of Mt. Boseti and obsidian domes are situated at the southeastern Lake Koka area
Thickness: More than 20m at Waka Bute, southeastern part of Lake Koka (L-AB04).

The Project for Groundwater Resources Assessment JICA in the Middle Awash River Basin, Final Report (Main Report) KOKUSAI KOGYO CO., LTD.
2-44
The unit overlies unconformably Dino ignimbrite. Waka Bute (L-AB04)
The unit unconformably overlies Holocene basalts. Miesa (L-AB03)
Source: the Project Team, Data: Result of geological survey in this Project
Figure 2.2.39: Outcrop Photos of Recent Rhyolitic Domes & Lava Flows
b.4.3 Alluvium: Qal
Lithology: Fine sand and mud Distribution: Along Awash river and Mojo river. Thickness: 1 to 5 m
The geological map of study area is shown in Figure 2.2.40 and the geological cross section is shown in Figure 2.2.41.

The Project for Groundwater Resources Assessment JICA in the Middle Awash River Basin, Final Report (Main Report) KOKUSAI KOGYO CO., LTD.
2-45
Figure 2.2.40: Geological Map of Study Area
Source: the Project Team, Data: Result of survey in this Project

The Project for Groundwater Resources Assessment JICA in the Middle Awash River Basin, Final Report (Main Report) KOKUSAI KOGYO CO., LTD.
2-46
Figure 2.2.41: Geological Cross-Section of Study Area Source: the Project Team, Data: Result of survey in this Project

The Project for Groundwater Resources Assessment JICA in the Middle Awash River Basin, Final Report (Main Report) KOKUSAI KOGYO CO., LTD.
2-47
2.2.4 Correlation of stratigraphy with previous studies
Results of correlation of stratigraphy established in this study and the previous documents listed below which cover the same area are shown in Table 2.2.15.
Documents and maps Study area Kazmin & Berhe (1978) Nazret area Alidge Groundwater Resources Assessment Project (2009) Alidge, Awash area Oromia Water Works Design & Supervision Enterprise (2013) Beseka area GSE (1985) Dire Dawa area GSE (2010) Debre Birhan area GSE (2010) Akaki-Beseka area F. Mazzarini et al (1999) Debre Zeyt area JICA (2012) Rift valley lake zone

The Project for Groundwater Resources Assessment JICA in the Middle Awash River Basin, Final Report (Main Report) KOKUSAI KOGYO CO., LTD.
2-48
Table 2.2.15: Correlation of Stratigraphy with Existing Documents and Maps Kazmin et al.(1978), GSE (1978)
Nazret areaAGRAP (2009)
Alidge-Awash areaOWWDSE (2013)
Beseka areaGSE (1985)
Dire-Dawa areaGSE (2010)
Debre Birhan areaGSE (2010)
Akaki-Beseka areaF. Mazzarini, et al.(1999)
Debre Zeyt areaJICA (2012)
Rift Valley lake zone 年代
Qed, Elluvial depositQsd, Slope deposits
Qaf, Alluvial fanQgf, Gravel outwash
Qtr, TravertineQal, Alluvial with minor
agglomerateQel, Eluvial
Qus, Alluvium Alluvium CoverAl, Alluvium
Q, Unclassified fluvial deposits
Qwra, Alkali and paralkali rhyolites, trachytes, domes and flows of Boset Weldoyi andHada mountains (Wanji group)Qwpu, Unwelded rhyolitic pumice and unwelded tuffs (Wanji group)
Qwb3, Recent aphyric basalt (Wanji group) Qb2, Aa lavaHolocene basalt
Scoria coneQwbh, Recent and subrecent
basaltic flows and caves
Qub, Basaltic lava flowsQuc, Scoria cones and fall out
depositsrb, Butajira recent basalt
Qwi2, Young ignimbrites of Fantale (Wanji group)Nn, Ash flow tuffs, pantelleritic ignimbrites and unwelded tuffs (Nazret group) Qed, Elluvial deposit
Fantaleignimbrite
Fantaleignimbrite
Qfig, Fentale-Alay degeignimbrite
G, Gonde strongly green weldedtuff
ob, Kulmusa highly welded tuff168,000±38,000 y (OWWDSE ,2013)
Qwt, Trachytic flows and domes associated with Fantale, Tinish Fantale and Kone(Wanji group)Qwp, Pitchstone flows and domes (Wanji group)Qwpo, Pantelleritic volcanics of Fantale rhyolites, trachytes, tuffs and agglomerates(Wanji group)
diverse Fantale volcanics Qft, Fentale trachyte
Qwpu, Unwelded rhyolitic pumice and unwelded tuffs (Wanji group)Nn, Ash flow tuffs, pantelleritic ignimbrites and unwelded tuffs (Nazret group)Qwb3, Recent aphyric basalt (Wanji group)
Y, Langano poorly weldedpumiceous pyroclastics
Nn, Ash flow tuffs, pantelleritic ignimbrites and unwelded tuffs (Nazret group) N2ab, Afar stratoid basalt upper N1_2n, Stratoid silicics Qdb, Dofan basaltG, Gonde strongly green welded
tuff
Qwb1, Pleistocene-subrecent basalts (Wanji group)Qwb2, Porphyritic feldspar basalts of Tulu Moye (Wanji group) Qb1, Basic lava flow and caves Pleistocene Basalt Qdb, Dofan basalt ba, Ogolche pleistocene basalt Zikwala olivine basalt : 0.61±0.03Ma (Morton et.al.,1979)
Qwh, Basaltic hyaloclastites (Wanji group)Qwe, Bedded explosion tuffs (Wanji group) Tuff Cone Qup, Phreatomagmatic deposits
Qtz, Zikwala trachytes Zikwala Volcanic unit 0.85±0.05Ma, 0.92±0.04Ma, 1.28±0.15Ma (Morton et al.,1979)
Qwpu, Unwelded rhyolitic pumice and unwelded tuffs (Wanji group)Nn, Ash flow tuffs, pantelleritic ignimbrites and unwelded tuffs (Nazret group)Qwb3, Recent aphyric basalt (Wanji group)
N2ab, Afar stratoid basalt upperolder ignimbrite of the Fantale
areaN1_2n, Stratoid silicics
Ncp, Chefe donsa pyroclasticdeposits
Chefe Donsa unitW, Ketar river acidic volcanic
sedimentary rocksChefe Donsa pyroclastic deposits : 1.71±0.04 Ma(Morrton et al.,1979), 2.24±0.3 Ma(IGGI-Pisa)
Nn, Ash flow tuffs, pantelleritic ignimbrites and unwelded tuffs (Nazret group)Qwp, Pitchstone flows and domes (Wanji group) rh, Gademotta rhyolite
Qwi, Dino ignimbrites (Wanji group)Nn, Ash flow tuffs, pantelleritic ignimbrites and unwelded tuffs (Nazret group) Nig, Dino ignimbrite Dino Tuff
G, Gonde strongly green weldedtuff
Dino ignimbrite: 1.5my (Mobidelli et al., 1975), 1.51 Ma (Kazmun, et al.,1978)
N2Qb, Bofa basalts N1ab, Afar stratoid basalt lower Bofa basaltN1_2ab, Stratoid basalts of Afar
(lower part)Tulu Rie Basalts unit N2b, Basalt
Tulu Rie basalt: 2.7±0.1 Ma(INGEIS-Buenos Aires),1.44±0.03 Ma(Chernet et al., 1998)Bofa : 1.21 Ma (Kazumin, et al., 1978), 6.1-4.4 Ma(Morton et al.,1979)
N2c, Chilalo and Badda trachytes and trachybasalts
Nn, Ash flow tuffs, pantelleritic ignimbrites and unwelded tuffs (Nazret group)Ql, Lacustrine sediments Nwp, Welded pyroclastic flows
Nn, Ash flow tuffs, pantelleritic ignimbrites and unwelded tuffs (Nazret group)Ql, Lacustrine sediments
N1_2ab, Stratoid basalts of Afar(lower part)
Npp, Welded to partially weldedpyroclastic flows
N2r, Older alkaline and paralkaline rhyolite domes and flowsQwt, Trachytic flows and domes associated with Fantale, Tinish Fantale and Kone(Wanji group)Qwra, Alkali and paralkali rhyolites, trachytes, domes and flows of Boset Weldoyi andHada mountains (Wanji group)
Nry, Rhyolitic volcanic centresrhyolite domes, flows and
pumiceN2r
N1_2gg, Peralkaline rhyoliticand trachytic domes and flows
Nrd, Rhyolitic and trachytic lavadomes
N1_2n, Rhyolitic volcanics
N1n, Anchar basalts N1n, Anchor basalt N1n, Anchar basalts Ttb, Tarmaber-Megezeze basaltE3tm, Tarmaber megezez
formationEga, Guraghe-Anchor basalts
Ngs, Sharenga rhyoliteAnchar : 12.4 Ma (Kazumin et.al., 1978)Mt. Megezeze: 13Ma, (Zanettin et al., 1974), 10.4Ma, (Chernet et al., 1998)
Tdig, Sela dengay-Debre birhan-Gorgo ignimbrite
Ngu, Upper basalt
N1r, Arba Guracha silicics N1r, Arba guracha silicics N1r, Arba guracha silicics Ngu, Upper basalt
N1a, Alaji basalts PNa1, Alajae formation P3N1a, Alaji basalts Tkb, Kesem basalt E2aa, Aiba-Alaje basaltsNgb, Beyana tuff,
Ngm, Middle basalt24-23Ma (Chernet et al., 1998), 14.4 Ma (Kuntz et al., 1975), 28-15 Ma (Morbidelli et al.,1975), 21.06±1.5 Ma, 14.94±1.5 Ma, 17.4±1.0 Ma (Kazumin, et al., 1978)
Nazret unit
rht, Rhyolitic tuffNqs, Rhyolite
Nwp : 3.5±0.1 Ma, 3.2±0.1 Ma(IGGI-Pisa), 4.7±0.7 Ma, 5.4±0.2 Ma(INGEIS-Buenos Aires),3.32±0.06 Ma, 3.11±0.06 Ma(Morton et al., 1979)Lower Nazret pyroclastic deposits
(Ti2)
Pliocene rhyolites(Tr2)T
ertia
ry
Plio
cene
Bofa basalts(Tb3)
Chilalo Trachybasalts(Tt)
Upper Nazret pyroclastic deposit(Ti3) older ignimbrite of the Fantale
area
Plei
stoc
ene
basa
lt
Zikwala Trachytes(Qt)
Chefe Donsa pyroclastic deposits(Qp1)
Pleistocene rhyolites(Qr1)
Dino ignimbrite(Qi1)
N1ab, Afar stratoid basalt lower
Fantale ignimbrite(Qi3)
Mio
cene
Anchar basalts(Tb2)
Debre Birhan ignimbrite(Ti1)
Huse Ridge rhyolites(Tr1)
Alaji basalts(Qb1)
Fantale volcanic rocks(Qf)
Boseti & Kone pumice falls(Qp2)
Kone ignimbrite(Qi2)
Pleistocene basalts(Qb1)
Bishoftu Volcanic unit
Sobebor volcanic sand beds(Qs)
Age This study
Cai
nozo
ic
Qua
rter
nary
Hol
ocen
e
Alluvium(Qal)
Recent rhyolitic domes & lava flows(Qr2)
Holocene basalts(Qb2)
Source: the Project Team, Data: Result of survey in this Project
Geological Age
(Tb1)

The Project for Groundwater Resources Assessment JICA in the Middle Awash River Basin, Final Report (Main Report) KOKUSAI KOGYO CO., LTD.
2-49
2.2.5 Geological structure and volcanic activity
a. Fault system
The MER (Main Ethiopian Rift) is an area of graben showing intense tensional tectonism and the related emplacement of volcanic products. The study area is located in a very complex junction of three important rift structures, two oceanic, the Red Sea and the Gulf of Aden and one continental, the East African Rift (Elc Electroconsult and Geotermica Italiana, 1987).
Generally, there are two main hypotheses of kinematic evolution of the Ethiopian Rift (ER). Some authors believe that the ER evolution has been mostly dominated by nearly pure extension (Mohr, 1983; Ebinger et al., 1993) with also a dextral component of displacement along the rift structure (Chorowicz et al., 1994), while the other authors suggest the occurrence of a left-lateral component of displacement along the rift axis during Quaternary (Boccaletti et al., 1999).
Boccaletti et al. (1999) summarized the previous study of structural setting of the MER as follows. The occurrence of two distinct fault systems in the MER is recognized; i) a mainly NE to NNE-trending border fault system that defines the rift margins and ii) a N to NNE-trending fault system that is mainly composed of right-stepping en-echelon faults constituting the so-called “Wonji Fault Belt (WFB)” (Mohr, 1960).
b. Active structures
The Wonji Fault Belt (WFB) is formed by several segments of Quaternary volcano-tectonic activity and these segments are disposed en-echelon left laterally (Gibson and Tazieff, 1970). They most probably represent incipient spreading center (Kazmin and Berhe, 1978).
The general structural pattern of the whole MER suggests the occurrence of a recent sinistral component of displacement along the rift axis. Nearly NNE-trending right-stepping en-echelon segments of the WFB located within the rift zone are arranged obliquely to the Rift margins. This setting is interpreted as evidence of the occurrence of some left-lateral shearing along the Rift (Boccaletti et al., 1999).
These segments of high activity can be recognized as shown in Figure 2.2.42. Kazmin and Barhe (1978) describe the characteristics of the WFB in the study area as follows. The southernmost segment, about 10km wide, extends along the eastern shore of Lake Ziway up to Gedemsa Caldera. It consists of numerous faults and open fractures situated 500 to 1,000m apart. This segment is marked by extensive eruptions of basalts, mainly from the Tulu Moye center and by the large silicic center of Gedemsa. There is no visible continuation of this axial segment in the north of Gademsa. It is substituted by the next segment, which is displaced about 10km to the east. This segment widens to 20km to the north and is marked by the two large silicic centers of Boseti and Kone as well as extensive fissure basalt eruptions. In the north of Kone Caldera, it is substituted by the third segment, which starts from the Fentale.

The Project for Groundwater Resources Assessment JICA in the Middle Awash River Basin, Final Report (Main Report) KOKUSAI KOGYO CO., LTD.
2-50
Source: Elc Electroconsult and Geotermica Italiana, 1987
Figure 2.2.42: En Echelon” Arrangement of the Active Volcano-tectonic Axis within the Northern Part of the Ethiopian Rift
2.2.6 Hydrogeology
a. Hydrogeological data collection
a.1 List of references
The geological map, hydrogeological map in relation to the hydrogeology and main reports have been collected for the references of the Study (refer to Table 2.2.16). Those reports and maps are collected mainly from Geological Survey of Ethiopia (hereafter referred to as “GSE”), Ministry of Water Irrigation and Electricity (hereafter referred to as “MoWIE”), and Water Works Design and Supervision Enterprise (hereafter referred to as “WWDSE”) and so on.
Table 2.2.16: List of References
i) Geological maps and explanation reports Geological map of Nazret, Ethiopian Institute of Geological Surveys (EIGS), 1978
Geology and Developing of the Nazret area, northern Ethiopia rift, Kazmin etc. EIGS 1978 Geological map of Dire Dawa, EIGS, 1985 Geological map of Debre Birhan, Geological Survey of Ethiopia (GSE), 1993 Geology of Debre Birhan area, Daniel Mesheha etc. compiled, GSE, 2010 Geological map of Akaki Beseka area, GSE, 1997 Geology of Akaki Beseka, Efrem Beshawered compiled, GSE, 2010 Geology of Addis Ababa map sheet, GSE, 1997 Geology of Addis Ababa city, Getahun assigned, GSE, 2007
ii) Hydrogeological maps and reports Hydrogeology (Map) of the Nazret, EIGS, 1985
Hydrogeology (Report) of the Nazret area (NC37-15), Gtahun Kebede, EICS, 1987 Hydrogeological map of Ethiopia (1:2,000,000) compiled by Tesfaye Chernet and the Regional Geology
Department, EIGS, 1988 Hydrogeological map of Addis Ababa sheet (NC37-10), GSE, 2010 Hydrochemical map of Addis Ababa sheet (NC37-10), GSE, 2010 Hydrogeological report of Addis Ababa sheet (NC37-10), GSE, 2010

The Project for Groundwater Resources Assessment JICA in the Middle Awash River Basin, Final Report (Main Report) KOKUSAI KOGYO CO., LTD.
2-51
iii) Project reports Geothermal reconnaissance study of selected sites of the Ethiopian rift system, EIGS, 1987
Fentale irrigation based interated development project, Oromia Water Works Design and Supervision Enterprise (OWWDSE), 2007
Evaluation of water resources of the Ada’a and Becho plans groundwater basin for irrigation development project, Water Works Design and Supervision Enterprise (WWDSE), planned by Ministry of Water Resources (MoWR), 2009
Allaidege plain groundwater resources assessment project, WWDSE planned by MoWR, 2009 ⅳ) Drilling reports
Well completion report for well drilling Funyan Ajo, 2003 Well completion report for Asebot town, 2008 Technical well completion report on Bakiko water supply project, 2005 Well completion report for well drilling at Oda Keneni,2003 Technical well completion report on Geneda Ta’a water supply project, 2005 Well completion report for well drilling at Hunde Missona, 2004 Completion report of deep water well drilling in Kurfa Wachu village, 2008 Well completion report for well drilling at Wolda Jajela, 2004 Technical well completion report on Calalaka Ta’a water supply project, 2005 Report on physical & Chemical analysis of water at Baka, Sararoo, and Caroraa, Drilling report at Milinoztuftuewde, Fayo, Burka Misra, and Tu, 2002-2003 Completion report of Abomsa deep well, 2008 Watcha Dole well completion report, 2013 Completion report of Abasa-Goroba deep wel, 2008 Well completion report for Marfe Village, 2009 Well completion report for Shamp Godo Kebele, 2009 Technical report on water well drilling and completion works undertaken at Cheffe Mishoma, 2007 Water well drilling completion report in Bote#1 site, 2013 Water well drilling completion report in Bote#2 site, 2013 Completion report for Mojo well, 2008 Well completion report of Ilmo Chukela Borehole, 2012 Waber Chukala well completion report, 2013 Well completion report at Fatole & Kurma Fatole, 2013 Well completion report at Kachachule Guja & Daglagala Jida, 2013 Six boreholes drilling, construction and testing project, 2013
-Well completion report of well 01 Kuntlshile hama district - Well completion report of well 02 Manjikso waji district - Well completion report of well 03 Dhinque Cheleba district - Well completion report of well 04 Wara Jarsa district
Well completion report at Kallo Kabite, Adada Dambala and Giche Garbabo, 2013 Well completion report at Tulu Ree, Foche, Wabor Cale amd Cheleleka, 2007 Well completion report of Agemso Rogicha borehole, 2012 Well completion report of Bishan Tino borehole, 2012 North Showa zone Minjar Shenkora Woreda in Agirat kebele test /production wells drilling supervision
report, 2011 Water well drilling report format; Agirat water well, Agirat-2 and Mstw#2, 2011-2012 Groundwater investigation report for rural kebeles in Minijar-Shenkora, 2007 Study review to locate borehole sites and drilling supervision report for Arerti town, 2006 Well drilling supervision report for Samsenbet area community water supply, 2008
ⅴ) References and reports in relation to the Lake Beseka
The study of Beseka Lake levels, Sir William Halcrow and partners, 1978 Study of Lake Beseka, MoWR, 1999 Growing lake with growing problems: integrated hydrogeological investigation on Lake Beseka, Eleni
Ayalew Belay, 2009 National lakes of Ethiopia, Tenalem Ayenew, 2009, AAU Press. Study and design of Lake Besaka level rise project Ⅱ, WWDSE, planned by Ministry of Water and
Energy (MoWE), 2011 Assessment and evaluation of cause for growth of Lake Besaka and design mitigation measures,
OWWDSE, planned by MoWE, 2013 ⅵ) References and reports in relation to the Study as a whole

The Project for Groundwater Resources Assessment JICA in the Middle Awash River Basin, Final Report (Main Report) KOKUSAI KOGYO CO., LTD.
2-52
F. Mazzarini et al. (1999) Geology of Debre Zeyt area (Ethiopia)(with a geological map at scale:100,000), Acta Volcanologica-11, 131-141
W. George Darling, et al. (1996) Lake-groundwater relationships and fluid-rock interaction in the East African Rift Valley: isotopic evidence, Journal African Earth Sciences 22, 423-431
Tesfaye Chernet (1982) Hydrogeology of the lakes region, Ethiopia, EIGS Seifu Kebede et al. (2008) Groundwater origin and flow along selected transects in Ethiopian rift
volcanic aquifers, Hydrogeology Journal 16, 55-73 Caroline Le Turdu et al. (1999) The Ziway-Shala lake basin system, Main Ethiopian Rift: Influence of
volcanism, tectonics, and climatic forcing on basin formation and sedimentation, Palaeogeography, Palaeoclimatology, Palaeoecology 150, 135-177
G. M. DI Paola (1972) Geology of the Corbetti Caldera Area (Main Ethiopian Rift Valley) P. Mohr et al. (1980) Quaternary Volcanism and Faulting at O’ A Caldera, Central Ethiopian Rift, Bull.
Volcanol, 43-1, 173-188 Elias Altaye et al.(1986) A Review Geological and Geophysical Exploration of Corbetti Geothermal
Project, Ethiopia, 8th NZ Geothermal Workshop, 205-210 Giday Woldegabriel et al. (1990) Geology, geochronology, and rift basin development in the central
sector of the Main Ethiopia Rift, Geological Society of America Bulletin 102, 439-458 Giday Woldegabriel et al. (2000) Volcanism, tectonism, sedimentation, and the paleoanthropological
record in the Ethiopian Rift System, Geological Society of America special paper 345, 83-98 Bridget R et al. (2006) Global synthesis of groundwater recharge in semiarid and arid regions,
Hydrological processes 20, 3335-3370 W.M. Edmunds (2010) Conceptual models for recharge sequences in arid and semi-arid regions using
isotopic and geochemical methods, Cambridge University Press Halcrow Group Limited and Generation Integrated Rural Development Consultants (2008) Rift Valley
Lakes Basin Integrated Resources Development Master Plan Study Project, MoWR
a.2 Existing well data
The collected existing well data are: i) Ethiopia National Groundwater Information System (hereafter referred to as “ENGWIS”) inventories managed by Ministry of Water, Irrigation and Electricity (hereafter referred to as “MoWIE”); ii) Well records mentioned in existing reports, and iii) Well drilling records including well columnar sections and pumping test records.
The total data extracted from those files are 1,524 points. However, items included in the data are not filled out, and some coordinates of wells are missing in the inventory. Therefore, excluding data that has no coordinates, the total number of considered point well sources is 1,365. In the Study area, 763 new points of data have been included in the ENGWIS inventory; however the items regarding the groundwater data have not been filled out. From now, the C/P of MoWIE needs to fill in the ENGWIS inventory.
The number of basic data in groundwater has been arranged in the Table 2.2.17 below.

The Project for Groundwater Resources Assessment JICA in the Middle Awash River Basin, Final Report (Main Report) KOKUSAI KOGYO CO., LTD.
2-53
Table 2.2.17: Number of Data by Parameter in Well Database (with coordinates)
Parameter Number of information
Static Water Level (SWL) 339
Dynamic Water Level (DWL) or Draw down (m)
154
Yield 305
Transmissivity(T) 55
Specific Capacity(Sc) 150
Water Quality Data 128
Geological Columnar Section 87
Source: the Project Team, Data: reference①, ②
The location map of the existing wells for the well inventory in each Study area is shown in Figure 2.2.43. The yield data of each existing well is also shown in Figure 2.2.44.
The relationship between well depth and yield is shown in Figure 2.2.45 in West Hararge Zone and Figure 2.2.46 in East Shew zone and Amhara Region respectively.
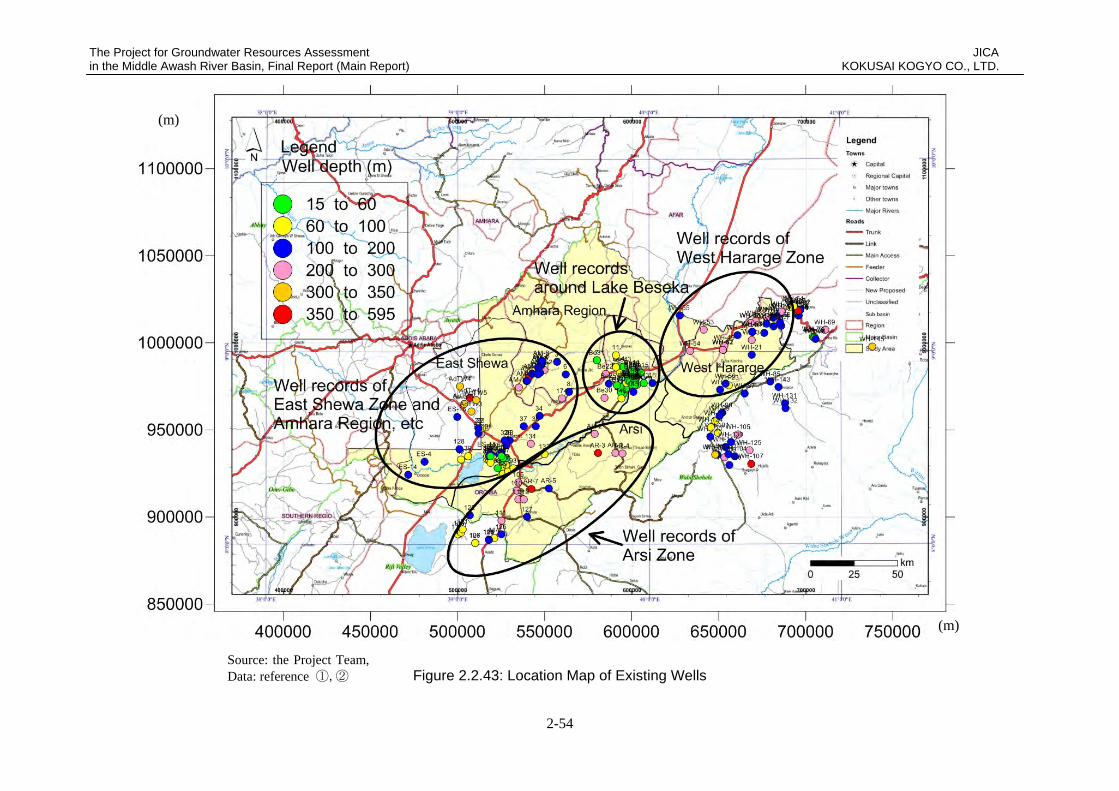
The Project for Groundwater Resources Assessment JICA in the Middle Awash River Basin, Final Report (Main Report) KOKUSAI KOGYO CO., LTD.
2-54
Figure 2.2.43: Location Map of Existing Wells
(m)
(m)
Source: the Project Team, Data: reference ①,②
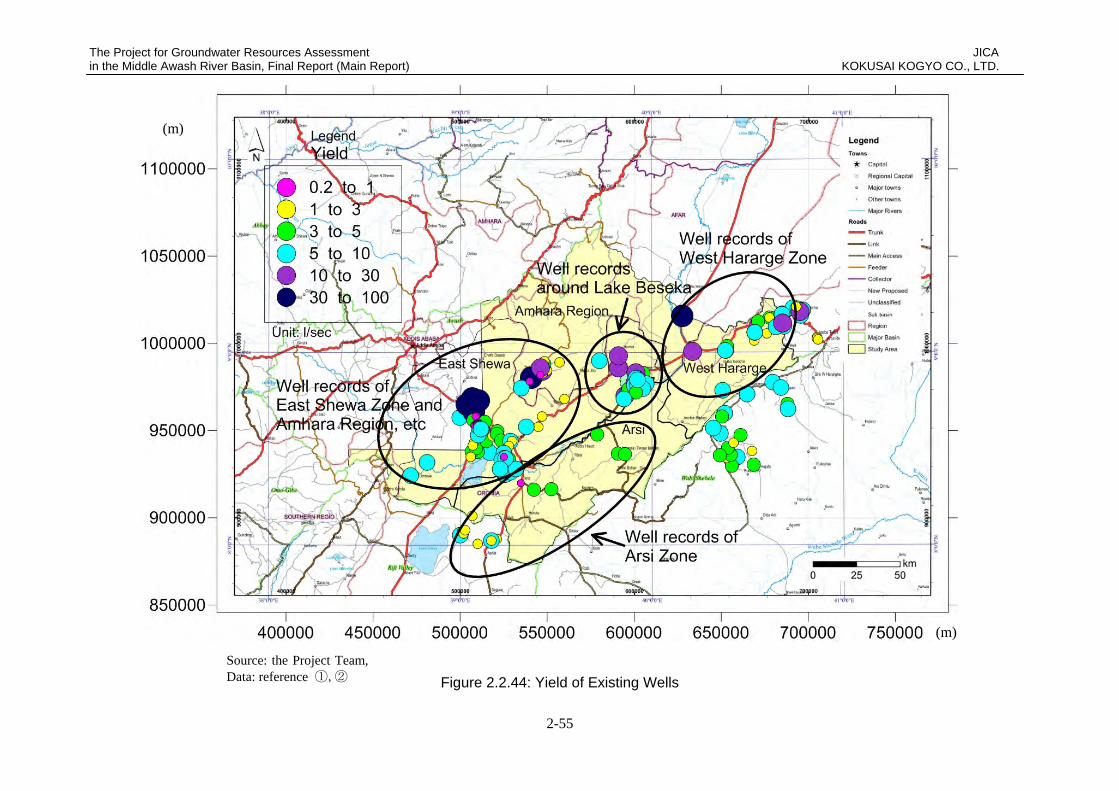
The Project for Groundwater Resources Assessment JICA in the Middle Awash River Basin, Final Report (Main Report) KOKUSAI KOGYO CO., LTD.
2-55
Figure 2.2.44: Yield of Existing Wells
(m)
(m)
Source: the Project Team, Data: reference ①,②

The Project for Groundwater Resources Assessment JICA in the Middle Awash River Basin, Final Report (Main Report) KOKUSAI KOGYO CO., LTD.
2-56
Source: the Project Team, Data: reference 1) of ②
Figure 2.2.45: Yield and Drilling Depth in West Hararge Zone
Source: the Project Team, Data: reference 1) of ① and 3), 4) of ②
Figure 2.2.46: Yield and Drilling Depth in East Shewa Zone, Amhara Region and Others

The Project for Groundwater Resources Assessment JICA in the Middle Awash River Basin, Final Report (Main Report) KOKUSAI KOGYO CO., LTD.
2-57
b. Aquifer by existing well
The columnar sections were described based on the lithological data of existing wells. The sample of columnar section includes the screen position and static water level. The existing columnar sections were utilized by themselves. The layers were assumed to be aquifers (depth of screens, grey bars next to column) and their assumed composition ratios and geological units are shown in Table 2.2.18. The results between those columnar sections and the geological map and the results of drilling data on JICA wells were all taken into account.
Table 2.2.18: Aquifer Lithology and Composition Ratio of Existing Wells
ID Lithology Main description in lithology
No. Composition ratio
Main geological units (existing data)
1 Basalt Trachytic basalt, Vesicular basalt, Highly weathered and fractured basalt, Massive basalt, Scoriacious basalt
40 29
Miocene Basalts (Anchar, Alaji basalts), Bofa basalts. Pleistocene basalts, Holocene basalts
2 Scoria Black scoria, Fine gravel with sand
9 7 Distribute with basalt
3 Ignimbrite Weathered ignimbrite, Fresh ignimbrite, Massive ignimbrite, Boulder ignimbrite
26
19 Nazret pyroclastic deposits, Pliocene rhyolits, Dino ignimbrite.
4 Rhyolite Highly fractured rhyolite, Weathered rhyolite
6 4 Debre Birhan ignimbrite and Huse Ridge rhyorites, Dino ignimbrite
5 Tuff Tuff, Indurated tuff, Unwelded tuff, Pumiceous tuff
9 7 Nazret pyroclastic deposits, Dino ignimbrite
6 Phonolite Fractured phonolite, 4 3 Nazret pyroclastic deposits, Anchar basalts.
7 Welded tuff Welded tuff 8 6 Kone ignimbrite, Fentale ignimbrite,
8 Pumice Moderately weathered pumice
7 5 Nazret pyroclastic deposits, Chefe Donsa pyroclastic deposits.
9 Ash Ash, Volcanic ash 10 7 Nazret pyroclastic deposits, Chefe Donsa pyroclastic deposits.
10 Pyroclastics Highly weathered Pyroclastics, Pumicious pyroclastics, Volcanic
4 3 Nazret pyroclastic deposits
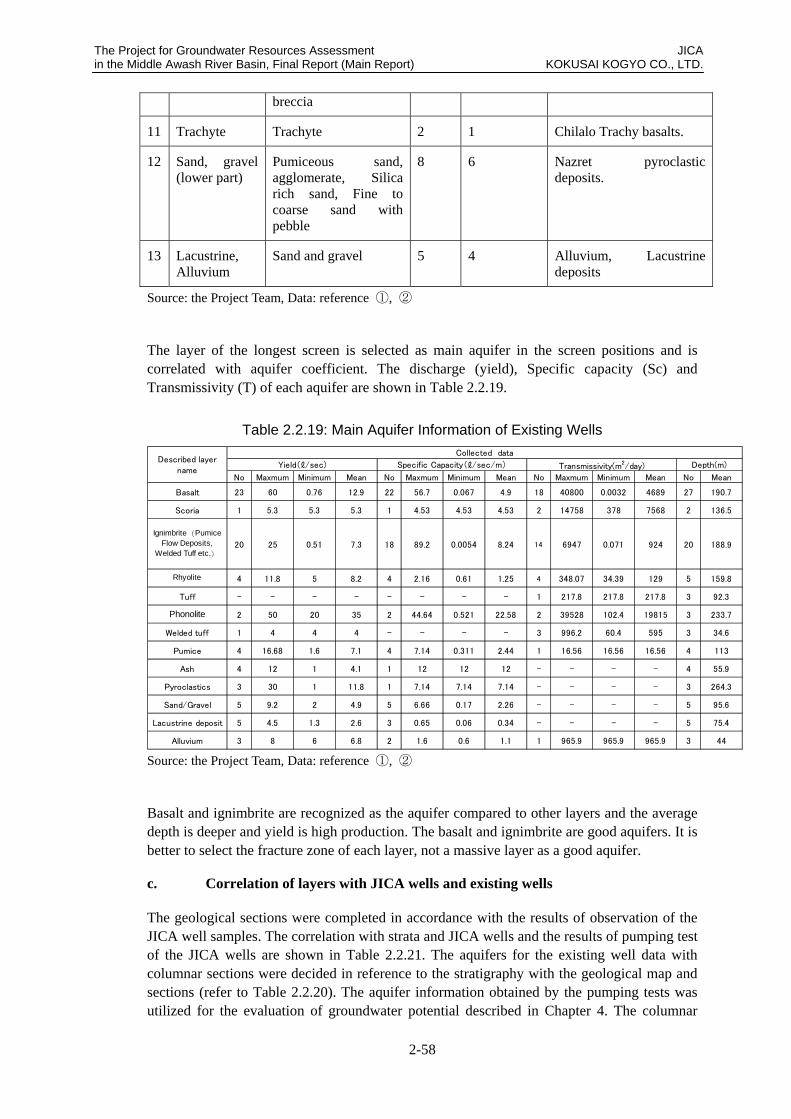
The Project for Groundwater Resources Assessment JICA in the Middle Awash River Basin, Final Report (Main Report) KOKUSAI KOGYO CO., LTD.
2-58
breccia
11 Trachyte Trachyte 2 1 Chilalo Trachy basalts.
12 Sand, gravel (lower part)
Pumiceous sand, agglomerate, Silica rich sand, Fine to coarse sand with pebble
8 6 Nazret pyroclastic deposits.
13 Lacustrine, Alluvium
Sand and gravel 5 4 Alluvium, Lacustrine deposits
Source: the Project Team, Data: reference ①, ②
The layer of the longest screen is selected as main aquifer in the screen positions and is correlated with aquifer coefficient. The discharge (yield), Specific capacity (Sc) and Transmissivity (T) of each aquifer are shown in Table 2.2.19.
Table 2.2.19: Main Aquifer Information of Existing Wells
No Maxmum Minimum Mean No Maxmum Minimum Mean No Maxmum Minimum Mean No Mean
Basalt 23 60 0.76 12.9 22 56.7 0.067 4.9 18 40800 0.0032 4689 27 190.7
Scoria 1 5.3 5.3 5.3 1 4.53 4.53 4.53 2 14758 378 7568 2 136.5
Ignimbrite(PumiceFlow Deposits,
Welded Tuff etc.)20 25 0.51 7.3 18 89.2 0.0054 8.24 14 6947 0.071 924 20 188.9
Rhyolite 4 11.8 5 8.2 4 2.16 0.61 1.25 4 348.07 34.39 129 5 159.8
Tuff - - - - - - - - 1 217.8 217.8 217.8 3 92.3
Phonolite 2 50 20 35 2 44.64 0.521 22.58 2 39528 102.4 19815 3 233.7
Welded tuff 1 4 4 4 - - - - 3 996.2 60.4 595 3 34.6
Pumice 4 16.68 1.6 7.1 4 7.14 0.311 2.44 1 16.56 16.56 16.56 4 113
Ash 4 12 1 4.1 1 12 12 12 - - - - 4 55.9
Pyroclastics 3 30 1 11.8 1 7.14 7.14 7.14 - - - - 3 264.3
Sand/Gravel 5 9.2 2 4.9 5 6.66 0.17 2.26 - - - - 5 95.6
Lacustrine deposit 5 4.5 1.3 2.6 3 0.65 0.06 0.34 - - - - 5 75.4
Alluvium 3 8 6 6.8 2 1.6 0.6 1.1 1 965.9 965.9 965.9 3 44
Described layername
Yield(ℓ/sec) Specific Capacity(ℓ/sec/m)
Collected data
Depth(m)Transmissivity(m2/day)
Source: the Project Team, Data: reference ①, ②
Basalt and ignimbrite are recognized as the aquifer compared to other layers and the average depth is deeper and yield is high production. The basalt and ignimbrite are good aquifers. It is better to select the fracture zone of each layer, not a massive layer as a good aquifer.
c. Correlation of layers with JICA wells and existing wells
The geological sections were completed in accordance with the results of observation of the JICA well samples. The correlation with strata and JICA wells and the results of pumping test of the JICA wells are shown in Table 2.2.21. The aquifers for the existing well data with columnar sections were decided in reference to the stratigraphy with the geological map and sections (refer to Table 2.2.20). The aquifer information obtained by the pumping tests was utilized for the evaluation of groundwater potential described in Chapter 4. The columnar

The Project for Groundwater Resources Assessment JICA in the Middle Awash River Basin, Final Report (Main Report) KOKUSAI KOGYO CO., LTD.
2-59
sections of the existing wells will be attached in the data book of the final report.
Table 2.2.20: Existing and JICA Wells Correlated with Strata
sand, clay, gravel, lucstrin
Be-12, NZ-136, NZ-137(and aboveAl), NZ-21, NZ-22, NZ-23, NZ-31,
NZ-40,NZ-149, NZ-150, NZ-152(and above Luc)
Around Lake Beseka, Lake Koka mainly
rhyolitic domes with obsidian lava flows -From Adama to Bofa and Kone to aroundFentale volcano mainly
glassy basalt & aphyric basalt and scoriacone -
From Adama to Furuta and Bofa, and fromaround Lake Koka to Kone caldera and aroundFentale volcano
pare green strongly welded tuff withfiamme
Be-15, NZ-14, Be-40, Be-43, Be-52 Around and the west area of Fentale volcano
Rhyolite, Trachyte, tuff & agglomerate - Around Fentale volcano
pumice fall - From around Mojo to around Fentale volcano
greenish consolidated to welded fine tuff NZ-7, Be-47From around Kone caldera via Fentale volcanoto Asebe Teferi area
aphyric basalt and scoria cone NZ-10, NZ-120, NZ-140, NZ-142,Be-48
All area of the Study area
tuff ring, maar deposits - Koeko-Kone-Fentale and around Mojo
Trachyte - Around Mt. Zikwale山
Pumice and tuff with intercalated withpoorly welded tuff
ES-18, ES-19, ES-20, NZ-118, NZ-119
All area except around Debre-Brihan of northarea of the Study area
rhyolite ES-4, ES-14, NZ-121 From around Lake Koka to Fentale volcano area
Greenish grey welded tuff with fiamme WH-8, WH-12, WH-22, AR-2, ES-3,NZ-114
All area except around Debre-Brihan of northarea of the Study area
aphyric basaltWH-51, AR-1, AWBH-3, AWBH-
4N, AWBB-5All area except around Debre-Brihan of northarea of the Study area
Trachytes and Trachybasalts - Only Adama-Furuta-Bofa area
light to dark grey welded tuff with fiamme ES-15, ES-16, AM-1, AM-2, AM-3,AdTW5, NZ-39
From Mojo to Lake Koka and north area of theStudy area
pumice and tuff WH-26, WH-52 All area except Koeke-Kone-Fentale areas
rhyolite with pumiceous tuff -All area except around Debre-Brihan of northarea of the Study area
aphyric basalt WH-1, WH-24, WH-54, AM-6,AdTW1
From around Mojo to north area of the Studyarea and east area of Awash area
upper conglomerate, tuff. sand,alternation
& greenish compacted to welded fine tuff-
From around Mojo to north area of the Studyarea and south area of Adama
white- bluish gray ryolite and tuff -East area from around Awash and NE-SWdirection around Huge Ridge
plagioclase aphyric basalt
WH-6, WH-7, AR-4, AR-5, AR-6,AM-12, AdTW2, AdTW3, NZ-9,AWBH-1, AWBH-2, AWBH-6,
AWBH-9, AWBH-11, AWBH-12
All area except around Lake Koka
Upper Nazret pyroclastic deposits(Ti3)
Lower Nazret pyroclastic deposits(Ti2)
Debre Birhan ignimbrite(Ti1)
Huse Ridge rhyolites(Tr1)
Age Stratigraphy
Cain
ozoi
c
Qua
rter
nary
Holo
cene
Litholigy Correlated existing and JICA wells Distribution
Alluvium & Lacustrine deposits(Qal)
Recent rhyolitic dome & lava flows(Qr2)
Holocene basalts(Qb2)
Plei
stoc
ene
Fentale ignimbrite(Qi3)
Fentale volcanic rocks(Qf)
Boseti - Kone pumice fall(Qp2)
Kone ignimbrite(Qi2)
Pleistocene basalts(Qb1)
Sobebor volcanic sand(Qs)
Zikwala trachytes(Zt)
Chefe Donsa pyroclastic deposits(Qp1)
Pleistocene rhyolites(Qr1)
Dino ignimbrite(Qi1)
Tert
iary
Plio
cene
Bofa basalts(Tb3)
Chilalo Trachy basalts(Tt)
Alaji basalts(Tb1)
Pliocene rhyolites(Tr2)
Mio
cene
Anchar basalts(Tb2)
Source: the Project Team, Data: reference ①の 1), 4), ② and 3) of ③

The Project for Groundwater Resources Assessment JICA in the Middle Awash River Basin, Final Report (Main Report) KOKUSAI KOGYO CO., LTD.
2-60
Table 2.2.21: Strata Observed in JICA Wells and Results of Pumping Tests
Elevation Depth Yield SWL DWL Sc T S
(m) (m) (L/sec) (m) (m) (L/sec/m) (m2/min)
AW BH-1 SB5-L Arerti Kersha 542642 985361 1760 228 Ti3, Tb1 12.09 13.86 58.06 0.27 0.0819 0.03108
AW BH-2 SB-BSK-W Arerti Melka Jilo 567414 980822 1151 250 Tb1 6.25 174.79 174.92 48.00 0.0083 6.63*10-3
AW BH-3 SB-BSK Metehara Tututa 589167 982682 1032 204 Tb3 6.30 68.56 68.56 - - -
AW BH-4N SB-BSK Metehara Tututa 587754 977437 1044 117 Tb3 11.12 87.91 89.10 9.34 1.1676 1.167*10-7
AW BH-5 SB-BSK Metehara Gelecha 601565 980024 959 140 Tb3 7.60 2.90 54.73 0.15 0.0034 1.61*10-4
AW BH-6 SB-BSK-W Welenchi Feto 552789 958778 1357 247 Tb3, Tb1 6.25 175.46 176.57 5.63 0.0166 6.63*10-9
AW BH-7 SB4-R Merti Abo Mesa 586813 949687 1239 250 - - - - - - -
AW BH-8 SB4-R Metehara Fateledi 615265 966369 1221 208 - - - - - - -
AW BH-9 SB3-L Welenchi Araso Bero 555025 936983 1424 272 Tb1 3.50 139.92 174.57 0.10 0.0037 7.41*10-4
AW BH-11 SB3-R Sire Gesala Chacha 553313 916009 1810 227 Ti2, Tb1 10.19 69.86 79.66 1.04 0.7281 1.61*10-4
AW BH-12 SB5-L Shola Sekoru 550405 1027427 2858 220 Tb1 5.00 163.71 165.89 2.29 0.1303 1.06*10-6
Pleistocenebasalts(Qb1)
Pliocenerhyolites
(Tr2)
Ancharbasalts(Tb2)
DebreBirhan
ignimbrite(Ti1)
Huse Ridgerhyolites
(Tr1)
Alaji basalts(Tb1)
Sobeborvolcanic
sand(Qs)
UpperNazret
pyroclasticdeposits
(Ti3)
Lower Nazretpyroclasticdeposits
(Ti2)
Alluvium &lacustrinedeposits
(Qal)
Recentrhyoliticdome &
lava flows(Qr2)
Holocenebasalt(Qb2)
Zikwalatrachytes
(Zt)
ChefeDonsa
pyroclasticdeposits
(Qp1)
Pleistocenerhyolites
(Qr1)
Dinoignimbrite
(Qi1)
Bofabasalts(Tb3)
ChilaloTrachybasalts
(Tt)
Fentaleignimbrite
(Qi3)
Fentalevolcanic
rocks(Qf)
Boseti -Kone
pumice fall(Qp2)
Koneignimbrite
(Qi2)
Aquifer
Ti3, Tb2, Ti1, Tb1
Qi3, Qp1, Qi1, Tb3, Tb1
Qb1, Qi1, Tb3
Ti1, Tb1
Qi3, Qi1, Tb3
Qb1, Qi1, Tb3, Ti3, Tb1
Qi1, Tb3, Tb1
Qr2
Qi1, Tb3, Ti2, Tb1
Qp1, Qi1, Ti2, Tb1
Qb1, Qi1, Tb3
Northings Strata NameWell ID Sub Basin Woreda Kebele Eastings
Source: the Project Team, Data: reference 3)of ③
The Project for Groundwater Resources Assessment JICA in the Middle Awash River Basin, Final Report (Main Report) KOKUSAI KOGYO CO., LTD.
2-61
Reference materials
① Main well records mentioned in existing reports: 1) Hydrogeology (map) of the Nazret, EIGS, 1985 2) Evaluation of water resources of the Ada’a and Becho plans groundwater basin for
irrigation development project, WWDSE, planned by MoWR, 2009 3) Allaidege plain groundwater resources assessment project, WWDSE planned by
MoWR, 2009 4) Study and design of Lake Besaka level rise project Ⅱ, WWDSE, planned by MoWE,
2011 5) Growing lake with growing problems: integrated hydrogeological investigation on
Lake Beseka, Ethiopia, ELENI AYALEW BELAY, 2009 6) Assessment and evaluation of causes for Beseka Lake level rise and design
mitigation measures PartⅡ: Study for medium and long term solutions (Main report final), MoWIE and OWWDSE, 2014
7) Groundwater origin and flow along selected transects in Ethiopian rift volcanic aquifers, Seifu Kebede et all, 2008
② Well drilling records including well columnar section and pumping test record: 1) Existing well data including columnar section and pumping test record in West
Hararge Zone 2) Existing well data including columnar section and pumping test record in Arsi
Zone. 3) Existing well data including columnar section and pumping test record in East
Shewa Zone 4) Well completion reports and well data in Arerti(Amhara Region)woreda, Lomme
(Oromia Region)woreda 5) WWDSE, 2014 Irrigation data(Well depth 595m)
③ Others references
1) Editing: Japanese Association of Groundwater Hydrology, Science for brand-name spring water, 1994
2) Hydrogeological map of Ethiopia (1:2,000,000) compiled by Tesfaye Chernet and the Regional Geology Department, EIGS, 1988
3) Data (including photo on site) from field survey and interview, etc by the Project Team

The Project for Groundwater Resources Assessment JICA in the Middle Awash River Basin, Final Report (Main Report) KOKUSAI KOGYO CO., LTD.
2-62
2.3 Socio-economic conditions
2.3.1 Development plan and related laws
a. National level (Federal Democratic Republic of Ethiopia)
The discussions on a development strategy regarding poverty reduction in Ethiopia were commenced in the year 1999. The countermeasure programs and plans against water shortage shown below are developed.
The objectives and development chart about these plans and policies shown above are indicated on Figure 2.3.1.
Source: the Project Team, Data: Result of survey in this Project
Figure 2.3.1: Related Chart of Ethiopian Water Sector Policies and Plan
2.3.2 Socio-economic conditions in the Middle Awash River Basin
a. Population and demographic characteristics
The population of Ethiopia reaches 86 million in the years 2012 and 2013 (population growth rate: approx. 2.7%), and the population number is on a continuing upward trend every year. This number shows that more than 32 million people are living in Oromia Region. The area in Oromia Region is the largest region in Ethiopia as shown in Table 2.3.1. The statistics in 2007 shows the population around 6.5 million in the Middle Awash River Basin (in which around 2.7 million is from Addis Ababa). However, the ratio between male and female is balanced in both city and rural area.
Table 2.3.1: Population Census Data of each Ethiopian Regional State in 1994, in 2007, and in 2013
Region Population
(1994) Population
(2007) Population (2013)*1)
Area (km2) Remarks
Addis Ababa 2,112,737 2,739,551 3,104,000 527 City Afar Region 1,106,383 1,390,273 1,650,000 72,053 Regional Capital: Asayita Amhara Region 13,834,297 17,221,976 19,212,000 154,709 Regional Capital:Bahir Dar
<Objectives on Mid-long term> ・Sustainable Development and Poverty Reduction Program (SDPRP)
Planning of Development Objectives
・Plan for Accelerated and Sustained Development to End Poverty (PASDEP) (Contribution to achievement of the MDGs)
<Sectoral Development Plan> ・Water Sector Development Program (WSDP), etc. <Sectoral complementary plan to the target> ・One WASH National Program (OWNP), etc.
<Action Plan> ・Universal Access Program (UAP2) ・Ethiopian Groundwater Resources Assessment Program (EGRAP+) etc.

The Project for Groundwater Resources Assessment JICA in the Middle Awash River Basin, Final Report (Main Report) KOKUSAI KOGYO CO., LTD.
2-63
Region Population
(1994) Population
(2007) Population (2013)*1)
Area (km2) Remarks
Benishangul-Gumuz Region
460,459 784,345 1,028,000 50,699 Regional Capital: Asosa
Dire Dawa 251,864 341,834 395,000 1,559 City Gambela Region 181,862 307,096 406,000 29,783 Regional Capital: GambelaHarar 131,139 183,415 215,000 334 City Oromia Region 18,732,525 26,993,933*2) 32,220,000 284,538 Regional Capital: Adama Somali Region 3,152,704 4,445,219 5,318,000 279,252 Regional Capital: Jijiga Tigray Region 3,136,267 4,316,988 5,062,000 84,722 Regional Capital: Mek’ele SNNPRs 10,377,028 14,929,548 17,887,000 105,476 Regional Capital: Awasa Total 53,477,265 73,750,932 86,614,000 1,063,652 Source: Central Statistical Agency( CSA), Britannica Book of the Year (1999) *1) The data in 2013 is quick estimation value with bulletin. *2) The breakdown of this value is 3,317460 (Male 1,679,153 Female1, 638,307) in urban area, and
23,676,473 (Male 11,915,853 Female 11,760,620) in rural area. a.1 Ethnic groups
Ratio of ethnic groups in Oromia Region is Oromo people (around 88%), Amhara (around 7%) Gurage (around 1%) and others (4%).
a.2 Religion
The Muslim is the largest religion (around 48 %) in Oromia Region followed by Ethiopian orthodox (around 30%) and y protestant (around 18%) and others (around 4%).
a.3 Language
In Oromia Region, the local people mainly speak Oromiffa language (around 84%) though there are some people speak Amhara language(around 11% ) as national common language.
b. Local administrative divisions
Ethiopia is composed of 9 regional government and 2 administrative cities except Addis Ababa. Each region is composed of many zones. Each zone is composed of many woredas. Each woreda is composed of several towns and regional kebeles.
Oromia region is divided into 18 zones, as is shown in Table 2.3.2. And the target towns of this project are in East Shewa zone, Arsi zone, and West Hararge zone.
Table 2.3.2: 18 Zones in Oromia Region
Zones in Oromia Region East Shewa Arsi Qelam Illibabur Jimma North Shewa West Arsi Horo Guduru West Hararge Burayu Special
zone surrounding A.A.
West Shewa Borena East Wallega East Hararge
South-west Shewa Guji West Wallega Bale Source: the Project Team, Data: Result of survey in this Project The majority of Project C/Ps belong to the Ministry of Water, Irrigation, and Electricity, and Oromia regional Water, Mines and Energy Bureau. The structure of these organizations is described below.

The Project for Groundwater Resources Assessment JICA in the Middle Awash River Basin, Final Report (Main Report) KOKUSAI KOGYO CO., LTD.
2-64
b.1 Ministry of Water, Irrigation and Electricity (MoWIE)
MoWIE started from 2013 September. It had been called as MoWE for 3 years from September 2010 to August 2013. The irrigation department was added at the time of this name change. In addition, the Energy department was changed to the Electricity department because of the organizational reformation of the Ethiopian government, which was conducted in October 2015. The organization structure of MoWIE is shown in Figure 2.3.2. The main C/P belongs to Groundwater Directorate.
Source: MoWIE
Figure 2.3.2: Organization Structure of the Relevant Department in MoWIE
b.2 Oromia regional Water, Mines, and Energy Bureau (OWMEB)
In Oromia region, the department of water supply works includes Oromia regional Water, Mines and Energy Bureau. The organization structure is shown in Figure 2.3.3. OWMEB consists of three core processes, which are: mines and energy, water supply and sanitation, and communications.. This new structure was implemented in September 2013. The water supply and sanitation department is further divided into 7 units. The main C/P belongs to water resources management department.
Water Use Permit and Administration Directorate
Public Relation &
Communication Directorate
Service
Provision
Directorate
Change Management Directorate
Research &
Development
Directorate
GeoInformation
& Information
Tech
Directorate
Procurement
Finance &
Property Admin
Directorate
Sector
Support
Coordination
Directorate
Sector
Support
Coordination
Directorate
HIV/AIDS Prevention & Controlling
Office
Human Resources
Management Directorate
Environmental
Impact Assessment
& Social
DevelopmentOffice
Water Works Construction Enterprise Ethiopian Electric Power Corporation
Awash Basin Authority Water Development Fund Office
National Petroleum Reserve Deposit Administration
National Metrology Agency
Ethiopian Energy Agency
Abay Basin Authority
State Minister for Electricity State Minister for Water State Minister for Irrigation
MoWIEMinistry of Water, Irrigation and Electricity
BasinAdministrationDirectorate
Water Supply Sanitation Directorate
Hydrology andWater QualityDirectorate
Water Use Permitand Administration
Directorate
Irrigation and Drainage
Directorate
GroundwaterDirectorate

The Project for Groundwater Resources Assessment JICA in the Middle Awash River Basin, Final Report (Main Report) KOKUSAI KOGYO CO., LTD.
2-65
OWMEBOromia Water Mineral and Energy Bureau
Deputy Head for Administaration(1)
(Communication Core Process)
Deputy Head for Mineral & Energy(1)
(Mines & Energy Core Process)
Bureau Head (1)
Deputy Head for Water Supply (1)(Water Supply & Sanitation
Core Process)
Water Supply FacilityManagement Process
Department (23)
ContractAdministaration &
Supervision ProcessDepartment (16)
CommunityManagement &Stakeholders
Department (6)
Procurement &Finance
Department (4)
Human ResourceDepartment (4)
Study & DesignProcess
Department (14)
Water ResourceManagement
Department (8)
Oromia Water WorksDesign and Supervision
Enterprise
Oromia Water WorksConstructionEnterprise
Source: OWMEB *Note: Some values in brackets are the number of staffs.
Figure 2.3.3: Organization Structure of the Relevant Departments in OWMEB
c. Regional economy
Oromia region is the largest region in the country, and agriculture is the basic industry after Addis Ababa. In 2012, 80% of regional population was engaged in agriculture, and agriculture contribution reaches 42% of total regional GDP.
More than 80 % of the male population is engaged in agriculture. The female population is engaged in other industries except agriculture.
In Oromia Region, there are not only agriculture resources but also tourism resource such as Awash National Park and Sodere hot springs, and water resource such as Awash River and Rift Valley lakes.
c.1 Agriculture
The main crops of agriculture production in Oromia Region are cereals. The other grains such as pulses and oilseeds are relatively little. The agriculture products in large quantities are sugarcane, coffee, potatoes, khat (preference crops) and cut flowers. In the middle of Awash River Basin, the national farms in large scale for sugarcane lie in Wonji/Wonji Shewa and Metehara. In case of livestock, main animals are cattle, sheep, goats, and poultry chickens.
c.2 Condition of social infrastructure (road, electricity, etc.)
c.2.1 Road condition
Improvement of infrastructure to develop rural area economy is very important. The current infrastructure in the Middle Awash River Basin is described below.

The Project for Groundwater Resources Assessment JICA in the Middle Awash River Basin, Final Report (Main Report) KOKUSAI KOGYO CO., LTD.
2-66
Table 2.3.3: Characteristics of Legend between the Target Towns (for Access Route Map)
Type Item Characteristics
Asphalt Road It is the most comfortable road to travel on. It is possible to travel at speeds of 50~80km/hr.
Non-asphalt road 1 Although it is non-asphalt road, the road surface is kept flat with heavy machineries. It is comfortably travelable all year. It is possible to travel at speeds of 30~50km/hr.
Non-asphalt road 2 It is non-asphalt road, and it is assumed that long time passed since its last road maintenance. The road surface is bumpy and it takes a long time to transit. It is possible to travel at speeds of 15~30km/hr.
Non-asphalt road 3 There would be considerable difficulty in passing this type of non-asphalt road. The road surface is very bumpy and there are many large and small stones on the road. Besides, the road is very steep. It is possible to travel at speeds of 10~15km/hr, however, it is not passable in the rainy season.
Source: the Project Team, Data: Result of survey in this Project

The Project for Groundwater Resources Assessment JICA in the Middle Awash River Basin, Final Report (Main Report) KOKUSAI KOGYO CO., LTD.
2-67
Addis Hiwot
Metehara Suger
Factory
Asela
Mojo
Sendafa
Bishoftu
Chiro
Dera
Awash
Melkasa
IteyaHuruta
DoniAbomsa
To Mechara
To Mechara
Wachu
Cheleleka
DinDinhu
Koshimhu
Bedesa
Komona
To Awasa
Arboyee
GolegotaBole
Sire
Bolo
Geldiya
Bofa
Arbe Gebeya
Wonji Shewa
Adulala
BedeyiBiyo
Chefe Donsa
Areda
Hardim
Kora
Mieso
Aneno
Belo
(Sirba)hu
Chorora
Gonde
Sodere
Godino
Asebot
To Dire Dawa,
Harar
Hargeti
Kenteri
Metehara
Awash
To Amibara,
Djibouti
To Debre Birhan
Bube
Bordede
Aseko
Arba Rekete
Gelemso
Asphalt Road
Non-asphalt Road 1
Non-asphalt Road 2
Non-asphalt Road 3
Target town
Woreda main(or Zonal) town
Dire
Bekejo
Welenchiti
Adama
Ude
Dhankaka
Kamise
Express Highway
Source: the Project Team, Data: Google Earth
Figure 2.3.4: Location and Access Road for 30 Target Towns in Oromia Region
700000 600000 500000
1000000 900000

The Project for Groundwater Resources Assessment JICA in the Middle Awash River Basin, Final Report (Main Report) KOKUSAI KOGYO CO., LTD.
2-68
c.2.2 Electricity
The electricity of Oromia Region is mainly covered by the supply source of hydroelectric power. The power producer is Ethiopia National Electric Power Corporation. The electric supply sources of the project area in middle Awash River Basin are composed by hydropower, by wind power (over 50 units in Adama), and by thermal power. The electricity is supplied 24 hours in the area which has the electric.
However, the electric supply are still insufficient at major cities such as Adama and Bishoftu which causing a sudden black-outs especially in West Hararge zone.
c.2.3 Railway
Just like the highway construction, train railway construction project is being conducted by loan assistance from the Chinese Government. The construction project is being managed by Both Ethiopian Railway Corporation and China Railway Engineering Corporation. The construction period of each phase is as shown in Table 2.3.4.
Table 2.3.4: Construction Period and Route for Ethiopia-China Railway Project from Addis Ababa to Djibouti
Period Route (Phase 1) The EFY 2012 – 2015 Addis Ababa – Adama (Nazret) (Phase 2) The EFY 2013 - 2016 Adama(Nazret) – Awash – Mieso (Phase 3) The EFY 2013 - 2017 Mieso – Dire Dawa – Djibouti
Source: the Project Team, Data: Result of survey in this Project
2.3.3 Socio-economic conditions in the woredas with target small towns
In order to understand the current condition for the Project O&M performance, socio-economy and water supply of every woreda water management bureaus, interview surveys were conducted in 15 woredas for 30 target towns. The woredas are 6 in the East Shewa zone, 6 in the Arsi zone and 3 in West Hararge.
a. Ethnic group
Oromo people, the most common people in Oromia region, is the majority for all Woredas sharing 80% or more in 13 Woredas out of 15. Amhara people is the second majority. They share 30% in Sire Woreda and some 10% in other Woredas. Other than them, some few Guraghe (common in Southern Nations, Nationalities, and Peoples’ Region; SNNPR) and Somali peoples are living. Afar and Tigray peoples can also be seen.
b. Education
The numbers of the schools as education facilities by objective Woredas are shown in Table 2.3.5. Average number of primary schools per Woreda is 41. The number of primary schools however has 18-folds difference among Woredas. There are 74 primary schools in Boset of East Shewa and are 4 only in Guba Qoricha of West Hararge, although the difference in the number of children (age 7-14) is some 2-folds only.

The Project for Groundwater Resources Assessment JICA in the Middle Awash River Basin, Final Report (Main Report) KOKUSAI KOGYO CO., LTD.
2-69
Table 2.3.5: Number of Schools in Woredas
Nursery Primary Secondary PreparatoryAge0-6 Age7-14 Age15-16 Age17-18
1 Adama Zuria 5 18 6 12 Ada 6 36 25 13 Boset 0 74 1 14 Lume 3 65 1 15 Gimbichu 2 49 1 16 Liben Zikuala 0 47 1 07 Sire 1 28 1 18 Jeju 1 28 1 19 Aseko 2 44 3 1
10 Merti 0 33 1 011 Tiyo 6 38 2 112 Lodehetosa 5 47 3 013 Anchar 13 39 4 214 Guba Qoricha 0 4 1 015 Mieso 3 59 2 1
Total 47 609 53 12Average 3 41 4 1
No WoredaZone
East Shewa
Arsi
WestHararge
No. of Schools
Note: School in Ethiopia includes nursery school (as kindergarten), primary school (class1-8), secondary school (class 9-10) and preparatory school (vocational school; class11-12).
Source: the Project Team, Data: Result of socio-economic survey in this Project
The numbers of children and the school attendance are shown in Table 2.3.6.
Table 2.3.6: Numbers of Children and the School Attendance in Woredas
Nursery sc. Primary sc. Secondary &Preparatory
No Zone Woreda Age 0-6 Age 7-14 Age 15-18 Age 0-6 Age 7-14 Age 15-18 unit(%)1 Adama Zuria 34852 34568 12000 2350 32156 3336 93.02 Ada 25649 33621 N.A 564 29720 555 88.43 Boset 33501 44665 22690 0 24479 1907 54.84 Lume 22047 31080 N.A 1800 28101 405 90.45 Gimbichu 24574 21074 N.A 109 18250 0 86.66 Liben Zikuala 18667 18659 12094 0 14344 843 76.97 Sire 17954 18345 7623 102 17504 1649 95.48 Jeju 22413 27736 18811 199 26072 1891 94.09 Aseko 10210 21886 8513 400 10957 1451 48.0
10 Merti 20068 22828 10530 704 10945 955 47.911 Tiyo 12707 27758 11043 333 24123 1319 86.912 Lodehetosa 21130 26575 11884 1049 21871 3440 82.313 Anchar 15655 16789 9581 0 8478 867 50.514 Guba Qoricha 25020 22400 N.A 0 9124 676 40.715 Mieso 29261 35075 13039 202 21283 1254 60.7
Total 279427 345584 124769 7610 267000 18618Average 22247 26871 12528 710 19827 1468 73.1
Ave(E.Shewa) 26548 30611 15595 804 24508 1174 81.7Ave(Arsi) 17414 24188 11401 465 18579 1784 75.8
Ave(W.Hararge) 23312 24755 11310 67 12962 932 50.6
School attendancerate of Age7-14
East Shewa
Arsi
WestHararge
No. of Children No. of School Attendance
Source: the Project Team, Data: Result of socio-economic survey in this Project
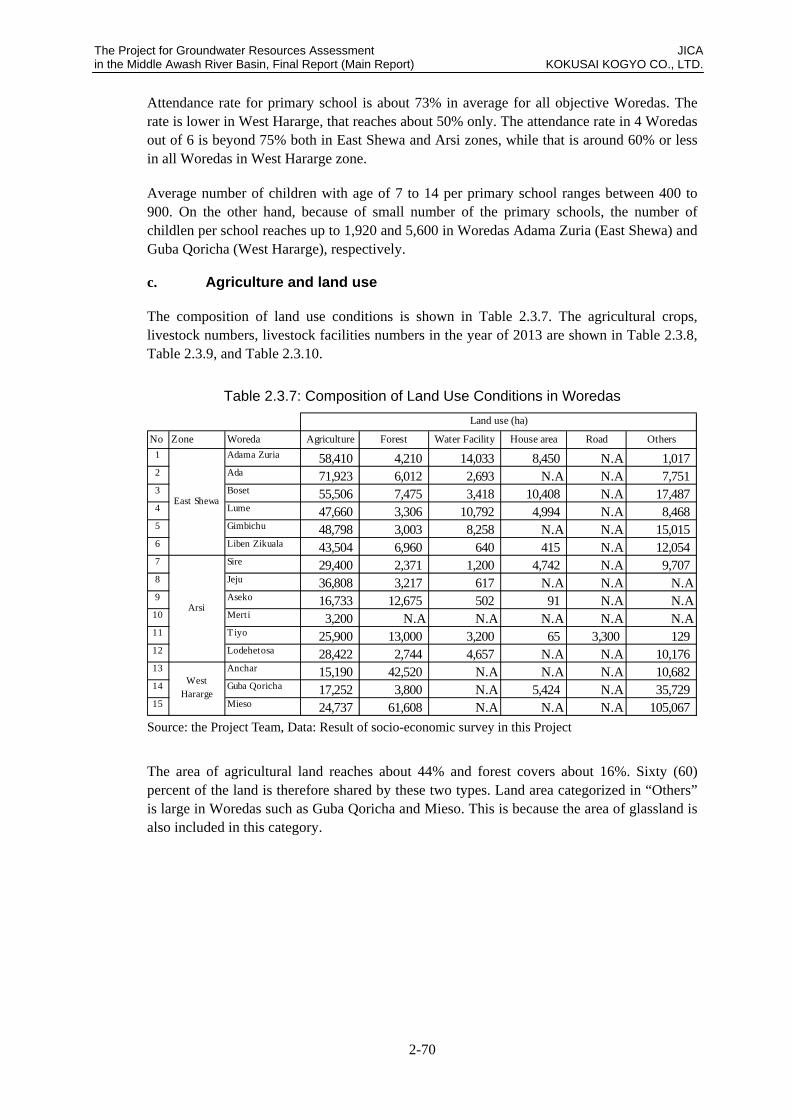
The Project for Groundwater Resources Assessment JICA in the Middle Awash River Basin, Final Report (Main Report) KOKUSAI KOGYO CO., LTD.
2-70
Attendance rate for primary school is about 73% in average for all objective Woredas. The rate is lower in West Hararge, that reaches about 50% only. The attendance rate in 4 Woredas out of 6 is beyond 75% both in East Shewa and Arsi zones, while that is around 60% or less in all Woredas in West Hararge zone.
Average number of children with age of 7 to 14 per primary school ranges between 400 to 900. On the other hand, because of small number of the primary schools, the number of childlen per school reaches up to 1,920 and 5,600 in Woredas Adama Zuria (East Shewa) and Guba Qoricha (West Hararge), respectively.
c. Agriculture and land use
The composition of land use conditions is shown in Table 2.3.7. The agricultural crops, livestock numbers, livestock facilities numbers in the year of 2013 are shown in Table 2.3.8, Table 2.3.9, and Table 2.3.10.
Table 2.3.7: Composition of Land Use Conditions in Woredas
No Zone Woreda Agriculture Forest Water Facility House area Road Others1 Adama Zuria 58,410 4,210 14,033 8,450 N.A 1,0172 Ada 71,923 6,012 2,693 N.A N.A 7,7513 Boset 55,506 7,475 3,418 10,408 N.A 17,4874 Lume 47,660 3,306 10,792 4,994 N.A 8,4685 Gimbichu 48,798 3,003 8,258 N.A N.A 15,0156 Liben Zikuala 43,504 6,960 640 415 N.A 12,0547 Sire 29,400 2,371 1,200 4,742 N.A 9,7078 Jeju 36,808 3,217 617 N.A N.A N.A9 Aseko 16,733 12,675 502 91 N.A N.A
10 Merti 3,200 N.A N.A N.A N.A N.A11 Tiyo 25,900 13,000 3,200 65 3,300 12912 Lodehetosa 28,422 2,744 4,657 N.A N.A 10,17613 Anchar 15,190 42,520 N.A N.A N.A 10,68214 Guba Qoricha 17,252 3,800 N.A 5,424 N.A 35,72915 Mieso 24,737 61,608 N.A N.A N.A 105,067
Land use (ha)
East Shewa
Arsi
WestHararge
Source: the Project Team, Data: Result of socio-economic survey in this Project
The area of agricultural land reaches about 44% and forest covers about 16%. Sixty (60) percent of the land is therefore shared by these two types. Land area categorized in “Others” is large in Woredas such as Guba Qoricha and Mieso. This is because the area of glassland is also included in this category.

The Project for Groundwater Resources Assessment JICA in the Middle Awash River Basin, Final Report (Main Report) KOKUSAI KOGYO CO., LTD.
2-71
Table 2.3.8: Main Crops Yield of Agriculture in 2013 in Woredas
No Zone Woreda Land(ha) Amount(ton) Land(ha) Amount(ton Land(ha) Amount(ton Land(ha) Amount(ton) Land(ha) Amount(ton) Land(ha) Amount(ton)1 Adama Zuria 1,287 5,736 333 1,195 11,548 21,350 3,920 13,015 2,953 10,335 5,321 13,8002 Ada 613 4,960 N.A N.A 26,545 66,993 17,834 118,566 - - 26,087 95,0903 Boset 9,002 14,938 611 166 16,571 40,810 185 177 163 195 25,851 38,1634 Lume 955 2,845 N.A N.A 15,721 37,003 14,438 58,928 1,193 4,067 8,366 65,7755 Gimbichu 209 842 261 628 2,231 4,573 4,047 100,997 336 1,176 14,783 34,2216 Liben Zikuala 7,128 27,415 600 2,104 14,828 33,380 15,080 5,081 981 2,588 4,878 9,8017 Sire 2,200 4,288 80 202 5,780 6,948 10,200 22,745 54,800 72,412 5,690 46,7668 Jeju 2,600 12,117 1,400 4,302 13,800 24,170 N.A N.A N.A N.A 15,907 45,9169 Aseko 1,356 7,954 1,776 9,566 577 837 N.A N.A N.A N.A 29,667 2,402
10 Merti 4,074 17,926 4,365 14,577 5,802 10,001 14,454 32,850 N.A N.A 3,245 96,35011 Tiyo 890 4,048 0 0 12,150 20,920 13,650 31,011 5,400 13,508 4,420 8,90312 Lodehetosa 455 1,674 57 25,660 26,570 42,257 15,754 71,316 9,016 18,390 7,084 38,01913 Anchar 3,780 12,666 N.A N.A 162 255 752 1,718 559 978 4,231 46,17214 Guba Qoricha 0 9,335 N.A 20,615 N.A N.A N.A N.A N.A N.A N.A N.A15 Mieso 3,020 1,371 14,259 12,433 N.A N.A N.A N.A 39 10,237 N.A N.A
Total 37,569 128,115 23,742 91,448 152,285 309,497 110,314 456,404 75,439 133,886 155,530 541,378
EastShewa
Arsi
WestHararge
Field area and Harvest of Main Crops
Maize Sorghum Teff Wheat Barely Others
Source: the Project Team, Data: Result of socio-economic survey in this Project
In terms of main crops, teff and wheat are dominant both in area and yield bases. Teff shares about 27% and wheat shares about 20% in cropping area. The former shares about 19% and the latter shares about 28% in yield amount.
Table 2.3.9: Number of Livestock in Woredas
No Zone Woreda Cattle Goat Sheep Donkey Chicken Horse Mule Camel Other1 Adama Zuria 97,000 49,970 41,700 39,135 17,053 500 411 215 -2 Ada 137,805 633,410 31,033 39,814 N.A 2,431 1,473 N.A -3 Boset 86,616 90,680 45,167 26,253 79,395 812 673 5,477 -4 Lume 91,314 23,101 23,652 21,619 N.A 316 819 N.A -5 Gimbichu 106,115 39,301 44,521 26,493 51,325 5,712 906 15 -6 Liben Zikuala 170,258 51,346 24,138 20,980 N.A 1,598 1,666 N.A -7 Sire 77,206 27,206 65,584 20,709 56,339 4,473 761 4,464 -8 Jeju 130,989 35,951 103,276 16,145 82,034 N.A 1,336 1,369 -9 Aseko 92,038 88,270 95,447 32,853 105,214 N.A N.A 3,354 -
10 Merti 93,371 52,323 26,781 9,200 99,715 N.A N.A 25,210 11,34911 Tiyo 92,711 12,050 63,033 18,356 55,320 8,937 542 N.A -12 Lodehetosa 112,856 33,908 146,492 35,195 121,923 7,952 1,833 N.A -13 Anchar 69,273 118,006 37,610 15,729 7,880 155 100 139 8,21914 Guba Qoricha 67,364 70,298 23,896 17,439 81,605 128 N.A 2,921 -15 Mieso 131,908 12,180 63,112 16 4 39,694 -
Total 1,556,824 1,882,958 1,329,468 352,100 820,915 33,030 10,524 82,858 19,5681,114,276
WestHararge
Arsi
EastShewa
No. of Livestock
Source: the Project Team, Data: Result of socio-economic survey in this Project
Goats (31%), cattle (26%) and sheep (22%) are the dominant livestocks in all Woredas. Chickens share approx. 13% in the numeral basis. Number of camels is larger in Merti (Arsi zone) and Mieso (West Hararge zone).

The Project for Groundwater Resources Assessment JICA in the Middle Awash River Basin, Final Report (Main Report) KOKUSAI KOGYO CO., LTD.
2-72
Table 2.3.10: Number of Agriculture and Livestock-related Facilities
No Zone Woreda LivestockHealth Post
CattleTrough
FarmingTraining Center
Agro-ExtensionHouse
1 Adama Zuria 5 3 7 72 Ada 4 5 4 43 Boset 2 3 3 14 Lume 3 2 5 35 Gimbichu 3 0 2 26 Liben Zikuala 1 0 2 27 Sire 1 0 1 18 Jeju 6 9 20 919 Aseko 5 4 15 12
10 Merti 45 3 17 511 Tiyo 1 0 3 312 Lodehetosa 1 0 3 313 Anchar 8 6 19 13714 Guba Qoricha 4 0 4 215 Mieso 16 132 28 90
East Shewa
Arsi
WestHararge
No.of Agro-pastral facilities
Source: the Project Team, Data: Result of socio-economic survey in this Project
There are no clear pattern in the number of agricultural and livestock-related facilities. The number of livestock health posts are the largest with 45 in Merti Woreda. All facilities are many in Mieso, while few facilities are available in Liben Zikuala and Sire.
d. Health and Hygiene
The reporting numbers of water-related diseases at the health center of every 15 woredas for target towns are shown in Table 2.3.11. And, the types and the number of latrine as hygiene facilities are shown in Table 2.3.12.
Table 2.3.11: Number and Type of Water-related Diseases in Woredas
No Zone Woreda Diarrhea Typhoid Malaria Dysentery Others
1 Adama Zuria 5,627 5,225 3,188 N.A2 Ada 2,042 N.A N.A N.A3 Boset 1,050 N.A 2,790 N.A4 Lume 1,250 870 5,687 N.A5 Gimbichu 379 171 N.A N.A6 Liben Zikuala 2,170 N.A 2,598 N.A7 Sire 450 250 N.A 4508 Jeju 850 223 850 N.A9 Aseko 218 122 212 231
10 Merti 4,086 4,710 4,826 83411 Tiyo N.A 594 N.A 18912 Lodehetosa 730 N.A N.A N.A13 Anchar 1,245 N.A 935 N.A 1,095
(Parasites etc.)14 Guba Qoricha 329 128 241 7215 Mieso 1,563 N.A 583 55
Total 21,989 12,293 21,910 1,831
West Hararge
Arsi
East Shewa
Source: the Project Team, Data: Result of socio-economic survey in this Project

The Project for Groundwater Resources Assessment JICA in the Middle Awash River Basin, Final Report (Main Report) KOKUSAI KOGYO CO., LTD.
2-73
Diarrhea and malaria are the major diseases. Both share about 38% each. Typhoid, which shares about 21%, is also the major disease.
Table 2.3.12: Type and Number of Latrine Facilities in Woredas
No Zone Woreda Simple pit Ventilated pit Flush latrine Compost pit Other1 Adama Zuria 9,675 420 N.A N.A 2332 Ada 8,250 1,500 N.A N.A 15,8503 Boset 5,230 N.A N.A N.A 3,2304 Lume 5,450 N.A N.A N.A -5 Gimbichu 2,358 N.A N.A N.A -6 Liben Zikuala 5,250 N.A N.A N.A -7 Sire 2,580 N.A N.A N.A 8908 Jeju 2,534 17,110 N.A 19,644 -9 Aseko 15,368 13,542 N.A N.A -
10 Merti 16,809 88 54 N.A -11 Tiyo N.A N.A N.A N.A -12 Lodehetosa 3,580 N.A N.A N.A 3,50013 Anchar 9,492 N.A N.A N.A -14 Guba Qoricha 22 N.A N.A N.A -15 Mieso 2,966 N.A N.A N.A -
East Shewa
Arsi
WestHararge
No.and type of Sanitary facilities
Source: the Project Team, Data: Result of socio-economic survey in this Project
Simple pit is dominant in the objective Woredas, while ventilated pit is relatively common in the Woredas such as Jeju and Aseko.


![Alliance Concrete v Sato Kogyo [2014] SGCA 35](https://static.fdocuments.us/doc/165x107/577cc3ed1a28aba71197977f/alliance-concrete-v-sato-kogyo-2014-sgca-35.jpg)
