The Progressive Corporation - AnnualReports.com base their rewards on results and promotion on...
38
The Progressive Corporation 2005 ANNUAL REPORT
Transcript of The Progressive Corporation - AnnualReports.com base their rewards on results and promotion on...

The Progressive Corporation 2005 ANNUAL REPORT

IT HAS BEEN MY OBSERVATIONTHAT MOST PEOPLE GET AHEAD DURING
THE TIME THAT OTHERS WASTE. Henry Ford
progress

.02 Financial Highlights
.05 Vision and Values
.09 Letter to Shareholders
.21 Objectives, Policies and Operations Summary
.29 Consolidated Financial Statements
.38 Safe Harbor Statement
.39 Corporate Information
.40 Directors and Officers
WhyTIME? THE PROGRESSIVE INSURANCE ORGANIZATION began in 1937.Since then, we have worked hard to build a superior propositionfor auto insurance consumers through competitive pricing and bycontinuously improving our products and services. Today, weoffer competitive rates and 24-hour, in-person and online serv-ices to all personal and commercial auto drivers throughout theUnited States. We sell our personal lines products through inde-pendent insurance agencies as Drive® Insurance from Progressive,and over the telephone and on the Internet as Progressive DirectSM.
Progressive’s consumer value proposition, based on Fast, Fair,Better, recognizes that respecting our customers’ time in everytransaction is essential to the definition of superior service. In anincreasingly fast-paced society, efficient time management andcommunication is expected in the services we deliver and it is thebasis for consumers’ evaluation of us.
We understand that the value of Time can be measured and interpreted by many criteria. For that reason, 12 artists have been chosen to visually represent the concept: Carol K.Brown,Beth Campbell, Martí Cormand, Daina Higgins, Joan Linder,Russell Nachman, Shaun O’Dell, Robyn O’Neil, Ben Peterson,Randall Sellers, AndreaWay and David Wetzl. Their work willjoin Progressive’s growing collection of contemporary art.
.01
||||
|
||
||
||
||
||
||
|| | | | |
||
||
||
||
||
||
||
|||

(billions–except per share amounts)
(billions–except shares outstanding and per share amounts)
{Five-Year Financial Highlights }
2005 2004 2003 2002 2001
FOR THE YEAR
Net premiums written $ 14.0 $ 13.4 $ 11.9 $ 9.5 $ 7.3Growth over prior year 5% 12% 26% 30% 17%
Net premiums earned $ 13.8 $ 13.2 $ 11.3 $ 8.9 $ 7.2Growth over prior year 5% 16% 28% 24% 13%
Total revenues $ 14.3 $ 13.8 $ 11.9 $ 9.3 $ 7.5Net income $ 1.39 $ 1.65 $ 1.26 $ .67 $ .41
Underwriting margin 11.9% 14.9% 12.7% 7.6% 4.8%Net income per share 1 $ 6.98 $ 7.63 $ 5.69 $ 2.99 $ 1.83
2005 2004 2003 2002 2001
AT YEAR-END
Common Shares outstanding (millions) 197.3 200.4 216.4 218.0 220.3Book value per share $ 30.96 $ 25.73 $ 23.25 $ 17.28 $ 14.76Consolidated shareholders’ equity $ 6.1 $ 5.2 $ 5.0 $ 3.8 $ 3.3Market capitalization $ 23.0 $ 17.0 $ 18.1 $ 10.8 $ 11.0Return on average shareholders’ equity 25.0% 30.0% 29.1% 19.3% 13.5%Market share2 7.7% 7.5% 7.0% 6.0% 5.1%Industry net premiums written3 $ 158.9 $ 157.3 $ 151.0 $ 139.6 $ 127.9
1-Year 3-Year 5-Year
STOCK PRICE APPRECIATION4
Progressive 37.9% 33.2% 27.8%S&P500 4.9% 14.4% .6%
1Presented on a diluted basis. 2Represents Progressive’s Personal Lines Businesses as a percent of the U.S. personal auto insurance market; 2005 is estimated.3Represents U.S. personal auto insurance market net premiums written as reported by A.M. Best Company Inc.; 2005 is estimated. 4Represents average annual compounded rate of increase and assumes dividend reinvestment.
All share and per share amounts were adjusted for the April 22, 2002, 3-for-1 stock split.
||||
|
||
||
||
||
||
||
|| | | | |
||
||
||
||
||
||
||
|||
.02
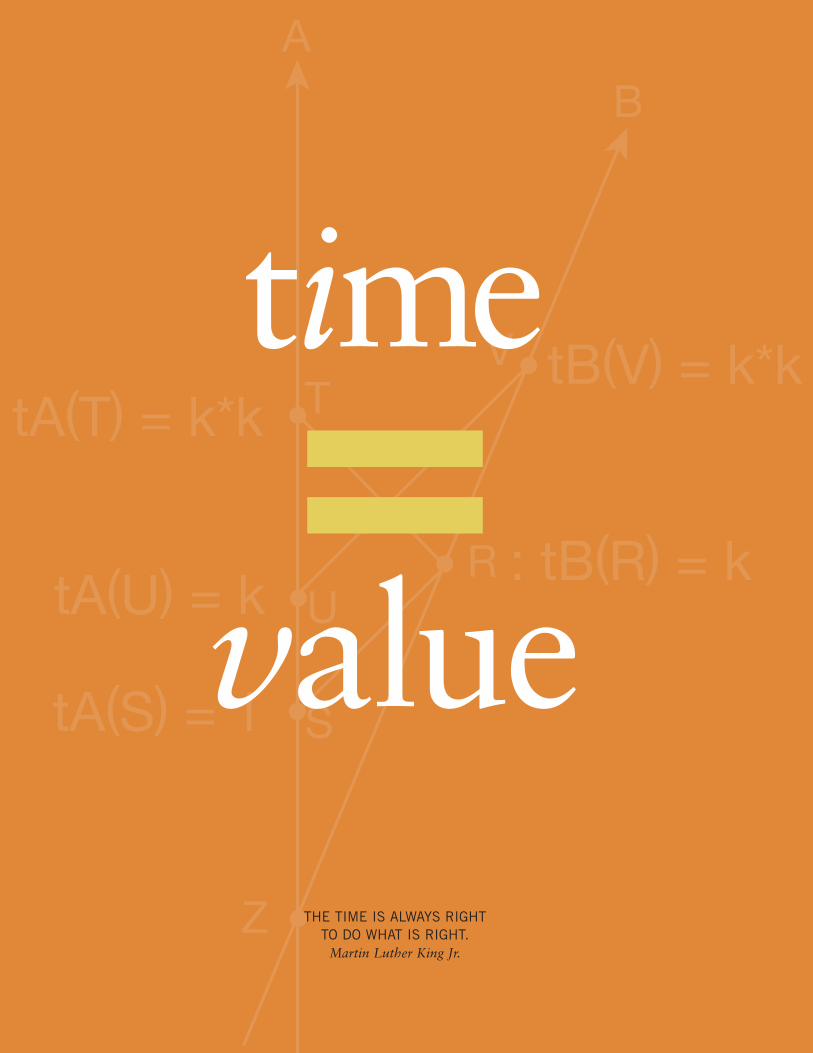
THE TIME IS ALWAYS RIGHTTO DO WHAT IS RIGHT.
Martin Luther King Jr.
value

COMMUNICATING A CLEAR PICTURE OF PROGRESSIVE by stating what we try toachieve (Vision), how we interact with customers (Customer Value Proposition) and whatguides our behavior (Core Values) permits all people associated with Progressive to un-derstand what we expect of ourselves and each other and how we conduct our business.
{Vision and Values}
.05
||||
|
||
||
||
||
||
||
|| | | | |
||
||
||
||
||
||
||
|||

.07
||||
|
||
||
||
||
||
||
|| | | | |
||
||
||
||
||
||
||
|||
CORE VALUES
Progressive’s Core Values serve as the foundation for our corpo-rate culture. They govern our decisions and define the manner inwhich we conduct our business and how we interact with all interested parties. We want them understood and embraced byall Progressive people. Growth and change provide new perspec-tive, requiring regular refinement of Core Values.Integrity We revere honesty. We adhere to the highest ethical stan-dards, provide timely, accurate and complete financial reporting,encourage disclosing bad news and welcome disagreement.Golden Rule We respect all people, value the differences amongthem and deal with them in the way we want to be dealt with. Thisrequires us to know ourselves and to try to understand others.Objectives We strive to communicate clearly Progressive’s am-bitious objectives and our people’s personal and team objectives.We evaluate performance against all these objectives. Excellence We strive constantly to improve in order to meet andexceed the highest expectations of our customers, agents, share-holders and people. We teach and encourage our people to improveperformance and to reduce the costs of what they do for customers.We base their rewards on results and promotion on ability.Profit The opportunity to earn a profit is how the competitivefree-enterprise system motivates investment to enhance humanhealth and happiness. Expanding profits reflect our customers’and claimants’ increasingly positive view of Progressive.
VISION
We seek to be an excellent, innovative, growing and enduringbusiness by cost-effectively and profitably reducing the humantrauma and economic costs of auto accidents and other mishaps,and by building recognized, trusted, admired, business-generat-ing brands. We seek to maximize shareholder value and to provide a positive environment that attracts quality people whodevelop and achieve ambitious growth plans.
CUSTOMER VALUE PROPOSITION
Our Customer Value Proposition provides a litmus test for customer interactions, relationships and innovation.Fast, Fair, Better That’s what you can expect from Progressive.Everything we do recognizes the needs of busy consumers, whoare cost-conscious, increasingly savvy about insurance and readyfor easy, new ways to quote, buy and manage their policies, including claims service that respects their time and reduces thetrauma and inconvenience of loss.

A MAN WHO DARES TO WASTE ONE HOUR OF TIME HAS NOT
DISCOVERED THE VALUE OF LIFE. Charles Darwin
success

MEASUREMENT IS CENTRAL TO PROGRESSIVE’S BUSINESS DISCIPLINE. We findways to measure just about everything. Crafting an accurate measure to summarize over-all company performance is perhaps hardest of all, but we have such a measure.
“Gainshare” is our way to calibrate the business gain made in any calendar year. Expressed as a score between 0 and 2 with calculation details that belie the simplisticscale, Gainshare has for over 12 years provided an internal barometer of performance,as well as variable compensation for all Progressive people. In the bleak year of 2000,the score was 0 and no Gainsharing compensation was paid. In 2003, when things couldnot have gone much better, the score was the first ever 2. While neither of these resultswas anticipated as likely in the distribution of outcomes, both served to validate the possibilities. Over the last 12 years, the average score has been 1.4, exceeding the ex-pected outcome of achieving our stated objectives which by design would produce a1.0.
Although 2005 was not a year of record setting growth rates or earnings per share, byour Gainshare score of 1.54, or by any other measure, it was a very solid all-around performance. We ended the year with just over $14 billion in net premiums written, anincrease of about $630 million, or 5% over 2004. This is the smallest gain of the last fiveyears in both absolute and percentage terms, but not out of sync with our expectations orour forecast of industry-wide auto premiums for 2005. Our calendar-year underwritingprofit margin remained exceptionally strong at 11.9%, considerably above our target of4%, but down from prior-year levels by about 3 points. Combined with investment returns for the year, net income for 2005 was $1.39 billion, yielding a return on averageshareholders’ equity of 25%.
{Letter to Shareholders}
.09
||||
|
||
||
||
||
||
||
|| | | | |
||
||
||
||
||
||
||
|||

||||
|
||
||
||
||
||
||
|| | | | |
||
||
||
||
||
||
||
|||
.10
90
95
100
105
110
115
19
76
19
80
19
85
19
90
19
95
20
00
(est.)2
00
5
MARKET CONDITIONS
With some good reason, the cyclical nature of insurance is oftencited when describing market conditions and industry perform-ance. The inset graph provides a visual reference to the surpris-ingly consistent nature of the private passenger auto cycle. Overthe past 30 years, we have seen enormous political and economicchanges, along with dramatic swings in interest rates and equity-market returns. Despite these changes, the cycle shows a consis-tent pattern. It would appear that over the past few years, we havebeen observing the ascent, peak and now the potential decline inunderwriting margins of the current cycle.
Last year I reported that consistently falling claims frequencymade 2003 and 2004 two of only three profitable years in the last25 for the auto insurance industry and that 2004 produced whatwas at that time perhaps the lowest industry-wide combined ratioin history. As most would have assumed, 2005 was to be anotheryear of underwriting profitability and, while significant, even thelosses from the storm season are unlikely to dramatically changethe macro cycle.
For Progressive, understanding this cycle translates into playing the right hand at the right time.
About one full cycle ago, the industry was reporting peak un-derwriting profitability. In 1998, Progressive reported a healthyunderwriting profit of 8.4%, but our growth was slowing. Our
PRIVATE PASSENGER AUTO COMBINED RATIOS 1976 – 2005
Source: A.M. Best Company Inc.
culture thrives on profitable growth, and slowing growth doesnot sit well at any level in the organization — now or then. We responded with price reductions in the hope of additionalprofitable growth. These reductions, combined with an unantic-ipated increase in claim frequency and severity and a host of othercontributing factors, decreased our underwriting profit to 1.7%in 1999 and led to an underwriting loss of 4.4% in 2000.
In our own small way we contributed to the cycle. As we review today’s market conditions there are reasons to respect theparallels to that time. We are more experienced, but imperfect,in valuing the benefit of rate reductions during market conditionsin which consumers experience rate stability or decreases. As such, we have chosen to be more deliberate in using rate reductions in search of profitable growth. Drive Insurance, whichoperates in an environment where rates are continuously com-pared to competitive options, reduced rates modestly during theyear and found it very hard to get growth in new applications.Progressive Direct kept rates relatively stable for the year and wasable to grow new applications, albeit at a pace far less than wecould have handled and would have preferred.
Change in market pricing is reflected in year-over-year growthin net premiums written for the auto insurance industry. In 2004, the year-over-year growth in net premiums written fell to

.11
||||
|
||
||
||
||
||
||
|| | | | |
||
||
||
||
||
||
||
|||
4.2% from the prior three-year average of 8%. For 2005, we estimate the year-over-year increase in net premiums written for the auto insurance industry will be about 1%. Our knowl-edge of the calculus combining price, growth and profit,while increasing, remains a challenge and something we want tobe smart about.
Reviewing Progressive’s and the industry’s results through 2005and noting the possible analogue to past cycles, we would make afew important observations. Operating margins, while historicallystrong, are starting to deteriorate. Modestly increasing severity,notably in physical damage coverages, combined with pricereductions, will likely reduce current margins. Prior period bod-ily injury severities, which have the highest sensitivity to carriedreserves, have generally been overestimated resulting in favorablecalendar-period adjustments. In Progressive’s case, the overall favorable calendar-year adjustment was 2.6 points for 2005.Calendar-period reporting has a way of disguising the run rate andperhaps delaying appropriate reactions. We have for some timeforecast that Progressive would slowly return to more normal operating margins by allowing expected increases in severity, andpotentially frequency, to absorb the margin in excess of our targetrather than immediately price it away. We continue to believe thisis the right way for us to address these market conditions.
We see 2006 as a year when accident-year results both for Progressive and the industry may begin producing smaller mar-gins and trending toward more historical norms. As with any out-look there are unknowns. The level of price activity and thedegree of severity and frequency change will be critical as we playour hand during this phase of the cycle.
History has been an influential teacher and as we work throughthis phase of the cycle many things are different and, we think, bet-ter for us. Our personal auto policy periods are shorter, providinggreater flexibility to price correctly and our controls and analyticreview of profitability by subsegments of our book are more rigor-ous. We are clearer about our expected outcomes. Loss cost andexpense management are all considerably tighter and our technol-ogy and operational performance are considerably improved.
While accepting that current market conditions will likely continue to influence our growth during 2006, and that growthwill be less than we believe we are ready to handle, we have embraced this time and opportunity as one of “maximum preparedness” for the future we anticipate.

MAXIMUM PREPAREDNESS
Underwriting cycle aside, our future will largely be determinedby how we craft it, and we have many important initiatives thatcontinue to excite me. A slightly less glamorous way to describeourselves and our ability to compete would be to suggest we dothree things well that really matter. We allocate costs betweenconsumers in ways that best match their expected costs, we man-age the claims and administrative costs that must ultimately beallocated, and we provide superior consumer experiences. Ourmaximum preparedness agenda is designed to encompass themany things we know matter in our business and to optimize ourperformance on a few very strategic initiatives that create mean-ingful and, in some cases, distinctive competitive advantages.

.13
||||
|
||
||
||
||
||
||
|| | | | |
||
||
||
||
||
||
||
|||
Claims Our single largest cost and one of our most visible consumer experiences has continued to demonstrate steady and consistent improvement. Our emphasis on claims handling quality and critical review has again established a new high-watermark. While the rate of improvement, by definition, will slow,this is likely the single most important and sustained operationalimprovement of the last several years. Even more important perhaps is that our claims quality improved in growth periodssuggesting, as we believe, claims quality is largely a functionof system-wide process design and effective implementation.We expect when margins thin the competitive benefits will bemore apparent.
Last year, I reported that we used the year to fully evaluateevery aspect of our concierge-level claims service and concludedby year end that our evaluation discipline and planning had positioned us well for expansion throughout 2005 and 2006.We opened six new facilities in 2005 and ended the year with 18under construction. 2006 will be a big year with about 30 plannedopenings. As passionate and involved as I have been with this initiative, I continue to be surprised and impressed by the level ofdetail and science our people have built around the concept, andjust how critical that detail is to ensure success. My confidence inmore than doubling the number of sites in just one year reflectsthat we are now observing that each opening builds on the suc-cess of those before it and has a much abbreviated learning curve.Several years ago I suggested that this initiative would change ourbusiness in profound ways, improving the customer and employee
experience, reducing the friction costs associated with claims han-dling, improving the interaction with body shops and leveragingscale advantages in meaningful ways. I am now more confidentthan ever and we have started to think more in terms of how notto deprive our customers of this level of service where we can offerit economically.
A theme highlighted by this report is the significance and valueof time in a service economy. More than anything else the conciergelevel of service respects our customers’ and claimants’ time andworks effectively to minimize the cycle time of repairs, resultingin cost-management opportunities at every step of the process.
Speaking of time, our claims responsiveness was once againput to the test in what appeared to be the never-ending storm season of 2005. We have reported at length on the storms andtheir economic toll, but the real story is that, when tested, ourclaims organization’s ability to produce excellent closure ratesand great customer service was, we believe, second to none. Aby-product of a storm season of this year’s magnitude is that it islikely that more people than ever, in a concentrated period oftime, have experienced an insurance claim of one type or another.We intend to confirm our understanding of our performance byconducting an independent survey of Gulf States claims handling.Determining where we have room for improvement will be theonly assessment of long-term value. Timely response in this caseis not just great customer service, it’s good business. Respondingto customers quickly adds certainty to our external financial disclosures as well as to the internal data we use for pricing.
OPHELIA
WILMA
KATRINA
TAMMY
CIN
DY
RITA
AR
LEN
E
GAMMA
DEN
NIS
EMILY
STA
NJOSÉ
BETA
FRANKLIN
IRENE
BRET
A
LPH
A
PHILLIPPE
M
ARIA
EPSILON
NATE
LEE
DELTA ZETA
IRENE
TEN
TWENTY-TWO
HARVEY
NINETEEN
STORM TRACKING – 2005 SEASON
||||
|
||
||
||
||
||
||
|| | | | |
||
||
||
||
||
||
||
|||
.14
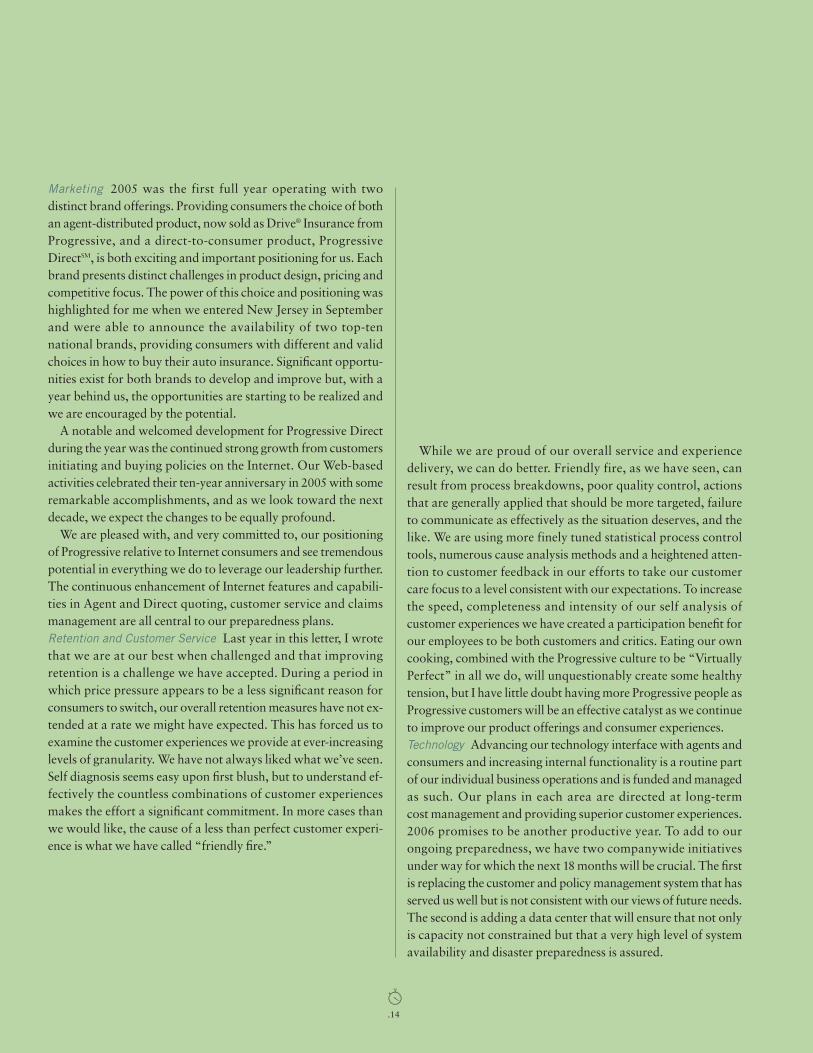
While we are proud of our overall service and experience delivery, we can do better. Friendly fire, as we have seen, can result from process breakdowns, poor quality control, actionsthat are generally applied that should be more targeted, failureto communicate as effectively as the situation deserves, and thelike. We are using more finely tuned statistical process controltools, numerous cause analysis methods and a heightened atten-tion to customer feedback in our efforts to take our customer care focus to a level consistent with our expectations. To increasethe speed, completeness and intensity of our self analysis of customer experiences we have created a participation benefit forour employees to be both customers and critics. Eating our owncooking, combined with the Progressive culture to be “VirtuallyPerfect” in all we do, will unquestionably create some healthy tension, but I have little doubt having more Progressive people asProgressive customers will be an effective catalyst as we continueto improve our product offerings and consumer experiences. Technology Advancing our technology interface with agents andconsumers and increasing internal functionality is a routine partof our individual business operations and is funded and managedas such. Our plans in each area are directed at long-termcost management and providing superior customer experiences.2006 promises to be another productive year. To add to our ongoing preparedness, we have two companywide initiativesunder way for which the next 18 months will be crucial. The firstis replacing the customer and policy management system that hasserved us well but is not consistent with our views of future needs.The second is adding a data center that will ensure that not onlyis capacity not constrained but that a very high level of systemavailability and disaster preparedness is assured.
Marketing 2005 was the first full year operating with two distinct brand offerings. Providing consumers the choice of bothan agent-distributed product, now sold as Drive® Insurance fromProgressive, and a direct-to-consumer product, Progressive DirectSM, is both exciting and important positioning for us. Eachbrand presents distinct challenges in product design, pricing andcompetitive focus. The power of this choice and positioning washighlighted for me when we entered New Jersey in Septemberand were able to announce the availability of two top-tennational brands, providing consumers with different and validchoices in how to buy their auto insurance. Significant opportu-nities exist for both brands to develop and improve but, with ayear behind us, the opportunities are starting to be realized andwe are encouraged by the potential.
A notable and welcomed development for Progressive Directduring the year was the continued strong growth from customersinitiating and buying policies on the Internet. Our Web-based activities celebrated their ten-year anniversary in 2005 with someremarkable accomplishments, and as we look toward the nextdecade, we expect the changes to be equally profound.
We are pleased with, and very committed to, our positioningof Progressive relative to Internet consumers and see tremendouspotential in everything we do to leverage our leadership further.The continuous enhancement of Internet features and capabili-ties in Agent and Direct quoting, customer service and claimsmanagement are all central to our preparedness plans.Retention and Customer Service Last year in this letter, I wrotethat we are at our best when challenged and that improving retention is a challenge we have accepted. During a period inwhich price pressure appears to be a less significant reason forconsumers to switch, our overall retention measures have not ex-tended at a rate we might have expected. This has forced us toexamine the customer experiences we provide at ever-increasinglevels of granularity. We have not always liked what we’ve seen.Self diagnosis seems easy upon first blush, but to understand ef-fectively the countless combinations of customer experiencesmakes the effort a significant commitment. In more cases thanwe would like, the cause of a less than perfect customer experi-ence is what we have called “friendly fire.”

INVESTMENTS AND CAPITAL MANAGEMENT
Solid growth in the economy and improving profits supported theequity markets in 2005 while “measured” interest rate increasesfrom the Federal Reserve pushed short-term rates higher to essen-tially flat with steady longer maturity yields. We took advantageof interest rate volatility during the year to shorten our portfolio’saverage maturity when rates were low and extend it when ratesincreased. We decreased our exposure to corporate and other non-government issued bonds early in the year, believing the incremen-tal yield premium relative to U.S. treasury bonds was insufficientfor the risk taken. Our portfolio produced a 4% total return in 2005 with equities tracking their benchmark and fixed-incomesecurities performing better than the general bond market.
.17
||||
|
||
||
||
||
||
||
|| | | | |
||
||
||
||
||
||
||
|||
Our long-standing and continuing position on capital manage-ment is to repurchase shares when our capital position, view ofthe future, and the stock’s price make it attractive to do so.Growth rates and profitability levels during 2005 happily led toan assessment that we were accumulating capital in excess of thatwhich we believed was needed and prudent to run the business.Committed to executing against our capital management strat-egy, we entered 2005 with regular monthly share repurchases.The average repurchase price per share in January was $83.46,below the $88 of the “Dutch auction” we had completed justthree months earlier. By September our repurchase price was justunder $100. October and November saw rapid escalation in thestock price peaking near $125; while delighted for shareholders,this level of volatility suggested we should pause for a while,which we did before repurchasing again in December at $118.92.
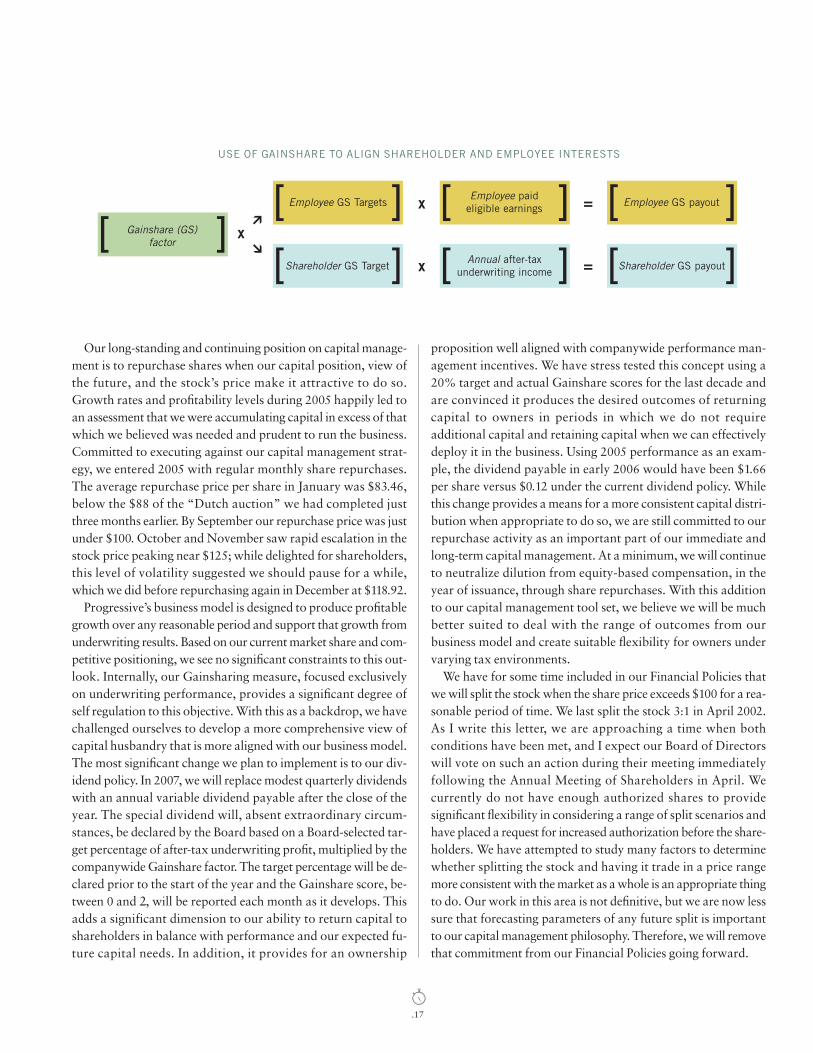
Progressive’s business model is designed to produce profitablegrowth over any reasonable period and support that growth fromunderwriting results. Based on our current market share and com-petitive positioning, we see no significant constraints to this out-look. Internally, our Gainsharing measure, focused exclusivelyon underwriting performance, provides a significant degree ofself regulation to this objective. With this as a backdrop, we havechallenged ourselves to develop a more comprehensive view ofcapital husbandry that is more aligned with our business model.The most significant change we plan to implement is to our div-idend policy. In 2007, we will replace modest quarterly dividendswith an annual variable dividend payable after the close of theyear. The special dividend will, absent extraordinary circum-stances, be declared by the Board based on a Board-selected tar-get percentage of after-tax underwriting profit, multiplied by thecompanywide Gainshare factor. The target percentage will be de-clared prior to the start of the year and the Gainshare score, be-tween 0 and 2, will be reported each month as it develops. Thisadds a significant dimension to our ability to return capital toshareholders in balance with performance and our expected fu-ture capital needs. In addition, it provides for an ownership
proposition well aligned with companywide performance man-agement incentives. We have stress tested this concept using a20% target and actual Gainshare scores for the last decade andare convinced it produces the desired outcomes of returning capital to owners in periods in which we do not requireadditional capital and retaining capital when we can effectively deploy it in the business. Using 2005 performance as an exam-ple, the dividend payable in early 2006 would have been $1.66per share versus $0.12 under the current dividend policy. Whilethis change provides a means for a more consistent capital distri-bution when appropriate to do so, we are still committed to our repurchase activity as an important part of our immediate andlong-term capital management. At a minimum, we will continueto neutralize dilution from equity-based compensation, in theyear of issuance, through share repurchases. With this additionto our capital management tool set, we believe we will be muchbetter suited to deal with the range of outcomes from our business model and create suitable flexibility for owners undervarying tax environments.
We have for some time included in our Financial Policies thatwe will split the stock when the share price exceeds $100 for a rea-sonable period of time. We last split the stock 3:1 in April 2002.As I write this letter, we are approaching a time when both conditions have been met, and I expect our Board of Directorswill vote on such an action during their meeting immediately following the Annual Meeting of Shareholders in April. We currently do not have enough authorized shares to provide significant flexibility in considering a range of split scenarios andhave placed a request for increased authorization before the share-holders. We have attempted to study many factors to determinewhether splitting the stock and having it trade in a price rangemore consistent with the market as a whole is an appropriate thingto do. Our work in this area is not definitive, but we are now lesssure that forecasting parameters of any future split is importantto our capital management philosophy. Therefore, we will removethat commitment from our Financial Policies going forward.
USE OF GAINSHARE TO ALIGN SHAREHOLDER AND EMPLOYEE INTERESTS
[ ] [ ][ ]
[ ] [ ]x
Employee paid eligible earningsx Employee GS payout
Shareholder GS TargetAnnual after-tax
underwriting incomex
=
= Shareholder GS payout
[ ]Employee GS Targets
[ ]Gainshare (GS) factor
>
>
||||
|
||
||
||
||
||
||
|| | | | |
||
||
||
||
||
||
||
|||
.18
CONSTANCY OF PURPOSE
Just as measurement is central to Progressive’s business discipline,our Core Values, aspirations and people are central to ourbusiness culture.
We are continuously motivated by our aspiration of becomingConsumers’ #1 Choice for Auto Insurance and in 2005 moved another step closer, ending the year with close to 10 million policies and enormous potential. Nothing we have achieved hasbeen without the efforts of so many and our single most important initiative continues to be making Progressive a GreatPlace to Work. Creating an environment where our people enjoyworking hard, are motivated to do their best, can grow constantlyand one that others want to join is a never-ending focus and has a special permanency. Our measures of the culture and work environment provide us both confidence and challenge inour efforts to ensure the Progressive culture continuously matchesour aspirations.
We greatly appreciate the customers we are privileged to serve, the more than 28,000 Progressive people who make it all possible, the agents and brokers who choose to represent us andshareholders who believe in what we are doing.
Glenn M. RenwickPresident and Chief Executive Officer

WE MUST USE TIME AS A TOOL,
NOT AS A CRUTCH.John F.Kennedy

.21
||||
|
||
||
||
||
||
||
|| | | | |
||
||
||
||
||
||
||
|||
CONSISTENT ACHIEVEMENT OF SUPERIOR RESULTS REQUIRES that our peopleunderstand Progressive’s objectives and their specific roles, and that their personal objectives dovetail with Progressive’s. Our objectives are ambitious, yet realistic.We rec-ognize that the dynamics of each distribution channel are very different and, therefore,have established a product management system responsible for achieving these financialobjectives over rolling five-year periods. Progressive monitors its financial policies continuously and strives to meet these targets annually. Experience always clarifies objectives and illuminates better policies.We constantly evolve as we monitor the execu-tion of our policies and progress toward achieving our objectives.
{Objectives, Policies and Operations Summary}

OBJECTIVES
Profitability Progressive’s most important goal is for our insurancesubsidiaries to produce an aggregate calendar-year underwritingprofit of at least 4%. Our business is a composite of many prod-uct offerings defined in part by product type, distribution chan-nel, geography, tenure of the customer and underwriting grouping.Each of these products has targeted operating parameters basedon level of maturity, underlying cost structures, customer mix andpolicy life expectancy. Our aggregate goal is the balanced blend ofthese individual performance targets in any calendar year.Growth Our goal is to grow as fast as possible, constrained onlyby our profitability objective and our ability to provide high-qual-ity customer service. Progressive is a growth-oriented companyand management incentives are tied to profitable growth.
We report Personal Lines and Commercial Auto results sepa-rately. We further break down our Personal Lines’ results by chan-nel (Drive and Direct) to give shareholders a clearer picture of thebusiness dynamics of each distribution method and their respec-tive rates of growth. Aggregate expense ratios and aggregate growthrates disguise the true nature and performance of each business.
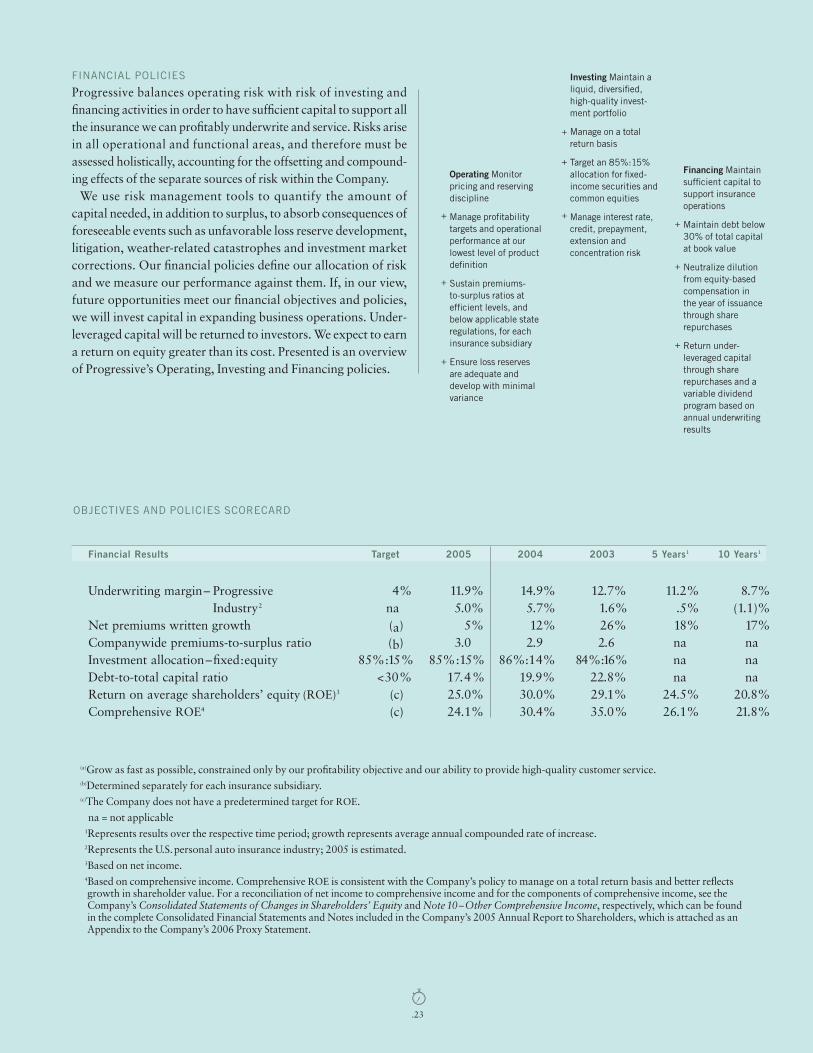
FINANCIAL POLICIES
Progressive balances operating risk with risk of investing and financing activities in order to have sufficient capital to support allthe insurance we can profitably underwrite and service. Risks arisein all operational and functional areas, and therefore must be assessed holistically, accounting for the offsetting and compound-ing effects of the separate sources of risk within the Company.
We use risk management tools to quantify the amount of capital needed, in addition to surplus, to absorb consequences offoreseeable events such as unfavorable loss reserve development,litigation, weather-related catastrophes and investment market corrections. Our financial policies define our allocation of riskand we measure our performance against them. If, in our view,future opportunities meet our financial objectives and policies,we will invest capital in expanding business operations. Under-leveraged capital will be returned to investors. We expect to earna return on equity greater than its cost. Presented is an overviewof Progressive’s Operating, Investing and Financing policies.
OBJECTIVES AND POLICIES SCORECARD
Financial Results Target 2005 2004 2003 5 Years1 10 Years1
Underwriting margin– Progressive 4% 11.9% 14.9% 12.7% 11.2% 8.7%Industry2 na 5.0% 5.7% 1.6% .5% (1.1)%
Net premiums written growth (a) 5% 12% 26% 18% 17%Companywide premiums-to-surplus ratio (b) 3.0 2.9 2.6 na naInvestment allocation–fixed:equity 85%:15% 85%:15% 86%:14% 84%:16% na naDebt-to-total capital ratio <30% 17.4% 19.9% 22.8% na naReturn on average shareholders’ equity (ROE)3 (c) 25.0% 30.0% 29.1% 24.5% 20.8%Comprehensive ROE4 (c) 24.1% 30.4% 35.0% 26.1% 21.8%
(a)Grow as fast as possible, constrained only by our profitability objective and our ability to provide high-quality customer service. (b)Determined separately for each insurance subsidiary.(c)The Company does not have a predetermined target for ROE.
na = not applicable1Represents results over the respective time period; growth represents average annual compounded rate of increase. 2Represents the U.S.personal auto insurance industry; 2005 is estimated. 3Based on net income.4Based on comprehensive income. Comprehensive ROE is consistent with the Company’s policy to manage on a total return basis and better reflects growth in shareholder value. For a reconciliation of net income to comprehensive income and for the components of comprehensive income, see the Company’s Consolidated Statements of Changes in Shareholders’ Equity and Note 10–Other Comprehensive Income, respectively, which can be found in the complete Consolidated Financial Statements and Notes included in the Company’s 2005 Annual Report to Shareholders, which is attached as an Appendix to the Company’s 2006 Proxy Statement.
.23
||||
|
||
||
||
||
||
||
|| | | | |
||
||
||
||
||
||
||
|||
Investing Maintain aliquid, diversified,high-quality invest-ment portfolio
Manage on a total return basis
Target an 85%:15%allocation for fixed-income securities andcommon equities
Manage interest rate,credit, prepayment,extension and concentration risk
Operating Monitorpricing and reservingdiscipline
Manage profitabilitytargets and operationalperformance at ourlowest level of productdefinition
Sustain premiums-to-surplus ratios at efficient levels, andbelow applicable stateregulations, for eachinsurance subsidiary
Ensure loss reservesare adequate and develop with minimalvariance
Financing Maintainsufficient capital tosupport insuranceoperations
Maintain debt below30% of total capitalat book value
Neutralize dilutionfrom equity-basedcompensation in the year of issuancethrough share repurchases
Return under-leveraged capitalthrough sharerepurchases and avariable dividendprogram based onannual underwritingresults
+
+
+
+
+
++
+
+

||||
|
||
||
||
||
||
||
|| | | | |
||
||
||
||
||
||
||
|||
.24
ACHIEVEMENTS
We are convinced that the best way to maximize shareholdervalue is to achieve these financial objectives and policies consis-tently. A shareholder who purchased 100 shares of Progressivefor $1,800 in our first public stock offering on April 15, 1971,owned 23,066 shares on December 31, 2005, with a market valueof $2,693,650, for a 23.5% compounded annual return, comparedto the 7.5% return achieved by investors in the Standard & Poor’s500 during the same period. In addition, the shareholder receiveddividends of $2,768 in 2005, bringing total dividends received to$34,335 since the shares were purchased.
In the ten years since December 31, 1995, Progressive share-holders have realized compounded annual returns, including dividend reinvestment, of 22.0%, compared to 9.1% for the S&P
500. In the five years since December 31, 2000, Progressive share-holders’ returns were 27.8%, compared to .6% for the S&P 500.In 2005, the returns were 37.9% on Progressive shares and 4.9%for the S&P 500.
Over the years, when we have had adequate capital and believedit to be appropriate, we have repurchased our shares. In addition,as our Financial Policies state, we will repurchase shares to neutralize the dilution from equity-based compensation programsand return any underleveraged capital to investors. During 2005,the Company repurchased 5,197,686 Common Shares during theyear at a total cost of $482.8 million with an average cost of$92.89 per share. Since 1971, we spent $3.4 billion repurchasingour shares, at an average cost of $14.24 per share.

OPERATIONS SUMMARY
Drive® Insurance from Progressive In 2005, results for Drive Insurance from Progressive were mixed. Profit margins were veryhealthy, with a combined ratio of 89.3. We kept our overall expense ratio flat at 20.2, despite adding significant new expendi-tures related to building the Drive brand. On the other hand,growth was not as strong. Our auto policies in force count grew6%, largely due to renewals and improvements in retention, whilewritten premiums grew only 1%, as falling average premiums perpolicy offset unit growth. Relative to 2004, new auto applicationswere down despite a slight increase in the number of quotes.
Simply put, the auto insurance market is soft. As rates drop,consumers are given less reason to shop at renewal; our data, as well as competitors’, bear this out. This declining base of shoppers is being chased by an increasingly aggressive set ofcompetitors applying rate reductions, redesigned underwriting,and enhanced marketing and producer compensation.
Despite the competitive market, there are successes to report.After a 20-year absence, we re-entered New Jersey with our auto product. Early results are very encouraging. In addition,
we believe that market dislocation and our superior handling of catastrophe-related claims in the Gulf states are creating opportunities there. The portion of our business generated by alliances with other carriers is growing. And, our SpecialLines business (primarily motorcycles, boats and recreational vehicles) grew 13% nearing the $800 million mark for premiumswritten in 2005.
We continued to build on the introduction of our new brand,Drive Insurance from Progressive. In 2005, nearly two millionunique visitors came to our new Web site, driveinsurance.com.We continued to enhance functionality of our agency-dedicatedWeb site, ForAgentsOnly.com, and improved our interface withagency management and comparative rating systems, making iteven easier for independent agents to quote and sell our products.We also concluded extensive testing of localized marketing tactics that will allow us to offer a broad array of co-branded mar-keting tools to agents in 2006. Agent acceptance of the new brandis strong; our biggest problem is meeting agents’ demand for moremarketing materials—not altogether a bad problem to have.
2005 2004 Change
Net Premiums Written (in billions) $ 8.0 $ 7.9 1%Net Premiums Earned (in billions) $ 8.0 $ 7.9 1%Loss and loss adjustment expense ratio 69.1 65.8 3.3 pts.Underwriting expense ratio 20.2 20.2 — pts.
Combined ratio 89.3 86.0 3.3 pts.Auto Policies in Force (in thousands) 4,491 4,245 6%
.25
||||
|
||
||
||
||
||
||
|| | | | |
||
||
||
||
||
||
||
|||

Progressive DirectSM Progressive Direct generated solid growthin 2005, with a combined ratio of 88.3. Our expense ratio declined .5 points, resulting from more renewals and a shift tomore sales on the Internet vs. phone. Net premiums written grew10%. Growth is a function of changes in prices, new sales andcustomer retention. Auto insurance prices, as measured bychanges in our rating plans, were relatively stable, although average earned premiums per policy decreased about 2%. Newsales were up 8% and auto policies in force grew 12%, despite aslight decline in retention. We were pleased with the growth in the sale of new policies particularly in light of the continueddramatic increase in advertising spend by our competitors in 2005. Our own advertising spend increased 14% despite a decrease in our use of direct mail. We are now making more useof media such as Internet and radio. We feel our advertising cre-ative has become more distinctive and recognizable.
Our overall new business growth has come through Internet-sales platforms, as business generated entirely through telephonecontact declined. We successfully introduced a next generationWeb-quoting platform that offers a much faster online quotingexperience and has led to an increase in our Web application com-pletion rate. We introduced “talk to me” functionality, allowingInternet customers to instantly start a telephone conversationwith a licensed professional who can access their quote real-timeand provide them counsel.
In 2005, we launched a New Jersey product that has performedto our expectations, and we are continuing to see our SpecialLines business grow.
||||
|
||
||
||
||
||
||
|| | | | |
||
||
||
||
||
||
||
|||
.26
2005 2004 Change
Net Premiums Written (in billions) $ 4.2 $ 3.8 10%Net Premiums Earned (in billions) $ 4.1 $ 3.7 10%Loss and loss adjustment expense ratio 68.4 65.5 2.9 pts.Underwriting expense ratio 19.9 20.4 (.5) pts.
Combined ratio 88.3 85.9 2.4 pts.Auto Policies in Force (in thousands) 2,328 2,084 12%

Commercial Auto From late 2004 and throughout 2005, the com-mercial auto market experienced broad rate decreases for the firsttime in six years. Although slight in nature, this rate action comesafter the industry’s extremely profitable 2004 and is indicative ofthe continued soft market. Competitors have also become moreactive in the truck owner-operator market, one of our corestrengths. However, because of our competitive position in theGulf region and our product’s entry into North and South Dakota,New Hampshire and South Carolina in 2004 and early 2005, wegained moderate share last year. Net written premiums grew 11%to $1.8 billion and policies in force rose 11%. We ended the yearstill the third largest writer in the commercial auto industry.
During 2005, rates were reduced in selective states when therewas an opportunity to grow or in response to a significant
2005 2004 Change
Net Premiums Written (in billions) $ 1.8 $ 1.6 11%Net Premiums Earned (in billions) $ 1.7 $ 1.5 9%Loss and loss adjustment expense ratio 62.4 59.7 2.7 pts.Underwriting expense ratio 19.7 19.2 .5 pts.
Combined ratio 82.1 78.9 3.2 pts.Policies in Force (in thousands) 468 420 11%
competitive threat. In addition, accident frequency was lowerthan expected. We also completed a transition from 6-month to12-month policies to better align with commercial customer preference and to increase our retention on the renewal book. Asa result, we enjoyed another year of strong profits.
While the coming year will be very competitive, several oppor-tunities await. In December, we entered New Jersey, the 6thlargest commercial auto market in the country, and have beenwarmly received by independent agents there. In addition, a foun-dation has been laid to significantly expand our agency presencein North Carolina and we expect to enter West Virginia in thefirst quarter 2006.
moneyTO ACHIEVE GREAT THINGS,
TWO THINGS ARE NEEDED; A PLAN,AND NOT QUITE ENOUGH TIME.
Leonard Bernstein

BASIS OF PRESENTATION The accompanying consolidated financial statements include the accounts of The Progressive Corporation, its subsidiaries and affiliate (theCompany). These financial statements should be read in conjunction with the completeConsolidated Financial Statements, including complete Notes to the Consolidated Financial Statements, as well as Management’s Discussion and Analysis of FinancialCondition and Results of Operations and Supplemental Information, which are includedin the Company’s 2005Annual Report to Shareholders, which is attached as anAppendixto The Progressive Corporation’s 2006 Proxy Statement.
{Consolidated Financial Statements}
.29
||||
|
||
||
||
||
||
||
|| | | | |
||
||
||
||
||
||
||
|||

(millions–except per share amounts)
{Consolidated Statements of Income}
For the years ended December 31, 2005 2004 2003
REVENUESNet premiums earned $ 13,764.4 $ 13,169.9 $ 11,341.0Investment income 536.7 484.4 465.3Net realized gains (losses) on securities (37.9) 79.3 12.7Service revenues 40.2 48.5 41.8Other income1 — — 31.2
Total revenues 14,303.4 13,782.1 11,892.0
EXPENSESLosses and loss adjustment expenses 9,364.8 8,555.0 7,640.4Policy acquisition costs 1,448.2 1,418.0 1,249.1Other underwriting expenses 1,312.2 1,238.6 1,010.1Investment expenses 12.1 13.9 11.5Service expenses 24.6 25.0 25.7Interest expense 82.6 80.8 95.5
Total expenses 12,244.5 11,331.3 10,032.3
NET INCOMEIncome before income taxes 2,058.9 2,450.8 1,859.7Provision for income taxes 665.0 802.1 604.3Net income $ 1,393.9 $ 1,648.7 $ 1,255.4
COMPUTATION OF EARNINGS PER SHAREBasic:Average shares outstanding 196.9 212.9 216.8
Per share $ 7.08 $ 7.74 $ 5.79Diluted: Average shares outstanding 196.9 212.9 216.8Net effect of dilutive stock-based compensation 2.9 3.3 3.7
Total equivalent shares 199.8 216.2 220.5Per share $ 6.98 $ 7.63 $ 5.69
1Represents interest earned on an income tax refund. See Note 3–Income Taxes, in the Company’s 2005 Annual Report to Shareholders, for further discussion.
See notes to the complete consolidated financial statements included in the Company’s 2005 Annual Report to Shareholders, which is attached as an Appendix to the Company’s 2006 Proxy Statement.
THE PROGRESSIVE CORPORATION AND SUBSIDIARIES
||||
|
||
||
||
||
||
||
|| | | | |
||
||
||
||
||
||
||
|||
.30

||||
|
||
||
||
||
||
||
|| | | | |
||
||
||
||
||
||
||
|||
.32
December 31, 2005 2004
ASSETSInvestments – Available-for-sale, at market:
Fixed maturities (amortized cost: $10,260.7 and $8,972.6) $ 10,221.9 $ 9,084.3Equity securities:
Preferred stocks (cost: $1,217.0 and $749.4) 1,220.3 768.9Common equities (cost: $1,423.4 and $1,314.0) 2,058.9 1,851.9
Short-term investments (amortized cost: $773.5 and $1,376.6) 773.6 1,376.9Total investments 14,274.7 13,082.0
Cash 5.6 20.0Accrued investment income 133.1 103.5Premiums receivable, net of allowance for doubtful accounts of $116.3 and $83.8 2,500.7 2,287.2Reinsurance recoverables, including $58.5 and $44.5 on paid losses 405.7 381.6Prepaid reinsurance premiums 103.7 119.8Deferred acquisition costs 444.8 432.2Income taxes 138.3 —Property and equipment, net of accumulated depreciation of $562.0 and $562.1 758.7 666.5Other assets 133.3 91.5
Total assets $ 18,898.6 $ 17,184.3
LIABILITIES AND SHAREHOLDERS’ EQUITYUnearned premiums $ 4,335.1 $ 4,108.0Loss and loss adjustment expense reserves 5,660.3 5,285.6Accounts payable, accrued expenses and other liabilities 1,510.8 1,325.0Income taxes — 26.0Debt1 1,284.9 1,284.3
Total liabilities 12,791.1 12,028.9Shareholders’ equity:
Common Shares, $1.00 par value (authorized 600.0; issued 213.1 and 213.2,including treasury shares of 15.8 and 12.8) 197.3 200.4
Paid-in capital 848.2 743.3Unamortized restricted stock (62.7) (46.0)Accumulated other comprehensive income:
Net unrealized gains on securities 390.1 435.1Net unrealized gains on forecasted transactions 8.6 9.7
Retained earnings 4,726.0 3,812.9Total shareholders’ equity 6,107.5 5,155.4Total liabilities and shareholders’ equity $ 18,898.6 $ 17,184.3
1Includes current and non-current debt. See Note 4—Debt, in the Company’s 2005 Annual Report to Shareholders, for further discussion.
See notes to the complete consolidated financial statements included in the Company’s 2005 Annual Report to Shareholders, which is attached as an Appendix to the Company’s 2006 Proxy Statement.
(millions)
{Consolidated Balance Sheets}
THE PROGRESSIVE CORPORATION AND SUBSIDIARIES

For the years ended December 31, 2005 2004 2003
RETAINED EARNINGSBalance, Beginning of year $ 3,812.9 $3,729.8 $2,796.0
Net income 1,393.9 $ 1,393.9 1,648.7 $1,648.7 1,255.4 $1,255.4Cash dividends on Common Shares ($.12,
$.11 and $.10 per share) (23.7) (23.3) (21.7)Treasury shares purchased1 (457.0) (1,542.4) (297.5)Other, net (.1) .1 (2.4)
Balance, End ofyear $4,726.0 $ 3,812.9 $3,729.8
ACCUMULATED OTHER COMPREHENSIVE INCOME (LOSS), NET OF TAXBalance, Beginning of year $ 444.8 $ 425.0 $ 169.3
Changes in: Net unrealized gains on securities (45.0) 16.9 255.8Net unrealized gains on forecasted transactions (1.1) (1.0) (1.0)Foreign currency translation adjustment — 3.9 .9
Other comprehensive income (46.1) (46.1) 19.8 19.8 255.7 255.7Balance, End of year $ 398.7 $ 444.8 $ 425.0
Comprehensive Income $ 1,347.8 $1,668.5 $1,511.1
COMMON SHARES, $1.00 PAR VALUEBalance, Beginning of year $ 200.4 $ 216.4 $ 218.0
Stock options exercised 1.6 2.1 2.8Treasury shares purchased1 (5.2) (18.6) (5.0)Restricted stock issued, net of forfeitures .5 .5 .6
Balance, End of year $ 197.3 $ 200.4 $ 216.4
PAID-IN CAPITALBalance, Beginning of year $ 743.3 $ 688.3 $ 584.7
Stock options exercised 42.6 49.6 47.2Tax benefits from exercise/vesting of
stock-based compensation 41.2 44.3 44.0Treasury shares purchased1 (20.6) (67.5) (14.3)Restricted stock issued, net of forfeitures 41.7 27.3 26.7Other — 1.3 —
Balance, End of year $ 848.2 $ 743.3 $ 688.3
UNAMORTIZED RESTRICTED STOCKBalance, Beginning of year $ (46.0) $ (28.9) $ —
Restricted stock issued, net of forfeitures (42.2) (40.6) (37.3)Restricted stock market value adjustment (8.2) (.3) (2.6)Amortization of restricted stock 33.7 23.8 11.0
Balance, End of year $ (62.7) $ (46.0) $ (28.9)
Total Shareholders’ Equity $ 6,107.5 $5,155.4 $5,030.6
1Includes 16.9 million Common Shares purchased pursuant to a “Dutch auction” tender offer in 2004; these shares were purchased at a price of $88 per share, for a total cost of $1.5 billion.
There are 20.0 million Serial Preferred Shares authorized; no such shares are issued or outstanding.
There are 5.0 million Voting Preference Shares authorized; no such shares have been issued.
See notes to the complete consolidated financial statements included in the Company’s 2005 Annual Report to Shareholders, which is attached as an Appendix to the Company’s 2006 Proxy Statement.
{Consolidated Statements of Changes in Shareholders’ Equity}
THE PROGRESSIVE CORPORATION AND SUBSIDIARIES
(millions–except per share amounts)
.33
||||
|
||
||
||
||
||
||
|| | | | |
||
||
||
||
||
||
||
|||

.35
||||
|
||
||
||
||
||
||
|| | | | |
||
||
||
||
||
||
||
|||
THE PROGRESSIVE CORPORATION AND SUBSIDIARIES
{Consolidated Statements of Cash Flows}
(millions)
For the years ended December 31, 2005 2004 2003
CASH FLOWS FROM OPERATING ACTIVITIESNet income $ 1,393.9 $ 1,648.7 $ 1,255.4Adjustments to reconcile net income to net cash provided by operating activities:
Depreciation 92.4 99.4 89.3Amortization of fixed maturities 189.6 168.9 103.2Amortization of restricted stock 33.7 23.8 11.0Net realized (gains) losses on securities 37.9 (79.3) (12.7)Changes in:
Unearned premiums 227.1 213.3 590.4Loss and loss adjustment expense reserves 374.7 709.3 763.3Accounts payable, accrued expenses and other liabilities 49.5 70.2 124.5Prepaid reinsurance premiums 16.1 (5.1) (18.0)Reinsurance recoverables (24.1) (110.3) (55.6)Premiums receivable (213.5) (207.6) (336.8)Deferred acquisition costs (12.6) (19.9) (48.8)Income taxes (140.0) 98.5 (.1)Tax benefits from exercise/vesting of stock-based compensation 41.2 44.3 44.0Other, net (71.9) 8.3 (72.2)
Net cash provided by operating activities 1,994.0 2,662.5 2,436.9
CASH FLOWS FROM INVESTING ACTIVITIESPurchases:
Fixed maturities (9,154.4) (6,686.3) (9,491.6)Equity securities (852.9) (678.3) (771.2)Short-term investments – auction rate securities (7,935.3) (6,890.1) (4,044.4)
Sales:Fixed maturities 7,068.6 5,885.7 7,189.3Equity securities 152.3 876.3 337.8Short-term investments – auction rate securities 8,053.4 6,552.4 3,907.6
Maturities, paydowns, calls and other:Fixed maturities 572.6 639.7 779.2Equity securities 114.4 78.2 91.7
Net sales (purchases) of short-term investments – other 491.8 (390.9) 56.6Net unsettled security transactions 126.6 (43.2) (37.1)Purchases of property and equipment (219.3) (192.0) (171.1)Sale of property and equipment 36.1 — —
Net cash used in investing activities (1,546.1) (848.5) (2,153.2)
CASH FLOWS FROM FINANCING ACTIVITIESProceeds from exercise of stock options 44.2 51.7 50.0Payments of debt — (206.0) —Dividends paid to shareholders (23.7) (23.3) (21.7)Acquisition of treasury shares (482.8) (1,628.5) (316.8)
Net cash used in financing activities (462.3) (1,806.1) (288.5)Increase (decrease) in cash (14.4) 7.9 (4.8)Cash, Beginning ofyear 20.0 12.1 16.9Cash, End of year $ 5.6 $ 20.0 $ 12.1
See notes to the complete consolidated financial statements included in the Company’s 2005 Annual Report to Shareholders, which is attached as an Appendix to the Company’s 2006 Proxy Statement.
||||
|
||
||
||
||
||
||
|| | | | |
||
||
||
||
||
||
||
|||
.36
REPORT OF INDEPENDENT REGISTEREDPUBLIC ACCOUNTING FIRM
To the Board of Directors and Shareholders of The Progressive Corporation:We have audited, in accordance with the standards of the PublicCompany Accounting Oversight Board (United States), the con-solidated financial statements of The Progressive Corporation asof December 31, 2005 and 2004, and for each of the three years inthe period ended December 31, 2005, management’s assessmentof the effectiveness of the Company’s internal control over finan-cial reporting as of December 31, 2005 and the effectiveness of the Company’s internal control over financial reporting as of December 31, 2005; and in our report dated February 28, 2006, weexpressed unqualified opinions thereon. The consolidated finan-cial statements and management’s assessment of the effectivenessof internal control over financial reporting referred to above (notpresented herein) appear in The Progressive Corporation’s 2005Annual Report to Shareholders, which is attached as an Appen-dix to The Progressive Corporation’s 2006 Proxy Statement.
In our opinion, the information set forth in the accompanyingcondensed consolidated financial statements is fairly stated, inall material respects, in relation to the consolidated financial state-ments from which it has been derived.
Cleveland, OhioFebruary 28, 2006
INTERNAL CONTROL OVER FINANCIAL REPORTING
The Company’s management is responsible for establishing andmaintaining adequate internal control over financial reporting.Based on the Company’s evaluation under the framework in Internal Control — Integrated Framework issued by the Commit-tee of Sponsoring Organizations of the Treadway Commission(COSO), management concluded that the Company’s internal con-trol over financial reporting was effective as of December 31, 2005.The complete “Management’s Report on Internal Control overFinancial Reporting,” as required by Section 404 of The Sarbanes-Oxley Act of 2002 and applicable SEC regulations, along with therelated report of PricewaterhouseCoopers LLP, is presented in the2005 Annual Report to Shareholders, which is attached as an Appendix in the Company’s 2006 Proxy Statement.
CEO AND CFO CERTIFICATIONS
Glenn M. Renwick, President and Chief Executive Officer of The Progressive Corporation, and W. Thomas Forrester, VicePresident and Chief Financial Officer of The Progressive Corpo-ration, have issued the certifications required by Sections 302and 906 of The Sarbanes-Oxley Act of 2002 and applicable SECregulations with respect to the Company’s 2005 Annual Reporton Form 10-K, including the financial statements provided in thisReport and in the 2005 Annual Report to Shareholders, which isattached as an Appendix in the Company’s 2006 Proxy State-ment. Among other matters required to be included in those certifications, Mr. Renwick and Mr. Forrester have each certifiedthat, to the best of his knowledge, the financial statements,
and other financial information included in the Annual Reporton Form 10-K, fairly present in all material respects the financialcondition, results of operations and cash flows of the Companyas of, and for, the periods presented. See Exhibits 31 and 32 to the Company’s Annual Report on Form 10-K for the completeSection 302 and 906 Certifications, respectively.
In addition, Mr. Renwick submitted his annual certification tothe New York Stock Exchange (NYSE) on May 13, 2005, statingthat he was not aware of any violation by the Company of theNYSE corporate governance listing standards, as required by Section 303A.12(a) of the NYSE Listed Company Manual.

||||
|
||
||
||
||
||
||
|| | | | |
||
||
||
||
||
||
||
|||
.38
COMMON SHARES
The Progressive Corporation’s Common Shares (symbol PGR)are traded on the New York Stock Exchange. Dividends are cus-tomarily paid on the last day of each quarter. The 2006 quarterlydividend record dates, subject to Board approval, are as follows:March 10, June 9, September 8 and December 8.
Stock Price Dividends Quarter High Low Close Rate of Return per Share
20051 $ 92.49 $ 81.38 $ 91.76 $ .0302 100.88 87.50 98.81 .0303 107.30 93.70 104.77 .0304 124.90 103.02 116.78 .030
$ 124.90 $ 81.38 $ 116.78 37.9% $ .120
20041 $ 89.06 $ 80.68 $ 87.60 $ .0252 91.97 81.30 85.30 .0253 85.60 73.10 84.75 .0304 97.29 83.01 84.84 .030
$ 97.29 $ 73.10 $ 84.84 1.6% $ .110
SAFE HARBOR STATEMENT UNDER THE PRIVATE SECURITIESLITIGATION REFORM ACT OF 1995
Statements in this Summary Annual Report that are not histori-cal fact are forward-looking statements that are subject to certain risks and uncertainties that could cause actual events andresults to differ materially from those discussed herein. Theserisks and uncertainties include, without limitation, uncertaintiesrelated to estimates, assumptions and projections generally; inflation and changes in economic conditions (including changesin interest rates and financial markets); the accuracy and ade-quacy of the Company’s pricing and loss reserving methodolo-gies; pricing competition and other initiatives by competitors; theCompany’s ability to obtain regulatory approval for requestedrate changes and the timing thereof; the effectiveness of the Company’s advertising campaigns; legislative and regulatory developments; disputes relating to intellectual property rights;the outcome of litigation pending or that may be filed against the Company; weather conditions (including the severity and
frequency of storms, hurricanes, snowfalls, hail and winter conditions); changes in driving patterns and loss trends; acts ofwar and terrorist activities; the Company’s ability to maintainthe uninterrupted operation of its facilities, systems (includinginformation technology systems) and business functions; courtdecisions and trends in litigation and health care and auto repaircosts; and other matters described from time to time by the Company in releases and publications, and in periodic reportsand other documents filed with the United States Securities andExchange Commission. In addition, investors should be awarethat generally accepted accounting principles prescribe when acompany may reserve for particular risks, including litigation exposures. Accordingly, results for a given reporting period couldbe significantly affected if and when a reserve is established forone or more contingencies. Reported results, therefore, may appear to be volatile in certain accounting periods.

.39
||||
|
||
||
||
||
||
||
|| | | | |
||
||
||
||
||
||
||
|||
Annual Meeting The Annual Meeting of Shareholders will be held at the offices of The Progressive Corporation, 6671 BetaDrive, Mayfield Village, Ohio 44143 on April 21, 2006, at 10 a.m.eastern time. There were 3,895 shareholders of record on Decem-ber 31, 2005.
Principal Office The principal office of The Progressive Corpora-tion is at 6300 Wilson Mills Road, Mayfield Village, Ohio 44143.
Phone 440-461-5000Web site progressive.com
Customer Service and Claims Reporting For 24-hour customerservice or to report a claim, contact:
Personal LinesProgressive DirectSM
1-800-PROGRESSIVE (1-800-776-4737)progressivedirect.com
Drive® Insurance from Progressive1-800-925-2886driveinsurance.com
Commercial AutoProgressive Commercial1-800-895-2886progressivecommercial.com
Drive® Insurance from Progressive1-800-444-4487driveinsurance.com
Counsel Baker & Hostetler LLP, Cleveland, Ohio
Transfer Agent and Registrar If you have questions about a specific stock ownership account, write or call: National CityBank, Dept. 5352, Corporate Trust Operations, P.O. Box 92301,Cleveland, Ohio 44193-0900. Phone: 1-800-622-6757 or e-mail:[email protected].
Whistleblower Protections The Company will not retaliate againstany officer or employee of the Company because of any lawfulact done by the employee to provide information or otherwiseassist in investigations regarding conduct that the employee reasonably believes to be a violation of Federal Securities Lawsor of any rule or regulation of the Securities and Exchange Commission or Federal Securities Laws relating to fraud againstshareholders. View the complete Whistleblower Protections atprogressive.com/governance.
Accounting Complaint Procedure Any employee or other inter-ested party with a complaint or concern regarding accounting,internal accounting controls or auditing matters relating to theCompany may report such complaint or concern directly to theChairman of the Audit Committee, as follows:Philip A. Laskawy, Audit Committee Chairman, c/o Ernst &Young, 5 Times Square, New York, New York 10036, Phone: 212-773-1300, e-mail: [email protected].
Any such complaint or concern also may be reported anony-mously over the following toll-free Alert Line: 1-800-683-3604.The Company will not retaliate against any individual by reason of his or her having made such a complaint or reportedsuch a concern in good faith. View the complete procedures at progressive.com/governance.
Corporate Governance The Company’s Corporate GovernanceGuidelines and Board committee charters are available at: progressive.com/governance, or may be requested in print bywriting to: The Progressive Corporation, Investor Relations, 6300Wilson Mills Road, Box W33, Mayfield Village, Ohio 44143.
Charitable Contributions Progressive supports qualified not-for-profit organizations working to reduce the human trauma andeconomic cost of auto accidents. In addition, The Progressive Insurance Foundation, a private charitable foundation that receives contributions from the Company, contributes on amatching basis to qualified tax-exempt organizations that are financially supported by Progressive employees.
Shareholder/Investor Relations The Progressive Corporation doesnot maintain a mailing list for distribution of shareholders’ reports.To view Progressive’s publicly filed documents, shareholders canaccess the Company’s Web site: progressive.com/sec. To view itsearnings and other releases, access progressive.com/investors.
To request copies of public financial information on the Company, write to: The Progressive Corporation, Investor Relations, 6300 Wilson Mills Road, Box W33, Mayfield Village,Ohio 44143, e-mail: [email protected] or call: 440-395-2258.
For financial-related information, call: 440-395-2222 or e-mail: [email protected].
For stock ownership account information, call National City Bank: 1-800-622-6757 or e-mail: [email protected].
For all other Company information, call: 440-461-5000 or e-mail: [email protected].
Interactive Annual Report The Progressive Corporation’s 2005 Annual Report, in an interactive format, can be found at: progressive.com/annualreport.
{Corporate Information}

DIRECTORS
Charles A. Davis3,5,6
Chief Executive Officer, Stone Point Capital LLC
(private equity investing)
Stephen R. Hardis2,4,5,6
Lead Director,Axcelis Technologies, Inc.
(manufacturing)
Bernadine P. Healy, M.D.3,6
Medical & Science Columnist,U.S. News & World Report
(publishing)
Jeffrey D. Kelly2,4,6
Vice Chairman andChief Financial Officer,National City Corporation(commercial banking)
Philip A. Laskawy1,6
formerly Chairman andChief Executive Officer,Ernst & Young LLP(professional services)
Peter B. Lewis2, 7
Chairman of the Board
Norman S. Matthews3,5,6
Consultant,formerly President,Federated Department Stores, Inc.(retailing)
Patrick H. Nettles, Ph.D.1,6
Executive Chairman,Ciena Corporation(telecommunications)
Glenn M. Renwick2
President and Chief Executive Officer
CONTACT NON-MANAGEMENT DIRECTORS
Interested parties have the ability to contact the non-managementdirectors as a group by sending a written communication clearlyaddressed to the non-management directors and sent to any ofthe following:
Peter B. Lewis, Chairman of the Board, The Progressive Corpo-ration, 6300 Wilson Mills Road, Mayfield Village, Ohio 44143or e-mail: [email protected].
Philip A. Laskawy, Chairman of the Audit Committee, The Progressive Corporation, c/o Ernst & Young, 5 Times Square,New York, New York 10036 or e-mail: [email protected].
Charles E. Jarrett, Corporate Secretary, The Progressive Corpo-ration, 6300 Wilson Mills Road, Mayfield Village, Ohio 44143or e-mail: [email protected].
The recipient will forward communications so received to thenon-management directors.
Donald B. Shackelford4,6
Chairman,Fifth Third Bank, Central Ohio(commercial banking)
Bradley T. Sheares, Ph.D.1,6
President,U.S. Human Health Divisionof Merck & Co., Inc.(health care)
1Audit Committee member2Executive Committee member3Compensation Committee member4Investment and Capital Committee member
5Nominating and GovernanceCommittee member
6Independent director7Non-executive chairman
CORPORATE OFFICERS
Glenn M. RenwickPresident and Chief ExecutiveOfficer
W. Thomas ForresterVice President andChief Financial Officer
Charles E. JarrettVice President, Secretary and Chief Legal Officer
Thomas A. King Vice President and Treasurer
Jeffrey W. BaschVice President and Chief Accounting Officer
Peter B. LewisChairman of the Board(non-executive)
{Directors and Officers}|||
||
||
||
||
||
||
||
|| | | | |
||
||
||
||
||
||
||
|||
.40

ART CREDITS
.03 Martí Cormand, Undercutting Sella
.06 Beth Campbell, See through the changes
.11 Randall Sellers, Untitled
.12 Ben Peterson, Time’s Arrow, Time’s Cycle
.15 Daina Higgins, The Entropy of Memory
.16 Russell Nachman, Untitled 1 2006
.18 Andrea Way, Piscean Isle (detail)
.22 Carol K. Brown, Untitled
.24 Shaun O’Dell, Talk not to me of blasphemy, man; I’d strike the sun if it insulted me (detail)
.27 Ben Peterson, Spill
.31Robyn O’Neil, The cradle above an abyss
.34 David Wetzl, Spectrum Navigator II
.37 Joan Linder, Untitled (Looking at the Moon Without Glasses On)
©2006 The Progressive CorporationDesign: Nesnadny + Schwartz, Cleveland + New York + TorontoPrinting: AGS Custom Graphics
The paper in this annual report is recycled and recyclable.

6300 WILSON MILLS ROAD MAYFIELD VILLAGE, OHIO 44143 440.461.5000 progressive.com®