The predictability of clinical variables in childhood for ...
39
Örebro University Institution for health and medical science Program: Biomedicine and methods in Medical Diagnostics 120 ECTS, Imaging and functional medicine Course: Thesis project medicine 30 ECTS Date: 150526 The predictability of clinical variables in childhood for cardiac structure, cardiac function and carotid intima media thickness in young obese adults Author: Walli Hanna Supervisor: Maria Westerståhl Lektor, with dr in physiology Karolinska institutet, Institution for laboratory medicine, Department of clinical physiology, C188, Karolinska university hospital Huddinge
Transcript of The predictability of clinical variables in childhood for ...
Örebro University
Institution for health and medical science
Program: Biomedicine and methods in Medical Diagnostics 120 ECTS,
Imaging and functional medicine
Course: Thesis project medicine 30 ECTS
Date: 150526
The predictability of clinical variables in
childhood for cardiac structure, cardiac
function and carotid intima media thickness
in young obese adults
Author: Walli Hanna
Supervisor: Maria Westerståhl Lektor, with dr in physiology
Karolinska institutet, Institution for laboratory medicine, Department of clinical
physiology, C188, Karolinska university hospital Huddinge

ABSTRAKT
The aim of the study was to identify if there were any clinical variables that in obese
children could predict cardiac structure and function or carotid intima media thickness
(cIMT) in young adulthood.
Echocardiographic measurements were performed in 19 obese children and adolescents.
5-12 years later echocardiographic measurements were repeated and also cIMT
measurements were performed. Clinical variables and fasting venous blood samples
were taken.
Unfavorable cardiac structure and function in young adulthood was associated with
unfavorable glucose levels and high blood lipids, blood pressure and body size in
childhood. cIMT in young adulthood were positively correlated to systolic blood
pressure, total cholesterol, triglycerides and triglycerides /high density lipoprotein-
cholesterol in childhood.
The conclusion of this study was that higher blood lipids and more unfavorable glucose
level in childhood could predict for lower values of cardiac function and of higher
values of cardiac structure, cIMT and cIMA in young adulthood.
Keywords
Childhood obesity, Echocardiography, carotid intima media thickness, longitudinal
study, cardiovascular risk factors

Content 1 Introduction ................................................................................................... 1
2 Material and method ..................................................................................... 4
2.1 study population .................................................................................. 4
2.2 Method ................................................................................................ 4
2.2.1 Anthropometric variables ....................................................... 4
2.2.2 Blood pressure measurements ............................................... 5
2.2.3 Blood chemistry testing/ biochemical parameters ................ 5
2.2.4 Oral glucose tolerance test .................................................... 5
2.2.5 Echocardiographic ................................................................. 6
2.2.6 Carotid Brightness-mode ultrasound ..................................... 9
2.3 Statistical analysis ............................................................................. 13
2.4 Ethical application ............................................................................ 13
3 Results ......................................................................................................... 14
3.1 Clinical, antropometric and biochemical variables .......................... 14
3.2 Echocardiographic parameters ......................................................... 17
3.3 Correlation between echocardiographic parameters from young adulthood
And variables from childhood .................................................................... 19
3.4 Correlation between cIMT respective cIMA from young adulthood and
variables from childhood ............................................................................ 19
4 Discussion ................................................................................................... 20
5 Acknowledgement ...................................................................................... 26
6 References ................................................................................................... 27
7 Attachments ................................................................................................ 31

ABBREVIATION
A-wave Velocity of inflow in mitral with atrial contraction
BMI Body mass index
BP Blood pressure
BSA Body surface area
CCA Common carotid arteries
cIMA Cross sectional carotid intima-media thickness area
cIMT Carotid intima-media thickness
CV Variations coefficient
EAT Epicardial adipose tissue
ECG Electrocardiogram
E-wave Velocity of mitral early filling
HDL-C High density lipoprotein- cholesterol
Hba1c Hemoglobin a1c
IVSd Intra ventricular septum diastole diameter
LAd Left atrial diameter
LDL-C low density lipoprotein- cholesterol
LV Left ventricular
LVED Left ventricular end diastole diameter
LVES Left ventricular end systolic diameter
LVM Left ventricular mass
LVPWd LV posterior wall in diastole
M-mode Motion-mode
OGTT Oral glucose tolerance test
PVD Pulmonary velocity venous flow during diastole
PVS Pulmonary velocity venous flow during systole
SDS Standard deviation score
TG Triglycerides
1
1 INTRODUCTION
Obesity in childhood is a public health problem and has been increasing in most of the
developed countries (1). Obesity appears to be occurring worldwide. Body mass index
(BMI) is one way to evaluate obesity. Obesity in childhood is associated with
cardiovascular risk later in life (2). When a child is evaluated for obesity, it is important
to evaluate the risk factors that could predict future cardiovascular structure and
function.
The prevalence of high blood pressure among adolescents is increasing, in concert with
the childhood obesity epidemic, and the increases of both high blood pressure and
obesity are higher among children. At higher blood pressure the cardiac works to a
higher resistance and the cardiac muscles size can increase which leads to hypertrophy.
Hypertension and obesity are both linked and leading to left ventricular (LV)
hypertrophy and dilatation (3, 4). LV hypertrophy is a major mechanism of cardiac
adaptation to hemodynamic overloads on the heart or contractile failure of the
myocardium (5). LV hypertrophy, left atrial (LA) enlargement and subclinical
impairment of LV function could lead to forms of cardiac dysfunction and heart failure
later in life (6).
Cardiac structure and function can be examined by ultrasound. Ultrasound of the heart
is a non-invasive method called echocardiography and has been used since the
beginning of 1950. In an echocardiographic exam the cardiac structure and function is
evaluated (7).
Left ventricular mass (LVM) is calculated and used to evaluate LV diastolic function
(8). The cardiac size varies with difference in body size. That is why LVM need to be
adjusted for different body size to identify if it is pathological or normal. LVM- index
could be correct by height raise to 2.7
for children and adults (9). Epicardial adipose
tissue (EAT) thickness represents cardiac and visceral adiposity is associated with the
amount of visceral fat and it has been suggested as a new cardiometabolic risk factor
(10).

2
A thicker cardiac structure could lead to dilatation and hypertrophy of the LV which
leads to an uneven contraction of the cardiac. A bad cardiac function could lead to
lower systolic function of LV and a diastolic dysfunction. That is why it is important to
not only evaluated cardiac structure but also cardiac function.
Several studies in children have reported significant bigger LA-diameter (d) and LV
dimension in children with obesity compared to children without obesity (3, 11-13).
Children with obesity had bigger and thicker cardiac structure compared to children
with a normal BMI (3, 14). That indicate LV-hypertrophy due to obesity begins in
childhood. BMI have an association with LVM in normal weight children and adults
and also in children and adult with hypertension (15, 16).
Arteriosclerosis is an early process beginning in childhood, with fatty streaks observed
in aorta, the coronary and carotid arteries of children and adolescents (17). The main
cardiovascular risk factors in pediatrics for atherogenic development are known (17).
The most relevant is overweight and obesity that has been increasing in most of the
developed countries (1). At the same time obesity-related comorbidities increased such
as hypertension, secondary dyslipidemia, and changes in glucose metabolism could lead
to increased carotid intima- media thickness (cIMT) of the carotids far wall (17). The
wall of the cIMT can be calculated and used for diagnosis of early atherosclerosis (18).
Increase of cIMT is a risk factor for stroke in adulthood, that’s why cIMT has been
examed by ultrasound since 1986 (18).
cIMT is only the intima-media thickness of the two dimensional image where the
measurement is performed and that’s why a cross sectional carotid intima-media area
(cIMA) can also be used (19).
3
Clinical variables as BMI, blood pressure, lipid levels, glucose and insulin could affect
the cardiac structure, function, cIMT and cIMA. It is known that low high density
lipoprotein- cholesterol (HDL-C) and high low density lipoprotein- cholesterol (LDL-
C), or high triglycerides (TG) are related to cardio-cerebrovascular disease (20).There is
no study that has investigated if clinical variables from childhood affect the cardiac
structure, function and cIMT and cIMA in young obese adults.
The aim of the study is to identify if there are clinical variables in childhood that can
predict cardiac structure and function, cIMT and cIMA in young adulthood among
patients with obesity.

4
2 MATERIAL AND METHOD
2.1 STUDY POPULATION
The study population consisted of 19 obese children and adolescents (11 women, 52%).
The subjects came twice, the first time for baseline measurements and the second time
for the follow-up measurements. The baseline measurements were the first exam when
the subjects were in their childhood and the age was between 9-17 years old (table 1).
The follow up measurements were performed after 5-12 years and they subjects were in
their young adulthood and the age was between 18-28 years old. All the subjects were
overweight or obese at baseline and were patients at the Rikscentrum at Karolinska
hospital in Huddinge, Stockholm.
All subjects who were included lived in Stockholm municipality and had performed the
baseline and the follow-up echocardiographic exams between the years 1999 to 2014.
The study population had done a complete exam week at the baseline tests and was
invited for a follow up exam.
2.2 METHOD
2.2.1 Anthropometric variables
Anthropometric variables such as weight and height were taken by experienced nurses.
They measured height (Ulmer Stadiometer, Ulm, Germany) and weight (Vetek model
T1-2001, Stockholm Sweden). BMI was calculated by (weight [kg] / height [m2]). BMI
was used for 18 years and older. BSA was calculated as BSA= SQRT ((height [cm]) x
(weight [kg])/3600 (21). Obesity in adulthood was classified into three degrees: obesity
degree I correspond to BMI 30-34.9, obesity degree II BMI 35-39.9 and extreme
obesity is a BMI >40 (22). BMI standard deviation score (SDS) for children was
calculated according to a Swedish population reference from Karlberg et al. (23).
BMI SDS takes into account the age and gender differences in childhood BMI. BMI
SDS = 0 means normal weight, the limit for obesity was approximately +2.5 BMI SDS
and BMI SDS +3.5 is the level for extreme obesity (24).
5
2.2.2 Blood pressure measurements
Blood pressure was measured after ten minutes rest in lying position. The cuff size was
based on the circumference of the upper arm. The blood pressure measurements were
repeated two to three times and the average was obtained for the final value.
The cut- off points for hypertension for the baseline measurements took account for
gender, age and length after Krmar et al (25). The cut-off points for hypertension for the
follow-up measurements were systolic blood pressure 140 mmHg and systolic blood
pressure 90 mmHg (26).
2.2.3 Blood chemistry testing/ biochemical parameters
Venous bloods were taken in the morning after a previous fasting since midnight and
were analyzed for biochemical parameters by the hospitals accredited chemistry
laboratory (Karolinska University hospital, Huddinge Stockholm) with the standard
methods. Fasting glucose (mmol/L), insulin (pmol) total cholesterol (mmol/L), TG
(mmol/L) HDL-C (mmol/L), LDL-C (mmol/L) and hemoglobin a1c (Hba1c)
(mmol/mol) were analyzed. The ratio TG/ HDL- C was calculated (27).
Cut off points for total cholesterol for children were > 5.2 mmol/l (28), TG for children
>1.7 mmol/l (28), HDL-C for children < 1.03 mmol/l for boys all ages and girls < 15
years and 1.29 mmol/l girls aged > 16 years (28) and LDL-C for > 3.4 mmol/l (28).
Cut-off points for pathological values for children and young adults was fasting glucose
> 6.1 mmol/l (29), for insulin > 105 pmol/l and for Hba1c > 42 mmol/l according to
Karolinska university hospital. Cut-off points for pathological values for young adults
for total cholesterol > 6.1, for TG > 2.6 mmol/l, for HDL-C > 2.7 mmol/L and for LDL-
C > 4.3 mmol/l according to Karolinska university hospital.
2.2.4 Oral glucose tolerance test
Oral glucose tolerance test (OGTT) was started by taken fasting venous blood which
was analyzed for venous plasma glucose and is the same as fasting glucose. The patient
drank 1,75g/kg glucose or 75 g glucose, maximum was 75g glucose. After 2 h the
ingestion of glucose venous blood was taken and analyzed again.

6
The cut-off point for pathological OGTT in children and adults with fasting plasma
glucose is > 6.1 mmol/l. Cut off points for pathological OGTT after 2h in children and
adults for plasma glucose was > 7.8 mmol/l (30).
2.2.5 Echocardiographic
Echocardiographic examinations were performed in all included subjects. The subjects
were studied while they were lying in left supine position. The baseline
echocardiographic examines were performed when the subjects were in there
childhood. The baseline exams were performed by three different experienced
biomedical laboratory scientists (BMA). The follow-up echocardiographic examination,
was performed when the subjects were in there young adulthood and was performed by
another experienced BMA.
Two- dimensional and Doppler- echocardiographic examinations were performed with
two ultrasound scanners. Siemens acuson seqouia 128 was used for baseline
echocardiographic exam and GE Vivid E9 was used for follow-up echocardiographic
exam with vector transducer with 3-megahertz and an electrocardiogram (ECG) was
simultaneously recorded with three electrodes in upper extremity.
All the echocardiographic images were stored and the measurements were measured
afterwards in Echopac program by the author.
Cardiac structure was obtained from a two dimensionally parasternal long-axis view
and all the measurements were measured from leading edge to leading edge. Measures
of cardiac structure included the thickness of the wall between the right and left
ventricle (intra ventricular septum in diastole, IVSd) the diameter of the left ventricle in
end diastole (LVED) and end systole (LVES), and the LV posterior wall in diastole
(LVPWd), LA-diameter (d) was measured in systole and aorta roth diameter (Aod) in
systole when LAd and Aod were biggest (8).
LA-area (a) was obtained and measured from four chamber view apical long axis view
in systole when the LA was biggest.

7
LVM (g) was calculated as standard formula from American society of
echocardiography (ASE) LVM = ( 0,8 x [1,04 x IVSd+ LVEdD + LVPWd)3 - LVEdD
3
] + 0,6) all the measurement was in mm and then total was divided in 1000 to have it in
g (8). LVM- index was calculated by divided LVM (g) over height (m) 2.7
to consider
body size (31). LVM-hypertrophy was defined as > 51 g/m2.7
for both children and
adults (9).
EAT thickness was measured on the free wall of the right ventricular from the
parasternal long-axis view figure 1. The EAT was identified as an echo-free space in
pericardial layers on two-dimensional echo in end-systole (figure 1). Normally EAT is
not visual but visual EAT over two mm is pathological both in childhood and young
adulthood.
Figure 1. Echocardiographic epicardial fat thickness. Epicardial fat thickness (red
dashed shape) is identified as the echo-free space between the outer wall of the
myocardium and the visceral layer of pericardium in the parasternal long-axis view in
end-systole at the point on the free wall of the right ventricle (32).
Digital imaging has also made it possible to reconstruct diverse motion (m)-mode
planes from two dimensional images (anatomical M-mode). Cardiac function was
assessed by following parameters anatomical M-mode and was used on measurement of
mitral annular plane systolic excursion (MAPSE). MAPSE is a simple way to asses LV
systolic function in adults and children (33, 34). MAPSE were performed in septal (S)-
8
and lateral (L) wall in apical 4 chamber view. The cursor was placed at the free septal
and lateral wall of mitral annulus. The maximal MAPSE was determined by the total
excursion of mitral annulus from the highest point after atrial ascent to the lowest point
of descent during ventricular systole.
Anatomical M-mode was also used to tricuspid annular plane systolic excursion
(TAPSE) which is a tool to analyze the systolic function of right ventricular (34). The
cursor was placed at the free wall of tricuspid annulus. The maximal TAPSE was
determined by the total excursion of the tricuspid annulus from its highest position after
atrial ascent to the lowest point of descent during ventricular systole. Only anatomical
M-mode was used both in baseline and follow-up measurements.
From the pulsed wave Doppler in 4 chamber apical view mitral and pulmonary inflow
velocities were obtained. The cursor sample volume was placed between the mitral
leaflet tips during diastole (open). The mitral inflow velocity in early diastole (E-wave)
and mitral inflow velocity of atrial contraction (A-wave) were measured and E/A- ratio
were calculated.
The pulmonary velocity venous inflow during systole (PVS) and diastolic (PVD), were
measured. The cursor sample volume was placed over the upper right pulmonary vein
in a 4 chamber apical view and PV S/D-ratio was calculated.
Z-score for, IVSd, LVEDd, LVEDSd, Aod and LAd were calculated. A regression line
took account the BSA and the echocardiographic parameters in cm which gave the z-
score (35).
This technique below described in detail by Cole (36) is able to deal effectively with
skewness and heteroscedasticity in the data. Briefly, the method generates a set of 3
curves for each of λ (L, the power transformation), µ (M, the mean), and σ (S, the
coefficient of variation) relative to height, which are then used to create centile curves.
From these curves SD value is obtained.
LVM z score was calculated as standard formula z-score= [(LVM (g) /M)L
-1]/(Lx S)
(37). L, M, S is explained above.

9
TAPSE z-score takes in account for the effects of age and BSA (38).
Limit values for pathologic in echocardiographic parameters differs in childhood and
young adulthood. Limit values was dependent of age, gender and BSA that is why
every subject have different limit values. An evaluation of pathologic
echocardiographic parameters was done separately for each subject in childhood and
young adulthood.
All echocardiographic images were used and image quality was evaluated as good,
decent or bad. Because the examiner used two different brands of ultrasound scanners
which gave difference in image quality. The echocardiographic images were evaluated
as good if the cardiac structure was distinct and visible in all the images and decent if
the cardiac structure were visible in most of the images. The echocardiographic images
were evaluated as bad when there were difficulties to see the cardiac structure.
Most of the echocardiographic images from childhood had decent quality (68%) and
bad (21%) the rest were good (11%).
Most of the echocardiographic image qualities from young adult hood were good (53%)
and decent (42%) and the rest were bad (5%).
2.2.6 Carotid Brightness-mode ultrasound
Carotid Brightness-mode ultrasounds were performed when the subjects were in young
adulthood, on the carotids with a duplex scanner (Siemens Acuson Sequoia 512) with
linear transducer (6L3) with 6 megahertz. All carotid examines were performed by the
same experienced BMA. The subject was lying on their back, and an ECG with three
electrodes was connected to the upper extremity. An ultrasound image was taken on the
right and the left CCA with visual far wall of CCA one- two cm below the carotid
bifurcation, using the manual cursor placement technique. The ultrasound image was
frozen on R-tagg ECG or in systole depending on when cIMT is as thickest (1). Three
different ultrasound image was saved when the far wall of cIMT was thickest (visual
evaluation) and were burned to a CD and afterwards be analyzed thru a computer
system (39).
10
cIMT and lumen diameters were measured with the ultrasound pictures from the CD
which was analyzed with Artery Measurement System II program (39). The program
had an auto detection of echo structures and manually correcting could be done by the
operator. Analyzes was performed by the author. cIMT was defined from leading edge
of intima lumen-echo to leading edge of media-adventitia echoon the far wall. Lumen
diameter was the space between leading edge of intima lumen echo of near wall and
leading edge of intima lumen echo on the far wall (figure 2) (40, 41). The
measurements of cIMT were made in a 10 mm long segment of distal CCA. The
program gave mean-, minimum- and maximum value of cIMT and lumen diameter
(39).
A mean value of cIMT was calculated by taking right and left cIMT and dividing it to
two.

11
Figure 2. Illustrate of correlation between anatomical and echo graphic picture of
the carotid artery. All measurements were performed leading edge to leading edge.
The figure illustrates near wall intima and media-adventitia. Measurements of intima-
media thickness were performed in the far wall. Lumen diameter measured from point 3
to 5. Leading edge echo on the far wall for intima-lumen= 3; leading edge on far wall of
intima lumen= 5; leading edge on far wall of media-adventitia=7 (41).

12
To compensate the effect of arterial stretch on the wall thickness because of difference
blood pressure between subjects was cIMA calculated by using the formula 3.14
*[(lumen diameter *0.5+cIMT)2]-( lumen diameter *0.5)
2] (19) (figure 3).
Figure 3. Illustrate of an anatomical cross sectional carotid intima media area
(cIMA). cIMA can be calculated after measured carotid intima-media thickness.
To evaluate how well the author measurements of cIMT and lumen diameter
corresponded to the experienced BMA measurements of cIMT and lumen diameter ten
subjects were randomly chosen. Both author and the experienced BMA measured and
the result were blind to the author.
Coefficient of variation (CV) for cIMT was 5.4% and for lumen diameter 3.2%. It
means that the variation between the experienced BMA measurements and the author’s
measurements is very small. Because the CV is very low it does not affect the
measurements variability.

13
2.3 STATISTICAL ANALYSIS
The Statistical Package for the Social Sciences version 22.0 (SPSS IBM) for Windows
was used for statistical analyzes. All normal distributed data were expressed as mean ±
standard deviation (SD). Data with skew distribution were shown as median (25
percentile – 75 percentile). Paired sample T-test was used to normal distributed data and
Wilcoxon test was used to skew distributed data to see differences in variables between
baseline when the subjects were in there childhood and follow up when the subjects
were in there young adulthood.
Normally distributed data was ANOVA used and skew distributed data was Spearman
rank correlation used for correlation analysis. With a univariat ANOVA and Spearman
rank correlation were the correlation tested between echocardiographic parameters,
cIMT respective cIMA from young adulthood and gender, weight, BMI sds, fasting
glucose, insulin, total cholesterol, TG, HDL-C, LDL- C, Hba1c, OGTT0, OGTT 120
systolic- and diastolic blood pressure from childhood. Univariat ANOVA and
Spearman rank correlation was also used to tracking, to see correlation between
echocardiographic parameters from young adulthood and echocardiographic parameters
from childhood. P-value and correlation coefficient (r2) was presented.
CV was calculated to see the variability in the measurement of cIMT between the
author and the experienced BMA according to the formula CV= s*100/ x. The mean
value of cIMT from the experienced BMA and the mean value of cIMT from the
author= x, SD for the difference of interoperator =s were calculated according to
formula s= SD/√2.
A P value of <0.05 was considered statistically significant.
2.4 ETHICAL APPLICATION
The Ethical application of the study was done, approved and can be seen in, Dnr:
2010/1089-31/1. The subjects over 18 years and parents to subjects under 18 years old
had to sign consent. An ethical application was considered to be necessary because the
results of the echocardiographic exam, blood pressure and clinical variables with higher
pathological values will get a treatment if needed.

14
3 RESULTS
3.1 CLINICAL, ANTROPOMETRIC AND BIOCHEMICAL VARIABLES
Compared to childhood, at young adulthood the subjects were older, taller, weighed
more, and had higher blood pressure and fasting glucose level and lower LDL-C (table
1). There was no difference between childhood and young adulthood in levels of
insulin, total cholesterol, TG, HDL-C, TG/HDL-C, HbA1C, OGTT0 and OGT 120. The
only difference in gender were the BMI sds from childhood (p= 0.03) and in insulin
from young adulthood (p=0.02). There were not so many that had pathological clinical
values from childhood to young adulthood (table 2). However there were less with
hypertension, total cholesterol, TG and bad HDL- C in young adulthood.
In childhood all the subjects were overweight or obese. Five percent had a BMI sds<
2.5, 53 % a BMI sds < 3.5 and 42% a BMI sds > 3.5. Ten percent of the subjects in
adulthood were classified as having obesity grade I, ten percent as grade II, 37 % as
grade III and 42 % as extremely obese.

15
Table 1. Clinical anthropometrics, blood pressure and biochemical variables in childhood and
young adulthood with obesity.
Variables n Childhood n Young adulthood
p childhood/young adulthood
Age (years) 19 13.2 ± 2.3 19 22.7 ± 3.2
<0.001
Female gender (%) (F/M) 19 37/63
N/A
N/A
Height (cm) 19 165.9 ± 10.3 19 177.6 ± 9.6
<0.001
Weight (kg) ↕ 19 93.5 (78.3- 104.9) 19 132.3 (108.1-146.0)
<0.001
Body mass index sds 19 3.4 ± 0.51
N/A
N/A
Body mass index (kg/m²)
N/A 19 41.2 ± 9.9
N/A
Smoker/ Non smoker (%)
N/A 19 63/37
N/A
Systolic blood pressure (mmHg) 19 112.9 ± 0.8 19 121.1 ± 7.7
0.008
Diastolic blood pressure (mmHg) 19 66.3 ± 8.7 19 74.3 ± 6.9
0.001
Fasting Glucose (mmol/L) 19 5.3 ± 0.51 19 5.6 ± 0.40
0.05
Insulin (pmol/L) ↕ 19 97 (56.0-163.0) 16 118 (61.5-185.9)
0.71
Total Cholesterol (mmol/L) ↕ 19 3.7 (3.3-4.2) 19 3.6 (3.3- 4.6)
0.53
TG (mmol/L) ↕ 19 1.2 ± 0.5 19 1.1 ± 1.3
0.67
HDL -C (mmol/L) 16 0.98 ± 0.31 16 1.1 ± 0.33
0.06
19 1.2 ± 0.31 ¤
LDL-C (mmol/L) 16 2.6 ± 0.78 16 2.3 ±0.56
0.05
TG/HDL-C kvot ↕ 16 1.2 (0.58-2.0) 16 1.0 (0.46-3.53)
0.41
19 1.0 (0.53-1.8) ¤
HBa1C (mmol/mol) ↕ 15 36.4 (32.2-37.5) 15 33 (30.5-36.0)
0.09
OGTT0 14 5.5 ± 0.55 14 5.4 ± 0.67
0.47
18 5.3 ± 0.58 ¤
OGTT 120 13 6.7 ± 1.2 13 6.8 ± 1.7
0.68
18 6.5 ± 1.5 ¤
cIMT mean (mm)
- 17 0.494 ± 0.08
cIMA mean (mm²)
- 17 9.66 ±2.2
P= probability value; N/A= not applicable; TG= Triglyceride; HDL-C= high density lipoprotein cholesterol LDL-C= low density lipoprotein; Hba1C= Hemoglobin A1C; OGTT= oral glucose tolerance test 0 and 120 min; cIMT= carotid intima-media thickness; cIMA= cross sectional
intima-media area.
* Data is shown as mean ± SD if nothing else is showed
↕ Skew distributed data presented as median (25-75 percentile) and analyzed with Wilcoxcon
¤ Whole group
16
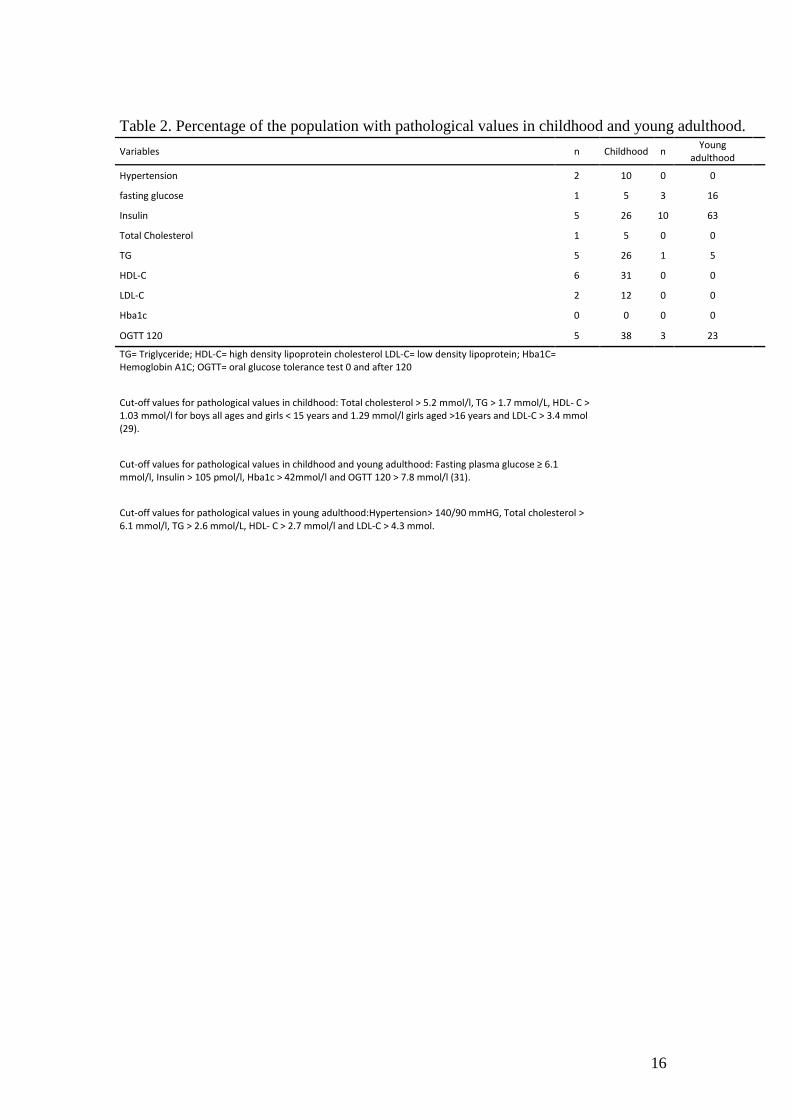
Table 2. Percentage of the population with pathological values in childhood and young adulthood.
Variables n Childhood n Young
adulthood
Hypertension 2 10 0 0
fasting glucose 1 5 3 16
Insulin 5 26 10 63
Total Cholesterol 1 5 0 0
TG 5 26 1 5
HDL-C 6 31 0 0
LDL-C 2 12 0 0
Hba1c 0 0 0 0
OGTT 120 5 38 3 23 TG= Triglyceride; HDL-C= high density lipoprotein cholesterol LDL-C= low density lipoprotein; Hba1C= Hemoglobin A1C; OGTT= oral glucose tolerance test 0 and after 120
Cut-off values for pathological values in childhood: Total cholesterol > 5.2 mmol/l, TG > 1.7 mmol/L, HDL- C >
1.03 mmol/l for boys all ages and girls < 15 years and 1.29 mmol/l girls aged >16 years and LDL-C > 3.4 mmol (29).
Cut-off values for pathological values in childhood and young adulthood: Fasting plasma glucose ≥ 6.1 mmol/l, Insulin > 105 pmol/l, Hba1c > 42mmol/l and OGTT 120 > 7.8 mmol/l (31).
Cut-off values for pathological values in young adulthood:Hypertension> 140/90 mmHG, Total cholesterol > 6.1 mmol/l, TG > 2.6 mmol/L, HDL- C > 2.7 mmol/l and LDL-C > 4.3 mmol.

17
3.2 ECHOCARDIOGRAPHIC PARAMETERS
Compared to childhood, at young adulthood most measures of cardiac structure had
become worse and cardiac function stayed normal (table 3 and 4).
Table 3. Echocardiographic parameters in childhood and young adulthood with obesity.
Parameters n Childhood n Young adulthood p childhood/young adulthood
Cardiac structure IVSd (mm) 18 9.6 ± 1.4 19 11.4 ± 1.5
0.002
LVED (mm) ↕ 18 48.5 (39-54) 19 53 (43-55)
<0.001
LVPWd (mm) 18 47.8 ± 3.9 19 8.7 ± 1.8
0.5
LVES (mm) 17 35.6 ± 2.6 19 39.2 ± 2.7
<0.001
LVM (g) 18 149.3 ± 38.5 19 195.5 ± 37.8
<0.001
LVM-index (g/m 2.7) 18 37.3 ± 7.1 19 41.4 ± 6.8
0.05
Lad (mm) ↕ 17 37 (33-41) 19 39 (36-46)
0.02
Aod (mm) 18 27.0 ± 2.6 18 29.6 ± 3.0
<0.01
LAa (m2) 18 15 (11-21) 18 17 (13-23)
0.05
EAT (mm) 17 1.7 ± 1.2 18 2.9 ± 1.0
<0.01 Cardiac function MAPSE septal (mm) ↕ 14 17.5 (15-23) 18 18 (15-21)
0.03
MAPSE lateral (mm) ↕ 13 18 (17-22) 16 18 (15-21)
0.57
TAPSE (mm) 12 21.4 ± 2.1 17 23.9 ± 2.4
0.10
E- wave (m2/s) ↕ 17 1.0 (0.8-1.3) 19 0.9 (0.7-1.4)
0.05
A-wave (m2/s) ↕ 17 0.5 (0.4-0.8) 19 0.5 (0.4-0.7)
0.40
E/A-ratio 17 1.9 ± 0.3 19 1.8 ± 0.3
0.03
PV S/D- ratio 3 1.2 ± 0.2 14 0.90 ± 0.30
N/A
IVSd= Intra ventricular septum diastolic diameter; LVED= left ventricular end diastolic diameter; LVPWD= Left ventricular posterior wall diastole; LVES= left ventricular systole diameter; LVM =left ventricular mass; Lad= left atrial diameter; Aod= aorta roth diameter; LAa = left atrial area; MAPSE= Mitral annular plane systolic excursion; TAPSE=tricuspid annular plane systolic excursion; E= velocity of mitral early filling; A= mean velocity of mitral inflow with atrial contraction; PVS= pulmonary velocity venous follow during systole; PVD= pulmonary; velocity venous flow during diastole; EAT= epicardial fat thickness; N/A= not applicable.
* Data is shown as mean ± SD if nothing else is showed ↕ Skew distributed data presented as median (25-75 percentile) and analyzed with wilcoxcon

18
Table 4. Percentage of the population with pathological echocardiographic values in childhood and young adulthood.
Parameters n Childhood n Young adulthood
Cardiac structure IVSd (mm) 0 0 8 42
LVEDd (mm) 0 0 9 48
PWd (mm) 2 11 1 5
LVESd (mm) 0 0 15 79
LVM-index (g/m 2.7) 1 6 1 5
Lad (mm) 0 0 6 32
Aod (mm) 3 18 3 6
LAa (cm2) 0 0 2 11
EAT (mm) 4 24 11 61
Cardiac Function MAPSE septal (mm) 0 0 0 0
MAPSE lateral (mm) 0 0 0 0
TAPSE (mm) 0 0 0 0
E/A-ratio 0 0 0 0
PV S/D-ratio 0 0 0 0
Ejection Fraction % 0 0 0 0
IVSd= Intra ventricular septum diastolic diameter; LVEDd= left ventricular end diastolic diameter; PWD= posterior wall diameter; LVESd= left ventricular systole diameter; LVM =left ventricular mass; Lad= left atrial diameter; Aod= aorta diameter; LAa = left atrial area; MAPSE= Mitral annular plane systolic excursion; TAPSE=tricuspid annular plane systolic excursion; E= velocity of mitral early filling; A= mean velocity of mitral inflow with atrial contraction; PVS= pulmonary velocity venous follow during systole; PVD= pulmonary; velocity venous flow during diastole; EAT= epicardial fat thickness.

19
3.3 CORRELATION BETWEEN ECHOCARDIOGRAPHIC PARAMETERS
FROM YOUNG ADULTHOOD AND VARIABLES FROM CHILDHOOD
Cardiac structures in young adulthood were positively correlated to weight, insulin,
total cholesterol, TG, LDL-C and systolic blood pressure in childhood (attachments 6
table 5). Cardiac function in young adulthood were positively correlated to height, BMI
sds, total cholesterol, TG, diastolic blood pressure and OGT0 in childhood. Cardiac
function in young adulthood was negatively correlated to HDL-C in childhood.
There was, with one exception, no tracking of the echocardiographic measurements.
Only A-wave in young adulthood was positively correlated to A-wave in childhood
(p=0.02 r2 =0.56).
3.4 CORRELATION BETWEEN CIMT RESPECTIVE CIMA FROM YOUNG
ADULTHOOD AND VARIABLES FROM CHILDHOOD
The mean value of cIMT in young adulthood was positively correlated to TG and total
cholesterol in childhood (attachments 6 table 5). Mean cIMA in young adulthood was
positively correlated to TG in childhood.

20
4 DISCUSSION
The aim of the study was to see if there was any correlation between clinical variables
in childhood and echocardiographic parameters, cIMT and cIMA in young obese adults.
For our knowledge this is the first study with this aim. The purpose of such a study is to
evaluate the meaningfulness of extended clinical testing in childhood obesity, for the
prediction of future cardiovascular disease.
Cardiac structure and function in young adulthood was associated with blood lipids,
glucose, blood pressure and body size in childhood.
cIMT and cIMA in young adulthood were positively correlated to systolic blood
pressure, total cholesterol, TG and TG/HDL-C in childhood.
LVM size varies with difference in body size. That is why LVM need to be adjusted for
different body size to identify if it is pathological or normal. That is why LVM-index is
calculated. Two studies showed that just LVM and not LVM-index was positively
correlated to BMI in children and adults with normal weight but also in children and
adults with hypertension (15, 16). In our study LVM or LVM-index in young adulthood
was not correlated to childhood BMI or weight. Maybe it is difficult to see a correlation
in LVM and BMI or weight because all the subjects were obese both in childhood and
young adulthood and most subjects had normal blood pressure in childhood.
In a study with 30 obese children after a significant weight reduction in 6 months, they
had significant decrease of LV wall dimension (which were IVSd, LVED, LVPWd and
LVES) lipid levels of total cholesterol, TG and LDL-C. But there was no difference in
cardiac function and fasting glucose after weight reduction (42).
In our study the participants had a significant weight increase from childhood to
adulthood. LV wall dimension in our study was significant higher and more often
pathological in young adulthood than in childhood. There were no differences in lipid
levels as total cholesterol, TG, HDL-C and TG/HDL-C between young adulthood and
childhood. But in childhood the parameters of lipid levels were more often pathological

21
compared to the value of lipid level that stayed approximately the same among the
years. High lipid levels in childhood had an affect later in time which is showed in
thicker cardiac structure in young adulthood.
Cabrera-Rego et al compared children and adolescents with obesity to a control group
with normal BMI. EAT was positively correlated to BMI, insulin and systolic blood
pressure (43).
Our study showed a significant increase in EAT among young adulthood compered to
childhood which has not been presented in any study before. Most EAT were
pathological in young adulthood. EAT from young adulthood had positively correlated
to insulin, weight and systolic blood pressure in childhood. In childhood 18 of the
participants had extreme obesity and that will lead to higher EAT, because the
correlation was positively strong.
There were three extreme values for one subject who weighed more and had higher
insulin in childhood and had higher EAT in young adulthood. When this values were
taken away from the analysis there was no longer a positively correlation between EAT
from young adulthood and weight and insulin from childhood.
There was one extreme value in OGTT in childhood, when this value was taken away
there was no correlation between MAPSE-L from young adulthood and OGTT in
childhood.
There was one extreme value in HDL-C in childhood, when this value was taken away
from the analysis there was no correlation between E- wave from young adulthood and
HDL-C in childhood. The extreme value drives the correlation. It gave a false high
correlation.
Systolic blood pressure was significantly higher in young adulthood than in childhood,
but only some of the participants were classified as having hypertension in childhood
and none in young adulthood. So still if the participants only have hypertension in
childhood it could predict to higher EAT. This finding needs to be evaluated in a larger
group of patients because the positive correlation was low. If the analyze was corrected
22
after BMI maybe would the positively correlation between blood pressure and EAT
disappeared because BMI and high blood pressure is correlated.
In the study were the obese children had a significant weight reduction they didn’t have
any difference in cardiac function after 6 months (42). In our study we did have a
significant increase in some parameters of cardiac function after 5- 12 years, but they
were normal values. Still, the measures of cardiac function in young adulthood were
positively correlated to several clinical variables in childhood, as weight, BMI sds, total
cholesterol, TG, LDL-C, Hba1c, fasting glucose, and diastolic blood pressure. Higher
and pathological clinical variables lead to worse cardiac function. One explanation
could be that in childhood when these variables were pathological it could affect
parameters of cardiac function but it was to short time for the cardiac function to
deteriorate to pathological levels.
As mention above cardiac function A-wave in young adulthood was positively
correlated to diastolic blood pressure in childhood. Higher diastolic blood pressure will
lead to higher velocity under mitral inflow during atrial contraction, because it will take
longer time for the atrial to contract because the cardiac have to contract to a higher
pressure. A- wave was not affected in young adulthood but because A-wave are a
component in E/A-ratio so, in the future this could lead to a converted E/A-ratio which
are a sign for a diastolic dysfunction. However, the cardiac structure was affected in
young adulthood.
All the variables above were not pathological and the correlations between cardiac
function and the clinical variables were not strong. Further research should be done with
longer follow-up time to see stronger correlations to variables of cardiac function. An
adjustment of weight change should have been done in the analyses then maybe the
correlation had been different.
Echocardiographic parameters in childhood did not correlate to echocardiographic
parameters in young adulthood. It is important to know that in children with obesity an
echocardiographic exam might not be necessary because it will not say anything about
the prognosis of cardiac structure and function in young adulthood. Maybe if the
analyses were adjusted for weight change the result had been different and maybe there

23
would have been a correlation between echocardiographic parameters in childhood and
to echocardiographic parameters in young adulthood. But it is important to take venous
blood to analyze lipid level and fasting glucose because these clinical variables can
predict future cardiac structure and function. Then treatment could be given to children
with high lipid levels and fasting glucose but also blood pressure to protect their
cardiac.
A study reported that children and adolescents with obesity were compared to two
groups, one of the groups was children with metabolic syndrome and the other was a
normal healthy control group. cIMT was significant higher in children with obesity
compared to the normal healthy control group. There was no significant difference in
cIMT between the children with obesity and the children with metabolic syndrome.
cIMT had correlation to systolic blood pressure, TG and HDL-C (44).
In our study we found similar correlations, but the difference was that the clinical
variables were from childhood and cIMT and cIMA from young adulthood. In the study
above the correlation was in children, so if children had higher systolic blood pressure,
TG and HDL-C then they would have thicker cIMT. Our study says that the clinical
variables systolic blood pressure, TG and HDL-C in childhood could predict for thicker
cIMT and cIMA in young obese adults.
Echocardiographic technique and the equipment have been developed so the
echocardiographic images from childhood were not as good as the echocardiographic
images from young adulthood. This could affect the result of the measurement because
the cardiac structure was not distinct. The risk for wrong measurement increases, either
way thicker or thinner.
From childhood all echocardiographic measurement were not measured because of bad
quality or missing echocardiographic images. Even all clinical variables were not taken
because there was no information of this study in that time. In the future if a follow-up
study is reported it would be better if all echocardiographic images were saved and all
variables were measured so statistical analysis could be made for example on PVS and

24
PVD. Also it could give more normal distributed data and maybe with stronger
correlations.
Anatomical M-mode had lower framerate which gave lower quality of the m-mode
picture. This led to more difficulty of doing the measurement and it could lead to
variation of the m-mode values.
Original LVM and LVM-index was calculated after m-mode measurements and not
measurements of two dimensional echocardiographic images. In this study there were
no M-mode measurements therefore two dimensional echocardiographic images were
used, which was also used in other reported studies. Clinically echocardiographic exams
do not use M-mode in a parasternal long axis, the use of a two dimensional image to
measure the dimension of the cardiac structure is more common.
Heartrate was a variable which could affect the results but didn’t. If the heart rate was
significant higher and pathological it could lead to pathological E/A-ratio but still be
normal. In our study no one had pathological E/A-ratio but still it is an important value
to have in a study when you validate the mitral inflow.
Insulin levels increase during puberty because they are growing which is normal (45).
In this report the subjects could be diagnostic as having pathological insulin but it could
be normal, because there were no information about puberty on the subjects. If there
were information about puberty level on the subject than it could be controlled for
difference in puberty level.
Smoking is a risk factor for cardiovascular diseases (46). Several where smokers in their
young adulthood but it are not consider in this study. Smoking could also be a clinical
variable in childhood that could predict for future cardiac structure, function, cIMT and
cIMA in young adulthood, but there was no information about smoking in their
childhood. Maybe if the subjects came back after 10-20 years later then it could be
possible to see if smoking in young adulthood could predict future for future cardiac
structure, function, cIMT and cIMA in adulthood.

25
The echocardiographic images from childhood and young adulthood were not blind for
the author. The best would have been if the echocardiographic images from childhood
and young adulthood were blind to have same condition for each measurement that was
made.
In the future it is important to keep following this study population to see how their
echocardiographic parameters and vascular health develops. Also use clinical variables
in childhood to later in life to see if they still could predict cardiac structure. Maybe it is
possible to see clinical variables in childhood that can predict cardiac function and
cIMT if the subject’s follow- ups after for example ten years and that in the test is
considered weight change.
The conclusion of this study was that higher lipid and attenuated glucose levels in
childhood could predict for higher values of cardiac structure, cIMT and cIMA in
young adulthood, 5-12 years later.

26
5 ACKNOWLEDGEMENT
I want to thank my supervisor Maria Westerståhl, senior lecturer, and Med dr in
physiologi and Eva Maret MD and Med dr in fysiologi.
I also want to thank the people from Barnendokrinlab B62 Karolinska university
hospital (Huddinge, Stockholm) for getting some data for me.
27
6 REFERENCES
1. Jackson-Leach R, Lobstein T. Estimated burden of paediatric obesity and co-
morbidities in Europe. Part 1. The increase in the prevalence of child obesity in
Europe is itself increasing. Int J Pediatr Obes. 2006;1(1):26-32.
2. Freedman DS, Dietz WH, Srinivasan SR, Berenson GS. The relation of
overweight to cardiovascular risk factors among children and adolescents: the
Bogalusa Heart Study. Pediatrics. 1999;103(6 Pt 1):1175-82.
3. Mehta SK, Richards N, Lorber R, Rosenthal GL. Abdominal obesity, waist
circumference, body mass index, and echocardiographic measures in children
and adolescents. Congenit Heart Dis. 2009;4(5):338-47.
4. Messerli FH, Christie B, DeCarvalho JG, Aristimuno GG, Suarez DH,
Dreslinski GR, et al. Obesity and essential hypertension. Hemodynamics,
intravascular volume, sodium excretion, and plasma renin activity. Arch Intern
Med. 1981;141(1):81-5.
5. Badeer HS. BIOLOGICAL SIGNIFICANCE OF CARDIAC
HYPERTROPHY. Am J Cardiol. 1964;14:133-8.
6. Levy D, Garrison RJ, Savage DD, Kannel WB, Castelli WP. Prognostic
implications of echocardiographically determined left ventricular mass in the
Framingham Heart Study. N Engl J Med. 1990;322(22):1561-6.
7. Keidel WD. [New method of recording changes in volume of the human heart].
Z Kreislaufforsch. 1950;39(9-10):257-71. Uber eine neue Methode zur
Registrierung der Volumanderungen des Herzens am Menschen.
8. Lang RM, Badano LP, Mor-Avi V, Afilalo J, Armstrong A, Ernande L, et al.
Recommendations for cardiac chamber quantification by echocardiography in
adults: an update from the American Society of Echocardiography and the
European Association of Cardiovascular Imaging. J Am Soc Echocardiogr.
2015;28(1):1-39 e14.
9. de Simone G, Devereux RB, Daniels SR, Koren MJ, Meyer RA, Laragh JH.
Effect of growth on variability of left ventricular mass: assessment of allometric
signals in adults and children and their capacity to predict cardiovascular risk. J
Am Coll Cardiol. 1995;25(5):1056-62.
10. Gastaldelli A, Basta G. Ectopic fat and cardiovascular disease: what is the link?
Nutr Metab Cardiovasc Dis. 2010;20(7):481-90.
11. Koopman LP, McCrindle BW, Slorach C, Chahal N, Hui W, Sarkola T, et al.
Interaction between myocardial and vascular changes in obese children: a pilot
study. J Am Soc Echocardiogr. 2012;25(4):401-10 e1.
12. Yu JJ, Yeom HH, Chung S, Park Y, Lee DH. Left atrial diameters in overweight
children with normal blood pressure. J Pediatr. 2006;148(3):321-5.
13. Dhuper S, Abdullah RA, Weichbrod L, Mahdi E, Cohen HW. Association of
obesity and hypertension with left ventricular geometry and function in children
and adolescents. Obesity (Silver Spring). 2011;19(1):128-33.
14. Ozdemir O, Hizli S, Abaci A, Agladioglu K, Aksoy S. Echocardiographic
measurement of epicardial adipose tissue in obese children. Pediatr Cardiol.
2010;31(6):853-60.
15. Daniels SR, Loggie JM, Khoury P, Kimball TR. Left ventricular geometry and
severe left ventricular hypertrophy in children and adolescents with essential
hypertension. Circulation. 1998;97(19):1907-11.
28
16. Daniels SR, Kimball TR, Morrison JA, Khoury P, Witt S, Meyer RA. Effect of
lean body mass, fat mass, blood pressure, and sexual maturation on left
ventricular mass in children and adolescents. Statistical, biological, and clinical
significance. Circulation. 1995;92(11):3249-54.
17. Berenson GS. Childhood risk factors predict adult risk associated with
subclinical cardiovascular disease. The Bogalusa Heart Study. Am J Cardiol.
2002;90(10C):3L-7L.
18. Pignoli P, Tremoli E, Poli A, Oreste P, Paoletti R. Intimal plus medial thickness
of the arterial wall: a direct measurement with ultrasound imaging. Circulation.
1986;74(6):1399-406.
19. Lemne C, Jogestrand T, de Faire U. Carotid intima-media thickness and plaque
in borderline hypertension. Stroke. 1995;26(1):34-9.
20. Magnussen CG, Venn A, Thomson R, Juonala M, Srinivasan SR, Viikari JS, et
al. The association of pediatric low- and high-density lipoprotein cholesterol
dyslipidemia classifications and change in dyslipidemia status with carotid
intima-media thickness in adulthood evidence from the cardiovascular risk in
Young Finns study, the Bogalusa Heart study, and the CDAH (Childhood
Determinants of Adult Health) study. J Am Coll Cardiol. 2009;53(10):860-9.
21. Mosteller RD. Simplified calculation of body-surface area. N Engl J Med.
1987;317(17):1098.
22. Clinical guidelines on the identification, evaluation, and treatment of overweight
and obesity in adults: executive summary. Expert Panel on the Identification,
Evaluation, and Treatment of Overweight in Adults. Am J Clin Nutr.
1998;68(4):899-917.
23. Karlberg J, Luo ZC, Albertsson-Wikland K. Body mass index reference values
(mean and SD) for Swedish children. Acta Paediatr. 2001;90(12):1427-34.
24. Danielsson P, Svensson V, Kowalski J, Nyberg G, Ekblom O, Marcus C.
Importance of age for 3-year continuous behavioral obesity treatment success
and dropout rate. Obes Facts. 2012;5(1):34-44.
25. Krmar RT, Holtback U, Bergh A, Svensson E, Wuhl E. Oscillometric casual
blood pressure normative standards for Swedish children using ABPM to
exclude casual hypertension. Am J Hypertens. 2015;28(4):459-68.
26. Mancia G, Fagard R, Narkiewicz K, Redon J, Zanchetti A, Bohm M, et al. 2013
ESH/ESC guidelines for the management of arterial hypertension: the Task
Force for the Management of Arterial Hypertension of the European Society of
Hypertension (ESH) and of the European Society of Cardiology (ESC). Eur
Heart J. 2013;34(28):2159-219.
27. Wood D, De Backer G, Faergeman O, Graham I, Mancia G, Pyorala K.
Prevention of coronary heart disease in clinical practice. Summary of
recommendations of the Second Joint Task Force of European and other
Societies on Coronary Prevention. J Hypertens. 1998;16(10):1407-14.
28. O'Loughlin J, Lauzon B, Paradis G, Hanley J, Levy E, Delvin E, et al.
Usefulness of the American Academy of Pediatrics recommendations for
identifying youths with hypercholesterolemia. Pediatrics. 2004;113(6):1723-7.
29. American Diabetes A. Diagnosis and classification of diabetes mellitus.
Diabetes Care. 2014;37 Suppl 1:S81-90.
30. Definition and diagnosis of diabets mellitus and intermediate hyperglycemia:
report of a WHO/IDF Consultation. Geneva, Switzerland: World health
Organization; 2006.
29
31. de Simone G, Daniels SR, Devereux RB, Meyer RA, Roman MJ, de Divitiis O,
et al. Left ventricular mass and body size in normotensive children and adults:
assessment of allometric relations and impact of overweight. J Am Coll Cardiol.
1992;20(5):1251-60.
32. Iacobellis G, Willens HJ. Echocardiographic epicardial fat: a review of research
and clinical applications. J Am Soc Echocardiogr. 2009;22(12):1311-9; quiz
417-8.
33. Qin JX, Shiota T, Tsujino H, Saracino G, White RD, Greenberg NL, et al.
Mitral annular motion as a surrogate for left ventricular ejection fraction: real-
time three-dimensional echocardiography and magnetic resonance imaging
studies. Eur J Echocardiogr. 2004;5(6):407-15.
34. Kaul S, Tei C, Hopkins JM, Shah PM. Assessment of right ventricular function
using two-dimensional echocardiography. Am Heart J. 1984;107(3):526-31.
35. Pettersen MD, Du W, Skeens ME, Humes RA. Regression equations for
calculation of z scores of cardiac structures in a large cohort of healthy infants,
children, and adolescents: an echocardiographic study. J Am Soc Echocardiogr.
2008;21(8):922-34.
36. Cole TJ. The LMS method for constructing normalized growth standards. Eur J
Clin Nutr. 1990;44(1):45-60.
37. Foster BJ, Mackie AS, Mitsnefes M, Ali H, Mamber S, Colan SD. A novel
method of expressing left ventricular mass relative to body size in children.
Circulation. 2008;117(21):2769-75.
38. Koestenberger M, Ravekes W, Everett AD, Stueger HP, Heinzl B, Gamillscheg
A, et al. Right ventricular function in infants, children and adolescents:
reference values of the tricuspid annular plane systolic excursion (TAPSE) in
640 healthy patients and calculation of z score values. J Am Soc Echocardiogr.
2009;22(6):715-9.
39. Wendelhag I, Liang Q, Gustavsson T, Wikstrand J. A new automated
computerized analyzing system simplifies readings and reduces the variability in
ultrasound measurement of intima-media thickness. Stroke. 1997;28(11):2195-
200.
40. Wikstrand J, Wendelhag I. Methodological considerations of ultrasound
investigation of intima-media thickness and lumen diameter. J Intern Med.
1994;236(5):555-9.
41. Wikstrand J. Methodological considerations of ultrasound measurement of
carotid artery intima-media thickness and lumen diameter. Clin Physiol Funct
Imaging. 2007;27(6):341-5.
42. Ghanem S, Mostafa M, Ayad S. Early echocardiography abnormalities in obese
children and adolescent and reversibility of these abnormalities after significant
weight reduction. J Saudi Heart Assoc. 2010;22(1):13-8.
43. Cabrera-Rego JO, Iacobellis G, Castillo-Herrera JA, Valiente-Mustelier J,
Gandarilla-Sarmientos JC, Marin-Julia SM, et al. Epicardial fat thickness
correlates with carotid intima-media thickness, arterial stiffness, and cardiac
geometry in children and adolescents. Pediatr Cardiol. 2014;35(3):450-6.
44. Fang J, Zhang JP, Luo CX, Yu XM, Lv LQ. Carotid Intima-media thickness in
childhood and adolescent obesity relations to abdominal obesity, high
triglyceride level and insulin resistance. Int J Med Sci. 2010;7(5):278-83.
45. Ball GD, Huang TT, Gower BA, Cruz ML, Shaibi GQ, Weigensberg MJ, et al.
Longitudinal changes in insulin sensitivity, insulin secretion, and beta-cell
function during puberty. J Pediatr. 2006;148(1):16-22.

30
46. Naya T, Hosomi N, Ohyama H, Ichihara S, Ban CR, Takahashi T, et al.
Smoking, fasting serum insulin, and obesity are the predictors of carotid
atherosclerosis in relatively young subjects. Angiology. 2007;58(6):677-84.

31
7 ATTACHMENTS
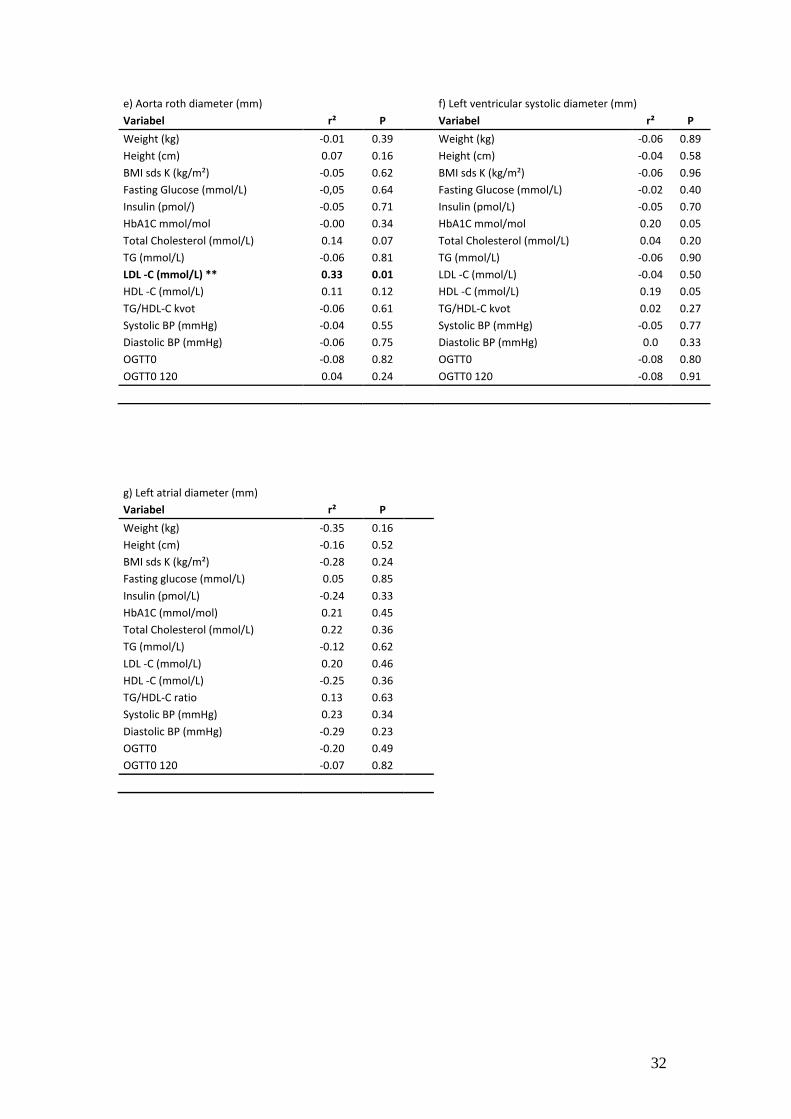
Table 5.Correlation between echocardiographic parameters and vascular structure from young adulthood with clinical variables from childhood.
a) Intra ventricular septum (mm)
b) Left ventricular diastolic diameter (mm)
Variabel r² P Variabel r² P
Weight (kg) -0.35 0.54
Weight (kg) 0.05 0.86
Height (cm) -0.24 0.46
Height (cm) 0.21 0.34
BMI sds (kg/m²) -0.43 0.62
BMI sds K (kg/m²) -0.28 0.25
Fasting glucose (mmol/L) -0.01 0.34
Fasting Glucose (mmol/L) 0.40 0.87
Insulin (pmol/L) -0.01 0.38
Insulin (pmol/L) -0.14 0.56
HbA1C mmol/mol 0.16 0.08
HbA1C mmol/mol 0.03 0.91
Total Cholesterol (mmol/L) ** 0.32 0.01
Total Cholesterol (mmol/L) -0.12 0.64
TG (mmol/L) ** 0.25 0.02
TG (mmol/L) 0.19 0.45
LDL -C (mmol/L) ** 0.29 0.02
LDL -C (mmol/L) -0.07 0.80 HDL -C (mmol/L) -0.32 0.5
HDL -C (mmol/L) -0.24 0.38
TG/HDL-C kvot -0.01 0.37
TG/HDL-C kvot 0.24 0.38
Systolic BP (mmHg) -0.05 0.80
Systolic BP (mmHg) -0.09 0.72
Diastolic BP (mmHg) -0.06 0.92
Diastolic BP (mmHg) -0.08 0.74
OGTT0 -0.06 0.61
OGTT0 -0.23 0.36
OGTT0 120 -0.04 0.51 OGTT0 120 -0.31 0.28
c) Left ventricular posterior wall in diastole (mm)
d) Epicardial adipose tissue (mm)
Variabel r² P Variabel r² P
Weight (kg) -0.04 0.53
Weight (kg) ** 0.56 <0.001
Height (cm) 0.01 0.36
Height (cm) 0.16 0.06
BMI sds K (kg/m²) -0.06 0.88
BMI sds K (kg/m²) 0.13 0.08
Fasting Glucose (mmol/L) -0.06 0.95
Fasting glucose (mmol/L) 0.12 0.09
Insulin (pmol/L) -0.06 0.98
Insulin (pmol/L) ** 0.52 <0.001
HbA1C mmol/mol -0.04 0.50
HbA1C mmol/mol 0.06 0.2
Total Cholesterol (mmol/L) 0.01 0.29
Total Cholesterol (mmol/L) 0.01 0.32
TG (mmol/L) 0.06 0.17
TG (mmol/L) -0.06 0.8
LDL -C (mmol/L) 0.02 0.28
LDL -C (mmol/L) -0.07 0.8
HDL -C (mmol/L) -0.05 0.61
HDL -C (mmol/L) 0.13 0.1
TG/HDL-C kvot -0.01 0.36
TG/HDL-C kvot -0.31 0.1
Systolic BP (mmHg) -0.06 0.86
Systolic BP (mmHg) ** 0.21 0.03
Diastolic BP (mmHg) -0.04 0.57
Diastolic BP (mmHg) 0.4 0.2
OGTT0 0.12 0.12
OGTT0 -0.02 0.40
OGTT0 120 -0.06 0.64 OGTT0 120 0.09 0.17
32
e) Aorta roth diameter (mm)
f) Left ventricular systolic diameter (mm)
Variabel r² P Variabel r² P
Weight (kg) -0.01 0.39
Weight (kg) -0.06 0.89
Height (cm) 0.07 0.16
Height (cm) -0.04 0.58
BMI sds K (kg/m²) -0.05 0.62
BMI sds K (kg/m²) -0.06 0.96
Fasting Glucose (mmol/L) -0,05 0.64
Fasting Glucose (mmol/L) -0.02 0.40
Insulin (pmol/) -0.05 0.71
Insulin (pmol/L) -0.05 0.70
HbA1C mmol/mol -0.00 0.34
HbA1C mmol/mol 0.20 0.05
Total Cholesterol (mmol/L) 0.14 0.07
Total Cholesterol (mmol/L) 0.04 0.20
TG (mmol/L) -0.06 0.81
TG (mmol/L) -0.06 0.90
LDL -C (mmol/L) ** 0.33 0.01
LDL -C (mmol/L) -0.04 0.50
HDL -C (mmol/L) 0.11 0.12
HDL -C (mmol/L) 0.19 0.05
TG/HDL-C kvot -0.06 0.61
TG/HDL-C kvot 0.02 0.27
Systolic BP (mmHg) -0.04 0.55
Systolic BP (mmHg) -0.05 0.77
Diastolic BP (mmHg) -0.06 0.75
Diastolic BP (mmHg) 0.0 0.33
OGTT0 -0.08 0.82
OGTT0 -0.08 0.80
OGTT0 120 0.04 0.24 OGTT0 120 -0.08 0.91
g) Left atrial diameter (mm)
Variabel r² P
Weight (kg) -0.35 0.16
Height (cm) -0.16 0.52
BMI sds K (kg/m²) -0.28 0.24
Fasting glucose (mmol/L) 0.05 0.85
Insulin (pmol/L) -0.24 0.33
HbA1C (mmol/mol) 0.21 0.45
Total Cholesterol (mmol/L) 0.22 0.36
TG (mmol/L) -0.12 0.62
LDL -C (mmol/L) 0.20 0.46
HDL -C (mmol/L) -0.25 0.36
TG/HDL-C ratio 0.13 0.63
Systolic BP (mmHg) 0.23 0.34
Diastolic BP (mmHg) -0.29 0.23
OGTT0 -0.20 0.49
OGTT0 120 -0.07 0.82

33
h) Left atrial area (cm2)
i) Early diastole-wave (m/s)
Variabel r² P Variabel r² P
Weight (kg) -0.06 0.78
Weight (kg) 0.20 0.44
Height (cm) -0.06 0.98
Height (cm) 0.08 0.76
BMI sds K (kg/m²) -0.04 0.58
BMI sds K (kg/m²) 0.03 0.91
Fasting Glucose (mmol/L) -0.06 0.77
Fasting Glucose (mmol/L) -0.16 0.54
Insulin (pmol/L) -0.06 0.77
Insulin (pmol/L) -0.08 0.74
HbA1C (mmol/mol) -0.08 0.99
HbA1C (mmol/mol)** 0.56 0.04
Total Cholesterol (mmol/L) 0.14 0.28
Total Cholesterol (mmol/L) 0.31 0.21
TG (mmol/L) -0.05 0.63
TG (mmol/L) 0.20 0.45
LDL -C (mmol/L) 0.02 0.29
LDL -C (mmol/L) 0.41 0.13
HDL -C (mmol/L) -0.08 0.92
HDL -C (mmol/L) ** -0.51 0.04
TG/HDL-C ratio -0.07 0.86
TG/HDL-C ratio 0.41 0.13
Systolic BP (mmHg) 0.14 0.07
Systolic BP (mmHg) 0.20 0.43
Diastolic BP (mmHg) 0.05 0.19
Diastolic BP (mmHg) 0.12 0.64
OGTT0 -0.07 0.78
OGTT0 -0.28 0.36
OGTT0 120 -0.40 0.49 OGTT0 120 -0.51 0.07
j) Atrial contraction- wave (m/s)
k) Early diastole/atrial contraction ratio
Variabel r² P Variabel r² P
Weight (kg) 0.32 0.20
Weight (kg) 0.12 0.08
Height (cm) 0.41 0.08
Height (cm) -0.06 0.84
BMI sds K (kg/m²) -0.21 0.39
BMI sds K (kg/m²) ** 0.22 0.03
Fasting Glucose (mmol/L) 0.11 0.65
Fasting Glucose (mmol/L) -0.05 0.73
Insulin (pmol/L) -0.01 0.98
Insulin (pmol/L) 0.10 0.10
HbA1C (mmol/mol) 0.34 0.21
HbA1C (mmol/mol) -0.01 0.35
Total Cholesterol (mmol/L) -0.05 0.83
Total Cholesterol (mmol/L) -0.04 0.54
TG (mmol/L) -0.13 0.60
TG (mmol/L) 0.32 0.22
LDL -C (mmol/L) 0.01 0.98
LDL -C (mmol/L) 0.06 0.18
HDL -C (mmol/L) -0.09 0.73
HDL -C (mmol/L) 0.08 0.16
TG/HDL-C ratio -0.08 0.77
TG/HDL-C ratio 0.24 0.03
Systolic BP (mmHg) -0.13 0.59
Systolic BP (mmHg) 0.21 0.03
Diastolic BP (mmHg)** 0.47 0.04
Diastolic BP (mmHg) -0.06 0.80
OGTT0 0.03 0.91
OGTT0 0.03 0.30
OGTT0 120 -0.43 0.13 OGTT0 120 -0.11 0.73

34
l) pulmonary systolic/diastolic ratio
m) Motion mode tricuspid annular plane systolic excursion (mm)
Variabel r² P Variabel r² P
Weight (kg) 0.06 0.20
Weight (kg) 0.03 0.24
Height (cm) 0.09 0.16
Height (cm) -0.01 0.37
BMI sds K (kg/m²) -0.08 0.95
BMI sds K (kg/m²) -0.01 0.36
Fasting Glucose (mmol/L) 0.04 0.25
Fasting Glucose (mmol/L) 0.03 0.24
Insulin (pmol/L) 0.01 0.33
Insulin (pmol/L) 0.02 0.27
HbA1C (mmol/mol) 0.20 0.10
HbA1C (mmol/mol) -0.06 0.62
Total Cholesterol (mmol/L) -0.08 1.00
Total Cholesterol (mmol/L) -0.02 0.41
TG (mmol/L) ** 0.23 0.05
TG (mmol/L) -0.01 0.36
LDL -C (mmol/L) -0.10 0.84
LDL -C (mmol/L) -0.06 0.65
HDL -C (mmol/L) -0.08 0.64
HDL -C (mmol/L) 0.09 0.16
TG/HDL-C ratio 0.01 0.35
TG/HDL-C ratio 0.07 0.19
Systolic BP (mmHg) -0.08 0.81
Systolic BP (mmHg) -0.04 0.54
Diastolic BP (mmHg) -0.08 0.87
Diastolic BP (mmHg) -0.06 0.84
OGTT0 -0.10 0.70
OGTT0 0.19 0.08
OGTT0 120 -0.13 0.98 OGTT0 120 -0.08 0.75
n) Motion mode mitral annular plane systolic excursion- septal wall (mm)
o) Motion mode mitral annular plane systolic-lateral wall (mm)
Variabel r² P Variabel r² P
Weight (kg) 0.21 0.42
Weight (kg) 0.38 0.17
Height (cm) 0.42 0.08
Height (cm) ** 0.61 0.01
BMI sds K (kg/m²) 0.07 0.80
BMI sds K (kg/m²) -0.14 0.61
Fasting Glucose (mmol/L) 0.43 0.09
Fasting Glucose (mmol/L) 0.43 0.09
Insulin (pmol/L) 0.22 0.39
Insulin (pmol/L) 0.23 0.39
HbA1C (mmol/mol) 0.15 0.62
HbA1C (mmol/mol) -0.13 0.67
Cholesterol (mmol/L) -0.24 0.34
Cholesterol (mmol/L) -0.35 0.20
TG (mmol/L) 0.10 0.71
TG (mmol/L) 0.29 0.26
LDL -C (mmol/L) -0.16 0.56
LDL -C (mmol/L) -0.50 0.11
HDL -C (mmol/L) -0.23 0.42
HDL -C (mmol/L) -0.36 0.23
TG/HDL-C ratio 0.17 0.56
TG/HDL-C ratio 0.38 0.20
Systolic BP (mmHg) 0.18 0.47
Systolic BP (mmHg) 0.25 0.35
Diastolic BP (mmHg) -0.10 0.70
Diastolic BP (mmHg) 0.10 0.70
OGTT0 ** 0.70 0.01
OGTT0 ** 0.58 0.05
OGTT0 120 -0.30 0.30 OGTT0 120 -0.18 0.58

35
p) Left ventricular mass (g)
q) Left ventricular mass-index (g/m2.7
)
Variabel r² P Variabel r² P
Weight (kg) -0.05 0.67
Weight (kg) -0.06 0.80
Height (cm) 0.07 0.15
BMI sds K (kg/m²) -0.04 0.56
BMI sds K (kg/m²) -0.06 0.84
Fasting glucos (mmol/L) -0.06 0.81
Fasting glucose (mmol/L) -0.05 0.77
Insulin (pmol/L) -0.04 0.62
Insulin (pmol/L) -0.06 0.82
HbA1C (mmol/mol) -0.07 0.90
HbA1C (mmol/mol) -0.06 0.63
Cholesterol (mmol/L) 0.11 0.09
Total Cholesterol (mmol/L) ** 0.29 0.01
TG (mmol/L) ** 0.19 0.03
TG (mmol/L) 0.07 0.14
LDL -C (mmol/L) 0.04 0.23
LDL -C (mmol/L) ** 0.24 0.03
HDL -C (mmol/L) -0.01 0.38
HDL -C (mmol/L) 0.04 0.23
TG/HDL-C ratio 0.03 0.24
TG/HDL-C ratio -0.05 0.60
Systolic BP (mmHg) -0.05 0.70
Systolic BP (mmHg) -0.06 0.86
Diastolic BP (mmHg) -0.04 0.63
Diastolic BP (mmHg) -0.02 0.41
OGTT0 -0.08 0.80
OGTT0 -0.05 0.52
OGTT0 120 -0.08 0.77
OGTT0 120 0.06 0.19
r) Mean carotid intima-media thickness (mm)
s) Mean cross sectional intima-media area (mm2)
Variabel r² P
Variabel r² P
Weight (kg) 0.02 0.26
Weight (kg) -0.02 0.34
Height (cm) -0.40 0.54
Height (cm) -0.02 0.42
BMI sds K (kg/m²) 0.42 0.21
BMI sds K (kg/m²) -0.05 0.61
Fasting glucose (mmol/L) 0.03 0.23
Fasting glucose (mmol/L) -0.02 0.43
Insulin (pmol/L) 0.42 0.21
Insulin (pmol/L) -0.01 0.36
HbA1C (mmol/mol) 0.09 0.94
HbA1C (mmol/mol) 0.17 0.30
Total Cholesterol (mmol/L) ** 0.21 0.04
Total Cholesterol (mmol/L) 0.01 0.29
TG (mmol/L) ** 0.29 0.02
TG (mmol/L) ** 0.20 0.04
LDL -C (mmol/L) 0.50 0.55
LDL -C (mmol/L) -0.08 0.96
HDL -C (mmol/L) 0.08 0.89
HDL -C (mmol/L) 0.03 0.44
TG/HDL-C ratio 0.05 0.21
TG/HDL-C ratio 0.10 0.14
Systolic BP (mmHg) 0.02 0.44
Systolic BP (mmHg) -0.04 0.56
Diastolic BP (mmHg) -0.06 0.73
Diastolic BP (mmHg) -0.06 0.70
OGTT0 0.21 0.07
OGTT0 0.08 0.18
OGTT0 120 0.04 0.46
OGTT0 120 -0.02 0.43
r 2 = correlation coefficient; P= probability value; **= Significant; BMI sds K= body mass index standard derivation score Karlberg; Hba1C= Hemoglobin a1C; TG= Triglyceride; LDL-C= low density lipoprotein- cholesterol; HDL-C= high density lipoprotein-cholesterol; BP= blood pressure; OGTT= oral glucose tolerance test 0 and 120 min.