THE PAWNBROKING INDUSTRY: EVIDENCE FROM VICTORIA Nick ...
21
The Pawnbroking Industry: Evidence from Victoria Draft: June 1997 1 THE PAWNBROKING INDUSTRY: EVIDENCE FROM VICTORIA Nick Bienkowski and Kevin Davis Department of Accounting and Finance The University of Melbourne 1. Introduction Regulation of the Pawnbroking and Second-Hand Dealers industry in Victoria has recently undergone changes. Those changes, and indeed the nature of the industry, are not widely understood, creating a problem for analysis of the likely effects of such a change in regulation. It is therefore the objective of this paper to analyse and describe the current state of the pawnbroking industry. No prior study of pawnbroking in Australia exists, to our knowledge, which unfortunately means that there is no historical reference point available with which to compare the current state of the industry 1 . Furthermore, industry changes seem likely to have occurred in recent years, driven by social factors such as higher long term unemployment and increased gambling and drug dependence (both potentially increasing demand for short term, low value loans by poor credit risks) and a decline in government social welfare support services and reduced access of lower income borrowers to commercial financial institutions resulting from deregulation and growth of user pays philosophy (both potentially reducing alternative sources of short term funds). Prior to the recent changes, the pawnbroking industry was regulated by the Second-Hand Dealers and Pawnbrokers Act (1989). Of particular relevance was the regulation of interest rates and prohibition on charging explicit fees (regulation 11(2)). Since pawnbrokers were considered providers of credit, they were subject to a maximum interest rate chargeable of 4% per month which applied under the Consumer Credit Act. Under this interest rate ceiling, pawnbrokers claimed that they could not operate viably due to the administration costs associated with short maturity/ low principal loans and high default risk which characterise this form of borrowing. As a result, most pawnbrokers in Victoria have been operating under a 1 Overseas studies include Caskey (1991) Caskey and Zikmund (1990), Hudson (1982) and Tebbett (1983)
Transcript of THE PAWNBROKING INDUSTRY: EVIDENCE FROM VICTORIA Nick ...
The Pawnbroking Industry: Evidence from Victoria Draft: June 1997
1
THE PAWNBROKING INDUSTRY: EVIDENCE FROM VICTORIA
Nick Bienkowski and Kevin Davis
Department of Accounting and Finance
The University of Melbourne
1. Introduction
Regulation of the Pawnbroking and Second-Hand Dealers industry in Victoria has recently undergone
changes. Those changes, and indeed the nature of the industry, are not widely understood, creating a
problem for analysis of the likely effects of such a change in regulation. It is therefore the objective of this
paper to analyse and describe the current state of the pawnbroking industry. No prior study of pawnbroking
in Australia exists, to our knowledge, which unfortunately means that there is no historical reference point
available with which to compare the current state of the industry1. Furthermore, industry changes seem
likely to have occurred in recent years, driven by social factors such as higher long term unemployment and
increased gambling and drug dependence (both potentially increasing demand for short term, low value
loans by poor credit risks) and a decline in government social welfare support services and reduced access
of lower income borrowers to commercial financial institutions resulting from deregulation and growth of
user pays philosophy (both potentially reducing alternative sources of short term funds).
Prior to the recent changes, the pawnbroking industry was regulated by the Second-Hand Dealers and
Pawnbrokers Act (1989). Of particular relevance was the regulation of interest rates and prohibition on
charging explicit fees (regulation 11(2)). Since pawnbrokers were considered providers of credit, they were
subject to a maximum interest rate chargeable of 4% per month which applied under the Consumer Credit
Act. Under this interest rate ceiling, pawnbrokers claimed that they could not operate viably due to the
administration costs associated with short maturity/ low principal loans and high default risk which
characterise this form of borrowing. As a result, most pawnbrokers in Victoria have been operating under a
1 Overseas studies include Caskey (1991) Caskey and Zikmund (1990), Hudson (1982) and Tebbett (1983)
The Pawnbroking Industry: Evidence from Victoria Draft: June 1997
2
‘defacto pawnbroking system’ in which the individual wanting funds sells the good to the pawnbroker and
has the first option to buy it back. This is commonly known as a ‘buy-back’. It can be argued that this is
equivalent to a pawnbroking loan in which funds are advanced against the security of the good and should
thus still be restricted by the 4% ceiling. It appears, however, that those responsible for enforcing of the
appropriate regulations (the Dealers Squad and the Victorian Police) have either not agreed with this
interpretation or have turned a blind eye conditional on continued fair dealings by pawnbrokers.
Such financial innovation in response to regulation is hardly unexpected. Nor is the reaction of the
enforcement authorities to an unworkable law, which if enforced would mean the demise of the industry. In
such circumstances, other regulatory objectives may take precedence, in this case including ensuring fair,
non exploitative, treatment of customers with low economic power and prevention of transactions in stolen
goods. Paradoxically, the ‘buy back’ technique induced by regulatory interest rate ceilings appears less
conducive to achieving these objectives than do standard ‘pledge’ transactions. Under the buy back system,
customers have only the verbal commitment of the pawnbroker that goods can be repurchased (and less
protection regarding the terms of resale of goods by the pawnbroker), while the tendency for pawnbrokers
to purchase goods, rather than being precluded from purchasing forfeited goods on pledge transactions and
forced to sell those goods, may change the incentives to deal in stolen property.
The objective of this paper is to provide information on characteristics of the pawnbroking industry in
Victoria, so that informed debate on regulatory policy can take place. Thus, the remainder of the paper
provides an overview of the pawnbroking industry derived from a survey of Victorian pawnbrokers. We
first outline the regulatory environment prevailing when the data was collected, and provide a brief
overview of the legislative changes passed in 1997 (Section 2), and then describe our data sources (Section
3). Then in Section 4 we provide: an analysis of the perceived costs of pawnbroking loans and their
characteristics; a description of borrower characteristics; a description of goods which are commonly
pawned and the market for these goods; an analysis of the nature of the pawnbroking business identifying
the main risks and operating costs; analysis of current trends and state of the industry. In Section 5 we
The Pawnbroking Industry: Evidence from Victoria Draft: June 1997
3
utilise this data to make some conjectures on the returns to pawnbroking and conclude the paper in Section
6 with some observations on the state of the pawnbroking industry.
2. The Regulatory Environment
Until 1997 the pawnbroking industry has been governed by the Second-Hand Dealers and Pawnbrokers
Act (1989). This outlines the requirements and rights of both the borrower and the pawnbroker. License
fees are inexpensive and currently these licenses are issued by the individual municipalities in which the
pawnbroker is operating. There is no general rule in granting licenses except that the licensee be a fit and
proper person. Beyond this, the police are required to make continual checks for stolen property.
When a loan amount is agreed upon, the borrower is required to produce one piece of photo identification,
or two other accepted forms of identification. The pawnbroker is then required to maintain a record of all
transactions in a book. This record book is to contain a description of the goods received, details of the
borrower, amount pledged, the monthly and annual rates of interest, the amount and dates of payment, and
the period of the loan. The pawnbroker must fix the period of the loan at the time that the goods are
pledged. The pawnbroker must then issue the borrower with a pledge ticket, the details of which are
governed by regulations 9(3) and 11, which include a prohibition on charging any fee for the issue of such a
ticket.
If the period of the loan expires and is not extended, and the goods are not redeemed, the pawn broker is
able to offer the goods for sale as soon as practical and so as to receive the best price reasonably obtainable.
If the principal lent is greater than $100, the pawnbroker must send notice to the borrower that the goods are
being offered for sale after one month from the date of the notice. The person who pledged the goods is
entitled to recover any difference between the sale price and the amount owing plus costs. The borrower
has 12 months to reclaim this discrepancy, which would be done through the courts. A person who has
pledged goods may redeem the goods at any time before the pawnbroker sells or disposes of them.

The Pawnbroking Industry: Evidence from Victoria Draft: June 1997
4
As noted previously, the maximum interest rate provision has led to financial innovation in the form of ‘buy
backs’, to the extent that few transactions have been undertaken as pledge transactions, and regulators have
turned a blind eye to the consequent avoidance of the interest rate ceiling. Responding to this and other
concerns about the industry, new legislation was passed in April 1997 (to take effect from 1998) to amend
the governing act. Principal changes were: the abolition of the interest rate ceiling; the requirement that
pawnbrokers display a schedule of their standard charges (ie interest rates); that the licensing system be
replaced by one of registration; that notices be displayed indicating the procedures which rightful owners of
goods stolen and pawned should take to reclaim their goods; tighter requirements on pawnbrokers to
ascertain the identity of customers.
3. Data Collection
A total of 52 surveys were distributed to businesses listed as Pawnbrokers in the Telstra Yellow Pages. This
was also cross-referenced with a listing obtained from the Internet. Of the 52 surveys distributed, 4 were
returned as “not known at this premises”, leaving the sample at 48. From the sample of 48, 12 were
returned for analysis, representing a 25% response rate. Another survey was returned in which the recipient
did not wish to partake in the study. Responses from a further 3 pawnbrokers who participated in the initial
drafting of the survey are included in the results. Thus, in all, a total of 15 surveys were available for data
analysis, representing a total of 18 premises (which constitutes approximately 35% of listed pawnbrokers
identifiable by mailing address). It is claimed that more pawnbrokers exist in Victoria, however in
communicating with councils and the Victorian Dealer Squad, few additions could be made to the sample.
Three main reasons are responsible for this; (i) the records kept by the individual councils are out of date, if
they exist at all; (ii) pawnbrokers and second-hand dealers are kept on the same database in which there are
approximately 10,000 entries within which there is no identification of pawnbrokers; and (iii) pawnbrokers’
addresses which are listed are no longer current due to insolvency or relocation. With this third point in
mind, it is the opinion of local residents, in Dandenong for example, that up to 15 pawnbrokers may exist at
any one time in the area, however they “come and go”.

The Pawnbroking Industry: Evidence from Victoria Draft: June 1997
5
The sample of 15 responses can be divided in to 2 groups: (i) those holding both a Pawnbroking license and
a Second-hand Dealers license and; (ii) those only holding Second-hand Dealers licenses. 8 survey reponses
(representing 11 premises) were from those with Pawnbroking licenses, while 7 survey reponses
(representing 7 premises) were from those with Second-hand Dealers licenses only. Even though some
respondents did not have pawnbroking licenses, they are undertaking “defacto” pawnbroking, as are
licensed pawnbrokers by operating under the buy-back system. The reponses can also be divided in terms
of location, with 8 premises being located in inner suburbs or the city, and the other 10 being in the outer
suburbs or country Victoria (see Table 3.1).
Table 3.1: Survey Response
Number %
Mailed 52 100.0
"not known" 4 7.7
Response (from 48) 12 25.0
Premises represented 18 37.5
Total Surveys (Premises) 15 (18) 100.0
- Pawnbrokers (with SHD) 8 (11) 53.3
- Second-hand Dealers only 7 (7) 46.7
Suburbs Represented
- Inner suburbs 8 44.4
- Outer Suburbs and country 10 55.6
4. Results
4.1 Pawnbrokers and their Customers:
Pawnbrokers generally cater to those who are excluded from, or unwilling to deal (perhaps because of cost)
with mainstream financial institutions. This is due to two main reasons. The first is that some consumers are

The Pawnbroking Industry: Evidence from Victoria Draft: June 1997
6
not able to meet credit standards generally applied. The second reason is that the individual may wish to
procure loans of low principal and for short term, which establishment costs and fees at mainstream
institutions may make prohibitively expensive. The advent of credit cards has resulted in the second reason
assuming less importance for those able to access such facilities. Consequently, it can be expected that the
majority of pawnbroking customers are those who are unable to borrow from mainstream institutions
because of insufficient credit standing.
The public’s perception of the characteristics of the average borrower from pawnbrokers is that they are
lower income earners. As a result, this has contributed to an unfavourable view of pawnbrokers - that they
take advantage of those who can least afford it. What this view fails to realise is that without pawnbrokers,
a source of credit (often the only one) for such individuals, and thus funds for necessary expenses, would be
eliminated.
Most pawnbroking customers fall into the 25-34 year old age cohort, and no particular nationality was
mentioned as being particularly over represented) Consistent with public opinion, it was estimated that
approximately 45% of all customers were unemployed or on social security. Such borrower characteristics
are consistent with the small size of loans demanded, and an interpretation of these representing a form of
“bridging” finance to meet necessary expenses prior to the next income receipt. As support for this
hypothesis, approximately 70% of respondents were of the view that the number of pledges (loans)
increases before social security payments. Of their customers, 56% are regulars (i.e. known to the
pawnbroker), with the largest number of pawnbrokers claiming that more than 70% of their customers are
regulars.
The most commonly cited reasons for loans were: rent, food and bills. Of the remaining reasons suggested
in the questionnaire (including; medical purposes, paying off other loans, car repairs), drugs and gambling
were not believed to be a frequent reason for the procurement of the funds. Many pawnbrokers claim to
have refused loans if it was their belief that the funds were to be used for gambling or drugs while some
pawnbrokers mentioned that they had issued Gamblers Anonymous cards to these people.

The Pawnbroking Industry: Evidence from Victoria Draft: June 1997
7
The results portray the average pawnbroking customer as a person in the lower percentile of income
earners. The most frequently cited reasons for use of pawn shops include; short-term and low principal debt,
inability to borrow from a bank, and anonymity. What follows is an analysis of the cost of an average loan
for pawn broker customers
4.2 Loan Characteristics
The main differences between pawnbroking credit and that from mainstream financial institutions are the
length and amount of the loan and the fact that goods are left as security to protect the pawnbroker against
default risk. This security is required due to the high default risk potential of these loans. Pawnbroking
credit is not offered on an unsecured basis because problems of adverse selection and asymmetric
information leading to high default rates mean that the level of interest rates necessary for economic
viability would be so high as to preclude most borrowers.
The pawnbroker faces costs and risks associated with accepting goods as security against funds advanced.
One is the cost of storage of the goods involved, including protection against theft. Another is the
possibility that the goods are not owned by the borrower (who has no intention of repaying the loan and is
using the pawnbroker as a means of disposing of stolen property). If the rightful owner locates and claims
the goods, the pawnbroker has lost the principal advanced - since the borrower is unlikely to be located or
willing to make repayment. A further risk lies in the fact that in the event of borrower default, the value of
the goods may be below the amount owing due to obsolescence, economic downturn or the illiquidity of the
second-hand goods market. Although the pawnbroker holds goods as security and thus does not have to
worry about the credit risk of an individual (whereas this is one of the biggest risks a bank faces), the risks
and costs just mentioned need to be covered over the short period of the loan.
(i) Loan Size
Consistent with expectations, the average loan size was small at $95, with approximately 50% of loans
being less than $100. The remainder of the loans were evenly spread over the ranges of $100-$200, and
The Pawnbroking Industry: Evidence from Victoria Draft: June 1997
8
greater than $200 (see Table 2). In comparison, the only study available with comparable data (based on
U.S. experience) also found that the average loan size was less than $100 (Caskey and Zikmund, 1990);
with the average loan size being about $50. The initial agreed loan period was 1 month for all but three
respondents, however most goods were held for at least double the initial agreed period, and regular
borrowers’ goods were held longer than those of unknown borrowers. The average loan period was less
than 2 months (approximately 40 days); 40% of loans were redeemed in less than 1 month, and
approximately another 40% of loans were redeemed in less than 3 months. Consistent with these findings,
Caskey and Zikmund found that in the USA loans lasted on average 2 to 3 months.
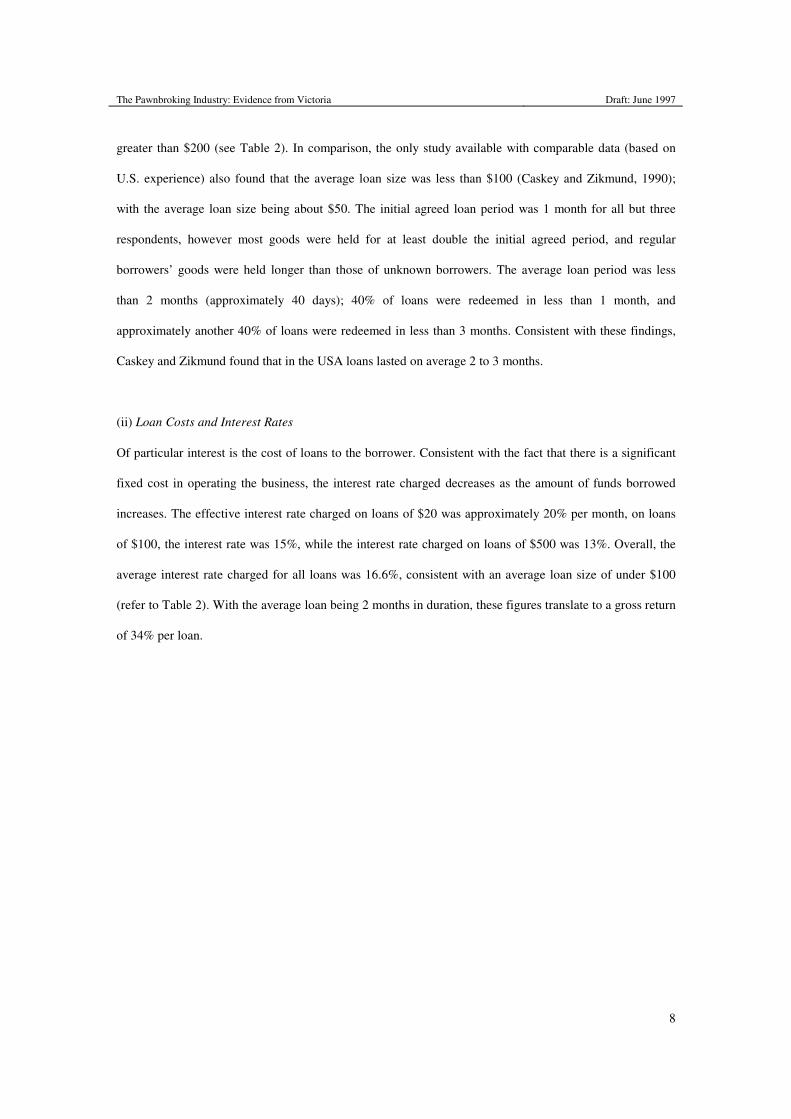
(ii) Loan Costs and Interest Rates
Of particular interest is the cost of loans to the borrower. Consistent with the fact that there is a significant
fixed cost in operating the business, the interest rate charged decreases as the amount of funds borrowed
increases. The effective interest rate charged on loans of $20 was approximately 20% per month, on loans
of $100, the interest rate was 15%, while the interest rate charged on loans of $500 was 13%. Overall, the
average interest rate charged for all loans was 16.6%, consistent with an average loan size of under $100
(refer to Table 2). With the average loan being 2 months in duration, these figures translate to a gross return
of 34% per loan.

The Pawnbroking Industry: Evidence from Victoria Draft: June 1997
9
Table 2: Loan Characteristics
Loan Size
- Loans under $100 49%
- Loans $100-$200 26%
- Loans above $200 25%
- Average Loan Size $95
Redemption Cost (after 1 mth.) Cost ($) Interest Ratea Interest Rate
(monthly) (annual)
- $20 Loan 23.82 19.1% 229%
- $100 Loan 115.27 15.3% 184%
- $500 Loan 565.00 13.0% 156%
- Average 16.6% 199% a Note; all pawnbrokers charge a flat monthly interest rate with interest charged from the start of the month.
Note that these are quoted interest rates and reflect the ex post return on funds for loans which do not
default. Where the proceeds from sale of pawned goods in the event of default exceed the amount owed, the
return on defaulting loans will exceed that on non defaulting loans. On average, since there is a significant
proportion of defaulting loans, the expected return on loans will also depend on the value of goods held as
security relative to the funds advanced. Where borrowers redeem goods in less than a month, the effective
rate of return (p.a.) on the loans is also higher.
In comparison, Caskey and Zigmund found that monthly interest rates in the United States varied from 3%
to 20%, depending on the state, and reflecting the fact that in some states interest rates were restricted by
interest rate ceilings. In states where no interest ceiling exists, interest rates on a $51 loan commonly range
from 18% to 28% per month.
(iii) Frequency of Redemption
All respondents preferred loans to be redeemed, despite the fact that sale of goods in the case of non-
redemption appears to bring higher short term returns. As indicated by a typical quote from one respondent
“I like to keep a regular clientele, if I sell their ‘good’, then that is one less good which someone can come

The Pawnbroking Industry: Evidence from Victoria Draft: June 1997
10
back to redeem, and one less good which can be redeemed in the future”. While 20% of loans in aggregate
are not redeemed, non-redemption rates are approximately 29% for amounts less than $100 and 16% for
amounts greater than $100 (refer Table 3).
The borrower has a greater incentive to redeem goods where the dollar gap between value and repayment
required is large which, given fairly constant loan/valuation ratios across the value spectrum would lead to
an expectation of higher redemption rates for higher value items. Default rates in the United States, reported
to be 19% on average, are again comparable with Victorian pawnshop loans.
Table 3: Default Rates and Holding Period
Redemption Non-Redemption
- within 1 month 42% - Loans under $100 29%
- within 3 months 40% - Loans greater than $100 16%
- greater than 3 months 18%
Average Loan Period
- Agreed loan period 32 days
- Holding period 60 days
- Holding period for regulars 86 days
(iv) Pawned Goods
Pawned goods are characterised by being heterogeneous, durable and portable goods. The two most
frequently cited pawned items are jewellery and electrical goods (this is consistent with information in
Caskey and Zikmund). In comparison, all other goods (photographic and sports equipment, musical
instruments etc.) were either infrequently offered and / or accepted. Electrical goods are regarded as more
risky than jewellery because of obsolescence, difficulty in assessing quality / working condition, and price
volatility. On the other hand, second-hand jewellery is frequently demanded and has a relatively efficient
pricing mechanism, in that it is directly related to the current gold price. As a result of this efficient pricing
mechanism, the loan-to-collateral ratio quoted by pawnbrokers was either for gold (or jewellery), or it was
specified that this ratio for gold was definitely the maximum that they would be prepared to lend.
The Pawnbroking Industry: Evidence from Victoria Draft: June 1997
11
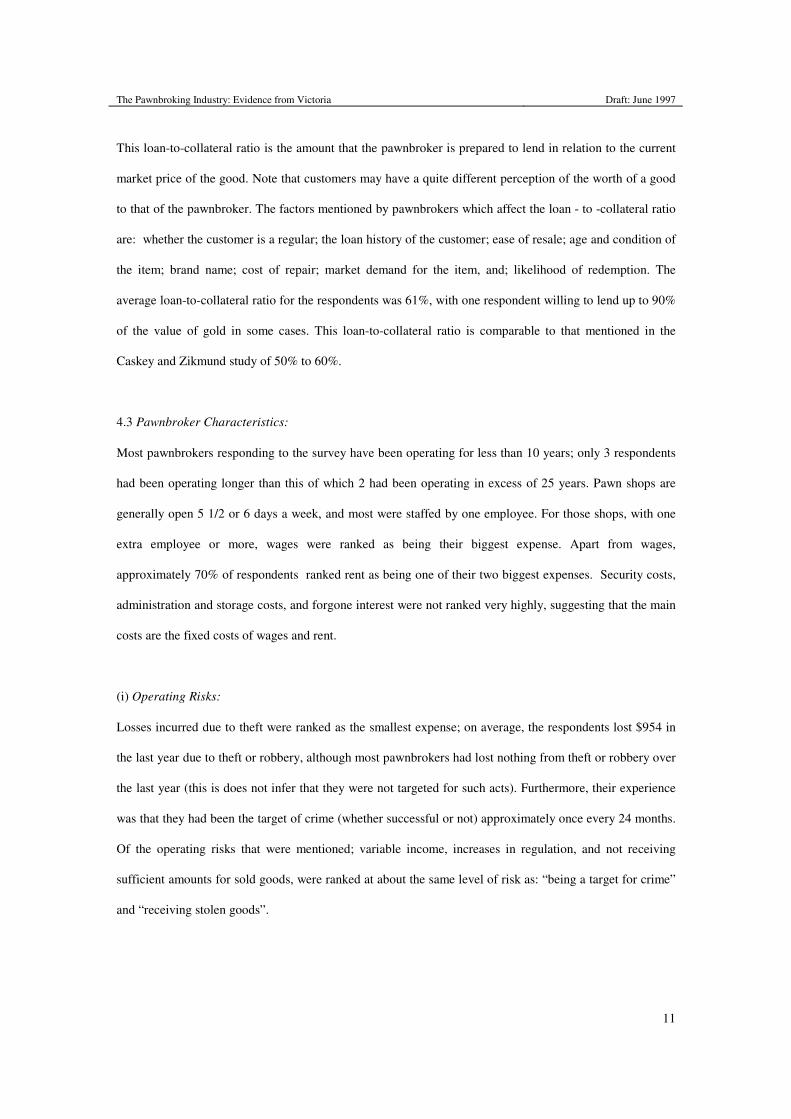
This loan-to-collateral ratio is the amount that the pawnbroker is prepared to lend in relation to the current
market price of the good. Note that customers may have a quite different perception of the worth of a good
to that of the pawnbroker. The factors mentioned by pawnbrokers which affect the loan - to -collateral ratio
are: whether the customer is a regular; the loan history of the customer; ease of resale; age and condition of
the item; brand name; cost of repair; market demand for the item, and; likelihood of redemption. The
average loan-to-collateral ratio for the respondents was 61%, with one respondent willing to lend up to 90%
of the value of gold in some cases. This loan-to-collateral ratio is comparable to that mentioned in the
Caskey and Zikmund study of 50% to 60%.
4.3 Pawnbroker Characteristics:
Most pawnbrokers responding to the survey have been operating for less than 10 years; only 3 respondents
had been operating longer than this of which 2 had been operating in excess of 25 years. Pawn shops are
generally open 5 1/2 or 6 days a week, and most were staffed by one employee. For those shops, with one
extra employee or more, wages were ranked as being their biggest expense. Apart from wages,
approximately 70% of respondents ranked rent as being one of their two biggest expenses. Security costs,
administration and storage costs, and forgone interest were not ranked very highly, suggesting that the main
costs are the fixed costs of wages and rent.
(i) Operating Risks:
Losses incurred due to theft were ranked as the smallest expense; on average, the respondents lost $954 in
the last year due to theft or robbery, although most pawnbrokers had lost nothing from theft or robbery over
the last year (this is does not infer that they were not targeted for such acts). Furthermore, their experience
was that they had been the target of crime (whether successful or not) approximately once every 24 months.
Of the operating risks that were mentioned; variable income, increases in regulation, and not receiving
sufficient amounts for sold goods, were ranked at about the same level of risk as: “being a target for crime”
and “receiving stolen goods”.

The Pawnbroking Industry: Evidence from Victoria Draft: June 1997
12
From comments made at a forum with pawnbrokers it became apparent that pawnbrokers felt that title risk
was their biggest risk. Title risk is defined as the risk that a customer who pawns or sells a good is not the
“real owner” of the item. If this is the case, then pawnbrokers stand to lose the value of the good, since the
rightful owner can reclaim the goods. This risk is further complicated by the identification requirements,
since many of those with low incomes do not have adequate identification while those proferring stolen
goods may have false identification. Anecdotal evidence of customers purchasing goods using stolen credit
cards and identity documents from a department store and providing the receipt and using the same
documents when pawning the good, or of one person pawning a good and an accomplice subsequently
appearing to assert ownership of “stolen” goods, are not uncommon. The police have trouble prosecuting
such cases, in which the pawnbroker often becomes the victim.
(ii) Competition
A significant development affecting the pawnbroking industry in Victoria in recent years has been the enty
of the Cash Converters chain of second hand shops Although Cash Converters do not have Pawnbroking
Licenses in Victoria, pawnbroking business may be lost where a pawnbroker is effectively entering into a
straight purchase of second-hand goods. Cash Converters have spent large amounts on advertising, possibly
attracting business from pawnbrokers, although pawnbrokers may also benefit from the increased public
awareness of the ability to obtain cash through second-hand dealers and pawnbrokers. Most respondents
felt that Cash Converters had not affected their business because they primarily buy goods which are not
accepted by pawnbrokers. 15% of respondents felt that business had increased because of Cash Converters
due to their advertising which has “ legitimised the industry and brought it into everyone’s lounges”.
(iii) Demand for Loans:
It has been suggested that a pawnbroker’s business may be affected by the state of the economy (Tebbutt,
1983), or the average real wage and the poverty rate (Caskey and Zikmund, 1990). In times of economic
difficulty it is hypothesised that the demand for loans will increase as people have greater difficulty making
ends meet. This may be true in the short-run, but extending beyond this, a pawnbroker will also feel the
effects of a down-turn in the economy. Firstly, a limited availability of funds means that credit may be

The Pawnbroking Industry: Evidence from Victoria Draft: June 1997
13
restricted as more people pledge goods (only one respondent mentioned that they had to restrict the value of
loans due to a lack of funds); secondly, an increasing number of pledges will not be redeemed, and thirdly,
the items pledged will be harder to sell and thus their value will decrease. The last two points will have two
major effects on the pawnbroker: (i) they will become less liquid, therefore, from an economic point of view
their interest rates will increase, or their loan-to-collateral ratios will fall; and (ii) a larger number of
pledged goods on hand will increase their storage and security costs. One other possible effect of an
economic downturn may be to drive business away as potential customers move around in search of
employment.
50% of respondents ranked a variable income as one of the top three risks of operation, with the same
number experiencing fluctuations in the number of loans per week. In comparison, only 30% of all
respondents felt that the state of the economy affected business. One third of these respondents mentioned
that a downturn in the economy only affected sales and not buy backs, with the remainder of the belief that
the economy did affect the number of loans. One respondent also mentioned that the price of jewellery is
affected by the exchange rate and gold prices. Occasions such as Christmas and public holidays also
increase the number of loans, either for extra money to tide the customers over until the next week, or for
money to buy presents. On the other side of the coin, it was mentioned that Christmas gifts were often
purchased at the pawn shop. 90% of respondents had felt that the number of loans had increased over the
last two years. Common reasons for this were: growth stage of the business, and the introduction of the
Casino and Tabaret. In fact, gambling was the most frequently cited reason.
On a daily basis, the average number of loans made per day was 16, with the average number for individual
respondents ranging between 9 and 35 loans per day. This average translates to a value of approximately
$1500 per day (or roughly $75,000 per day in total for the industry in Victoria). However most of the
respondents estimated that they lent less than $1500 per day. Similarly, the number of loans outstanding
ranged between 50 and 1000, with the average being 276, totalling a value of $26,351. Extrapolating, the
amount outstanding is in excess of one million dollars state-wide. Those respondents with Second-hand
The Pawnbroking Industry: Evidence from Victoria Draft: June 1997
14
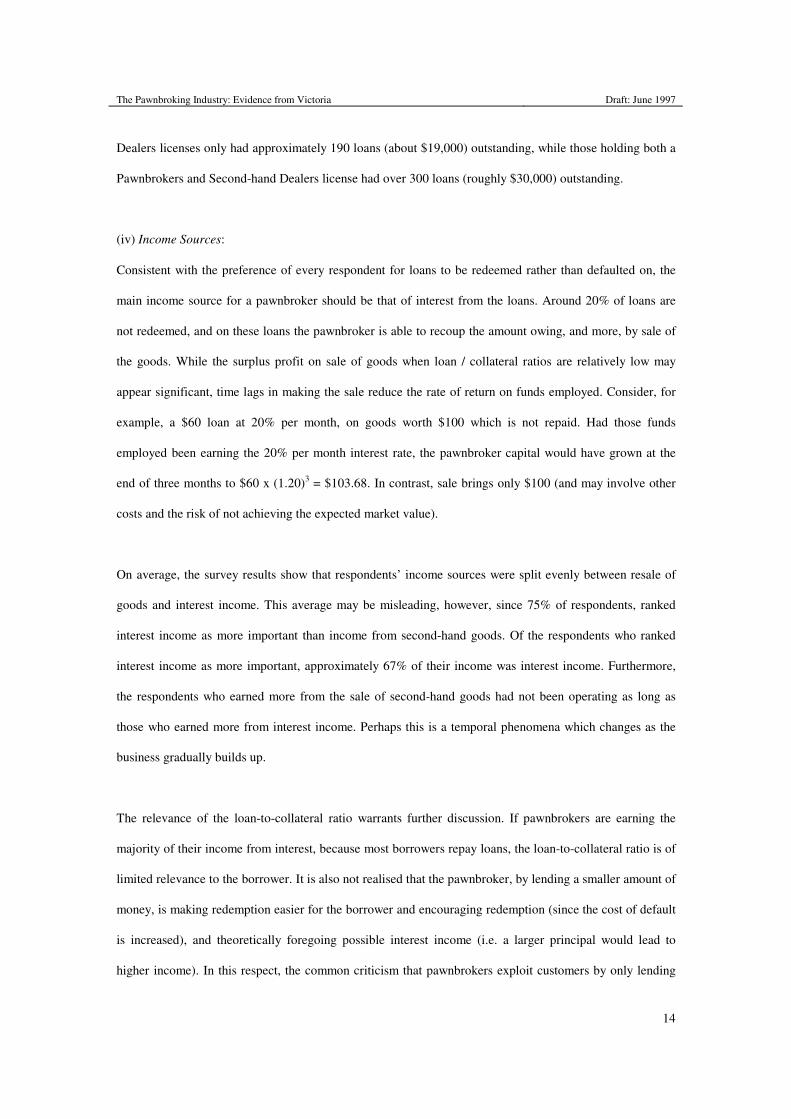
Dealers licenses only had approximately 190 loans (about $19,000) outstanding, while those holding both a
Pawnbrokers and Second-hand Dealers license had over 300 loans (roughly $30,000) outstanding.
(iv) Income Sources:
Consistent with the preference of every respondent for loans to be redeemed rather than defaulted on, the
main income source for a pawnbroker should be that of interest from the loans. Around 20% of loans are
not redeemed, and on these loans the pawnbroker is able to recoup the amount owing, and more, by sale of
the goods. While the surplus profit on sale of goods when loan / collateral ratios are relatively low may
appear significant, time lags in making the sale reduce the rate of return on funds employed. Consider, for
example, a $60 loan at 20% per month, on goods worth $100 which is not repaid. Had those funds
employed been earning the 20% per month interest rate, the pawnbroker capital would have grown at the
end of three months to $60 x (1.20)3 = $103.68. In contrast, sale brings only $100 (and may involve other
costs and the risk of not achieving the expected market value).
On average, the survey results show that respondents’ income sources were split evenly between resale of
goods and interest income. This average may be misleading, however, since 75% of respondents, ranked
interest income as more important than income from second-hand goods. Of the respondents who ranked
interest income as more important, approximately 67% of their income was interest income. Furthermore,
the respondents who earned more from the sale of second-hand goods had not been operating as long as
those who earned more from interest income. Perhaps this is a temporal phenomena which changes as the
business gradually builds up.
The relevance of the loan-to-collateral ratio warrants further discussion. If pawnbrokers are earning the
majority of their income from interest, because most borrowers repay loans, the loan-to-collateral ratio is of
limited relevance to the borrower. It is also not realised that the pawnbroker, by lending a smaller amount of
money, is making redemption easier for the borrower and encouraging redemption (since the cost of default
is increased), and theoretically foregoing possible interest income (i.e. a larger principal would lead to
higher income). In this respect, the common criticism that pawnbrokers exploit customers by only lending
The Pawnbroking Industry: Evidence from Victoria Draft: June 1997
15
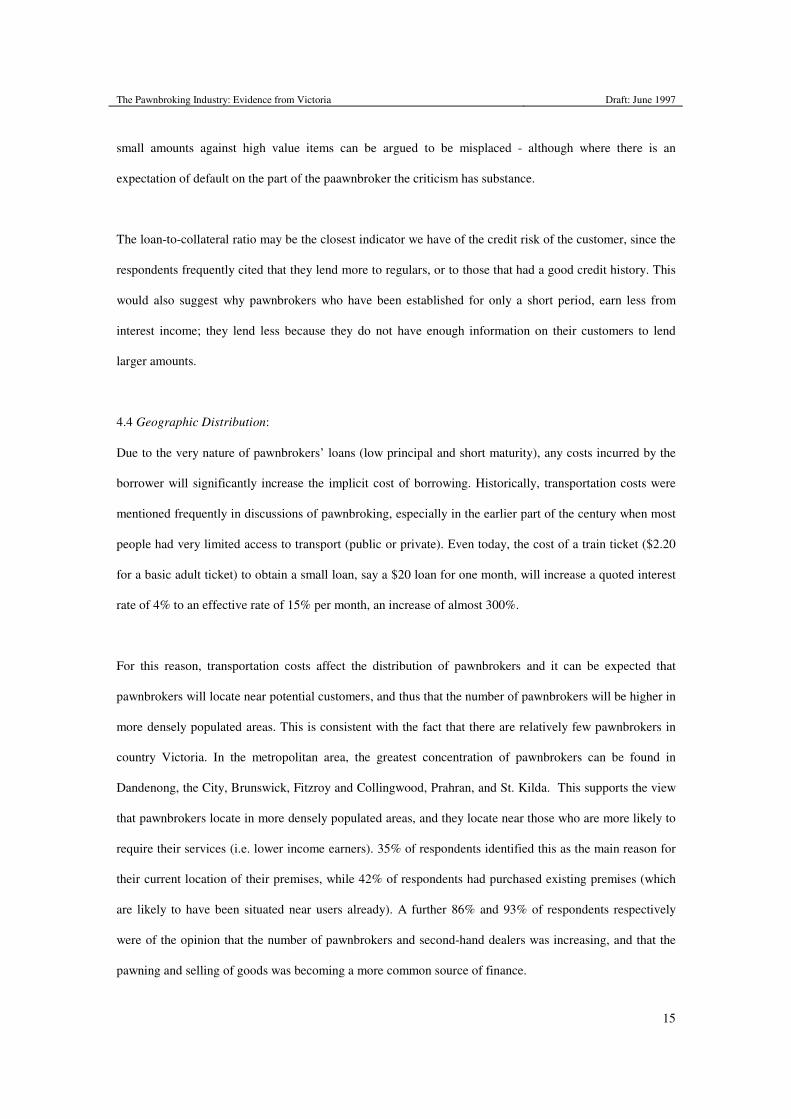
small amounts against high value items can be argued to be misplaced - although where there is an
expectation of default on the part of the paawnbroker the criticism has substance.
The loan-to-collateral ratio may be the closest indicator we have of the credit risk of the customer, since the
respondents frequently cited that they lend more to regulars, or to those that had a good credit history. This
would also suggest why pawnbrokers who have been established for only a short period, earn less from
interest income; they lend less because they do not have enough information on their customers to lend
larger amounts.
4.4 Geographic Distribution:
Due to the very nature of pawnbrokers’ loans (low principal and short maturity), any costs incurred by the
borrower will significantly increase the implicit cost of borrowing. Historically, transportation costs were
mentioned frequently in discussions of pawnbroking, especially in the earlier part of the century when most
people had very limited access to transport (public or private). Even today, the cost of a train ticket ($2.20
for a basic adult ticket) to obtain a small loan, say a $20 loan for one month, will increase a quoted interest
rate of 4% to an effective rate of 15% per month, an increase of almost 300%.
For this reason, transportation costs affect the distribution of pawnbrokers and it can be expected that
pawnbrokers will locate near potential customers, and thus that the number of pawnbrokers will be higher in
more densely populated areas. This is consistent with the fact that there are relatively few pawnbrokers in
country Victoria. In the metropolitan area, the greatest concentration of pawnbrokers can be found in
Dandenong, the City, Brunswick, Fitzroy and Collingwood, Prahran, and St. Kilda. This supports the view
that pawnbrokers locate in more densely populated areas, and they locate near those who are more likely to
require their services (i.e. lower income earners). 35% of respondents identified this as the main reason for
their current location of their premises, while 42% of respondents had purchased existing premises (which
are likely to have been situated near users already). A further 86% and 93% of respondents respectively
were of the opinion that the number of pawnbrokers and second-hand dealers was increasing, and that the
pawning and selling of goods was becoming a more common source of finance.

The Pawnbroking Industry: Evidence from Victoria Draft: June 1997
16
An increase in the number of related premises will have implications for competition in the industry which
may lead to a decrease in interest rates. These view is supported by the results of this study. Figure 2
displays the implicit interest rates charged by pawnbrokers according to size and location. The more
densely populated suburbs (High Pop.) include those mentioned above (Dandenong, the City, Brunswick,
Fitzroy and Collingwood, and Prahran), while the less densely populated suburbs (Low Pop.) consist of the
remaining suburbs for which results were obtained (for example: Shepparton and Oakleigh). Although the
small sample limits our ability to draw firm conclusions, it does appear that population density, and
therefore the number of pawnbrokers, leads to competition and a decrease in the interest rate charged.
When the respondents were asked their opinions on a fair interest rate, 13% of respondents felt that country
pawnbrokers would need to charge approximately 30% more than pawnbrokers in the metropolitan area to
keep their business viable.
Monthly Interest Rates by Location and Size
0
0.05
0.1
0.15
0.2
0.25
$20 $100 $500
Loan Amount
Mo
nth
ly I
nte
rest
Rate
Total
High Pop
Low Pop
Figure 4: Monthly Interest Rates Charged by Area and Loan Size
5. Pawnbroker Income
In this section we utilise the results of our survey data, as outlined above to estimate the average
pawnbroker income. Do pawnbrokers make high incomes, or does the ease of entry to the industry limit
ability to generate returns in excess of “normal profits”?
The Pawnbroking Industry: Evidence from Victoria Draft: June 1997
17
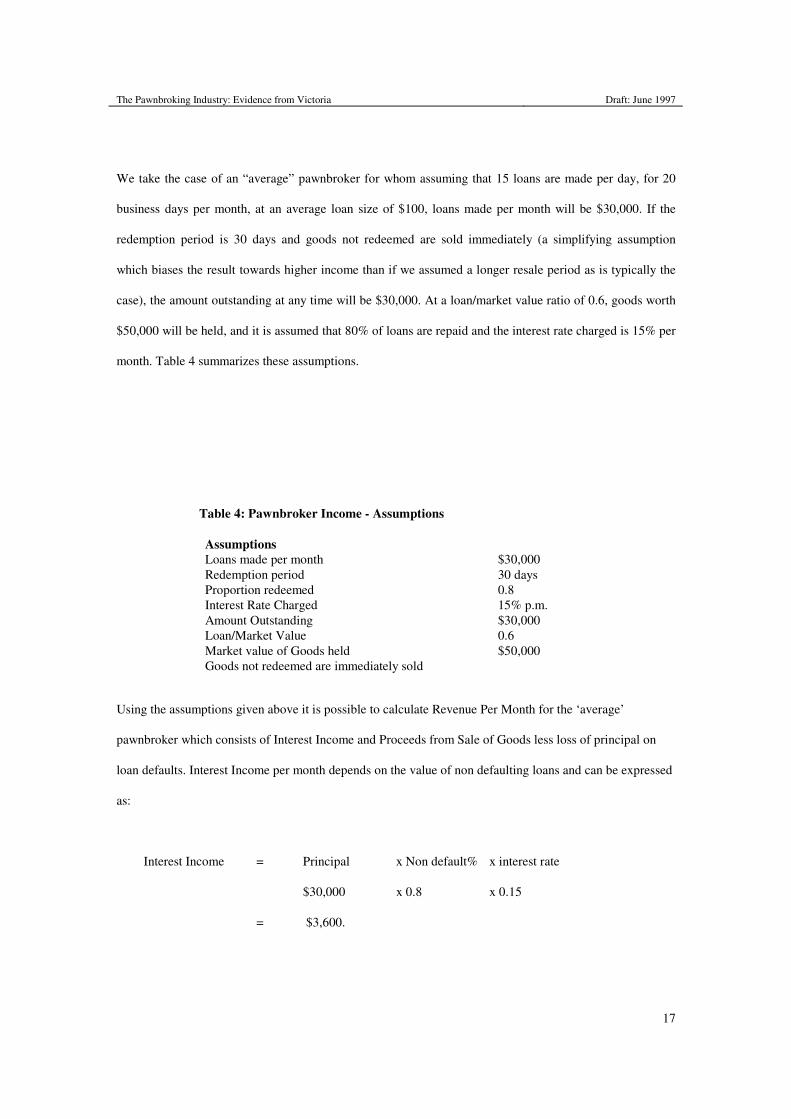
We take the case of an “average” pawnbroker for whom assuming that 15 loans are made per day, for 20
business days per month, at an average loan size of $100, loans made per month will be $30,000. If the
redemption period is 30 days and goods not redeemed are sold immediately (a simplifying assumption
which biases the result towards higher income than if we assumed a longer resale period as is typically the
case), the amount outstanding at any time will be $30,000. At a loan/market value ratio of 0.6, goods worth
$50,000 will be held, and it is assumed that 80% of loans are repaid and the interest rate charged is 15% per
month. Table 4 summarizes these assumptions.
Table 4: Pawnbroker Income - Assumptions
Assumptions Loans made per month $30,000
Redemption period 30 days Proportion redeemed 0.8 Interest Rate Charged 15% p.m.
Amount Outstanding $30,000 Loan/Market Value 0.6
Market value of Goods held $50,000 Goods not redeemed are immediately sold
Using the assumptions given above it is possible to calculate Revenue Per Month for the ‘average’
pawnbroker which consists of Interest Income and Proceeds from Sale of Goods less loss of principal on
loan defaults. Interest Income per month depends on the value of non defaulting loans and can be expressed
as:
Interest Income = Principal x Non default% x interest rate
$30,000 x 0.8 x 0.15
= $3,600.

The Pawnbroking Industry: Evidence from Victoria Draft: June 1997
18
Proceeds from sale of goods depend on the market value of goods held against defaulting loans and can be
expressed as:
Sales of Goods = Market Value x Default%
$50,000 x 0.2
= $10,000
from which must be subtracted the loss of principal on those defaulting loans, given by:
Principal loss = Principal x Default%
$30,000 x 0.2
= $ 6,000
Hence, revenue per month can be calculated as:
Revenue = $3,600 + $10,000 -$6,000 = $ 7,600
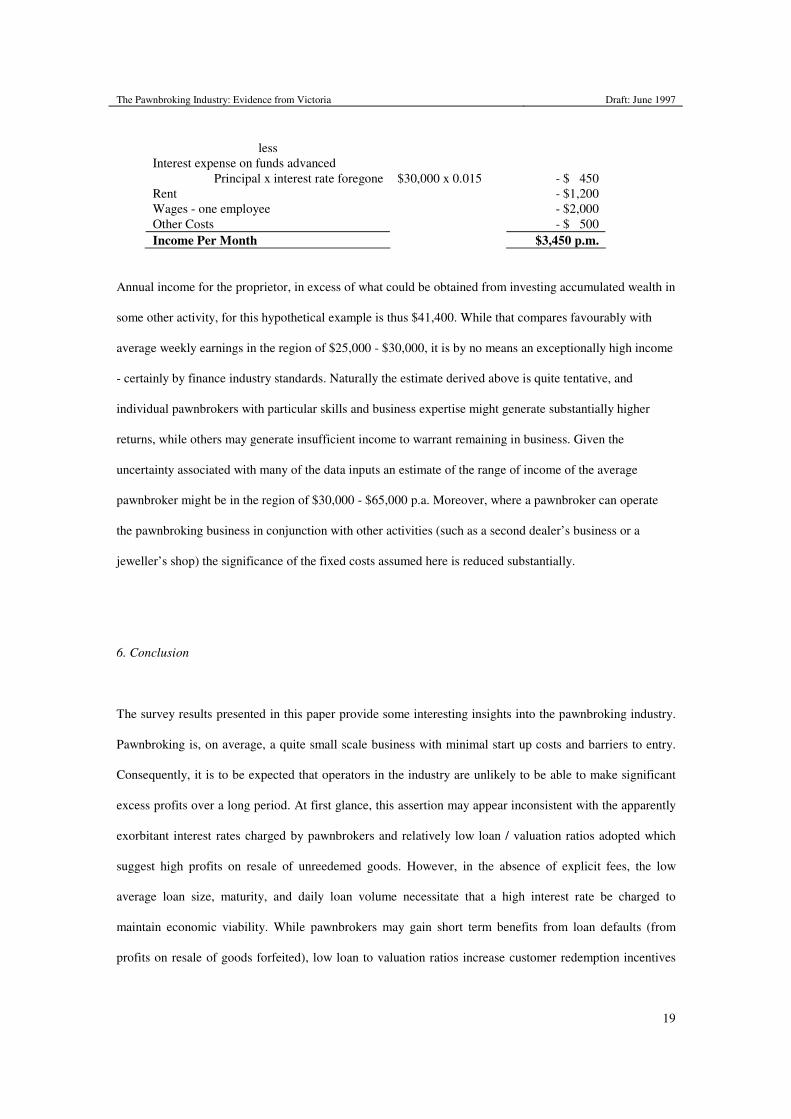
To calculate pawnbroker income per month it is necessary to make some assumptions about costs, which
consist primarily of employee wages, rental, interest expense/foregone on funds advanced, and other costs
such as advertising, licensing, insurance etc. Based on survey results, the average pawnbroker has one
employee (in addition to him/herself) which we assume involves a monthly wages cost of $2,000. Rental on
premises is assumed to be $1,200 per month or $300 per week - a figure which obviously can vary
significantly depending on location. Interest foregone on funds advanced to customers (or equivalently the
cost of funds borrowed to fund advances to customers) also needs to be deducted, and an interest rate of
18% p.a. is assumed for this component of costs. Finally, other costs such as advertising, insurance,
licensing, etc., are assumed to be in the order of $500 per month. Table 5 utilises these figures to estimate
pawnbroker income per month.
Table 5: Average Pawnbroker Income
Revenue Per Month $7,600
The Pawnbroking Industry: Evidence from Victoria Draft: June 1997
19
less Interest expense on funds advanced
Principal x interest rate foregone $30,000 x 0.015 - $ 450 Rent - $1,200 Wages - one employee - $2,000
Other Costs - $ 500
Income Per Month $3,450 p.m.
Annual income for the proprietor, in excess of what could be obtained from investing accumulated wealth in
some other activity, for this hypothetical example is thus $41,400. While that compares favourably with
average weekly earnings in the region of $25,000 - $30,000, it is by no means an exceptionally high income
- certainly by finance industry standards. Naturally the estimate derived above is quite tentative, and
individual pawnbrokers with particular skills and business expertise might generate substantially higher
returns, while others may generate insufficient income to warrant remaining in business. Given the
uncertainty associated with many of the data inputs an estimate of the range of income of the average
pawnbroker might be in the region of $30,000 - $65,000 p.a. Moreover, where a pawnbroker can operate
the pawnbroking business in conjunction with other activities (such as a second dealer’s business or a
jeweller’s shop) the significance of the fixed costs assumed here is reduced substantially.
6. Conclusion
The survey results presented in this paper provide some interesting insights into the pawnbroking industry.
Pawnbroking is, on average, a quite small scale business with minimal start up costs and barriers to entry.
Consequently, it is to be expected that operators in the industry are unlikely to be able to make significant
excess profits over a long period. At first glance, this assertion may appear inconsistent with the apparently
exorbitant interest rates charged by pawnbrokers and relatively low loan / valuation ratios adopted which
suggest high profits on resale of unreedemed goods. However, in the absence of explicit fees, the low
average loan size, maturity, and daily loan volume necessitate that a high interest rate be charged to
maintain economic viability. While pawnbrokers may gain short term benefits from loan defaults (from
profits on resale of goods forfeited), low loan to valuation ratios increase customer redemption incentives
The Pawnbroking Industry: Evidence from Victoria Draft: June 1997
20
and thus the possibility of repeat business using the same collateral. The survey data presented here suggests
that neither quoted interest rates of around 15 % per month nor loan / valuation ratios of 60% (once time
lags in resale of unreedemed goods are allowed for) are necessarily indicative of exploitative behaviour.
The preceding conclusions do not however imply that market forces can be relied upon to generate a
desirable outcome in the pawnbroking industry. Entry to the industry is easy, customers are often in adverse
circumstances with weak bargaining power and limited financial expertise, and short term gains may be
possible by exploitation of such customers. Paradoxically, the legislation governing the industry prior to the
1997 changes encouraged practices which magnified this problem - since under the ‘buy back’ method of
transactions the rights of customers were not well defined. Whether removal of interest rate ceilings under
the new legislation induces a return to pledge based lending in which customer rights are better protected,
or whether further measures are required remains to be seen and may provide a good test of the extent of
consumer information and market power and the extent of competition - since informed consumers could be
expected to demand financing using the technique which better protects their rights.
The Pawnbroking Industry: Evidence from Victoria Draft: June 1997
21
REFERENCES
Caskey John P (1991) “Pawnbroking in America: The Economics of a Forgotten Credit Market” Journal of
Money, Credit, and Banking, 23, 1, February, 85-99
Caskey John P and Brian J Zikmund (1990) “Pawnshops: The Consumer’s Lender of Last Resort” Federal
Reserve Bank of Kansas City Economic Review, March / April, 5-18
Hudson Kenneth (1982) Pawnbroking: An Aspect of British Social History, The Bodley Head, London
Tebbett Melanie (1983) Making Ends Meet: Pawnbroking and Working-Class Credit, Leicester University
Press, New York,