The Pattern of Protection and Economic Growth: Evidence...
28
The Pattern of Protection and Economic Growth: Evidence from Chinese Cities Jing Cai (University of California, Berkeley) Ann Harrison (UC Berkeley, Wharton, and NBER) Justin Yifu Lin (World Bank) October 2011
Transcript of The Pattern of Protection and Economic Growth: Evidence...

The Pattern of Protection and Economic Growth: Evidence from
Chinese Cities
Jing Cai (University of California, Berkeley)
Ann Harrison (UC Berkeley, Wharton, and NBER)
Justin Yifu Lin (World Bank)
October 2011

Outline
I. Why industrial policy: the rationaleII. But does it work? A tour of the literatureIII. Two critical issues:
– What you promote– How you promote
• Harrison and Rodriguez Clare (2010)• Aghion, Dewatripont, Du, Harrison and
Legros (2011)• This paper

I. Why Industrial Policy?

Why this resurgence of interest in industrial policy?
• All 13 of the successful cases identified by the Growth Commission Report used industrial policy.
• All governments “doomed to choose”
• New openness to thinking about government intervention post-2008-2009 crisis. Why?– Failed orthodox laissez faire policies associated with crisis– Perception (even at World Bank) that just relying on
investment climate not enough– Perceived success of (pro-industrial policy) China and
generally more successful performance of developing countries throughout the crisis. In US, the Central Intelligence Agency views China’s IP as a new secret weapon.

The rationale for industrial policy usually comes from a market failure, such as:
• Industry-level externalities, which mean that firms produce too little because they do not incorporate the gains to others when they increase their own output
• Complementarity between goods production and key inputs such as infrastructure, which require public provision
• Agglomeration economies, stemming from knowledge spillovers or labor market pooling imply firms could lower costs of production if they could all locate close together
• Imperfect competition. Aghion, Dewatripont, Du, Harrison, Legros show that with two dominant firms and competitive fringe, laissez faire leads to less competition, innovation and lower welfare
• Imperfect capital markets, which make it difficult to find financing for new projects (ex: SMEs lack collateral for loans)
Implication: No government action means too little growth, innovation, or exploitation of agglomeration economies

II. But Does it Work? A Tour of the Literature

Skeptics– Krueger and Tuncer (1982)
• If IP worked, more supported sectors should grow faster.• Since they don’t in Turkey, IP involved rent-seeking and
didn’t work• Reply by Harrison (1984): in fact, promoted sectors grew
faster• Reply by Rodrik: shouldn’t expect higher growth
– Beason and Weinstein (1996)• Japan targeted wrong sectors• Protected and supported sectors did not grow faster
– Howard Pack and K. Saggi (2006)• Conclude IP doesn’t work (India and software industry)
– Josh Lerner (2009)

Optimists: What and How you promote matters:– Clemens and Williamson (2001): Target
emerging sectors– Nunn and Trefler (2006): Target skill-
intensive sectors– Rodrik (2008) suggests under-valuing the
exchange rate to promote tradeables– Easterly et al (2009): manufactured exports– Alfaro and Charlton (2010): FDI promotion,
which targets high-tech sectors, leads to higher quality FDI and growth

III. Digging Deeper: What to promote and How

Should successful IP promote emerging, not declining sectors ?
USA
Bailing out sunset industries Promoting emerging sectors
China

Harrison and Rodriguez Clare (2010) in Handbook of Development Economics promote “soft” IP
“Hard” industrial Policy:– Tariffs– Subsidies to specific
sectors– Tax breaks for foreign
investors– Domestic content
requirements
Soft” Industrial Policy:– Special Economic
Zones offering lower cost infrastructure
– Roads and ports designed to increase trade
– Special Credit for exporters (Trade Credit)
– Promoting clusters in order to export
? √

Two Questions for Today
• What types of sectors do governments target for trade and tax policies?
• How do patterns of tariff and tax policies to promote industry affect productivity levels and growth within China?

This Paper
• Define a series of correlations within China to identify what sectors are targeted by local governments.
• Why China? (data, governance, city variation)• Building on Nunn and Trefler (2006), we focus on the
correlation between tariffs or tax holidays and industrial characteristics
• Focus on three types of sectors: Export intensive (EXP/SALES): export procurement/industrial sales Skill intensive (S/UNSK): #skilled workers /#unskilled workers, skilled
workers are those with at least high school education R&D intensive: #high-level technicians and engineers/total workforce
Measures of Patterns of Interventions(Does “what” you promote matter?)
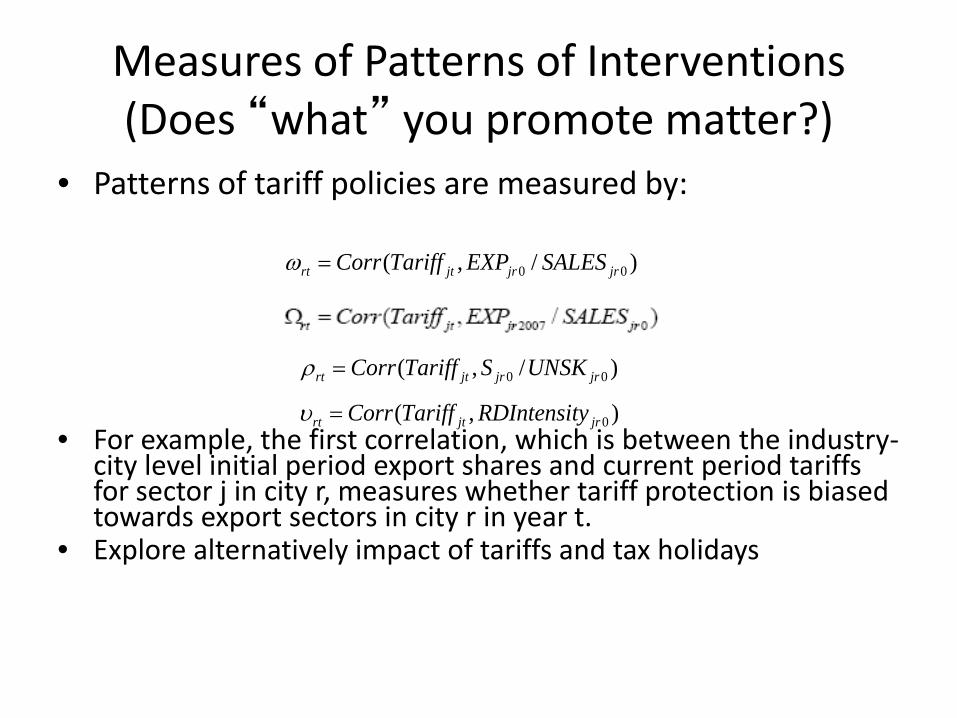
• Patterns of tariff policies are measured by:
• For example, the first correlation, which is between the industry-city level initial period export shares and current period tariffs for sector j in city r, measures whether tariff protection is biased towards export sectors in city r in year t.
• Explore alternatively impact of tariffs and tax holidays
0 0( , / )rt jt jr jrCorr Tariff EXP SALESω =
0 0( , / )rt jt jr jrCorr Tariff S UNSKρ =
0( , )rt jt jrCorr Tariff RDIntensityυ =

Estimation Strategy• Estimate the effect of patterns of policies on
firm performance. • Measures of performance:
Total factor productivity estimated using four methods: Aw, Chen, and Roberts 2001 (AW), OLS, OLS with fixed effects, and Olley & Pakes 1996 (OP).
• Alternative measures of performance: firm productivity levels and growth rates Industry-city aggregate productivity levels “Between” measure of aggregate TFP: measures
movement into new sectors and contribution to TFP

Estimation Strategy
• Firm-level estimation :

Estimation Strategy
• Industry-level estimation:
• The aggregate industry productivity is measured by: ln lnjrt it ijrt
iTFP s TFP=∑

Data • Chinese Industrial firms from NBS: annual
survey of all enterprises with more than 5 million RMB sales
• Annual data for 1998 through 2007
• Information on outputs and inputs, ownership
• Tax incentives based on deviations from statutory taxes, based on taxes paid/profits
• Tariff dataset from the World Integrated Trading Solution (WITS)

Summary Statistics: What Sectors are Promoted in China?
Table 3.2 Patterns of Tariffs and Tax by Year, excluding alcohol and tobacco sectors
Year Cor(Tariff, Export/Sales)
Cor(Tariff, Export/Sales_07)
Cor(Tariff, Skilled/Unskilled)
Cor(Tariff, RD intensity)
Cor(Tax, Export/Sales)
Cor(Tax, Export/Sales_07)
Cor(Tax, Skilled/Unskilled)
Cor(Tax, RD intensity)
1998 0.0476 0.0578 -0.0288 -0.1521 -0.1277 -0.0359 0.0395 0.0845
1999 0.0197 0.0431 -0.0123 -0.1502 -0.1077 -0.0382 0.0494 0.1061
2000 -0.0049 0.0223 -0.0045 -0.1464 -0.0857 -0.0352 0.0375 0.0794
2001 0.0322 0.0584 -0.0567 -0.1733 -0.0783 -0.0399 0.0368 0.066
2002 0.0313 0.0551 -0.0528 -0.1754 -0.1332 -0.0739 0.0479 0.0934
2003 0.0263 0.0413 -0.0513 -0.1596 -0.1257 -0.0813 0.0242 0.0972
2004 0.0134 0.0426 -0.0379 -0.1342 -0.1345 -0.1022 -0.0003 0.1091
2005 0.0511 0.0767 -0.0523 -0.1186 -0.0998 -0.0978 0.0031 0.0919
2006 0.0266 0.0446 -0.0518 -0.1272 -0.0949 -0.0974 -0.0248 0.0718
2007 0.0185 0.0353 -0.0592 -0.1341 -0.0747 -0.0963 -0.0012 0.0859
Total 0.0264 0.0478 -0.0444 -0.1428 -0.1043 -0.0706 0.0138 0.0886
Notes: All endowments are measured by industry-city level beginning or end of period values (2008 or 2007 for export intensity, 2004 for skill and RD intensity). Export intensity equals export procurement divided by industrial sales; the ratio between skilled workers (educations equivalent to or higher than senior high school) and unskilled workers is defined as skill intensity; RD intensity is defined as the share of high level technicians and engineers in total number of employees.
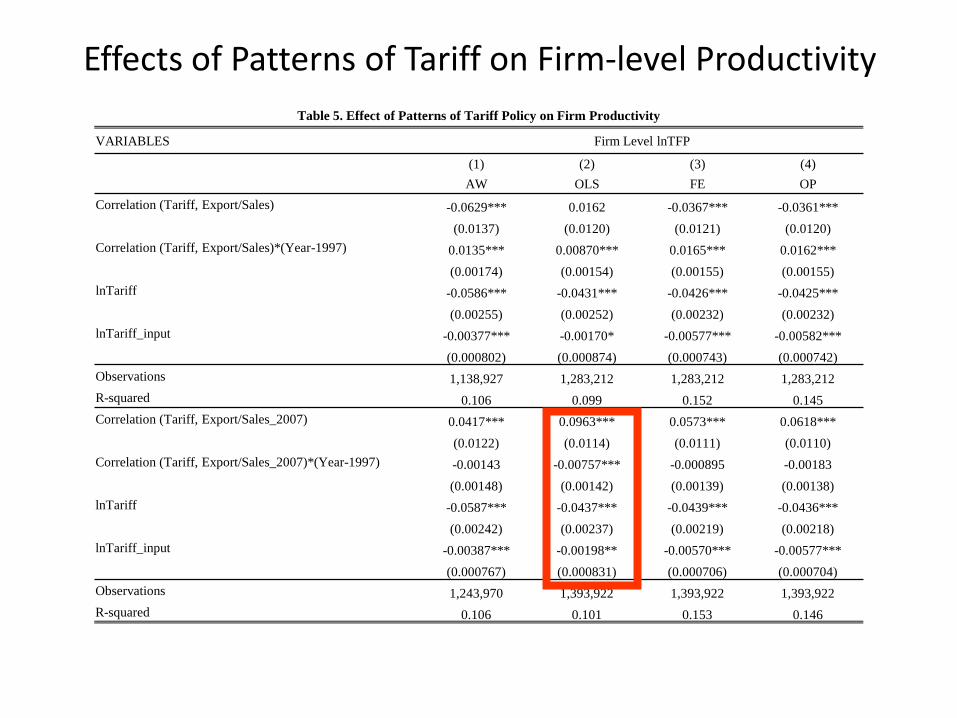
Effects of Patterns of Tariff on Firm-level ProductivityTable 5. Effect of Patterns of Tariff Policy on Firm Productivity
VARIABLES Firm Level lnTFP
(1) (2) (3) (4)AW OLS FE OP
Correlation (Tariff, Export/Sales) -0.0629*** 0.0162 -0.0367*** -0.0361***(0.0137) (0.0120) (0.0121) (0.0120)
Correlation (Tariff, Export/Sales)*(Year-1997) 0.0135*** 0.00870*** 0.0165*** 0.0162***(0.00174) (0.00154) (0.00155) (0.00155)
lnTariff -0.0586*** -0.0431*** -0.0426*** -0.0425***(0.00255) (0.00252) (0.00232) (0.00232)
lnTariff_input -0.00377*** -0.00170* -0.00577*** -0.00582***(0.000802) (0.000874) (0.000743) (0.000742)
Observations 1,138,927 1,283,212 1,283,212 1,283,212R-squared 0.106 0.099 0.152 0.145Correlation (Tariff, Export/Sales_2007) 0.0417*** 0.0963*** 0.0573*** 0.0618***
(0.0122) (0.0114) (0.0111) (0.0110)Correlation (Tariff, Export/Sales_2007)*(Year-1997) -0.00143 -0.00757*** -0.000895 -0.00183
(0.00148) (0.00142) (0.00139) (0.00138)lnTariff -0.0587*** -0.0437*** -0.0439*** -0.0436***
(0.00242) (0.00237) (0.00219) (0.00218)lnTariff_input -0.00387*** -0.00198** -0.00570*** -0.00577***
(0.000767) (0.000831) (0.000706) (0.000704)Observations 1,243,970 1,393,922 1,393,922 1,393,922R-squared 0.106 0.101 0.153 0.146

Table 5. Effect of Patterns of Tariff Policy on Firm Productivity (continued)
VARIABLES Firm Level lnTFP
(1) (2) (3) (4)AW OLS FE OP
Correlation (Tariff, Skilled/Unskilled) -0.0280*** -0.0206*** -0.0244*** -0.0235***
(0.00853) (0.00762) (0.00755) (0.00753)Correlation (Tariff, Skilled/Unskilled)*(Year-1997) -0.00132 -0.00444*** -0.00190* -0.00209**
(0.00122) (0.00106) (0.00107) (0.00107)lnTariff -0.0585*** -0.0432*** -0.0434*** -0.0431***
(0.00242) (0.00239) (0.00221) (0.00220)lnTariff_input -0.00379*** -0.00176** -0.00551*** -0.00558***
(0.000767) (0.000833) (0.000707) (0.000706)Observations 1,248,948 1,400,266 1,400,266 1,400,266R-squared 0.106 0.101 0.152 0.145Correlation (Tariff, RD intensity) -0.0523*** 0.0459*** -0.0159* -0.0149*
(0.00952) (0.00857) (0.00840) (0.00838)Correlation (Tariff, RD intensity)*(Year-1997) 0.00993*** -0.00554*** 0.00297** 0.00281**
(0.00138) (0.00128) (0.00126) (0.00125)lnTariff -0.0587*** -0.0432*** -0.0434*** -0.0431***
(0.00242) (0.00239) (0.00221) (0.00220)lnTariff_input -0.00383*** -0.00177** -0.00553*** -0.00560***
(0.000767) (0.000832) (0.000707) (0.000705)Observations 1,248,916 1,400,219 1,400,219 1,400,219R-squared 0.106 0.101 0.152 0.145Firm Fixed Effects Yes Yes Yes Yes
Year Dummies Yes Yes Yes Yes

Estimation Results: Effects of Patterns of Tariff on Industry-City Aggregate Productivity
Table 7. Effect of Patterns of Tariff Policy on Industry-City Aggregate Productivity
VARIABLES Industry-City Level Aggregate lnTFP
(1) (2) (3) (4)
AW OLS FE OP
Correlation (Tariff, Export/Sales) 0.126*** 0.0511*** 0.0893*** 0.0909***(0.0260) (0.0167) (0.0219) (0.0212)
Correlation (Tariff, Export/Sales)*(Year-1997) -0.00804** -0.000732 -0.00616* -0.00595*(0.00370) (0.00226) (0.00310) (0.00300)
lnTariff -0.114*** -0.112** -0.110*** -0.110***(0.0413) (0.0424) (0.0412) (0.0412)
lnTariff_input -0.274** -0.308** -0.264** -0.264**(0.112) (0.122) (0.115) (0.115)
Observations 107,189 112,565 112,565 112,565R-squared 0.280 0.230 0.291 0.298Correlation (Tariff, Export/Sales_2007) 0.0552** 0.0264 0.0214 0.0269
(0.0257) (0.0220) (0.0251) (0.0245)Correlation (Tariff, Export/Sales_2007)*(Year-1997) -0.0110*** -0.00899*** -0.0141*** -0.0139***
(0.00409) (0.00324) (0.00376) (0.00370)lnTariff -0.112*** -0.114*** -0.112*** -0.112***
(0.0412) (0.0420) (0.0410) (0.0409)lnTariff_input -0.270** -0.301** -0.257** -0.257**
(0.112) (0.122) (0.114) (0.114)Observations 111,547 117,064 117,064 117,064R-squared 0.279 0.229 0.291 0.299

Table 7. Effect of Patterns of Tariff Policy on Industry-City Aggregate Productivity (continued)
VARIABLES Industry-City Level Aggregate lnTFP
(1) (2) (3) (4)
AW OLS FE OP
Correlation (Tariff, Skilled/Unskilled) -0.0871*** -0.0414*** -0.0745*** -0.0722***(0.0218) (0.0136) (0.0168) (0.0164)
Correlation (Tariff, Skilled/Unskilled)*(Year-1997) 0.00859*** 0.000682 0.00378 0.00376(0.00284) (0.00198) (0.00239) (0.00233)
lnTariff -0.113*** -0.113*** -0.113*** -0.112***(0.0402) (0.0415) (0.0404) (0.0403)
lnTariff_input -0.276** -0.297** -0.256** -0.255**(0.111) (0.122) (0.115) (0.114)
Observations 113,941 119,871 119,871 119,871R-squared 0.278 0.220 0.290 0.297Correlation (Tariff, RD intensity) -0.0191 0.00719 -0.0892*** -0.0764***
(0.0193) (0.0147) (0.0202) (0.0192)Correlation (Tariff, RD intensity)*(Year-1997) -0.000198 -0.00434* 0.00536* 0.00411
(0.00261) (0.00238) (0.00279) (0.00269)lnTariff -0.113*** -0.113*** -0.113*** -0.112***
(0.0402) (0.0415) (0.0403) (0.0403)lnTariff_input -0.275** -0.296** -0.257** -0.256**
(0.111) (0.122) (0.115) (0.114)Observations 113,912 119,830 119,830 119,830R-squared 0.278 0.220 0.290 0.297Industry Fixed Effects YES YES YES YESRegion Dummies YES YES YES YES
Year Dummies YES YES YES YES

Estimation Results: Effects of Patterns of Tax PoliciesTable 8. Effect of Patterns of Tax Policy on Industry-City Aggregate Productivity
VARIABLES Industry-City Level Aggregate lnTFP(1) (2) (3) (4)AW OLS FE OP
Correlation (Tax, Export/Sales) -0.0174 -0.00650 -0.115*** -0.0999***(0.0196) (0.0143) (0.0161) (0.0155)
Correlation (Tax, Export/Sales)*(Year-1997) 0.000266 -0.00153 0.00713*** 0.00598**(0.00264) (0.00218) (0.00234) (0.00226)
lnTax -0.0296*** -0.00483*** -0.00571 -0.00809**(0.00306) (0.00180) (0.00357) (0.00321)
Observations 101,364 105,660 105,660 105,660R-squared 0.290 0.243 0.298 0.307Correlation (Tax, Export/Sales_2007) -0.0504** -0.0212 -0.0944*** -0.0891***
(0.0191) (0.0154) (0.0185) (0.0178)Correlation (Tax, Export/Sales_2007)*(Year-1997) 0.0110*** 0.00401 0.00864*** 0.00893***
(0.00289) (0.00258) (0.00290) (0.00284)lnTax -0.0282*** -0.00413** -0.00502 -0.00738**
(0.00299) (0.00176) (0.00374) (0.00334)Observations 105,200 109,612 109,612 109,612R-squared 0.290 0.241 0.297 0.306Correlation (Tax, Skilled/Unskilled) 0.0530*** -0.00616 0.0417*** 0.0393***
(0.0164) (0.0112) (0.0137) (0.0133)Correlation (Tax, Skilled/Unskilled)*(Year-1997) -0.00450** 0.000441 -0.00525*** -0.00483***
(0.00205) (0.00143) (0.00168) (0.00164)lnTax -0.0287*** -0.00491*** -0.00562 -0.00798**
(0.00300) (0.00177) (0.00376) (0.00336)Observations 107,236 111,972 111,972 111,972R-squared 0.288 0.233 0.296 0.304Correlation (Tax, RD intensity) 0.0797*** 0.0225** 0.0352** 0.0358***
(0.0125) (0.0111) (0.0138) (0.0130)Correlation (Tax, RD intensity)*(Year-1997) -0.00936*** -0.000661 -0.00155 -0.00187
(0.00187) (0.00172) (0.00207) (0.00196)lnTax -0.0284*** -0.00466*** -0.00532 -0.00769**
(0.00299) (0.00175) (0.00373) (0.00333)Observations 107,207 111,932 111,932 111,932R-squared 0.289 0.233 0.296 0.305

Results SummaryTable 9.1. Summary of Tariff Results
Tariff Correlation (Tariff, Export/Sales)
Correlation (Tariff, Skilled/Unskilled)
Correlation (Tariff, RD intensity)
Firm Level lnTFPAW - +/+ - /OLS - +/+ - +FE - +/+ - /OP - +/+ - /
Industry-City Level Aggregate lnTFPAW - +// - -OLS - +/- - -FE - +/- - -OP - +/- - -
Annual Growth of Firm Level lnTFPFE / +/+ + /
Table 9.2 Summary of Tax Results
Correlation (Tax, Export/Sales)
Correlation (Tax, Skilled/Unskilled)
Correlation (Tax, RD intensity)
Industry-City Level Aggregate lnTFPAW //- + +OLS // / +FE -/- + +OP -/- + +

Moving into higher productivity sectors: what matters?
• Can decompose Industry-city level growth into a “within” component and a “between” component which reflects structural change.
• Rodrik (2011) and McMillan and Rodrik (2010) show much of difference in Asian versus other regions’growth is due to the between component
• Across Chinese cities, biggest determinant of between component of productivity growth is not driven by policies but by foreign investment, which encourages firms to move into high productivity sectors

Concluding Comments• Net impact of tariffs negative because while
interventions skewed towards sectors where China has a comparative advantage helped (measured by export intensity), the targeting was not strong enough
• Strong evidence that tax holidays led to higher growth when targeted at export-oriented, unskilled-intensive, and less R&D intensive sectors in China.
• Because targeting was stronger using tax holidays, and effect uniformly positive, net impact of this intervention has been positive on firm productivity growth
• Targeting exports, unskilled intensive sectors, and sectors not intensive in the use of R and D was a strategy consistent with China’s comparative advantage
• As China’s comparative advantage evolved, the benefits of such targeting fell.
Final Take-Aways• Final goods and input tariffs have significantly
negative effects on both firm and industry level productivity and growth;
• Tariff protection and tax reduction policies are most successful in a country like China during the 1998-2007 period when targeted at exportables, unskilled-intensive, and less R&D intensive sectors.
• As China’s comparative advantage has evolved, optimal targeting policies have also changed.