The PAS Group Limited FY2017 Results Briefing · The PAS Group Limited – FY2017 Results Briefing...
20
24 August 2017 The PAS Group Limited – FY2017 Results Briefing ABN 25 169 477 463
Transcript of The PAS Group Limited FY2017 Results Briefing · The PAS Group Limited – FY2017 Results Briefing...

24 August 2017
The PAS Group Limited – FY2017 Results Briefing ABN 25 169 477 463
2
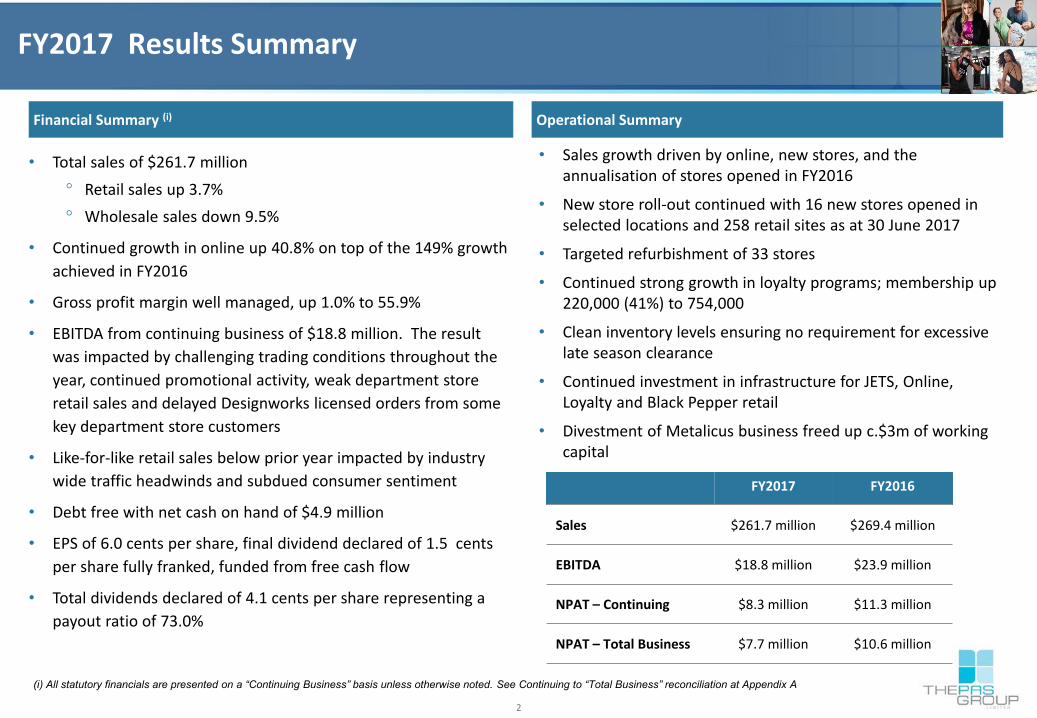
FY2017 Results Summary
Financial Summary (i)
Operational Summary
FY2017 FY2016
Sales $261.7 million $269.4 million
EBITDA $18.8 million $23.9 million
NPAT – Continuing $8.3 million $11.3 million
NPAT – Total Business $7.7 million $10.6 million
• Sales growth driven by online, new stores, and the annualisation of stores opened in FY2016
• New store roll-out continued with 16 new stores opened in selected locations and 258 retail sites as at 30 June 2017
• Targeted refurbishment of 33 stores
• Continued strong growth in loyalty programs; membership up 220,000 (41%) to 754,000
• Clean inventory levels ensuring no requirement for excessive late season clearance
• Continued investment in infrastructure for JETS, Online, Loyalty and Black Pepper retail
• Divestment of Metalicus business freed up c.$3m of working capital
• Total sales of $261.7 million
Retail sales up 3.7%
Wholesale sales down 9.5%
• Continued growth in online up 40.8% on top of the 149% growth
achieved in FY2016
• Gross profit margin well managed, up 1.0% to 55.9%
• EBITDA from continuing business of $18.8 million. The result
was impacted by challenging trading conditions throughout the
year, continued promotional activity, weak department store
retail sales and delayed Designworks licensed orders from some
key department store customers
• Like-for-like retail sales below prior year impacted by industry
wide traffic headwinds and subdued consumer sentiment
• Debt free with net cash on hand of $4.9 million
• EPS of 6.0 cents per share, final dividend declared of 1.5 cents
per share fully franked, funded from free cash flow
• Total dividends declared of 4.1 cents per share representing a
payout ratio of 73.0%
(i) All statutory financials are presented on a “Continuing Business” basis unless otherwise noted. See Continuing to “Total Business” reconciliation at Appendix A
3
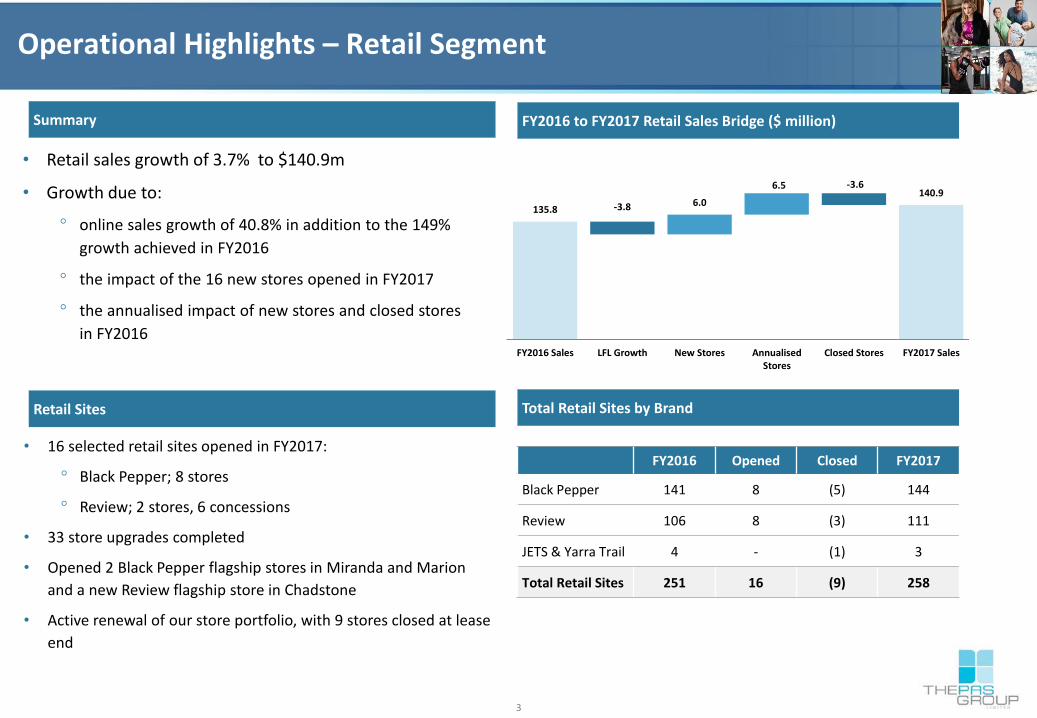
135.8 -3.8 6.0
6.5 -3.6 140.9
FY2016 Sales LFL Growth New Stores AnnualisedStores
Closed Stores FY2017 Sales
Operational Highlights – Retail Segment
• 16 selected retail sites opened in FY2017:
Black Pepper; 8 stores
Review; 2 stores, 6 concessions
• 33 store upgrades completed
• Opened 2 Black Pepper flagship stores in Miranda and Marion
and a new Review flagship store in Chadstone
• Active renewal of our store portfolio, with 9 stores closed at lease
end
Total Retail Sites by Brand
FY2016 Opened Closed FY2017
Black Pepper 141 8 (5) 144
Review 106 8 (3) 111
JETS & Yarra Trail 4 - (1) 3
Total Retail Sites 251 16 (9) 258
• Retail sales growth of 3.7% to $140.9m
• Growth due to:
online sales growth of 40.8% in addition to the 149%
growth achieved in FY2016
the impact of the 16 new stores opened in FY2017
the annualised impact of new stores and closed stores
in FY2016
Summary FY2016 to FY2017 Retail Sales Bridge ($ million)
Retail Sites

4
Operational Highlights – Online & Customer Loyalty
• Online sales now represent 12.4% of Group retail sales, up from 8.6% in
FY2016
• Access to key retail partners online customer base was achieved via the
launch of Myer Dropship and The Iconic for Review with sales exceeding
expectations in both channels
• Initiated discussions with both Amazon and Alibaba with a planned
launch on their marketplace channels to take place in FY2018
• Launch of new White Runway and Black Pepper websites in H1
incorporating enhanced functionality and improved navigation and
checkout
• Launched a new JETS website in February 2017 on the Salesforce
Commerce Cloud platform, providing improved customer experience
and conversion
• Loyalty membership grew by a further 220,000 members (up 41%) in
FY2017 to 754,000 members. Loyalty sales now represent c.76% of
sales and the program continues to provide improved consumer
insights, enables tailored communication and drives traffic to our retail
stores
• Successful launch of Loyalty App for Review with more than 30,000
downloads driving higher conversion and engagement with top
spenders
• Launch of new social media channels for Review with Weibo and
WeChat as a first step in our entry to the China market
New JETS Website and David Jones Dropship
Loyalty and Online Growth FY2014 –FY2017
108 2.6%
342
4.5%
534 8.6%
754 12.4%
Loyalty ('000 members) Online % of sales
FY14 FY15 FY16 FY17
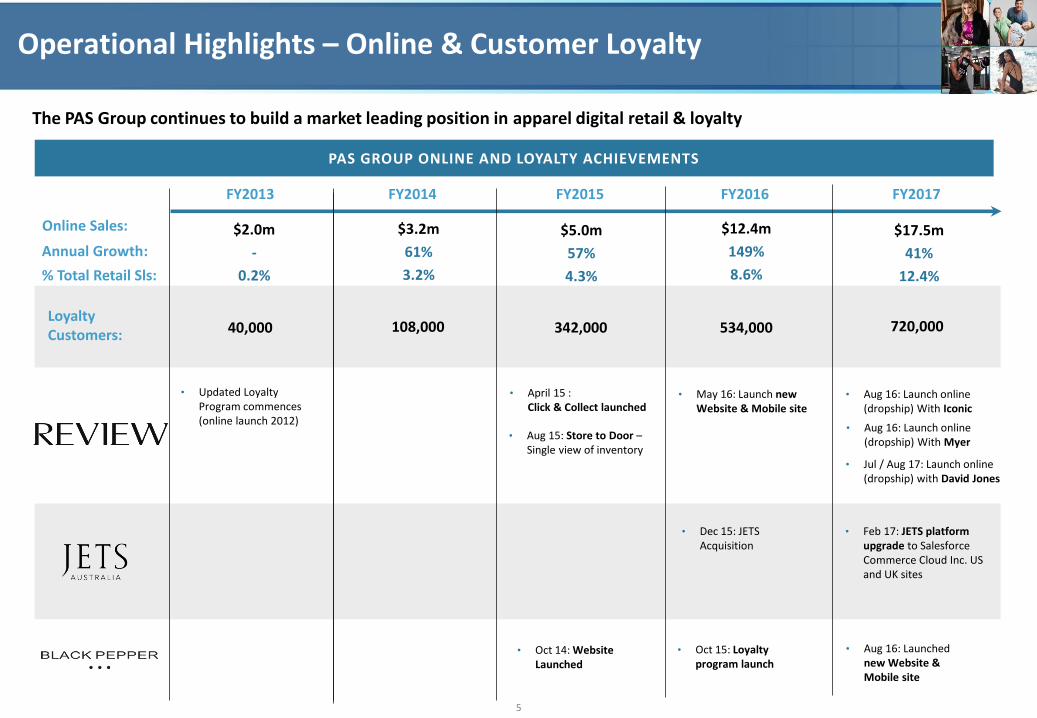
5
Operational Highlights – Online & Customer Loyalty
PAS GROUP ONLINE AND LOYALTY ACHIEVEMENTS
The PAS Group continues to build a market leading position in apparel digital retail & loyalty
Online Sales: $3.2m
61%
3.2%
$2.0m
-
0.2%
$5.0m
57%
4.3%
$12.4m
149%
8.6%
$17.5m
41%
12.4%
40,000 108,000 342,000 534,000 720,000
• Aug 16: Launch online (dropship) With Myer
• Updated Loyalty Program commences (online launch 2012)
• Jul / Aug 17: Launch online (dropship) with David Jones
• Aug 15: Store to Door – Single view of inventory
• April 15 : Click & Collect launched
• Aug 16: Launch online (dropship) With Iconic
• May 16: Launch new Website & Mobile site
Loyalty Customers:
Annual Growth:
• Feb 17: JETS platform upgrade to Salesforce Commerce Cloud Inc. US and UK sites
• Dec 15: JETS Acquisition
• Aug 16: Launched new Website & Mobile site
• Oct 14: Website Launched
• Oct 15: Loyalty program launch
FY2013 FY2014 FY2015 FY2016 FY2017
% Total Retail Sls:

6
Operational Highlights – Wholesale, Design & Distribution
• Wholesale sales were $120.9m, down 9.5% on the same period
last year
• Sales were down on the prior year due to order movements from
Designworks department store customers offset partially by a
full year of JETS (FY2016 seven months)
DESIGNWORKS
• Sales down 16.4% to $84.6 million largely due reduced and
delayed licensed orders from some key department store
customers
• Increased FY2017 sales in the Sport Division driven by growth in
new Footwear ranges and Sports Equipment
• Business well positioned for FY2018 incorporating new supply
opportunities with major customers and the launch of a new
major sports license
OTHER WHOLESALE
• Growth in JETS driven by strong international wholesale
• Further investment in JETS infrastructure to drive growth
• Growth in Yarra Trail wholesale
• Continued shift from Wholesale to Retail in Black Pepper
Wholesale Sales by Brand – FY2016 v FY2017
76% 70%
11% 10%
14% 20%
FY2016 FY2017
Designworks Black Pepper Other

7
Sales by customer
• Investment in own retail and International channels continues to reduce reliance on local Discount Department stores
• Continued growth in Sport and Footwear through Rebel and Independents
• Increase in David Jones due to JETS and the launch of Review concessions
• Kmart reduction due to reduced character licensing partially offset by growth in Target
Kmart 15.2%
Target 6.9%
Rebel 1.6%
Big W 2.4%
Myer - Concessions
11.2%
Myer - Wholesale
3.5%
David Jones 2.4%
Independent Wholesale
10.5%
Own Retail Stores 42.4%
International 3.9%
Sales by Customer /Channel – Full Year FY2017
Kmart 21.0%
Target 5.1%
Rebel 1.3%
Myer - Concessions
11.7%
Myer - Wholesale
4.6% David Jones 1.0%
Independent Wholesale
14.6%
Own Retail Stores 38.7%
International 2.1%
Sales by Customer /Channel – Full Year FY2016

8
Gross Margin and Exchange Rates
• Gross margin has continued to be well managed through
the currency cycle despite historical depreciation in the
AUD
• FY2017 Gross profit % 100bps higher than prior year
driven by a higher retail mix
• Forward US dollar currency requirements for retail
businesses covered to the end of FY2018 at c.$0.75
• Future currency requirements and wholesale pricing are
determined when firm orders are received
Exchange rate and margin
$0.88
$0.75 $0.73
55.2% 54.9% 55.9%
FY2015 FY2016 FY2017
AUD $ Gross Margin %

9
Future Growth Plan
New Store Roll Out
• Selected new stores to be opened with the major emphasis on David Jones concessions (opening an additional 8 in addition to the 4 opened in FY2017)
• Implementation of a new future store concept for Review
Store Enhancement
• 26 Targeted refurbishments planned in FY2018
• New future store concept planned for Review concession in Myer and David Jones
• New store concept for the JETS Noosa store as well as David Jones
Product and Brand Extension
• Planned growth in Designworks sports & footwear division
• Expansion in Everlast product categories through Everlast FIT
• Launch of a major new sport brand
• Launch of BOD Activewear by Racheal Finch in department stores and online
Licensing Opportunities
• Continue to leverage alliance with UK based global brand owner IBML – new major sports licence confirmed in FY2017
• Opportunities with strong portfolio of licences and an ongoing pipeline of new licensed opportunities
Online Growth
• New website planned for Review on the Salesforce Commerce Cloud Platform leveraging the success of JETS
• Planned launch of additional group brands on the Amazon Marketplace
• Planned Launch of Review and possibly Yarra Trail on the Alibaba Tmall global platform
• Launch of Everlast online
Loyalty • Launch of a new Black Pepper loyalty program
• Continued focus on mobile loyalty and segmented, targeted communications
International Growth • JETS international growth through wholesale and online – US focus for FY2018
• Review China and Asia entry through Alibaba platforms
Acquisitions • Bondi Bather swimwear acquired in August 2017 as a strategic addition to the swimwear division
• Continuing to evaluate a broad range of value enhancing opportunities
1
2
3
4
5
6
7
8
10
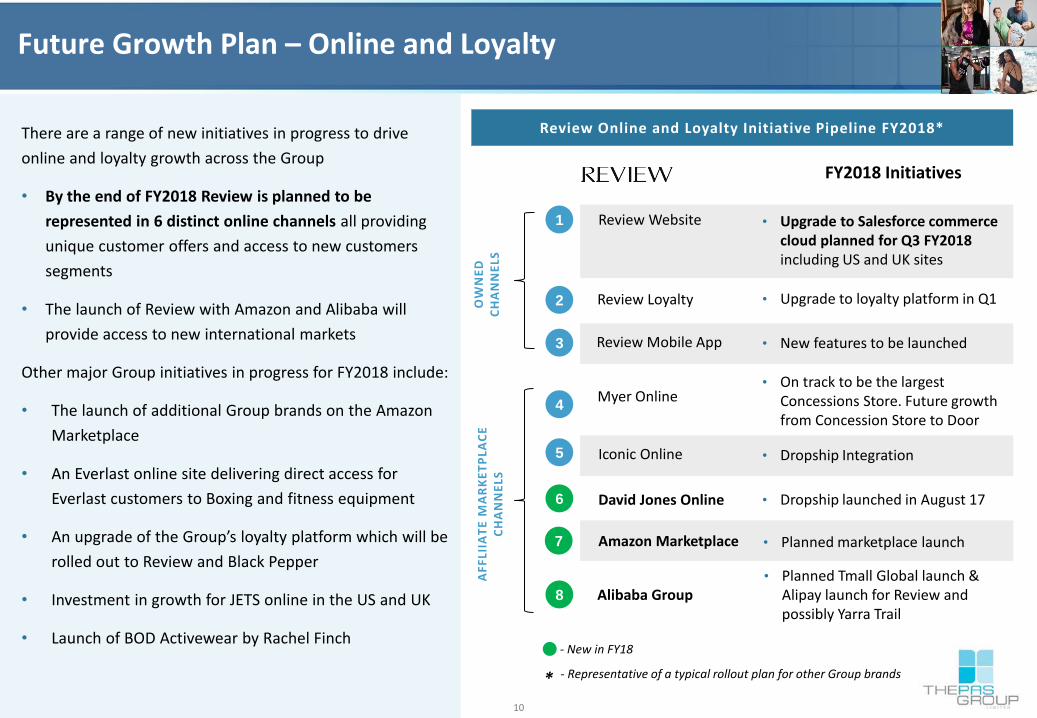
Future Growth Plan – Online and Loyalty
Review Online and Loyalty Initiative Pipeline FY2018*
• Upgrade to Salesforce commerce cloud planned for Q3 FY2018 including US and UK sites
Review Website
Review Mobile App • New features to be launched
Myer Online • On track to be the largest
Concessions Store. Future growth from Concession Store to Door
David Jones Online • Dropship launched in August 17
Iconic Online • Dropship Integration
Amazon Marketplace • Planned marketplace launch
Alibaba Group • Planned Tmall Global launch &
Alipay launch for Review and possibly Yarra Trail
• Upgrade to loyalty platform in Q1 Review Loyalty
FY2018 Initiatives
There are a range of new initiatives in progress to drive
online and loyalty growth across the Group
• By the end of FY2018 Review is planned to be
represented in 6 distinct online channels all providing
unique customer offers and access to new customers
segments
• The launch of Review with Amazon and Alibaba will
provide access to new international markets
Other major Group initiatives in progress for FY2018 include:
• The launch of additional Group brands on the Amazon
Marketplace
• An Everlast online site delivering direct access for
Everlast customers to Boxing and fitness equipment
• An upgrade of the Group’s loyalty platform which will be
rolled out to Review and Black Pepper
• Investment in growth for JETS online in the US and UK
• Launch of BOD Activewear by Rachel Finch
6
5
4
3
2
1
8
7
OW
NE
D
C
HA
NN
ELS
A
FF
LIIA
TE
MA
RK
ET
PLA
CE
C
HA
NN
ELS
- New in FY18
- Representative of a typical rollout plan for other Group brands *

11
Outlook
• Trading conditions in the first 8 weeks remain challenging with comp store growth below prior year
• Planned moderate like-for-like sales growth from Q2
• Continued focus and investment on growing online sales and loyalty programs through own channels and international
marketplace opportunities
• Selected new stores to be opened in FY2018
Opening 15 new stores, of which 8 will be David Jones Concessions
New store concepts to be introduced for Review and JETS
Planning to close between 10 – 15 stores at lease expiry in FY2018
• Continued investment to grow JETS online, retail and international wholesale
• Designworks growth from the new Sport Division including new categories in Footwear and Equipment and the launch of
a new sports brand
• Strong cash generation with no debt and a new flexible banking deal to cost effectively accommodate growth
• Continuing to explore potential acquisitions & licensing opportunities
Acquisition in August of Bondi Bather

FY2017 Financials
13
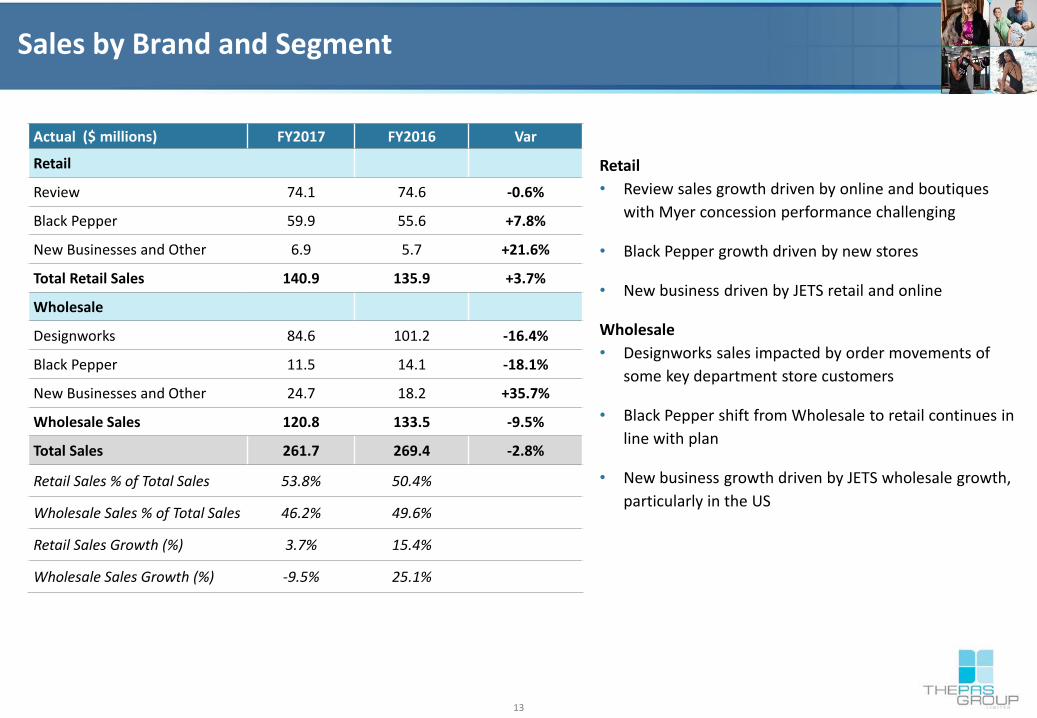
Sales by Brand and Segment
Actual ($ millions) FY2017 FY2016 Var
Retail
Review 74.1 74.6 -0.6%
Black Pepper 59.9 55.6 +7.8%
New Businesses and Other 6.9 5.7 +21.6%
Total Retail Sales 140.9 135.9 +3.7%
Wholesale
Designworks 84.6 101.2 -16.4%
Black Pepper 11.5 14.1 -18.1%
New Businesses and Other 24.7 18.2 +35.7%
Wholesale Sales 120.8 133.5 -9.5%
Total Sales 261.7 269.4 -2.8%
Retail Sales % of Total Sales 53.8% 50.4%
Wholesale Sales % of Total Sales 46.2% 49.6%
Retail Sales Growth (%) 3.7% 15.4%
Wholesale Sales Growth (%) -9.5% 25.1%
Retail
• Review sales growth driven by online and boutiques
with Myer concession performance challenging
• Black Pepper growth driven by new stores
• New business driven by JETS retail and online
Wholesale
• Designworks sales impacted by order movements of
some key department store customers
• Black Pepper shift from Wholesale to retail continues in
line with plan
• New business growth driven by JETS wholesale growth,
particularly in the US

14
Income Statement
Continuing Business ($ millions)(i) FY2017 FY2016 Var
Revenue from Sales 261.7 269.4 -2.8%
Gross Profit 146.3 147.8
Gross Profit Margin (%) 55.9% 54.9%
Cost of Doing Business (CODB) (127.5) (123.9)
CODB (%) 48.7% 46.0%
EBITDA 18.8 23.9 -21.3%
Depreciation & Amortisation (7.7) (6.8)
EBIT 11.1 17.1 -35.4%
Net Finance Costs (0.7) (0.9)
PBT 10.4 16.2 -35.9%
Tax Expense (2.1) (4.9)
NPAT – Continuing Business 8.3 11.3 -27.1%
NPAT – Discontinued Business (0.6) (0.7)
NPAT – Reported 7.7 10.6 -27.4%
• Gross profit margin up 100 basis points reflecting
increase to retail mix
• CODB increase on prior year of 270 basis points (which
includes revenue of $1.7m from the release of deferred
and contingent consideration relating to the conclusion
of the JETS acquisition) was predominantly due to:
Property and employment costs associated with
new stores in FY2017 and full year impact of stores
rolled out in FY2016
Investment in Black Pepper retail infrastructure
Full year annualisation and investment in JETS
Investment in digital marketing and fulfilment
costs for online sales growth
• Depreciation increase largely due to the annualisation
of new stores and investment in online
• Net finance costs decrease was largely due to new
banking deal entered into in January allowing access to
cheaper debt funding of working capital cycle
(i) See Continuing Business to Total Business Income Statement reconciliation at Appendix A

15
Balance Sheet
Statutory ($ millions) 30 June 2017 30 June 2016
Cash and Cash Equivalents 4.9 7.9
Trade and Other Receivables 20.3 21.2
Inventory 33.1 30.1
Property, Plant and Equipment 15.6 13.7
Deferred Tax Assets 7.4 8.8
Goodwill & Other Intangible Assets 85.5 85.4
Assets Held for Sale - 3.6
Other Assets 3.9 4.2
Total Assets 170.7 174.9
Trade and Other Payables 18.5 18.3
Deferred Tax Liabilities 7.5 7.5
Liabilities Held for Sale - 0.3
Other Liabilities 18.2 23.0
Total Liabilities 44.2 49.1
Net Assets 126.5 125.8
• No debt
• Net cash of $4.9 million (as at 30 June 2017)
• Inventory increase due to new stores and investment in
JETS stock levels
• PP&E increase due to new stores and refurbishment
investment and transition to the new Designworks
support office
• Net Assets and Liabilities Held for Sale represents the
net value of assets and liabilities relating to the
Metalicus discontinued business which completed on 30
September 2016
• Other liabilities decrease was primarily due to a
reduction in deferred and contingent consideration
payable relating to the JETS acquisition as well as
reductions in employee and lease incentive liabilities

16
Statutory ($ millions) FY2017 FY2016
Net profit after tax (i) 7.7 10.6
Adjustments (incl depreciation, interest and tax) 10.6 11.5
Cash profit 18.3 22.1
Movement in Working Capital (2.9) (2.2)
Movement in Trade & Other Receivables 1.1 1.6
Movement in Inventories (3.0) (5.2)
Movement in Trade & Other Payables (1.0) 1.4
Movement in prepayments and provisions (3.1) 0.6
Net cash flow from operations 12.3 20.5
Receipts/(Payments) for Businesses 3.0 (11.5)
Capital Expenditure (8.6) (7.9)
Lease Incentive - Support Offices 0.7 1.7
Net cash flow before financing activities and tax 7.4 2.8
Income Tax (Paid)/Refund (2.4) 1.0
Net Interest (0.8) (0.9)
Dividends Paid (7.1) (7.8)
Net Cash Flow (2.9) (4.9)
Cash Flow Statement
• Positive net cash flow generated pre dividends
• Operational cash flows impacted reduced EBITDA and
investment in inventory
• Capital Expenditure reflects the continual store roll out
program, targeted investment in refurbishments,
ongoing development of our online and loyalty
infrastructure and build of the the new Designworks
office
• The movement in prepayments and provisions
incorporates the release of deferred and contingent
payments relating to JETS
• Receipts/(Payments) for Businesses reflect the net cash
inflow upon disposal of Metalicus in H1 FY2017 and
outflows for the initial payments for White Runway and
JETS in H1 FY2016
• Dividends paid reflect the payment of the Final Dividend
for FY2016 & FY2015
(i) NPAT includes aggregate impact of Metalicus discontinued business. Refer to Appendix A

17
Earnings by Segment
• Retail EBITDA decreased compared to prior year due to
challenging retail conditions including like for like retail
sales below prior year and under performance of retail
concession stores
• Included in the result were the positive impacts of the
strong online sales growth of 40.8%, 16 new store
openings and the net annualisation of 32 stores
opened in FY2016
• Wholesale EBITDA was below prior year predominantly
due to delayed department store and discount
department store orders, partially offset by a 130 bps
increase in gross margin
• Unallocated and Corporate underlying EBITDA has been
well managed and increased year on year due to
centralisation of $1.7m in Digital Marketing costs
Actual Underlying ($ millions) FY2017 FY2016
EBITDA
Retail 18.4 20.7
Margin (%) 13.1% 15.2%
Wholesale 10.1 11.9
Margin (%) 8.3% 8.9%
Unallocated / Corporate (9.7) (8.7)
Total EBITDA 18.8 23.9
Margin (%) 7.2% 8.9%
EBIT
Retail 13.1 16.3
Margin (%) 9.3% 12.0%
Wholesale 9.5 11.3
Margin (%) 7.9% 8.5%
Unallocated / Corporate (11.5) (10.5)
Total EBIT 11.1 17.1
Margin (%) 4.2% 6.4%

Appendices

19
Appendix A: Continuing to Total Business Reconciliation
(i) The FY2017 financial information presented reflects the operations for the three month ownership period ended 30 September 2016 whilst the FY2016 comparative period reflects a full
twelve months trading.
($’millions) FY2017
Revenue FY2017 EBITDA
FY2017 EBIT
FY2017 NPAT
FY2016 Revenue
FY2016 EBITDA
FY2016 EBIT
FY2016 NPAT
Continuing Business 261.7 18.8 11.1 8.3 269.4 23.9 17.1 11.3
Financial Impact: Metalicus Discontinued Operation(i) 5.3 (0.8) (0.8) (0.6) 25.4 (1.8) (2.2) (0.8)
Total Business 267.0 18.0 10.3 7.7 294.8 22.1 14.9 10.6
On 27 July 2016 The PAS Group Ltd (‘PAS’) announced that it had signed an agreement for the sale of its loss making Metalicus business to the General Pants Group. This transaction was successfully completed on 30 September 2016.
On this basis, the Metalicus business met the criteria to be classified as a discontinued operation for the year ended 30 June 2017. Accordingly, the results of the discontinued operation are presented separately in the consolidated statement of profit and loss and other comprehensive income and the assets and liabilities incorporated in the sale have been presented separately in the statement of financial position as assets held for sale for the comparative period 30 June 2016 in accordance with Accounting Standards.
All prior year comparatives throughout the financial statements and notes are representative of the continuing business only and Note 5 provides further information regarding the disposed business.
Whilst PAS believes that presenting continuing business profit provides a better understanding of its financial performance, for transparency, a reconciliation between the continuing business and the Total Business incorporating the Metalicus Discontinued Operation is provided below.
20
Disclaimer
Forward looking statements: This presentation contains certain forward looking statements, including with respect to the financial condition, results of operations
and businesses of The PAS Group Limited (‘PGR’) and certain plans and objectives of the management of PGR. Forward looking statements can generally be
identified by the use of words including but not limited to “project”, “foresee”, “objectives”, “plan”, “aim”, “intend”, “anticipate”, “believe”, “estimate”, “may”,
“should”, “will”, “forecast” or similar expressions. Indications of plans, strategies and objectives of management, sales and financial performance are also forward
looking statements.
All such forward looking statements involve known and unknown risks, significant uncertainties, assumptions, contingencies and other factors, many of which are
outside the control of PGR, which may cause the actual results or performance of PGR to be materially different from any future results or performance expressed
or implied by such forward looking statements. Such forward looking statements apply only as of the date of this presentation.
Factors that cause actual results or performance to differ materially include without limitation the following: risks and uncertainties with the Australian, New
Zealand and global economic environment and capital market conditions, the cyclical nature of the retail industry, the level of activity in Australian and New
Zealand retail industries, fluctuation in foreign currency exchange and interest rates, competition, PGR’s relationships with, and the financial condition of, its
suppliers and customers, legislative changes or other changes in the laws which affect PGR’s business, including consumer law, and operational risks. The foregoing
list of important factors and risks is not exhaustive.
No representation or warranty (express or implied) is given or made by any person (including PGR) in relation to the accuracy, likelihood or achievement or
reasonableness of any forward looking statements or the assumptions on which the forward looking statements are based. PGR does not accept responsibility or
liability arising in any way for errors in, omissions from, or information contained in this presentation.
PGR disclaims any obligation or undertaking to release any updates or revisions to the information to reflect any new information or change in expectations or
assumptions after the date of this presentation, except as may be required under securities law.
Disclaimer and third party information: To the fullest extent permitted by law, no representation or warranty (express or implied) is or will be made by any legal or
natural person in relation to the accuracy or completeness of all or part of this document, or any constituent or associated presentation, information or material
(collectively, the Information). The Information may include information derived from public or third party sources that has not been independently verified.
Investment decisions: Nothing contained in the Information constitutes investment, legal, tax or other advice. The Information does not take into account the
investment objectives, financial situation or particular needs of any investor, potential investor or any other person. You should take independent professional
advice before making any investment decision.
All statutory numbers referred to in this presentation have been audited.
Any adjustments made between statutory and pro forma results are made in accordance with ASIC Guidance Statement RG230.