SIA ANALYST/MEDIA BRIEFING Q4 and FY2017-18 Results Slide … · Slide 1 SIA ANALYST/MEDIA BRIEFING...
43
Slide 1 SIA ANALYST/MEDIA BRIEFING Q4 and FY2017-18 Results 18 May 2018
Transcript of SIA ANALYST/MEDIA BRIEFING Q4 and FY2017-18 Results Slide … · Slide 1 SIA ANALYST/MEDIA BRIEFING...
Slide 1
SIA ANALYST/MEDIA BRIEFINGQ4 and FY2017-18 Results
18 May 2018
THE PARENT AIRLINEQ4 AND FY17/18
RESULTS
Slide 3
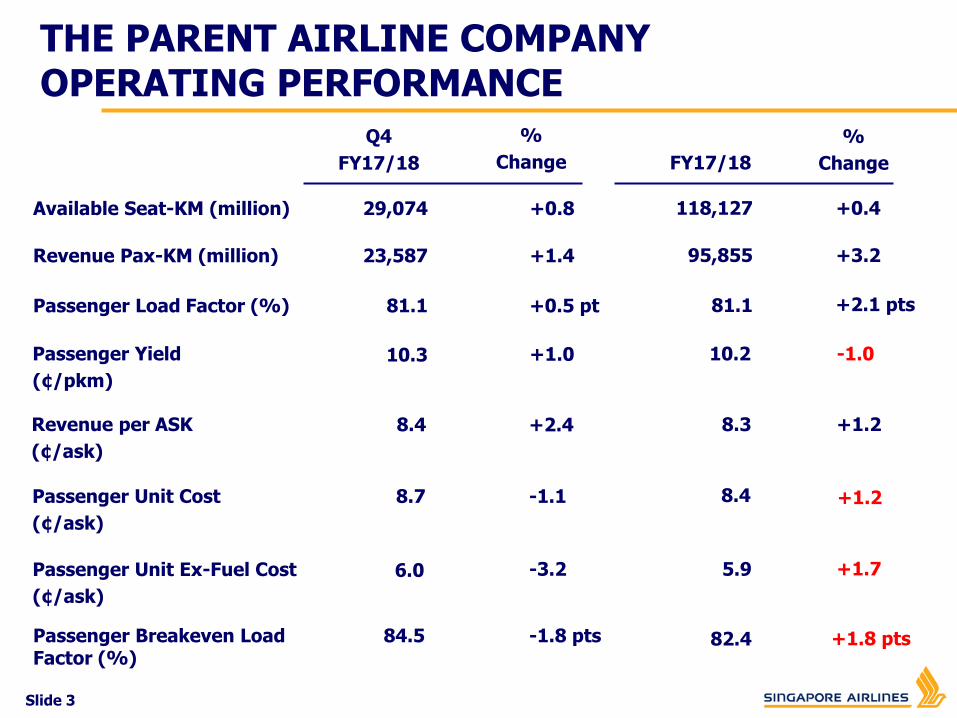
THE PARENT AIRLINE COMPANY OPERATING PERFORMANCE
Q4
FY17/18 FY17/18
%
Change
Passenger Load Factor (%)
Revenue Pax-KM (million)
81.1 +0.5 pt 81.1 +2.1 pts
Available Seat-KM (million)
23,587
29,074
+1.4
+0.8
95,855
118,127
+3.2
+0.4
%
Change
Passenger Yield
(¢/pkm)
10.3 +1.0 10.2 -1.0
Revenue per ASK
(¢/ask)
8.4 +2.4 8.3 +1.2
Passenger Unit Cost
(¢/ask)
8.7 -1.1 8.4 +1.2
Passenger Unit Ex-Fuel Cost
(¢/ask)
6.0 -3.2 5.9 +1.7
82.4 +1.8 ptsPassenger Breakeven Load Factor (%)
84.5 -1.8 pts
Slide 4
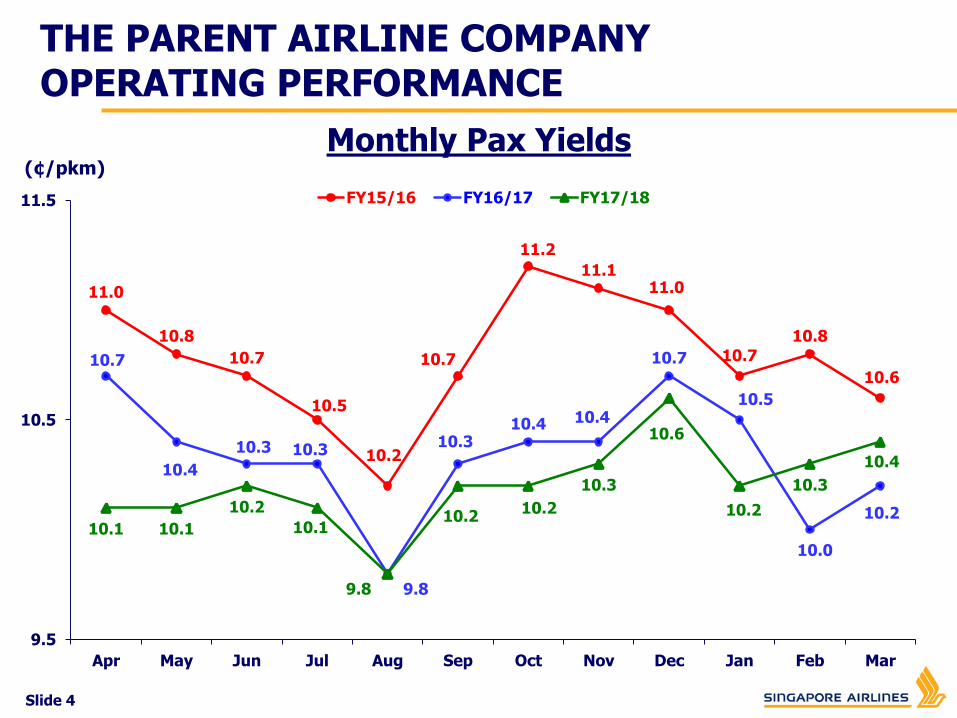
(¢/pkm)
Monthly Pax Yields
11.0
10.8
10.7
10.5
10.2
10.7
11.2
11.111.0
10.7
10.8
10.610.7
10.4
10.3 10.3
9.8
10.310.4 10.4
10.7
10.5
10.0
10.210.1 10.1
10.2
10.1
9.8
10.210.2
10.3
10.6
10.2
10.3
10.4
9.5
10.5
11.5
Apr May Jun Jul Aug Sep Oct Nov Dec Jan Feb Mar
FY15/16 FY16/17 FY17/18
THE PARENT AIRLINE COMPANY OPERATING PERFORMANCE
Slide 5
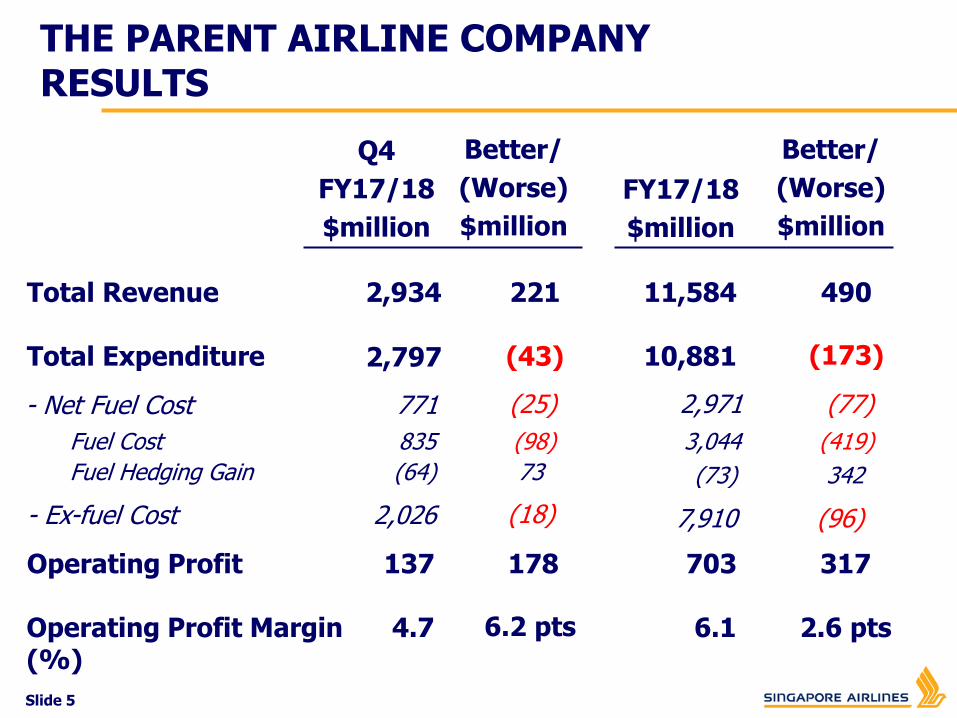
137Operating Profit 178
2,797Total Expenditure
835Fuel Cost
(64)Fuel Hedging Gain
2,026- Ex-fuel Cost
(43)
(98)
73
(18)
2,934Total Revenue
Q4
FY17/18
$million
221
Better/
(Worse)
$million
4.7Operating Profit Margin (%)
6.2 pts
- Net Fuel Cost 771 (25)
317703
(173)10,881
49011,584
FY17/18
$million
(419)3,044
342(73)
(96)7,910
Better/
(Worse)
$million
2.6 pts6.1
(77)2,971
THE PARENT AIRLINE COMPANY RESULTS
Slide 6
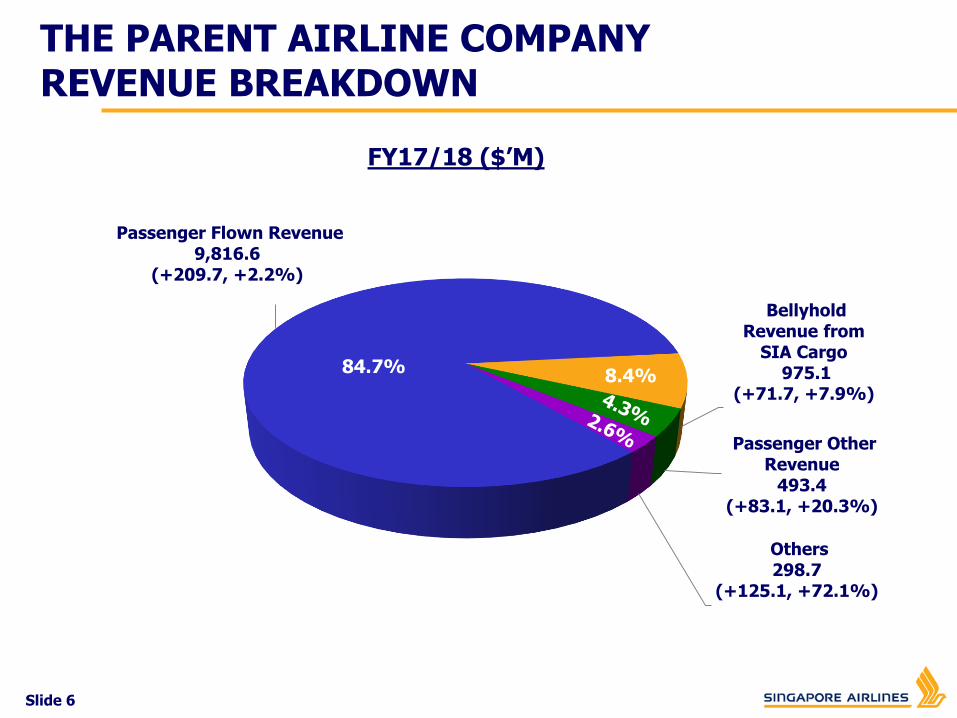
FY17/18 ($’M)
Passenger Flown Revenue9,816.6
(+209.7, +2.2%)
Bellyhold Revenue from
SIA Cargo975.1
(+71.7, +7.9%)
Passenger Other Revenue
493.4(+83.1, +20.3%)
Others298.7
(+125.1, +72.1%)
84.7%8.4%
THE PARENT AIRLINE COMPANY REVENUE BREAKDOWN
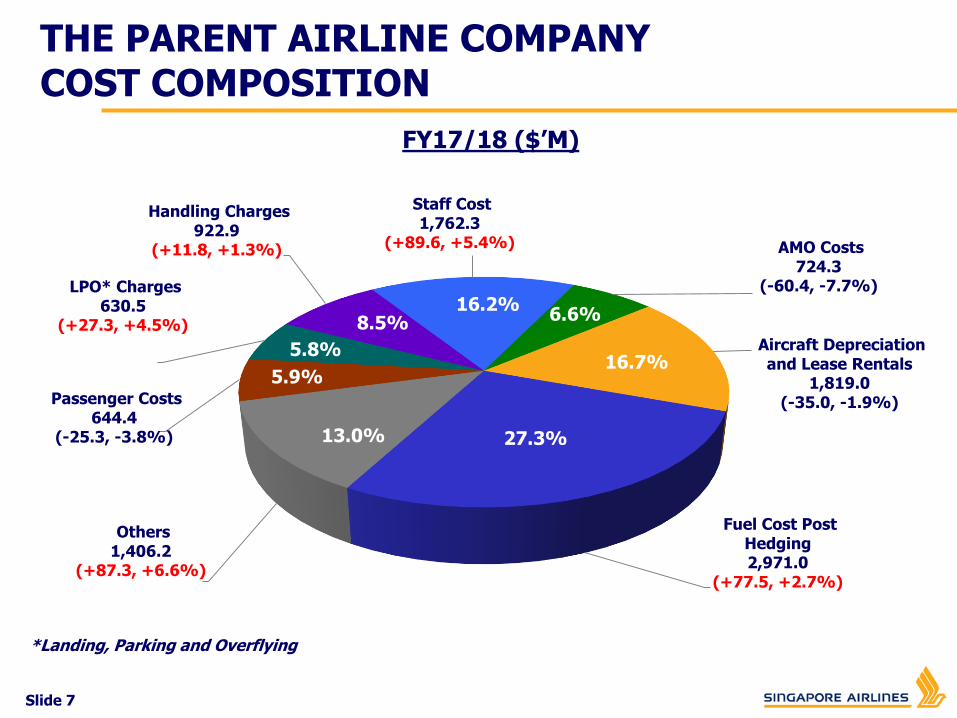
THE PARENT AIRLINE COMPANY COST COMPOSITION
FY17/18 ($’M)
*Landing, Parking and Overflying
27.0%12.3%
8.5%
6.3%
5.7%
15.6%
17.3%
7.3%
Fuel Cost Post Hedging2,971.0
(+77.5, +2.7%)
Others1,406.2
(+87.3, +6.6%)
Passenger Costs644.4
(-25.3, -3.8%)
LPO* Charges630.5
(+27.3, +4.5%)
Handling Charges922.9
(+11.8, +1.3%)
Staff Cost1,762.3
(+89.6, +5.4%) AMO Costs724.3
(-60.4, -7.7%)
Aircraft Depreciation and Lease Rentals
1,819.0(-35.0, -1.9%)
27.3%
6.6%16.2%
16.7%
13.0%
5.9%
8.5%
5.8%
Slide 7
SIA GROUP Q4 AND FY17/18
RESULTS
Slide 9
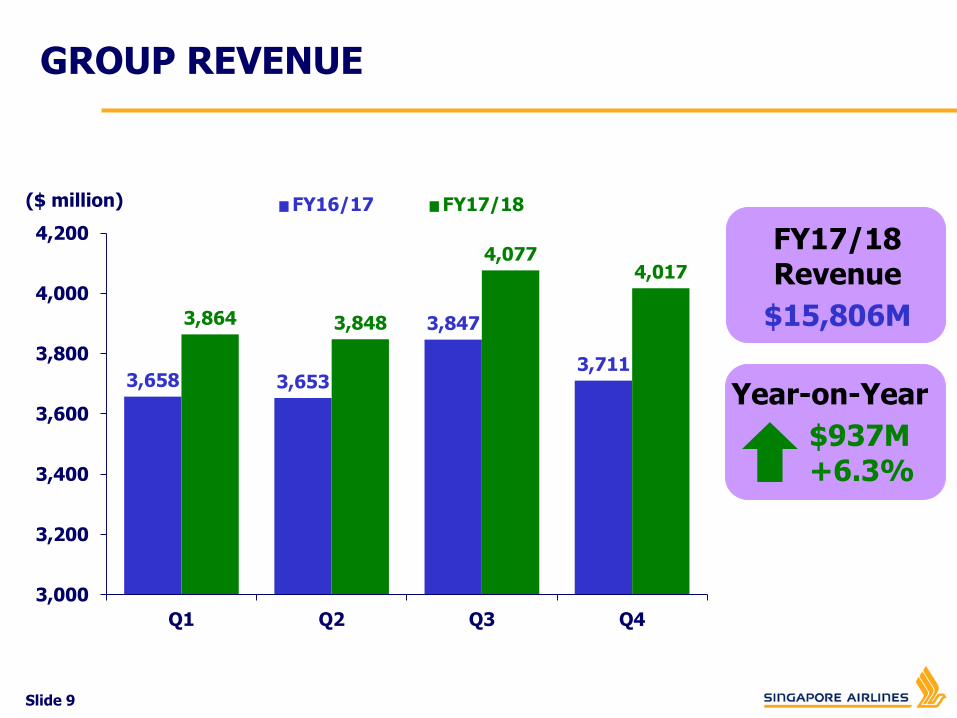
Year-on-Year
$937M+6.3%
($ million)
FY17/18Revenue
$15,806M
FY16/17 FY17/18
GROUP REVENUE
3,658 3,653
3,847
3,711
3,864 3,848
4,0774,017
3,000
3,200
3,400
3,600
3,800
4,000
4,200
Q1 Q2 Q3 Q4
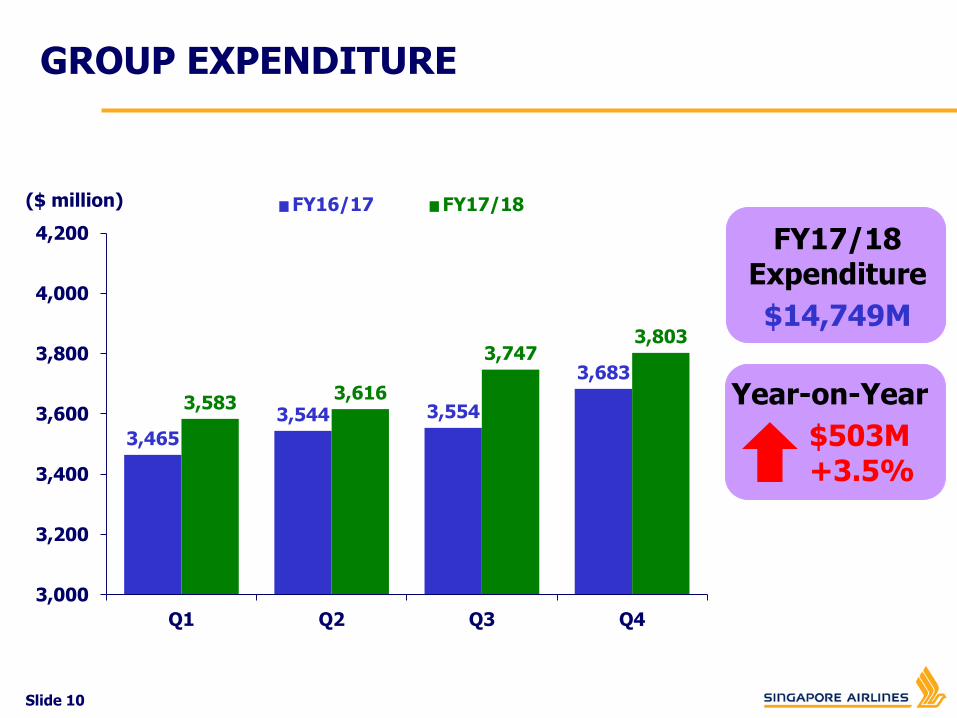
Slide 10
Year-on-Year
$503M+3.5%
($ million)
FY17/18Expenditure
$14,749M
FY16/17 FY17/18
GROUP EXPENDITURE
3,465
3,544 3,554
3,683
3,5833,616
3,7473,803
3,000
3,200
3,400
3,600
3,800
4,000
4,200
Q1 Q2 Q3 Q4

Slide 11
Year-on-Year
$434M+69.7%
FY17/18Op Profit
$1,057M
GROUP OPERATING PROFIT
($ million)
259
410
681623
1,057
0
200
400
600
800
1,000
1,200
FY13/14 FY14/15 FY15/16 FY16/17 FY17/18
Slide 12
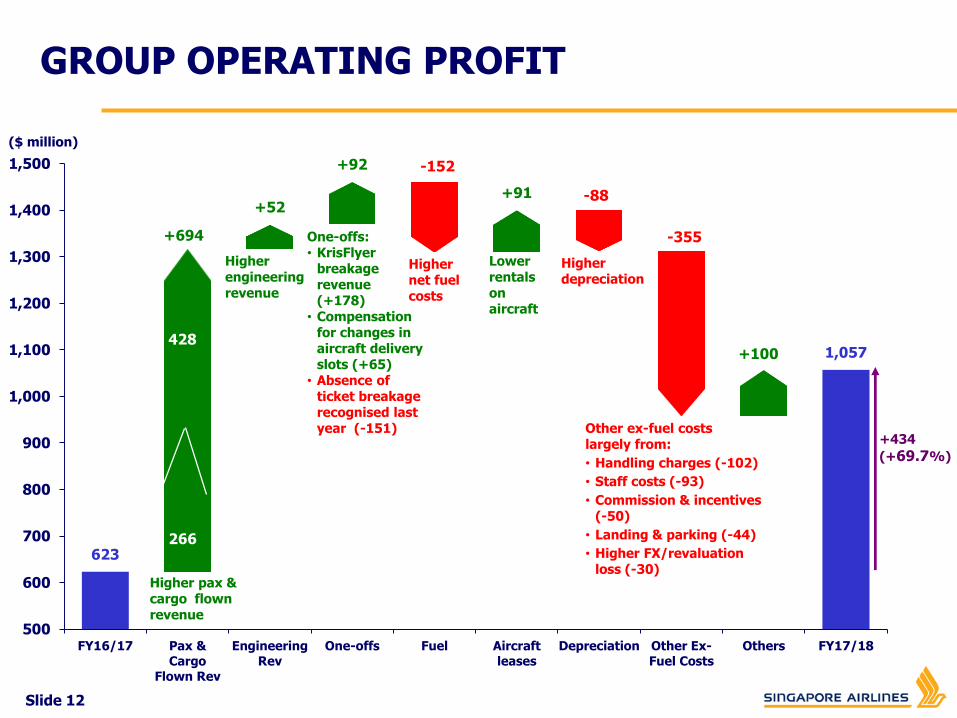
GROUP OPERATING PROFIT
623
+694
+52
+92 -152
+91 -88
-355
+100 1,057
500
600
700
800
900
1,000
1,100
1,200
1,300
1,400
1,500
FY16/17 Pax &Cargo
Flown Rev
EngineeringRev
One-offs Fuel Aircraftleases
Depreciation Other Ex-Fuel Costs
Others FY17/18
($ million)
Higher pax & cargo flown revenue
Higher net fuel costs
Lower rentals on aircraft
Higher depreciation
Higher engineering revenue
One-offs:• KrisFlyer
breakage revenue (+178)
• Compensation for changes in aircraft delivery slots (+65)
• Absence of ticket breakage recognised last year (-151) Other ex-fuel costs
largely from:
• Handling charges (-102)
• Staff costs (-93)
• Commission & incentives (-50)
• Landing & parking (-44)
• Higher FX/revaluation loss (-30)
+434
(+69.7%)
428
266
Slide 13
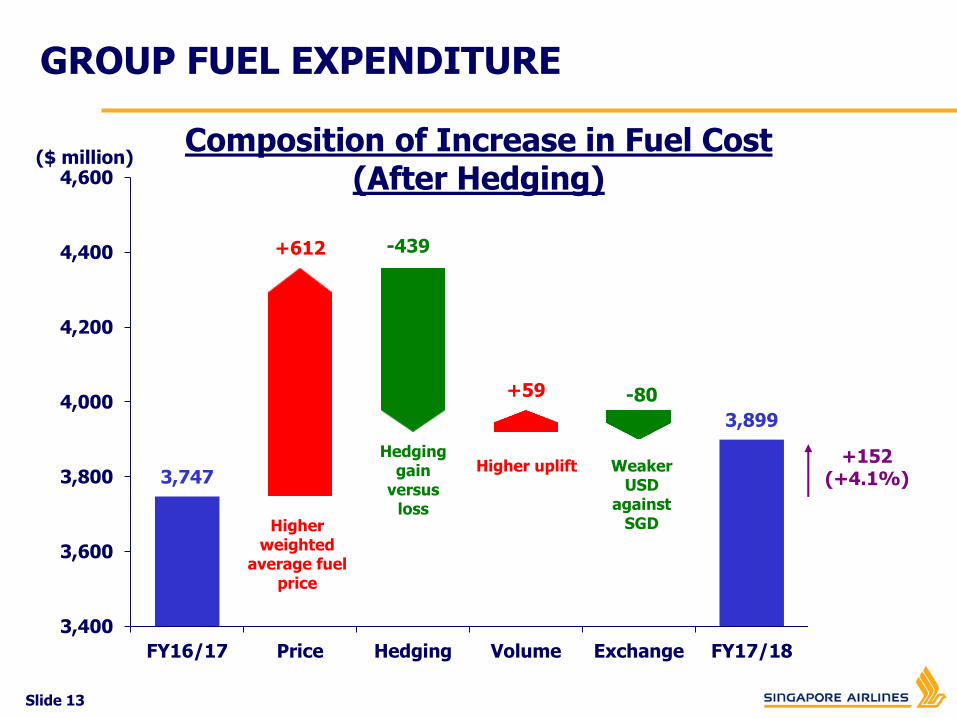
GROUP FUEL EXPENDITURE
Composition of Increase in Fuel Cost(After Hedging)
3,747
+612 -439
+59 -80
3,899
3,400
3,600
3,800
4,000
4,200
4,400
4,600
FY16/17 Price Hedging Volume Exchange FY17/18
Higherweighted
average fuel price
Hedging gain
versus loss
Higher uplift WeakerUSD
against SGD
+152 (+4.1%)
($ million)
Slide 14
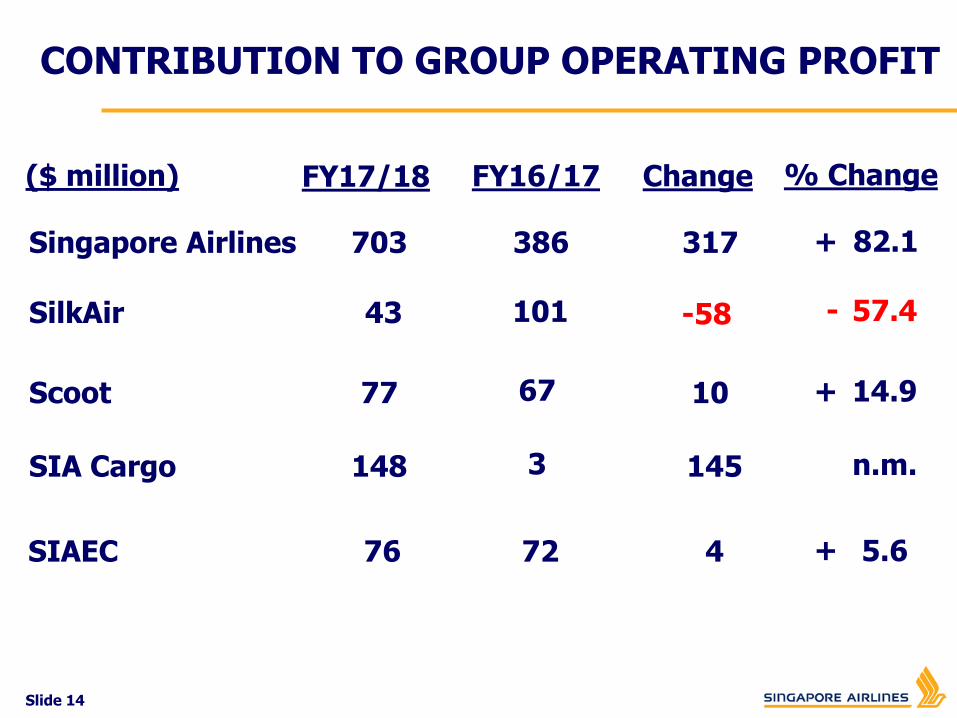
317386703Singapore Airlines
FY17/18
-5810143SilkAir
106777Scoot
FY16/17 Change
82.1+
57.4-
14.9
% Change
1453148SIA Cargo n.m.
CONTRIBUTION TO GROUP OPERATING PROFIT
47276SIAEC 5.6
($ million)
+
+
Slide 15
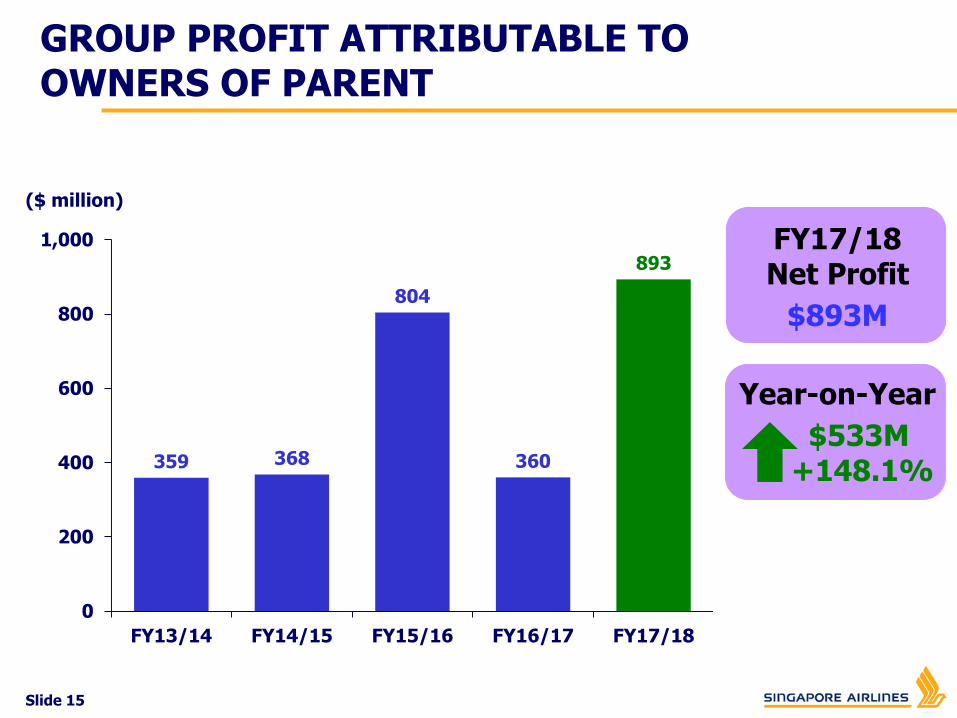
Year-on-Year
$533M+148.1%
FY17/18Net Profit
$893M
GROUP PROFIT ATTRIBUTABLE TO OWNERS OF PARENT
($ million)
359 368
804
360
893
0
200
400
600
800
1,000
FY13/14 FY14/15 FY15/16 FY16/17 FY17/18
($ million)
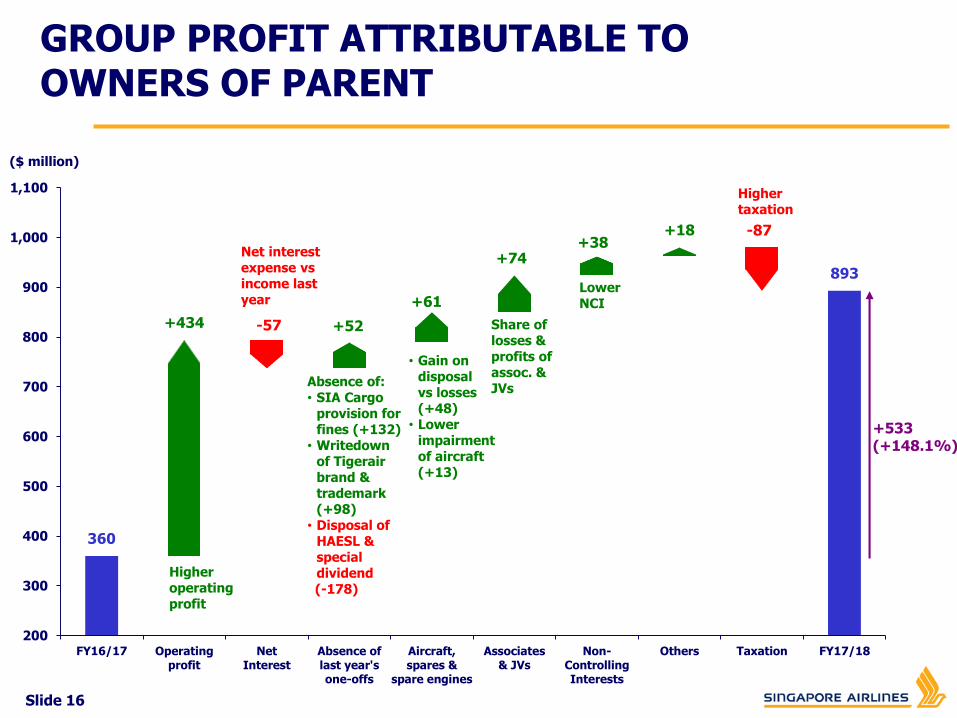
GROUP PROFIT ATTRIBUTABLE TOOWNERS OF PARENT
360
+434 -57 +52
+61
+74+38
+18 -87
893
200
300
400
500
600
700
800
900
1,000
1,100
FY16/17 Operatingprofit
NetInterest
Absence oflast year'sone-offs
Aircraft,spares &
spare engines
Associates& JVs
Non-ControllingInterests
Others Taxation FY17/18
Higher taxation
Higher operating profit
Share of losses & profits of assoc. & JVs
Net interest expense vs income last year
Lower NCI
Absence of:• SIA Cargo
provision for fines (+132)
• Writedownof Tigerairbrand & trademark (+98)
• Disposal of HAESL & special dividend (-178)
• Gain on disposal vs losses (+48)
• Lower impairment of aircraft (+13)
+533(+148.1%)
Slide 16
Slide 17
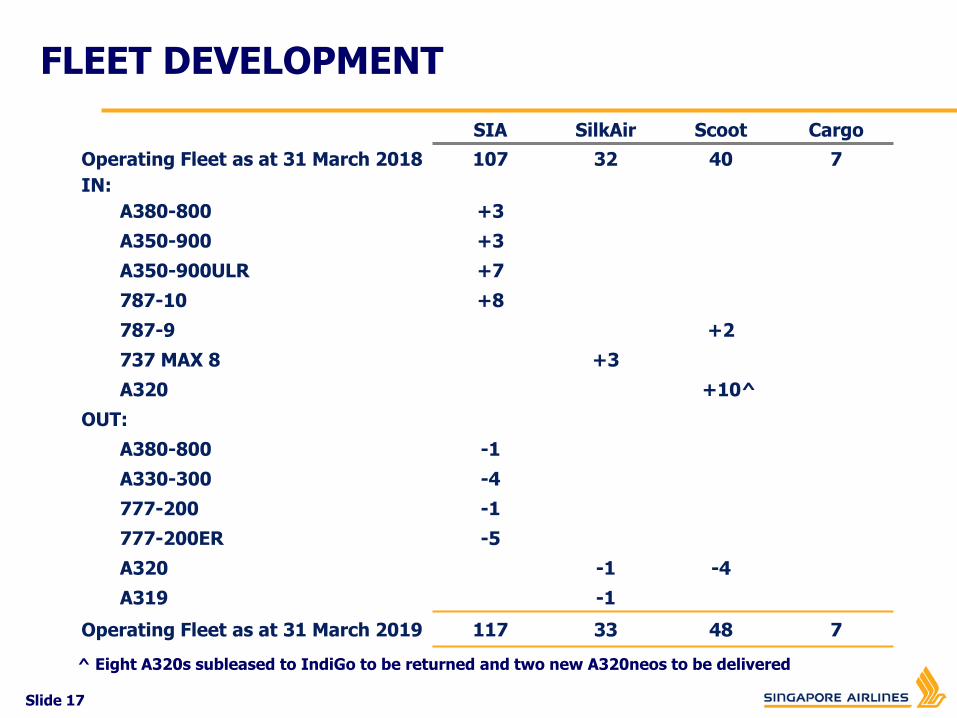
FLEET DEVELOPMENT
SIA SilkAir Scoot Cargo
Operating Fleet as at 31 March 2018 107 32 40 7
IN:
A380-800 +3
A350-900 +3
A350-900ULR +7
787-10 +8
787-9 +2
737 MAX 8 +3
A320 +10^
OUT:
A380-800 -1
A330-300 -4
777-200 -1
777-200ER -5
A320 -1 -4
A319 -1
Operating Fleet as at 31 March 2019 117 33 48 7
^ Eight A320s subleased to IndiGo to be returned and two new A320neos to be delivered
Slide 18
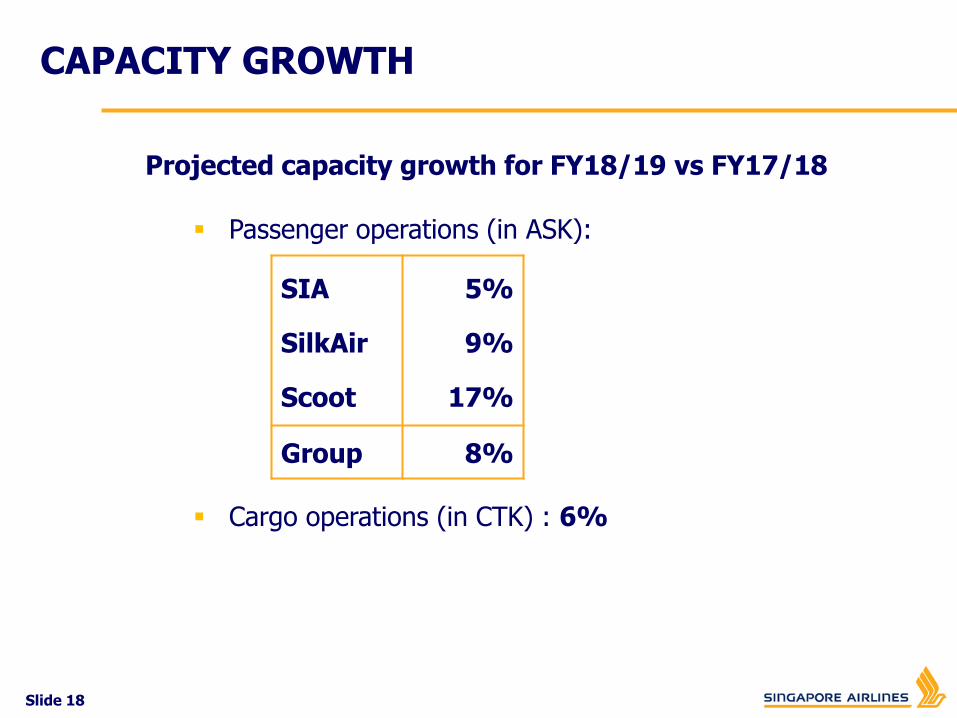
CAPACITY GROWTH
Projected capacity growth for FY18/19 vs FY17/18
Passenger operations (in ASK):
Cargo operations (in CTK) : 6%
SIA
SilkAir
Scoot
5%
9%
17%
Group 8%
Slide 19
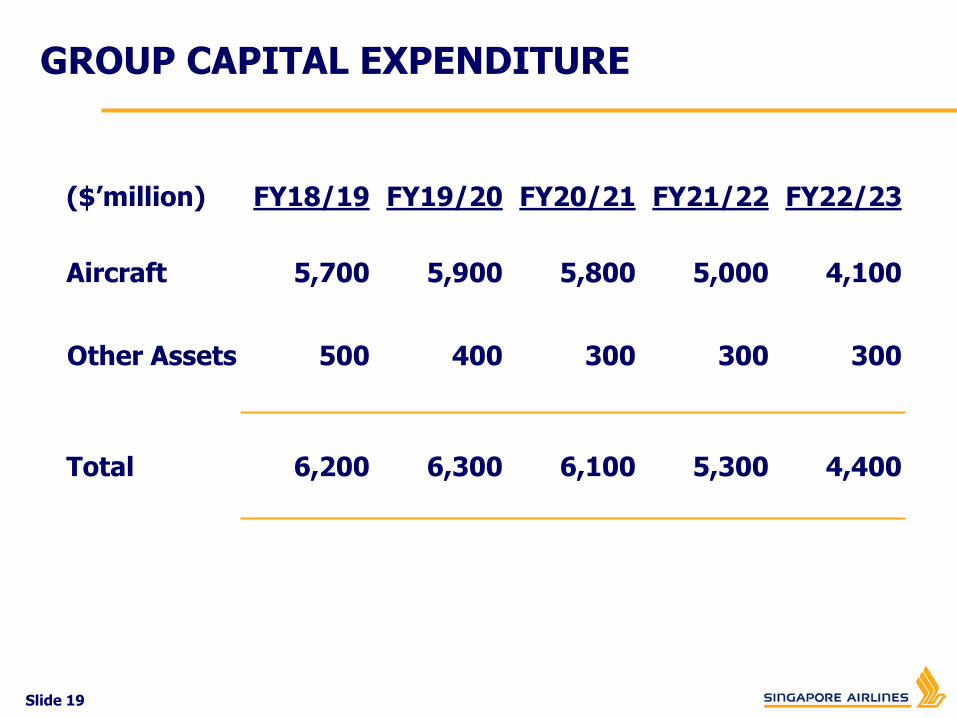
GROUP CAPITAL EXPENDITURE
($’million) FY18/19 FY19/20 FY20/21 FY21/22 FY22/23
Aircraft 5,700 5,900 5,800 5,000 4,100
Other Assets 500 400 300 300 300
Total 6,200 6,300 6,100 5,300 4,400
Slide 20
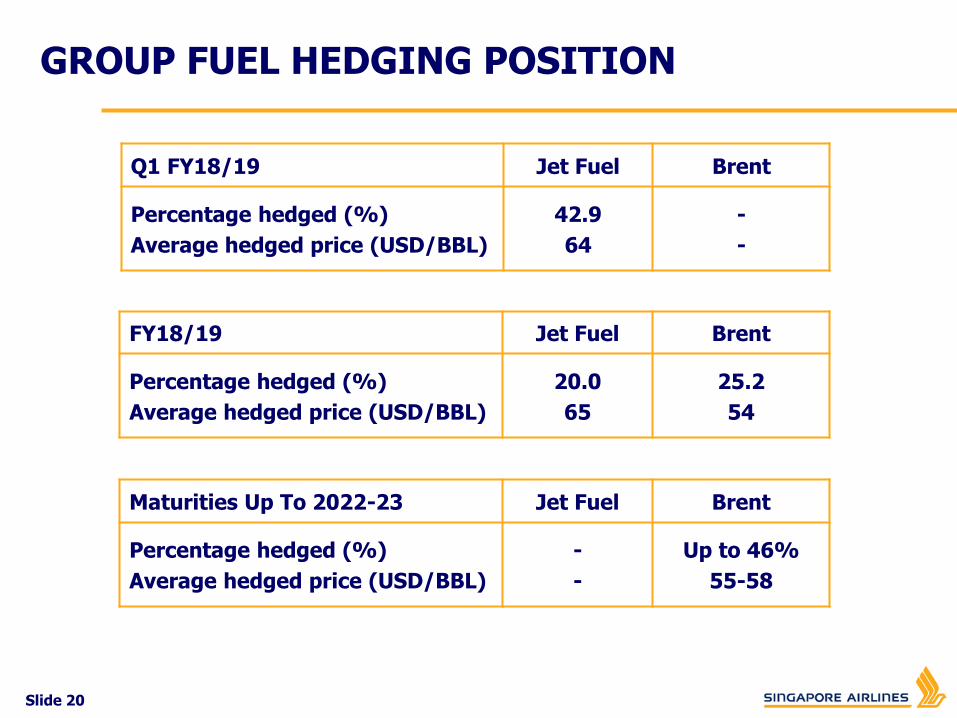
GROUP FUEL HEDGING POSITION
Q1 FY18/19 Jet Fuel Brent
Percentage hedged (%)
Average hedged price (USD/BBL)
42.9
64
-
-
FY18/19 Jet Fuel Brent
Percentage hedged (%)
Average hedged price (USD/BBL)
20.0
65
25.2
54
Maturities Up To 2022-23 Jet Fuel Brent
Percentage hedged (%)
Average hedged price (USD/BBL)
-
-
Up to 46%
55-58
Slide 21
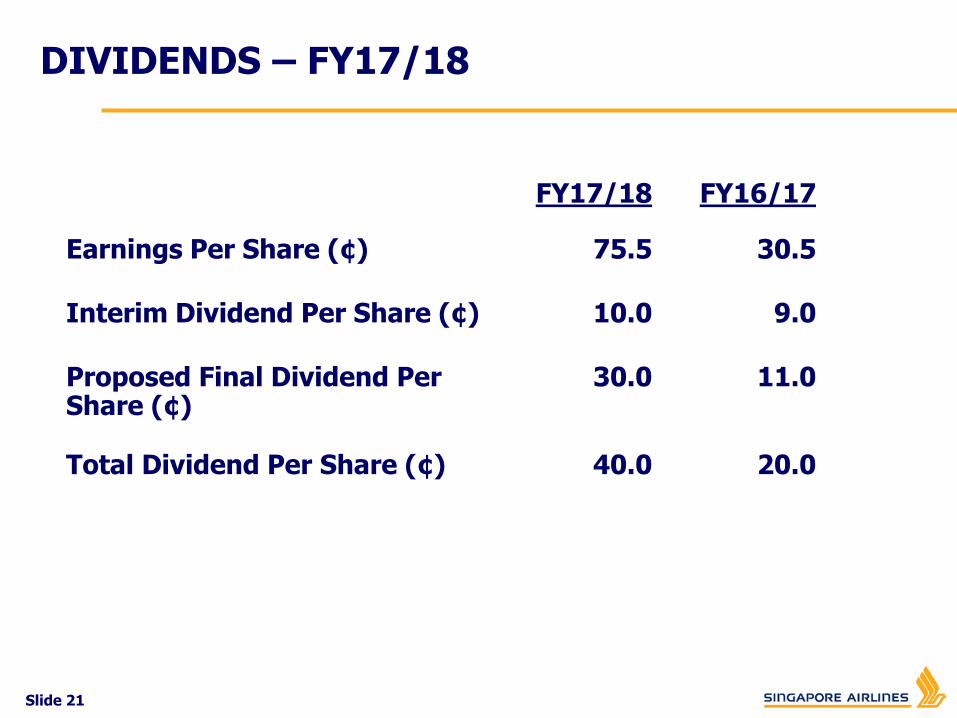
9.010.0Interim Dividend Per Share (¢)
DIVIDENDS – FY17/18
30.575.5Earnings Per Share (¢)
11.030.0Proposed Final Dividend Per Share (¢)
FY16/17FY17/18
20.040.0Total Dividend Per Share (¢)
ADOPTION OF IFRS 1
Slide 23
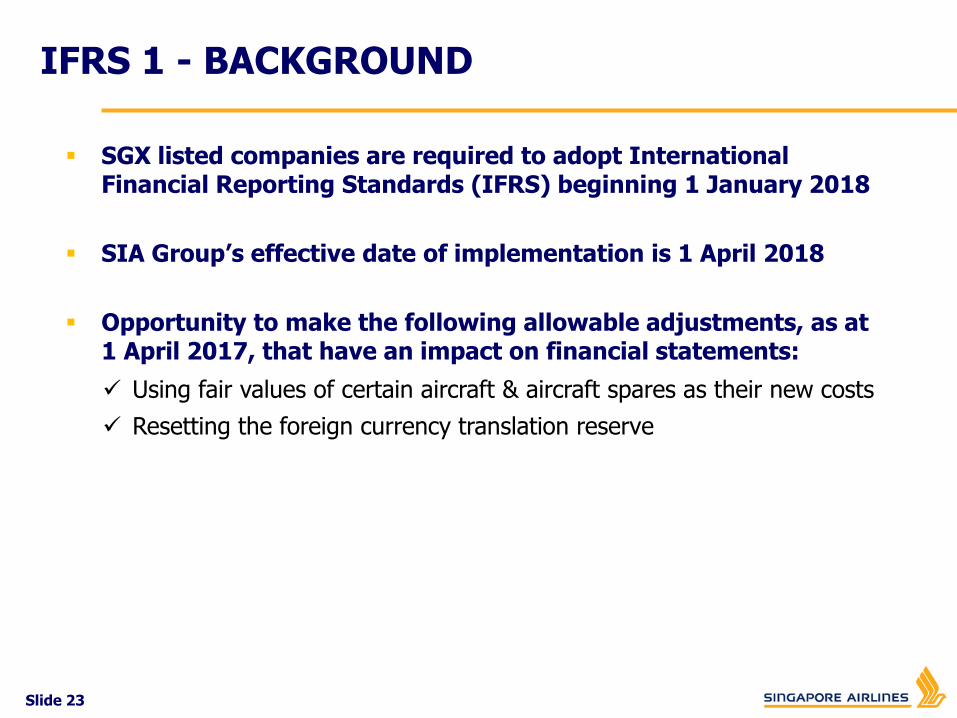
IFRS 1 - BACKGROUND
SGX listed companies are required to adopt International Financial Reporting Standards (IFRS) beginning 1 January 2018
SIA Group’s effective date of implementation is 1 April 2018
Opportunity to make the following allowable adjustments, as at 1 April 2017, that have an impact on financial statements:
Using fair values of certain aircraft & aircraft spares as their new costs
Resetting the foreign currency translation reserve
Slide 24
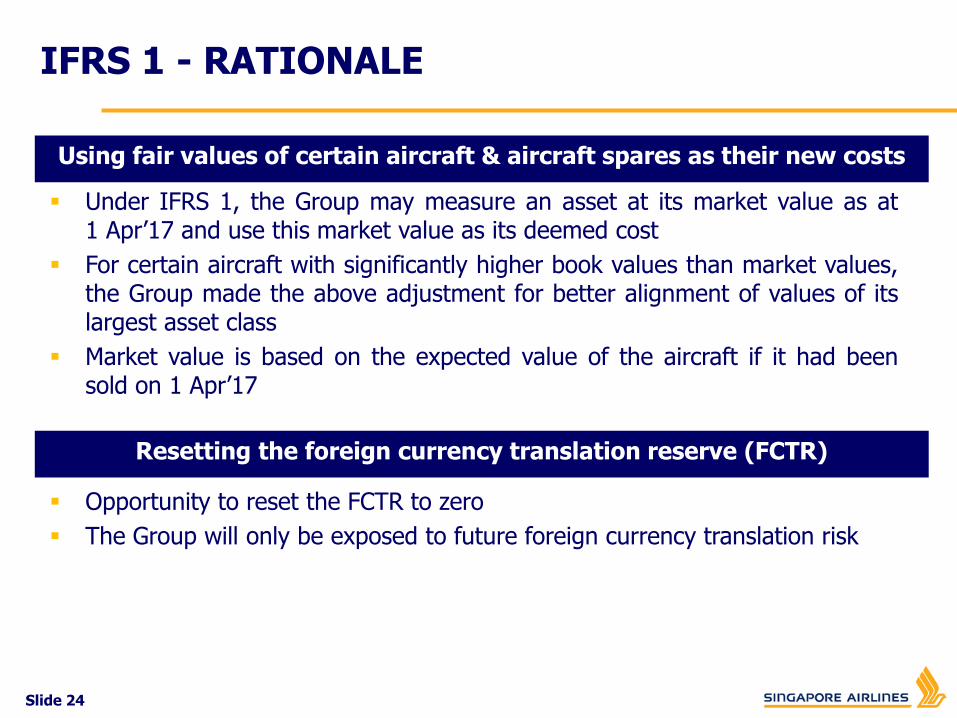
IFRS 1 - RATIONALE
Using fair values of certain aircraft & aircraft spares as their new costs
Under IFRS 1, the Group may measure an asset at its market value as at1 Apr’17 and use this market value as its deemed cost
For certain aircraft with significantly higher book values than market values,the Group made the above adjustment for better alignment of values of itslargest asset class
Market value is based on the expected value of the aircraft if it had beensold on 1 Apr’17
Resetting the foreign currency translation reserve (FCTR)
Opportunity to reset the FCTR to zero
The Group will only be exposed to future foreign currency translation risk

Slide 25
IFRS 1 – FINANCIAL IMPACT
The estimated impact of applying the adjustments on 1 Apr’17 is set out below:
Adjustment to aircraft & aircraft spares (2,147.0) 490.7^
Cumulative translation differences (FCTR) (123.7) -
Total (pre-tax) (2,270.7) 490.7
Tax effect 365.6 (83.3)
Total (post-tax) (1,905.1) 407.4
Increase/(decrease) ($'M)
General ReserveImpact on Restated
FY17/18 Profit
^ reduction in depreciation expense
Slide 26
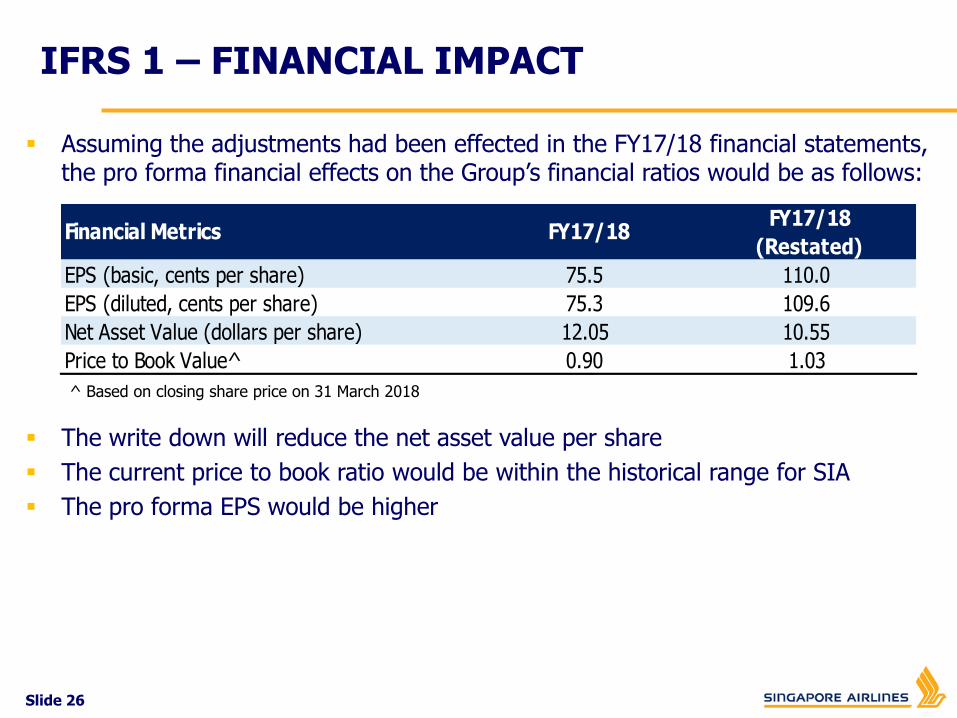
IFRS 1 – FINANCIAL IMPACT
Assuming the adjustments had been effected in the FY17/18 financial statements, the pro forma financial effects on the Group’s financial ratios would be as follows:
EPS (basic, cents per share) 75.5 110.0
EPS (diluted, cents per share) 75.3 109.6
Net Asset Value (dollars per share) 12.05 10.55
Price to Book Value^ 0.90 1.03
Financial Metrics FY17/18FY17/18
(Restated)
The write down will reduce the net asset value per share
The current price to book ratio would be within the historical range for SIA
The pro forma EPS would be higher
^ Based on closing share price on 31 March 2018

Slide 27
IFRS 1 – FINANCIAL IMPACT
The depreciation impact will decline over time, until all affected aircraft have been disposed
Increase ($'M)
Operating Profit
FY18/19 425.6
FY19/20 322.3
FY20/21 234.5
The estimated depreciation expense impact on Group P&L for the next three financial years is as follows:
STRATEGIC DEVELOPMENTS
Slide 29
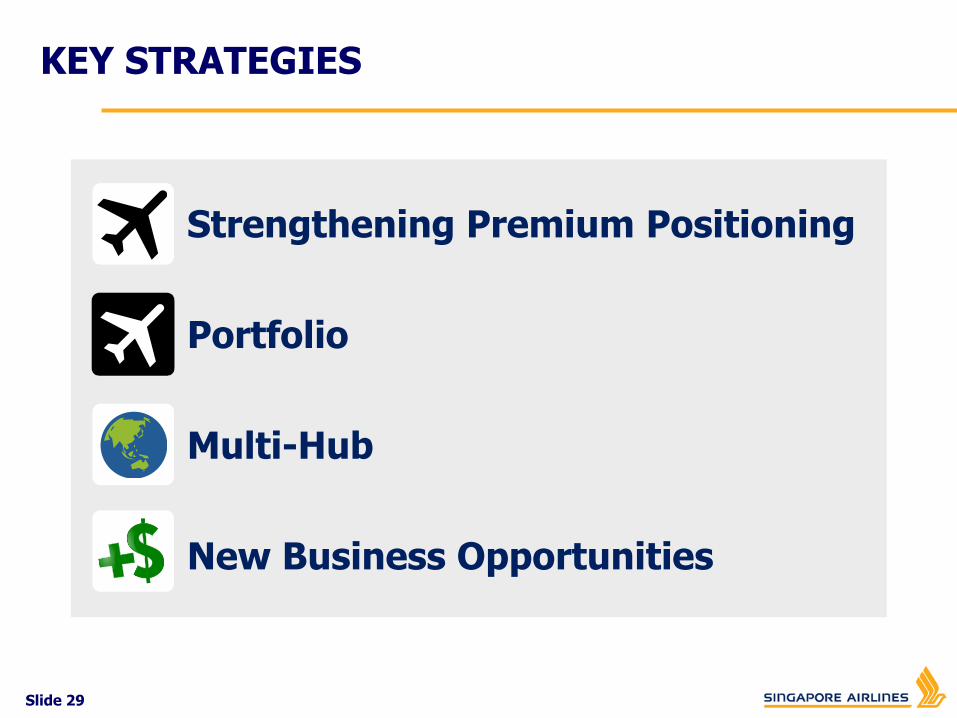
Strengthening Premium Positioning
Multi-Hub
Portfolio
New Business Opportunities
KEY STRATEGIES
Slide 30
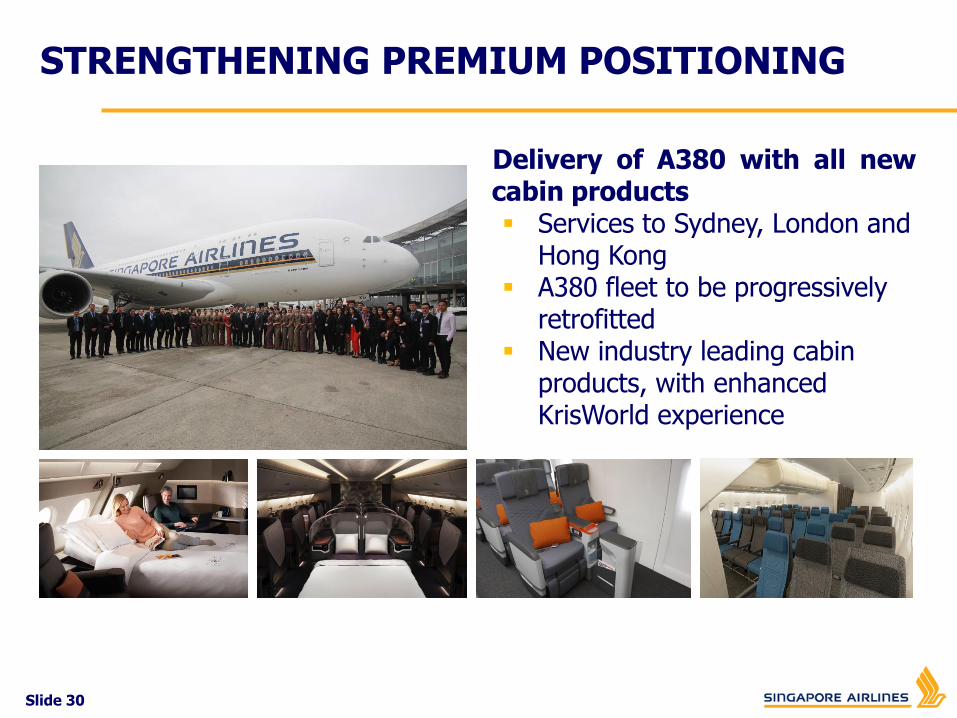
STRENGTHENING PREMIUM POSITIONING
Delivery of A380 with all newcabin products Services to Sydney, London and
Hong Kong A380 fleet to be progressively
retrofitted New industry leading cabin
products, with enhanced KrisWorld experience
Slide 31
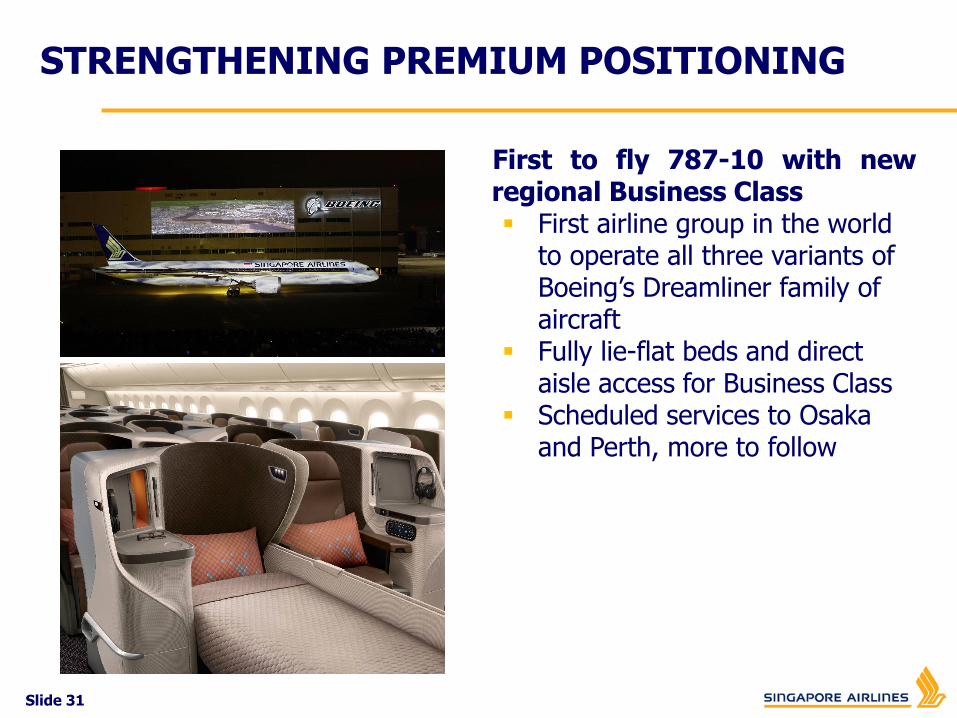
First to fly 787-10 with newregional Business Class First airline group in the world
to operate all three variants of Boeing’s Dreamliner family of aircraft
Fully lie-flat beds and direct aisle access for Business Class
Scheduled services to Osaka and Perth, more to follow
STRENGTHENING PREMIUM POSITIONING

Slide 32
Fleet renewal and investment Nearly US$50B worth of aircraft on order as
a Group
A350-900ULR Late 2018 – Expansion of non-stop services
to USA, including New York and Los Angeles
777-9 & 787-10 US$13.8B order signed with Boeing for 20
777-9s and 19 787-10s Caters for additional growth and fleet
modernisation through the next decade
STRENGTHENING PREMIUM POSITIONING
Slide 33
PORTFOLIO
Completion of Scoot and Tigerair Integration Enhanced synergies with both LCCs under
a single brand from 25 July 2017 New destinations include Athens (Jun’17),
Honolulu (Dec’17), Berlin (Jun’18), Pekanbaru (Jun’18) and Nanchang (Jul’18)
Completion of SIA Cargo Re-integration Seamless reintegration on 01 April 2018 Greater efficiencies through support
functions being handled by respective SIA Divisions
Slide 34
The SIA Group serves 138 destinations in 37 countries and territories
PORTFOLIO
Slide 35
Investments in strategic markets
Complements and strengthens Singapore hub through synergies
Serving 22 destinations across India 20th A320 aircraft delivered in Apr’18, with two more
to be delivered by Jul’18 Preparing to launch international operations from
2H 2018
8 destinations and 5 B777-200s Network to expand following ICAO safety upgrade
of Thai aviation sector Launch of new services to Hangzhou (Jun’18*),
Tokyo (Narita) (Jun’18), New Delhi (end-Oct’18*)
MULTI-HUB
* Subject to regulatory approvals
Slide 36
NEW REVENUE & BUSINESS OPPORTUNITIES
SIA-CAE Flight Training Centre Equally-owned JV for pilot training in
Singapore Operations expected to commence from 2H
2018 Provides full range of initial type rating and
recurrent training programmes for Boeing 737MAX, 747, 777 and 787 aircraft types
Travel Retail Joint Venture Travel retail JV with DFASS and SATS under
KrisShop and Scootalogue brands Transforms existing programmes into omni-
channel e-commerce platforms
TRANSFORMATION
Slide 38
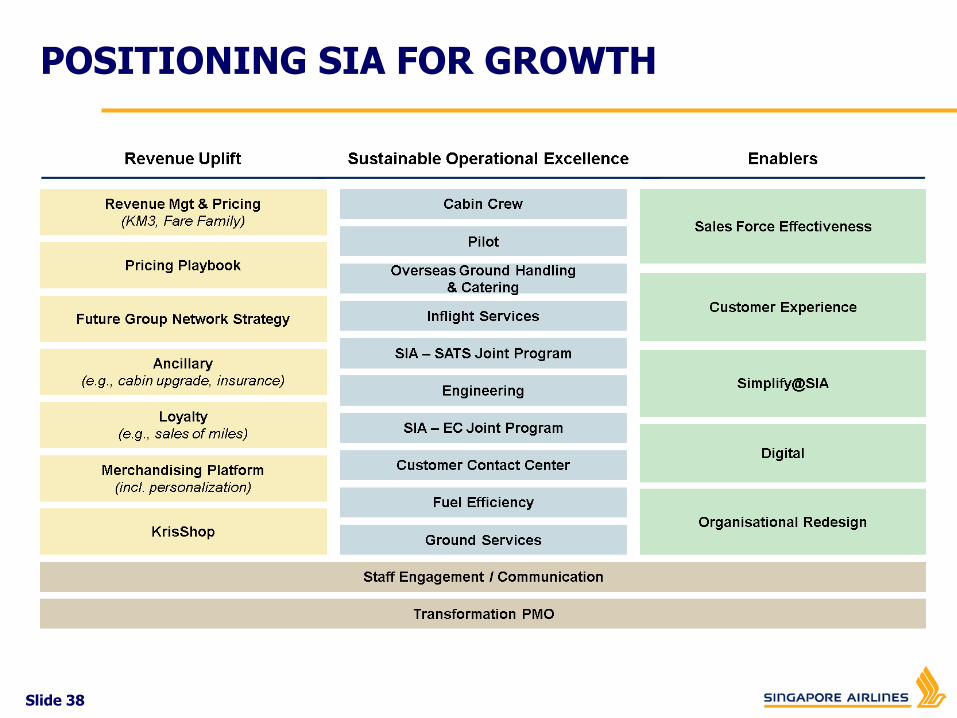
POSITIONING SIA FOR GROWTH
Slide 39
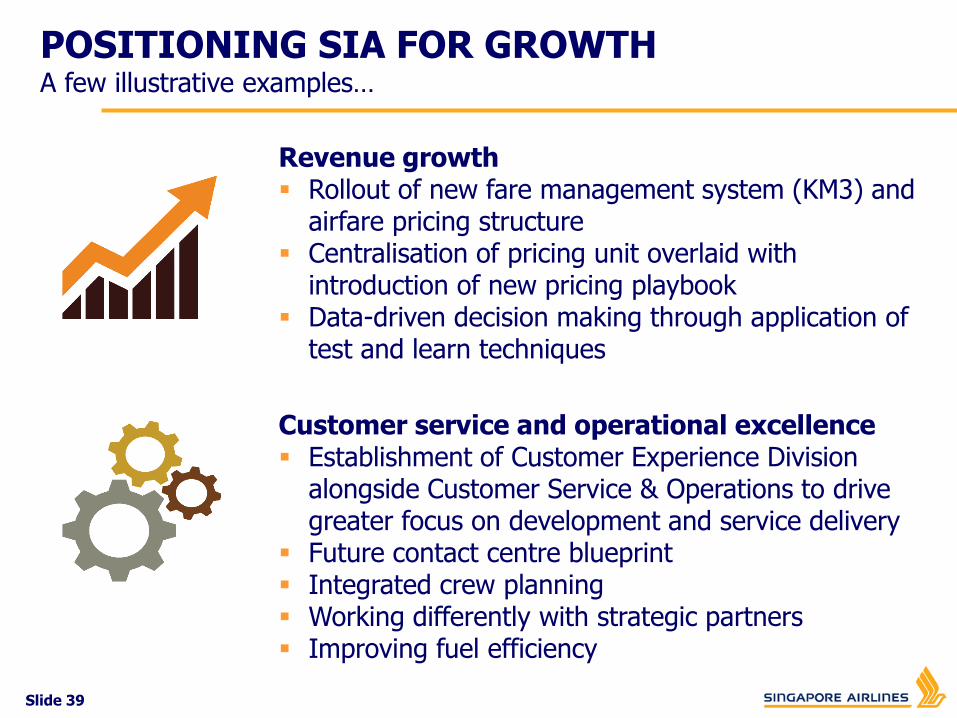
POSITIONING SIA FOR GROWTHA few illustrative examples…
Revenue growth Rollout of new fare management system (KM3) and
airfare pricing structure Centralisation of pricing unit overlaid with
introduction of new pricing playbook Data-driven decision making through application of
test and learn techniques
Customer service and operational excellence Establishment of Customer Experience Division
alongside Customer Service & Operations to drive greater focus on development and service delivery
Future contact centre blueprint Integrated crew planning Working differently with strategic partners Improving fuel efficiency
Slide 40
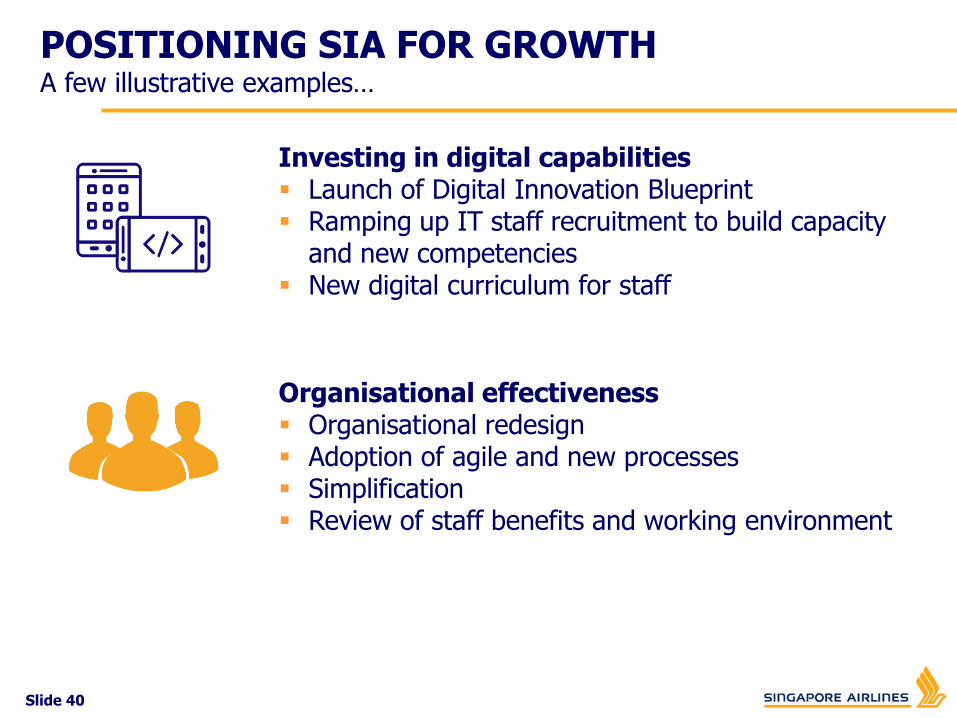
POSITIONING SIA FOR GROWTHA few illustrative examples…
Investing in digital capabilities Launch of Digital Innovation Blueprint Ramping up IT staff recruitment to build capacity
and new competencies New digital curriculum for staff
Organisational effectiveness Organisational redesign Adoption of agile and new processes Simplification Review of staff benefits and working environment
Slide 41
POSITIONING SIA FOR GROWTH
Transformation programme on track with good progress
Key mid-term initiatives have been completed or are work-in-progress Future Group network Customer experience Simplify@SIA Organisational redesign Going digital
Slide 42
More than S$100M investment to enhance customer experience Lie-flat Business Class seats Seat-back IFE in Business Class and Economy Class Cabin upgrades expected to start in 2020, based on availability by
seat suppliers
SilkAir to be merged entirely into SIA after sufficient number of aircraft have been fitted with new cabin products
Will help drive growth for SIA Group
SILKAIR
Slide 43
THANK YOU