Predictive shelf life model for the improvement of quality ...

The On-Shelf Availability Improvement Road Map2008–2009
A framework with toolsets and tips for continuous improvement in OSA in the Australian and New Zealand food and grocery industry
In conjunction with

Contents1. Acknowledgements ......................................................................4
2. Introduction ...................................................................................6
3. OSA Improvement Road Map Stage 1 – Plan ...............................................................................7 Main Objectives ................................................................................. 7 Support for a project – Management attention and the will for collaboration .................................................................... 7 Establishing Priorities – Defining the project’s scope ...................... 8 Resource the project – Undertake Stakeholder Analysis ................ 9 Project Charter – Establish a Project Charter and Project Stage Plan ............................................................................. 11
4. OSA Improvement Road Map Stage 2 – Map key Process and gather Measures ......................14 Objectives .......................................................................................... 14 Map Key Business Processes ........................................................... 14 Determine and Agree Measures to be Used .................................... 15 Consider OSA Measurement Methods ............................................. 17
5. OSA Improvement Road Map Stage 3 – Analysis and OOS cause identification .......................19 Objectives .......................................................................................... 19 Determine the type of OOS issues (Shelf vs. Store vs. Supply Chain) .................................................... 20 Identify Causes of OSA Issues .......................................................... 21
6. OSA Improvement Road Map Stage 4 – Developing solutions ....................................................23 Objectives .......................................................................................... 23 Identify and develop solutions that address root causes of OOS ........................................................................... 23
7. OSA Improvement Road Map Stage 5 – Implement solution trials .............................................28 Objectives .......................................................................................... 28 Develop Implementation Plans ......................................................... 28 Implement Trial Solutions .................................................................. 28
8. OSA Improvement Road Map Stage 6 – Evaluate.........................................................................29 Objectives .......................................................................................... 29 Determine and evaluate impact of initiatives .................................... 29 Prepare to Roll-out Successful Initiatives ......................................... 31
9. Appendix .......................................................................................32 Appendix 1: Prioritising OSA Efforts: Velocity and Volatility of Sales........................................................... 32 Appendix 2: Prioritising OSA Efforts: Shopper Cost Components and OOS Behaviour ............................ 33 Appendix 3 – Basic Root Cause Analysis Tools ............................... 34 Appendix 4: On-Shelf Availability Improvement Project Protocol Template ................................................................. 36 Appendix 5: A Common Language for Product Availability Measurement and for the Assignment of Causes of Out of Stocks through the Value Chain in Australasian Grocery ................ 39 Appendix 6: Bibliography & Recommended Reading ..................... 42

ECR Australasia – working together for total customer satisfactionEfficient Consumer Response (ECR) is a business
concept aimed at better satisfying consumer
needs, through businesses and trading partners
working together.
In doing so, ECR best practices will deliver superior
business results by reducing costs at all stages
throughout the value chain, achieving efficiency
and streamlined processes. ECR best practices
can deliver improved range, consumer value, sales,
service and convenience offerings. This in turn will
lead to greater satisfaction of consumer needs.
ECR Australasia reflects a commitment to take costs
out of the grocery supply chain and better satisfy
consumer demands through the adoption of world’s
best practice. In an increasingly global food and
grocery industry and a retail environment subject
to rapid change, the future for Australian and New
Zealand suppliers, retailers and wholesalers depends
on increased efficiencies, reduced costs and added
value for consumers.
For more information about ECR Australasia, visit
www.ecraustralasia.org.au
For further information please contact:
Efficient Consumer Response Australasia
c/o Australian Food and Grocery Council
Locked Bag 1, Kingston ACT 2604
Telephone: (02) 6273 1466
Facsimile: (02) 6273 1477
E-mail: [email protected]
Website: www.afgc.org.au
About AccentureAccenture is a global management consulting,
technology services and outsourcing company.
Combining unparalleled experience, comprehensive
capabilities across all industries and business
functions, and extensive research on the world’s
most successful companies, Accenture collaborates
with clients to help them become high-performance
businesses and governments. With more than
180,000 people in 49 countries, the company
generated net revenues of US$19.70 billion for
the fiscal year ended 31 August 2007.
The Accenture Retail industry group has helped
more than 400 retailers from around the world
develop adaptive, executable strategies in uncertain
environments. Accenture’s consulting experience
with the world’s leading retailers and our independent
research provides retailers with food for thought −
and helps them progress in their journeys toward
high performance.
For further information please contact:
Marek Rucinski, Partner, Products Operating Group
3

4
AcknowledgementsA
ckno
wle
dg
emen
ts
This On-Shelf Availability Improvement Road Map was made possible through support and contributions from
the industry working group and their respective employer companies.
The ECRA Board SponsorsMr Paul Harker, General Manager - Replenishment, Woolworths Limited
Mr Andrew Cummings, Managing Director, Clorox Australia Pty Ltd
The ECRA Working GroupThe following team members are thanked for their contribution and support:
Group Member Company
Mr Mark Casey Foodstuffs (Auckland) Limited
Mr Michael Haire Metcash Trading Ltd
Mr Justin Henderson Woolworths Limited
Mr Wesley Taylor Woolworths Limited
Mr Jan Van der Merwe Coles Group Ltd
Mr Steve Mitchell Unilever Australasia
Mr Geoff Harvey Simplot Australia Pty Ltd
Mr Hoss Matar Coca-Cola Amatil Ltd
Mr Brendon Lawry Fonterra Brands (NZ) Ltd
Ms Laura Hull Parmalat Australia Ltd
Mr Nick Frith Cadbury Schweppes Aust. & NZ
Mr Trent Baldac Coca-Cola Amatil Ltd
Mr Zach Thom Unilever Australasia
Mr Marek Rucinski Accenture
Mr Lindsay Davidson New Zealand Food & Grocery Council
ECRA SecretariatSamantha Blake
John Cawley
1

5
Background to the reportLate in 2008, ECR Australasia, in partnership with Accenture released the major report entitled “The On-Shelf
Availability (OSA) Challenge 2007- 2008, A report into the current state of OSA in the Australian and New Zealand
grocery industry”.
The report highlighted findings from an extensive survey of industry leaders and some of the key findings
from the report are captured within the following document. Notably, the report proposed three key
recommendations:
• There is a need to develop a common language for OSA, with clear definition of terms being the most
important first step for the value chain partners.
• Industry participants must develop a more aligned view of the root causes of poor OSA.
• The industry as a whole needs to improve its levels of collaboration to better address this issue in the future.
The following document has been developed as a step towards addressing these recommendations, and to
benefit business partners as they work together to improve OSA for shoppers.

6
Intr
od
uctio
n
IntroductionWhere companies determine a priority to improve
On-Shelf Availability (OSA), it’s beneficial to support
this goal with a framework for improvement. The
ECR Australasia OSA Improvement Road Map closely
follows the ECR Europe Shrinkage Reduction Road
Map (ECR Europe 2004) as a model. It is intended
for use as a manual and describes the activities that
need to be undertaken to develop projects to improve
OSA. It also provides an objective common language
to aid communication between business partners
aiming to mutually resolve out of stock (OOS) issues.
The OSA Improvement Road Map offers an easy-to-
follow framework built around a series of sequential
steps, supported with information, tools and tips to
address potential issues that may be encountered.
As well as providing the basis for a project-based
approach to OSA, the framework recognises the
need for ongoing improvement and is also applicable
as a continuous improvement loop.
As part of the process of validation of the Road
Map as a framework for engagement, pilot case
studies have been undertaken. ECRA plans to make
details of the pilot case studies available upon their
completion.
Figure 1. The ECR OSA Improvement Road Map
Road Map Basis Source: Shrinkage: A Collaborative Approach to Reducing Stock Loss in the Supply Chain, ECR Europe 2004
The document follows the process shown in the
Road Map flow-chart above. Each step is covered in
detail with clarity around the objective and relevant
checkpoint considerations to help project partners
remain on track. At the heart of the framework is a
common sense approach:
• identify and prioritise plans
• undertake robust analysis using “real world” data
• develop and trial solutions
• evaluate their impacts prior to rolling out
sustainable and improved practices.
When considering OSA, it is clear that every business
situation is unique and is subject to its own set of
variables. There is not a single solution, or even a set
of solutions, that can simply be chosen and applied.
OSA improvement is a long-term undertaking for
companies and best practice will follow experience
and trialling of solutions. Users of this guide need to
be aware that there is no “one size fits all” solution to
OSA. The approach needs to be tailored in ways that
suit the particular business needs.
The OSA road map will help clarify a staged
approach to improving OSA. It also provides structure
to the ensuing work effort and provides guidance
around key project components for people involved.
Figure 2. Trends on level of importance of OSA to the industryThe Australasian grocery industry clearly recognises the importance of addressing OSA issues. In addition, it is evident that OSA has become a more important issue in recent years.
Ref: ECR Australasia / Accenture, 2008
2
Identify improved on-shelf availability as
a corporate goal
1. Plan
4. Develop Solutions
2. Map & Measure
3. Analyse / identify root causes
5. Implement
6. Evaluate
1.5
x m
ore
7%
93%
6%
33%
61%
0%
Not ImportantNeutralVery Important
4 x
less
Current
Five years ago

7
3S
tage 1 - P
lan
Objectives• Support for a project – Management attention and
the will for collaboration
• Establish priorities – Defining the project’s scope
• Resource the project - Undertake stakeholder
analysis
• Project charter - Establish a Project Charter and
Project Stage Plan
Support for a project – Management attention and the will for collaborationWhile there are great benefits to be enjoyed from
improved OSA, it must be recognised that OSA
projects face a range of challenges, including the
need for resources and collaboration.
These needs stem from the fact that the causes of
poor OSA can occur at various points within the
value chain. Remember that it may not be within the
bounds of a single function, or of just one business
partner, to address the issues and to remove
impediments.
Discussion around roles and responsibilities
within the project team follows. However, a key
consideration at the outset of the project involves
achieving buy-in and support of Senior Management.
Management Attention is identified as one of two
critical prerequisites (along with Measurement) by
ECR Europe.
OSA measurement and improvement can be
resource hungry activities and usually require the
cooperation of staff across companies and functions.
Engagement and buy-in of senior management is
generally required to ensure a project receives the
ongoing attention, sponsorship and resourcing
needed for success. High level management attention
facilitates collaboration as senior management across
project partner companies can prioritise and resource
the project work as part of joint business planning.
Figure 3. Seven Key Levers to Affect Out-of-Stocks
Ref: ECR Europe & Roland Berger Strategy Consultants, 2003
Introduction
Identify improved on-shelf availability as
a corporate goal
1. Plan
4. Develop Solutions
2. Map & Measure
3. Analyse / identify root causes
5. Implement
6. Evaluate
1 2
3
4
5
6
7
Measurement Management attention
Replenishment system
In-store execution
Inventory accuracy
Promotion management
Ordering system
Do you have Senior Management buy-
in and sponsorship for undertaking
project work to improve OSA?
OSA Improvement Road MapStage 1 – Plan

8
Sta
ge
1 –
Pla
n
Establishing Priorities – Defining the project’s scopeFor many companies, the concept of a goal to
increase OSA can be daunting. There are many
SKUs, customers, stores, data points and resources
involved and a wide variety of potential issues that
may be contributing to OOS. Often this results in
companies either undertaking projects on an ad-hoc
basis or not at all, despite recognising the value
of OSA improvement. The key to getting started is
prioritising.
Prioritising allows companies to get started on
improving OSA in collaboration with business
partners by focusing on the issues that will give the
greatest return on investment (people, time, finance).
A stepped approach to improvement facilitates
“learning by doing” - trialling efforts to understand
what works. Lessons can then be reapplied to
future OSA improvement efforts, thus reducing the
investment needed.
The approach taken to prioritising will depend on the
specific situation. Some suggestions for prioritising
for various business situations are listed in the chart
below.
Whatever method and basis is used, prioritising must
be undertaken as the outcomes define the scope
for the initial (or next) improvement project. This in
turn helps determine the stakeholders, resource
requirements and goals for the project.
Business Situation Approach to prioritising
The biggest opportunities for improving sales through OSA are not known. The number of SKU’s is relatively small
• Measure OSA for all products across suitable sample of stores to gather credible data to determine biggest opportunities which should be addressed first
The biggest opportunities for improving sales through OSA are not known. The number of SKU’s /stores is large
• Determine which products will have the most impact on sales (&/or profit) through increasing OSA. The 80/20 rule can be applied as basis – 80% of sales from 20% of products (and if appropriate keep repeating 80/20 rule on each top 20% of SKUs until appropriate sized range is identified to prioritise)
• Apply same method to store base if appropriate
• Consider velocity and volatility of SKUs (see appendix 1 – Prioritising OSA efforts: Velocity and Volatility of Sales)
• Consider “Shopper Cost Components and OOS Behaviour” as it relates to your category / SKUs (see appendix 2 – Prioritising OSA Efforts: Shopper Cost Components and OOS Behaviour)
There are known situations (eg: new product OOS, promotional OOS, seasonal OOS) and/or SKUs that are obvious OOS issues in the business.
• Measure OSA for the identified SKUs / situations across sample store base to determine if value in focussing on specific stores, regions first
Have you defined the scope of the project through identifying priority products,
stores and OOS situations?

9
Stag
e 1 – Plan
Resource the project – Undertake Stakeholder Analysis Resource requirements will be different for every OSA
project depending on:
• scope (depth, breadth, longevity)
• methodologies available and chosen (manual v
technological etc)
• return on investment.
It will be incumbent on the project management team
to determine specific resources required for each
project. Irrespective of the variables, one of the first
steps the project manager ought to undertake when
considering resourcing is to conduct a Stakeholder
Analysis.
When introducing the Stakeholder Analysis table, ECR
Europe noted that having established the case for
a project, it is important to identify key stakeholders
through the supply chain and to consider the impact
of improvement projects on all of these stakeholders.
This is necessary to appreciate the social and cultural
organisational dynamics involved as they will impact
the likelihood of a project’s success. This is particularly
true for projects where many of the underlying issues
may be “people issues”.
The example Stakeholder Analysis Table below, maps
the effects that an OOS reduction project might have
on stakeholders. The perception of the benefits and
problems of these efforts should be captured along
with the perceptions of the changes that would occur
and the likely resistance to them. Finally judgement
on the current levels of commitment as well as those
required to deliver the project is necessary. Efforts to
resolve gaps between current and required levels of
commitment can then be incorporated into the plan.
Who will be Affected?
Perceived Benefits (Disbenefits)
Changes Needed
Perceived Resistance
Shoppers • Get what I want at best price
None None
Store replen. Team
• Increased sales
• (Inventory risks)
Learn to use new process for promo ordering
Reluctance to change – time pressure
Store Managers
• Increased sales
• Satisfied customers
Ensure staff skilled in new processCommitment to new process
Reluctance to change – store personnel already too busy
Sales Rep • Increased sales
• ROI
Engage in data sharing with customer
Extra work and unsure if customer will perform their duties
Commitment (Current and Required)
Anti None Allow it to happen
Help it to happen
Make it happen
C R
C R
C R
Figure 4. Stakeholder Analysis TableExample Stakeholder Analysis Table – Improve availability on promotion
Ref: Adapted from Beck A, Chapman P & Peacock C, 2003
10
The results of the Stakeholder Analysis provide
valuable insight into which stakeholder groups
need to be represented on the project team
and where lines of communication need to be
established. Below is an example of a project
team developed following stakeholder analysis.
This example shows the cascade of support from
the project sponsors at senior executive level, to
the senior managers who lead the steering group
and then to the project team itself. Whilst there
are many people associated with the team, the
bulk of the work falls to the project managers who
are tasked with delivering the project goals.
Figure 5. Example Project Team
Ref: Adapted from Beck A, Chapman P & Peacock C, 2003
Sponsors:
Steering Group:
Project Managers:
Team Members:
Senior Manager
Functional Director / General Manager
Functional Director / General Manager
Retailer Supplier
Project Manager
Buyers, Store Ops, Store Managers
Senior Manager
Project Manager
Account Manager, Sales Ops Managers
IT, Supply Chain
Supply ChainSupport
Have you identified key stakeholders
for your OSA improvement project,
and considered their needs when developing
a project team and defining lines of
communication?
Sta
ge
1 –
Pla
n
11
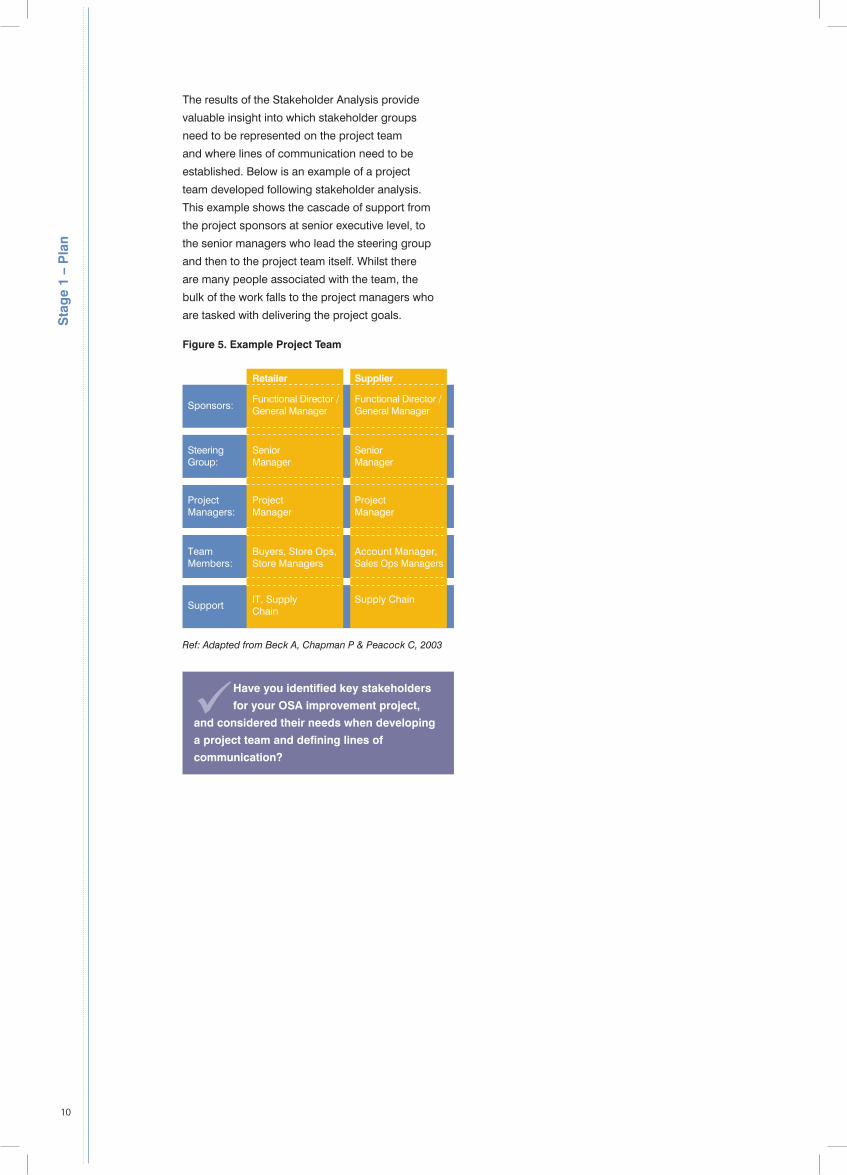
Project Charter – Establish a Project Charter and Project Stage PlanHaving gained support by Senior Management to
undertake OSA improvements and identified the
project scope, it’s vital to bring together the overall
plan into a management record that will then serve
as a “living” document throughout the project. This
is commonly referred to as the Project Charter. This
Charter is supported by Project Stage Plans.
The Project Charter outlines the vision, scope/scale,
objectives, approach and responsibilities for the
project in its entirety. This is the top-line document
which provides a common understanding of the
purpose across key stakeholders. The Charter
may be altered through the project with Steering
Committee and Sponsor approval, for example if the
project scope changes significantly.
The Project Stage Plan supports the Charter. Project
Stage Plans will be replaced during different phases
of a project. OSA improvement projects are likely to
require separate Project Stage Plans for each of the
following phases of a project:
• Mapping processes and measuring OSA
• Implementing solutions as a pilot program
• Rolling out solutions to a broad base.
This is because these are distinct projects within the
overall strategy – they have their own goals, resourcing
needs, sets of responsibilities and milestones.
At the outset, the Charter will set the platform for
the entire project whilst the Project Stage Plan
will look specifically at the immediate tasks ahead
including; mapping processes, OSA measurement,
and potentially root cause analysis and solution
development work. The Project Stage Plan cannot
consider solution implementation at this time as issues
have not been uncovered nor solutions developed.
The template/formats these documents take will vary
across businesses but the tables below capture the
key elements that need to be addressed.
Development of the Project Charter should be a
highly collaborative process. This represents an
important and valuable opportunity for project
partners to literally “be on the same page” from
the very start of a project, and to ensure that the
objectives are shared. This joint ownership will
smooth the path to working together right from the
project’s outset.
Project CharterProject Charter should include…
The vision for the project and the project team
The scope of the project
The objectives of the project
The approach to be taken
Anticipated costs of the project
Anticipated resources required by the project
The roles and responsibilities
How participants will collaborate to deliver the objectives of the project – what the future state will look like after the project
How this project will contribute towards realising the vision. The people and systems that will be affected and the timing for the project
Why the project is necessary and how its success will be measured (eg. target levels for measures of stock availability) The intended benefits to partnering organisations and shoppers
What the major project activities will be and the key milestones to be used to monitor progress. How issues such as confidentiality will be addressed
Planned budget requirements and how they are broken down by cost element
What the resource requirements will be for the project, and from where resources need to be sourced
Responsibilities for managing the project. The responsibilities of the resources that will be committed to the project
Each Project Stage Plan should include:
The deliverables
The milestones for monitoring progress
Risks and strategies for mitigation
The tasks necessary to produce the deliverables
The resources necessary to produce the deliverables
Responsibilities
Measures
What must be delivered in the project stage
What the sequential steps are and when and how progress against each step is to be tracked and reported
What the risks are that could impact on the project stage and what can / will be done in advance to mitigate these risks
What the specific tasks are that are to be completed during the project stage. What skills are in place and any additional training and education required prior to commencement
Who needs to be involved against each deliverables, when and for how much time. Other resources required – systems etc.
What the specific responsibilities are for those involved in the project stage
Specific measures that will be used to identify the impact of work undertaken during the project stage. How these measures facilitate evaluating the impact of work
A feasible schedule Date by when the project stage is to be completed
Project Stage Plan
Stag
e 1 – Plan

1212
“A Project Charter allows us to identify the
scope and objective right at the start before
commencing any work. We determine what is
out of scope as well, so that during the project
you are not distracted by other related topics.
The Charter allows us to outline the benefits,
assumptions, risks and deliverables. It can
then be updated as we work through the Road
Map, determining goals, timelines etc.
It also keeps a record of all work done in the
project” – Laura Hull, Parmalat Australia Ltd
Have project partners developed a
Project Charter and achieved Sponsor
sign-off?
Has an appropriate Project Stage Plan been
developed for the upcoming stage (map
processes and measure OSA)?
Have these been communicated to all key
stakeholders so they are in a position to
support the project? Are all participants aware
of, trained for and ready to perform their roles?
Once developed, the Project Charter needs to be
signed off by the project sponsors. To achieve a clear
understanding of intent and clear identification of
roles and responsibilities, all stakeholders need to be
instructed in the Charter and Project Stage Plans.
Sta
ge
1 –
Pla
n

13

14
4
Sta
ge
2 -
Map
key
Pro
cess
an
d g
ath
er M
easu
res
Objectives• Map key business processes
• Determine and agree measures to be used
• Consider OSA measurement method options
Improving OSA begins with diagnosing the
nature of the OOS problem which then facilitates
identifying the causes. Understanding current
operational systems and processes is also
important to gain widespread recognition of the
problem and establish the need for change.
Figure 6. Frequency of OSA Measurement Out of Stocks impacts are at least AUD $3.2 billion, but more likely closer to AUD $5.2 billion. A key aspect precluding more exact calculation was the level and inconsistency with which OOS are measured in the markets.
Notably, in 2008 in Australasia:
• 42% of suppliers were not measuring OSA at all
• 22% of retailers were not measuring OSA at all
Of those who did measure OSA, the frequency of measurement was highly inconsistent as shown in the following chart, thus providing suboptimal value.
Ref: ECR Australasia / Accenture, 2008
The act of mapping business processes as part of
identifying the sources of OOS problems will help
develop the momentum required to bring about
change. The core purpose of supply chain processes
is to make products available to shoppers at the
point of purchase. If this is not happening, then
somewhere along the chain, one or more processes
are failing to perform. Therefore it makes sense to
invest time and effort in mapping these processes to
determine whether availability is being measured and
to understand what causes failure.
Map Key Business ProcessesDocumenting existing processes will help the project
team to view the various activities that make up a
supply chain from a process perspective. Often,
existing ways of working have never been described
or even thought of as processes. Further, companies
may be well aware of their internal processes but may
fail to fully comprehend their partners’ processes.
By ensuring that all parties have a good level of
knowledge, issues can be more correctly identified
and resolved.
Therefore, prior to measuring OSA, it makes sense to
map the processes intended to ensure the availability
of product to consumers, including forecasting and
ordering processes as well as physical movement of
goods. This establishes common understanding of
actions, potential risks to availability, measurements
in place, data availability, accountabilities etc. This
will improve engagement and communication and
should help expedite improvement by strengthening
understanding between partners.
OSA Improvement Road MapStage 2 – Map key Process and gather Measures
Identify improved on-shelf availability as
a corporate goal
1. Plan
4. Develop Solutions
2. Map & Measure
3. Analyse / identify root causes
5. Implement
6. Evaluate
Infrequentor adhoc
measurementintervals
5%3%
17%
37%
10%
28%
OtherAnnuallyQuarterlyMonthlyWeeklyDaily
“We have found significant value in mapping
out the relevant current processes in detail
before jointly considering what changes could
be implemented. This allows us to better
understand our retail partners’ requirements
and uncover issues which might otherwise
have been overlooked, but can turn out to be
critical!” Hoss Matar, Coca-Cola Amatil Ltd

15
Flow-chart techniques are an appropriate way to
document the steps of a process. A simple and
effective flow-charting technique is a Block Flow
Diagram. The figure shown below is an example of a
block flow diagram for the steps involved in moving
products in a retail store from backroom areas to
the shelf. Where necessary, process steps can be
further analysed to document them to a greater level
of detail.
Figure 7. Example Block Flow Diagram
Ref: Beck A, Chapman P & Peacock C, 2003
There are many different ways by which a process
can be represented. Each can provide useful insights,
but when communicating the findings of the process
mapping exercise it is wise to keep the techniques as
simple as possible. Even when the flow chart doesn’t
provide a complete or totally accurate model of a
process, it still has considerable value in promoting a
process-orientated approach to improvements and to
align understanding.
Determine and Agree Measures to be UsedProject teams should adopt two approaches to
measuring OSA in order to understand the issues
they are trying to address.
The first is to identify and collate relevant existing
value chain data across both partners’ businesses.
The process mapping exercise described previously
helps this process. So to will utilising the Common
Language detailed in appendix 5, which describes
the suite of measures of product availability currently
used by suppliers and retailers through in each stage
from supplier Distribution Centre (DC) through to
retail store and shelf.
The second is to collate new project specific data,
which may include both:
• “Hard” data – collected from store audits, retailer
inventory data, point-of-sale data
• “Soft” data - information gathered via staff
interviews or observations during store visits.
There are a number of measures that can help project
partners to appreciate the “what, where, when and
how much” questions associated with retail out-of-
stocks. In the major study A Comprehensive Guide
To Retail Out-of-Stock Reduction In the Fast Moving
Consumer Goods Industry (Gruen & Corsten 2008), a
suite of attributes and related measures for OOS rates
were provided. This work was underpinned with two
fundamental concepts:
1. The concept of an OOS event which takes place
each time a product is unavailable for purchase
by a consumer when it was intended by the
retailer that the product should be available for
purchase on the shelf. The event starts when the
last saleable unit is taken from the shelf and ends
when saleable stock is replenished on the shelf.
2. That OOS events have multiple attributes which
can be measured and calculated as OOS rates.
Each attribute can be expressed as a rate over a
given measurement period.
The following table shows the OOS attributes defined
by Gruen & Corsten, the related OOS rates and a
brief description and calculation base. This study
provides much greater detail around these measures
and their uses (refer to Appendix 6).
Move Roll Cage to Aisle
Open Cage
Move Case to Shelf
Prepare Shelf
Fill Shelf
Have you documented the value chain
processes (yours and your project
partner’s) and developed joint understanding
of the actions, risks, measures, data and
accountabilities associated with the processes
from an OSA perspective?
Stag
e 2 - Map
key Pro
cess and
gath
er Measures
OSA Improvement Road MapStage 2 – Map key Process and gather Measures

16
Sta
ge
2 -
Map
key
Pro
cess
and
g
ath
er M
easu
res
The table provides a basis for common language
when partners are measuring OOS/OSA rates.
The ability to measure the various attributes will be
dependent on the data and resources available,
and will provide differing insights into potential root
causes of issues. The key is for project partners to
agree which OOS/OSA rates are being measured to
ensure common understanding and continuity.
OOS Attribute OOS Rate Description / Calculation
Frequency
Breadth in Category
Duration
Shelf Availability
Intensity - Lost Unit Sales
Intensity - Lost Monetary Sales
Intensity - Number of Customers Impacted
Item OOS Event Rate
Category OOS Event Rate
OOS Duration Rate
Shelf Availability Rate
OOS Lost Unit Sales Rate
OOS Sales Loss Rate
OOS Customer Impact Rate
The number of OOS events for an item over a given unit of time
The number of items in a category that are OOS at the time of the measurement as a percentage of the total number of items intended to be available for sale in category
During a given measurement period: the total selling time that the item is OOS divided by the total selling time available
100% minus the OOS Duration Rate
In the measurement period: The total item unit losses due to OOS divided by (the total number of item units sold plus the total item unit losses)
In the measurement period: The total dollar sales losses due to OOS / (the total dollar sales plus the total dollar sales losses)
1 – [(# estimated baskets the item would have appeared in minus the actual # baskets item appeared in) divided by # estimated baskets the item would have appeared in]
Are project partners aligned as to the
specific attributes of OSA/OOS they
are going to measure and the calculations
being used?
Ref: Gruen T W & Corsten D, 2008

17
Stag
e 2 - Map
key Pro
cess and
gath
er Measures
Consider OSA Measurement MethodsCompanies need to develop an approach to data
gathering that is systematic and part of an ongoing
process that describes patterns, trends and
information relating to product OSA. There are three
general methods companies use when seeking to
measure OOS/OSA rates:
1. Manual Store Audits
2. Perpetual Inventory Data based OOS aggregation
3. Point of Sale Data based OOS estimation.
A brief description of each of the three methods
follows, including some advantages and
disadvantages of each.
Method 1: Manual Store Audits
Brief Overview
Primary Advantages Key Limitations
Periodic manual checking of shelves and displays in chosen category. Auditor checks for “holes” - i.e. a shelf tag should be in place with an SKU behind it, but the shelf is empty (or if product is available it is hidden to the shopper). Generally used to calculate the % items in a category that are not available – i.e. the category’s OOS rate or the OOS rate for a given manufacturer. Also may be used to track instances of OOS over time – eg a given SKU was unavailable 6 times when checked weekly over 12 month period.
• Can facilitate instant follow up which may determine the cause of the OOS so it can be addressed and checked on broader scale if appropriate (eg data integrity issue)
• Can be relatively cost effective way to focus on fixing ongoing issues where the issue and problem areas (store / product) are known and can be targeted.
• Process may have been in place for extended time, allowing for comparisons of performance data over time
• All holes are counted equally irrespective of rate of sale, item value, and duration of OOS. Does not much give perspective of loss of sales or impacts on consumers
• High cost of labour means may be ad-hoc and difficult to scale to large store / product base. Lack of frequency and breadth then diminishes worth of data
• Subject to many opportunities for human error - eg similar looking product behind wrong ticket = no gap perceived
Method 2: Perpetual Inventory data based measurements
Brief Overview
Primary Advantages Key Limitations
Review of Perpetual Inventory (PI) data periodically to check stock on hand for all SKUs available in the store inventory system. When an item is registering zero stock on hand in a store, then this is counted as an OOS. Can then be used similarly to manual audit to identify rates of OOS for given category / supplier etc on given day, instances of an item going OOS over time etc. Can also be used for additional insight into the various OOS rates if data is tracked daily.
• System based, therefore is easily scaleable and facilitates standardised reports. Eliminates human errors.
• Provides level of insight into OOS duration – particularly if captured daily – which can then be used to consider cost of lost sales, consumer impacts etc
• Could be used to point to potential root causes and solutions – eg if promoted line goes OOS midweek, may need twice weekly delivery or a larger initial order.
• Is unable to differentiate between OOS in store and OOS on shelf, i.e. if product is hidden in back room or on wrong shelf this is not picked up
• Is subject to inaccuracy where issues such as theft, damages, miss-scans etc mean inventory has been lost but is still shown in the PI system.
Method 3: Point of Sale Data based estimates
Brief Overview
Primary Advantages Key Limitations
This method uses data bases which contain product rate of sale information captured over time, whereby algorithms linked to the point of sale systems estimate whether and when a product goes OOS by the fact that it has not scanned during an anticipated period. When the product next scans, the system then calculates how long the OOS duration was and the number of estimated missed sales this equates to. From this data, all OOS rate calculations can be performed, and, by examining patterns, root causes of the OOS can be suggested.
• Mass scalability and ability to aggregate / disaggregate data (SKU / Category/ Store / Brand etc)
• If estimates are accurate, then gives precise views of lost sales/revenue from OOS and facilitates prioritising
• Provides greater insight into potential root causes of OOS• Measures “On-shelf” availability rather than “In -store”
availability, and if used in conjunction with PI data can show issues in shelf replenishment and maintenance.
• Overseas studies have shown to be 85-90% accurate, similar to manual audits.
• For slower moving lines, an item may go OOS but is not picked up as no sales were estimated to have been missed in the period it was OOS
• Based on historical sales rates, therefore may not be accurate where sales are erratic, for new lines etc, and the system’s calculations are dependent on accuracy of historical data
• May not be trusted as calculations are theoretical from a system – i.e not “seen with my own eyes”.
Ref: Gruen T W & Corsten D, 2008

18
Have project partners considered the
methodology to be used for the OSA
measurement, agreed on the process for
measuring, and have clear requirements for the
quality and quantity of output data and how it
is to be used?
Does the Project Charter need to be revised?
Does the Project Stage Plan adequately cover
the work to now be undertaken?
Again, each method has its advantages and
disadvantages. Project teams will be guided by
what is available and what is appropriate to the
specific measurement situation they face. The key
is to research the options and consider what is
appropriate, then to agree the process by which the
measurement will be executed and the deliverables
required from the measurement.
The objectives are that the measures can
be used to determine root causes, and to
measure the results of the changes made
immediately and on an ongoing basis.
Figure 8. OSA Data Collection Methods UsedIn Australasia 58 % of Suppliers and 78% of retailers measure OSA. The OSA data collection methods they use are as follows:
Ref: ECR Australasia / Accenture, 2008
EMERGING TREND: Recent reports identify
Method 3 – POS Data Based Estimates as
an emerging practice which may provide
significant benefits to users. This method is yet
to achieve substantial adoption in Australasia,
but should be evaluated as a potential method
by companies wishing to undertake OSA
Improvement projects and its merits strongly
considered.
9%
33%
54%
4%
Electroniccheck
Systemcalculated
CombinationPhysicalaudits
Sta
ge
2 -
Map
key
Pro
cess
and
g
ath
er M
easu
res

19
Stag
e 3 - Analysis and
O
OS
cause identificatio
n
5OSA Improvement Road MapStage 3 – Analysis and OOS cause identification
Objectives• Determine the type of OSA issues faced (shelf vs
store vs supply chain)
• Identify Causes of OSA issues.
Having prioritised focus areas for improvement efforts
and undertaken process mapping and measurement,
it is likely that project participants will have identified
problem areas. The next step is to determine the
cause of the issues so improvement steps can be
taken.
Identify improved on-shelf availability as
a corporate goal
1. Plan
4. Develop Solutions
2. Map & Measure
3. Analyse / identify root causes
5. Implement
6. Evaluate
20%
18%
13%
13%
6%
5%
4%
3%
3%
2%
13%
15%
15%
13%
7%
19%
0%
0%
0%
18%
2%
11%
Supplie Rr etailer
Forecasting inaccuracy
In-store staffing (insufficientor busy staff)
Promotions, advertising anddisplay planning
Planogram design andimplementation
Ordering (no order, late order,wrong order, backorders)
Range complexity
Physical distribution(shipping, loading)
Storage (put away / break pack)
Supplier availability
Product purchasingfrequencies
Data integrity
Note: terminology used in chart is per that used in the survey
Ref: ECR Australasia / Accenture, 2008
Figure 9. Australasian Supplier and Retailer points of view on root causes of poor OSA There is considerable misalignment between what supplier companies and retailers view to be the causes of poor OSA. This highlights the importance of undertaking collaborative project work to measure OSA and understand root causes of issues, so that there is alignment on what is driving the issue prior to developing solutions.

20
Determine the type of OOS issues (Shelf vs. Store vs. Supply Chain)The first consideration when determining causes of
OOS is to understand the point in the value chain
at which availability of product is breaking down.
Identify the type of OOS issue being incurred
through answering the following questions:
Consideration:SHELF based OOS tend to be store specific
problems and are less likely to be related to specific
products – (i.e. if a product is found to be OOS only
in isolated stores, potentially SHELF based OOS
issues are behind this).
For example:
- Poor shelf replenishment from backroom
- Poor planogram compliance.
STORE based OOS issues are often related to
specific products – (i.e. if a product is found to be
OOS across a broad base of stores, potentially
STORE based OOS issues are behind this).
For example:
- Product data in the system may be incorrect
- Product demand may be difficult to forecast (on
promo, new line, rapid growth etc)
- Promotional communication / execution issues
may exist
- Product may have insufficient space in
planogram.
Therefore, the breadth of OOS at product level may
also be an indicator of whether SHELF or STORE
based OOS issues are being experienced.
5
Question If answer is YES…
Is stock available in store but stock availability on the shelf / POS is poor?
this is a SHELF based OOS issue, and causes will lie in issues relating to in-store operations
Is stock available in the DC, or from Direct Store Delivery (DSD) supplier, but stock availability in the store is poor?
this is a STORE based OOS issue, and causes will lie in issues relating to store ordering processes
Is stock availability in DC (or from DSD Supplier) poor?
issues lie in upstream planning and supply chain operations
Have you identified whether the OOS
issues are SHELF based OOS issues,
STORE based OOS issues (or if SUPPLY
CHAIN based OOS issues upstream of the
store)?
Sta
ge
3 -
Ana
lysi
s an
d
OO
S c
ause
iden
tific
atio
n

21
Stag
e 3 - Analysis and
O
OS
cause identificatio
n
Identify Causes of OSA IssuesOnce the type of OOS issue has been determined,
the next logical step is to identify, through the use
of hard and soft measurement tools (see Road Map
Stage 2) the likely OOS Problem Area.
OOS Problem Areas, and their underlying causes,
may be classified differently by individual retailers
and suppliers according to in-house terminologies.
The following table highlights common OOS Problem
Areas and their underlying causes. The OOS Problem
Areas are segregated into UPSTREAM SUPPLY
CHAIN, STORE and SHELF based OOS types. Refer
also to Appendix 5 regarding Common Language in
this area.
Type of
OOS
Value Chain
Stage
OOS Problem
Area
Causes of Out of Stocks
UPSTREAM SUPPLY CHAIN based Out-of-Stocks
Supply into Retailer DC Replenishment
Supplier Out of Stock – Order was correct but supplier did not have sufficient stock available to fulfil the orderSupplier Picking / Delivery Error – Supplier delivered incorrect quantity / product, or delivery was late, or product delivered was unsaleable (damaged, dated, etc)
At Retailer DC
Forecasting Retailer Forecast Error - Inadequate stock ordered due to incorrect estimate of volume / timing of stock requirements
Ordering Retailer Order Error – Wrong Item / Quantity ordered by retailer, or ordered too early/late
Management Retailer Promotions Management – Changes to promotion scale/timing, leading to under ordering by retailer
Data Integrity
Product Data Error (DC System) – Product item data is incorrectly loaded / aligned in system, impacting capability to order correctly (eg new/deleted lines, pack counts, etc)Inventory Data Error (DC System) – Quantity Available in system is incorrect. Stock is incorrectly assumed to exist
Product Unsaleable Product Retail DC– Stock on hand cannot be dispatched to store due to dated product / QA issues / product recall etc
Supply into Retail Store Replenishment
Retailer DC Out of Stock - Order was correct but Retailer DC did not have sufficient stock available to fulfil the order (see section above)Retailer DC Picking / Delivery Error - Incorrect quantity / product from retailer DC, late in delivery / delivery cycle too infrequent, product damaged or otherwise unsaleableDSD Supplier Failure - Order was correct but supplier did not have sufficient stock available / delivered incorrect product / delivered late / order rejected at delivery
STORE based Out-of-Stocks
At Retail Store
Forecasting Store Forecast Error – Inadequate stock ordered due to incorrect estimate of volume / timing of stock requirements
Ordering Store Order Error - Store ordered incorrect stock / wrong quantity / too late vs. planned / forgot to order / etc
ManagementStore Promotions Management – Incorrect understanding of scale, & / or late changes to scale / timing, leading to under ordering
Data Integrity
Inventory Data Error (Store System) - Quantity Available in system is incorrect. Stock is incorrectly assumed to existProduct Data Error (Store System) - Product item data is incorrectly loaded / aligned in system, impacting capability to order correctly (eg new/deleted lines, pack counts)POS Data Error – Product is miss-scanning leading to inventory inaccuracies
ProductProduct Association – An OOS on one SKU drives an unforseen spike in demand for a complementary SKU, driving it OOS
SHELF based Out-of-Stocks
“In-store Operations”
On Shelf / Display
Replenishment Shelf Replenishment Failure – Product available in store, but not moved to shelf/display in time to prevent OOS
Management
Planogram Compliance and Maintenance - Poor merchandising on shelf eg. products not aligned to correct tickets, missing tickets, incorrect space/position vs. planogram
Product Unsaleable product at store – Product removed from shelf due to damage, theft, recall etc

22
PLEASE NOTE: Appendix 3 offers further tools/ideas
for consideration in tracing underlying causes of
OOS.
As project participants analyse hard and soft
measurement information, determine proposed OOS
types, and identify problem areas and underlying
issues, this information should be validated by the
project team. The team should be satisfied that they
have sufficient information to be confident that the
appropriate underlying causes have been identified
before moving to the Developing Solutions stage.
“The importance of fully identifying &
understanding the underlying causes of OOS
cannot be understated. Without understanding
the real cause of an OOS, it’s an almost
impossible task to implement the ongoing
corrective action and ultimately reduce OOS
at a shelf level. Our approach to ensuring we
get to the heart of the issue is to continually
question & drill down through an issue until
we are satisfied that we have really gotten
to the real root cause of the OOS. Using this
methodology, we are able to build a loss tree
that allows us to understand each of the issues,
including the root cause that has lead to the
OOS. Using this information, we can then
develop & implement the necessary strategies
to improve OSA.” Steve Mitchell, Unilever
Australasia
EMERGING TREND: In Field Intelligence:
“Sales Force Automation” tools – handheld
information management devices, are rapidly
becoming highly sophisticated and are being
used by FMCG companies to help manage
OSA (among many other functions) in Australia
and New Zealand today. Not only is sales and
shelf management information made available
to representatives, but rapid responses to low
and out of stocks can be coordinated. A Root
Cause of OOS determination checklist can
also be made available to representatives via
the devices. This helps them to identify OOS
drivers and discuss solutions with store staff
immediately, and to relay information to their
Head Office for advice and action planning on
a broad scale.
Have identified OOS Problem Areas and
the underlying issues driving OOS been
validated and agreed as correct by project
partners? Is the project team now prepared to
seek and develop solutions?
Does the Project Charter need to be revised?
Does the Project Stage Plan adequately cover
the work to now be undertaken?
Sta
ge
3 -
Ana
lysi
s an
d
OO
S c
ause
iden
tific
atio
n

23
Stag
e 4 – Develo
ping
so
lutions
6OSA Improvement Road MapStage 4 – Developing solutions
Objectives• Identify and develop solutions that address root
causes of OOS.
Organisations may be tempted to start their OSA
improvement efforts at the solution stage. It is
not uncommon to find a great solution and then
search for a problem to which it can be applied.
However, this is at odds with the systematic
approach advocated. Through the diagnostic
investigation described in the Road Map, it is clear
that the solutions required to resolve OOS issues
and improve availability to shoppers are extremely
context-specific.
Identify and develop solutions that address root causes of OOSBearing in mind that the effective solutions will be
context-specific, it is not possible to associate single
particular solutions with specific problems individual
companies may be experiencing. However, a series
of suggestions are provided in the following table for
consideration and as ‘thought starters’.
The suggestions listed have been grouped according
to the OOS Problem Areas noted previously in Road
Map Stage 3. It is not an exhaustive list of options
and many other potential solutions are available.
Individual project managers obviously need to
consider the appropriate solution(s) given the specific
circumstances faced and resources available.
Identify improved on-shelf availability as
a corporate goal
1. Plan
4. Develop Solutions
2. Map & Measure
3. Analyse / identify root causes
5. Implement
6. Evaluate

24
Type of OOS
Value Chain Stage
OOS Problem Area
Causes of Out of Stocks Potential Solutions
UPSTREAM SUPPLY CHAIN based Out-of-Stocks
Supply into Retailer DC
Replenishment
Supplier Out of Stock – Order was correct but supplier did not have sufficient stock available to fulfil the order
• Collaboration / knowledge sharing to improve forecasting
• Communication process and triggers to improve contingency planning for potential OOS – “no surprises” basis
Supplier Picking / Delivery Error – Supplier delivered incorrect quantity / product, or delivery was late, or product delivered was unsaleable (damaged, dated, etc)
• Implement common process and language for tracking and communicating issues to suppliers as arise. Rank issues and develop action plan and KPIs to track improvement
At Retailer DC
Forecasting
Retailer Forecast Error – Inadequate stock ordered due to incorrect estimate of volume / timing of stock requirements
• Collaboration / knowledge sharing to improve forecasting
• Revise safety stock levels for SKUs considering volatility levels in addition to historical average issues to store
• Revise safety stock levels for SKUs with long lead times
OrderingRetailer Order Error – Wrong Item / Quantity ordered by retailer personnel, or ordered too early / late
• Computer assisted ordering for DC requirements
• Training and best practice reinforcement
• Collaborative ordering or Vendor/Co-managed inventory
• Alerts systems
Management Retailer Promotions Management – Changes to promotion scale / timing, leading to under ordering by retailer
• Collaboration to ensure agreed promotional scale / scope / timing at outset – avoid surprises when possible
• Develop joint action/contingency plan to be activated should unforseen promotional changes occur – ensure all impacted parties are aware of responsibilities and lines for communication of any anticipated issues
Data Integrity
Product Data Error (DC System) – Product item data is incorrectly loaded / aligned in system, impacting capability to order correctly (eg new/deleted lines, pack counts, palletisation quantities etc)
• Utilise data synchronisation platforms (eg GS1net)and ensure alert system in place to capture misalignment
• Implement regular audit process to ensure alignment
• Strengthen new product introduction / deletion process
Inventory Data Error (DC System) – Quantity Available in system is incorrect. Stock is incorrectly assumed to exist
• Audit to establish level of error. For critical lines, consider increasing safety stock by appropriate margin to cover
• Investigate drivers of discrepancies (theft, damage, error) and take action to address
Product
Unsaleable Product Retail DC– Stock on hand cannot be dispatched to store due to dated product / QA issues / product recall etc
• Investigate for process breakdown contributing to issues and amend processes accordingly
• Collaboration with suppliers to identify potential product dating issues (eg seasonal) and develop joint plan to manage
Supply into Retail Store
Replenishment
Retailer DC Out of Stock – Order was correct but Retailer DC did not have sufficient stock available to fulfil the order (see section above)
•(Identify causes as above)
Retailer DC Picking / Delivery Error - Incorrect quantity / product from retailer DC, late in delivery / delivery cycle too infrequent, product damaged or otherwise unsaleable
• Implement process for monitoring performance and communicating issues to DC / Transport Operations as arise. Identify key issues and develop action plan and KPIs to track improvement
• Review replenishment cycle for store to ensure aligned to capability to store stock
DSD Supplier Failure - Order was correct but supplier did not have sufficient stock available / delivered incorrect product / delivered late / order rejected at delivery
• Implement common process and language for tracking and communicating issues to suppliers as arise. Rank issues and develop action plan and KPIs to track improvement
• Report issues to central coordination body so wider retail business can identify common issues and develop and implement solutions across store base
Sta
ge
4 –
Dev
elo
pin
g s
olu
tions

25
Stag
e 4 – Develo
ping
solutio
ns
Type of OOS
Value Chain Stage
OOS Problem Area
Causes of Out of Stocks Potential Solutions
STORE based Out-of-Stocks
At Retail Store
Forecasting
Store Forecast Error – Inadequate stock ordered due to incorrect estimate of volume / timing of stock requirements
• Collaboration / knowledge sharing with supplier representatives to improve forecasting (especially new, seasonal and promoted lines)
• Revise safety stock levels for SKUs considering volatility levels in addition to historical scan sales
• For items identified to have high levels of OOS, build base demand levels iteratively until true demand level is found to overcome self perpetuation of OOS through understated true demand
Ordering
Store Order Error - Store ordered incorrect stock / wrong quantity / too late vs. plan / forgot to order / etc
• Computer assisted ordering for store inventory
• Training and best practice reinforcement
• Alerts system prior to order transmission
Management
Store Promotions Management – Incorrect understanding of scale, & / or late changes to scale / timing, leading to under ordering
• Increased collaboration with supplier representatives and Retailer “Head Office” to ensure agreed promotional scale / scope / timing at outset – avoid surprises when possible
• Daily update process to facilitate review of plans and rapid identification of changes to plan. Action/contingency and communication plan in place for such occurrences
Data Integrity
Product Data Error (Store System) - Product item data is incorrectly loaded / aligned in system, impacting capability to order correctly (eg new/deleted lines, pack counts)
• Utilise data synchronisation platforms between store and central systems and ensure alert system in place to capture misalignment
• Implement regular audit process to ensure alignment
• Implement retailer wide communication process so that issues identified at one store can be flagged to all stores for checking data alignment. Advise suppliers of issues also to assist in checking and solving issues.
Inventory Data Error (Store System) - Quantity Available in system is incorrect. Stock is incorrectly assumed to exist
• Audit to establish level of error. For critical lines, consider increasing safety stock by appropriate margin to cover
• Investigate drivers of discrepancies (theft, damage, error) and take action to address
POS Data Error – Product is miss-scanning leading to inventory inaccuracies
• Check scan all items with PI discrepancy for barcode issues
• Training and best practice reinforcement for cashiers
Product
Product Association – An OOS on one SKU drives an unforseen spike in demand for a complementary SKU, driving it OOS
• Identify key SKUs suffering OOS through association (analysis can be done at HO or store level). Identify potential uplift for complimentary SKU and collaborate with Suppliers/HO to set appropriate short term safety stock adjustment when primary SKU is OOS
SHELF based Out-of-Stocks
“In-store Operations”
On Shelf / Display
Replenishment
Shelf Replenishment Failure – Product available in store, but not moved to shelf/display in time to prevent OOS
• Align labour availability to delivery scheduling
• Collaborate with Suppliers on opportunities to improve “store-friendliness” of product packaging and labelling to facilitate fast accurate product identification and shelf filling
• Develop “triage” process between stores and DC for fast storeroom identification of lines that are OOS / low stock in store at time of order
Management
Planogram Compliance and Maintenance - Poor merchandising on shelf eg. products not aligned to correct tickets, missing tickets, incorrect space/position vs. planogram
• Training and best practice reinforcement
• Store audits linked to KPIs for “Category / Aisle Captains”
• Identify products whose packaging contributes to shelf management mistakes and flag as potential improvement areas for suppliers
Product Unsaleable product at store – Product removed from shelf due to damage, theft, recall etc
• Track damage and theft rates in trial stores against target products to quantify issues and share between partners
• Supplier review of product specs for impacted SKUs

26
Prioritising SolutionsOften several potential solutions are available to
address a given problem. Solutions will have differing
levels of benefit and impact. The ideal scenario is for
a chosen solution to be easy to implement and have
a high level of impact and benefit. The reality is likely
to be a trade-off.
The following diagram shows how companies can
consider the impact and benefit versus ease of
implementation for each potential solution, and then
chart this information on an Initiatives Prioritisation
Matrix. This gives some clarity as to the relative merits
of various solutions when deciding which solutions to
implement and in what priority order.
Figure 10. Initiatives Prioritisation Matrix
Ref: Accenture
NOTE: Several publications that include proposed
solutions to OOS issues on a “by root cause”
basis have been included in the bibliography of
recommended reading (see appendix 6). These
are often supported with actual case studies in
the grocery industry showing solutions being
implemented. Again, while these may not match
specifics of the issues facing readers in their own
OSA improvement project, they can provide ideas
and insight to similar issues and the approaches
companies have taken to address them.
Categorising of SolutionsIn the previous table, potential solutions
have been colour coded as: Technological
Solutions – blue; Personnel/Training Solutions
– red; Process Solutions – green; Collaborative
Solutions – yellow. This suggests that the
following considerations can be included in
establishing plans to address OOS issues faced:
Sta
ge
4 –
Dev
elo
pin
g s
olu
tions
Ease of Implementation
L
Shelve
Re-evaluateMarketMix/Approach
Target and Test Quick Win
M H
L
H
M
2
3 6
1
5
4
Leve
l of P
oten
tial B
enef
its a
nd Im
pact
“It is important to understand the type of
solution you are proposing to address OOS as
this will help guide who needs to be involved.
For example, collaborative solutions will need
strong management involvement from business
partners, whereas technological solutions may
require involvement of experts with specific
skill sets in that area” Geoff Harvey, Simplot
Australia Pty Ltd.
OOS Problem Area Primary Solution Types Supporting Solution TypesReplenishment Process Collaboration
Forecasting Process Collaboration
Ordering Technology Training, Collaboration
Management Process CollaborationData Integrity Process Technology, CollaborationProduct Collaboration Process

27
Irrespective of the particular situation being faced,
there are some key considerations that need to be
discussed and agreed between project partners when
developing solutions. Several such considerations
are included on the table below and should be tested
by project teams prior to signing off solutions.
Stag
e 4 – Develo
ping
solutio
ns
Have project partners fully considered
and validated proposed solutions to
the identified root causes of their OOS issues
prior to developing trial implementation
plans?
Consideration Test
Rationality• Will the solution actually address the root cause?
• Is the solution clearly defensible?
Applicability • Can the solution work in the “real world” or does it rely too much on unproven theory?
Traceability• After implementing, can before and after measurement be performed to give clear indication of the solution’s impact?
Cost Effectiveness• Does the gain from this solution cover the costs associated with implementing it?
- For ALL parties involved?
Scalability• Could this solution logically and cost effectively be scaled to wider product/category/store basis?
• Does lack of scalability impact its effectiveness?
Longevity
• Will this solution be sustainable, or are other changes potentially going to supersede or override it?
• Will the solution be acceptable to future management if there are personnel changes?
People
• Does the solution impact people’s job tasks?
- Will this be an issue?
- Have stakeholders been consulted?
Legality • Are there any practices within the solution that may cause issues (eg anti-competitive)?
Timeliness • Can the solution be applied in a reasonable timeframe to ensure buy-in and resource commitment?

28
OSA Improvement Road MapStage 5 – Implement solution trials
Objectives• Develop implementation plans
• Implement trial solutions.
Similarly to each previous OSA Improvement
Roadmap stage, the Implementation stage requires
significant planning. The project management
team must construct a clear and robust plan for
implementation that defines what is to be delivered,
the benefits and the resources required.
NOTE: The scale and scope of solution trials to be
implemented will vary considerably between projects.
However they tend to be variations around four main
archetypes:
• Simple, quick and effective fixes
• Application of established best practice
• Experiments
• Business case pilots
Develop Implementation PlansIrrespective of the type of solution(s) selected for
trialling, a quality Project Stage Plan will be required
in order to drive delivery of the trial’s implementation
within time and resource constraints. It is critical that
all costs associated with the trialling of solutions are
captured throughout this stage so that these may
then be included in the ensuing evaluation of the
trials providing full visibility in the business case for
an extended roll-out.
Implement Trial SolutionsImplement the OSA improvement trial per the Project
Stage Plan.
Does the Project Charter need to be
revised? Has a Project Stage Plan been
developed for the Implementation stage that
adequately covers the work to be undertaken?
Is there a process to capture all costs incurred
in the trial implementation?
Identify improved on-shelf availability as
a corporate goal
1. Plan
4. Develop Solutions
2. Map & Measure
3. Analyse / identify root causes
5. Implement
6. Evaluate
7
Sta
ge
5 –
Imp
lem
ent
solu
tion
tria
ls

29
OSA Improvement Road MapStage 6 – Evaluate
Objectives• Determine and evaluate the impact of initiatives
• Prepare to roll-out successful initiatives.
Having completed the project work to trial the
implementation of changes to process and practice
in order to improve OSA, it is critical that robust
evaluation of the outcomes, findings and learning
from the project takes place.
Determine and evaluate impact of initiativesIf possible, the evaluation would be overseen by
Senior Management who do not have a stake in
the project work itself, but have a vested interest in
the improvement of OSA. The focus should be on
whether the project delivered the desired results and
why/why not. The evaluation needs to be objective
and of sound quality, with all facts and findings
clarified.
There are three sets of outcomes which should be
considered against each project in order to give full
perspective and ensure that benefits are captured,
irrespective of whatever next steps take place in
efforts to improve OSA. These are:
1. Report specific results the project achieved / failed
to achieve against objectives. Determine if the
business case been made to proceed
2. Capture key learning that arose through the
project work
3. Identify best / better practices that have been
unearthed in the project
Results versus objectivesObjectives for the project’s impact are specified
in the Project Charter during initial project plan
development (Stage 1 of Road Map) and measures
noted throughout the project. Evaluation considers
the specific, fact based outcomes against objectives
using the measurements outlined in the plan. The
quantitative suite of results, as well as indicating the
level of success against the project objectives, is
important when seeking to justify the expansion of
the initiative to greater scale, and in providing senior
management across business partners with a single
set of facts and figures for such consideration
The Business Case for Rolling Out OSA Improvement SolutionsThrough the process of implementation and
trialling of solutions, the project team will have had
the opportunity not just to evaluate the success
of the implementation, but also to identify the
costs involved. Just as an extrapolation of the
benefits flowing from improved OSA gives insight
to the opportunity facing partners by rolling out
improvement plans on a broader scale, so must an
extrapolation of the costs involved be undertaken to
allow a balanced business decision to be made.
Management should have sufficient opportunity to
review and challenge the reported costs and benefits
to their satisfaction. This again reinforces the need
for quality tracking of the costs and benefits through
the trial implementation period, facilitating a faster
decision whether to roll-out, and building trust
between partners that there will be no unforseen cost
surprises appearing during a subsequent program
roll-out.
Identify improved on-shelf availability as
a corporate goal
1. Plan
4. Develop Solutions
2. Map & Measure
3. Analyse / identify root causes
5. Implement
6. Evaluate
Stag
e 6 – Evaluate
8

30
Key Learning Arising for Project WorkA project is an excellent chance for business partners
involved to step back from day to day operations
and consider the current processes, systems and
practices in place. Project managers should look to
compile a project log capturing perspectives, ideas,
issues, potential issues, opportunities and needs
discovered whilst undertaking the project.
A project provides a rare opportunity for partners
to work closely and much of the value of this is
found in advancing understanding, which may in
turn uncover greater opportunities for collaboration
and improvement even if they were not the intended
focus of the project. Many of the lessons from
a project are transferable to other projects and
situations, and each project is in itself a significant
source for the building of understanding between
business partners.
Types of Learning Resulting from Project Work
Best & Better Practices Found During ProjectProjects also provide an excellent opportunity to view
different approaches taken to problem- solving or
opportunity maximising across stores, categories,
products, retailers, suppliers etc. As with the lessons
encountered during a project, another qualitative set
of findings is the logging of best and better practices.
Through avenues such as ensuring that best/better
practices is an agenda item for project meetings,
these can be logged and built into considerations
for any scaled roll-out of the OSA improvement
initiatives. As with key learnings, best and better
practices may well have wider application than the
specific project being undertaken, and may lead to
further initiatives in their own right.
Has a thorough, objective review of the initiative undertaken been completed by
appropriate persons?
Have both quantitative and qualitative results been considered?
Have key learnings and best / better practices been considered?
Can a decision now be made to roll the initiatives out to the broader business as appropriate?
Adapted from: Beck A, Chapman P & Peacock C, 2003
Areas of Focus Examples of Types of learning to capture
Results
• Current OSA KPIs / performance measurement being used
• Actions taken against results
• Pros and cons of current result measurements
Procedures
• Current procedures used to manage OSA.
• Guidelines and documents available to explain procedures
• Gaps in procedures / effectiveness
• Knowledge levels around procedures
Tools / Methods• Tools and other guidance provided to staff to manage
OSA
• Proactive OSA management methods seen
Process
• Ordering and Forecasting processes
• Promotional and other planning processes
• In-store shelf replenishment processes
• Primary points of process gap / breakdown
Structure
• Ways of assigning responsibility
• Hierarchy of tasks and time assignment
• Handover points and potential gaps
Skills
• Skill gaps impacting OSA
• Knowledge gaps impacting OSA
• Training and learning opportunities
Sta
ge
6 –
Eva
luat
e

31
Stag
e 6 – Evaluate
Places
Products
Roll out toall stores
Roll out to“problem”
stores
Roll out tostores ofcertainprofile
Use on allproducts
Use on“problem”products
Use onSKUs ofcertainprofile
Has a business case for roll-out
based on the costs versus benefits
been made available and accepted by Senior
Management? Has agreement been reached
for the expanded roll-out of OSA improvement
initiatives?
Does the Project Charter need to be revised
for any roll-out implementation? Has a Project
Stage Plan been developed for the roll-out that
adequately covers the work to be undertaken?
Prepare to Roll-out Successful InitiativesAssuming that the project has proved successful to
sponsors and key stakeholders, the decision to be
made by project partners in the first instance is about
the scope and scale of the roll-out. There are several
options open to participants, and the decisions taken
will need to consider the resources available and the
benefits to be derived. A (non-exhaustive) matrix of
decisions is shown here, noting that the options are
not mutually exclusive
Throughout the OSA Improvement project, there are
likely to have been several iterations of amendment to
the Project Charter as issues and opportunities have
been unearthed. A roll-out of solutions on a broader
scale may well be a major undertaking and require
a further, potentially significant, amendment to the
Project Charter.
A broad scale roll-out will likely require its own project
plan with associated objectives, resourcing and
timelines. A Project Stage Plan will be required for
this next body of work
Figure 11. Decision matrix for roll-out

32
Appendix 1: Prioritising OSA Efforts: Velocity and Volatility of SalesWhen considering which products to focus OSA
improvement efforts on, companies may wish to build
their priority lists based on Velocity of product sales
and also Volatility of sales.
Velocity:The major OSA/OOS report A Comprehensive
Guide to Retail Out-of-Stock Reduction in
the Fast-Moving Consumer Goods Industry
(Gruen & Corsten 2008) studied the velocity
characteristics of products in typical US grocery
stores, and the relationship between sales
velocity and availability of product on shelf.
The findings included:A typical large store ranging of more than 50,000
unique SKUs would sell about 27,000 unique SKUs in
a week. On a typical day, the store would sell around
12,000 unique SKUs. On its busiest shopping day
the store would sell around 16,000 unique SKUs. Of
these, 5000 SKUs account for over 70 per cent of
the store’s sales – i.e. c10 per cent of SKUs ranged
account for more than 70 per cent of sales.
• Relatively few SKUs account for the majority of
sales. (80/20 rule)
The study then performed analysis on c11,000
SKUs that met a predefined sales hurdle rate (out of
70,000 total SKUs scanning in a year). The analysis
investigated the rates of OOS for these items and
showed that whilst 3 per cent of these 11,000 SKUs
exceeded additional hurdle rates that classified them
as high velocity SKUs, this 3 per cent equated to 17
per cent of all lost sales due to unavailability on shelf.
• High velocity SKUs have a disproportionately
(6 to 1) rate of lost sales compared to low
velocity items
VolatilityThe additional complexities of forecasting and
managing inventory requirements for promotions,
and the volatility of rate of sales for these product
on promotion versus off promotion, provides further
opportunity for OOS – ECR Europe had previously
suggested that the OOS rate for promoted items
could reach as much as 75 per cent higher than for
non-promoted lines.
• Productswhosesalesratesarehighlyvolatile
are susceptible to higher rate of OOS
Companies wishing to determine products to
focus OSA improvement efforts on may wish to
consider characterising products based on rate of
sale (velocity) and consistency of sale (volatility)
and focussing initially on high velocity products,
particularly those who are also subject to promotional
volatility.
Figure 12. Characterising products based on velocity and volatility
Appendix
Volatility
Velocity
High
High
Low
Low
9A
pp
end
ix
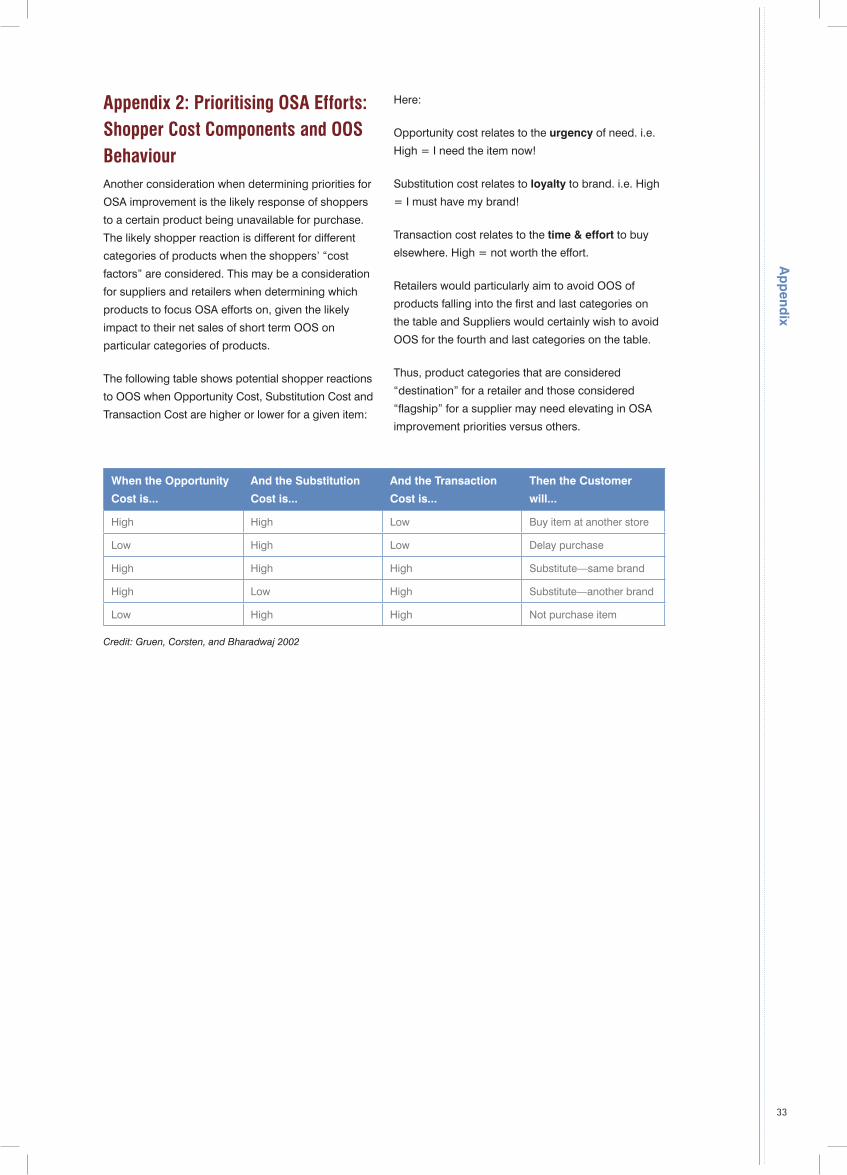
33
9AppendixA
pp
endix
Appendix 2: Prioritising OSA Efforts: Shopper Cost Components and OOS BehaviourAnother consideration when determining priorities for
OSA improvement is the likely response of shoppers
to a certain product being unavailable for purchase.
The likely shopper reaction is different for different
categories of products when the shoppers’ “cost
factors” are considered. This may be a consideration
for suppliers and retailers when determining which
products to focus OSA efforts on, given the likely
impact to their net sales of short term OOS on
particular categories of products.
The following table shows potential shopper reactions
to OOS when Opportunity Cost, Substitution Cost and
Transaction Cost are higher or lower for a given item:
Here:
Opportunity cost relates to the urgency of need. i.e.
High = I need the item now!
Substitution cost relates to loyalty to brand. i.e. High
= I must have my brand!
Transaction cost relates to the time & effort to buy
elsewhere. High = not worth the effort.
Retailers would particularly aim to avoid OOS of
products falling into the first and last categories on
the table and Suppliers would certainly wish to avoid
OOS for the fourth and last categories on the table.
Thus, product categories that are considered
“destination” for a retailer and those considered
“flagship” for a supplier may need elevating in OSA
improvement priorities versus others.
Credit: Gruen, Corsten, and Bharadwaj 2002
When the Opportunity
Cost is...
And the Substitution
Cost is...
And the Transaction
Cost is...
Then the Customer
will...
High High Low Buy item at another store
Low High Low Delay purchase
High High High Substitute—same brand
High Low High Substitute—another brand
Low High High Not purchase item

34
Appendix 3 – Basic Root Cause Analysis Tools1. Flowchart – simple tool / process that can
be applied in store when encountering OOS
on shelf. Example below from ECRA Australia
publication “A guide to Efficient Replenishment
and Reducing Stock Outs within the Grocery
Industry” (ECR Australasia 2001)
Ap
pen
dix
SHELF OOS DETECTED
Product not available on shelf or cappingGO TO BACKROOM
Go to stocklocation
Inventoryavailable in
store system
Ordergenerated for
this SKU?
SKU shouldhave already
arrived
SKU loadedat DC?
Inventoryavailableat DC?
Ordergenerated
at DC
SKU avail.for orderingto supplier
SKU shouldhave already
arrived
Physicalstock availableat backroom
location?
SKU availablefor ordering to
DC?
SKUdiscontinued?
Product ingood shape?
Backroomto shelf
replenish
Damages
Inventoryaccuracy
Discontinueditem
Master datanot OK
Deliveryaccuracy Store
ordering
Operationserror at DC
Supplierreliability
DCOrdering
(may hide insufficientshelf space)
Yes No No No No
Yes
Yes
Yes
Yes
Yes
Yes No
Yes Yes
Yes
YesYes NoNo
NoNo
No
No No
(may hide forecast/safety stock calculation errors)
1
2
45
6
98
7
10
3
(may hide forecast/safety stock calculation errors)
(should not count as shelf OOS)
Key: Store operations issue Store ordering issue DC issue Supplier issue Head office issue

35
Ap
pend
ix
2. Fishbone Analysis – for brainstorming
around “Cause and Effect”. Participants start
with OOS and keep repeating the question
“why?” to build the “Fishbone” chart. This can
highlight many potential causes that lead to
the effect of OOS. (example shown can be
expanded by asking “Why?” at each point.)
No Stock on Shelf
Data Integrity Forecasting Ordering
StoreReplenishment
Shelf Replenishment
Management
Sales Underestimated
Late promo change
New line– nohistory
Item dataincorrect insystem
POG non-complianceNot moved
from storeroom
Inventory levelincorrect insystem
No order placed
Lateorder
Wrongproduct
DCOOS
Picking error
Late DSDdelivery
No labouravailable
“Lost” instoreroom

36
Appendix 4: On-Shelf Availability Improvement Project Protocol Template
The following template is a tool that OSA
Improvement project partners may wish to use. It
is designed primarily to ensure that those following
the OSA Improvement Road Map stay on track
(note that it closely follows the Checkpoints in the
OSA Improvement Road Map) and facilitates joint
agreement as to the work to be undertaken and the
decisions made.
1. Project planning
Project Parameters:
Category
Retailer
Supplier
Date
Management Approval for Project / Project Charter Sign-off:
Retailer
Supplier
Date
Project Scope:
Products in scope
Stores in scope
Specific Situations for focus
Key Stakeholders:
Function / role Anticipated Impact Communication Plan
Stakeholder Analysis completed?
Project Team:
Project Function / role Retailer Personnel Supplier Personnel
Sponsor
Steering Group
Project Managers
Team Members
Support
Other
Project Goals:
Quantitative targets
Qualitative outputs / benefits
Key Milestones:
What By When Responsible
Ap
pen
dix
37
Ap
pend
ix
2. Process mapping and availability measurement
Process Mapping (as is situation):
Process to be mapped By When Status
OSA / OOS Measurement:
OOS Attributes to be Measured Method OOS Rates and Calculation base
3. Analysis and root cause identification
Store based OOS:
Root Cause Area OOS Root Causes Identified
Shelf Based OOS:
Root Cause Area OOS Root Causes Identified
Supply Chain Based OOS:
Root Cause Area OOS Root Causes Identified
4. Solution development
Issue & Root Cause Agreed Trial Solution Trial Parameters

38
5. Implementation (may be trial basis)
What Who When
Management Approval for implementation:
Retailer
Supplier
Date
6. Evaluation
Impact of implementation:
Quantitative
Qualitative
Key Learning Log:
Area Learning Action
Best Practices Log:
Area Best Practice Viewed Action
Roll-out plans:
Action Scope Timing
Management Approval for roll-out:
Retailer
Supplier
Date
Ap
pen
dix

39
Ap
pend
ix
Appendix 5: A Common Language for Product Availability Measurement and for the Assignment of Causes of Out of Stocks through the Value Chain in Australasian GroceryWhen considering the current product availability
measurements and assignment of causes of out of
stocks (OOS) used by participants in the industry,
it is inevitable that there are different terminologies
used by each retailer and supplier. There has been
no attempt at standardisation of such terminology,
which in any case is not feasible given many local
businesses are subsidiaries of international parent
companies who use internal standards.
This can inhibit OSA Improvement efforts between
partners through misunderstanding, misinterpretation,
failure to identify all measurement and assignment
information available, and the confusion that follows.
In reality there are great opportunities available to
partners in OSA improvement projects to make use
of such information, a key opportunity is to clarify
these points in a way both partners can relate to via a
“common language”.
The ECRA OSA Improvement project team
investigated the various availability measurements
and OOS cause assignments used through the
stages of the value chain in Australasian grocery and
found that, whilst terminology varied considerably
across companies, the actual product availability
measurements and OOS cause assignments being
utilised were highly consistent.
The following table has been validated by the
grocery industry members on the project team as
encompassing the availability measures and OOS
cause assignments being used.
The document breaks the Value Chain into the
following Stages, which reflect key points at which
measurement of availability takes place and causes
of OOS can be assigned.
The purpose of the Common Language document
is not to replace the terminologies used internally
by companies. Rather, its provides a common basis
for understanding what availability measurement
and OOS cause assignment takes place through the
values chain stages and descriptions of these. This
can then be used in consideration of approaches to
OSA Improvement projects and discussions between
parties without having to make assumptions about
what may or may not be currently used.
When used in this way, the Common Language
is just that – a way of ensuring that partners are
“speaking the same language” when discussing
current availability measurements and OOS cause
assignments through the values chain and how these
might be utilised by the partners to drive better, and
common, understanding of the issues during the
project, irrespective of the way they may describe
these attributed back in their own businesses.
At the Supplier
Into Retailer DC
At Retailer DC
Into Retail Store
At Retail Store
On Shelf / Display

40
A Common Language for Product Availability Measurement and Causes of OOS through the Value Chain in Australasian Grocery
Value Chain
Stage
Measures of
Product Availability
Description Root Causes of Out of Stocks
At Supplier
• Days Stock on Hand at Supplier – SKU
• Daily calculation of current quantity stock on hand by SKU against forward forecast of sales
• Supplier Forecast Error – incorrect estimate of volume / timing of product requirements
• Production Error – manufacturing issues caused non/late production against plan
• Supply Error – Product delivered late / damaged / incorrect to DC vs planned
• Supplier Out of Stocks - SKU
• Daily/perpetual list of SKUs with stock on hand value of zero in supplier inventory system
• Outbound Service Level to Retailer – SKU / Order
• SKU level calculation of % cases dispatched versus cases ordered on each order
Into Retailer DC
• Inbound Service Level from Supplier – SKU / Order
• Order level calculation of % cases received in full and on time versus cases ordered for each order
• Supplier Out of Stock – Order was correct but supplier did not have sufficient stock available to fulfil the order
• Supplier Picking / Delivery Error – Supplier delivered incorrect quantity / product or was late to deliver
• Unsupplied Cartons from Supplier
• Daily list of volume of goods not supplied against anticipated deliveries from suppliers – captured by SKU by DC by supplier
At Retailer DC
• Days Stock on Hand at Retailer DC – SKU
• Daily calculation at SKU level – quantity / $ stock on hand divided by historical average daily sales
• Retailer Forecast Error - incorrect estimate of volume / timing of product requirements
• Retailer Order Error – Wrong Item / Quantity ordered by retailer, or ordered too early/late
• Retailer Promotions Management – changes to promotion scale / timing, leading to under ordering by retailer
• Product Data Error (DC System) – Product item data is incorrectly loaded / aligned in system, impacting capability to order correctly
• Inventory Data Error (DC System) – Quantity Available in system is incorrect. Stock is incorrectly assumed to exist
• Unsaleable Product at DC – stock on hand cannot be dispatched to store due to dated product / QA issues / product recall etc
• Retailer DC Out of Stocks – SKU / Supplier
• Daily snapshot generated list of SKUs with stock on hand value of zero in retailer inventory system
• Outbound Service Level to Store – SKU / Order
• SKU level calculation of cases dispatched versus cases ordered
• Unsupplied Cartons to Store
• Daily list of volume of goods by SKU not supplied against store orders and value of these lost sales
• Critical Stock Level Report
• Daily list of items anticipated to go OOS as demand expected to exceed stock availability
Ap
pen
dix

41
Ap
pend
ix
Value Chain
Stage
Measures of
Product Availability
Description Root Causes of Out of Stocks
Into Retail Store
• Inbound Service Level from Retailer DC – SKU / Order
• Order level calculation of percentage cases received from DC versus cases ordered
• Retailer DC Out of Stock - Order was correct but Retailer DC did not have sufficient stock available to fulfil the order
• Retailer Picking / Delivery Error - Incorrect quantity / product from retailer DC, late in delivery, damaged or otherwise unsaleable
• DSD Supplier Failure - Order was correct but supplier did not have sufficient stock available / delivered incorrect product / delivered late / order rejected at delivery
• Inbound Service Level from DSD Supplier - SKU / Order
• Order level calculation of percentage cases received from DSD Supplier versus cases ordered
At Retail Store
• Days Stock on Hand in Store – SKU
• Store system generated daily snapshot calculation of stock on hand by SKU against historical rate of sales
• Store Order Error – Store ordered incorrect stock / wrong quantity / too late vs planned
• Store Forecast Error - incorrect estimate of volume / timing of product requirements
• Store Promotions Management – Incorrect understanding of scale, & / or late changes to scale / timing, leading to under ordering
• Inventory Data Error (Store System) - Quantity Available in system is incorrect. Stock is incorrectly assumed to exist
• Product Data Error (Store System) - Product item data is incorrectly loaded / aligned in system, impacting capability to order correctly
• POS Data Error – product is miss-scanning leading to inventory inaccuracies
• Product Association – an OOS on one SKU drives an unforseen spike in demand for a complementary SKU, driving it OOS
• Store Out of Stocks – SKU / Supplier
• Daily/perpetual list of SKUs with stock on hand value of zero in store inventory system
• Store Availability Rate
• Daily / perpetual calculation of % of items available in store. Number of SKUs showing stock on hand of > zero in store divided by number of SKUs ranged by store.
On Shelf / Display
• Physical Out of Stock on Shelf – SKU / Supplier
• Periodic (eg weekly) visual shelf census based calculation of % SKUs with no stock on shelf against base denominator (eg: SKUs in category, by supplier etc)
• Shelf Replenishment Failure – product available in store, but not moved to shelf/display in time to prevent OOS
• Planogram Compliance and Maintenance - Poor merchandising on shelf eg. products not aligned to correct tickets, missing tickets, incorrect space/position vs planogram
• Unsaleable product in Store – Product removed from shelf due to damage, theft, recall etc

42
Appendix 6: Bibliography & Recommended ReadingThis Road Map for OSA Improvement would not
have been possible without the help of previous work
done by ECRA and by other ECR aligned initiatives
throughout the world.
For both content and design we have in particular
referenced:
• Beck A, Chapman P & Peacock C, 2003, “The
Shrinkage Reduction Road Map” excerpt from
Shrinkage – a collaborative approach to reducing
stock loss in the supply chain – now tried & tested!
– an ECR Europe publication.
• ECR Australasia / Accenture, 2008, The On-Shelf
Availability Challenge 2007-2008.
• ECR Australasia / Price Waterhouse Coopers,
2001, A Guide to Efficient Replenishment and
Reducing “Stock Outs” within the Grocery Industry.
• ECR Europe & Roland Berger Strategy
Consultants, 2003, ECR – Optimal Shelf
Availability. Increasing Shopper Satisfaction at the
Moment of Truth.
• Gruen T W & Corsten D, 2008, A Comprehensive
Guide To Retail Out-of-Stock Reduction In the Fast-
Moving Consumer Goods Industry.
• Gruen T, Corsten D & Bharadwaj S, 2002, Retail
Out-of-Stocks: A Worldwide Examination of Extent,
Causes and Consumer Responses.
• IGD / ECR UK, 2004, Availability – A UK
Perspective.
Ap
pen
dix

43

© 2009 ECR Australia
![Machine Operational Availability Improvement by ... · Continuous Improvement: Jevgeni et al. [15], introduced a new framework that allows continuous improvement for the reliability](https://static.fdocuments.us/doc/165x107/5e4fce0e555f1c2b2d2bb673/machine-operational-availability-improvement-by-continuous-improvement-jevgeni.jpg)