IMPROVING ON-SHELF AVAILABILITY IN GROCERY ... following case study demonstrates how this process,...
20
MARKET6 KNOWLEDGE PATH SERIES IMPROVING ON-SHELF AVAILABILITY IN GROCERY: NEW FORMS OF RETAILER-SUPPLIER COLLABORATION
Transcript of IMPROVING ON-SHELF AVAILABILITY IN GROCERY ... following case study demonstrates how this process,...

MARKET6 KNOWLEDGE PATH SERIES
IMPROVING ON-SHELF AVAILABILITY IN GROCERY: NEW FORMS OF RETAILER-SUPPLIER COLLABORATION
INTRODUCTIONThe urgency retailers face to increases sales, reduce costs and retain shoppers has never been greater than it is today. More effective promotions, better displays and new item introductions represent some of the merchandising tools at their disposal. On the surface, these may sound easy enough to achieve, but that couldn’t be further from the truth.
Supply chain complexity, the lack of shared data visibility and fragmented business processes are impacting business in every aisle. The result is often product out-of-stocks, reduced on-shelf availability and disenchanted shoppers.
These stubborn problems are not new. Their impact on suppliers and retailers has been felt for years. The difference today is that we have reached new competitive heights, a critical inflexion point in the evolution of grocery—the rise of omnichannel, new store formats and relentless competition have created a struggle for profits and shopper loyalty.
Recent research from the Trading Partner Alliance consisting of FMI and GMA reveals that the out of stock rate remains at 8% on average and exceeds 10% for promoted items. The alliance wisely indicates that the problem is bigger than lost revenue:
“Today’s consumer-driven marketplace makes improving the user experience a high priority. Shoppers say product availability is a top-three reason for where they shop, yet on average, every time a shopper comes into a store, one out of every 12 items on her shopping list, and one of every 10 or less for promoted items, is not on the shelf.” 1
1 “Solving the Out of Stock Problem,” An FMI/GMA Trading Partner Alliance Report
IMPROVING ON-SHELF AVAILABILITY IN GROCERY | MARKET6.COM | ©2016 MARKET6, INC. ALL RIGHTS RESERVED. 3
COLLABORATION IN ACTIONSo why has on-shelf availability (OSA) been so difficult to achieve? The answer lies dormant across a number of factors, most of which can be traced to a single phrase: “Data rich, insights poor.” Solving the OSA problem requires instant access to intelligence born from a blend of unified data, analytic insights and collaborative decision making. It requires suppliers and retailers to reinvent themselves using coordinated resources and seamless processes.
Some of the leading retailers and suppliers have solved this riddle and reap the rewards every day. They continue to grow in highly competitive markets where margins are at a premium. Consider the following fact-based account
A multinational consumer packaged goods company servicing thousands of grocery stores wanted to work collaboratively with its retailer to increase on-shelf availability and reduce out of stocks in support of higher profits and customer satisfaction.
This CPG was operating under constraints includ-ing limited visibility into retailer data. They could see only orders from the retailer and corresponding shipments to their own DC. Sales and forecasted demand were absent, as was a complete view of inventory. Both organizations were faced with out of stocks and lower-than-expected on-shelf availability. In some locations, post-promotion supply exceeded demand, resulting in excessive inventory and unexpected shipping costs.
From an operational perspective, pressing decisions needed to be made, including when and where to relocate products out of distribution centers to meet spikes in demand. Demand variability at the store, day and SKU level needed to be addressed.
Using a collaborative approach, the supplier and the retailer analyzed demand forecasts and inventory at a granular level. Analysis using data and metrics that provided
a broader view of supply and demand revealed exactly where out of stocks were most likely to occur, allowing for product repositioning and order prioritization. The partners also discovered where they needed to taper down orders to allow for a clean exit on promotions.
This example is one of many driving a new approach to retailer-supplier collaboration. It combines shared analysis of integrated data, allowing suppliers and retailers to coordinate operations. If joint planning and decision making were obstacles in the past, immediate access to shared intelligence in an “always on” environment helped overcome those challenges. Time savings could be the single most positive outcome. Today, supplier-retailer partnerships are taking on new meaning. These two players are working more closely than ever before to uncover new insights, improve operations and drive results.
The net results were a dramatic reduction in out of stocks, sales growth three times higher than the category average and 50% reduc-tions in post-promotional inventory levels.
IMPROVING ON-SHELF AVAILABILITY IN GROCERY | MARKET6.COM | ©2016 MARKET6, INC. ALL RIGHTS RESERVED. 4
While the experts, supported by empirical data, agree that OSA continues to be a challenge, what’s less apparent is how to fix it. What steps should organizations take to identify risks and effect change?
At a basic level, we need to ask, “Are merchandising experts and their supply-side counterparts properly equipped to win in their markets without a defined solution and technology framework that support issue resolution? And this leads to another question: “If they are, can successful processes be replicated at scale across hundreds or even thousands of stores, and thousands of products, when daily supply and demand variability fluctuate so dramatically?”
Other industries have met the challenge through rapid data discovery and predictive analytics designed to precisely pinpoint causal relationships. This approach reveals insights hidden within massive amounts of fast-changing data, by using a powerful combination of guided analytics, predictive analytics, business intelligence and reporting. The vast majority of successes have typically employed both prebuilt analytic solutions AND a defined process of discovery. Without the former, the latter is not possible. Without the latter, the analyst continues to search for answers.
Can the grocery industry apply these standards to uncover operational problems that impact on-shelf availability? Here’s a simplified version of a common approach that may help.
Analysts start by forming a hypothesis they want to prove while assessing whether or not the available data allows them to prove or disprove the hypothesis.
For example, an analyst may have heard that specific products are out of stock for a set of stores in one district. She forms a hypothesis that most of the problem is inventory related, is widespread across districts, regions and stores, and has not varied much over the past quarter. Using advanced analytics and discovery tools, the analyst then attempts to prove or disprove the hypothesis. As insights are gathered, conclusions and next steps are formed.
In the second step, data profiling allows the analyst to become familiar with trends, patterns and anomalies leading her down one or more paths of investigation. One insight leads to another as she explores a data trail that includes demand,
supply, shipments, authorizations and more. Deeper exploration results in identifying causal relationships. Results are validated and then shared with change agents, and an action plan is put in place.
The most successful organizations share results along the way. They gain feedback from partners and internal team members, which leads to more rapid discovery and issue resolution.
Clearly, this process requires that analysts have access to integrated data and analytic solutions that facilitate navigating large amounts of detailed data. Depending on the type of analysis being done, a blend of descriptive and/or predictive analytics is usually at play. Metric-based dashboards and reporting are deployed for rapid problem identification, leading to deeper insights.
The most successful organizations share
results along the way.
BUILDING BLOCKS FOR SUCCESS
IMPROVING ON-SHELF AVAILABILITY IN GROCERY | MARKET6.COM | ©2016 MARKET6, INC. ALL RIGHTS RESERVED. 5
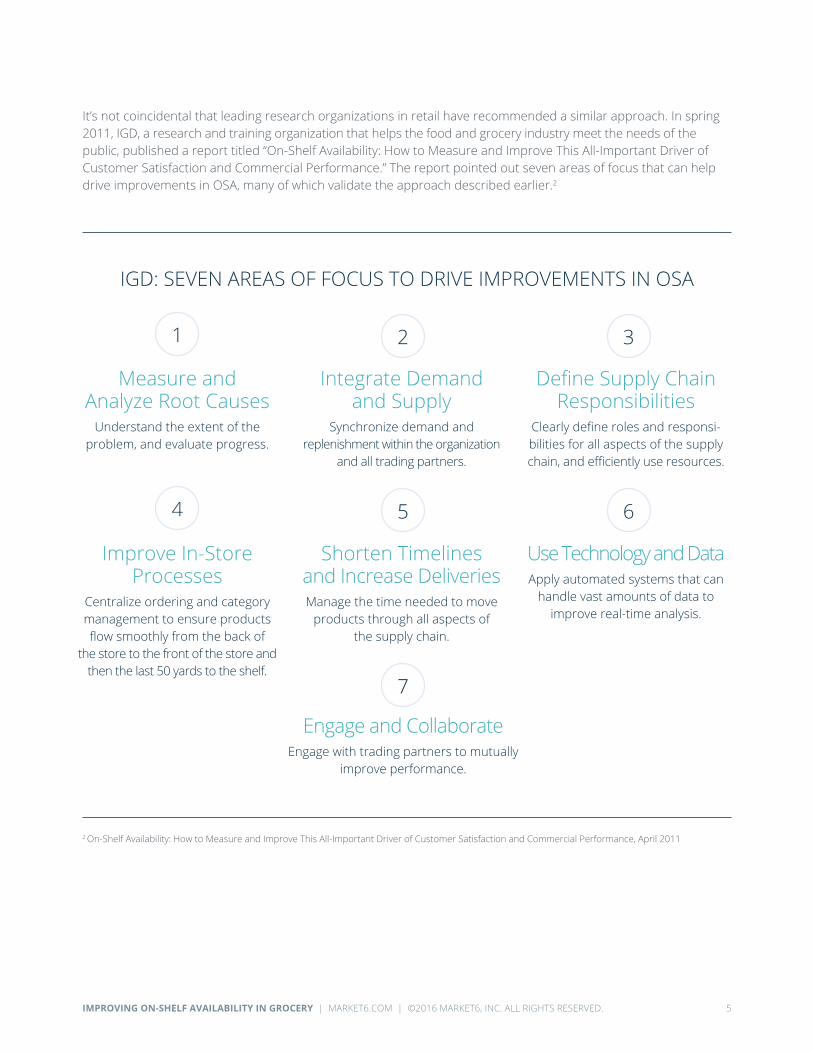
It’s not coincidental that leading research organizations in retail have recommended a similar approach. In spring 2011, IGD, a research and training organization that helps the food and grocery industry meet the needs of the public, published a report titled “On-Shelf Availability: How to Measure and Improve This All-Important Driver of Customer Satisfaction and Commercial Performance.” The report pointed out seven areas of focus that can help drive improvements in OSA, many of which validate the approach described earlier.2
Measure and Analyze Root Causes
Understand the extent of the problem, and evaluate progress.
Improve In-Store Processes
Centralize ordering and category management to ensure products flow smoothly from the back of
the store to the front of the store and then the last 50 yards to the shelf.
Integrate Demand and Supply
Synchronize demand and replenishment within the organization
and all trading partners.
Shorten Timelines and Increase DeliveriesManage the time needed to move
products through all aspects of the supply chain.
Define Supply Chain Responsibilities
Clearly define roles and responsi-bilities for all aspects of the supply chain, and efficiently use resources.
Use Technology and DataApply automated systems that can
handle vast amounts of data to improve real-time analysis.
1 2 3
4 5 6
7
2 On-Shelf Availability: How to Measure and Improve This All-Important Driver of Customer Satisfaction and Commercial Performance, April 2011
Engage and CollaborateEngage with trading partners to mutually
improve performance.
IGD: SEVEN AREAS OF FOCUS TO DRIVE IMPROVEMENTS IN OSA
IMPROVING ON-SHELF AVAILABILITY IN GROCERY | MARKET6.COM | ©2016 MARKET6, INC. ALL RIGHTS RESERVED. 6
Now, let’s apply this thinking to real operational issues that face suppliers and retailers every day. The following case study demonstrates how this process, combined with enabling technology, is used to solve on-shelf availability problems.
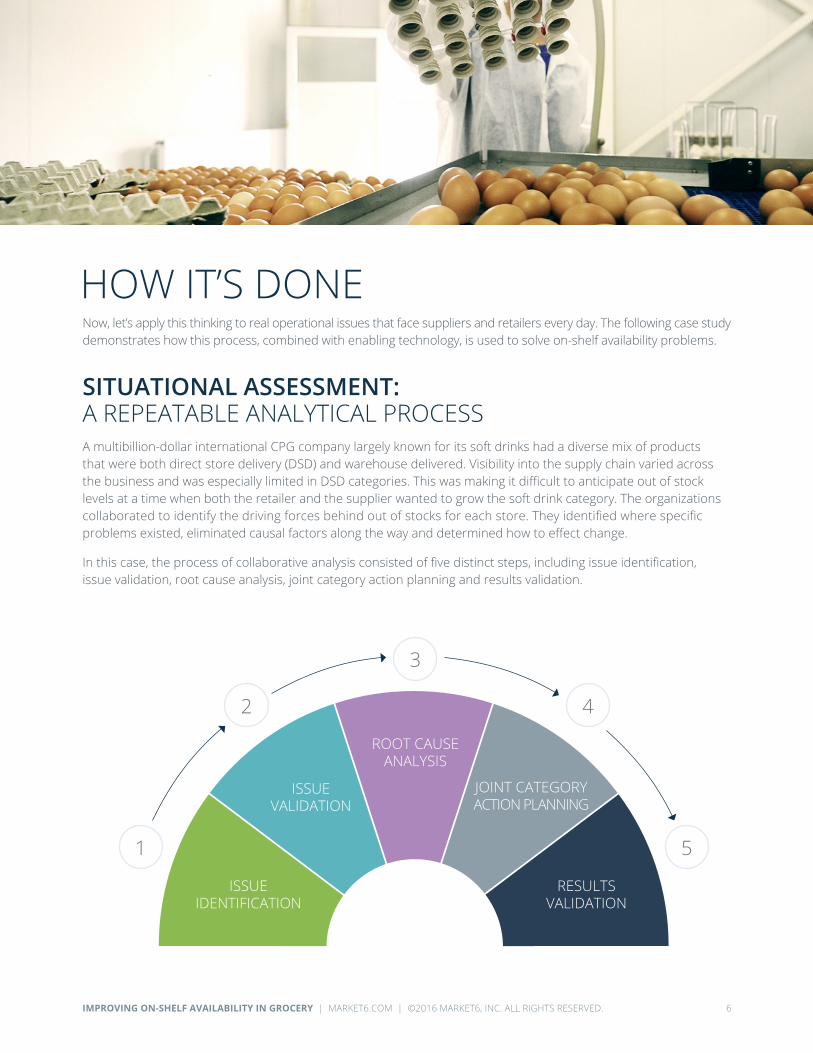
SITUATIONAL ASSESSMENT: A REPEATABLE ANALYTICAL PROCESSA multibillion-dollar international CPG company largely known for its soft drinks had a diverse mix of products that were both direct store delivery (DSD) and warehouse delivered. Visibility into the supply chain varied across the business and was especially limited in DSD categories. This was making it difficult to anticipate out of stock levels at a time when both the retailer and the supplier wanted to grow the soft drink category. The organizations collaborated to identify the driving forces behind out of stocks for each store. They identified where specific problems existed, eliminated causal factors along the way and determined how to effect change.
In this case, the process of collaborative analysis consisted of five distinct steps, including issue identification, issue validation, root cause analysis, joint category action planning and results validation.
1
2
3
4
5
ISSUEIDENTIFICATION
ISSUEVALIDATION
ROOT CAUSE ANALYSIS
JOINT CATEGORYACTION PLANNING
RESULTS VALIDATION
HOW IT’S DONE
IMPROVING ON-SHELF AVAILABILITY IN GROCERY | MARKET6.COM | ©2016 MARKET6, INC. ALL RIGHTS RESERVED. 7
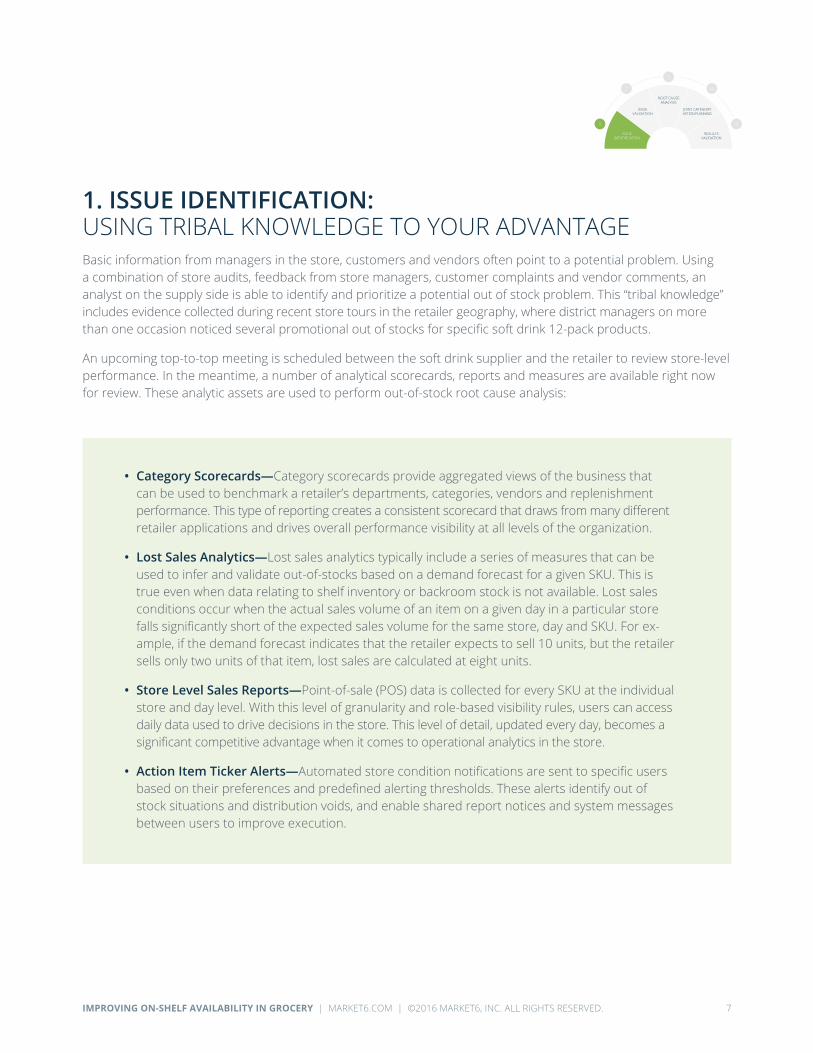
1. ISSUE IDENTIFICATION: USING TRIBAL KNOWLEDGE TO YOUR ADVANTAGEBasic information from managers in the store, customers and vendors often point to a potential problem. Using a combination of store audits, feedback from store managers, customer complaints and vendor comments, an analyst on the supply side is able to identify and prioritize a potential out of stock problem. This “tribal knowledge” includes evidence collected during recent store tours in the retailer geography, where district managers on more than one occasion noticed several promotional out of stocks for specific soft drink 12-pack products.
An upcoming top-to-top meeting is scheduled between the soft drink supplier and the retailer to review store-level performance. In the meantime, a number of analytical scorecards, reports and measures are available right now for review. These analytic assets are used to perform out-of-stock root cause analysis:
• Category Scorecards—Category scorecards provide aggregated views of the business that can be used to benchmark a retailer’s departments, categories, vendors and replenishment performance. This type of reporting creates a consistent scorecard that draws from many different retailer applications and drives overall performance visibility at all levels of the organization.
• Lost Sales Analytics—Lost sales analytics typically include a series of measures that can be used to infer and validate out-of-stocks based on a demand forecast for a given SKU. This is true even when data relating to shelf inventory or backroom stock is not available. Lost sales conditions occur when the actual sales volume of an item on a given day in a particular store falls significantly short of the expected sales volume for the same store, day and SKU. For ex-ample, if the demand forecast indicates that the retailer expects to sell 10 units, but the retailer sells only two units of that item, lost sales are calculated at eight units.
• Store Level Sales Reports—Point-of-sale (POS) data is collected for every SKU at the individual store and day level. With this level of granularity and role-based visibility rules, users can access daily data used to drive decisions in the store. This level of detail, updated every day, becomes a significant competitive advantage when it comes to operational analytics in the store.
• Action Item Ticker Alerts—Automated store condition notifications are sent to specific users based on their preferences and predefined alerting thresholds. These alerts identify out of stock situations and distribution voids, and enable shared report notices and system messages between users to improve execution.
1
2
3
4
5
ISSUEIDENTIFICATION
ISSUEVALIDATION
ROOT CAUSE ANALYSIS
JOINT CATEGORYACTION PLANNING
RESULTS VALIDATION
IMPROVING ON-SHELF AVAILABILITY IN GROCERY | MARKET6.COM | ©2016 MARKET6, INC. ALL RIGHTS RESERVED. 8
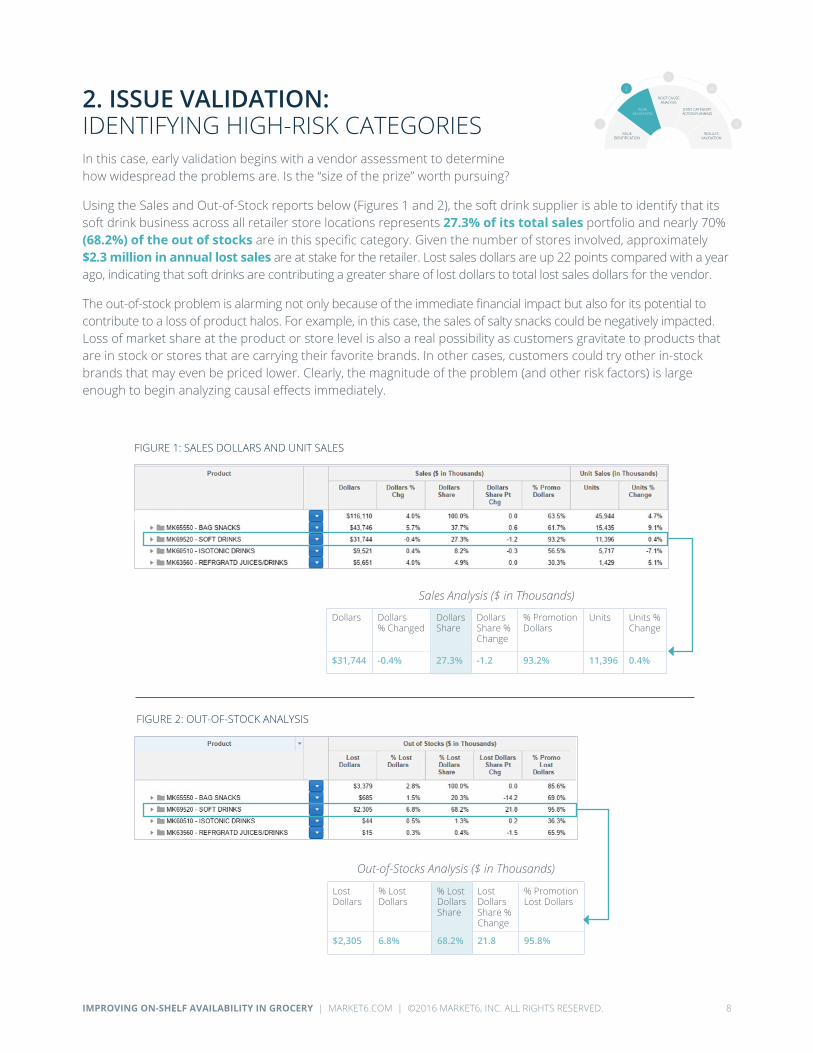
2. ISSUE VALIDATION: IDENTIFYING HIGH-RISK CATEGORIESIn this case, early validation begins with a vendor assessment to determine how widespread the problems are. Is the “size of the prize” worth pursuing?
Using the Sales and Out-of-Stock reports below (Figures 1 and 2), the soft drink supplier is able to identify that its soft drink business across all retailer store locations represents 27.3% of its total sales portfolio and nearly 70% (68.2%) of the out of stocks are in this specific category. Given the number of stores involved, approximately $2.3 million in annual lost sales are at stake for the retailer. Lost sales dollars are up 22 points compared with a year ago, indicating that soft drinks are contributing a greater share of lost dollars to total lost sales dollars for the vendor.
The out-of-stock problem is alarming not only because of the immediate financial impact but also for its potential to contribute to a loss of product halos. For example, in this case, the sales of salty snacks could be negatively impacted. Loss of market share at the product or store level is also a real possibility as customers gravitate to products that are in stock or stores that are carrying their favorite brands. In other cases, customers could try other in-stock brands that may even be priced lower. Clearly, the magnitude of the problem (and other risk factors) is large enough to begin analyzing causal effects immediately.
1
2
3
4
5
ISSUEIDENTIFICATION
ISSUEVALIDATION
ROOT CAUSE ANALYSIS
JOINT CATEGORYACTION PLANNING
RESULTS VALIDATION
FIGURE 1: SALES DOLLARS AND UNIT SALES
FIGURE 2: OUT-OF-STOCK ANALYSIS
Sales Analysis ($ in Thousands)
Dollars Dollars % Changed
Dollars Share
Dollars Share % Change
% Promotion Dollars
Units Units % Change
$31,744 -0.4% 27.3% -1.2 93.2% 11,396 0.4%
Out-of-Stocks Analysis ($ in Thousands)
Lost Dollars
% Lost Dollars
% Lost Dollars Share
Lost Dollars Share % Change
% Promotion Lost Dollars
$2,305 6.8% 68.2% 21.8 95.8%
IMPROVING ON-SHELF AVAILABILITY IN GROCERY | MARKET6.COM | ©2016 MARKET6, INC. ALL RIGHTS RESERVED. 9
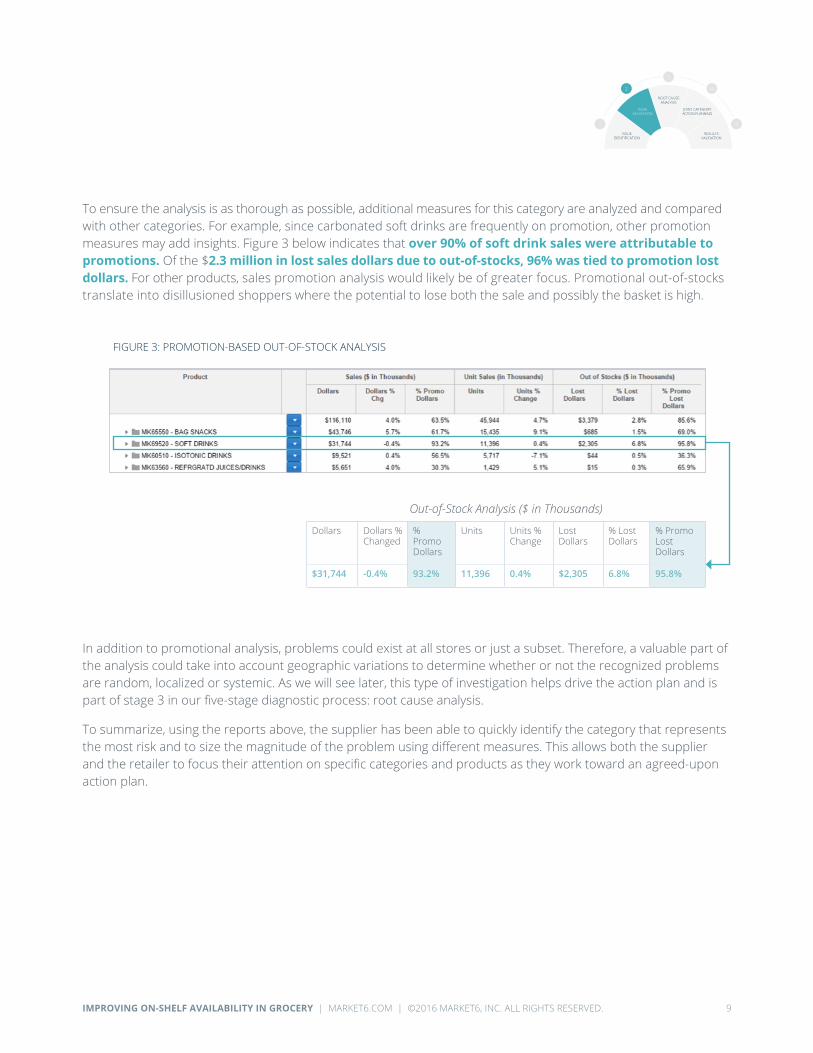
To ensure the analysis is as thorough as possible, additional measures for this category are analyzed and compared with other categories. For example, since carbonated soft drinks are frequently on promotion, other promotion measures may add insights. Figure 3 below indicates that over 90% of soft drink sales were attributable to promotions. Of the $2.3 million in lost sales dollars due to out-of-stocks, 96% was tied to promotion lost dollars. For other products, sales promotion analysis would likely be of greater focus. Promotional out-of-stocks translate into disillusioned shoppers where the potential to lose both the sale and possibly the basket is high.
FIGURE 3: PROMOTION-BASED OUT-OF-STOCK ANALYSIS
Out-of-Stock Analysis ($ in Thousands)
Dollars Dollars % Changed
% Promo Dollars
Units Units % Change
Lost Dollars
% Lost Dollars
% Promo Lost Dollars
$31,744 -0.4% 93.2% 11,396 0.4% $2,305 6.8% 95.8%
In addition to promotional analysis, problems could exist at all stores or just a subset. Therefore, a valuable part of the analysis could take into account geographic variations to determine whether or not the recognized problems are random, localized or systemic. As we will see later, this type of investigation helps drive the action plan and is part of stage 3 in our five-stage diagnostic process: root cause analysis.
To summarize, using the reports above, the supplier has been able to quickly identify the category that represents the most risk and to size the magnitude of the problem using different measures. This allows both the supplier and the retailer to focus their attention on specific categories and products as they work toward an agreed-upon action plan.
1
2
3
4
5
ISSUEIDENTIFICATION
ISSUEVALIDATION
ROOT CAUSE ANALYSIS
JOINT CATEGORYACTION PLANNING
RESULTS VALIDATION
IMPROVING ON-SHELF AVAILABILITY IN GROCERY | MARKET6.COM | ©2016 MARKET6, INC. ALL RIGHTS RESERVED. 10
3. ROOT CAUSE ANALYSIS: GAINING SUPPLIER-RETAILER AGREEMENTFixing any problem requires a thorough understanding of what’s causing it. In this case, out-of-stocks could be caused by any number of issues, including disruptions in the supply chain, store authorizations, poor in-store execution or some combination of factors. The primary goal of root cause analysis is to resolve why and where the problems are occurring. Some of the questions the retailer-supplier teams want to answer include:
• What specific subcategories, segments or SKUs are affected?
• Is this confined to a specific time frame?
• Are promotions running during this time, or are lost dollars related to everyday turn volumes?
• Is the issue random, localized or systemic?
• Which stores are affected?
• Are specific routes contributing to the problem?
Answering these questions helps prove or disprove the hypothesis. One way of approaching root cause analysis is through a process of elimination. Eliminating nonrelevant factors quickly helps you isolate the root cause.
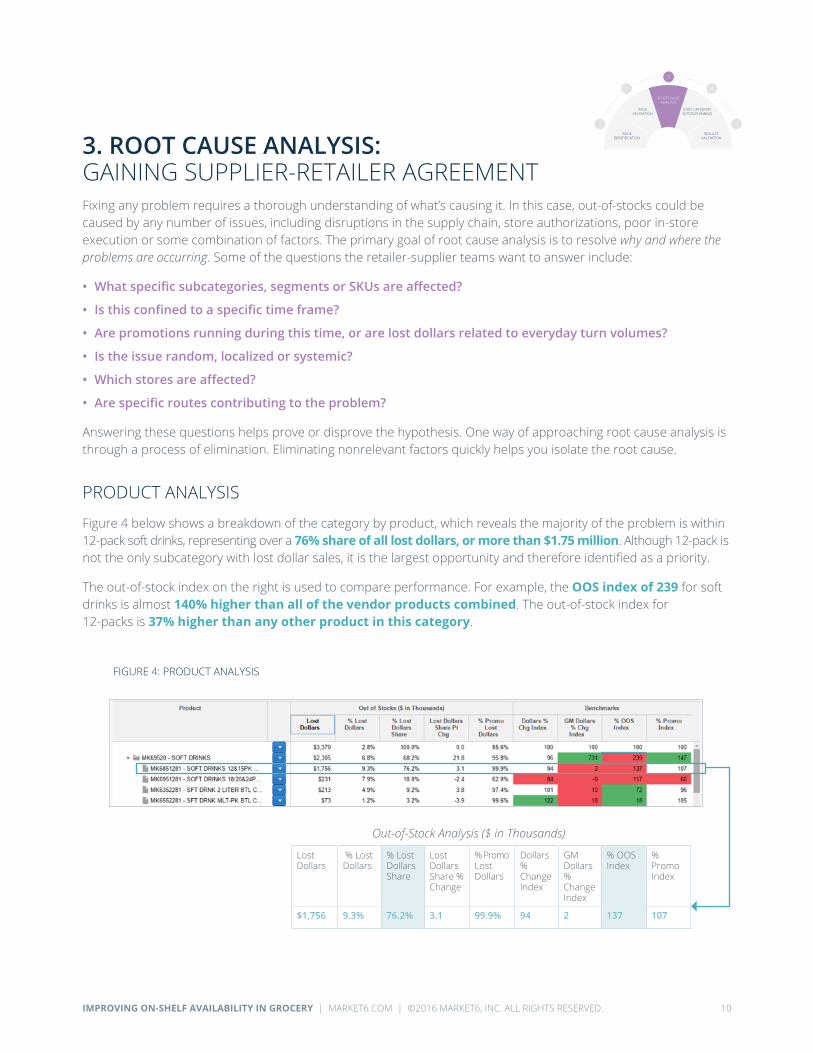
PRODUCT ANALYSIS
Figure 4 below shows a breakdown of the category by product, which reveals the majority of the problem is within 12-pack soft drinks, representing over a 76% share of all lost dollars, or more than $1.75 million. Although 12-pack is not the only subcategory with lost dollar sales, it is the largest opportunity and therefore identified as a priority.
The out-of-stock index on the right is used to compare performance. For example, the OOS index of 239 for soft drinks is almost 140% higher than all of the vendor products combined. The out-of-stock index for 12-packs is 37% higher than any other product in this category.
1
2
3
4
5
ISSUEIDENTIFICATION
ISSUEVALIDATION
ROOT CAUSE ANALYSIS
JOINT CATEGORYACTION PLANNING
RESULTS VALIDATION
FIGURE 4: PRODUCT ANALYSIS
Out-of-Stock Analysis ($ in Thousands)
Lost Dollars
% Lost Dollars
% Lost Dollars Share
Lost Dollars Share % Change
% Promo Lost Dollars
Dollars % Change Index
GM Dollars % Change Index
% OOS Index
% Promo Index
$1,756 9.3% 76.2% 3.1 99.9% 94 2 137 107
IMPROVING ON-SHELF AVAILABILITY IN GROCERY | MARKET6.COM | ©2016 MARKET6, INC. ALL RIGHTS RESERVED. 11
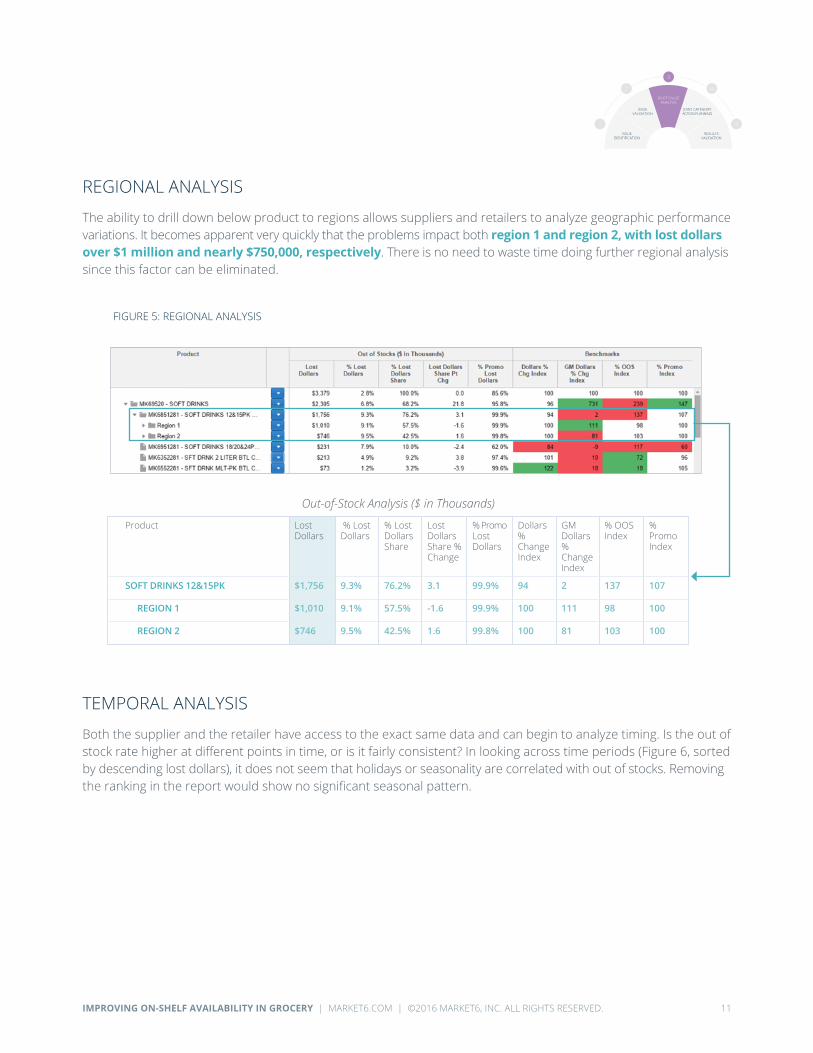
REGIONAL ANALYSIS
The ability to drill down below product to regions allows suppliers and retailers to analyze geographic performance variations. It becomes apparent very quickly that the problems impact both region 1 and region 2, with lost dollars over $1 million and nearly $750,000, respectively. There is no need to waste time doing further regional analysis since this factor can be eliminated.
1
2
3
4
5
ISSUEIDENTIFICATION
ISSUEVALIDATION
ROOT CAUSE ANALYSIS
JOINT CATEGORYACTION PLANNING
RESULTS VALIDATION
FIGURE 5: REGIONAL ANALYSIS
Out-of-Stock Analysis ($ in Thousands)
Product Lost Dollars
% Lost Dollars
% Lost Dollars Share
Lost Dollars Share % Change
% Promo Lost Dollars
Dollars % Change Index
GM Dollars % Change Index
% OOS Index
% Promo Index
SOFT DRINKS 12&15PK $1,756 9.3% 76.2% 3.1 99.9% 94 2 137 107
REGION 1 $1,010 9.1% 57.5% -1.6 99.9% 100 111 98 100
REGION 2 $746 9.5% 42.5% 1.6 99.8% 100 81 103 100
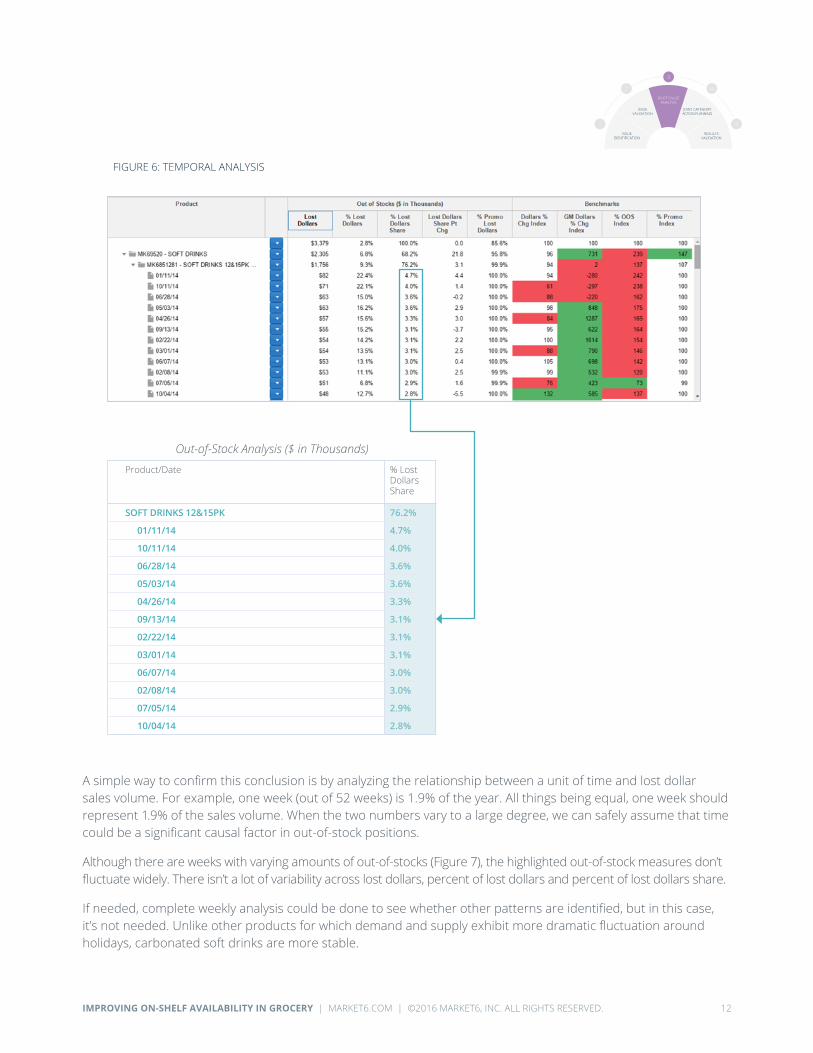
TEMPORAL ANALYSIS
Both the supplier and the retailer have access to the exact same data and can begin to analyze timing. Is the out of stock rate higher at different points in time, or is it fairly consistent? In looking across time periods (Figure 6, sorted by descending lost dollars), it does not seem that holidays or seasonality are correlated with out of stocks. Removing the ranking in the report would show no significant seasonal pattern.
IMPROVING ON-SHELF AVAILABILITY IN GROCERY | MARKET6.COM | ©2016 MARKET6, INC. ALL RIGHTS RESERVED. 12
A simple way to confirm this conclusion is by analyzing the relationship between a unit of time and lost dollar sales volume. For example, one week (out of 52 weeks) is 1.9% of the year. All things being equal, one week should represent 1.9% of the sales volume. When the two numbers vary to a large degree, we can safely assume that time could be a significant causal factor in out-of-stock positions.
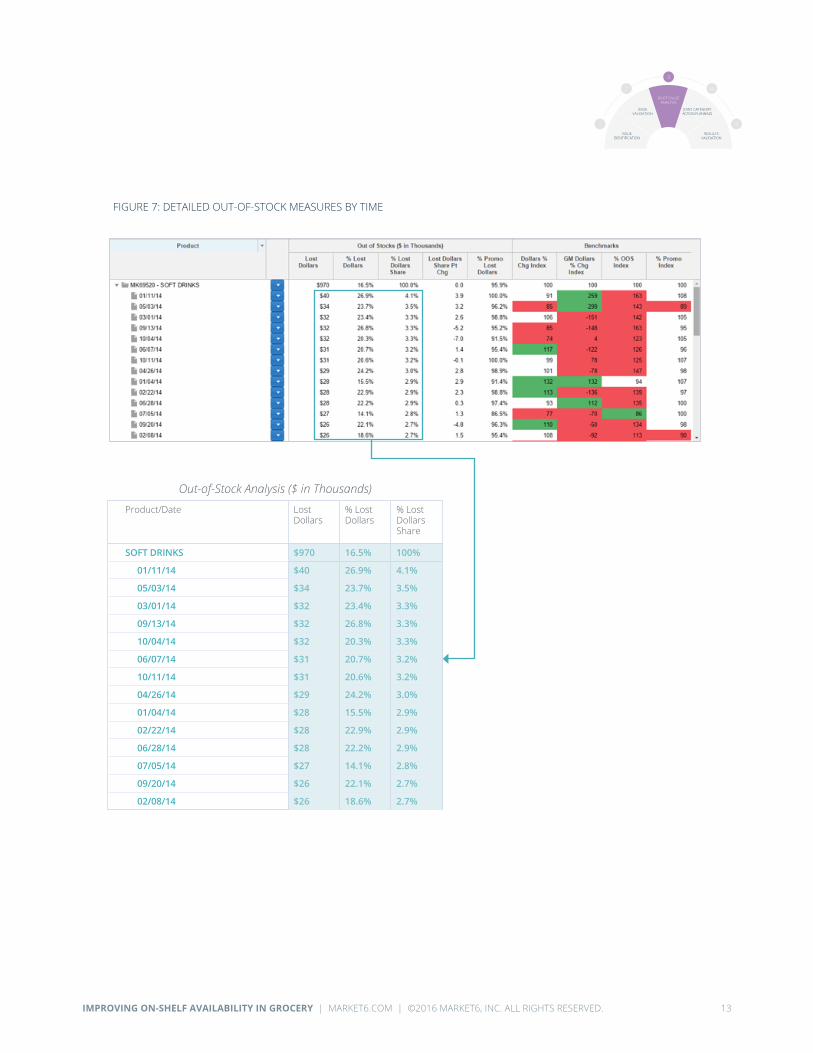
Although there are weeks with varying amounts of out-of-stocks (Figure 7), the highlighted out-of-stock measures don’t fluctuate widely. There isn’t a lot of variability across lost dollars, percent of lost dollars and percent of lost dollars share.
If needed, complete weekly analysis could be done to see whether other patterns are identified, but in this case, it’s not needed. Unlike other products for which demand and supply exhibit more dramatic fluctuation around holidays, carbonated soft drinks are more stable.
1
2
3
4
5
ISSUEIDENTIFICATION
ISSUEVALIDATION
ROOT CAUSE ANALYSIS
JOINT CATEGORYACTION PLANNING
RESULTS VALIDATION
FIGURE 6: TEMPORAL ANALYSIS
Out-of-Stock Analysis ($ in Thousands)
Product/Date % Lost Dollars Share
SOFT DRINKS 12&15PK 76.2%
01/11/14 4.7%
10/11/14 4.0%
06/28/14 3.6%
05/03/14 3.6%
04/26/14 3.3%
09/13/14 3.1%
02/22/14 3.1%
03/01/14 3.1%
06/07/14 3.0%
02/08/14 3.0%
07/05/14 2.9%
10/04/14 2.8%
IMPROVING ON-SHELF AVAILABILITY IN GROCERY | MARKET6.COM | ©2016 MARKET6, INC. ALL RIGHTS RESERVED. 13
1
2
3
4
5
ISSUEIDENTIFICATION
ISSUEVALIDATION
ROOT CAUSE ANALYSIS
JOINT CATEGORYACTION PLANNING
RESULTS VALIDATION
FIGURE 7: DETAILED OUT-OF-STOCK MEASURES BY TIME
Out-of-Stock Analysis ($ in Thousands)
Product/Date Lost Dollars
% Lost Dollars
% Lost Dollars Share
SOFT DRINKS $970 16.5% 100%
01/11/14 $40 26.9% 4.1%
05/03/14 $34 23.7% 3.5%
03/01/14 $32 23.4% 3.3%
09/13/14 $32 26.8% 3.3%
10/04/14 $32 20.3% 3.3%
06/07/14 $31 20.7% 3.2%
10/11/14 $31 20.6% 3.2%
04/26/14 $29 24.2% 3.0%
01/04/14 $28 15.5% 2.9%
02/22/14 $28 22.9% 2.9%
06/28/14 $28 22.2% 2.9%
07/05/14 $27 14.1% 2.8%
09/20/14 $26 22.1% 2.7%
02/08/14 $26 18.6% 2.7%
IMPROVING ON-SHELF AVAILABILITY IN GROCERY | MARKET6.COM | ©2016 MARKET6, INC. ALL RIGHTS RESERVED. 14
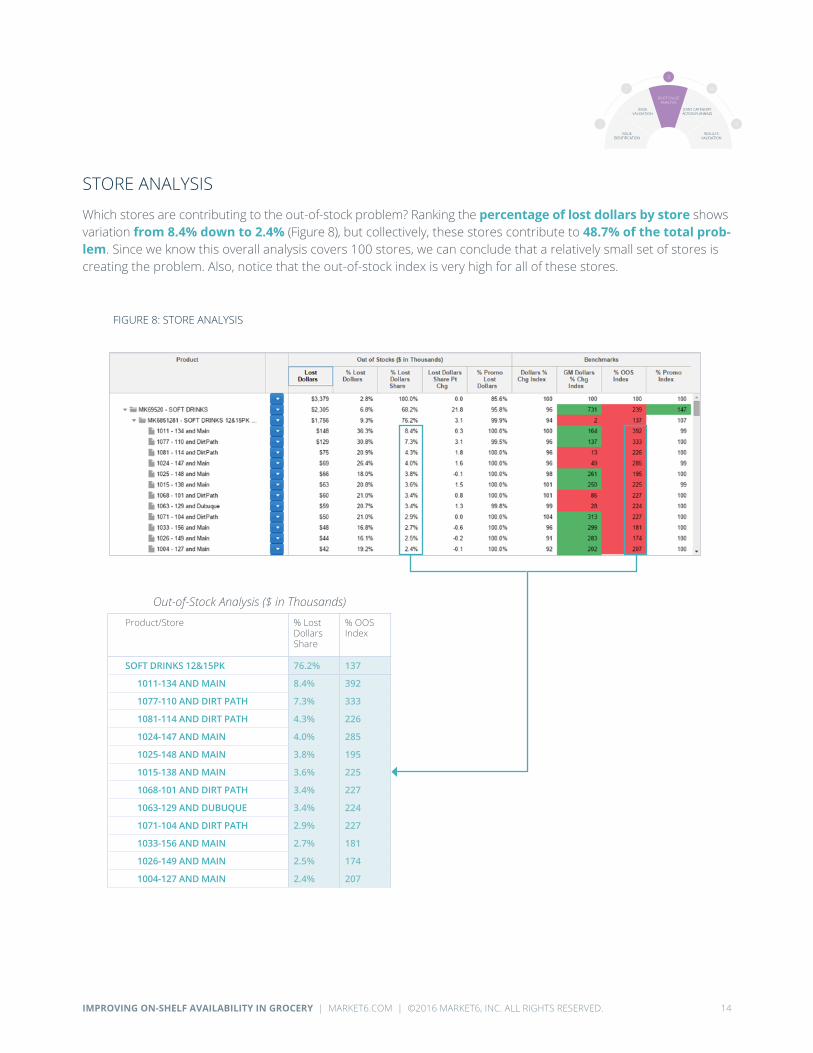
STORE ANALYSIS
Which stores are contributing to the out-of-stock problem? Ranking the percentage of lost dollars by store shows variation from 8.4% down to 2.4% (Figure 8), but collectively, these stores contribute to 48.7% of the total prob-lem. Since we know this overall analysis covers 100 stores, we can conclude that a relatively small set of stores is creating the problem. Also, notice that the out-of-stock index is very high for all of these stores.
1
2
3
4
5
ISSUEIDENTIFICATION
ISSUEVALIDATION
ROOT CAUSE ANALYSIS
JOINT CATEGORYACTION PLANNING
RESULTS VALIDATION
FIGURE 8: STORE ANALYSIS
Out-of-Stock Analysis ($ in Thousands)
Product/Store % Lost Dollars Share
% OOS Index
SOFT DRINKS 12&15PK 76.2% 137
1011-134 AND MAIN 8.4% 392
1077-110 AND DIRT PATH 7.3% 333
1081-114 AND DIRT PATH 4.3% 226
1024-147 AND MAIN 4.0% 285
1025-148 AND MAIN 3.8% 195
1015-138 AND MAIN 3.6% 225
1068-101 AND DIRT PATH 3.4% 227
1063-129 AND DUBUQUE 3.4% 224
1071-104 AND DIRT PATH 2.9% 227
1033-156 AND MAIN 2.7% 181
1026-149 AND MAIN 2.5% 174
1004-127 AND MAIN 2.4% 207
IMPROVING ON-SHELF AVAILABILITY IN GROCERY | MARKET6.COM | ©2016 MARKET6, INC. ALL RIGHTS RESERVED. 15
ANALYSIS RECAP
Since the DSD vendor maintains the inventory, and there’s virtually no visibility in this data on the retail side, out-of-stock analysis has been used to identify less-than-optimal inventory positions. Key points include:
We know that 12-pack soft drinks represent by far the greatest amount of lost dollars and out-of-stocks for this supplier and retailer. Lost dollar volumes are high enough to warrant immediate investigation.
The out-of-stocks are almost exclusively tied to promotions. While soft drinks are often on promotion, there’s clear indication that shopper satisfaction is at risk.
The analysis initially showed that time is also not playing a significant role, and this was verified in a subsequent analysis of out-of-stock measures over time.
Smaller regional variations in out-of-stocks positions do exist, but it’s clear that all regions are exhibiting out-of-stock problems. Therefore, additional regional analysis has been eliminated as a causal effect.
Twelve stores are contributing to over 48% of the out-of-stocks. Lost sales indices for these select few are way above the average for all stores.
Connecting these facts leads us to believe that the root cause is likely an inventory issue at the store level. This could be driven by any number of factors, including lack of space, small footprint, inventory restrictions, route inefficiencies or retail execution.
Both the retailer and the supplier also know this is a DSD product, which allows them to eliminate warehouse or retailer supply chain issues. This specific vendor is acutely aware of the fact that a single distributor or bottler is not contributing to the problem.
Based on these conclusions, the analyst looks at one final question having to do with whether or not the stores exhibiting the problem are all linked to one driver or a single route salesperson. The stores in question all exhibit significant volumes, and internal knowledge allows this root cause to be excluded. A meeting is set between the retailer and the supplier to review the results and put an action plan in place.
1
2
3
4
5
ISSUEIDENTIFICATION
ISSUEVALIDATION
ROOT CAUSE ANALYSIS
JOINT CATEGORYACTION PLANNING
RESULTS VALIDATION
1
2
3
4
5
IMPROVING ON-SHELF AVAILABILITY IN GROCERY | MARKET6.COM | ©2016 MARKET6, INC. ALL RIGHTS RESERVED. 16
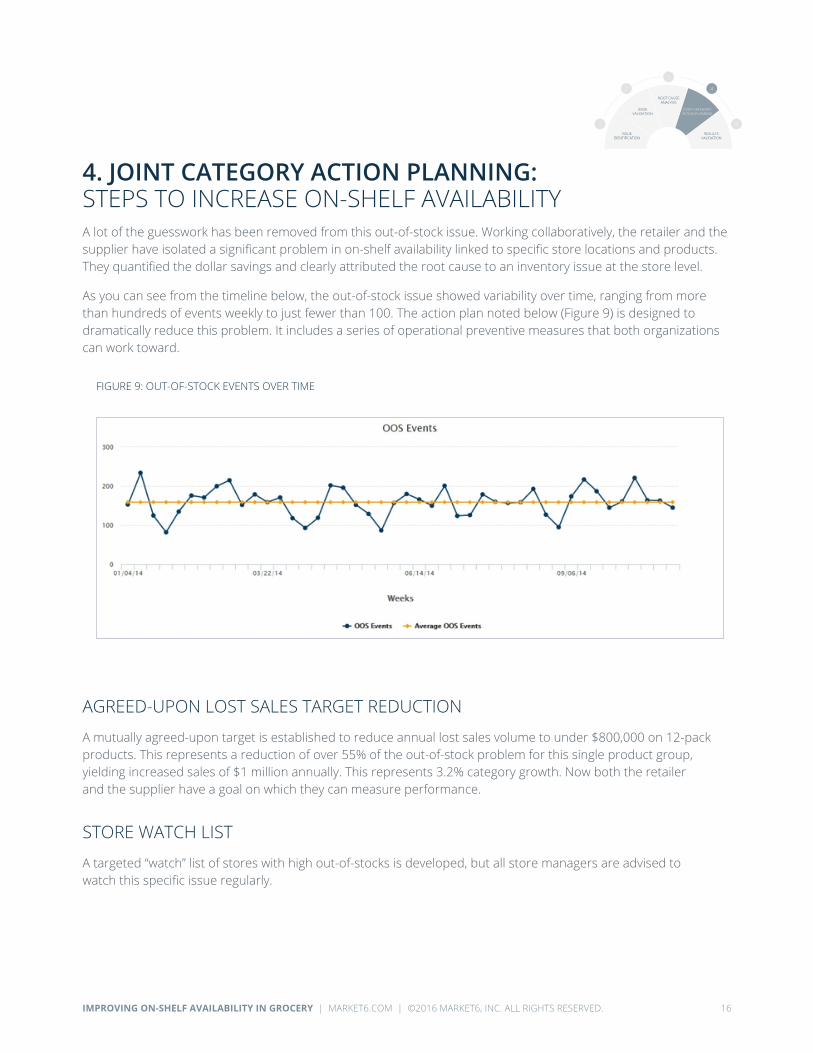
4. JOINT CATEGORY ACTION PLANNING: STEPS TO INCREASE ON-SHELF AVAILABILITYA lot of the guesswork has been removed from this out-of-stock issue. Working collaboratively, the retailer and the supplier have isolated a significant problem in on-shelf availability linked to specific store locations and products. They quantified the dollar savings and clearly attributed the root cause to an inventory issue at the store level.
As you can see from the timeline below, the out-of-stock issue showed variability over time, ranging from more than hundreds of events weekly to just fewer than 100. The action plan noted below (Figure 9) is designed to dramatically reduce this problem. It includes a series of operational preventive measures that both organizations can work toward.
1
2
3
4
5
ISSUEIDENTIFICATION
ISSUEVALIDATION
ROOT CAUSE ANALYSIS
JOINT CATEGORYACTION PLANNING
RESULTS VALIDATION
FIGURE 9: OUT-OF-STOCK EVENTS OVER TIME
AGREED-UPON LOST SALES TARGET REDUCTION
A mutually agreed-upon target is established to reduce annual lost sales volume to under $800,000 on 12-pack products. This represents a reduction of over 55% of the out-of-stock problem for this single product group, yielding increased sales of $1 million annually. This represents 3.2% category growth. Now both the retailer and the supplier have a goal on which they can measure performance.
STORE WATCH LIST
A targeted “watch” list of stores with high out-of-stocks is developed, but all store managers are advised to watch this specific issue regularly.
IMPROVING ON-SHELF AVAILABILITY IN GROCERY | MARKET6.COM | ©2016 MARKET6, INC. ALL RIGHTS RESERVED. 17
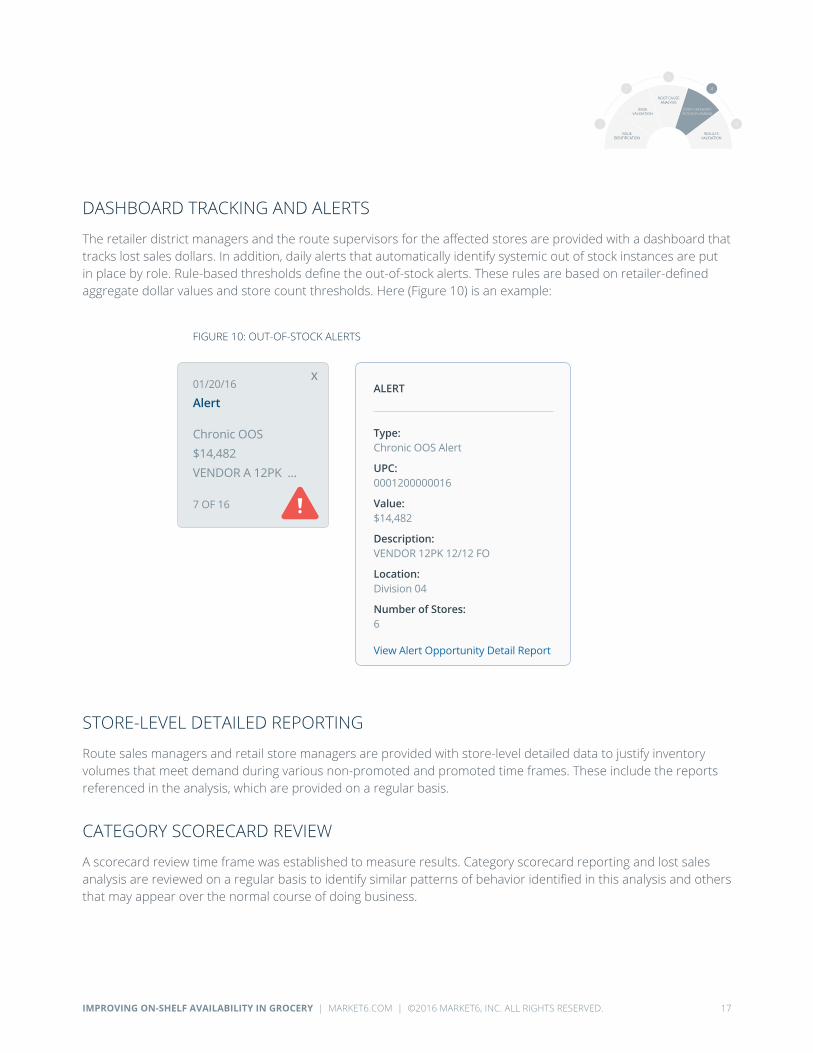
DASHBOARD TRACKING AND ALERTS
The retailer district managers and the route supervisors for the affected stores are provided with a dashboard that tracks lost sales dollars. In addition, daily alerts that automatically identify systemic out of stock instances are put in place by role. Rule-based thresholds define the out-of-stock alerts. These rules are based on retailer-defined aggregate dollar values and store count thresholds. Here (Figure 10) is an example:
1
2
3
4
5
ISSUEIDENTIFICATION
ISSUEVALIDATION
ROOT CAUSE ANALYSIS
JOINT CATEGORYACTION PLANNING
RESULTS VALIDATION
FIGURE 10: OUT-OF-STOCK ALERTS
ALERT
Type:Chronic OOS Alert
UPC:0001200000016
Value:$14,482
Description:VENDOR 12PK 12/12 FO
Location:Division 04
Number of Stores:6
View Alert Opportunity Detail Report
STORE-LEVEL DETAILED REPORTING
Route sales managers and retail store managers are provided with store-level detailed data to justify inventory volumes that meet demand during various non-promoted and promoted time frames. These include the reports referenced in the analysis, which are provided on a regular basis.
CATEGORY SCORECARD REVIEW
A scorecard review time frame was established to measure results. Category scorecard reporting and lost sales analysis are reviewed on a regular basis to identify similar patterns of behavior identified in this analysis and others that may appear over the normal course of doing business.
01/20/16
Alert
Chronic OOS$14,482VENDOR A 12PK ...
7 OF 16
X
IMPROVING ON-SHELF AVAILABILITY IN GROCERY | MARKET6.COM | ©2016 MARKET6, INC. ALL RIGHTS RESERVED. 18
5. RESULTS VALIDATION: ANTICIPATING PROBLEMS THROUGH REGULAR DATA-DRIVEN INSIGHTS The soft drinks vendor and retailer now have a defined process and a set of analytical reports they can use to assess these out-of-stock problems in the future. A shared view of the exact same date means that both organizations act as the stewards of on-shelf availability. With notifications in place, out-of-stock diagnostics are much easier to identify and validate.
Moving forward, both the supplier and the retailer are equipped with data-driven insights at granular levels of detail (store, product, day), which they use to identify the problems and later to confirm that they have been corrected. In this case, the data is updated daily, providing regular access to intelligence they never had before.
A significant reason why this analysis produced identifiable, measurable and actionable results had to do with the fact that data from many different systems was integrated into pre-built retail analytic reports and visualizations. These integrated solutions, including inventory data, merchandising data and POS data, are used to validate results on a continuous basis.
At this point, both the retailer and the supplier are equipped with a defined analytical process and supporting intelligence to anticipate and address problems before they impact operations and shopper satisfaction.
1
2
3
4
5
ISSUEIDENTIFICATION
ISSUEVALIDATION
ROOT CAUSE ANALYSIS
JOINT CATEGORYACTION PLANNING
RESULTS VALIDATION
IMPROVING ON-SHELF AVAILABILITY IN GROCERY | MARKET6.COM | ©2016 MARKET6, INC. ALL RIGHTS RESERVED. 19
Leading grocery retailers are taking advantage of modern approaches in retailer-supplier collaboration today. New approaches in analytics are allowing analysts on both sides to quickly sift through large amounts of formerly disparate data, identify and explore problems, and resolve issues quickly. At a time when every dollar makes a difference and shoppers are gravitating to alternative channels and stores, the need to increase on-shelf availability and reduce out-of-stocks is more relevant than ever.
Until now, the challenges preventing improvements in on-shelf availability existed at many levels. Fast-changing data from different source systems was impossible to analyze. The inability to instantly access the right analytic measures prevented analysts from uncovering root causes. The lack of shared data added complexity to processes that were already fragmented.
But that has all changed. Tight operational time frames can now be met. Regular analysis is literally clicks away. Repeatable processes are allowing retailers and suppliers to work together as a single unit, with shared goals and positive results on both sides.
As hundreds or thousands of new brands are introduced, the answers rest on top of the data, not buried within. This competitive advantage is allowing some of the most progressive retailers and suppliers to win in dynamic markets. The operational mindset of retailers and suppliers has shifted—today the focus is on operational execution leading to savings, sales and increased shopper loyalty. Category and supply managers recognize that the task of solving problems in on-shelf availability is now within their grasp. In today’s fragmenting markets, addressing these types of issues, no matter how small, really matters.
ABOUT MARKET6® and the KNOWLEDGE PATH SERIES
Market6® is committed to providing new approaches to retailer-supplier collaboration that address specific challenges in the market. Today, over 1,000 consumer packaged goods companies and retailers are actively applying these solutions and winning in the market.
A lot has been written about the fact that problems exist in out-of-stocks, promotions, new item introductions and on-shelf availability. But little has been written about how retailers and suppliers can apply data, insights and action to reach new heights in operational excellence. The Market6 Knowledge Path series is designed to provide needed guidance, shorten time to insights and deliver improved collaborative results. Look for other white papers like this one at Market6.com.
CONCLUSION
Visit Market6.com to download a free copy of real results case studies documenting the success of the largest suppliers and retailers in the world. To learn more or request a demo, contact us:
800.371.1725 [email protected] market6.com
Market6® is used by more than 1,000 CPG companies and retailers to help optimize retail operations every day.
Market6® provides web-based retail collaboration solutions with advanced
analytics built in to help retailers and suppliers drive insights, make smarter
decisions and deliver measurably better results.
Market6, DemandView, DemandView Essential, DemandView Category, DemandView Replenish and the Market6 logo are trademarks of Market6, Inc. ©2016 Market6, Inc. All Rights Reserved.


![OPTIMAL SHELF AVAILABILITY - Zéro Rupture tavoledilavoro.pdf · Pane e Pasticceria Birra Bagno/Docciaschiuma Prodo piatti/lavast Base: 779 D18) […] proviamo a costruire il Suo](https://static.fdocuments.us/doc/165x107/5c6dbb5809d3f2fe088c270a/optimal-shelf-availability-zero-rupture-tavoledilavoropdf-pane-e-pasticceria.jpg)